prisoner reentry in idaho - webarchive.urban.org
TRANSCRIPT

RE
SE
AR
CH
B
RI
EF
Decem
ber 2004
Prisoner Reentry in
Idaho
Nancy G. La Vigne Cynthia A. Mamalian Gillian Thomson
Jamie Watson
URBAN INSTITUTE Justice Policy Centerresearch for safer communities


About the Authors © Copyright 2004
URBAN INSTITUTE Justice Policy Center 2100 M Street, NW Washington, DC 20037 www.urban.org (202) 833-7200
The views expressed are those of the authors and should not be attributed to The Urban Institute, its trustees, or its funders.
The Justice Policy Center (JPC) carries out nonpartisan research to inform the national dialogue on crime, justice and community safety. For more information on JPC’s reentry research, visit http://jpc.urban.org/reentry. To receive monthly email updates on JPC research, send an email to [email protected].
Nancy G. La Vigne is a senior research associate at the Urban Institute, where she directs several projects related to prisoner reentry, including Returning Home: Understanding the Challenges of Prisoner Reentry, a multistate, longitudinal study of the reentry experience. Her other research interests include the geographic analysis of crime, situational crime prevention, and community policing. Dr. La Vigne has 12 years of experience conducting criminal justice research and has previous experience in crime policy and the legislative process. Prior to her current position, she was founding director of the National Institute of Justice's Crime Mapping Research Center. Dr. La Vigne's other work experience includes consulting for the Police Executive Research Forum, the National Council on Crime and Delinquency, and the National Development and Research Institute. She also served as research director for the Texas Punishment Standards Commission. Dr. La Vigne has authored articles in journals, chapters in edited volumes, and textbooks and monographs on prisoner reentry, crime prevention, policing, and spatial analysis. She holds a PhD in criminal justice from Rutgers University and a Master's in public affairs from the University of Texas.
Cynthia A. Mamalian is an independent consultant to the Urban Institute and other criminal justice and victim service agencies in the Washington, D.C., area. Her primary research interests include domestic violence and child abuse and neglect. Recent projects have focused on prisoner reentry. Prior to consulting, Dr. Mamalian worked as a senior analyst and social science analyst for five years for the Office of Research and Evaluation at the National Institute of Justice. She also previously served as associate director of the Center for Crime Prevention Studies at Rutgers University. She holds a PhD and a Master’s in criminal justice from Rutgers University.
Gillian Thomson is an independent consultant to the Urban Institute and to other criminal justice agencies and academic institutions. Much of her work has involved compiling and analyzing qualitative and quantitative data to inform the collaborative problem-solving efforts of criminal justice agencies in a particular jurisdiction. She has years of experience understanding and analyzing data from agencies spanning the criminal justice system, with a particular focus on correctional agencies in the past several years. Prior to working as a consultant, Ms. Thomson worked as a management analyst in the Court Services and Offender Supervision Agency in Washington, D.C. Ms. Thomson received a BA in politics from Princeton University and a Master’s in public policy from the John F. Kennedy School of Government at Harvard University.
Jamie Watson is a former research associate for the Urban Institute. Her primary areas of interest focus on prisoner reentry and community-based crime prevention and reduction initiatives. While at the Urban Institute, Ms. Watson served as project director for the Reentry Mapping Network, a partnership between the Urban Institute and local organizations committed to engaging neighborhoods by mapping and analyzing prisoner reentry at the neighborhood level. Ms. Watson has a Master’s degree in public policy from Harvard University and a BA in government from the University of Texas at Austin.
PRISONER REENTRY IN IDAHO i

Acknowledgments
The authors would like to thank the many individuals and organizations who made valuable contributions to this report. We thank the Idaho Department of Correction (IDOC) and the Idaho Department of Juvenile Corrections for providing the data for this report, and specifically Greg Sali, Larry Callicutt, and Monty Prow for their assistance with the data. We are also grateful to staff from the Urban Institute’s Justice Policy Center who contributed substantially to this report, including Barbara Parthasarathy, who prepared the maps included in this report; Meagan Funches, who formatted the text and graphics and shepherded the production process; and Amy Solomon, who provided critical feedback and guidance along the way. Finally, we thank our funders and project partners, Helena Huang at the JEHT Foundation and Thomas MacLellan at the National Governors Association. Without their support, this report could not have been possible.
ii PRISONER REENTRY IN IDAHO

Contents
Executive Summary................................................................................................................v
Introduction..............................................................................................................................1
Chapter 1 Incarceration Trends in Idaho..............................................................................3
Prison Population on the Rise.........................................................................................3
Admission and Release Trends......................................................................................4
Idaho Department of Correction: Structure and Prisoner Classification........................5
Chapter 2 Characteristics of Idaho’s Released Prisoners.................................................9
Demographics .................................................................................................................9
Why They Were in Prison .............................................................................................12
How Long They Were in Prison....................................................................................13
Criminal History and the Revolving Door......................................................................16
Mental and Physical Health Challenges.......................................................................17
Education and Programming ........................................................................................18
Chapter 3 Prisoner Release and Supervision Policies and Practices............................23
How Prisoners are Released in Idaho..........................................................................23
Prominence of Post Release Supervision....................................................................24
Chapter 4 Geographic Distribution of Released Prisoners .............................................29
Reentry in Idaho ............................................................................................................29
Prisoners Returning to Ada County in 2003.................................................................32
Prisoners Returning to Twin Falls, Washington, and Cassia Counties.......................33
Juveniles Released in 2002..........................................................................................34
Chapter 5: Looking Forward................................................................................................36
PRISONER REENTRY IN IDAHO iii
Figures and Tables
Figure 1. U.S. and Idaho State Prison Populations.................................................................... 3
Figure 2: Total Population, Admissions, and Releasees for IDOC Secure Facilities, 1996–2003 ............................................................................................................................ 5
Figure 3. Percentage of Admissions to IDOC Secure Facilities by Initial Admission Type, FY 2003 ................................................................................................................................. 7
Figure 4. Prisoners Released in Idaho by Race/Ethnicity, 2003..............................................10
Figure 5. Prisoners Released in Idaho by Age at Release, 2003 ............................................10
Figure 6. Prisoners Released in Idaho by Marital Status, 2003...............................................11
Figure 7. Prisoners Released in Idaho by Number of Children, 2003 .....................................11
Figure 8. Prisoners Released in Idaho by General Category of Most Serious Conviction Offense, 2003 ......................................................................................................................12
Figure 9. Prisoners Released in Idaho by Category of Most Serious Conviction Offense, 2003 ....................................................................................................................................13
Figure 10. Prisoners Released in Idaho by Minimum Cumulative Sentence, 2003................14
Figure 11. Prisoners Released in Idaho by Time Served in a Secure Facility and by Incarceration Status, 2003 ..................................................................................................15
Table 1. Average Time Served by Admission Type for Prisoners Released in 2003 .............15
Figure 12. IDOC Releasees by Average Time Served (in Years) and Crime Type, 2003 .....16
Figure 13. Prisoners Released in Idaho by Number of Disciplinary Reports, 2003 ................17
Figure 14. Prisoners Released in Idaho by Highest Grade Attended, 2003............................19
Figure 15. Prisoners Released in Idaho by Release Type, FY 2003.......................................24
Figure 16. Releases from IDOC Secure Facilities to Supervision, FY 1996-2003..................25
Figure 17. Prisoner Releasees by Idaho County, 2003 ...........................................................30
Figure 18. Prisoner Releasees by Idaho County, 2003 ...........................................................31
Figure 19. Prisoner Releasees to Idaho Counties, Rate Per 1,000 Residents, 2003.............31
Table 2. Social, Economic, and Crime Indicators for Ada County ...........................................32
Table 3. Three Counties with the Highest Concentrations of Returning Prisoners in Idaho, by Social, Economic and Crime Indicators.........................................................................34
Figure 20. Geographic Distribution of Released Juveniles, 2002............................................35
iv PRISONER REENTRY IN IDAHO
Executive Summary
This report describes the process of prisoner reentry in Idaho by examining the trends in incarceration and prisoner releases in the state, the characteristics of the state’s released prisoners, and the geographic distribution of released prisoners. This report does not attempt to evaluate a specific reentry program or empirically assess Idaho’s reentry policies and practices. Rather, the report consolidates existing data on incarceration and release trends and presents a new analysis of data on Idaho prisoners released in 2003. The data used in this report were derived from several sources, including the Idaho Department of Correction (IDOC), Idaho Department of Juvenile Corrections (IDJC), the Bureau of Justice Statistics, and the U.S. Census Bureau. Highlights from the report are presented below.
Incarceration Trends. Over the past seven years, Idaho’s incarcerated population has grown at a faster rate than state prison populations nationwide. The Idaho prison population increased 60 percent from 1996 to 2003, compared with a 23 percent increase nationally during this same time period. The per capita rate of imprisonment in Idaho rose from 319 to 430 per 100,000 residents in the state between 1996 and 2000, an increase of 35 percent. Idaho’s release patterns reflect these incarceration trends: 3,194 prisoners were released from Idaho prisons in fiscal year 2003, 78 percent higher than the number released in fiscal year 1996 (N = 1,790). Between fiscal years 2002 and 2003, the growth of Idaho’s prison population slowed, increasing by less than 1 percent. The growth of the state’s admission and release populations, however, climbed during this one-year time period by nearly 5 and 18 percent, respectively.
Characteristics of Prisoners Released in 2003. The majority of released prisoners were male (83 percent) and white (79 percent). The average age at release was 33 years. One-third (33 percent) had been serving time for drug offenses, 21 percent for violent offenses, and the remaining 46 percent for nonviolent (and nondrug) offenses. The average time served was 1.7 years; “termers” served an average of 2.7 years, “riders” served approximately six months, and parole violators released after awaiting a hearing with the Parole Commission served less than four months. Educational attainment was also quite low, with nearly half of the prisoners released in 2003 lacking a high school diploma or GED at the time of incarceration. Eleven percent of all releasees participated in the IDOC’s relapse prevention program during their most recent period of incarceration. Approximately 13 percent of the release population received psychotropic medication at some point during their most recent incarceration period.
Characteristics of Juveniles Released in 2002. In the 2002 calendar year, the IDJC released 373 juveniles into the community. The majority were male (85 percent) and white (95 percent). Most of the juveniles released in 2002 (84 percent) were between the ages of 15 and 18 years. The largest percentage of juveniles released from the IDJC in 2002 had been serving time for nonviolent (and nondrug) offenses (62 percent). On average, juveniles were in custody for 1.4 years. Twelve percent of juveniles released in 2002 had been in an Idaho juvenile facility at least once before.
Release and Supervision Policies and Practices. In fiscal year 2003, the majority (80 percent) of all exiting prisoners were released discretionarily to a period of community supervision. From 1996 to 2003, the proportion of prisoners released to supervision in Idaho remained relatively stable at around 80 percent, while the number of prisoners released to supervision increased by 69 percent from 1,505 in fiscal year 1996 to 2,545 in fiscal year 2003.
Geographic Distribution of Released Prisoners. Of the prisoners released to supervision in Idaho in 2003, more than one-fourth (27 percent) returned to Ada County, followed by Canyon County (13
PRISONER REENTRY IN IDAHO v

percent). Five of Idaho’s 44 counties accounted for 73 percent of returning prisoners. Among these five counties, Ada County had the greatest number of returning prisoners, but the lowest rate of returning prisoners, at 2 per every 1,000 residents. Among all counties in Idaho, Twin Falls and Washington Counties had the highest rates of returning prisoners (3.9 per 1,000 residents), followed by Cassia County (3.6 per 1,000 residents). As with the adult release population, the greatest share of released juveniles (29 percent) returned to Ada County.
vi PRISONER REENTRY IN IDAHO
Introduction
This report examines the prisoner reentry phenomenon in Idaho. Prisoner reentry—the process of leaving prison and returning to society—has become a pressing issue both in Idaho and across the nation. Rising incarceration rates over the past quarter century have resulted in more and more prisoners being released from prison each year. Nationwide, an estimated 630,000 prisoners were released from state and federal prisons in 2001, a fourfold increase over the past two decades.1 Thus, released prisoners, their families, and the communities to which they return have to cope with the challenges of reentry on a much greater scale than ever before.
And the challenges of reentry are many. More prisoners nationwide are returning home having spent longer terms behind bars,2 exacerbating the already significant challenges of finding employment and reconnecting with family. Prisoners today are typically less prepared for reintegration, less connected to community-based social structures, and more likely to have health or substance abuse problems than in the past. In addition to these personal circumstances, limited availability of jobs, housing, and social services in a community may affect the returning prisoner's ability to successfully reintegrate.3
These challenges affect more than returning prisoners and their families; they can also have serious implications for the communities to which prisoners return. Two-thirds of the nation’s prisoners released in 1996 returned to major metropolitan areas across the country—up from 50 percent in 1984.4 Within central cities, released prisoners are often concentrated in a few neighborhoods.5 These high concentrations of returning prisoners generate great costs to those communities, including potential increases in costs associated with crime and public safety, greater public health risks, and high rates of unemployment and homelessness. Developing a thorough understanding of the characteristics of returning prisoners and the challenges they face is an important first step in shaping public policy toward improving the safety and welfare of all citizens.
In many ways, the dimensions and challenges of prisoner reentry observed on the national level are mirrored in Idaho. Incarceration levels and rates have increased significantly in Idaho in recent years. Between fiscal years 1996 and 2003, the Idaho prison population increased by 60 percent from 3,639 to 5,825, and the per capita rate of imprisonment in Idaho rose from 319 to 430 per 100,000 residents between 1996 and 2000, an increase of 35 percent.6 Admissions to Idaho prisons also increased over this period. In fiscal year 1996, 2,233 individuals were admitted to Idaho prisons, and by fiscal year 2003, annual admissions had grown to 3,218, a 44 percent increase.
1 Paige M. Harrison and Jennifer C. Karberg, Prison and Jail Prisoners at Midyear 2002 (Washington, DC: U.S. Department of Justice, Bureau of Justice Statistics, 2003). 2 James P. Lynch and William J. Sabol, "Prisoner Reentry in Perspective," Crime Policy Report, vol. 3 (Washington, DC: The Urban Institute, 2001). 3 For an in-depth discussion of prisoner reentry nationwide, see Jeremy Travis, Amy L. Solomon, and Michelle Waul, From Prison to Home: The Dimensions and Consequences of Prisoner Reentry (Washington, DC: Urban Institute Press, 2001). 4 Lynch and Sabol, "Prisoner Reentry in Perspective." 5 Nancy G. La Vigne, Vera Kachnowski, Jeremy Travis, Rebecca Naser, and Christy Visher, “A Portrait of Prisoner Reentry in Maryland” (Washington, DC: The Urban Institute, 2003); Nancy G. La Vigne, Cynthia A. Mamalian, Christy Visher, and Jeremy Travis, “ A Portrait of Prisoner Reentry in Illinois” (Washington, DC: The Urban Institute, 2003); Nancy G. La Vigne, Gillian Thomson, Vera Kachnowski, Christy Visher, and Jeremy Travis, “A Portrait of Prisoner Reentry in Ohio” (Washington, DC: The Urban Institute, 2003); Jamie Watson, Amy Solomon, and Jeremy Travis, “A Portrait of Prisoner Reentry in Texas” (Washington, DC: The Urban Institute, 2004). 6 Bureau of Justice Statistics (http://www.ojp.usdoj.gov/bjs/prisons.htm#selected).
PRISONER REENTRY IN IDAHO 1
As with the growth in imprisonment, Idaho has also experienced a dramatic growth in the number of people being released from prison. In fiscal year 1996, only 1,790 individuals were released from the state’s prisons. Seven years later, 3,194 individuals were released to the community from Idaho’s prisons, a 78 percent increase. In 2003, the vast majority (90 percent) of those released from Idaho prisons to a period of postrelease supervision returned to communities in Idaho. While over one-fourth (27 percent) of these released prisoners returned to Ada county, Twin Falls and Washington Counties received the highest concentrations of returning prisoners, at 3.9 prisoners per 1,000 residents.
Government leaders, corrections officials, local organizations, and service providers are keenly aware of the reentry challenges experienced by states and communities across the country, and they have begun to use both research and programmatic knowledge to address them. This emphasis on issues pertaining to prisoner reentry prompted the National Governor's Association to launch the Prisoner Reentry State Policy Academy. Established in the summer of 2003, the goal of the Academy is to help governors and other state policymakers develop and implement effective prisoner reentry strategies that reduce costly recidivism rates. Seven states—Georgia, Idaho, Massachusetts, Michigan, New Jersey, Rhode Island, and Virginia—have been selected to participate in this intensive 18-month policy academy. Activities include an in-state policy workshop, two policy academy meetings, and customized technical assistance, including the production of this report. The purpose of the report is to present information on prisoner reentry in one document that can be used to inform state officials and policymakers as they develop strategies to address prisoner reentry in Idaho.
This report describes prisoner reentry in Idaho by examining the state’s incarceration, admission, and release trends over time; describing the characteristics of prisoners released from Idaho prisons; and examining the geographic distribution of those released prisoners across the state. This report does not attempt to evaluate a specific reentry program, nor does it empirically assess Idaho’s reentry policies and practices. Rather, the report consolidates existing data on incarceration and release trends and presents a new analysis of data on Idaho prisoners released in 2003.
About the Data
The data used for this report were derived from several sources. Longitudinal data describing the incarceration and reentry trends in Idaho and the nation were derived from the Idaho Department of Correction (IDOC), and the U.S. Department of Justice, Bureau of Justice Statistics. The county-level demographic, socioeconomic, and crime data presented in chapter 4 came from the 2000 U.S. Census and the Idaho State Police.
Data on the population of inmates released from Idaho secure facilities in calendar year 2003, including postincarceration data, were provided by the IDOC. In cases in which the IDOC released an individual more than once in 2003 (in most cases this would occur when a person was released from prison, returned to prison for a violation of the conditions of his or her release, and was then released again), only the individual’s first release is included in most analyses.
The IDOC data included only the county to which prisoners who were supervised upon release returned. Since the majority of inmates released from the IDOC in CY 2003 (83 percent) were released to supervision, the geographic analysis includes most released prisoners. Postincarceration addresses for inmates who were not released to supervision were unavailable, and thus were not included in the geographic analysis.
Data for the juvenile cohort were provided by the Idaho Department of Juvenile Corrections (IDJC).
2 PRISONER REENTRY IN IDAHO

C H A P T E R 1 Incarceration Trends in Idaho In order to understand the reentry phenomenon in Idaho, it is first necessary to examine prison admission and release trends in the state. This section provides an overview of recent incarceration history in Idaho and describes some basic changes in the state’s prisoner population and release cohorts. This context will help frame the reentry issue and will provide background for the discussion of the needs and challenges of returning prisoners that follows later in this report.
PRISON POPULATION ON THE RISE
The Idaho prison population has grown significantly over the past seven years. Between fiscal years 1996 and 2003, Idaho’s incarcerated population increased by 60 percent from 3,639 to 5,825 people (figure 1).7 While the prison population grew steadily from fiscal years 1998 to 2002 at an average rate of 10 percent per year, it tapered off between 2002 and 2003, rising by just 23 offenders, or 0.4 percent.
Figure 1. U.S. and Idaho State Prison Populations
0
1,000
2,000
3,000
4,000
5,000
6,000
7,000
1996 1997 1998 1999 2000 2001 2002
Year
Idah
o Pr
ison
Pop
ulat
ion
900,000
950,000
1,000,000
1,050,000
1,100,000
1,150,000
1,200,000
1,250,000
U.S
. Pris
on P
opul
atio
n
Idaho Prison Population
U.S. Prison Population
2003
Source: IDOC and U.S. Bureau of Justice Statistics Note: Years represent fiscal years for Idaho and calendar years for the United States. The U.S. state prison population figure for 2003 is not yet available.
7 IDOC, “Idaho Department of Correction Historical Admissions and Releases for Fiscal Years 1996 to 2003” (Boise, ID: IDOC, 2003.) http://corrections.state.id.us/facts/monthly_stats/AdmitRls95-01Rpt.pdf.
PRISONER REENTRY IN IDAHO 3
Despite the slower growth in recent years, Idaho’s prison population grew at a faster rate (7 percent annually) in the past seven years than the prison population nationwide (3 percent annually).8 In 2002, however, Idaho had a slightly lower incarceration rate compared with the nation (461 versus 476 per 100,000 residents).9
As the prison population has increased in Idaho, so too has spending on corrections. Between fiscal years 1997 and 2002, the IDOC budget increased 55 percent (as adjusted for inflation),10 rising from $71,125,80011 to $123,136,300.12
ADMISSION AND RELEASE TRENDS
Between fiscal years 1996 and 2003, admissions to IDOC secure facilities increased by 44 percent from 2,233 to 3,218 people. During this same time period, the number of inmates released from prison increased by 78 percent from 1,790 to 3,194 people (figure 2). As can be seen in figure 2, when the number of admissions and releases are essentially the same (fiscal years 1998 and 2003), the total prison population remains steady, and when the number of admissions exceeds the number of releases (all other years), the total prison population increases.
Idaho has had no significant changes in sentencing policy that might affect these admissions and release trends from the mid-1990s to the present. However, in 1986 the Unified Sentencing Act (House Bill No. 524) was signed into Idaho law, and became effective February 1987. This Act, also known as the Truth in Sentencing Act, required that a minimum (fixed) period must be served prior to a prisoner’s release on parole.13 While it is difficult to assess the impact of Idaho’s Truth-in-Sentencing law on the state’s recent incarceration trends, it is likely that such legislation has contributed to increases in the prison population over time, since prisoners generally serve longer terms under this law.14
8 Comparisons are based on statistics from FY 1996 to FY 2003 for Idaho and statistics from CY 1995 to CY 2002 for the nation. Idaho Department of Correction, Idaho Department of Correction Historical Admissions and Releases for Fiscal Years 1996 to 2003 (Boise, ID: IDOC, 2001); Bureau of Justice Statistics, Datafile corpop05.wk1: Prisoners in Custody of State or Federal Correctional Authorities, National Prisoner Statistics data series (NPS-1) (Washington, DC: U.S. Department of Justice, Bureau of Justice Statistics, 2001); Paige M. Harrison and Allen J. Beck, “Prisoners in 2002,” Bureau of Justice Statistics Bulletin (Washington, DC: U.S. Department of Justice, 2003). 9 The incarceration rate represents sentenced prisoners under the jurisdiction of state or federal correctional authorities. Paige M. Harrison and Allen J. Beck, “Prisoners in 2002.” 10 This calculation was based on the U.S. Department of Labor, Bureau of Justice Statistics, Consumer Price Index, http://www.bls.gov/cpi. 11 Idaho Department of Correction, Annual Report, FY 2002. $71,125,800 is $79,722,918 in 2002 dollars. 12 Idaho Department of Correction, Annual Report FY 2002. 13 At the time of sentencing, judges may impose a fixed sentence during which time the prisoner is not eligible for parole. Judges may also impose a subsequent indeterminate period. The aggregate sentence cannot exceed the maximum provided by law. “The court can impart the specific amount of punishment it feels to be just and still impose an indeterminate period to be used by the Commission of Pardons and Parole for rehabilitation and parole purposes” (Idaho Code § 19-2513). Idaho also has a “three-strikes” policy (Idaho Code § 19-2514–Persistent Violator–Sentence on Third Conviction for Felony, effective 1923, amended 1970) for which a third felony conviction requires a sentence between five years and life. 14 Paula M. Ditton and Doris James Wilson, “Truth in Sentencing in State Prisons,” Bureau of Justice Statistics Special Report (Washington, DC: Bureau of Justice Statistics, 1999).
4 PRISONER REENTRY IN IDAHO

Figure 2: Total Population, Admissions, and Releases for IDOC Secure Facilities, 1996–2003
0
1,000
2,000
3,000
4,000
5,000
6,000
7,000
FY 96 FY 97 FY 98 FY 99 FY 00 FY 01 FY 02 FY 03
Total Population Admissions Releases
Source: Urban Institute analysis of Idaho Department of Correction, “Idaho Department of Correction Historical Admissions and Releases for Fiscal Years 1996 to 2003.”
IDAHO DEPARTMENT OF CORRECTION: STRUCTURE AND PRISONER CLASSIFICATION
Idaho’s Department of Correction (IDOC) differs in structure from that of many other states. In Idaho, the Department of Correction is responsible not only for incarcerating adult felons but also for supervising probationers and parolees in the community, as well as providing pre-sentence investigation reports for the courts. The IDOC operates eight correctional institutions, one privately operated correctional institution, four community work centers,15 and 22 probation/parole district and satellite offices.16
With respect to the incarcerated population, the IDOC categorizes its inmates into three broad groups: termers, riders, and parole violators. “Termers” are offenders committed to prison by the courts or by the Commission of Pardons and Parole (hereafter referred to as “Parole Commission”).17 Termers tend to correspond most closely with prisoners incarcerated in other state prison systems who receive a minimum sentence of at least one year.
“Riders”18 are offenders for whom judges have imposed prison sentences, but who remain under the jurisdiction of the courts. These prisoners serve approximately 120 to 180 days in a specialized IDOC correctional facility where they undergo psychiatric and other testing, and may participate in 15 The community work centers are secure facilities that allow work release opportunities for minimum and community custody inmates, many of whom are nearing release. Among the prisoners released in 2003, 4 percent participated in a community work center program during their most recent period of incarceration. 16 Idaho Department of Correction web site (http://www.corr.state.id.us/about_us/overview.htm). 17 Termers are committed by the Parole Commission in cases in which parole violators are revoked. 18 Riders are also called “retained jurisdiction offenders” because the courts retain jurisdiction until the offender completes this special program.
PRISONER REENTRY IN IDAHO 5

rehabilitation programs. This alternative is available only for felony cases.19 Toward the end of the rider program, the facility completes a report (based on program participation and behavior) to help the judge make the decision to either place the offender on probation or “drop jurisdiction” and have the prisoner serve the imposed sentence.20 Among the offenders exiting rider status from fiscal years 1996 to 2003, 87 percent were released to probation and 13 percent received additional prison time.21
Finally, “parole violators” are offenders who violated the conditions of their parole or committed a new crime while on parole and are awaiting a revocation hearing from the Parole Commission. The Parole Commission will determine whether to revoke the offender to prison, reinstate the offender to parole, or discharge the offender. Parole violators remain in this temporary custody status until the Parole Commission decides how to respond to the violation. A parole violator’s custody status changes to “term” if the Board decides to revoke parole.22 For parole violators whose custody status was changed between fiscal years 1996 and 2003, 73 percent had their parole revoked, 22 percent were reinstated on parole, and 4 percent were discharged.23 Parole violators spend approximately three to four months, on average, in IDOC facilities prior to receiving a change in their status.
Nearly half (44 percent) of the admissions24 to IDOC secure facilities in fiscal year 2003 were riders, 40 percent were termers, and 16 percent were parole violators (figure 3). As described above, some of the prisoners who were initially classified as riders or parole violators may become termers with the court’s or Parole Commission’s determination.
19 Idaho’s Sixth Judicial District Court web page (http://www.co.bannock.id.us/sentenci.htm). 20 Idaho Department of Correction brochure (http://corrections.state.id.us/our_facilities/brochure.pdf). 21 IDOC, “Idaho Department of Correction Historical Admissions and Releases for Fiscal Years 1996 to 2003” (Boise, ID: IDOC, 2001). 22 Some parole violators who are revoked are never assigned parole violator status. Rather, they go straight to term status. This is a very small segment of the parole violator population. Also, some of the parole violators in the datafile should have been reclassified as term offenders and then released from that status, but were not. For that reason, some parole violators have much longer time served calculations than the parole violators awaiting a hearing. Some parole violators are also absconders and they are given meaningless exit dates. In addition, some mental health offenders cannot, without a judge’s decision, be labeled as term offenders, so they remain on parole violator status indefinitely. Admissions to parole violator status prior to 2002 (N = 40) were excluded from analysis since they do not represent current practices or they fall into the absconder or mental health categories as explained above. 23 IDOC, “Idaho Department of Correction Historical Admissions and Releases for Fiscal Years 1996 to 2003.” Figures do not add to 100 percent due to rounding. 24 Admissions to IDOC’s nonsecure facilities are not included in these calculations. Admissions represent inmates’ initial admission types.
6 PRISONER REENTRY IN IDAHO

Figure 3. Percentage of Admissions to IDOC Secure Facilities by Initial Admission Type, FY 2003
Termer40%
Rider44%
Parole Violator16%
Source: Urban Institute analysis of Idaho Department of Correction, “Idaho Department of Correction Historical Admissions and Releases for Fiscal Years 1996 to 2003.”
PRISONER REENTRY IN IDAHO 7


C H A P T E R 2 Characteristics of Idaho’s Released Prisoners In order to better understand prisoner reentry in Idaho, it is important to examine the characteristics of the population being released from Idaho’s secure facilities. This section describes the cohort released from secure facilities in the Idaho Department of Correction (IDOC) in 2003, examining basic demographics, program needs and availability, most serious conviction offenses, time served, prior incarceration histories, and physical and mental health conditions.25
DEMOGRAPHICS
In the 2003 calendar year, the IDOC system released 3,113 men and women into the community. The demographic composition of this 2003 release cohort reflects the composition of the Idaho prison population: the majority were male (83 percent) and white (79 percent). The release cohort also included individuals of other races, 14 percent of which were Hispanic and 4 percent Native American (figure 4). The racial distribution of the release cohort differs from the racial distribution of the state, which is 91 percent white, with all other races totaling less than 1 percent each.
Most prisoners were relatively young at the time of their release, with nearly three-quarters (73 percent) between the ages of 20 and 39 (figure 5). The average age of those released in 2003 was 33 years. Females released from Idaho’s prisons in 2003 were slightly older than males; the average age at release for females was 33.5 years compared with 32.9 years for males. Termers released from Idaho’s prisoners in 2003 were older than the riders; the average age at release for termers was 35.3 years compared with 29.7 years for riders.
At the time of their admission, slightly more than half (52 percent) of all prisoners released during 2003 reported that they were not married (figure 6),26 and over half (59 percent) of released prisoners also reported having at least one child.27 Among male releasees, 55 percent had at least one child compared with 81 percent of female releasees. While the percentage of male releasees with children declines as the number of children increases, the percentage of female releasees with children stays relatively constant (between 17 and 25 percent) for each category of total children (figure 7). Of released prisoners with children, the average number of children for male releasees is 1.2, versus an average of 2.1 children for female releasees.
25 Unless otherwise noted, the results presented in this chapter were generated from a datafile provided by the IDOC. The analysis includes only the first release from IDOC for each inmate in calendar year 2003. Of the 3,113 prisoners released in 2003, all but 2 percent had only one exit in 2003; only 56 prisoners had two or three exits in 2003. The analysis includes prisoners released from IDOC secure facilities (both correctional institutions and community work centers). Sample sizes for the analyses presented in this chapter are indicated on each chart. Differences in sample sizes are a function of missing data or data excluded for reasons explained in accompanying notes. 26 Marital status is reported upon admission to prison. Only 22 percent of prisoners were married when they entered prison. 27 Over one-third (35 percent) of the released prisoners were missing data regarding number of children and educational attainment. A large percentage (57 percent) of the missing data is associated with prisoners sentenced in Ada County, even though Ada County accounts only for 23 percent of incoming prisoners. This finding suggests that a disproportionately high percentage of prisoners from Ada County did not have pre-sentence investigations (PSI)—the source for these data. Until recently, the IDOC performed PSIs for all Idaho counties except Ada County, although it is now responsible for Ada County’s PSIs as well. In light of these missing data, the IDOC review and analysis unit analyzed a cohort of prisoners sentenced in Ada County and found that these prisoners had a similar number of children and level of educational attainment as those prisoners (statewide) who did have these data available.
PRISONER REENTRY IN IDAHO 9

Figure 4. Prisoners Released in Idaho by Race/Ethnicity, 2003
Hispanic14%
Other3%Native American
4%
White79%
Source: Urban Institute analysis of IDOC datafile of 2003 releasees. Note: These data were available for 3,096 observations.
Figure 5. Prisoners Released in Idaho by Age at Release, 2003
2
6
22
34
2
25
70.3
3553
13
0.2
0 5 10 15 20 25 30 35 40 45 50 55 60
60 and over
50-59
40-49
30-39
20-29
Under 20
Percent
RidersTermers
Source: Urban Institute analysis of IDOC datafile of 2003 releasees. Note: These data were available for 3,113 observations.
10 PRISONER REENTRY IN IDAHO

Figure 6. Prisoners Released in Idaho by Marital Status, 2003
Single52%
Married22%
Divorced20%
Other6%
Source: Urban Institute analysis of IDOC datafile of 2003 releasees. Note: These data were available for 2,985 observations.
Figure 7. Prisoners Released in Idaho by Number of Children, 2003
17
20
25
45
19
18
22
15
8
10
0 10 20 30 40 50
Four or more
Three
Two
One
None
Percent
MalesFemales
Source: Urban Institute analysis of IDOC datafile of 2003 releasees. Note: These data were available for 2,013 observations.
PRISONER REENTRY IN IDAHO 11

WHY THEY WERE IN PRISON
The largest percentage of Idaho prisoners who were released in 2003 had been serving time for nonviolent (and nondrug) offenses (46 percent), followed by drug offenses (33 percent) and violent offenses (21 percent). Of those released in 2003, a slightly higher percentage of termers had a violent offense (23 percent) as compared with riders (18 percent) (figure 8). Figure 9 presents, in more detail, the most serious offenses for which the prisoners released in 2003 were convicted and incarcerated.28
Figure 8. Prisoners Released in Idaho by General Category of Most Serious Conviction Offense, 2003
23
32
45
18
36
46
0 5 10 15 20 25 30 35 40 45 50
Violent
Drugs
Non-Violent
Percent
TermersRiders
Source: Urban Institute analysis of IDOC datafile of 2003 releasees. Notes: Figure excludes parole violators who were released after awaiting a Parole Commission hearing (who were not revoked) (n = 192). These data are based on 2,921 observations.
28 Parole violators who were released after awaiting a Parole Commission hearing (who were not revoked) were excluded from the figures in this section. In the cases of offenders who were incarcerated after being on probation or parole, their most serious conviction offense may represent the offense for which they were originally convicted or it may represent a new offense that they committed while on probation or parole and for which they were convicted and incarcerated.
12 PRISONER REENTRY IN IDAHO

Figure 9. Prisoners Released in Idaho by Category of Most Serious Conviction Offense, 2003
5
7
33
9
11
13
10
8
2
1
0 5 10 15 20 25 30 35
Other
DUI
Drugs
Forgery/Fraud
Theft
Burglary
Assault
Sex Offenses
Robbery
Murder/Manslaughter
Percent
Source: Urban Institute analysis of IDOC datafile of 2003 releasees. Notes: Figure excludes parole violators who were released after awaiting a Parole Commission hearing (who were not revoked) (n = 192). These data are based on 2,921 observations.
HOW LONG THEY WERE IN PRISON
For prisoners sentenced under Idaho’s Unified Sentencing Act, once they have served their minimum terms, the Parole Commission may release them to parole or decide to keep them in IDOC custody up to their maximum sentences. These rules do not apply to the rider population that remains under the jurisdiction of the courts. Given the role that offenders’ minimum sentences play in determining their time served in IDOC custody, the analysis that follows focuses on minimum sentences.
Prisoners released in 2003 had been sentenced to an average minimum of 27 months (2.25 years) in the Idaho correctional system. This average is the same for both termers and riders. Nearly three-quarters (71 percent) of the 2003 release cohort had a cumulative minimum sentence totaling two years or less, just over a quarter (27 percent) had a minimum sentence of between two and five years, and only 2 percent had a minimum sentence of more than five years.29 While the vast majority of both termers and riders had minimum cumulative sentences of two years or less, a greater percentage of termers had a minimum cumulative sentence of exactly one year, while a greater percentage of riders had a sentence of one to two years. Figure 10 presents separately the minimum cumulative sentences for termers and riders.
29 Parole violators who were not revoked and who were thus released in 2003 after being held pending a Parole Commission hearing were excluded from the analysis of sentence length. Prisoners with a minimum sentence of zero years (n = 72) were also excluded from the analysis of sentence length. Some of these prisoners have a sentence of life and some may be data entry errors.
PRISONER REENTRY IN IDAHO 13
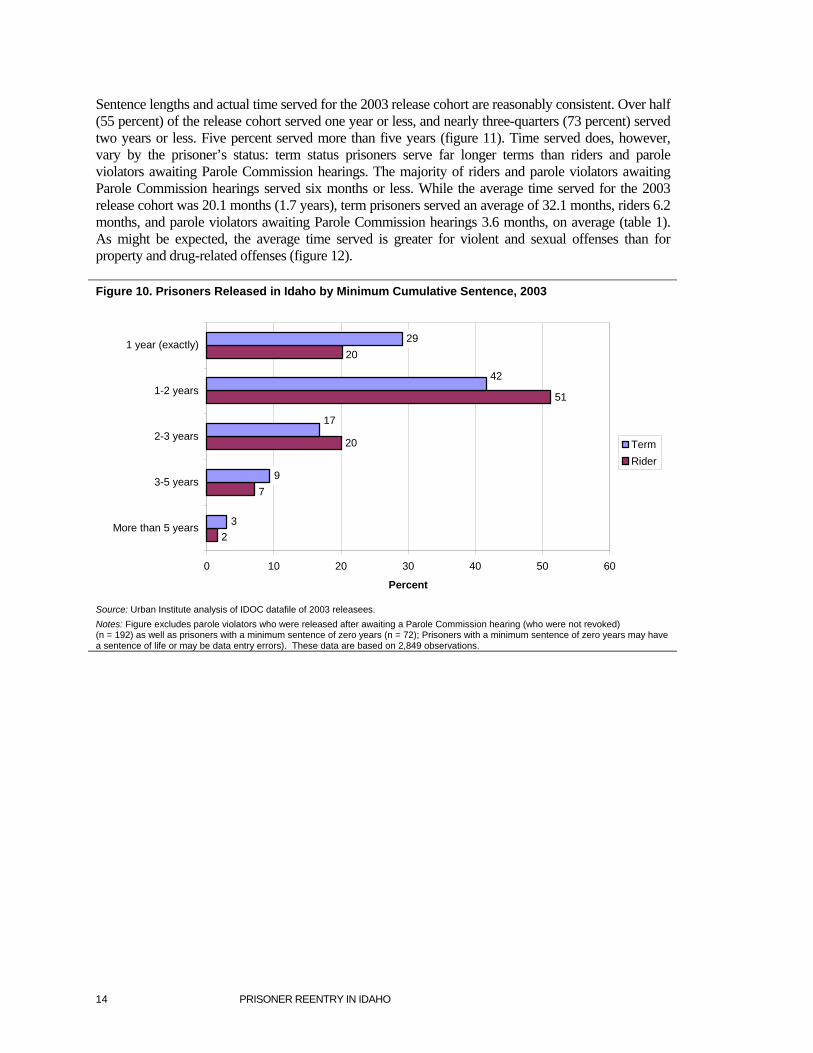
Sentence lengths and actual time served for the 2003 release cohort are reasonably consistent. Over half (55 percent) of the release cohort served one year or less, and nearly three-quarters (73 percent) served two years or less. Five percent served more than five years (figure 11). Time served does, however, vary by the prisoner’s status: term status prisoners serve far longer terms than riders and parole violators awaiting Parole Commission hearings. The majority of riders and parole violators awaiting Parole Commission hearings served six months or less. While the average time served for the 2003 release cohort was 20.1 months (1.7 years), term prisoners served an average of 32.1 months, riders 6.2 months, and parole violators awaiting Parole Commission hearings 3.6 months, on average (table 1). As might be expected, the average time served is greater for violent and sexual offenses than for property and drug-related offenses (figure 12).
Figure 10. Prisoners Released in Idaho by Minimum Cumulative Sentence, 2003
20
51
3
9
2920
7
2
42
17
0 10 20 30 40 50 60
More than 5 years
3-5 years
2-3 years
1-2 years
1 year (exactly)
Percent
TermRider
Source: Urban Institute analysis of IDOC datafile of 2003 releasees. Notes: Figure excludes parole violators who were released after awaiting a Parole Commission hearing (who were not revoked) (n = 192) as well as prisoners with a minimum sentence of zero years (n = 72); Prisoners with a minimum sentence of zero years may have a sentence of life or may be data entry errors). These data are based on 2,849 observations.
14 PRISONER REENTRY IN IDAHO

Figure 11. Prisoners Released in Idaho by Time Served in a Secure Facility and by Incarceration Status, 2003
0 5 10 15 20 25 30 35
More than 5 years
3-5 years
2-3 years
1-2 years
6 months - 1 year
6 months or less
Percent
Term Rider PV
Source: Urban Institute analysis of IDOC datafile of 2003 releasees. Note: These data are based on 3,089 observations.
Table 1. Average Time Served by Admission Type for Prisoners Released in 2003
Admission type Average time served (months)
Released prisoners
Term 32.1 1,674 Rider 6.2 1,244 Parole violators awaiting Parole Commission hearings (not revoked) 3.6 171 All of the above 20.1 3,089 Source: Urban Institute analysis of IDOC datafile of 2003 releasees.
PRISONER REENTRY IN IDAHO 15

Figure 12. IDOC Releasees by Average Time Served (in Years) and Crime Type, 2003
1.8
1.4
1.5
1.3
1.7
1.7
1.9
2.1
3.2
6.0
0 1 2 3 4 5 6 7
Other
DUI
Drugs
Forgery/Fraud
Theft
Burglary
Assault
Robbery
Sex Offenses
Murder/Manslaughter
Years
Source: Urban Institute analysis of IDOC datafile of 2003 releasees. Notes: Figure excludes parole violators who were released after awaiting a Parole Commission hearing and were not revoked (n = 192). These data are based on 2,921 observations.
CRIMINAL HISTORY, RECIDIVISM, AND DISCIPLINARY HISTORY
Cycling in and out of prison is common among released prisoners, whether they are returned to prison while under parole supervision or not. A national study by the Bureau of Justice Statistics (BJS) found that 52 percent of prisoners released in 1994 were returned to prison for new sentences or for technical violations within three years of their release.30 Another BJS study found that among state parole discharges nationwide in 2000, 42 percent were returned to prison or jail and 9 percent absconded within three years.31 While comparable recidivism statistics are not available for Idaho, the share of released prisoners who have been previously incarcerated suggests that they may be experiencing a lower recidivism rate than their national counterparts: approximately 34 percent of the 2003 release cohort having been incarcerated in the IDOC at least once before.32
30 Patrick A. Langan and David J. Levin, “Recidivism of Prisoners Released in 1994,” Bureau of Justice Statistics Special Report (Washington, DC: U.S. Department of Justice, 2002). 31 Timothy Hughs and Doris James Wilson, Reentry Trends in the U.S. (Washington, DC: U.S. Department of Justice, 2003). 32 This statistic may be an overestimate. The 2003 release cohort data provided by the IDOC indicated that only 11 percent of the releasees had been incarcerated in the IDOC once before and only 1 percent had two or more prior incarcerations in the IDOC. However, the number of prior incarcerations represents the number of previous commitments to incarceration, but does not indicate the number of times the offender has been in and out of prison. Thus, these data do not include those prisoners who had been returned to the IDOC for a parole revocation. Twenty-two percent of all offenders have previously been returned to the IDOC for parole revocations (and then released), according to a telephone conversation with Greg Sali of the IDOC on May 3, 2004. Combining these two categories of prisoners who had prior incarcerations in the IDOC produces the 34 percent estimate. What we do not know, however, is the extent to which the two estimates may overlap.
16 PRISONER REENTRY IN IDAHO

During their term of incarceration, just over one-quarter (27 percent) of the prisoners released in 2003 had one or two disciplinary reports, and 14 percent had more than two (figure 13). More than half (59 percent) of the prisoners (excluding parole violators awaiting hearings) received no major or minor disciplinary reports while incarcerated.
Figure 13. Prisoners Released in Idaho by Number of Disciplinary Reports, 2003
None59%
One to Two27%
Three to Five9%
More than Five5%
Source: Urban Institute analysis of IDOC datafile of 2003 releases. Notes: Figure excludes parole violators who were released after awaiting a Parole Commission hearing and who were not revoked (n = 192). These data are based on 2,921 observations.
MENTAL AND PHYSICAL HEALTH CHALLENGES
Many prisoners suffer from co-occurring and chronic mental and physical health disorders that make it difficult for them to transition from prison to free society.33 A 2002 report to Congress on the physical and mental health conditions of soon-to-be-released prisoners by the National Commission on Correctional Health Care found that tens of thousands of prisoners are released to communities every year with communicable and chronic diseases that are left largely untreated.34 Statistics on Idaho’s inmate population are not readily available, but if medical costs are any indication, health problems may pose a challenge to returning prisoners: from fiscal year 2002 to fiscal year 2003, medical costs for Idaho’s prisoners increased 4.5 percent and represented 9 percent ($9.8 million) of annual department expenditures. Medical costs have increased an additional 4.3 percent for fiscal year 2004.35
With respect to mental illness, the IDOC reports that over 600 prisoners (over 10 percent) have identified mental health issues, and that during fiscal year 2003, 897 prisoners (15 percent) were on 33 Laura Maruschak and Allen Beck, Medical Problems of Inmates, 1997, Bureau of Justice Statistics Special Report, NCJ 181644 (Washington, DC: U.S. Department of Justice, 2001). 34 National Commission on Correctional Health Care, The Health Status of Soon-to-Be-Released Inmates: A Report to Congress, vol. 1 (Washington, DC: National Commission on Correctional Health Care, 2002). 35 Idaho Department of Correction, Annual Report, Fiscal Year 2003.
PRISONER REENTRY IN IDAHO 17

psychotropic medication.36 Statistics for the 2003 release cohort are similar: approximately 13 percent had been on psychotropic medication at some point during their most recent incarceration period.
A specific area of heightened concern is the prevalence of HIV/AIDS in prison populations. Nationally, in 2000, 2.2 percent of state prisoners were HIV positive, and the overall rate of confirmed AIDS cases among the nation’s prison population was four times the rate in the U.S. general population (0.52 percent versus 0.13 percent).37 Idaho’s statistics are lower than the national rate: a 2002 study by the Bureau of Justice Statistics found that 0.4 percent of inmates in Idaho’s state prisons were known to be HIV positive. The numbers are identical for prisoners who were released from IDOC’s secure facilities in 2003: less than 1 percent (0.4 percent, n = 12) were HIV positive.38
EDUCATION AND PROGRAMMING
Historically, prison programs have played an important role in American corrections. Prison administrators and others have long believed that providing prison-based educational and vocational programs increases the likelihood that prisoners will return to the community with greater success. Recent research supports this rationale, showing that a range of prison-based programming can contribute to positive postrelease outcomes for prisoners, including reduced recidivism.39 In addition to prison-based programming, community-based services for released prisoners have been shown to increase the likelihood of successful reintegration and decrease the recidivism rate of released prisoners.40 In fact, research has shown that some of the most effective programs are those that combine in-prison programming with aftercare in the community.41
Education
Of those prisoners released in 2003, 53 percent possessed a high school diploma or GED prior to incarceration.42 Thirty percent of the 2003 release cohort had gone no further than 9th grade, 41 percent had 10th or 11th grade as their highest grade attended, and 29 percent had attended 12th grade or higher (figure 14).
One-third (33 percent) of all prisoners released in 2003 participated in a high school–level education class during their most recent period of incarceration. This statistic jumps to 43 percent for only those inmates who did not have a high school diploma or a GED prior to incarceration.43 Education class 36 These two statistics are counterintuitive in that one would expect that all those on psychotropic medications have been diagnosed with a mental illness; it is likely that the diagnosis data were collected at intake and do not represent all those who were diagnosed during their entire term of incarceration. Idaho Department of Correction, Annual Report, Fiscal Year 2003. At the end of fiscal year 2003, the number of individuals incarcerated in IDOC facilities totaled 5,825. 37 Laura Maruschak, HIV in Prisons, 2000, Bureau of Justice Statistics Bulletin, NCJ 196023 (Washington, DC: U.S. Department of Justice, 2002). The cumulative number of AIDS cases in Idaho reported through December 2002 was 547, a rate of 2.3 per 100,000 people. The cumulative number of AIDS cases reported through December 2002 for the United States was 859,000, a rate of 15 per 100,000 people (Henry J. Kaiser Family Foundation, State Health Facts Online, http://stateheatlhfacts.kff.org). 38 Urban Institute analysis of IDOC 2003 release cohort data. 39 Gerald G. Gaes, Timothy J. Flanagan, Laurence L. Motik, and Lynn Stewart, “Adult Correctional Treatment,” in Prisons, edited by M. Tonry and J. Petersilia (Chicago, IL: University of Chicago Press, 1999). 40 Sarah Lawrence, Daniel P. Mears, Glenn Dubin, and Jeremy Travis, The Practice and Promise of Prison Programming, Research Report (Washington, DC: The Urban Institute, 2002). 41 Gerald Gaes, Timothy S. Flanagan, Laurence L. Motiuk, and Lynn Stewart, “Adult Correctional Treatment,” in Prisons, edited by Michael Tonry and Joan Petersilia (361–426) (Chicago: University of Chicago Press, 1999). 42 The IDOC captures at admission, the highest educational grade attended (though not necessarily completed) by prisoners, and whether prisoners had a high school diploma or GED prior to incarceration. 43 This includes inmates who did not have information regarding educational attainment recorded in the datafile.
18 PRISONER REENTRY IN IDAHO

participation also differed greatly by incarceration status: 62 percent of the released riders participated in high school–level education classes compared with 30 percent of termers.44
A smaller portion of the 2003 release cohort completed a high school education or equivalent exam (such as a GED) during their most recent period of incarceration. Among inmates who did not have a high school diploma or a GED prior to incarceration,45 18 percent completed a high school education or equivalent exam. Again, incarceration status mattered: nearly one-third (31 percent) of released riders completed a high school education or equivalent exam compared with 10 percent of termers.
Figure 14. Prisoners Released in Idaho by Highest Grade Attended, 2003
2
27
41
30
0 5 10 15 20 25 30 35 40 45
Some College or more
Twelfth Grade
Tenth or Eleventh Grade
Ninth Grade or lower
Percent
Source: Urban Institute analysis of IDOC datafile of 2003 releases. Note: These data were available for 1,850 observations.
44 Note that the 192 parole violators who were released after awaiting a Parole Commission hearing (who were not revoked) are not included in the results of the prison program section since their participation in or completion of programs may have occurred during their original period of incarceration rather than during the period that they were awaiting a Parole Commission hearing. 45 This includes inmates who did not have information regarding educational attainment recorded in the datafile.
PRISONER REENTRY IN IDAHO 19

Other Prison Programs
As with prisoners around the country, the need for substance abuse treatment appears to be high among Idaho prisoners.46 The Level of Service Inventory (LSI) assessment tool indicated that 83 percent of prisoners released in 2003 had a need for treatment. IDOC sources indicate, however, that the LSI assessment tool may overestimate the actual number of persons needing treatment. With respect to treatment received, 11 percent of all prisoners released in 2003 participated in the IDOC Relapse Prevention Program47 during their most recent period of incarceration. Nearly three-quarters (73 percent) of those who participated in the program completed it.
In three facilities, the IDOC also offers therapeutic community (TC) programs,48 which last 6 to 12 months and target high-risk inmates with chronic criminal and substance abuse histories. Eleven percent of the prisoners released in 2003 participated in this program during their most recent period of incarceration, and nearly one-fifth (19 percent) of participants completed the program.
The IDOC also offers a Cognitive Self Change program, which is “designed to change the criminal thinking patterns of offenders in an effort to reduce negative behavior.”49 Almost one-fifth (17 percent) of the prisoners released in 2003 participated in a Cognitive Self Change program during their most recent period of incarceration, with over half (56 percent) of the participating prisoners completing the program.
46 For example, see the National Center on Addiction and Substance Abuse, Behind Bars: Substance Abuse and America’s Prison Population (New York: National Center on Addiction and Substance Abuse at Columbia University, 1998). Drug and alcohol abuse and addiction were implicated in the crimes and incarceration of 80 percent of inmates in state and federal prisons and local jails at the end of 1996. Forty-one percent of first-time offenders and 81 percent of offenders with five or more prior convictions have a history of regular drug use. From 1993 to 1996, as the number of inmates needing substance abuse treatment climbed from 688,000 to 840,000, the number of inmates in treatment hovered around 150,000. From 1995 to 1996, the number of inmates in treatment decreased as the number in need of treatment rose (http://www.casacolumbia.org/pdshopprov/shop/category.asp?catid=2). 47 The Relapse Prevention Program is a “comprehensive developmental recovery treatment model that is devised to help recovering offenders identify appropriate recovery plans, set treatment goals, and measure progress. The Developmental Model of Recovery addresses six stages of recovery. Each stage has tasks to be accomplished and skills to be developed” (Idaho Department of Correction, http://www.corr.state.id.us/programs/programs_substance.htm). 48 These programs “use a hierarchical model with treatment stages that reflect increased levels of personal and social responsibility. Peer influence, mediated through a variety of group processes, is used to help individuals learn and assimilate social norms and develop more effective social skills. TCs differ from other treatment approaches principally in their use of the community, comprised of treatment staff and those in recovery, as key agents of change. This approach is often referred to as ’community as method.’ TC members interact in structured and unstructured ways to influence attitudes, perceptions, and behaviors associated with drug use” (Idaho Department of Correction, http://www.corr.state.id.us/programs/programs_therapeutic.htm). 49 IDOC, “Appendix 3—Offender Programs and Education Report,” in Annual Statistical Report, Fiscal Year 2003 (Boise, ID: IDOC, 2004), http://corrections.state.id.us/facts/annualreport.pdf.
20 PRISONER REENTRY IN IDAHO

Juveniles Released in 2002
To more fully understand the reentry phenomenon in Idaho, it is important to examine juvenile releasees from state correctional institutions. Understanding the characteristics of the released juvenile population may help focus reentry interventions aimed at preventing recidivism and future admissions to prison.
In the 2002 calendar year, the Idaho Department of Juvenile Corrections (IDJC) released 373 juveniles into the community. With regard to gender and race, the composition of this 2002 juvenile release cohort reflects the composition of Idaho’s adult prison population: the majority was male (85 percent) and white (95 percent). Most of the juveniles released in 2002 (84 percent) were between the ages of 15 and 18 years.50 Approximately half had drug and alcohol problems (55 percent) and/or mental or physical health challenges (48 percent).
The largest share of juveniles released from the IDJC in 2002 had been serving time for nonviolent (and nondrug) offenses (62 percent).51 Forty-nine percent of the juvenile releasees had been incarcerated for a felony offense, 35 percent had been serving time for a misdemeanor offense, and 16 percent had been incarcerated for a parole violation. On average, juveniles were in custody for 1.4 years. Twelve percent of juveniles released in 2002 had been in an Idaho juvenile facility at least once before.
An IDJC Two-Year Report (Summer 2003) indicates that of the 453 juveniles (average daily count) in the Department’s custody at the time of the report, 50 percent will be adjudicated or convicted of a new felony or misdemeanor that is not a status offense or probation violation after a 24-month follow-up period. Of these juveniles, 78 percent will be adjudicated of a misdemeanor and 23 percent will be adjudicated of a felony. It is further noted that 9 percent will return to IDJC custody and 22 percent will be incarcerated by the Idaho Department of Correction (IDOC) approximately 18 months after release from the IDJC.52
50 Age distribution of 2002 juvenile release cohort: ages 11 to 14 years (7 percent); 15 or 16 years (34 percent); 17 or 18 years (50 percent); and 19 years or older (9 percent) (source: IDJC datafile). 51 Offense type distribution of 2002 juvenile release cohort: property offense (43 percent); persons offense (22 percent); sexual offense (13 percent); drug and alcohol (3 percent); other offense (19 percent) (source: IDJC datafile). 52 Idaho Department of Juvenile Corrections (Summer 2003) (http://www.djc.state.id.us/docs/Publications/Two-Year%20Report%202003.pdf).
PRISONER REENTRY IN IDAHO 21


C H A P T E R 3 Prisoner Release and Supervision Policies and Practices The first year after release is a critical period during which released prisoners are most susceptible to reoffending, emphasizing the importance of postrelease supervision.53 Postrelease supervision typically serves two primary functions with regard to preventing such recidivism: (1) promoting the successful reintegration of prisoners back into society and (2) monitoring released prisoners for public safety purposes. Idaho Community Corrections embraces both roles, using individual support and community programs and services to promote successful reintegration into the community, and employing supervision functions to ensure that released prisoners are maintaining drug- and crime-free lifestyles. This chapter provides an overview of how Idaho’s prisoners are released and supervised in the community.
HOW PRISONERS ARE RELEASED IN IDAHO
Idaho prisoners are released through one of three mechanisms: (1) discretionary release by the Parole Commission or judge; (2) mandatory release at the expiration of the prisoner’s sentence; or (3) other release, such as pardon or death.
The most common release mechanism employed in Idaho is discretionary release, whereby during their incarceration, prisoners appear before a judge or members of the Parole Commission who decide whether to approve their release. Of the prisoners released in fiscal year 2003, 80 percent (2,545 prisoners) were released discretionarily to some form of supervision. Forty-one percent were released to parole by the Parole Commission, while 39 percent were released to probation by a judge (figure 15). The incarcerated offenders released to probation are the riders who, as noted in chapter 1, are offenders who typically serve 120 to 180 days in a secure facility after which time a judge determines whether to release the offender to probation or require the offender to serve the imposed sentence as a termer. The prisoners released to parole are either termers granted release by the Parole Commission or parole violators who were reinstated on parole without being revoked.
Prisoners can also “max out” and be released through mandatory (nondiscretionary) means, having fully served their maximum sentence. These prisoners are released without any supervision requirements. In fiscal year 2003, 573 individuals, or 18 percent of the released population, exited prison at the expiration of their sentences with no subsequent period of supervision. Finally, a small population of prisoners (2 percent of those released in fiscal year 2003) exited prison through other means, such as a pardon or death (figure 15).
53 Patrick A. Langan and David J. Levin, Recidivism of Prisoners Released in 1994, Bureau of Justice Statistics Special Report (Washington, DC: U.S. Department of Justice, 2002).
PRISONER REENTRY IN IDAHO 23

Figure 15. Prisoners Released in Idaho by Release Type, FY 2003
Release to Parole41%
Release to Probation39%
Completion of Sentence
18%
Other2%
Source: Urban Institute analysis of Idaho Department of Correction, “Idaho Department of Correction Historical Admissions and Releases for Fiscal Years 1996 to 2003.”. Note: The data are based on 3,194 observations.
PROMINENCE OF POSTRELEASE SUPERVISION
Community Corrections Offices of the IDOC, in coordination with the Parole Commission, have jurisdiction over those prisoners released to a period of probation or parole. These offices were established “to integrate the delivery of correctional programming into related community supervision and operations as deemed necessary for the protection of society and the habilitation of offenders.”54 In recent years, the proportion of Idaho prisoners released to supervision in the community has remained stable, with approximately 80 percent of all prisoners being released to supervision (figure 16). The number of prisoners released to supervision, however, increased by 69 percent from 1,505 in fiscal year 1996 to 2,545 in fiscal year 2003, largely tracking the overall increase in releases.55
54 Specifically, these offices supervise probationers and parolees; provide programming, either directly or through other community resources, to assist releasees in achieving a crime-free lifestyle and satisfactory adjustment back to society; complete evaluations and provide information to the courts for use in sentencing decisions; and utilize practical methods to encourage self-improvement in the conduct and behavior of probationers and parolees (Idaho Department of Correction, Rules, Policy and Directives pages, http://www.corr.state.id.us/about_us/policy.htm). 55 Among the termers released in fiscal year 2003, 66 percent were released to parole supervision, and among the released riders, 100 percent were released to probation.
24 PRISONER REENTRY IN IDAHO

Figure 16. Releases from IDOC Secure Facilities to Supervision, FY 1996-2003
0
10
20
30
40
50
60
70
80
90
100
FY 96 FY 97 FY 98 FY 99 FY 00 FY 01 FY 02 FY 03
Perc
ent
Source: Urban Institute analysis of Idaho Department of Correction, “Idaho Department of Correction Historical Admissions and Releases for Fiscal Years 1996 to 2003.”
Toward the end of fiscal year 2003,56 approximately 144 community corrections officers supervised 9,940 released prisoners, a ratio of 69 prisoners per officer.57 Community Corrections provides accountability and protection to released prisoners by prescribing individual case management plans that are facilitated, monitored, and supervised through an assigned probation/parole officer. Released prisoners are assigned a supervision level (e.g., maximum, medium, and minimum) based on an assessment of their individual risk and/or needs, which determines the level of active supervision and the frequency of surveillance each month.58
There is, however, no fixed length of time that a released prisoner is supervised. Parolees are discharged from parole when the maximum sentence has expired, unless a Commission warrant was issued before the full term or the good-time release date.59 Parolees may be discharged prior to completion of their maximum sentence if the Parole Commission believes that an early discharge is compatible with the parolee’s welfare and that of society. However, the Commission is prohibited by law from granting a discharge from parole before the parolee has served at least one year under
56 Data are for May 2004. 57 Idaho Department of Correction, e-mail correspondence with Steve Nelson, program coordinator, June 23, 2004. 58 Officers usually have much more contact than these standards imply due to their community involvement and the needs of offenders (Idaho Department of Correction, http://www.corr.state.id.us/our_facilities/community.htm). 59 The good-time release date is the date a prisoner completes the term of sentence, minus statutory good time credits when applicable (Idaho Administrative Code [IDAPA 50.01.01] Rules of the Commission of Pardons and Parole, http://www2.state.id.us/adm/adminrules/rules/idapa50/0101.pdf). Statutory good time is used to reduce the maximum term of an inmate’s sentence for those who are eligible. It is subtracted from the final release date. The rate is specified by Idaho Code Section 20-101A. Statutory good time is available only for sentences on crimes committed before July 1, 1986, regardless of when the sentence was imposed. No statutory good-time reduction is allowed for sentences on crimes committed after July 1, 1986. Statutory good-time credits are computed and awarded in a lump sum at the beginning of the sentence. Good time is considered accrued and subject to forfeiture as of that date (Idaho Department of Correction, Policy Manual, Policy No. 136, Sentence Administration, http://www.corrections.state.id.us/policy/int136.pdf).
PRISONER REENTRY IN IDAHO 25
supervision, and certain other restrictions apply to sex and violent offenders, as well as those serving a life sentence.60
Parole is revoked when a parolee violates a condition of release or commits a new crime.61 The department has, however, implemented several changes in the way it responds to parolees who have committed violations, relying instead on graduated responses to violations other than immediate revocation (e.g., increased treatment requirements combined with discretionary jail time, day reporting combined with curfew, electronic monitoring, and increased parole officer contact). As a result, fewer parolees are being returned to prison: from fiscal year 1996 to 2002, 33 percent of parolees, on average, had their parole status revoked.62 By fiscal year 2003, that percentage had fallen to 24 percent.63
The court retains jurisdiction of riders (who are released to probation) through the Department of Correction; thus, the court determined parole conditions and lengths of supervision with the understanding that the probationer is also subject to the rules and regulations of the Division of Community Corrections. “Unlike parole, there is no minimum amount of time that is required of a probationer. The amount of time to be served is instead governed by (1) no more than the maximum time of the probationary terms and (2) a combination of the judge's dictates in the matter along with attitude and adjustment of the probationer.”64
60 Idaho Administrative Code (IDAPA 50.01.01), Rules of the Commission of Pardons and Parole (http://www2.state.id.us/adm/adminrules/rules/idapa50/0101.pdf). 61 For both probation and parole, a report of violation must be filed with either the judge in a probation case or with the Parole Commission in a parole case. The report of violation is discussed with district office management and sometimes with the judge or the Parole Commission. Depending on the nature of the violation, officers must document the use of intermediate sanctions and interventions before management (IDOC) will approve the report of violation. 62 Idaho Department of Correction, Annual Report, Fiscal Year 2003. From fiscal year 1996 through 2002, 39 percent of male parolees revoked and 27 percent of female parolees were revoked. Of the male parolees who were revoked, 85 percent were revoked within 24 months of parole, and of the female parolees who were revoked, 89 percent were revoked within 24 months of parole. In 2004, 18 percent of the parole revocations were for a new crime (e-mail correspondence with Megan Ronk, Idaho Department of Correction, July 14, 2004). 63 Idaho Department of Correction, Annual Report, Fiscal Year 2003. 64 Idaho Administrative Code (IDAPA 50.01.01), Rules of the Commission of Pardons and Parole (http://www2.state.id.us/adm/adminrules/rules/idapa50/0101.pdf).
26 PRISONER REENTRY IN IDAHO

Conditions of Release
Prisoners released to a period of parole supervision are subject to a number of conditions of release. Parolees must:
1. live in an approved residence and request permission to change residence or travel;
2. work in a lawful occupation or a program approved by the Commission;
3. support dependents to the best of their ability;
4. obey all municipal, county, state, and federal laws;
5. conduct themselves in a manner which is not, nor intended to be, harmful to themselves or others;
6. follow the written or oral instructions of the parole officer or Commission;
7. not possess or use firearms or other dangerous weapons;
8. abstain from the excessive use of alcoholic beverages;
9. abstain from the possession, procurement, use, or sale of narcotics or controlled substances;
10. freely cooperate and voluntarily submit to medical and chemical tests and examinations to determine the use or influence of alcohol or narcotics;
11. participate in treatment programs as specified by the Commission or ordered by the parole officer;65 and,
12. submit to random searches of person and/or property; and
13. in addition to general rules of parole, the commission may also add special conditions appropriate to the individual case.
Source: Idaho Administrative Code (IDAPA 50.01.01) Rules of the Commission of Pardons and Parole (http://www2.state.id.us/adm/adminrules/rules/idapa50/0101.pdf).
65 “Counselors provide group and individual services in conjunction with trained probation/parole officers in all districts offices and community work centers. Counselors provide linkage, coordination, and consistency in substance abuse treatment between Department of Correction institutions, Community Corrections, and community agencies and referrals. The primary focus is recovery from addiction; group/cognitive self-change; preventative education; transition; rational thinking; and prevention. Assessment, screening, and specialized substance abuse training for probation and parole staff also are provided. Substance abuse counselors work in conjunction with these trained substance probation/parole officers to develop effective treatment plans intended to facilitate long-term abstinence and stability” (Idaho Department of Correction, http://www.corr.state.id.us/our_facilities/community.htm).
PRISONER REENTRY IN IDAHO 27


C H A P T E R 4 Geographic Distribution of Released Prisoners The community context of prisoner reentry can have an important influence on postrelease success or failure. It stands to reason that ex-prisoners returning to communities with high unemployment rates, limited affordable housing options, active drug markets, and few services may be more likely to relapse and recidivate. This chapter presents findings from a geographic analysis of returning prisoners by county by mapping those prisoners released to supervision, and examines this reentry distribution in relation to the socioeconomic characteristics of the three counties with the highest concentrations of returning prisoners (as measured by releasees per 1,000 residents). It also discusses Ada County, which had the highest number of released prisoners in 2003.
REENTRY IN IDAHO
During 2003, the vast majority (90 percent) of supervised releasees returned to communities in Idaho.66 Five of Idaho’s 44 counties accounted for 73 percent of returning prisoners (figures 17 and 18). The greatest share (27 percent) returned to Ada County, followed by Canyon (13 percent), Twin Falls (11 percent), Kootenai (11 percent), and Bonneville (10 percent).67 These five counties make up 53 percent of Idaho’s resident population.68 Ada County, which has the greatest number of returning prisoners, however, has the lowest rate of returning prisoners among these five counties: 2.0 per every 1,000 residents. Among all counties in Idaho, Twin Falls and Washington Counties have the highest rates of returning prisoners (at 3.9 per 1,000 residents each), followed by Cassia County (3.6 per 1,000 residents) (figure 19)69. Because concentrations of released prisoners may be as important (if not more so) than sheer volume, we will first describe prisoner reentry in Ada County and then examine in more detail the characteristics of Twin Falls, Washington, and Cassia counties.
66 In 2003, 3,113 incarcerated offenders were released from IDOC facilities (note that only the first release for each prisoner released in 2003 was included in the analysis). The county of release is known for 2,239 of those individuals released to supervision in the community, which is 72 percent of all releasees. We do not have the county of release for the remaining 28 percent of the released population for the following reasons: 519 prisoners were released without supervision, 246 prisoners were released to an out-of-state location, and 109 supervised releasees were missing a county of release. 67 The number of returning prisoners are Ada (N = 611), Canyon (N = 292), Twin Falls (N = 253), Kootenai (N = 236), and Bonneville (N = 233). 68 2000 U.S. Census. 69 These rates were derived using county population figures from the 2000 U.S. Census.
PRISONER REENTRY IN IDAHO 29
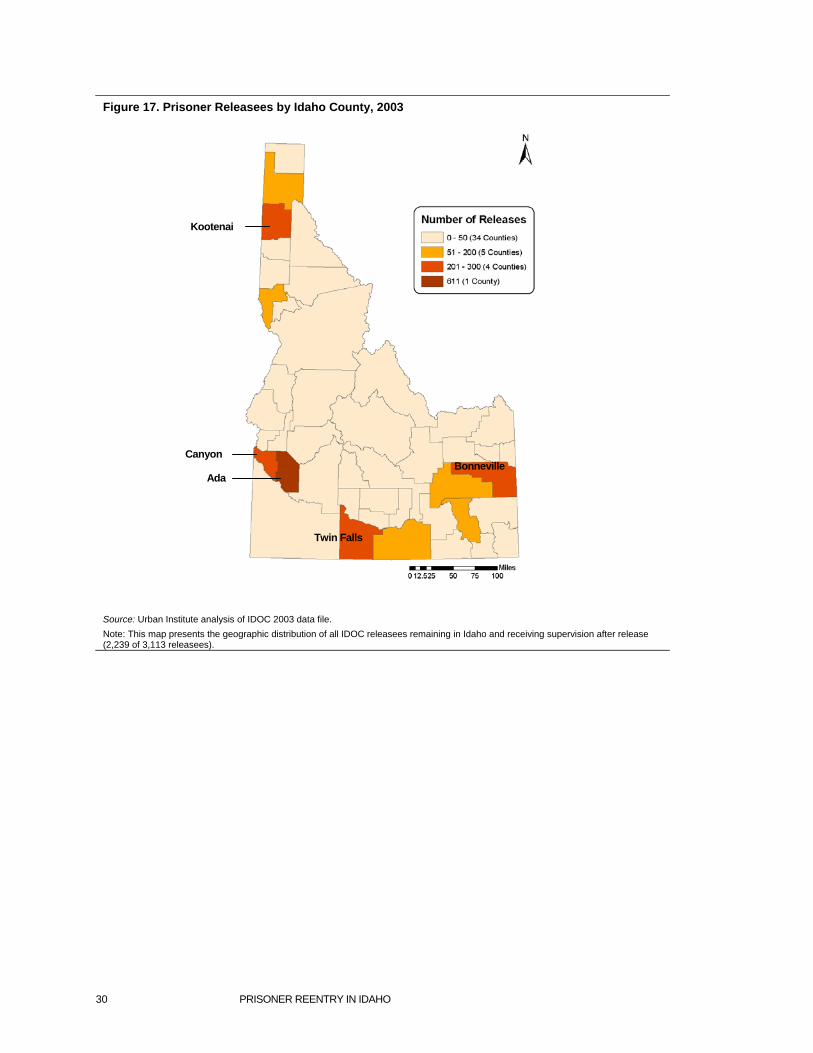
Figure 17. Prisoner Releasees by Idaho County, 2003
Source: Urban Institute analysis of IDOC 2003 data file. Note: This map presents the geographic distribution of all IDOC releasees remaining in Idaho and receiving supervision after release (2,239 of 3,113 releasees).
Ada
Canyon
Kootenai
Bonneville
Twin Falls
30 PRISONER REENTRY IN IDAHO

Figure 18. Prisoner Releasees by Idaho County, 2003
Ada28%
Canyon13%
Twin Falls11%
Kootenai11%
Bonneville10%
All Other Counties
27%
Source: Urban Institute analysis of IDOC 2003 data file.
Figure 19. Prisoner Releasees to Idaho Counties, Rate Per 1,000 Residents, 2003
Source: Urban Institute analysis of IDOC 2003 data.
PRISONER REENTRY IN IDAHO 31
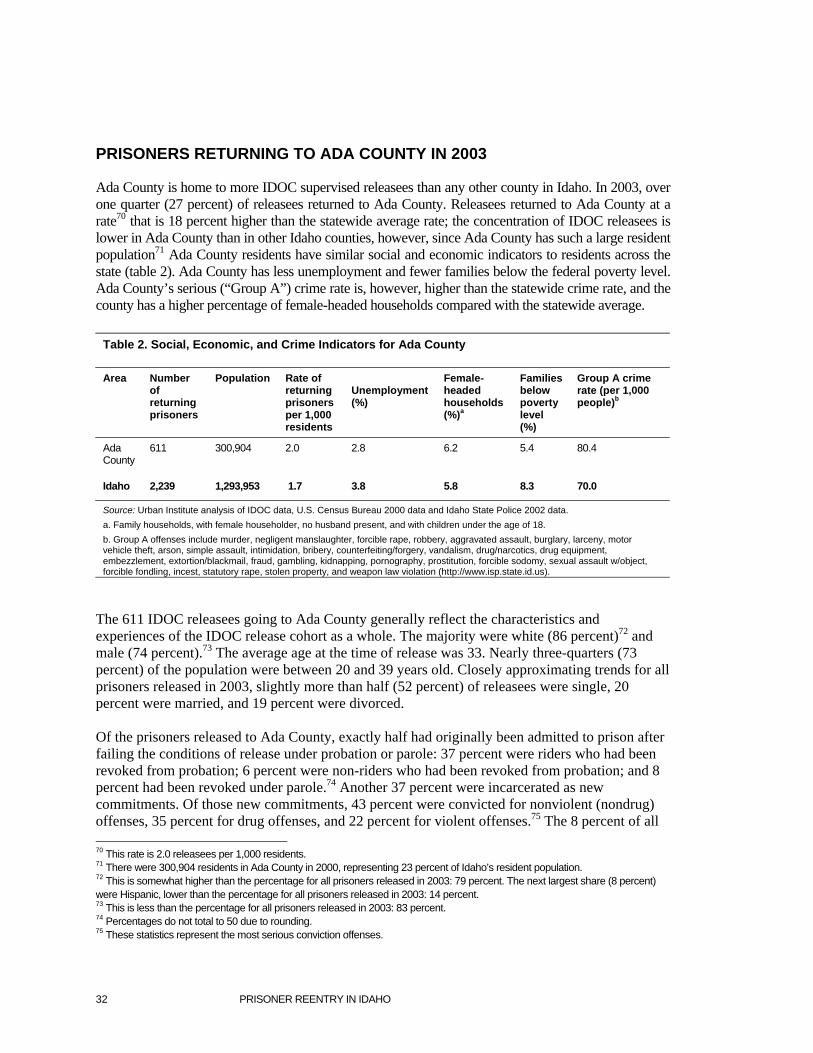
PRISONERS RETURNING TO ADA COUNTY IN 2003
Ada County is home to more IDOC supervised releasees than any other county in Idaho. In 2003, over one quarter (27 percent) of releasees returned to Ada County. Releasees returned to Ada County at a rate70 that is 18 percent higher than the statewide average rate; the concentration of IDOC releasees is lower in Ada County than in other Idaho counties, however, since Ada County has such a large resident population71 Ada County residents have similar social and economic indicators to residents across the state (table 2). Ada County has less unemployment and fewer families below the federal poverty level. Ada County’s serious (“Group A”) crime rate is, however, higher than the statewide crime rate, and the county has a higher percentage of female-headed households compared with the statewide average.
Table 2. Social, Economic, and Crime Indicators for Ada County
Area Number of returning prisoners
Population Rate of returning prisoners per 1,000 residents
Unemployment (%)
Female-headed households (%)a
Families below poverty level (%)
Group A crime rate (per 1,000 people)b
Ada County
611 300,904 2.0 2.8 6.2 5.4 80.4
Idaho 2,239 1,293,953 1.7 3.8 5.8 8.3 70.0
Source: Urban Institute analysis of IDOC data, U.S. Census Bureau 2000 data and Idaho State Police 2002 data. a. Family households, with female householder, no husband present, and with children under the age of 18. b. Group A offenses include murder, negligent manslaughter, forcible rape, robbery, aggravated assault, burglary, larceny, motor vehicle theft, arson, simple assault, intimidation, bribery, counterfeiting/forgery, vandalism, drug/narcotics, drug equipment, embezzlement, extortion/blackmail, fraud, gambling, kidnapping, pornography, prostitution, forcible sodomy, sexual assault w/object, forcible fondling, incest, statutory rape, stolen property, and weapon law violation (http://www.isp.state.id.us).
The 611 IDOC releasees going to Ada County generally reflect the characteristics and experiences of the IDOC release cohort as a whole. The majority were white (86 percent)72 and male (74 percent).73 The average age at the time of release was 33. Nearly three-quarters (73 percent) of the population were between 20 and 39 years old. Closely approximating trends for all prisoners released in 2003, slightly more than half (52 percent) of releasees were single, 20 percent were married, and 19 percent were divorced. Of the prisoners released to Ada County, exactly half had originally been admitted to prison after failing the conditions of release under probation or parole: 37 percent were riders who had been revoked from probation; 6 percent were non-riders who had been revoked from probation; and 8 percent had been revoked under parole.74 Another 37 percent were incarcerated as new commitments. Of those new commitments, 43 percent were convicted for nonviolent (nondrug) offenses, 35 percent for drug offenses, and 22 percent for violent offenses.75 The 8 percent of all 70 This rate is 2.0 releasees per 1,000 residents. 71 There were 300,904 residents in Ada County in 2000, representing 23 percent of Idaho’s resident population. 72 This is somewhat higher than the percentage for all prisoners released in 2003: 79 percent. The next largest share (8 percent) were Hispanic, lower than the percentage for all prisoners released in 2003: 14 percent. 73 This is less than the percentage for all prisoners released in 2003: 83 percent. 74 Percentages do not total to 50 due to rounding. 75 These statistics represent the most serious conviction offenses.
32 PRISONER REENTRY IN IDAHO

releasees who were parole violators—individuals who were released after awaiting a Parole Commission hearing and who ultimately did not have their parole revoked—were excluded from this analysis. The Ada County releasee cohort had an average minimum sentence of 24 months.76 A greater share of Ada County releasees received longer minimum sentences than releasees across the state. Slightly more than three-quarters (77 percent) of the release cohort had a cumulative minimum sentence totaling two years or less while approximately one-fifth (21 percent) had a minimum sentence between two and five years. The remaining 2 percent of releasees had a minimum sentence of more than five years.
Ada County releasees served an average of 1.4 years for their most recent incarceration.77 Over half (57 percent) of the release cohort served one year or less, and over three-quarters (77 percent) served two years or less. Four percent served more than five years. This analysis, however, indicates that the average time prisoners serve varies distinctly by their status: term status prisoners serve far longer terms than riders and parole violators awaiting Parole Commission hearings. On average, term prisoners served 27.2 months, riders served 6.1 months, and parole violators awaiting Parole Commission hearings served 1.9 months.
PRISONERS RETURNING TO TWIN FALLS, WASHINGTON, AND CASSIA COUNTIES
As mentioned above, among all Idaho counties, Twin Falls and Washington Counties had the highest rates of returning prisoners (at 3.9 per 1,000 residents each), followed by Cassia County (3.6 per 1,000 residents) (figure 19). The three counties that had the highest rates of returning prisoners are generally characterized by higher proportions of families living in poverty, higher than average unemployment rates,78 greater shares of female-headed households,79 and higher crime rates as compared with the state average (table 3).80 It should be noted that both Washington and Cassia counties had very low numbers of returning prisoners, however, at 39 and 76 respectively, and Washington County had a notably lower crime rate than the statewide average.
The demographic composition of prisoners released to Twin Falls, Washington, and Cassia Counties reflects the composition of the 2003 release cohort, with a few exceptions. While the majority of prisoners released to these counties were white males, Cassia County did have a greater percent of female released prisoners (24 percent compared with 17 percent for the 2003 release cohort), and both Cassia and Washington Counties had a greater percentage of Hispanic released prisoners (32 and 21 percent, respectively, compared with 14 percent for the 2003 release cohort). Like the 2003 release cohort, most prisoners released to these counties were relatively young at the time of their release, with over three-quarters between the ages of 20 and 39, and more than half reported that they were not married at the time of their admission.
The greatest percentage of prisoners released to these three counties, like the release cohort as a whole, had been serving time for nonviolent (and nondrug) offenses, followed by drug offenses, and then violent offenses. The prisoners released to Washington and Cassia Counties however, had a different
76 The 8 percent of releasees who were parole violators awaiting a hearing (and were never revoked) were excluded from the analysis of sentence length. 77 This includes parole violators who were not revoked after being held pending their Parole Commission hearings. 78 Cassia County is an exception. 79 Washington County is an exception. 80 Washington County is an exception.
PRISONER REENTRY IN IDAHO 33

admission type distribution compared with the 2003 release cohort. While 54 percent of the 2003 release cohort were termers, 40 percent riders, and 6 percent parole violators, the prisoners released to Washington and Cassia Counties were primarily admitted to prison as riders (74 and 78 percent, respectively), then termers (23 and 21 percent, respectively) and parole violators (3 and 1 percent, respectively).
While prisoners released to Washington and Cassia Counties generally reflected the cumulative minimum sentence distribution of the 2003 release cohort,81 a greater percentage of prisoners released to Twin Falls had received longer sentences.82 While over half (55 percent) of the 2003 release cohort had served one year or less in prison, a greater percentage of the prisoners released to Twin Falls (66 percent), Washington (77 percent), and Cassia (84 percent) Counties served one year or less in prison. This finding is not surprising given that these counties have larger populations of riders who are incarcerated for relatively shorter periods of time. The prisoners released to these three counties also had fewer prior incarcerations compared with the 2003 release cohort as a whole.83
Table 3. Three Counties with the Highest Concentrations of Returning Prisoners in Idaho, by Social, Economic and Crime Indicators
Area Number of returning prisoners
Population Rate of returning prisoners per 1,000 residents
Unemployment (%)
Female-headed households (%)a
Families below poverty level (%)
Group “A” crime rate (per 1,000 people)b
Twin Falls 253 64,284 3.9 3.9 5.9 9.1 94.2
Washington 39 9,977 3.9 4.7 4.9 10 35.6
Cassia 76 21,416 3.6 3.2 5.9 11.1 78.6
Idaho 2,239 1,293,953 1.7 3.8 5.8 8.3 70.0
Sources: Urban Institute analysis of IDOC 2003 data , U.S. Census Bureau 2000 data and Idaho State Police 2002 data. a. Family households, with female householder, no husband present, and with children under the age of 18. b. Group “A” offenses include murder, negligent manslaughter, forcible rape, robbery, aggravated assault, burglary, larceny, motor vehicle theft, arson, simple assault, intimidation, bribery, counterfeiting/forgery, vandalism, drug/narcotics, drug equipment, embezzlement, extortion/blackmail, fraud, gambling, kidnapping, pornography, prostitution, forcible sodomy, sexual assault w/object, forcible fondling, incest, statutory rape, stolen property, and weapon law violation (http://www.isp.state.id.us).
JUVENILES RELEASED IN 2002
During 2002, the majority (83 percent) of juveniles released from the Idaho Department of Juvenile Corrections (IDJC) returned to communities in Idaho.84 Five of Idaho’s 44 counties accounted for 59 percent (N = 182) of all juvenile releasees with known or in-state release county data (figure 20). As with the adult release population, the greatest share of released juveniles (29 percent) returned to Ada County. As can be seen in figure 20, juvenile releasees are returning to the same counties as are adult 81 Nearly three-quarters (71 percent) of the 2003 release cohort had a cumulative minimum sentence totaling two years or less, just over one-quarter (27 percent) had a minimum sentence of between two and five years, and only 2 percent had a minimum sentence of more than five years. 82 Fifty-one percent of prisoners released to Twin Falls had a cumulative minimum sentence totaling two years or less, and 42 percent had a minimum sentence of between two and five years. 83 Percentage of prisoners who had been incarcerated at least once before: 2003 release cohort (34 percent), Twin Falls County (17 percent), Washington County (5 percent), and Cassia County (5 percent). 84 In 2002, 373 incarcerated juvenile offenders were released from IDJC facilities. Seventeen percent (N = 63) of juvenile releasees were missing release county data or were returning to counties that were out of state.
34 PRISONER REENTRY IN IDAHO

releasees, with one notable exception: a smaller share of juveniles are returning to Twin Falls County than are adult releasees.
Figure 20. Geographic Distribution of Released Juveniles, 2002
Source: Urban Institute analysis of IDJC 2002 data.
PRISONER REENTRY IN IDAHO 35


C H A P T E R 5 Looking ForwardOver the past two decades, the growth in prison populations nationwide has translated into more and more people being released from prison and reentering society. The state of Idaho has experienced similar incarceration and release trends, but with even greater increases, and thus faces the reentry challenges that accompany such growth. Between 1996 and 2003, the Idaho prison population increased 60 percent, while state prison populations across the United States increased 23 percent. The number of people released from Idaho prisons reflects these rising population trends: in fiscal year 2003, 3,194 prisoners were released from Idaho prisons, a 78 percent increase from the number released in fiscal year 1996. The majority of these released prisoners were single white males, with an average age of 33. The largest percentage of prisoners had been serving time for nonviolent (nondrug) offenses, followed by drug offenses, and the average time served was 2.7 years for termers, approximately six months for riders, and less than four months for Parole Violators released after awaiting a hearing with the Parole Commission.
It is likely that socioeconomic community characteristics have an effect on reentry success or failure. Thus, from a reentry planning perspective, it is important to consider the community context of prisoner reentry. Are jobs available in or near the communities to which prisoners return? What is the availability of affordable housing in these areas? What is the prevalence of assets, such as faith-based institutions, versus risks, such as open-air drug markets? It is also useful to understand whether services for ex-prisoners are located within or in close proximity to these neighborhoods with high rates of returns, and whether prisoners returning to those areas are able to access these resources. The highest percentage of prisoners released in Idaho returned to Ada County, and the counties with the highest rates of prisoner return were Twin Falls, Washington, and Cassia. An analysis of social and economic indicators for Ada County suggests that its residents fare better than, or close to the same as, the average state resident. This same analysis for Twin Falls, Washington, and Cassia Counties indicates that Twin Falls and Cassia counties generally have higher proportions of families living in poverty, higher than average unemployment rates, greater shares of female-headed households, and higher crime rates as compared with the state average. Future research should include neighborhood-level analyses of community characteristics in Ada, Twin Falls, Washington, Cassia, and other Idaho counties, which will provide a more detailed picture of the communities to which released prisoners return.
Another important facet of prisoner reentry is the family context of the reintegration experience. That more than half of the prisoners released in 2003 had left children behind while incarcerated highlights the importance and challenge of family reunification upon a person’s release from prison. Families may be a strong source of support to returning prisoners, while others have their own histories of substance use and criminal activity that may make them negative influences for returning prisoners. Understanding the family context of prisoner reentry is thus critical in reentry planning efforts.
Returning prisoners in Idaho, like those nationwide, have many needs as they begin the process of reintegration. Health problems and issues of dependency on drugs and/or alcohol are likely to pose significant reentry challenges to the state’s returning prisoners—challenges that could seriously affect the ease of transition to life on the outside. Mental and physical health conditions of returning prisoners also have important public health implications, specifically related to the spread of infectious disease to the general population and the added strain on the health care system.
We also know that the likelihood of recidivating is high: roughly 34 percent of released prisoners in Idaho had served prior terms in prison. Criminal histories can create barriers to employment, housing, and eligibility for food stamps and other forms of public assistance, and can limit opportunities for civic
PRISONER REENTRY IN IDAHO 37
participation. It is thus paramount that state officials, service providers, and community stakeholders approach the reentry issue comprehensively, considering these many dimensions of the reentry experience and tapping the numerous resources that could provide assistance to returning prisoners and their families.
It is clear that the challenges of reentry in Idaho are great, but so are the opportunities. Successful reentry is critical for ensuring public safety, reducing the costs of incarceration, and promoting the well being of individuals, families and communities.
38 PRISONER REENTRY IN IDAHO