prisx tfifx financial services fund– i classindividual.troweprice.com/gcfiles/pdf/arfsf.pdf ·...
TRANSCRIPT

Proof #4
PRISX
TFIFX
Financial Services Fund
Financial Services Fund– I Class
aNNualREPORT
December 31, 2017
T. Rowe PRICe
The fund invests in companies that are primarily engaged in the financial services industry.

Proof #4
REPORTS ON THE WEB
Sign up for our Email Program, and you can begin to receive updated fund reports and prospectuses online rather than through the mail. Log in to your account at troweprice.com for more information.
HIGHLIGHTS
• Financialservicescompaniesweresolidperformersduringthe12-monthreportingperiod,benefitingfromoptimismabouttaxreform,solideconomicgrowth,risinginterestrates,andstableglobalfinancialmarkets.
• Yourfundreturned19.09%andoutperformedtheMorningstarFinancialAverageandtheLipperFinancialServicesFundsIndexbutslightlyunderperformedtheRussell3000FinancialIndex.
• Webelievethatcommunitybanksandpropertyandcasualtyinsurerswilloffersomeofthemostcompellinginvestmentopportunitiesinthesectorin2018.
• Barringarecession,financialstocksappearlikelytooutperformtheoverallmarketin2018.
T. Rowe Price Financial Services Fund
TheviewsandopinionsinthisreportwerecurrentasofDecember31,2017.They are not guarantees of performance or investment results andshouldnotbe takenas investmentadvice. Investmentdecisionsreflectavarietyof factors,and themanagers reserve the right tochange theirviews about individual stocks, sectors, and the markets at any time.As a result, the views expressed should not be relied upon as a fore-castof the fund’s future investment intent.Thereport iscertifiedunderthe Sarbanes-Oxley Act, which requiresmutual funds and other publiccompanies to affirm that, to the best of their knowledge, the informa-tionintheirfinancialreportsisfairlyandaccuratelystatedinallmaterialrespects.
Proof #4
T. Rowe Price Financial Services Fund
Manager’s Letter
1
Fellow Shareholders
Financial services companies performed well in 2017, benefiting from optimism
about tax reform along with solid economic growth, rising interest rates, and stable
global financial markets. Title insurers, payment networks, exchanges, and money
center banks led the gains, while community banks, commercial lines, property
and casualty (P&C) insurers, and reinsurers underperformed. The near-term
economic outlook looks solid with growth accelerating and confidence high among
consumers and corporations. However after the strong gains of 2017, we are
mindful that investor optimism is high and valuations are elevated for the overall
market. Nevertheless, we believe that financial services stocks are well positioned to
outperform in 2018, given that markets have only partially priced the prospect of an
improving regulatory backdrop into valuations and consensus expectations.
PERFORMANCE COMPARISON
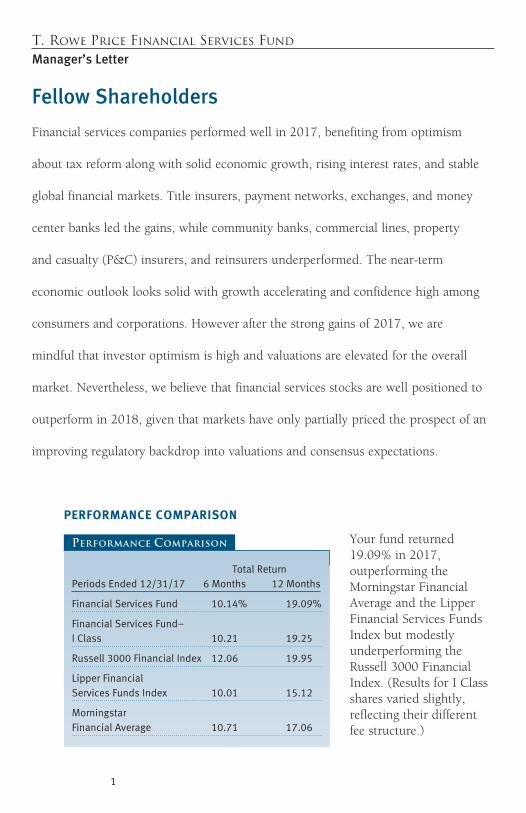
Your fund returned 19.09% in 2017, outperforming the Morningstar Financial Average and the Lipper Financial Services Funds Index but modestly underperforming the Russell 3000 Financial Index. (Results for I Class shares varied slightly, reflecting their different fee structure.)
TotalReturnPeriodsEnded12/31/17 6Months 12Months
FinancialServicesFund 10.14% 19.09%
FinancialServicesFund–IClass 10.21 19.25
Russell3000FinancialIndex 12.06 19.95
LipperFinancialServicesFundsIndex 10.01 15.12
MorningstarFinancialAverage 10.71 17.06
Performance Comparison

Proof #4
2
PERFORMANCE REVIEW
Stock selection largely drove outperformance versus the Morningstar Financial Average and the Lipper Financial Services Funds Index as a number of stocks in which we had been heavily investing over the past couple of years significantly contributed to performance in 2017. The fund’s modest underperformance versus the Russell 3000 Financial Index was due to its smaller average market capitalization ($74 billion) versus the average capitalization for the index ($128 billion) in a year in which large-caps significantly outperformed.
One of the mainstays of our investment philosophy is that we invest for the long term. We have been able to buy out-of-favor stocks that we believe will significantly outperform the market and the financial services sector over time. This approach has enabled us to materially increase positions in a number of out-of-favor, high-quality financial services companies that were trading at relatively inexpensive valuations during the postelection market rally. This group of stocks—which included payment networks Visa and MasterCard, exchanges Cboe Global Markets (CBOE) and Intercontinental Exchange, digital wallet PayPal, and title insurers Fidelity National Financial and First American Financial—drove a significant amount of the fund’s outperformance versus the fund’s benchmarks in 2017. (Please refer to the fund’s portfolio of investments for a complete list of holdings and the amount each represents in the portfolio.)
PayPal was the fund’s top performer. At one time, investors worried about the long-term sustainability of the company’s business model. However, PayPal has emerged as an investor darling, with best-in-class earnings growth and a high valuation by its peer group. The tide turned for the stock when PayPal’s management partnered with Visa, MasterCard, and other companies within the payments ecosystem. We had expected these partnerships to form, and our fundamental analysis suggested that the market was materially underestimating the company’s earnings growth potential.
Another strong contributor to performance for 2017 was CBOE. In 2016, amid investor disappointment with CBOE’s announced acquisition of BATS Global Markets, we had the rare opportunity to significantly increase our CBOE position at a modest valuation. We believed CBOE was a fast-growing and unique exchange, and at
Proof #4
3
that time, it was trading at a modest valuation of 17 times to 18 times earnings. As CBOE underperformed following the U.S. presidential election, we further increased our position and ultimately built it into one of the fund’s top 10 holdings. Toward the end of the first quarter of 2017, CBOE benefited from the rotation back into “structural winners,” as the company has a durable, low-double-digit earnings growth rate that is not reliant on cyclical factors or capital market strength.
In 2017, our research team’s analysis of highly cyclical automobile lenders paid off for us. Santander Consumer USA and Ally Financial had been among the most disliked and cheapest stocks within the financial services sector amid concern about the potential for rising losses in the deteriorating credit environment faced by auto lenders. Banks and consumer lenders had been overly aggressive in auto lending from 2014 to 2016 by loosening terms and conditions. Through lengthy research into public filings, industry data, and historical trends, our analysts concluded that auto losses were peaking and that profitability would start to improve in coming years. As a result of this work, we purchased Santander and Ally at significant discounts to their tangible book value. Both stocks were strong performers over the second half of the year as our fundamental thesis played out and credit loss concerns receded.
Community banks Signature Bank, and Popular were large detractors. With short-term rates rising and the yield curve flattening, banks with greater sensitivity to longer-term rates, such as Signature, significantly underperformed banks with sensitivity to short-term rates. Signature also suffered when it had to write down loans of New York City taxis, which had come under competitive pressure from Uber and Lyft.
Signature is trading at less than 14 times earnings for 2018, which is at the lower end of the peer group range. However, we believe the bank has better long-term growth prospects than others in the sector and a strong track record on credit quality. Additionally, we expect there will be a substantial amount of merger activity in coming years among regional and community banks, and we believe Signature is an attractive prospect for any larger bank looking to add high-quality assets in the Northeast or Florida. Thus, we increased exposure to Signature over the period.

Proof #4
4
Hurricane Maria significantly pressured shares of Popular, the largest domestic bank in Puerto Rico. The bank is likely to incur elevated losses as the local economy recovers. However, Puerto Rico’s economy could get an intermediate-term boost from the tens of billions of dollars of insurance claims and U.S. government emergency financial packages. Additionally, Popular has some of the highest capital ratios of any bank we follow and one of the lowest stock valuations. The shares trade at less than book value and at 10 times 2018 earnings estimates. As a result, we believe Popular is well positioned to withstand the challenges and appreciate over time, and we recently added to our position.
PORTFOLIO REVIEW
Your fund was well diversified across more than 97 issuers of securities as of December 31, and we have attempted to position the portfolio to outperform the financial services sector in a wide variety of economic backdrops. We consistently look for “idiosyncratic” investments that have the potential for higher-return scenarios, such as an operational turnaround or a company sale. We believe the strength of our analyst team and internal analytical resources is our chief competitive advantage. By utilizing our team’s expertise and taking full advantage of our three-year investment horizon, we have been able to invest in heavily discounted, out-of-favor stocks that have highly asymmetric risk/reward profiles.
Our economic outlook has not changed significantly since the beginning of 2017. We are optimistic that rising interest rates, lower taxes, healthy capital markets, and a more pro-business stance from regulators and politicians will help the sector. However, the areas where we expect to find our best investment opportunities are very different than they were at this time last year.
At the beginning of 2017, we felt that some of the most attractively valued stocks were the high-growth “structural winners,” such as Visa, MasterCard, and PayPal. After outperforming significantly in 2017, those stocks look less attractive going into 2018. In particular, we believe our fundamental thesis in PayPal has largely played out, and we have eliminated our position. With investors now understanding the benefits of the company’s strategic partnerships with Visa, MasterCard, and others, PayPal’s price-to-earnings ratio has expanded from 25.2 at the beginning of 2016 to 34.3 today.

Proof #4
5
We believe PayPal is still a highly attractive growth company but with neither a unique fundamental thesis nor a compelling valuation. As a result, we sold the stock and decided to be disciplined and look for the next opportunity for large returns.
Looking ahead, we believe that the two most attractive opportunities are in community banks and P&C insurers. We have long believed in the need for consolidation in the community bank segment as these highly fragmented businesses can benefit from the scale that comes with merger activity. In 2017, we owned several banks, including Park Sterling, BNC Bancorp (which was purchased by Pinnacle Financial Partners in
June), Paragon Commercial, Bank Mutual, and Clifton Bancorp, and we continue to own a number of banks that we believe are attractive takeover candidates, such as Pacific Premier Bancorp, BankUnited, Signature Bank, Heritage Commerce, Towne Bank, Old Line Bancshares, First Hawaiian, Seacoast Banking, Charter Financial, Cobiz Financial, Guaranty Bancorp, National Bank Holdings, Pacific Mercantile Bancorp, Preferred Bank, and First Republic Bank.
When selecting bank stocks, we carefully analyze a firm’s underwriting culture and its quality of deposits. Although the economy looks healthy today, we recognize that the economic expansion and equity bull market are more than nine years old. Thus, we are carefully assessing the risk profiles, underwriting processes, and management
Lipper Financial Financial ServicesAsof12/31/17 ServicesFund FundsIndex
RegionalBanks 32.4% 35.5%
PropertyandCasualtyInsurance 16.2 12.9
MoneyCenterBanks 15.4 9.4
TitleInsurance 5.6 1.2
Exchanges 4.8 3.0
ConsumerFinance 4.5 4.5
RealEstate 3.7 1.2
DiversifiedFinancials 3.3 3.4
SecurityBrokersandDealers 2.6 6.9
ThriftandMortgageFinance 2.1 2.6
TrustBanks 2.0 2.7
Other 6.6 16.7
Reserves 0.8 0.0
Total 100.0% 100.0%
Source:T.RowePrice.Funddataarebasedonthefund’snetassetsasof12/31/17.Lipperdataarebasedonthelatestholdingsdataavailableforthefundsrepresentedintheindex.
Industry Diversification

Proof #4
6
track records of each bank we consider. At the same time, as we move further into the Fed’s tightening cycle, pressures will increase for banks to raise deposit costs in order to attract and maintain deposits. Banks that have strong deposit franchises—such as SVB Financial Group and First Republic Bank—face less risk of unexpected deposit outflows or spikes in funding costs.
The P&C insurer group has become increasingly attractive in recent months as the stocks have significantly underperformed the financial services sector and the overall market. These insurers have been hit by the largest series of natural catastrophe losses in the industry’s history. While near-term earnings and book value have been negatively affected, we believe that the pricing cycle will likely improve correspondingly in 2018. This improvement in pricing should boost both earnings and valuations.
Our favorite P&C insurer continues to be Chubb. We believe it has one of the strongest balance sheets and largest excess capital positions in the industry. If we are correct about the direction of pricing, Chubb will be able to gain share at an increasingly attractive point in the cycle. We also own large positions in American International Group and Zurich Insurance Group. We believe they will deliver substantially improved financial results in coming years as new and improved management teams drive change. We have also recently added new positions in reinsurers Validus and Axis Capital—both of which materially underperformed in 2017—on the expectation that pricing will improve more than expected.
OUTLOOK
Financial markets and the economy have remained strong for longer than we would have anticipated a few years ago. At the same time, we do not see significant signs of excessive risk that tend to presage the creation and subsequent bursting of a bubble. We believe that the odds of the economy’s growth rate accelerating and decelerating from here are roughly equal. This belief sharpens our focus on the risk/reward profiles of every one of our current and prospective investments.
Barring a recession, we believe that financial stocks will outperform the overall market in 2018. In our view, investors are underestimating the beneficial impact of regulatory reform on industry returns and capital return. Earlier in 2017, investors seemed, to us, overly focused on the

Proof #4
7
political obstacles to legislative changes in regulation instead of on the far more important regulatory staffing decisions that would be made by the Trump administration. The new administration has appointed many key regulators whom we consider to be more banking friendly than their predecessors. Among those are the banking industry’s two most important regulators—a new chairman of the Federal Reserve and the vice chair for supervision on the Fed’s Board of Governors. Furthermore, leadership atop the highly influential Office of the Comptroller of the Currency, Federal Deposit Insurance Corporation, and Consumer Financial Protection Bureau has also been changed by the current administration.
It is important to note that regulatory reform is coming against the backdrop of a financial services ecosystem that has dramatically improved. Capital and liquidity requirements have been increased, regulators have become more proactive in identifying deteriorating lending standards, and banks have implemented more sophisticated risk management controls. We believe JPMorgan Chase, Citigroup, State Street, Morgan Stanley, Fifth Third Bancorp, and KeyCorp are among the greatest potential beneficiaries from regulatory reform, and each is a large position for the fund. Nevertheless, financial services stocks remain highly cyclical. In spite of the risk controls, we may not be able to anticipate the next financial crisis. However, we strongly believe the banks and regulators will be better positioned to weather the storm and minimize the damage than they were in the 2008–to–2009 recession.
Moreover, valuations for many of the stocks in the sector are still reasonable, and there are plenty of stocks that are trading well below what we believe to be their intrinsic value. Many of these stocks also have unique and company-specific catalysts, which we believe will lead to valuation expansion or greater-than-expected earnings growth. Finally, most of the management teams and directors for the largest banks today are focused on improving operations, growing organically, minimizing risk, and returning capital. In prior cycles, many of these same companies sought to grow through risky mergers and to improve returns by increasing leverage through the use of new, “innovative” products, such as mortgage-backed securities, credit default swaps, and minimum-balance guaranteed variable annuities.
Without a strong view on the direction of the economy, we are, as always, steadfastly focused on identifying idiosyncratic opportunities with strong upside potential. We seek stocks that have an important driver that we believe is either misunderstood or underappreciated

Proof #4
8
by the market. Our long-term investment horizon and contrarian investment style allow us to make opportunistic investments that have uniquely attractive upside and risk/reward profiles.
We thank you for your confidence in T. Rowe Price and in our investment management capabilities.
Respectfully submitted,
Gabriel SolomonChairman of the fund’s Investment Advisory Committee
January 22, 2018
The committee chairman has day-to-day responsibility for managing the portfolio and works with committee members in developing and executing the fund’s investment program.

Proof #4
9
T. Rowe Price Financial Services Fund
Risks of Investing
Thefund’ssharepricecanfallbecauseofweaknessinthestockmarket,aparticularindustry,orspecificholdings.Stockmarketscandeclineformanyreasons,includingadversepoliticaloreconomicdevelopments,changesininvestorpsychology,orheavyinstitutionalselling.Theprospectsforanindustryorcompanymaydeterioratebecauseofavarietyoffactors,includingdisappointingearningsorchangesinthecompetitiveenvironment.Inaddition,theinvestmentmanager’sassessmentofcompaniesheldinafundmayproveincorrect,resultinginlossesorpoorperformance,eveninrisingmarkets.
Fundsthatinvestonlyinspecificindustrieswillexperiencegreatervolatilitythanfundsinvestinginabroadrangeofindustries.Thebankingindustrycanbesignificantlyaffectedbylegislationthathasreducedtheseparationbetweencommercialandinvestmentbankingbusinesses,changedthelawsgoverningcapitalizationrequirementsandthesavingsandloanindustry,andincreasedcompetition.Inaddition,changesingeneraleconomicconditionsandinterestratescansignificantlyaffectthebankingindustry.Financialservicescompaniesmaybehurtwheninterestratesrisesharply,althoughnotallcompaniesareaffectedequally.Thestocksmayalsobevulnerabletorapidlyacceleratinginflation.
Glossary
Lipper indexes:FundbenchmarksthatconsistofasmallnumberofthelargestmutualfundsinaparticularcategoryastrackedbyLipperInc.
Morningstar Financial Average:Trackstheperformanceoffundsthatseekcapitalappreciationbyinvestingprimarilyinequitysecuritiesoffinancialservicescompanies.
Price-to-earnings (P/E) ratio—12 months forward:Avaluationmeasurecalculatedbydividingthepriceofastockbytheanalysts’forecastofthenext12months’expectedearnings.Theratioisameasureofhowmuchinvestorsarewillingtopayforthecompany’sfutureearnings.ThehighertheP/E,themoreinvestorsarepayingforacompany’searningsgrowthinthenext12months.
Russell 3000 Financial Index:Asub-indexoftheRussell3000IndexthatincludesallofthefinancialssectorcomponentsoftheRussell3000.
Tangible Book Value:Ameasurethatlooksatwhatcommonshareholderscanexpecttoreceiveifthefirmgoesbankruptandallofitsassetsareliquidatedattheirbookvalues;intangibleassetssuchasgoodwillareremovedfromthiscalculationbecausetheycannotbesoldduringliquidation.
Note:RussellInvestmentGroupisthesourceandownerofthetrademarks,servicemarks,andcopyrightsrelatedtotheRussellindexes.Russell®isatrademarkofRussellInvestmentGroup.

Proof #4
10
T. Rowe Price Financial Services Fund
TWENTY-FIVE LARGEST HOLDINGS
Percentof NetAssets 12/31/17
JPMorganChase 5.7%WellsFargo 5.3Citigroup 4.5Chubb 3.4FifthThirdBancorp 3.2
AmericanInternationalGroup 2.8BankUnited 2.8SignatureBank 2.5Visa 2.2CboeGlobalMarkets 2.1
KeyCorp 2.0StateStreet 2.0FirstRepublicBank 1.9IntercontinentalExchange 1.8RSAInsurance 1.6
FNF 1.6BlackKnight 1.5ZurichInsuranceGroup 1.5CoreLogic 1.5SLMCorporation 1.4
MorganStanley 1.3CitizensFinancial 1.3SeacoastBanking 1.3FirstHawaiian 1.3NationalBankHoldings 1.3
Total 57.8%
Note:Theinformationshowndoesnotreflectanyexchange-tradedfunds(ETFs),cashreserves,orcollateralforsecuritieslendingthatmaybeheldintheportfolio.
Portfolio Highlights

Proof #4
11
T. Rowe Price Financial Services Fund
MAJOR PORTFOLIO CHANGESListedindescendingorderofsize.
SixMonthsEnded12/31/17
Largest Purchases Largest Sales
AmericanInternationalGroupChubbPacWestBancorp*FidelityNationalInformationCardtronics*HomeBancshares*FranklinResources*KeyCorpSignatureBankPinnacleFinancialPartners
PayPalHoldings**StateStreetMetLife**SVBFinancialGroupVisaMasterCardProgressiveCitigroupMorganStanleyAvalonBayCommunities**
*Positionadded.**Positioneliminated.
Portfolio Highlights

Proof #4
T. Rowe Price Financial Services Fund
Performance and Expenses
12
Russell 3000 Financial Index $16,470
Financial Services Fund $19,709
As of 12/31/17
12/07 12/1312/1212/1112/1012/0912/08 12/1712/14
F I N A N C I A L SE R V I CES F U N D
Lipper Financial Services Funds Index $15,706
10,000
5,000
15,000
20,000
25,000
$30,000
Note: Performance for the I Class will vary due to its differing fee structure.
12/15 12/16
Growth of $10,000
Thischartshowsthevalueofahypothetical$10,000investmentinthefundoverthepast10fiscalyearperiodsorsinceinception(forfundslacking10-yearrecords).Theresultiscomparedwithbenchmarks,whichmayincludeabroad-basedmarketindexandapeergroupaverageorindex.Marketindexesdonotincludeexpenses,whicharedeductedfromfundreturnsaswellasmutualfundaveragesandindexes.
SincePeriodsEnded12/31/17 1Year 5Years 10Years Inception
FinancialServicesFund 19.09% 15.99% 7.02% –
FinancialServicesFund–IClass 19.25 – – 23.27%
Current performance may be higher or lower than the quoted past performance, which cannot guarantee future results. Share price, principal value, and return will vary, and you may have a gain or loss when you sell your shares. For the most recent month-end performance, please visit our website (troweprice.com) or contact a T. Rowe Price representative at 1-800-225-5132 or, for I Class shares, 1-800-638-8790.
Thistableshowshowthefundwouldhaveperformedeachyearifitsactual(orcumulative)returnsfortheperiodsshownhadbeenearnedataconstantrate.Averageannualtotalreturnfiguresincludechangesinprincipalvalue,reinvesteddividends,andcapitalgaindistributions.Returnsdonotreflecttaxesthattheshareholdermaypayonfunddistributionsortheredemptionoffundshares.Whenassessingperformance,investorsshouldconsiderbothshort-andlong-termreturns.
Average Annual Compound Total Return

Proof #4
13
T. Rowe Price Financial Services Fund
FinancialServicesFund 0.93%
FinancialServicesFund–IClass 0.76
Theexpenseratioshownisasofthefund’sfiscalyearended12/31/16.Thisnumbermayvaryfromtheexpenseratioshownelsewhereinthisreportbecauseitisbasedonadifferenttimeperiodand,ifapplicable,includesacquiredfundfeesandexpensesbutdoesnotincludefeeorexpensewaivers.
Expense Ratio
Fund Expense Example
Asamutualfundshareholder,youmayincurtwotypesofcosts:(1)transactioncosts,suchasredemptionfeesorsalesloads,and(2)ongoingcosts,includingmanagementfees,distributionandservice(12b-1)fees,andotherfundexpenses.Thefollowingexampleisintendedtohelpyouunderstandyourongoingcosts(indollars)ofinvestinginthefundandtocomparethesecostswiththeongoingcostsofinvestinginothermutualfunds.Theexampleisbasedonaninvestmentof$1,000investedatthebeginningofthemostrecentsix-monthperiodandheldfortheentireperiod.
Pleasenotethatthefundhastwoshareclasses:Theoriginalshareclass(InvestorClass)chargesnodistributionandservice(12b-1)fee,andtheIClasssharesarealsoavailabletoinstitutionallyorientedclientsandimposeno12b-1oradministrativefeepayment.Eachshareclassispresentedseparatelyinthetable.
Actual ExpensesThefirstlineofthefollowingtable(Actual)providesinformationaboutactualaccountvaluesandexpensesbasedonthefund’sactualreturns.Youmayusetheinformationonthisline,togetherwithyouraccountbalance,toestimatetheexpensesthatyoupaidovertheperiod.Simplydivideyouraccountvalueby$1,000(forexample,an$8,600accountvaluedividedby$1,000=8.6),thenmultiplytheresultbythenumberonthefirstlineundertheheading“ExpensesPaidDuringPeriod”toestimatetheexpensesyoupaidonyouraccountduringthisperiod.
Hypothetical Example for Comparison PurposesTheinformationonthesecondlineofthetable(Hypothetical)isbasedonhypotheticalaccountvaluesandexpensesderivedfromthefund’sactualexpenseratioandanassumed5%peryearrateofreturnbeforeexpenses(notthefund’sactualreturn).Youmaycomparetheongoingcostsofinvestinginthefundwithotherfundsbycontrastingthis5%hypotheticalexampleandthe5%hypotheticalexamplesthatappearintheshareholderreportsoftheotherfunds.Thehypotheticalaccountvaluesandexpensesmaynotbeusedtoestimatetheactualendingaccountbalanceorexpensesyoupaidfortheperiod.

Proof #4
14
T. Rowe Price Financial Services Fund
Fund Expense Example (continued)
Note:T.RowePricechargesanannualaccountservicefeeof$20,generallyforaccountswithlessthan$10,000.ThefeeiswaivedforanyinvestorwhoseT.RowePricemutualfundaccountstotal$50,000ormore;accountselectingtoreceiveelectronicdeliveryofaccountstatements,transactionconfirmations,prospectuses,andshareholderreports;oraccountsofaninvestorwhoisaT.RowePricePersonalServicesorEnhancedPersonalServicesclient(enrollmentintheseprogramsgenerallyrequiresT.RowePriceassetsofatleast$250,000).Thisfeeisnotincludedintheaccompanyingtable.Ifyouaresubjecttothefee,keepitinmindwhenyouareestimatingtheongoingexpensesofinvestinginthefundandwhencomparingtheexpensesofthisfundwithotherfunds.
Youshouldalsobeawarethattheexpensesshowninthetablehighlightonlyyourongoingcostsanddonotreflectanytransactioncosts,suchasredemptionfeesorsalesloads.Therefore,thesecondlineofthetableisusefulincomparingongoingcostsonlyandwillnothelpyoudeterminetherelativetotalcostsofowningdifferentfunds.Totheextentafundchargestransactioncosts,however,thetotalcostofowningthatfundishigher.
Beginning Ending ExpensesPaid AccountValue AccountValue DuringPeriod* 7/1/17 12/31/17 7/1/17to12/31/17
Investor ClassActual $1,000.00 $1,101.40 $4.45
Hypothetical(assumes5%returnbeforeexpenses) 1,000.00 1,020.97 4.28
I ClassActual 1,000.00 1,102.10 3.71
Hypothetical(assumes5%returnbeforeexpenses) 1,000.00 1,021.68 3.57
*Expensesareequaltothefund’sannualizedexpenseratioforthe6-monthperiod,multipliedbytheaverageaccountvalueovertheperiod,multipliedbythenumberofdaysinthemostrecentfiscalhalfyear(184),anddividedbythedaysintheyear(365)toreflectthehalf-yearperiod.TheannualizedexpenseratiooftheInvestorClasswas0.84%,andtheIClasswas0.70%.
Financial Services Fund

Proof #4
15
T. Rowe Price Financial Services Fund
Financial Highlights For a share outstanding throughout each period
The accompanying notes are an integral part of these financial statements.
Investor Class
Year Ended
12/31/17
12/31/16
12/31/15
12/31/14
12/31/13
NET ASSET VALUE
Beginning of period
$ 24.61
$ 21.26
$ 22.22
$ 20.57
$ 14.94
Investment activities
Net investment income(1)
0.21
0.29
0.31
0.20
0.17
Net realized and unrealized gain / loss
4.49
3.31
(0.45)
1.69
5.64
Total from investment activities
4.70
3.60
(0.14)
1.89
5.81
Distributions
Net investment income
(0.24)
(0.22)
(0.25)
(0.24)
(0.18)
Net realized gain
(1.07)
(0.03)
(0.57)
–
–
Total distributions
(1.31)
(0.25)
(0.82)
(0.24)
(0.18)
NET ASSET VALUE
End of period $ 28.00 $ 24.61 $ 21.26 $ 22.22 $ 20.57
Ratios/Supplemental Data Total return(2) 19.09% 16.91% (0.64)% 9.24% 38.93%
Ratio of total expenses to average net assets
0.85%
0.88%
0.86%
0.87%
0.88%
Ratio of net investment income to average net assets
0.78%
1.41%
1.36%
0.98%
0.97%
Portfolio turnover rate
54.8%
41.8%
38.1%
46.6%
48.7%
Net assets, end of period (in thousands)
$ 790,360
$ 743,520
$ 632,719
$ 521,666
$ 568,796
(1) Per share amounts calculated using average shares outstanding method. (2) Total return reflects the rate that an investor would have earned on an investment in the fund
during each period, assuming reinvestment of all distributions.
Proof #4
16
T. Rowe Price Financial Services Fund
Financial Highlights For a share outstanding throughout each period
The accompanying notes are an integral part of these financial statements.
I Class
Year Ended
12/31/17
11/29/16(1)
Through
12/31/16
NET ASSET VALUE
Beginning of period
$ 24.61
$ 23.61
Investment activities
Net investment income(2)
0.28(3)
0.04(3)
Net realized and unrealized gain / loss
4.46
1.21
Total from investment activities
4.74
1.25
Distributions
Net investment income
(0.29)
(0.22)
Net realized gain
(1.07)
(0.03)
Total from investment activities
(1.36)
(0.25)
NET ASSET VALUE
End of period $ 27.99 $ 24.61
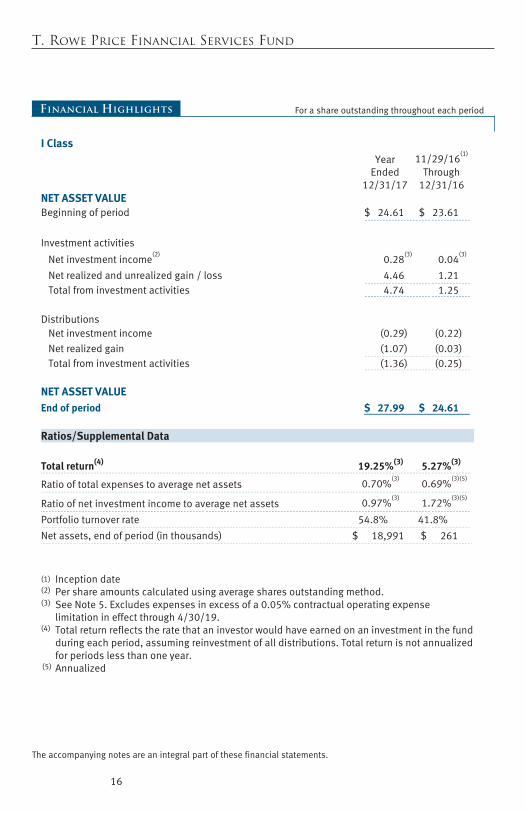
Ratios/Supplemental Data Total return(4) 19.25%(3) 5.27%(3)
Ratio of total expenses to average net assets
0.70%(3)
0.69%(3)(5)
Ratio of net investment income to average net assets
0.97%(3)
1.72%(3)(5)
Portfolio turnover rate
54.8%
41.8%
Net assets, end of period (in thousands)
$ 18,991
$ 261
(1) Inception date (2) Per share amounts calculated using average shares outstanding method. (3) See Note 5. Excludes expenses in excess of a 0.05% contractual operating expense
limitation in effect through 4/30/19. (4) Total return reflects the rate that an investor would have earned on an investment in the fund
during each period, assuming reinvestment of all distributions. Total return is not annualized for periods less than one year.
(5) Annualized
Proof #4
T. Rowe Price Financial Services Fund December 31, 2017
Portfolio of Investments ‡ Shares $ Value
(Cost and value in $000s)
17
First Page Footer
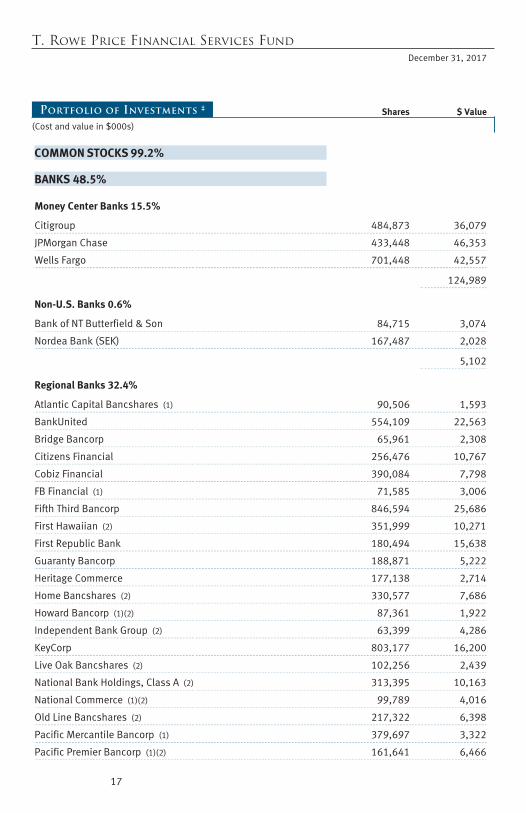
COMMON STOCKS 99.2%
BANKS 48.5%
Money Center Banks 15.5%
Citigroup 484,873 36,079
JPMorgan Chase 433,448 46,353
Wells Fargo 701,448 42,557
124,989
Non-U.S. Banks 0.6%
Bank of NT Butterfield & Son 84,715 3,074
Nordea Bank (SEK) 167,487 2,028
5,102
Regional Banks 32.4%
Atlantic Capital Bancshares (1) 90,506 1,593
BankUnited 554,109 22,563
Bridge Bancorp 65,961 2,308
Citizens Financial 256,476 10,767
Cobiz Financial 390,084 7,798
FB Financial (1) 71,585 3,006
Fifth Third Bancorp 846,594 25,686
First Hawaiian (2) 351,999 10,271
First Republic Bank 180,494 15,638
Guaranty Bancorp 188,871 5,222
Heritage Commerce 177,138 2,714
Home Bancshares (2) 330,577 7,686
Howard Bancorp (1)(2) 87,361 1,922
Independent Bank Group (2) 63,399 4,286
KeyCorp 803,177 16,200
Live Oak Bancshares (2) 102,256 2,439
National Bank Holdings, Class A (2) 313,395 10,163
National Commerce (1)(2) 99,789 4,016
Old Line Bancshares (2) 217,322 6,398
Pacific Mercantile Bancorp (1) 379,697 3,322
Pacific Premier Bancorp (1)(2) 161,641 6,466

Proof #4
T. Rowe Price Financial Services Fund
Shares $ Value
(Cost and value in $000s)
18
PacWest Bancorp (2) 172,300 8,684
Paragon Commercial (1)(2) 12,946 689
Pinnacle Financial Partners (2) 106,726 7,076
Popular (2) 266,826 9,470
Preferred Bank (2) 77,113 4,533
Prosperity Bancshares (2) 115,329 8,081
Seacoast Banking (1) 412,677 10,403
Signature Bank (1) 148,495 20,382
South State (2) 72,389 6,309
SVB Financial Group (1) 14,239 3,329
Towne Bank/Portsmouth VA (2) 179,025 5,505
Univest 133,299 3,739
Western Alliance Bancorp (1) 59,925 3,393
262,057
Total Banks 392,148
CAPITAL MARKETS 11.1%
Asset Managers 1.7%
Financial Engines (2) 120,400 3,648
Franklin Resources (2) 168,500 7,301
Virtus Investment Partners 27,700 3,187
14,136
Exchanges 4.8%
Cboe Global Markets 134,485 16,755
CME Group 48,754 7,121
Intercontinental Exchange 207,063 14,610
38,486
Security Brokers & Dealers 2.6%
Morgan Stanley 207,221 10,873
TD Ameritrade Holding 198,042 10,126
20,999

Proof #4
T. Rowe Price Financial Services Fund
Shares $ Value
(Cost and value in $000s)
19
Trust Banks 2.0%
State Street 161,837 15,797
15,797
Total Capital Markets 89,418
FINANCE 9.9%
Consumer Finance 4.5%
Ally Financial 144,000 4,199
Encore Capital (1)(2) 79,537 3,349
PRA Group (1)(2) 176,200 5,850
Santander Consumer USA Holdings (2) 300,700 5,599
SLM Corporation (1)(2) 985,045 11,131
Synchrony Financial 151,500 5,849
35,977
Diversified Financials 3.3%
MasterCard, Class A 61,982 9,382
Visa, Class A 154,738 17,643
27,025
Thrift & Mortgage Finance 2.1%
Charter Financial 260,579 4,570
Clifton Bancorp (2) 65,600 1,122
PennyMac Financial Services, Class A (1) 177,862 3,975
Webster Financial (2) 135,018 7,583
17,250
Total Finance 80,252
INSURANCE 23.2%
Insurance Agents - Brokers & Services 0.6%
Crawford, Class A 189,848 1,614
Marsh & McLennan 45,257 3,683
5,297

Proof #4
T. Rowe Price Financial Services Fund
Shares $ Value
(Cost and value in $000s)
20
Life Insurance 0.8%
AIA Group (HKD) 277,800 2,363
Brighthouse Financial (1) 25,328 1,485
Voya Financial (2) 47,600 2,355
6,203
Property & Casualty Insurance 16.2%
American International Group 381,100 22,706
Axis Capital Holdings 12,097 608
Chubb 190,700 27,867
CNA Financial (2) 175,537 9,312
Direct Line Insurance (GBP) 1,348,549 6,939
Hannover Rueck (EUR) 18,510 2,322
Infinity Property & Casualty (2) 13,535 1,435
Loews 69,946 3,500
ProAssurance 23,552 1,346
Progressive 129,853 7,313
RSA Insurance (GBP) 1,502,119 12,804
Safety Insurance Group 42,736 3,436
Sampo, A Shares (EUR) 43,868 2,408
State Auto Financial 255,091 7,428
Validus Holdings 17,200 807
White Mountains Insurance Group 1,716 1,461
XL Group 208,872 7,344
Zurich Insurance Group (CHF) 39,956 12,148
131,184
Title Insurance 5.6%
Black Knight (1) 278,689 12,304
CoreLogic (1) 261,929 12,104
First American Financial (2) 151,007 8,463
FNF 321,157 12,602
45,473
Total Insurance 188,157

Proof #4
T. Rowe Price Financial Services Fund
Shares $ Value
(Cost and value in $000s)
21
MISCELLANEOUS 2.8%
Other 2.8%
Cardtronics (1)(2) 338,200 6,264
DST Systems (2) 78,600 4,879
Equifax 28,591 3,371
Fidelity National Information 87,800 8,261
Total Miscellaneous 22,775
REAL ESTATE 3.7%
Real Estate 3.7%
American Campus Communities, REIT 89,751 3,682
Equity Residential, REIT (2) 50,430 3,216
JBG SMITH Properties, REIT 196,444 6,823
SL Green Realty, REIT (2) 73,046 7,373
TRI Pointe (1) 130,600 2,340
Vornado Realty Trust, REIT 80,918 6,326
Total Real Estate 29,760
Total Common Stocks (Cost $584,308) 802,510
SHORT-TERM INVESTMENTS 1.1%
Money Market Funds 1.1%
T. Rowe Price Government Reserve Fund, 1.24% (3)(4) 8,791,700 8,792
Total Short-Term Investments (Cost $8,792) 8,792

Proof #4
T. Rowe Price Financial Services Fund
Shares $ Value
(Cost and value in $000s)
22
SECURITIES LENDING COLLATERAL 3.6%
Investments in a Pooled Account through Securities Lending Program with State Street Bank and Trust Company 3.6%
Short-Term Funds 3.6%
T. Rowe Price Short-Term Fund, 1.49% (3)(4) 2,943,069 29,431
Total Investments through Securities Lending Program with State Street Bank and Trust Company 29,431
Total Securities Lending Collateral (Cost $29,431) 29,431
Total Investments in Securities
103.9% of Net Assets (Cost $622,531) $ 840,733
‡ Shares are denominated in U.S. dollars unless otherwise noted. (1) Non-income producing (2)
All or a portion of this security is on loan at December 31, 2017 -- total value of such securities at period-end amounts to $29,717. See Note 3.
(3) Seven-day yield (4) Affiliated Company
CHF Swiss Franc EUR Euro GBP British Pound HKD Hong Kong Dollar REIT
A domestic Real Estate Investment Trust whose distributions pass-through with original tax character to the shareholder
SEK Swedish Krona

Proof #4
T. Rowe Price Financial Services Fund
23
The accompanying notes are an integral part of these financial statements.
Affiliated Companies
($000s)
The fund may invest in certain securities that are considered affiliated companies. As defined by the 1940 Act, an affiliated company is one in which the fund owns 5% or more of the outstanding voting securities, or a company that is under common ownership or control. The following securities were considered affiliated companies for all or some portion of the year ended December 31, 2017. Net realized gain (loss), investment income, change in net unrealized gain/loss, and purchase and sales cost reflect all activity for the period then ended.
Affiliate
Net Realized Gain(Loss)
Change in NetUnrealizedGain/Loss
InvestmentIncome
T. Rowe Price Government Reserve Fund $ — $ — $ 152 T. Rowe Price Short-Term Fund — — —++ Totals $ —# $ — $ 152+ Supplementary Investment Schedule Affiliate
Value12/31/16
PurchaseCost
SalesCost
Value12/31/17
T. Rowe Price Government Reserve Fund $ 39,754 ¤ ¤ $ 8,792 T. Rowe Price Short-Term Fund 28,938 ¤ ¤ 29,431 $ 38,223^
# Capital gain/loss distributions from mutual funds represented $0 of the net realized gain
(loss). ++ Excludes earnings on securities lending collateral, which are subject to rebates and fees as
described in Note 3. + Investment income comprised $152 of dividend income and $0 of interest income. ¤ Purchase and sale information not shown for cash management funds. ^ The cost basis of investments in affiliated companies was $38,223.

Proof #4
24
T. Rowe Price Financial Services Fund December 31, 2017
The accompanying notes are an integral part of these financial statements.
($000s, except shares and per share amounts)
Statement of Assets and Liabilities
Assets
Investments in securities, at value (cost $622,531) $ 840,733
Receivable for shares sold 2,747
Dividends receivable 997
Other assets 1,316
Total assets 845,793
Liabilities
Obligation to return securities lending collateral 30,648
Payable for investment securities purchased 3,521
Payable for shares redeemed 1,664
Investment management fees payable 432
Due to affiliates 92
Payable to directors 1
Other liabilities 84
Total liabilities 36,442
NET ASSETS $ 809,351 Net Assets Consist of:
Undistributed net investment income $ 262
Accumulated undistributed net realized gain 16,632
Net unrealized gain 218,203
Paid-in capital applicable to 28,906,009 shares of $0.0001 par value capital stock outstanding; 1,000,000,000 shares authorized 574,254
NET ASSETS $ 809,351 NET ASSET VALUE PER SHARE
Investor Class ($790,359,899/ 28,227,563 shares outstanding) $ 28.00
I Class ($18,991,453/ 678,446 shares outstanding) $ 27.99

Proof #4
T. Rowe Price Financial Services Fund
($000s)
Statement of Operations
25
The accompanying notes are an integral part of these financial statements.
Year Ended
12/31/17Investment Income (Loss)
Income Dividend $ 12,624 Securities lending 60
Total income 12,684
Expenses Investment management 4,974 Shareholder servicing
Investor Class 1,209 Prospectus and shareholder reports
Investor Class 49 Custody and accounting 194 Registration 124 Legal and audit 25 Directors 3 Miscellaneous 24
Total expenses 6,602
Net investment income 6,082
Realized and Unrealized Gain / Loss
Net realized gain (loss) Securities 73,169 Foreign currency transactions (4)
Net realized gain 73,165
Change in net unrealized gain / loss
Securities 50,691 Other assets and liabilities denominated in foreign currencies 2
Change in net unrealized gain / loss 50,693
Net realized and unrealized gain / loss 123,858
INCREASE IN NET ASSETS FROM OPERATIONS $ 129,940

Proof #4
T. Rowe Price Financial Services Fund
($000s)
26
Statement of Changes in Net Assets
Year Ended
12/31/17 12/31/16Increase (Decrease) in Net Assets
Operations Net investment income $ 6,082 $ 7,755 Net realized gain (loss) 73,165 (13,305) Change in net unrealized gain / loss 50,693 91,372 Increase in net assets from operations 129,940 85,822
Distributions to shareholders
Net investment income Investor Class (6,408) (6,406) I Class (183) (2)
Net realized gain Investor Class (28,571) (728) I Class (673) –
Decrease in net assets from distributions (35,835) (7,136)
Capital share transactions*
Shares sold Investor Class 316,891 229,416 I Class 19,337 250
Distributions reinvested Investor Class 33,351 6,854 I Class 841 –
Shares redeemed Investor Class (396,998) (204,144) I Class (1,957) –
Increase (decrease) in net assets from capital share transactions (28,535) 32,376
Net Assets
Increase during period 65,570 111,062 Beginning of period 743,781 632,719
End of period $ 809,351 $ 743,781

Proof #4
T. Rowe Price Financial Services Fund
($000s)
27
The accompanying notes are an integral part of these financial statements.
Statement of Changes in Net Assets
Year Ended
12/31/17 12/31/16
Undistributed net investment income 262 771
*Share information
Shares sold Investor Class 12,132 10,187 I Class 707 11 Distributions reinvested Investor Class 1,190 279 I Class 30 – Shares redeemed Investor Class (15,305) (10,013) I Class (70) – Increase (decrease) in shares outstanding (1,316) 464

Proof #4
28
T. Rowe Price Financial Services Fund December 31, 2017
Notes to Financial Statements
T. Rowe Price Financial Services Fund, Inc. (the fund), is registered under the Investment Company Act of 1940 (the 1940 Act) as a diversified, open-end management investment company. The fund seeks long-term growth of capital and a modest level of income. The fund has two classes of shares: the Financial Services Fund (Investor Class) and the Financial Services Fund–I Class (I Class). I Class shares generally are available only to investors meeting a $1,000,000 minimum investment or certain other criteria. Each class has exclusive voting rights on matters related solely to that class; separate voting rights on matters that relate to both classes; and, in all other respects, the same rights and obligations as the other class.
NOTE 1 - SIGNIFICANT ACCOUNTING POLICIES
Basis of Preparation The fund is an investment company and follows accounting and reporting guidance in the Financial Accounting Standards Board (FASB) Accounting Standards Codification Topic 946 (ASC 946). The accompanying financial statements were prepared in accordance with accounting principles generally accepted in the United States of America (GAAP), including, but not limited to, ASC 946. GAAP requires the use of estimates made by management. Management believes that estimates and valuations are appropriate; however, actual results may differ from those estimates, and the valuations reflected in the accompanying financial statements may differ from the value ultimately realized upon sale or maturity.
Investment Transactions, Investment Income, and Distributions Investment transactions are accounted for on the trade date basis. Income and expenses are recorded on the accrual basis. Realized gains and losses are reported on the identified cost basis. Dividends received from mutual fund investments are reflected as dividend income; capital gain distributions are reflected as realized gain/loss. Dividend income and capital gain distributions are recorded on the ex-dividend date. Income tax-related interest and penalties, if incurred, are recorded as income tax expense. Distributions from REITs are initially recorded as dividend income and, to the extent such represent a return of capital or capital gain for tax purposes, are reclassified when such information becomes available. Income distributions are declared and paid by each class annually. Distributions to shareholders are recorded on the ex-dividend date. A capital gain distribution may also be declared and paid by the fund annually.

Proof #4
29
T. Rowe Price Financial Services Fund
Currency Translation Assets, including investments, and liabilities denominated in foreign currencies are translated into U.S. dollar values each day at the prevailing exchange rate, using the mean of the bid and asked prices of such currencies against U.S. dollars as quoted by a major bank. Purchases and sales of securities, income, and expenses are translated into U.S. dollars at the prevailing exchange rate on the respective date of such transaction. The portion of the results of operations attributable to changes in foreign exchange rates on investments is not bifurcated from the portion attributable to changes in market prices. The effect of changes in foreign currency exchange rates on realized and unrealized security gains and losses is reflected as a component of security gains and losses.
Class Accounting Shareholder servicing, prospectus, and shareholder report expenses incurred by each class are charged directly to the class to which they relate. Expenses common to both classes, investment income, and realized and unrealized gains and losses are allocated to the classes based upon the relative daily net assets of each class. To the extent any expenses are waived or reimbursed in accordance with an expense limitation (see Note 5), the waiver or reimbursement is charged to the applicable class or allocated across the classes in the same manner as the related expense.
Rebates Subject to best execution, the fund may direct certain security trades to brokers who have agreed to rebate a portion of the related brokerage commission to the fund in cash. Commission rebates are reflected as realized gain on securities in the accompanying financial statements and totaled $9,000 for the year ended December 31, 2017.
New Accounting Guidance In March 2017, the FASB issued amended guidance to shorten the amortization period for certain callable debt securities, held at a premium. The guidance is effective for fiscal years and interim periods beginning after December 15, 2018. Adoption will have no effect on the fund’s net assets or results of operations.
On August 1, 2017, the fund implemented amendments to Regulation S-X, issued by the Securities and Exchange Commission, which require standardized, enhanced disclosures, particularly related to derivatives, in investment company financial statements. Adoption had no effect on the fund’s net assets or results of operations.
Proof #4
30
T. Rowe Price Financial Services Fund
Indemnification In the normal course of business, the fund may provide indemnification in connection with its officers and directors, service providers, and/or private company investments. The fund’s maximum exposure under these arrangements is unknown; however, the risk of material loss is currently considered to be remote.
NOTE 2 - VALUATION
The fund’s financial instruments are valued and each class’s net asset value (NAV) per share is computed at the close of the New York Stock Exchange (NYSE), normally 4 p.m. ET, each day the NYSE is open for business. However, the NAV per share may be calculated at a time other than the normal close of the NYSE if trading on the NYSE is restricted, if the NYSE closes earlier, or as may be permitted by the SEC.
Fair Value The fund’s financial instruments are reported at fair value, which GAAP defines as the price that would be received to sell an asset or paid to transfer a liability in an orderly transaction between market participants at the measurement date. The T. Rowe Price Valuation Committee (the Valuation Committee) is an internal committee that has been delegated certain responsibilities by the fund’s Board of Directors (the Board) to ensure that financial instruments are appropriately priced at fair value in accordance with GAAP and the 1940 Act. Subject to oversight by the Board, the Valuation Committee develops and oversees pricing-related policies and procedures and approves all fair value determinations. Specifically, the Valuation Committee establishes procedures to value securities; determines pricing techniques, sources, and persons eligible to effect fair value pricing actions; oversees the selection, services, and performance of pricing vendors; oversees valuation-related business continuity practices; and provides guidance on internal controls and valuation-related matters. The Valuation Committee reports to the Board and has representation from legal, portfolio management and trading, operations, risk management, and the fund’s treasurer.
Various valuation techniques and inputs are used to determine the fair value of financial instruments. GAAP establishes the following fair value hierarchy that categorizes the inputs used to measure fair value:
Level 1 – quoted prices (unadjusted) in active markets for identical financial instruments that the fund can access at the reporting date

Proof #4
31
T. Rowe Price Financial Services Fund
Level 2 – inputs other than Level 1 quoted prices that are observable, either directly or indirectly (including, but not limited to, quoted prices for similar financial instruments in active markets, quoted prices for identical or similar financial instruments in inactive markets, interest rates and yield curves, implied volatilities, and credit spreads)
Level 3 – unobservable inputs
Observable inputs are developed using market data, such as publicly available information about actual events or transactions, and reflect the assumptions that market participants would use to price the financial instrument. Unobservable inputs are those for which market data are not available and are developed using the best information available about the assumptions that market participants would use to price the financial instrument. GAAP requires valuation techniques to maximize the use of relevant observable inputs and minimize the use of unobservable inputs. When multiple inputs are used to derive fair value, the financial instrument is assigned to the level within the fair value hierarchy based on the lowest-level input that is significant to the fair value of the financial instrument. Input levels are not necessarily an indication of the risk or liquidity associated with financial instruments at that level but rather the degree of judgment used in determining those values.
Valuation Techniques Equity securities listed or regularly traded on a securities exchange or in the over-the-counter (OTC) market are valued at the last quoted sale price or, for certain markets, the official closing price at the time the valuations are made. OTC Bulletin Board securities are valued at the mean of the closing bid and asked prices. A security that is listed or traded on more than one exchange is valued at the quotation on the exchange determined to be the primary market for such security. Listed securities not traded on a particular day are valued at the mean of the closing bid and asked prices for domestic securities and the last quoted sale or closing price for international securities.
For valuation purposes, the last quoted prices of non-U.S. equity securities may be adjusted to reflect the fair value of such securities at the close of the NYSE. If the fund determines that developments between the close of a foreign market and the close of the NYSE will affect the value of some or all of its portfolio securities, the fund will adjust the previous quoted prices to reflect what it believes to be the fair value of the securities as of the close of the NYSE. In deciding whether it is necessary to adjust quoted prices to reflect fair value, the fund reviews a variety of factors, including developments in foreign markets, the performance of U.S. securities markets, and the performance of instruments

Proof #4
32
T. Rowe Price Financial Services Fund
trading in U.S. markets that represent foreign securities and baskets of foreign securities. The fund may also fair value securities in other situations, such as when a particular foreign market is closed but the fund is open. The fund uses outside pricing services to provide it with quoted prices and information to evaluate or adjust those prices. The fund cannot predict how often it will use quoted prices and how often it will determine it necessary to adjust those prices to reflect fair value. As a means of evaluating its security valuation process, the fund routinely compares quoted prices, the next day’s opening prices in the same markets, and adjusted prices.
Actively traded equity securities listed on a domestic exchange generally are categorized in Level 1 of the fair value hierarchy. Non-U.S. equity securities generally are categorized in Level 2 of the fair value hierarchy despite the availability of quoted prices because, as described above, the fund evaluates and determines whether those quoted prices reflect fair value at the close of the NYSE or require adjustment. OTC Bulletin Board securities, certain preferred securities, and equity securities traded in inactive markets generally are categorized in Level 2 of the fair value hierarchy.
Investments in mutual funds are valued at the mutual fund’s closing NAV per share on the day of valuation and are categorized in Level 1 of the fair value hierarchy. Assets and liabilities other than financial instruments, including short-term receivables and payables, are carried at cost, or estimated realizable value, if less, which approximates fair value.
Thinly traded financial instruments and those for which the above valuation procedures are inappropriate or are deemed not to reflect fair value are stated at fair value as determined in good faith by the Valuation Committee. The objective of any fair value pricing determination is to arrive at a price that could reasonably be expected from a current sale. Financial instruments fair valued by the Valuation Committee are primarily private placements, restricted securities, warrants, rights, and other securities that are not publicly traded.
Subject to oversight by the Board, the Valuation Committee regularly makes good faith judgments to establish and adjust the fair valuations of certain securities as events occur and circumstances warrant. For instance, in determining the fair value of an equity investment with limited market activity, such as a private placement or a thinly traded public company stock, the Valuation Committee considers a variety of factors, which may include, but are not limited to, the issuer’s business prospects, its financial standing and performance, recent investment transactions in the issuer, new rounds of

Proof #4
33
T. Rowe Price Financial Services Fund
financing, negotiated transactions of significant size between other investors in the company, relevant market valuations of peer companies, strategic events affecting the company, market liquidity for the issuer, and general economic conditions and events. In consultation with the investment and pricing teams, the Valuation Committee will determine an appropriate valuation technique based on available information, which may include both observable and unobservable inputs. The Valuation Committee typically will afford greatest weight to actual prices in arm’s length transactions, to the extent they represent orderly transactions between market participants, transaction information can be reliably obtained, and prices are deemed representative of fair value. However, the Valuation Committee may also consider other valuation methods such as market-based valuation multiples; a discount or premium from market value of a similar, freely traded security of the same issuer; or some combination. Fair value determinations are reviewed on a regular basis and updated as information becomes available, including actual purchase and sale transactions of the issue. Because any fair value determination involves a significant amount of judgment, there is a degree of subjectivity inherent in such pricing decisions, and fair value prices determined by the Valuation Committee could differ from those of other market participants. Depending on the relative significance of unobservable inputs, including the valuation technique(s) used, fair valued securities may be categorized in Level 2 or 3 of the fair value hierarchy.
Valuation Inputs The following table summarizes the fund’s financial instruments, based on the inputs used to determine their fair values on December 31, 2017:
($000s) Level 1 Level 2 Level 3 Total Value
Quoted Prices
Significant Observable
Inputs
Significant Unobservable
Inputs
InvestmentsinSecurities,except: $ 38,223 $ — $ — $ 38,223
CommonStocks 761,498 41,012 — 802,510
Total $ 799,721 $ 41,012 $ — $ 840,733
There were no material transfers between Levels 1 and 2 during the year ended December 31, 2017.

Proof #4
34
T. Rowe Price Financial Services Fund
NOTE 3 - OTHER INVESTMENT TRANSACTIONS
Consistent with its investment objective, the fund engages in the following practices to manage exposure to certain risks and/or to enhance performance. The investment objective, policies, program, and risk factors of the fund are described more fully in the fund’s prospectus and Statement of Additional Information.
Securities Lending The fund may lend its securities to approved borrowers to earn additional income. Its securities lending activities are administered by a lending agent in accordance with a securities lending agreement. Security loans generally do not have stated maturity dates, and the fund may recall a security at any time. The fund receives collateral in the form of cash or U.S. government securities, valued at 102% to 105% of the value of the securities on loan. Collateral is maintained over the life of the loan in an amount not less than the value of loaned securities; any additional collateral required due to changes in security values is delivered to the fund the next business day. Cash collateral is invested in accordance with investment guidelines approved by fund management. Additionally, the lending agent indemnifies the fund against losses resulting from borrower default. Although risk is mitigated by the collateral and indemnification, the fund could experience a delay in recovering its securities and a possible loss of income or value if the borrower fails to return the securities, collateral investments decline in value, and the lending agent fails to perform. Securities lending revenue consists of earnings on invested collateral and borrowing fees, net of any rebates to the borrower, compensation to the lending agent, and other administrative costs. In accordance with GAAP, investments made with cash collateral are reflected in the accompanying financial statements, but collateral received in the form of securities is not. At December 31, 2017, the value of loaned securities was $29,717,000; the value of cash collateral and related investments was $30,648,000.
Other Purchases and sales of portfolio securities other than short-term securities aggregated $416,256,000 and $439,068,000, respectively, for the year ended December 31, 2017.

Proof #4
35
T. Rowe Price Financial Services Fund
NOTE 4 - FEDERAL INCOME TAxES
No provision for federal income taxes is required since the fund intends to continue to qualify as a regulated investment company under Subchapter M of the Internal Revenue Code and distribute to shareholders all of its taxable income and gains. Distributions determined in accordance with federal income tax regulations may differ in amount or character from net investment income and realized gains for financial reporting purposes. Financial reporting records are adjusted for permanent book/tax differences to reflect tax character but are not adjusted for temporary differences.
The fund files U.S. federal, state, and local tax returns as required. The fund’s tax returns are subject to examination by the relevant tax authorities until expiration of the applicable statute of limitations, which is generally three years after the filing of the tax return but which can be extended to six years in certain circumstances. Tax returns for open years have incorporated no uncertain tax positions that require a provision for income taxes.
Reclassifications to paid-in capital relate primarily to a tax practice that treats a portion of the proceeds from each redemption of capital shares as a distribution of taxable net investment income or realized capital gain. For the year ended December 31, 2017, the following reclassifications were recorded to reflect tax character (there was no impact on results of operations or net assets):
Undistributednetrealizedgain $ (5,585)
Paid-incapital 5,585
($000s)
Distributions during the years ended December 31, 2017 and December 31, 2016, were characterized for tax purposes as follows:
($000s)
December 312017 2016
Ordinaryincome $ 10,144 $ 6,408
Long-termcapitalgain 25,691 728
Totaldistributions $ 35,835 $ 7,136

Proof #4
36
T. Rowe Price Financial Services Fund
At December 31, 2017, the tax-basis cost of investments, including derivatives, and components of net assets were as follows:
Costofinvestments $ 626,021
Unrealizedappreciation $ 221,609
Unrealizeddepreciation (6,897)
Netunrealizedappreciation(depreciation) 214,712
Undistributedordinaryincome 4,316
Undistributedlong-termcapitalgains 16,069
Paid-incapital 574,254
Netassets $ 809,351
($000s)
The difference between book-basis and tax-basis net unrealized appreciation (depreciation) is attributable to the deferral of losses from wash sales for tax purposes. During the year ended December 31, 2017, the fund utilized $13,619,000 of capital loss carryforwards. In accordance with federal tax laws applicable to investment companies, net specified losses realized between November 1 and December 31 are not recognized for tax purposes until the subsequent year (late-year ordinary loss deferrals); however, such losses are recognized for financial reporting purposes in the year realized.
NOTE 5 - RELATED PARTY TRANSACTIONS
The fund is managed by T. Rowe Price Associates, Inc. (Price Associates), a wholly owned subsidiary of T. Rowe Price Group, Inc. (Price Group). The investment management agreement between the fund and Price Associates provides for an annual investment management fee, which is computed daily and paid monthly. The fee consists of an individual fund fee, equal to 0.35% of the fund’s average daily net assets, and a group fee. The group fee rate is calculated based on the combined net assets of certain mutual funds sponsored by Price Associates (the group) applied to a graduated fee schedule, with rates ranging from 0.48% for the first $1 billion of assets to 0.265% for assets in excess of $650 billion. The fund’s group fee is determined by applying the group fee rate to the fund’s average daily net assets. At December 31, 2017, the effective annual group fee rate was 0.29%.

Proof #4
37
T. Rowe Price Financial Services Fund
The I Class is subject to an operating expense limitation (I Class limit) pursuant to which Price Associates is contractually required to pay all operating expenses of the I Class, excluding management fees, interest, expenses related to borrowings, taxes, brokerage, and other non-recurring expenses permitted by the investment management agreement, to the extent such operating expenses, on an annualized basis, exceed 0.05% of average net assets. This agreement will continue until April 30, 2019, and may be renewed, revised, or revoked only with approval of the fund’s Board. The I Class is required to repay Price Associates for expenses previously paid to the extent the class’s net assets grow or expenses decline sufficiently to allow repayment without causing the class’s operating expenses (after the repayment is taken into account) to exceed both: (1) the expense limitation in place at the time such amounts were paid; and (2) the class’s current expense limitation. However, no repayment will be made more than three years after the date of a payment or waiver.
Pursuant to this agreement, less than $1,000 of expenses were waived/paid by Price Associates during the year ended December 31, 2017 and remain subject to repayment by the fund.
In addition, the fund has entered into service agreements with Price Associates and two wholly owned subsidiaries of Price Associates (collectively, Price). Price Associates provides certain accounting and administrative services to the fund. T. Rowe Price Services, Inc. provides shareholder and administrative services in its capacity as the fund’s transfer and dividend-disbursing agent. T. Rowe Price Retirement Plan Services, Inc. provides subaccounting and recordkeeping services for certain retirement accounts invested in the Investor Class and I Class. For the year ended December 31, 2017, expenses incurred pursuant to these service agreements were $85,000 for Price Associates; $560,000 for T. Rowe Price Services, Inc.; and $110,000 for T. Rowe Price Retirement Plan Services, Inc. The total amount payable at period-end pursuant to these service agreements is reflected as Due to Affiliates in the accompanying financial statements.
Additionally, the fund is one of several mutual funds in which certain college savings plans managed by Price Associates may invest. As approved by the fund’s Board of Directors, shareholder servicing costs associated with each college savings plan are borne by the fund in proportion to the average daily value of its shares owned by the college savings plan. For the year ended December 31, 2017, the fund was charged $72,000 for shareholder servicing costs related to the college savings plans, of which $45,000 was for services provided by Price. The amount payable at period-end pursuant to this

Proof #4
38
T. Rowe Price Financial Services Fund
agreement is reflected as Due to Affiliates in the accompanying financial statements. At December 31, 2017, approximately 5% of the outstanding shares of the Investor Class were held by college savings plans.
The fund may invest its cash reserves in certain open-end management investment companies managed by Price Associates and considered affiliates of the fund: the T. Rowe Price Government Reserve Fund or the T. Rowe Price Treasury Reserve Fund, organized as money market funds, or the T. Rowe Price Short-Term Fund, a short-term bond fund (collectively, the Price Reserve Funds). The Price Reserve Funds are offered as short-term investment options to mutual funds, trusts, and other accounts managed by Price Associates or its affiliates and are not available for direct purchase by members of the public. Cash collateral from securities lending is invested in the T. Rowe Price Short-Term Fund. The Price Reserve Funds pay no investment management fees.
As of December 31, 2017, T. Rowe Price Group, Inc., or its wholly owned subsidiaries owned 10,589 shares of the I Class, representing 2% of the I Class’s net assets.
The fund may participate in securities purchase and sale transactions with other funds or accounts advised by Price Associates (cross trades), in accordance with procedures adopted by the fund’s Board and Securities and Exchange Commission rules, which require, among other things, that such purchase and sale cross trades be effected at the independent current market price of the security. During the year ended December 31, 2017, the aggregate value of purchases and sales cross trades with other funds or accounts advised by Price Associates was less than 1% of the fund’s net assets as of December 31, 2017.
NOTE 6 - BORROWING
To provide temporary liquidity, the fund may borrow from other T. Rowe Price-sponsored mutual funds under an interfund borrowing program developed and managed by Price Associates. The program permits the borrowing and lending of cash at rates beneficial to both the borrowing and lending funds. Pursuant to program guidelines, loans totaling 10% or more of a borrowing fund’s total assets require collateralization at 102% of the value of the loan; loans of less than 10% are unsecured. During the year ended December 31, 2017, the fund incurred $1,000 in interest expense related to outstanding borrowings on 3 days in the average amount of $5,300,000 and at an average annual rate of 1.92%. At December 31, 2017, there were no borrowings outstanding.

Proof #4
39
T. Rowe Price Financial Services Fund
Report of Independent Registered Public Accounting Firm
To the Board of Directors and Shareholders of T. Rowe Price Financial Service Fund, Inc.
Opinion on the Financial Statements
We have audited the accompanying statement of assets and liabilities, including the portfolio of investments, of T. Rowe Price Financial Service Fund, Inc. (the “Fund”) as of December 31, 2017, the related statement of operations for the year ended December 31, 2017, the statement of changes in net assets for each of the two years in the period ended December 31, 2017, including the related notes, and the financial highlights for each of the periods indicated therein (collectively referred to as the “financial statements”). In our opinion, the financial statements present fairly, in all material respects, the financial position of the Fund as of December 31, 2017, the results of its operations for the year then ended, the changes in its net assets for each of the two years in the period ended December 31, 2017 and the financial highlights for each of the periods indicated therein, in conformity with accounting principles generally accepted in the United States of America.
Basis for Opinion
These financial statements are the responsibility of the Fund’s management. Our responsibility is to express an opinion on the Fund’s financial statements based on our audits. We are a public accounting firm registered with the Public Company Accounting Oversight Board (United States) (“PCAOB”) and are required to be independent with respect to the Fund in accordance with the U.S. federal securities laws and the applicable rules and regulations of the Securities and Exchange Commission and the PCAOB.
We conducted our audits of these financial statements in accordance with the standards of the PCAOB. Those standards require that we plan and perform the audit to obtain reasonable assurance about whether the financial statements are free of material misstatement, whether due to error or fraud.

Proof #4
40
T. Rowe Price Financial Services Fund
Report of Independent Registered Public Accounting Firm (continued)
Our audits included performing procedures to assess the risks of material misstatement of the financial statements, whether due to error or fraud, and performing procedures that respond to those risks. Such procedures included examining, on a test basis, evidence regarding the amounts and disclosures in the financial statements. Our audits also included evaluating the accounting principles used and significant estimates made by management, as well as evaluating the overall presentation of the financial statements. Our procedures included confirmation of securities owned as of December 31, 2017 by correspondence with the custodians, transfer agent and brokers; when replies were not received from brokers, we performed other auditing procedures. We believe that our audits provide a reasonable basis for our opinion.
PricewaterhouseCoopers LLPBaltimore, MarylandFebruary 15, 2018
We have served as the auditor of one or more investment companies in the T. Rowe Price group of investment companies since 1973.

Proof #4
41
T. Rowe Price Financial Services Fund
Tax Information (Unaudited) for the Tax Year Ended 12/31/17
WeareprovidingthisinformationasrequiredbytheInternalRevenueCode.Theamountsshownmaydifferfromthoseelsewhereinthisreportbecauseofdifferencesbetweentaxandfinancialreportingrequirements.
Thefund’sdistributionstoshareholdersincluded:
• $4,743,000fromshort-termcapitalgains
• $30,085,000fromlong-termcapitalgains,ofwhich$29,961,000wassubjecttoalong-termcapitalgainstaxrateofnotgreaterthan20%,and$124,000toalong-termcapitalgainstaxrateofnotgreaterthan25%.
Fortaxablenon-corporateshareholders,$12,811,000ofthefund’sincomerepresentsqualifieddividendincomesubjecttoalong-termcapitalgainstaxrateofnotgreaterthan20%.
Forcorporateshareholders,$10,527,000ofthefund’sincomequalifiesforthedividends-receiveddeduction.
AdescriptionofthepoliciesandproceduresusedbyT.RowePricefundsandportfoliostodeterminehowtovoteproxiesrelatingtoportfoliosecuritiesisavailableineachfund’sStatementofAdditionalInformation.Youmayrequestthisdocumentbycalling1-800-225-5132orbyaccessingtheSEC’swebsite,sec.gov.
Thedescriptionofourproxyvotingpoliciesandproceduresisalsoavailableonourcorporatewebsite.Toaccessit,pleasevisitthefollowingWebpage:
https://www3.troweprice.com/usis/corporate/en/utility/policies.html
Scrolldowntothesectionnearthebottomofthepagethatsays,“ProxyVotingPolicies.”ClickontheProxyVotingPolicieslinkintheshadedbox.
Eachfund’smostrecentannualproxyvotingrecordisavailableonourwebsiteandthroughtheSEC’swebsite.ToaccessitthroughT.RowePrice,visitthewebsitelocationshownabove,andscrolldowntothesectionnearthebottomofthepagethatsays,“ProxyVotingRecords.”ClickontheProxyVotingRecordslinkintheshadedbox.
Information on Proxy Voting Policies, Procedures, and Records
ThefundfilesacompletescheduleofportfolioholdingswiththeSecuritiesandExchangeCommissionforthefirstandthirdquartersofeachfiscalyearonFormN-Q.Thefund’sFormN-QisavailableelectronicallyontheSEC’swebsite(sec.gov);hardcopiesmaybereviewedandcopiedattheSEC’sPublicReferenceRoom,100FSt.N.E.,Washington,DC20549.FormoreinformationonthePublicReferenceRoom,call1-800-SEC-0330.
How to Obtain Quarterly Portfolio Holdings

Proof #4
42
T. Rowe Price Financial Services Fund
About the Fund’s Directors and Officers
YourfundisoverseenbyaBoardofDirectors(Board)thatmeetsregularlytoreviewawidevarietyofmattersaffectingorpotentiallyaffectingthefund,includingperformance,investmentprograms,compliancematters,advisoryfeesandexpenses,serviceproviders,andbusinessandregulatoryaffairs.TheBoardelectsthefund’sofficers,whoarelistedinthefinaltable.Atleast75%oftheBoard’smembersareindependentofT.RowePriceAssociates,Inc.(T.RowePrice),anditsaffiliates;“inside”or“interested”directorsareemployeesorofficersofT.RowePrice.Thebusinessaddressofeachdirectorandofficeris100EastPrattStreet,Baltimore,Maryland21202.TheStatementofAdditionalInformationincludesadditionalinformationaboutthefunddirectorsandisavailablewithoutchargebycallingaT.RowePricerepresentativeat1-800-638-5660.
Independent Directors
Name(Year of Birth)Year Elected*[Number of T. Rowe Priceportfolios Overseen]
Principal Occupation(s) and Directorships of Public Companies and Other Investment Companies During the Past Five Years
BruceW.Duncan(1951)2013[191]
ChiefExecutiveOfficerandDirector(2009toDecember2016),ChairmanoftheBoard(January2016topresent),andPresident(2009toSeptember2016),FirstIndustrialRealtyTrust,anownerandoperatorofindustrialproperties;ChairmanoftheBoard(2005toSeptember2016)andDirector(1999toSeptember2016),StarwoodHotels&Resorts,ahotelandleisurecompany;Director,BostonProperties(May2016topresent);Director,MarriottInternational,Inc.(September2016topresent)
RobertJ.Gerrard,Jr.(1952)2012[191]
AdvisoryBoardMember,PipelineCrisis/WinningStrategies,acollaborativeworkingtoimproveopportunitiesforyoungAfricanAmericans(1997topresent)
PaulF.McBride(1956)2013[191]
AdvisoryBoardMember,VizziaTechnologies(2015topresent)
*Eachindependentdirectorservesuntilretirement,resignation,orelectionofasuccessor.

Proof #4
43
T. Rowe Price Financial Services Fund
Independent Directors (continued)
Name(Year of Birth)Year Elected*[Number of T. Rowe Priceportfolios Overseen]
Principal Occupation(s) and Directorships of Public Companies and Other Investment Companies During the Past Five Years
CeciliaE.Rouse,Ph.D.(1963)2012[191]
Dean,WoodrowWilsonSchool(2012topresent);ProfessorandResearcher,PrincetonUniversity(1992topresent);MemberofNationalAcademyofEducation(2010topresent);Director,MDRC,anonprofiteducationandsocialpolicyresearchorganization(2011topresent);ResearchAssociateofLaborStudiesProgram(2011to2015)andBoardMember(2015topresent),NationalBureauofEconomicResearch(2011topresent);ChairofCommitteeontheStatusofMinorityGroupsintheEconomicProfession(2012topresent);VicePresident(2015topresent),AmericanEconomicAssociation
JohnG.Schreiber(1946)2001[191]
Owner/President,CentaurCapitalPartners,Inc.,arealestateinvestmentcompany(1991topresent);Cofounder,Partner,andCochairmanoftheInvestmentCommittee,BlackstoneRealEstateAdvisors,L.P.(1992to2015);Director,GeneralGrowthProperties,Inc.(2010to2013);Director,BlackstoneMortgageTrust,arealestatefinancecompany(2012to2016);DirectorandChairmanoftheBoard,BrixmorPropertyGroup,Inc.(2013topresent);Director,HiltonWorldwide(2013topresent);Director,HudsonPacificProperties(2014to2016)
MarkR.Tercek(1957)2009[191]
PresidentandChiefExecutiveOfficer,TheNatureConservancy(2008topresent)
*Eachindependentdirectorservesuntilretirement,resignation,orelectionofasuccessor.
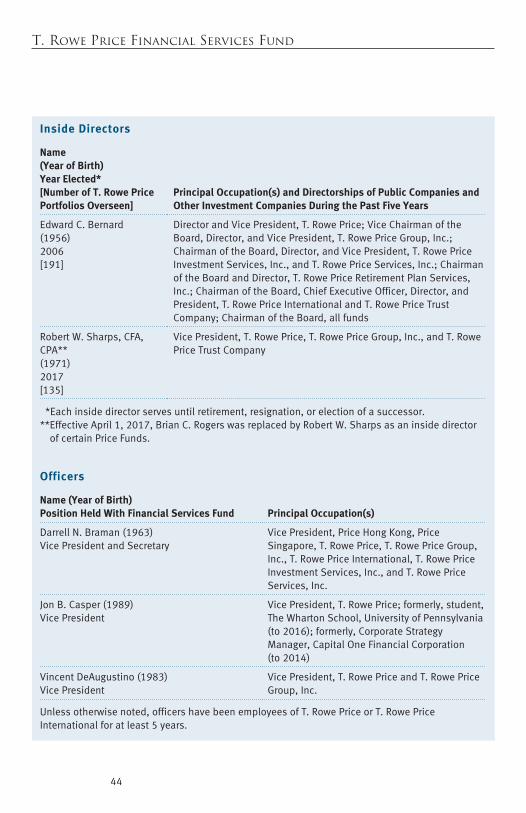
Proof #4
44
T. Rowe Price Financial Services Fund
Inside Directors
Name(Year of Birth)Year Elected*[Number of T. Rowe Price Portfolios Overseen]
Principal Occupation(s) and Directorships of Public Companies and Other Investment Companies During the Past Five Years
EdwardC.Bernard(1956)2006[191]
DirectorandVicePresident,T.RowePrice;ViceChairmanoftheBoard,Director,andVicePresident,T.RowePriceGroup,Inc.;ChairmanoftheBoard,Director,andVicePresident,T.RowePriceInvestmentServices,Inc.,andT.RowePriceServices,Inc.;ChairmanoftheBoardandDirector,T.RowePriceRetirementPlanServices,Inc.;ChairmanoftheBoard,ChiefExecutiveOfficer,Director,andPresident,T.RowePriceInternationalandT.RowePriceTrustCompany;ChairmanoftheBoard,allfunds
RobertW.Sharps,CFA,CPA**(1971)2017[135]
VicePresident,T.RowePrice,T.RowePriceGroup,Inc.,andT.RowePriceTrustCompany
*Eachinsidedirectorservesuntilretirement,resignation,orelectionofasuccessor.**EffectiveApril1,2017,BrianC.RogerswasreplacedbyRobertW.Sharpsasaninsidedirector
ofcertainPriceFunds.
Officers
Name (Year of Birth)Position Held With Financial Services Fund Principal Occupation(s)
DarrellN.Braman(1963)VicePresidentandSecretary
VicePresident,PriceHongKong,PriceSingapore,T.RowePrice,T.RowePriceGroup,Inc.,T.RowePriceInternational,T.RowePriceInvestmentServices,Inc.,andT.RowePriceServices,Inc.
JonB.Casper(1989)VicePresident
VicePresident,T.RowePrice;formerly,student,TheWhartonSchool,UniversityofPennsylvania(to2016);formerly,CorporateStrategyManager,CapitalOneFinancialCorporation(to2014)
VincentDeAugustino(1983)VicePresident
VicePresident,T.RowePriceandT.RowePriceGroup,Inc.
Unlessotherwisenoted,officershavebeenemployeesofT.RowePriceorT.RowePriceInternationalforatleast5years.

Proof #4
45
T. Rowe Price Financial Services Fund
Officers (continued)
Name (Year of Birth)Position Held With Financial Services Fund Principal Occupation(s)
ChristopherT.Fortune(1973)VicePresident
VicePresident,T.RowePriceandT.RowePriceGroup,Inc.
JonM.Friar(1982)VicePresident
VicePresident,T.RowePriceandT.RowePriceGroup,Inc.
JohnR.Gilner(1961)ChiefComplianceOfficer
ChiefComplianceOfficerandVicePresident,T.RowePrice;VicePresident,T.RowePriceGroup,Inc.,andT.RowePriceInvestmentServices,Inc.
NinaP.Jones,CPA(1980)VicePresident
VicePresident,T.RowePriceandT.RowePriceGroup,Inc.
YoichiroKai(1973)VicePresident
VicePresident,T.RowePriceGroup,Inc.,andT.RowePriceInternational
PaulJ.Krug,CPA(1964)VicePresident
VicePresident,T.RowePrice,T.RowePriceGroup,Inc.,andT.RowePriceTrustCompany
GregoryLocraft(1971)VicePresident
VicePresident,T.RowePriceandT.RowePriceGroup,Inc.
CatherineD.Mathews(1963)TreasurerandVicePresident
VicePresident,T.RowePrice,T.RowePriceGroup,Inc.,andT.RowePriceTrustCompany
IanC.McDonald(1971)VicePresident
VicePresident,T.RowePriceandT.RowePriceGroup,Inc.
ThibaultNardin(1983)VicePresident
VicePresident,T.RowePriceGroup,Inc.,andT.RowePriceInternational
JeffreyR.Nathan(1985)VicePresident
Employee,T.RowePrice
DavidOestreicher(1967)VicePresident
Director,VicePresident,andSecretary,T.RowePriceInvestmentServices,Inc.,T.RowePriceRetirementPlanServices,Inc.,T.RowePriceServices,Inc.,andT.RowePriceTrustCompany;ChiefLegalOfficer,VicePresident,andSecretary,T.RowePriceGroup,Inc.;VicePresidentandSecretary,T.RowePriceandT.RowePriceInternational;VicePresident,PriceHongKongandPriceSingapore
Unlessotherwisenoted,officershavebeenemployeesofT.RowePriceorT.RowePriceInternationalforatleast5years.

Proof #4
46
T. Rowe Price Financial Services Fund
Officers (continued)
Name (Year of Birth)Position Held With Financial Services Fund Principal Occupation(s)
JohnW.Ratzesberger(1975)VicePresident
VicePresident,T.RowePrice,T.RowePriceGroup,Inc.,andT.RowePriceTrustCompany;formerly,NorthAmericanHeadofListedDerivativesOperation,MorganStanley(to2013)
ShannonH.Rauser(1987)AssistantSecretary
Employee,T.RowePrice
MatthewJ.Snowling,CFA(1971)VicePresident
VicePresident,T.RowePriceandT.RowePriceGroup,Inc.
GabrielSolomon(1977)President
VicePresident,T.RowePriceandT.RowePriceGroup,Inc.
MitchellJ.K.Todd(1974)VicePresident
VicePresident,T.RowePriceGroup,Inc.,andT.RowePriceInternational
SusanG.Troll,CPA(1966)VicePresident
VicePresident,T.RowePriceandT.RowePriceGroup,Inc.
ZenonVoyiatzis(1971)VicePresident
VicePresident,T.RowePriceGroup,Inc.,andT.RowePriceInternational;formerly,ManagingDirector,UBSGlobalAssetManagement(to2015)
MeganWarren(1968)VicePresident
VicePresident,T.RowePrice,T.RowePriceGroup,Inc.,T.RowePriceRetirementPlanServices,Inc.,T.RowePriceServices,Inc.,andT.RowePriceTrustCompany;formerly,ExecutiveDirector,JPMorganChase(to2017)
TamaraP.Wiggs(1979)VicePresident
VicePresident,T.RowePriceandT.RowePriceGroup,Inc.
Unlessotherwisenoted,officershavebeenemployeesofT.RowePriceorT.RowePriceInternationalforatleast5years.

Proof #4
This page intentionally left blank.

Proof #4
This page intentionally left blank.

Proof #4
This page intentionally left blank.

Proof #4
This page intentionally left blank.

Proof #4
This page intentionally left blank.

Proof #4
This page intentionally left blank.

Proof #4
This page intentionally left blank.

Proof #4
F117-050 2/18
STOCK FUNDSDomestic Blue Chip GrowthCapital Appreciation‡
Capital OpportunityDiversified Mid-Cap GrowthDividend GrowthEquity IncomeEquity Index 500Extended Equity Market IndexFinancial ServicesGrowth & IncomeGrowth StockHealth Sciences‡
Media & TelecommunicationsMid-Cap Growth‡
Mid-Cap Value‡
New America GrowthNew EraNew Horizons‡
QM U.S. Small & Mid-Cap Core EquityQM U.S. Small-Cap Growth EquityQM U.S. Value EquityReal EstateScience & TechnologySmall-Cap Stock‡
Small-Cap ValueTax-Efficient Equity Total Equity Market IndexU.S. Large-Cap CoreValue
ASSET ALLOCATION FUNDSBalanced Global AllocationPersonal Strategy BalancedPersonal Strategy GrowthPersonal Strategy IncomeReal AssetsSpectrum GrowthSpectrum IncomeSpectrum InternationalTarget Date Fundsˆ
BOND FUNDSDomestic TaxableCorporate IncomeCredit OpportunitiesFloating RateGNMA High Yield‡
Inflation Protected BondLimited Duration Inflation
Focused BondNew IncomeShort-Term BondTotal ReturnUltra Short-Term BondU.S. Bond Enhanced IndexU.S. High YieldU.S. Treasury IntermediateU.S. Treasury Long-Term
Domestic Tax-FreeCalifornia Tax-Free BondGeorgia Tax-Free BondIntermediate Tax-Free High YieldMaryland Short-Term Tax-Free BondMaryland Tax-Free BondNew Jersey Tax-Free BondNew York Tax-Free BondSummit Municipal IncomeSummit Municipal IntermediateTax-Free High YieldTax-Free IncomeTax-Free Short-IntermediateVirginia Tax-Free Bond
MONEY MARKET FUNDSTaxableCash Reserves1
Government Money2
U.S. Treasury Money2
MONEY MARKET FUNDS (cont.)Tax-FreeCalifornia Tax-Free Money1
Maryland Tax-Free Money1
New York Tax-Free Money1
Summit Municipal Money Market1
Tax-Exempt Money1
INTERNATIONAL/GLOBAL FUNDSStockAfrica & Middle EastAsia OpportunitiesEmerging EuropeEmerging Markets StockEmerging Markets Value StockEuropean Stock Global ConsumerGlobal Growth StockGlobal IndustrialsGlobal Real EstateGlobal StockGlobal Technology‡
International Concentrated EquityInternational DiscoveryInternational Equity IndexInternational StockInternational Value EquityJapanLatin AmericaNew AsiaOverseas StockQM Global Equity
BondDynamic Global BondEmerging Markets BondEmerging Markets Corporate BondEmerging Markets Local Currency BondGlobal High Income BondGlobal Multi-Sector BondInternational BondInternational Bond (USD Hedged)
T.RowePriceInvestmentServices,Inc.100EastPrattStreetBaltimore,MD21202
Thispagecontainssupplementaryinformationthatisnotpartoftheshareholderreport.
T. Rowe Price Mutual Funds
201802-367174
Call 1-800-225-5132 to request a prospectus or summary prospectus; each includes investment objectives, risks, fees, expenses, and other information that you should read and consider carefully before investing. ‡Subjecttocertainexceptions,thefundiscurrentlyclosedtonewinvestorsandnewaccounts.
ˆTheTargetDateFundsareinclusiveoftheRetirementFunds,theTargetFunds,andtheRetirementBalancedFund.
1 Retail Funds: You could lose money by investing in the Fund. Although the Fund seeks to preserve the value of your investment at $1.00 per share, it cannot guarantee it will do so. Beginning October 14, 2016, the Fund may impose a fee upon the sale of your shares or may temporarily suspend your ability to sell shares if the Fund’s liquidity falls below required minimums because of market conditions or other factors. An investment in the Fund is not insured or guaranteed by the Federal Deposit Insurance Corporation or any other government agency. The Fund’s sponsor has no legal obligation to provide financial support to the Fund, and you should not expect that the sponsor will provide financial support to the Fund at any time.
2 Government Funds: You could lose money by investing in the Fund. Although the Fund seeks to preserve the value of your investment at $1.00 per share, it cannot guarantee it will do so. An investment in the Fund is not insured or guaranteed by the Federal Deposit Insurance Corporation or any other government agency. The Fund’s sponsor has no legal obligation to provide financial support to the Fund, and you should not expect that the sponsor will provide financial support to the Fund at any time.