private credit, public debt, and financial crises
TRANSCRIPT

Prepared for FRBSF Seminar: Understanding the Slow Recovery
April 10, 2013
Òscar Jordà Research Advisor
Federal Reserve Bank of San Francisco
Thanks to Early Elias for research assistance, and FRBSF Community Development, Economic Research
for advice. Based on work with Moritz Schularick (U. of Bonn) and Alan M. Taylor (U. of Virginia).
Private Credit, Public Debt, and
Financial Crises

140 years, 17 countries: Lessons
1. The long view and emerging trends
2. Credit and financial crises
3. Public debt and the recovery
4. Implications for policymakers
2

The long view and emerging trends
3

Financial crises return…Why?
4
0
1
2
3
4
5
6
7
8
9
1870 1880 1890 1900 1910 1920 1930 1940 1950 1960 1970 1980 1990 2000 2010
Countries experiencing a crisis in a given yearFinancial Crises
Out of 17
Bretton
Woods

Bretton Woods: what was different?
• Capital controls
• Fixed exchange rates
• Low leverage banking
• Govt. securities a much higher proportion of bank assets (less portfolio risk)
• Primitive finance did not hinder investment: Average growth = 3.8% in 1947-1970, 3.2% in 1971-2007
• BW eventually collapsed 5

Banking sector explodes since Bretton Woods
6
0
50
100
150
200
250
1870 1880 1890 1900 1910 1920 1930 1940 1950 1960 1970 1980 1990 2000 2010
As a percent of GDP, average across 17 countries
Bank Lending, Bank Assets and MoneyPercent
Bank assets
Bank loans
Money
Bretton Woodsends

Age of money ushers the age of credit
7
-200
-150
-100
-50
0
50
100
150
1870 1880 1890 1900 1910 1920 1930 1940 1950 1960 1970 1980 1990 2000 2010
Average across 17 countries
Bank Aggregates Relative to Money Percent
Bank assets
Bank loans

From nuts and bolts to bricks and mortar
8
0
0.1
0.2
0.3
0.4
0.5
0.6
0.7
0.8
1880 1890 1900 1910 1920 1930 1940 1950 1960 1970 1980 1990 2000 2010
Ratio of US Real Estate Lending to US Total Lending Ratio
Commercial
Household
Total real estate

Total Liabilities then and now
9
0
100
200
300
400
500
6002007 Percent
0
100
200
300
400
500
6001928 Percent
Public debtBank liabilities

Unprecedented reversal of reserves
• Lesson of 1990s emerging markets (EM) crises:
– Crisis more painful w/o foreign reserves
• Since:
– Globalization = expansion of balance sheets
– Private capital flows from DM to EM
– Official capital flows from EM to DM
• Great Reserve Accumulation: $10T officially + $4T in sovereign wealth funds
10

Demographic trends reversing: Savings?
11
45
50
55
60
65
70
75
80
85
1970 1980 1990 2000 2010 2020 2030 2040 2050Source: U.N. Population Statistics; see Pradhan and Taylor (2011)
Working age = ages 20-64; dependents = ages 0-19 and 65+
Dependents as a Percentage of Working AgePercent
World
Less developed
More developed

Recent trends are game changers
• Unprecedented expansion of credit: financial
assets/GDP = 150% in 1975 → 350% in 2008.
Bank loans/GDP doubled.
• The banks’ asset mix: govt. securities 60-70% in
1950; 0% in the 2000s
• Switch to wholesale funding (uninsured) from
deposits (insured): Shadow banking
• Public debt growing globally before the crisis
12

Credit and financial crises
13

Financial crises are different
14
-10
-5
0
5
10
15
0 1 2 3 4 5
Cumulative change from the start of the recession
USA real GDP per capita
Years
Percentage points
Financial
Normal

Financial crises: disinvestment and deflation
15
-70
-60
-50
-40
-30
-20
-10
0
10
20
30
40
0 1 2 3 4 5
Cummulative change from the start of the recession
USA Investment
Years
Percentage points
Financial
Normal
-15
-10
-5
0
5
10
15
20
25
0 1 2 3 4 5
Cumulative change since the start of the recession
USA CPI Prices
Years
Percentage points
Financial
Normal

Private credit predicts financial crises
Predict financial crises with: (1) (2) (3) (4) (5)
Change in private credit - -
Change in public debt - -
Level of credit/GDP - - - -
Level of debt/GDP - - - -
Both interacted - - -
AUC 0.72 0.61 0.71 0.71 0.62
16
• Public debt does not work
• External imbalances (not shown) do no work
• Let’s not kid ourselves, financial crises are difficult to predict

Excess credit trumps debt accumulation
17
-8
-6
-4
-2
0
2
4
6
0 1 2 3 4 5
Normal vs. financial as a function of credit and debt
The Recession and the Recovery
Years
Percent
Normal
Low credit
and low debt
Low credit
and high debt
High credit
and low debt
High credit
and high debt

Public debt and the recovery
18

Public debt growing again…
19
0
20
40
60
80
100
120
140
1870 1890 1910 1930 1950 1970 1990 2010
Total Public Debt to GDP Ratio Percent of GDP
USA
Average (exclud. USA and Japan)

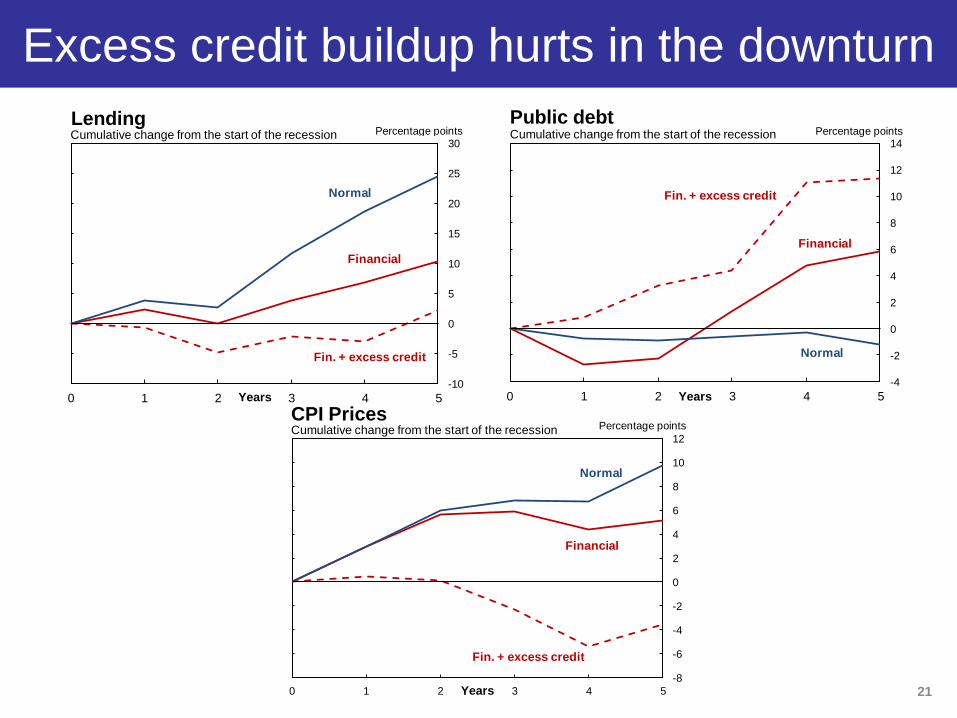
Excess credit buildup hurts in the downturn
20
-10
-8
-6
-4
-2
0
2
4
6
0 1 2 3 4 5
Cumulative change from the start of the recessionReal GDP per capita
Years
Percentage points
Financial
Fin. + excess credit
Normal
Norm. + excess credit
Excess credit buildup hurts in the downturn
21 -8
-6
-4
-2
0
2
4
6
8
10
12
0 1 2 3 4 5
Cumulative change from the start of the recessionCPI Prices
Years
Percentage points
Financial
Fin. + excess credit
Normal
-10
-5
0
5
10
15
20
25
30
0 1 2 3 4 5
Cumulative change from the start of the recessionLending
Years
Percentage points
Financial
Fin. + excess credit
Normal
-4
-2
0
2
4
6
8
10
12
14
0 1 2 3 4 5
Cumulative change from the start of the recession
Public debt
Years
Percentage points
Financial
Fin. + excess credit
Normal

The level of debt matters in the downturn
22
-12
-10
-8
-6
-4
-2
0
2
4
6
0 1 2 3 4 5
Cumulative change from the start of the recessionReal GDP per capita
Years
Percentage points
Normal
FinancialDebt/GDP = 50
FinancialDebt/GDP = 100
-25
-20
-15
-10
-5
0
5
10
15
0 1 2 3 4 5
Cumulative change from the start of the recessionCPI Prices
Years
Percentage points
Normal
FinancialDebt/GDP = 50
FinancialDebt/GDP = 100
-10
-5
0
5
10
15
20
25
30
0 1 2 3 4 5
Cumulative change from the start of the recession
Lending
Years
Percentage points
Normal
FinancialDebt/GDP = 50
FinancialDebt/GDP = 100
-20
-15
-10
-5
0
5
10
0 1 2 3 4 5
Cumulative change from the start of the recessionPublic Debt
Years
Percentage points
Normal
FinancialDebt/GDP = 50
FinancialDebt/GDP = 100

US vs UK recovery (± shadow banking)
23
-10
-5
0
5
10
15
0 1 2 3 4 5
Cumulative change since the start of the 2007 recession
UK real GDP per capita
Years
Percentage points
Actual
Predicted
Normal
-10
-5
0
5
10
15
0 1 2 3 4
Cumulative change since the start of the 2007 recession
USA real GDP per capita
Years
Percentage points
Actual
Predicted
Normal

Implications for policymakers
24

Maybe this time is different
• Monitor credit and leverage. New age of
credit:
– Excess credit makes recessions worse,
recoveries slower
– Turns some into financial crises
• Excess public debt:
– Not the same as credit
– But high levels complicate recoveries from
financial crises
• New EM and demographic trends
25

Further reading
26

Useful References
• Jordà, Òscar. 2012. Credit: A Starring Role in the Downturn. FRBSF Economic Letter, 2012-12.
• Jordà, Òscar, Moritz Schularick and Alan M. Taylor. 2011. Financial Crises, Credit Booms, and External Imbalances: 140 Years of Lessons. IMF Economic Review, 59.
• Jordà, Òscar, Moritz Schularick and Alan M. Taylor. 2012. When Credit Bites Back: Leverage, Business Cycles, and Crises. FRBSF working paper.
• Reinhart, Carmen M. and Kenneth Rogoff. 2009. This Time Is Different: Eight Centuries of Financial Folly. Princeton University Press.
• Schularick, Moritz and Alan M. Taylor. 2012. Credit Booms Gone Bust: Monetary Policy, Leverage Cycles, and Financial Crises, 1870-2008. American Economic Review, 102(2).
• Taylor, Alan M. 2012. The Great Leveraging. NBER working paper 18290 27