private equity and executive compensation
TRANSCRIPT

Columbia Law School Columbia Law School
Scholarship Archive Scholarship Archive
Faculty Scholarship Faculty Publications
2013
Private Equity and Executive Compensation Private Equity and Executive Compensation
Robert J. Jackson Jr.
Follow this and additional works at: https://scholarship.law.columbia.edu/faculty_scholarship
Part of the Business Organizations Law Commons
Recommended Citation Recommended Citation Robert J. Jackson Jr., Private Equity and Executive Compensation, 60 UCLA L. REV. 638 (2013). Available at: https://scholarship.law.columbia.edu/faculty_scholarship/625
This Article is brought to you for free and open access by the Faculty Publications at Scholarship Archive. It has been accepted for inclusion in Faculty Scholarship by an authorized administrator of Scholarship Archive. For more information, please contact [email protected].

Private Equity and Executive CompensationRobert J Jackson, Jr.
ABSTRACT
After the financial crisis, Congress directed regulators to enact new rules on C EQ pay
at public companies. The rules would address the possibility that directors of public
conpani es put ranagers'interests ahead of shareholderswhen setting executive pay.
Yet little is known about how CEOs are paid in companies whose directors have
undivided loyalty to shareholders. These directors car be fbund in companies owned by
private equity firms-the savvy investors long renowned for their ability to maximize
shareholier value.
this Artic. presents the first study of how CEO pay in companies owned by private
equity firms differs from CEO pay in public companies. The study finds that directors
appointed by private equity tirms tie CEO pay much more closely to performatnce
by preventing CEOs from selling, or "unloading," their holdings of the conpanss
stock. -My ndings suggest that publiccorpan boards should also lirnit unloadingto strengthen the CEO pay performartc link. Furthermore, reglators should require
public corparties to disclose CEO stock holdings prominently. Both current law and
post-crisis rulemaking emphasize transparency in pay levels rather than irincentives, afbcus that perversely encourages directors to weaken the relationship between CEOpay and perfbrmance.
AUTHOR
RobertJJacksontjr.is Associate Protu ssor of L awa ad ilton Handler Fellow aColumbia
Law School,
I wish to thank Lucian Bebchuk, William Bratton, Andrew Buzin, Steven IDavidoff, Allen
Ferrell, jeffrey Gordort, Stevert Kaplan, Richard Squire, Randall Thomas, Norman Veasey,
and participants in faculty workshops at the C BJerkeey School(oftLwColumbia Law
School, George Washington University L aw School, IiHrxarvard Law School, and the
University of Pennsylvania Law School, s well as participants at the UJiversity of
Colorado Law Schooljunior Business Law Conferencefor helpftl corrments. I also thank
the private equity professionals who Shared their perspectives with me it confdential
interviews, Capital IQand Dealogic for actcess to their proprietary databases, and
Jonathat Olsen and Chaptnann Wong tor exceptional research assistance.
60 UCLA L. REV. 638 (2013)

TABLE OF CONTENTS
INTRODUCTION-.. 40
I AGENCY AND EXECUTIVE PAY..................................... 41A. Agency Problems in Setting CEO Pay------------ -6413
B 1Potential Effects of Agency Problems on CEO Pay........----------
1. Pay Levels- - --- -615
2. Portfolio Incentives-...................................45
II. EVIDENCE ON Ilow PRIVATE EQuITY INVESTORS PAY CEOs-------------.47A. Methodology andi LDataset.....
B Evidencc on Agenc and CEO Pay.....-- - 65)1. Pa' L[evels- - --- -651
2. Portfolio Incentives--...--- - - -653
3. Potential Private Equity Selection Effect..............-------4. Effects of the Exit of the Private Equity Investor................
11. I1PLICATIONS FOR PUBLIC COMPANIES AND POLICYlMAKERS-----------------
A. Bargains Over CEO Incentives.....-- - -- -- -- 6601. Magritude of Public Corripany CEO Incentives--------------661
2. Contracting for CEO Incentives....-- - -66-2B. Regulation of CEO Incentives.--------------------------------.6
1. Existing Disclosui-re Rdes-............................'64
2. Post-Crisis Rulema-ldng--------------------------------.65
3. Disclosing Portflio Incentives...--- ---- --666
CONCLU)SION ..- 6
APPENDIXA , DATA --.......................................... ..-668
A. DatasetAssemb.iv---------------------------------- n691. Companies Owned by Private Equity Firms-----------------n692. Companies Targeted by Piate Equity Firms7
B Constructed Variables--..61. CEO) Pay L evels- - - - - -671-
2. Portfolio ctivs --671
3. Company Characteristics-------------------------------2APPENDIX B. ANALYSIS-----------------------------------------------------------
A. CEO Pay Levels....................................... .n
B ,CEO Portfolio I-ctie67s
C- Private Equity Selection Effects....-- - -- -- --675
V, PrivateEquity0vrsbip arnd CEO..o.rfolio..centives ............- 676
........ 4
639

640 60 UCLA L. REV. 638(2013)
INTRODUCTION
Congress's response to the recent financial crisis, the Dodd-Frank Act,mandates new rules on CEO pay at public companies.' Like other observers,Congress was concerned that public company directors favor managers' interestsover those of shareholders when setting CEO pay. While public company direc-tors owe their legal duties to shareholders, they often owe their positions on theboard to the CEO. A great deal of study has been dedicated to whether these di-rectors' divided loyalties cause them to favor CEOs over shareholders in pay ne-gotiations. No previous study has considered, however, how directors withundivided fidelity to shareholders pay CEOs. Such directors can be found in com-panies owned by private equity firms-savvy investors long known for their abil-ity to maximize shareholder value.
To test how divided director loyalties affect executive compensation, thisArticle presents the first study of CEO pay in companies owned by private equityfirms. The evidence shows that private equity investors tie CEO pay much moreclosely to performance than do the boards of directors of otherwise similar publiccompanies.
This finding has important implications for the increasingly vociferous de-bates over CEO pay. Because, over the past two decades, public company CEOshave received most of their pay in the form of stock rather than cash, some ob-servers have argued that their pay is adequately linked to performance. But publiccompany boards allow CEOs to unload (that is, to sell) their stock holdings. Thedata presented here suggest that private equity firms strictly prohibit such unload-ing. As a result, the pay-performance link is much weaker in public companiesthan in companies owned by private equity investors. Borrowing from their pri-vate equity counterparts, public company boards seeking to strengthen the link be-tween pay and performance should restrict CEOs' freedom to unload.
These findings also offer lessons for regulators now charged with writing newrules on public company CEO pay. For one thing, existing executive pay disclo-sure rules, which provide investors with extensive information on CEO pay levelsbut little information on CEO stock holdings, may perversely encourage publiccompany directors to weaken the pay-performance link. For another, regulators
1. See, e.g., Dodd-Frank Wall Street Reform and Consumer Protection Act, Pub. L. No. 111-203, §§ 951-956, 124 Stat. 1899-1906 (2010) (codified at 12 U.S.C. § 5641 (Supp. V 2011) &15 U.S.C. §§ 78j-3, 78j-4, 781, 78n-1 (Supp. V 2011)) (requiring most public companies to,among other things, provide shareholders with a nonbinding vote on executive compensation anddisclose new details on top executives' pay).
640 60 UCLA L. REV. 638 (2013)

should be wary of the impact of the new rules on CEO pay that Congress has nowmandated under Dodd-Frank, which could exacerbate these effects. Regulatorsshould respond by ensuring that new rules on executive pay are accompanied by arequirement that public companies also prominently disclose CEO stock holdings.
The Article proceeds as follows. Part I explains how the divided loyalties ofpublic company directors can affect CEO pay. Part II tests the impact of these di-vided loyalties by presenting data on CEO pay in companies owned by private eq-uity firms and contrasting it with evidence from comparable public companies.Part III discusses the implications of this study's findings for current policy debatesover the regulation of CEO pay at public companies. The Article concludes bybriefly describing the broader corporate-governance lessons that might be learnedfrom closer study of companies owned by private equity investors.
I. AGENCYAND EXECUTIVE PAY
Although the official duty of the board of directors is to advance the interestsof shareholders,2 in practice the interests of shareholders and directors frequent-ly diverge. This is especially true in public companies without a controllingshareholder. In these companies, directors generally own very small amounts ofthe firm's equity, and so do not internalize most of the costs of corporate de-cisionmaking. Meanwhile, managers exercise a great deal of influence overwhether directors retain their positions on the board. And most public companyshareholders own too small an interest in the firm to make monitoring of directorsworthwhile. Hence there is an agency problem: Director-agents may have incen-tives to favor the interests of management over the interests of their shareholder-principals.3
This problem is particularly acute when directors bargain with the CEO toset her compensation. Directors have reason to favor the CEO in these negoti-ations, and the CEO can benefit personally when directors stray from the bargainthat is in the shareholders' best interest. Extensive previous work has been dedi-cated to the question whether public company directors frequently favor the in-terests of CEOs when bargaining over executive pay. But no previous study hasexamined the agency problem by comparing the CEO pay deals struck by directorswith potentially divided loyalties, such as those in public companies, to those
2. See, e.g., Aronson v. Lewis, 473 A.2d 805, 811 (Del. 1984) (citing DEL. CODE ANN. tit. 8,§ 141(a) (1983)).
3. For the seminal articulation of the agency problem caused by the separation of ownership fromcontrol in public corporations, see ADOLF A. BERLE, JR. & GARDINER C. MEANS, THEMODERN CORPORATION AND PRIVATE PROPERTY (1932).
Private Equity and Executive Compensation 641

642 60 UCLA L. REV. 638 (2013)
struck by directors who have undivided incentives to advance the interests ofshareholders.4
Private equity firms, which own and operate trillions of dollars' worth ofAmerican businesses, provide one basis for such a comparison.5 Financial econ-omists have long recognized that the governance structure employed in compa-nies owned by private equity investors reduces the agency costs associated with thepublic corporation.' In particular, the directors of these companies are appointedby the private equity firms themselves, and these directors hold substantial equitystakes in the company.7 They are therefore much less likely to be subject to theagency problem that may affect bargains struck by directors at public companies.Considerable work has been dedicated to understanding the agency-cost relatedbenefits of private equity ownership,8 and even more study has been dedicated tothe effects of agency costs on executive pay in public companies. 9 Nevertheless,because companies owned by private equity firms are generally not required todisclose executive pay, almost nothing is known about how directors at thesecompanies pay CEOs.
4. Some attention has been given to executive pay at firms in bankruptcy, a situation in which creditorshave bargaining influence that may counteract managers' boardroom influence. Empirical resultsare mixed. Compare M. Todd Henderson, Paying CEOs in Bankruptcy:Executive Compensation WhenAgency CostsAre Low, 101 NW. U. L. REV. 1543,1618 (2007), with Lynn M. LoPucki &William C.Whitford, Corporate Governance in the Bankruptcy Reorganization fLarge, Publicly Held Companies,141 U. PA. L. REV. 669, 711 (1993).
5. Private equity firms acquired some $1.6 trillion worth of American businesses from 2005 through
June 2007 alone. See, e.g., Steven N. Kaplan & Per Strdmberg, LeveragedBuyouts andPrivate Equity,J. ECON. PERSP., Winter 2009, at 121, 126 fig.2, 127-28. Although the pace of private equity acqui-sitions slowed in 2008 and 2009 as a result of reduced access to debt after the financial crisis, morerecently funds have flowed into private equity firms at record rates, leaving little doubt that the role ofprivate equity investors in American corporate governance will continue to grow in the coming years.See, e.g., Vincent Ryan, More Money Flows Into Private Equity, CFO MAG., Sept. 15, 2011, http://www3.cfo.com/article/2011/9/capital-markets-more-money-flows-into-private-equity (reportingthat private equity funds raised $142 billion during the first halfof 2011).
6. See Michael C. Jensen, The Eclipse ofthePublic Corporation, HARV. BUS. REV., Sept.-Oct. 1989, at 61.7. For a helpfil discussion of the typical structure and incentives of the boards of directors of companies
owned by private equity firms, see Ronald W. Masulis & Randall S. Thomas, Does Private EquityCreate Wealth? The Effects ofPrivate Equity andDerivatives on Corporate Governance, 76 U. CHI. L.REV. 219, 224 (2009) (noting that boards of directors at companies owned by private equity firms "aremore effective than public company boards, as 'even the best part-time independent directors are notthe equivalent of full-time, highly-incentivized private equity managers"' (quoting RonaldJ. Gilson&Charles K. Whitehead, DeconstructingEquity: Public Ownershi, Agency Costs, and Complete CapitalMarkets, 108 COLUM. L. REV. 231,260 (2008))).
8. For an example of empirical work on the effects of private equity ownership, see Steven Kaplan,The Effects of Management Buyouts on Operating Peformance and Value, 24J. FIN. ECON. 217(1989).
9. See Kevin J. Murphy, Executive Compensation, in 3B HANDBOOK OF LABOR ECONOMICS 2486(Orley Ashenfelter & David Card eds., 1999) (concluding that growth in the academic articles onexecutive pay has generally outpaced the growth in executive pay itself).

Yet bargains between private equity firms and the CEOs of the companiesthey own can tell us a great deal about the consequences of the director agencyproblem in public companies. First, these bargains can help us understand wheth-er directors' divided loyalties lead public companies to pay CEOs more than theywould if directors pursued shareholder interests more vigorously. Second, bargainsover CEO incentives in companies owned by private equity firms can tell us wheth-er agency problems lead directors of public companies to bargain for too weak a linkbetween CEO pay and performance.
A. Agency Problems in Setting CEO Pay
When bargaining with CEOs over compensation, public company directorsmust reconcile the competing interests of shareholders and executives. Wheth-er public company directors favor CEOs over shareholders in determining theamount and kind of the CEO's pay has been the subject of considerable scholar-ly debate.
Two major schools of thought have emerged. The "optimal contracting"view contends that market forces are sufficient to induce directors to pursue thedeal that is best for shareholders.' 0 Theorists in this school argue that markets inproducts, labor, and corporate control discipline directors who stray from thatdeal." While market slack may leave room for occasional departures from thecompensation bargain that is in the best interest of shareholders, generally nego-tiations between CEOs and public company boards will yield the pay package thatis in the shareholders' best interest. 12
The alternative, known as the "managerial power" view, holds that mar-ket forces are inadequate to counteract the strong influence that CEOs of publiccompanies wield over their boards of directors. These scholars emphasize thatCEOs influence whether a director is nominated for reelection, and that direc-tors therefore face strong incentives to satisfy the CEO's demands in order to retaintheir seats on the board.'3 In addition, public company directors typically own very
10. For a highly influential early work expressing this view, see Frank H. Easterbrook, Managers'Discretion andlnvestors' Welfare: Theoies andEvidence, 9 DEL.J. CORP. L. 540 (198 4 ).
11. See, e.g., Eugene F. Fama,Agency Problems andthe Theory ofthe Firm, 88 J. POL. ECON. 288, 291-92(1980) (arguing that labor markets discipline opportunistic CEO behavior because managers areaware that such conduct will harm their reputations and therefore decrease the value of their humancapital).
12. See generally John E. Core et al., Executive Equity Compensation and Incentives: A Survey, FRBNYECON. POLY REV., Apr. 2003, at 27, 28; Andrei Shliefer & Robert W. Vishny, A Survey ofCorporate Governance, 52 J. FIN. 737 (1997).
13. See, e. g., Luciarn Arye Bebchuk et al., Managerial/Power and Rent Extraction in the Design ofExecutive
Compensation, 69 U. CHI. L. REV. 751, 761-62 (2002); see also LULIAN BEBCHUK &JESSE
Private Equity and Executive Compensation 643

644 60 UCLA L. REV. 638 (2013)
small proportions of the company's stock, and thus personally bear very few of thecosts of the CEO's compensation package. Moreover, individual shareholders,who typically hold relatively small stakes in large public companies, lack incentivesto discipline directors who favor the CEO's interests. For these reasons, the costs todirectors of resisting the CEO's pay demands are many while the benefits are few.
None of the conditions that characterize the managerial power view of publiccompany directors hold for the directors of companies owned by private equityfirms. Private equity firms are usually contractually entitled to appoint directors tothe board, so they, rather than the CEO, control whether directors retain theirseats.14 Directors appointed by private equity firms, unlike public company direc-tors, own large stakes in their companies."s And experienced, sophisticated privateequity investors like Henry Kravis, George Roberts, and Ted Forstmann frequentlyput themselves on the boards of the companies they own." Such directors arefaithful to shareholder interests because they often are the principal shareholders.' 7
Therefore, companies owned by private equity firms offer a rare opportunity to testthe implications of the managerial power hypothesis in an environment in whichagency costs are low.
Yet little is known about how these companies pay their CEOs." While pre-vious work has established that private equity owners encourage executives to own
FRIED, PAY WITHOUT PERFORMANCE: THE UNFULFILLED PROMISE OF EXECUTIVECOMPENSATION (2004); Lucian Arye Bebchuk &Jesse M. Fried, Executive Compensation as anAgency Problem, J. ECON. PERSP., Summer 2003, at 71, 72-73. Nominees listed on the company'sproxy statement are virtually assured election, and although those nominees are ordinarily chosen byan independent committee, see Orders Relating to Equity Compensation Plans, 68 Fed. Reg. 39,995(July 3, 2003), it is well known that the CEO exercises considerable influence over who is listed onthe proxy. See, e.g., JAY W. LORSCH & ELIZABETH MACIVER, PAWNS OR POTENTATES: THEREALITY OF AMERICA'S CORPORATE BOARDS 20 (1989); Martin Lipton, The MillenniumBubble andltsAftermath: ReformingAmerica and Getting Back to Business, M &A LAW., July-Aug.2003, at 1, 4.
14. These contractual rights are generally contained in shareholder agreements entered into at the timethe private equity firm invests in the company. See Scott D. Miller, Private Equity ShareholderArrangements, in FOURTH ANNUAL PRIVATE EQUITY FORUM: LEGAL AND FINANCIALSTRATEGIES FOR DEALMAKING IN THE CURRENT MARKET 428 (2002); see also, e.g., Digitas,Inc., Registration Statement (Form S-1), at 50 (Dec. 23, 1999) (describing a private equity firm's rightto appoint at least two directors to the company's board).
15. See, e.g., Masulis & Thomas, supra note 7, at 228 (arguing that companies owned by private equityfirms have "much stronger financial incentives for directors" because private equity firms serve as"blockholder[s], whose representatives are placed on the board").
16. See, e.g., Alliance Imaging, Inc., Registration Statement (Form S-1), at 47 (July 2, 2011) (describingthe board membership of Henry Kravis and George Roberts).
17. See, e.g., Masulis &Thomas, supra note 7, at 228.18. Anecdotal reports in the press have variously concluded that private equity owners pay more, less, or
the same as public companies. Compare Elizabeth MacDonald, Pay Dirt: Wfho Gets Paid More, ChiefExecutives at Public or Private Companies?, FORBES, May 21, 2007, at 108 (public companies paymuch more), with Andrew Ross Sorkin & Eric Dash, Private Firms Lure CEOs With Top Pay, N.Y.

large equity stakes in their companies, almost no attention has been given to thecomparison between CEO pay at companies owned by private equity firms andpublic company CEO pay."
B. Potential Effects ofAgency Problems on CEO Pay
The managerial power theory suggests that public company directors strayfrom the CEO pay bargain that maximizes shareholder value in two ways. First,they pay CEOs more than is necessary to induce optimal effort. Second, they failto link enough of that pay to performance.
1. Pay Levels
Perhaps the most familiar refrain in debates over CEO pay is that the CEOsof public companies are paid too much. This claim has dominated the popular20
and academic2' press as well as debates over the regulation of public company cor-porate governance for decades. Although this literature has grown increasinglycomplex, the argument is straightforward: Directors of public companies allowCEOs to extract excessive levels of compensation from shareholders.22
2. Portfolio Incentives
A more nuanced claim is that public company directors fail to adequately linkCEO pay to performance. Like all risk-averse individuals, CEOs prefer pay that is
TIMES, Jan. 8, 2007, at A4 (public companies pay far less), andjoseph E. Bachelder III, ExecutiveCompensation: Public Versus Private-Equity-Controlled Companies, N.Y. L.J., May 30, 2008, at 3(public companies and companies owned by private equity pay the same).
19. Previous work has established, for example, that managerial ownership in the company's stockgenerally increases in connection with certain private equity transactions. See Kaplan & Stromberg,supra note 5, at 131. A contemporaneous working paper also compares CEO pay and incentives incompanies owned by private equity firms and public companies. See Phillip Leslie & Paul Oyer,ManagerialIncentives and Value Creation: Evidence From Private Equity (Stanford Graduate Sch. ofBus., Working Paper, 2009), available at http://faculty-gsb.stanford.edu/oyer/wp/pe.pdf.
20. See, e.g., Albert R. Hunt, LetterFrom Washington:As U.S. Rich-Poor Gap Grows, So Does Public Outcry,N.Y. TIMES, Feb. 18, 2007, http://www.nytimes.com/2007/02/18/world/americas/18iht-letter.4637416.html ("Inflated CEO pay... is fueling [a] populist backlash . . . .").
21. See, e.g., Michael Faulkender et al., Executive Compensation:An Overview ofResearch on CorporatePractices and ProposedRcforms, J. APPLIED CORP. FIN., Winter 2010, at 107, 110 (describing the"intense and ongoing debate among academics" over whether CEO pay in public companies isexcessive).
22. See, e.g., Bebchuk et al., supra note 13, at 789 (arguing that CEOs can extract additional amounts ofexcessive pay by receiving pay in forms that are "camouflaged," or hidden from shareholder andpublic view).
Private Equity and Executive Compensation 645

fixed and certain in amount.23 But CEOs may be better motivated to maximizeshareholder value if they receive pay that fluctuates with the company's value.24Managerial power theorists argue that public company boards favor the interestsof CEOs over those of investors in part by permitting CEOs to extract fixed pay-ments rather than payments based on the company's value.25
One way to link CEO pay to shareholder value is to give the CEO bonusesthat vary based on the CEO's performance. But financial economists have longargued that these bonus payments do not adequately link the CEO's pay to the val-ue of the company. Instead, economists generally measure the strength of the re-lationship between CEO pay and shareholder value through the CEO's holdingsof company stock, or her "portfolio incentives.1"26
For many years, the majority of CEO compensation at public companies hasin fact been paid in equity.27 Thus, many have argued that public company CEOsnow have sufficient stock ownership in the companies they run to align their paywith their company's performance. 22 But because CEOs are risk-averse, we canexpect that they will respond to receiving stock-based pay by unloading their stockholdings if they are permitted to do so. Thus, the extent to which CEO pay islinked to the company's performance depends not only on the amount of stockCEOs arepaid, but also on how much of that stock they retain. Because portfolio
23. In this Article, I follow the broader literature on executive compensation and assume that CEOsare risk-averse. See, e.g., Core et al., supra note 12, at 27. The premises underlying this assumption arehotly disputed, see, e.g., Victor P. Goldberg, Aversion to RiskAversion in the New InstitutionalEconomics, 146 J. INSTITITONAL &THEORETICAL ECON. 216, 216 (1990), but for purposes ofthis Article I assume that CEOs are risk-averse and therefore prefer fixed compensation to pay thatvaries in tandem with the value of the firm.
24. For the classic work on this point, see Steven Shavell, Risk Sharing andIncentives in the Pnnc al andAgentRelationship, 10 BELLJ. ECON. 55 (1979). See abo Michael C. Jensen &William H. Meckling,Theory ofthe Firm: ManagerialBehavior, Agency Costs and Ownersh Structure, 3 J. FIN. ECON. 305,308-10 (1976).
25. See, e.g., Bebchuk et al., supra note 13, at 813-27 (arguing that directors use particular types ofcompensation to convey fixed value to executives rather than to link pay to performance).
26. For the seminal work arguing in favor of these measures, see Michael C. Jensen & Kevin J. Murphy,Peformance Pay and Top-ManagementIncentives, 98 J. POL. ECON. 225, 251, 232 (1990) (concludingthat "annual executive bonuses are not highly variable" with performance and arguing that CEOportfolio incentives provide a superior proxy for the relationship between the CEO's wealth and thevalue of the company).
27. See, e.g., David I. Walker, Evolving Executive Equity Compensation and the Limits of<OptimalContracting, 64 VAND. L. REV. 611 (2011).
28. See, e.g., John E. Core et al., Is US. CEO Compensation Inefficient Pay Without Performance?, 103MICH. L. REv. 1142, 1172 (2005).
646 60 UCLA L. REV. 638 (2013)

incentives reflect the CEO's holdings of company stock after accounting for the ef-fects of unloading, they offer the most meaningful measure of the link betweenCEO pay and performance.
In public companies, CEOs may use their influence over directors to obtainthe contractual freedom to unload their companies' stock. To the extent, then,that the divided loyalties of public company directors lead them to favor CEOs inpay negotiations, we would expect to see differences between CEO portfolio incen-tives at public companies and at companies owned by private equity firms.
II. EVIDENCE ON How PRIVATE EQUITY INVESTORS PAY CEOs
As we have seen, CEO pay in companies owned by private equity firms cantell us a great deal about public company directors' bargains over CEO pay. Doesmanagerial influence cause public company directors to overpay CEOs, or un-dercut the creation of a strong link between pay and performance? This Part pre-sents the first empirical study of those questions.
The evidence suggests that the agency problem in public companies affectsnot the amount of CEO pay, but rather the strength of CEOs' portfolio incen-tives. CEO pay at companies owned by private equity investors is linked muchmore closely to performance than CEO pay at public companies.
A. Methodology and Dataset
Private equity firms have attracted considerable attention from both financialeconomists and legal scholars. And CEO pay in companies owned by private eq-uity firms can provide critical insights into longstanding debates over public com-pany corporate governance. But, for two reasons, almost nothing is known abouthow private equity investors pay the CEOs of the companies they own. First,companies owned by private equity firms usually do not have publicly traded secu-rities, and therefore are not required to disclose what they pay their CEOs. Second,the databases generally used for comprehensive empirical studies on executive payare limited to large public companies.
Private equity firms, however, often take the companies they own publicthrough initial public offerings of stock (IPOs). At the time of the IPO, thecompany must file a registration statement with the Securities and ExchangeCommission (SEC) providing detailed information on executive pay prior to theoffering. Furthermore, as long as the company remains public, it must file pub-licly available annual proxy statements describing the CEO's pay. By drawing on
Private Equity and Executive Compensation 647

648 60 UCLA L. REV. 638 (2013)
these filings, this Article provides the first systematic study of how private equityfirms pay the CEOs of the companies they own.29
I gathered data on CEO pay at 108 companies that were owned by a privateequity firm and completed an IPO between 2000 and 2004. I compared these da-ta to information on CEO pay in a group of comparable public companies thatwere not owned by a private equity firm.30 Table 1 summarizes key characteristicsof the companies and CEOs in each group.
29. For more detail on the assembly of the dataset, see infaAppendix A, text accompanying notes 82-97.The companies that engage in an IPO represent only a small fraction of the companies owned byprivate equity firms, and are often among the most successful companies they own. See, e.g., Kaplan& Strdmberg, supra note 5, at 129 tbl.2 (finding that, in a sample of more than 17,000 companiesowned by private equity between 1970 and 2007, less than 15 percent were the subject of an IPO).Thus, it is possible that CEO pay and portfolio incentives at these companies are not representativeof pay practices in companies owned by private equity firms more generally. In interviews, however,private equity and executive compensation professionals indicated that CEO pay at the companiesthat completed an IPO was unlikely to be significantly different from pay in companies owned byprivate equity firms more generally. Contracts governing CEO pay arrangements at these companiesare negotiated consistently across the private equity investor's portfolio of companies-and thesebargains are struck long before the CEO, the company, or the private equity investor is able to antic-ipate whether the company will eventually be one of the few in the portfolio that will be the subjectof an IPO.
Separately, ifprivate equity owners and executives are able to anticipate when an IPO will be com-pleted, executive compensation practices in these firms may change as the IPO approaches. Thiswould make data on CEO compensation from filings in the year before the company's IPO lessrepresentative ofpay practices at companies owned by private equity investors more generally. Privateequity professionals that I asked about this possibility responded, however, that it is difficult to antic-ipate with precision when an IPO will be completed. That response is consistent with the securities-filing activity of the companies owned by private equity firms studied here. Many of these firmsrepeatedly filed amended registration statements in continued anticipation of a completedoffering.
30. To ensure that the comparison group of public companies included only firms that were also close tothe IPO stage, I removed from the comparison sample all firm years in which a firm was more thanseven years from its IPO as well as all firms for which information on the date of the IPO was notavailable. In addition, in the multivariate regressions described in the Appendices, I separately controlfor the number of years since a firm's public offering. See infra Appendix A, text accompanyingnotes 85-86.

Private Equity and Executive Compensation 649
TABLE 1. Summary of Company and CEO Characteristics3'
(Zpaues Ownedb a C maioPrivateEqi4 FirmFnn
Market$1065960**$10040160
lndustzy-Adjusted'virn39 10J 3.00* 1.06
CEOlen~ire4.78" 6.26
CEQ Age51.67** 56.83(years)
(Fim Yars 487 542
Table 1 shows that CEOs in private equity-owned companies had somewhatshorter tenure and were slightly younger than their public company counterparts.Moreover, the private equity-owned companies were much smaller than those inthe comparison group. Because previous work has established that a company'ssize significantly influences its CEO's compensation, 33 the analysis in this Part con-trols for size when evaluating CEO pay, and in the multivariate regressions de-scribed in Appendix B, I use additional controls reflecting each company's size.
Previous scholarship has argued that private equity owners hold large stakes intheir portfolio companies and succeed in placing their representatives on the com-panies' boards.34 My evidence confirms that view. Table 2 summarizes the means
31. Dollar values are presented in thousands of inflation-adjusted 2005 dollars. I use the standardidentifiers of statistical significance for differences among means: "***" indicates significance at 99percent confidence, "* indicates significance at 95 percent confidence, and "* indicates signifi-cance at 90 percent confidence.
32. Following previous work, I calculated this measure as the ratio of market capitalization to assets,adjusted for industry. See, e.g., Martijn Cremers & Allen Ferrell, Thirty Years of CorporateGovernance: Firm Valuation and Stock Returns 6 (Sept. 2009) (unpublished manuscript), availableathttp://www.aw.harvard.edu/faculty/faculty-workshops/ferrell.paper.pdf (describing the method ofadjusting Tobin's Qfor industry using the industry's median Tobin's Q. Thus, the average companyowned by a private equity firm in my dataset had a ratio of market capitalization to assets three timesthe typical ratio for companies in its industry. For firther detail on the calculation of this measure, seeifa Appendix A, text accompanying note 97.
33. See Lucian Bebchuk & Yaniv Grinstein, The Growth of Executive Pay, 21 OXFORD REV. ECON.POL'Y 283, 283-84 (2005) (describing this literature).
34. See, e.g., Masulis & Thomas, supra note 7, at 228.

of key characteristics for private equity-owned companies in my sample in theyear of each firm's IPO.
TABLE2. Sample of Companies Owned by Private Equity Firms35
2000 2001 2002 2003 2004
Firms in Sample 24 16 17 15 36
tquit Ownedb Eqtu Ow~n 58.3% 68.6% 50.6% 55.0% 57.4%
by Private Equity F irmBoadSeatsHld by 51.6% 53.8% 50.0% 50.0% 52.4%
Private Equity Owner
Most Frequent Piva4te Bain WarburgEquity Owner Capital Pincus
Years-,PdateEqdity 2.13 3.27 3.70 2.86 3.06Acquisition to[ PO 1
Table 2 shows that my sample is consistent with previous literature on private eq-uity firms. On average, a majority of the equity in each company is owned by theprivate equity investor, who also appointed a majority of the company's directors.36
Such directors are not subject to the conflicting loyalties that might influencedirectors in public companies. Below I compare the CEO pay packages negotiat-ed by each group of directors to identify the possible effects, if any, of the directoragency problem on the magnitude and structure of CEO pay at public companies.
B. Evidence on Agency and CEO Pay
Managerial power theorists contend that the director agency problem inpublic companies leads to two types of compensation practices that are contrary
35. For ease of presentation, Table 2 provides mean levels of private equity ownership, the percentage ofboard seats held by the private equity owner, and the number of years between the private equityinvestor's acquisition of its stake and the IPO. These averages were not meaningfully different frommedians for each of these variables.
36. Although my sample includes a broadly representative mix of private equity firms, 25 percent ofthe companies were owned by just five private equity firms: Warburg Pincus, Bain Capital, TheBlackstone Group, Apollo, and Kohlberg Kravis Roberts (KKR).
650 60 UCLA L. REV. 638 (2013)

to shareholder interests. First, public company directors pay CEOs more than is inshareholders' interests. Second, these directors fail to create a strong link betweenCEO pay and performance. The evidence from private equity supports the secondclaim-but not the first.
1. Pay Levels
Do the hard-bargaining directors appointed by private equity investors paytheir CEOs more or less than directors at comparable public companies? Anecdo-tal reports have suggested both. 7 My evidence suggests that the more likely an-swer is neither.
Previous work has measured the level of CEO pay in two ways. First, we canapproximate the amount of pay the CEO receives in cash by measuring the sum ofthe salary and bonus received by the CEO. Second, we can estimate the amountof total compensation the CEO receives by adding to the sum of salary and bo-nus any other compensation received by the CEO, including the value of stock-based pay."
Table 3 describes the average salary and bonus, and average total compensa-tion, for CEOs at companies owned by private equity firms and at comparisoncompanies, controlling for company size' 9
37. See supra note 18 and sources cited therein.38. For representative work using these methods of estimating managers' cash and total compensation,
see, for example, Sanjai Bhagat & Brian Bolton, Investment Bankers' Culture of Ownership? 13-14(Aug. 2010) (unpublished manuscript), available at http://sites.udel.edu/wccg/files/2012/04/SSRN-id1664520.pdf Although option valuation methodologies may overestimate the incentive effects ofoptions, see, e.g., Richard A. Lambert et al., Portfolio Considerations in Valuing Executive Compensation,29 J. AccT. RES. 129 (1991), I follow the weight of the literature and use the Black-Scholes methodto determine the value of options when calculating CEOs' total compensation. See, e.g., Bebchuk &Grinstein, supra note 33, at 284 (describing Black-Scholes valuation as the "standard" approach).For related robustness checks, including checks related to the value of stock options granted beforethe companies in my sample were publicly traded, see infra Appendix A, text accompanying notes92-93.
39. The mean CEO compensation in companies owned by private equity firms is presented as the sumof the mean of each compensation measure for firms in the comparison sample plus the correlationcoefficient for a dummy variable representing private equity ownership in a regression model alsocontrolling for firm size, expressed as the log of each firm's market capitalization. Neither modeldescribed in Table 3 can reject, at 90 percent confidence, the hypothesis that the coefficient for theprivate equity ownership dummy variable is zero.
Private Equity and Executive Compensation 651

TABLE 3. CEO Pay in Companies Owned by Private Equity Firms
Companies OwnedComparison
by Private EquityCompaniesFirms
A al Salary$1,860,899 $1,789,166.and Bonus
TotalAnnual$8,440,587 $9,280,719
Compensation
The level of CEO pay in companies owned by private equity firms is statisticallyindistinguishable 40 from the level ofpay in comparison firms.4
1 The evidence doesnot support the view that managerial power causes directors to overpay executives.
For several reasons, however, the possibility that divided director incentiveslead to excessive CEO pay in public companies should not be ruled out. For onething, companies owned by private equity firms compete with public companies inthe market for CEO talent. Because companies owned by private equity investorsrepresent only a small fraction of the companies in the economy, we would expectthese firms to have relatively little power in this market. Thus, even if principal-agent conflict causes public company boards to overpay CEOs, market forces maygive companies owned by private equity investors little choice but to pay compa-rable amounts. Moreover, as I explain below, companies owned by private equityfirms link CEO pay far more closely to performance than comparable public com-panies. By persuading CEOs to accept similar pay levels and riskier pay packages,companies owned by private equity firms may effectively pay CEOs less than com-parable public companies.42 Nevertheless, overall the evidence from private equityoffers little direct support for the view that managerial influence leads to excessiveCEO pay in public companies. 43
40. More extensive multivariate analysis is set forth in Appendix B. Results from those models, whichcontrol for a variety of differences among firms and CEOs in the sample, are consistent with thosepresented in Table 3. See infraAppendix B, Table 7 & text accompanying note 99.
41. It is possible that CEOs of companies owned by private equity firms face a systematically higherlikelihood that they will be dismissed than public company CEOs, and thus expect to receivehigher pay to compensate them for this additional risk. See, e.g., Viral V. Acharya et al., PrivateEquity: Boom andBust?, J. App. CORP. FIN., Fall 2007, at 1. For details on additional robustnesschecks I conducted to control for this possibility in multivariate regression analyses, see infraAppendixB, note 98.
42. Notably, however, even controlling for differences in the CEO's pay-performance link, I observe nostatistically meaningfuil differences in CEO pay levels. See infta Appendix B, Table 7 & note 99.
43. See inta Table 4 and accompanying text. Public company CEOs may also receive additional pay informs not subject to disclosure, and thus not captured by my dataset, in connection with directors'
652 60 UCLA L. REV. 638 (2013)

Private Equity and Executive Compensation 653
2. Portfolio Incentives
Managerial power theorists also argue that the divided loyalties of publiccompany directors cause them to tie CEO pay too weakly to performance. Stud-ying CEO pay in companies owned by private equity firms permits us to test thatclaim.
Financial economists have developed two metrics for the portfolio incentivesthat best capture the link between a CEO's pay and her company's performance.Both metrics reflect the effect of a given change in the value of the company onthe value of the stock and stock options held by the CEO. The first metric is the"dollar-on-dollar" measure, which indicates how much a $1,000 change in firmvalue would cause the value of the stock and stock options owned by the CEO tochange.44 This metric is useful in evaluating CEO incentives in making marginaldecisions, such as whether to consume corporate perquisites. A CEO with $1 indollar-on-dollar incentives, for example, can consume $1,000 in perquisites at aprivate cost of $1. The second metric, known as the "equity returns" proxy,45 indicates the change in the value of the CEO's stock and stock options caused by a 1percent change in the firm's value.46 This metric is useful for evaluating CEO in-centives in making large-scale decisions that are likely to significantly affect returnsto shareholders.4 1
efforts to camouflage CEO pay levels-a proposition for which there is some evidence. See LucianBebchuk & Robert J. Jackson, Jr., Executive Pensions, 30 J. CORP. L. 823. 845 (2005). The CEOs ofcompanies owned by private equity investors may be less likely to receive pay in those forms, becausedirectors of these companies do not have to disclose their executive compensation decisions and thushave no reason to camouflage pay levels.
44. For early work describing and analyzing this metric in a sample of large public companies, see Jensen&Murphy, supra note 26, at 226.
45. See Brian J. Hall &Jeffrey B. LiebmanAre CEOs Really PaidLike Bureaucrats?, 113 Qj. ECON. 653,671-72 (1998). Both measures require calculation of the delta of the CEO's stock options-that is,the change in the value of a stock option based on a given change in the company's stock price. Thevalue of delta depends on the exercise price and duration of each stock option held by the CEO. Forfurther detail, see infa Appendix A, text accompanying notes 94-95.
46. These metrics are more precise than simply measuring the number of shares the CEO owns, whichexcludes the effects of stock options from analysis of the CEO's incentives. Calculating each mea-sure is straightforward. The dollar-on-dollar measure is the CEO's percentage of the total sharesoutstanding plus the percentage of outstanding shares the CEO can acquire through options(weighted by option delta), multiplied by $1,000. The equity-returns measure is the stock pricedivided by 100, multiplied by the number of shares and options held; the latter figure is againweighted by option delta.
47. Because a CEO's exposure to changes in firm value is limited by his wealth, we expect the two metricsto have opposite relationships to firm size. As the firm grows, the CEO is able to own a smaller per-centage of its outstanding shares. Since the dollar-on-dollar metric depends on the CEO's percentageownership of total shares, we would expect the dollar-on-dollar measure to fall as firm size increases.Since the equity-returns measure depends on the absolute value of shares and options held by the

Previous study of these metrics, relying exclusively on analysis of large publiccompanies, has yielded mixed results. Some have contended that CEO portfolioincentives are too low.48 More recent work, on the other hand, has argued thatCEOs have portfolio incentives that are already "quite large," concluding that man-agerial influence is unlikely to affect CEO portfolio incentives.49 No previouswork, however, has evaluated whether CEO incentives in public companies differfrom those in companies that are owned by a private equity investor.
Table 4 compares average CEO portfolio incentives in companies owned byprivate equity firms with those in comparable public companies, controlling forfirm size50
TABLE 4. CEO Portfolio Incentives
Congauies:OWXn~t4WbyCompaison:Thvxate Equitirms Finns
flollanon-Doflmr $25.67*** $10.40portfolio Inetives
Eqiy-Retun58446$516204PortfoliolIncentives $S,4 ~ ~ 1,O
Table 4 provides strong evidence that managerial power in public companiesweakens CEO portfolio incentives. Measured by both metrics, the link betweenpay and performance is significantly stronger in private equity-owned companies.And these are economically meaningful differences in the CEOs' incentives tomaximize firm value. The CEO of a company owned by private equity who con-sumes $1,000 in perquisites personally bears more than twice as much of the per-quisites' cost than a CEO of a comparable public company. When shareholderreturns fall by 1 percent, the personal loss suffered by the CEO of a private equity-owned company is 40 percent greater than the loss suffered by the CEO of a com-parable public company.
CEO, we would expect the equity-returns measure to rise as firm size increases. See generally GeorgeP. Baker &Brian J. Hall, CEO Incentives andFirm Size, 22 J. LAB. ECON. 767 (2004). To addressthese effects, the results presented throughout this Article reflect controls for company size.
48. See, e.g., Jensen &Murphy, supra note 26, at 244 (describing pay-performance sensitivity for CEOs atlarge public companies as "generally low"); Randall Morck et al., Management OwnershiP and MarketValuation:An EmpiricalAnalysis, 20 J. FIN. ECON. 293 (1988).
49. Core et al., supra note 28, at 1172.50. The results presented in Table 4 were arrived at using the same methodology employed to calculate
the results presented in Table 3. See supra note 39. As Table 4 shows, portfolio incentives for CEOsat companies owned by private equity investors are statistically and economically significantly largerthan portfolio incentives for CEOs at comparable public companies.
654 60 UCLA L. REV. 638 (2013)

These results provide strong support for the view that managerial powerin public companies weakens the link between CEO pay and performance. InAppendix B, I subject the findings in Table 4 to controls for several potential al-ternative explanations.5 Those models confirm that CEO portfolio incentives aresignificantly higher in companies owned by private equity firms than incentives incomparable public companies. The evidence, then, suggests that the differencesin CEO incentives observed here are attributable, at least in part, to the directoragency problem in public companies.
These results are especially striking when combined with those in Table 3,which showed that the total amount of CEO pay (including the value of stockand stock options so granted to the CEO) is statistically indistinguishable be-tween the two types of companies. 52 This suggests that the stronger portfolioincentives that we see in private equity-owned companies are not the result oflarger stock and option grants at those companies. Rather, the incentives arestronger because of what happens after the CEO receives stock and options: Pri-vate equity firms restrict CEOs' freedom to unload the equity they receive ascompensation.5 3 By contrast, public company directors have long allowed CEOsto unload their stock-based pay-a practice that has drawn criticism from man-agerial-power theorists. After accounting for the effects of unloading, CEOincentives are much stronger in companies owned by private equity than in pub-lic companies.
51. These include, for example, the illiquidity of the CEO's stock holdings when companies are notpublicly traded and the leverage usually associated with private equity ownership. The models inAppendix B control for these effects. For example, the models contain a proxy for the potential effectsof the illiquidity of CEO stock holdings through a dummy variable signifying any year in which thefirm was private. The results of those models are consistent with those presented in Table 4. See infaAppendix B &Table 8.
52. In unreported analysis, I tested whether CEOs in the two types of companies receive similar levels ofstock-based compensation-that is, pay in the form of grants of stock and stock options. Thelevels of stock-based compensation for CEOs in companies owned by private equity and comparablepublic companies are statistically indistinguishable-suggesting, as indicated in the text, thatstronger incentives in private equity-owned firms are not the result of larger stock and option grantsbut instead reflect the CEO's freedom to unload.
53. See, e.g., DEALLAWYERS, WEBCAST: COMPENSATION ARRANGEMENTS FOR PRIVATEEQUITY DEALS 4 (Oct. 31, 2007) (on file with author) (summarizing private equity firms' approachto CEO unloading as follows: "[The CEO] get[s] out when we get out.").
54. See Bebchuk et al, supra note 13, at 825 ("[F]irms take surprisingly few steps to prevent or regulate the[unloading] of the incentives provided by the grant of options and restricted stock.").
Private Equity and Executive Compensation 655

656 60 UCLA L. REV. 638 (2013)
3. Potential Private Equity Selection Effects
CEOs at companies owned by private equity firms have a far stronger pay-performance link than CEOs at comparable public companies. One possiblereason for this result is that the directors appointed by private equity firms drive aharder bargain on the pay-performance link than directors at public companies.Another possibility, however, is that private equity firms simply choose to invest incompanies that already have strong CEO portfolio incentives in place.
To explore this possibility, I gathered data on CEO portfolio incentives at 53companies that were the targets of private equity buyouts between 2000 and 2005,as well as a comparison group of public companies that were not bought out.7
Table 5 compares CEO portfolio incentives at companies targeted by private equi-ty investors with CEO incentives at the comparison group of public companies,controlling for firm size:
TABLE 5. CEO Incentives in Firms Targeted by Private Equity Investors5 6
tkivAtahEtyity Firms
to1nrton4D6llasbIctives$14.20
$14.40
44utw7etupw$1451236 $1201081
PortfoliolIncentives$152610,8
Table 5 shows that the pay-performance link is not economically or statisticallysignificantly stronger in companies targeted by private equity firms than in compa-rable public companies. This result suggests that private equity firms do not sys-tematically invest in companies where the pay-performance link is already strong.In Appendix B, I subject the findings in Table 5 to further multivariate analysis.The results presented here are robust to those tests?.s Thus, it does not appear
55. I am especially grateful to Jonathan Olsen for his assistance in gathering these data. For details on theassembly and analysis of the data, see infra Appendix A, text accompanying notes 88-91.
56. The results presented in Table 5 were arrived at using the same methodology employed to calcu-late the results in Table 3. See supra note 39. As Table 5 shows, there was no meaningftil differencein the level of CEO portfolio incentives at companies that were the targets of private equity investorsand CEO incentives at comparable public companies that were not targeted.
57. See infra Appendix B & Table 9.

that private equity firms' selection of the companies they buy fully explains the sig-nificantly stronger CEO portfolio incentives that we see in the companies thatthey own.
4. Effects of the Exit of the Private Equity Investor
The evidence shows that CEOs in companies owned by private equity firmshave far stronger portfolio incentives than their public company counterparts. Oneexplanation for this result is that managerial influence over public company boardsof directors weakens the pay-performance link. Analyzing preliminary resultsfrom the study presented in this Article, however, one commentator has suggestedan alternative explanation for why companies owned by private equity firms havestronger CEO portfolio incentives: Perhaps the CEOs chosen by private equityfirms prefer more risk, and thus are more willing to accept pay packages that tietheir wealth more closely to the value of their companies. 8 Which explanation ismore likely to account for the large differences in CEO portfolio incentives identi-fied in this Article?
One way to approach that question is to ask whether CEO portfolio incen-tives change as a private equity investor sells its stake in a company and its repre-sentatives leave the board. If CEO risk tolerance, rather than the presence of theprivate equity firm's representatives on the board, explains the stronger portfolioincentives we see in companies owned by private equity investors, the exit of theprivate equity investor should have no effect on those incentives. But if private eq-uity investors' board representatives force CEOs to accept stronger portfolio in-centives, then those incentives should weaken as the private equity firm exits.
I begin with a summary of the exit behavior of private equity firms in mysample. Figure 1 shows the average stake held by private equity firms at the time ofthe IPO and in the years following the offering:
58. Professor David Walker provided a preliminary assessment of the evidence presented in this Articlein recently published work. See David I. Walker, Executive Pay Lessons From Private Equity, 91 B.U.L. REV. 1209, 1219 (2011).
Private Equity and Executive Compensation 657

658 60 UCLA L. REV. 638(2013)
70%
60%
650%
b 40%
S300/
S20%
00/0
0 1 2 3 4 5
Years After Public Offering
FIGURE 1. Private Equity Ownership After an IPO
Following an IPO, private equity firms exit their investments gradually. On aver-age, they continue to hold 27 percent of the equity of their companies in the secondyear after an IPO. But by the fifth year, this stake has fallen to just 15 percent. Aswe would expect, the presence of private equity representatives on the companies'boards follows a similar pattern. Directors appointed by private equity firms, on av-erage, hold 51 percent of the board seats at their companies at the time of the IPO.By the second year after the IPO, that fraction falls to 33 percent, and by the fifthyear, these directors occupy just 23 percent of the seats on their companies' boards.
Since private equity firms exit their investments gradually, the data allow usto assess whether the level of private equity ownership is linked to CEO portfolioincentives. Table 6 shows the average dollar-on-dollar incentives of the CEOs inthe sample of private equity-owned companies based on different levels of privateequity ownership:
658 60 UCLA L. REV. 638 (2013)

TABLE 6. Private Equity Ownership Levels and CEO Incentives 59
Private Equity Firms' Ownership Stake
Greater Between Lessthan 30% 10% and 30% than 10
Dollar-on-Dlollar$34.67 $28.65 $27.65
Portfolio Incentives
Table 6 shows that CEO portfolio incentives do indeed weaken as private equityfirms exit. Multivariate regression models described in Appendix B show thatportfolio incentives have an economically and statistically significant relationshipwith the stake held by the private equity firm, even controlling for differencesamong companies and CEOs.60 The evidence indicates that differences in CEOrisk preferences also do not fully explain the stronger portfolio incentives we ob-serve in companies owned by private equity firms. Instead, these stronger incen-tives seem to be explained by the presence of directors with undivided loyalty tothe companies' owners.
Study of CEO pay in companies owned by private equity offers importantnew insights on the effects of the director agency problem in public companies.Public company directors, who have potentially divided loyalties, create a weakerlink between CEO pay and performance than directors appointed by private equi-ty firms-with economically significant consequences for CEO incentives to max-imize shareholder value.
III. IMPLICATIONS FOR PUBLIC COMPANIESANDPOLICYMAKERS
The effects of managerial power on executive pay at public companies havedrawn considerable attention from commentators and lawmakers. The evidencepresented in this Article shows that directors appointed by private equity inves-tors-directors who are unlikely to be swayed by managerial influence-bargain
59. The CEOs' equity-returns portfolio incentives follow a pattern similar to the trend described inTable 6.
60. For the results of multivariate regressions controlling for a variety of firm and CEO characteristics, seeinfra Appendix B & Table 10. The relationship between the level of private equity ownership andportfolio incentives is statistically significant at high levels of confidence and is robust to controls forfirm fixed effects. In other words, holding any omitted variables associated with each firm constantover time, smaller stakes held by private equity firms are associated with lower CEO dollar-on-dollarincentives.
Private Equity and Executive Compensation 659

for a far stronger link between CEO pay and performance than their public com-pany counterparts.
This Part discusses two implications of these findings for current debates onCEO pay at public companies. First, although public company boards have beenpaying CEOs in stock for decades, CEOs at companies owned by private equityfirms-where directors restrict CEOs' freedom to unload-have far strongerportfolio incentives. Drawing on the lessons from private equity, public companydirectors who seek to align CEO pay more closely with performance should pur-sue contractual arrangements that limit CEOs' freedom to unload company stock.
Second, to encourage directors to insist upon such arrangements, regulatorsshould mandate that public companies disclose CEO portfolio incentives. Currentrules require clear, salient disclosure of pay levels but not portfolio incentives, givingdirectors little reason to bargain for stronger portfolio incentives-and perhapseven encouraging directors to weaken them. Moreover, after the recent financialcrisis, Congress directed regulators to enact new rules on executive compensationat public companies. But these rules will not provide investors with informationon portfolio incentives, exacerbating the law's current emphasis on pay levels.Regulators should respond by mandating that all public companies provide clear,salient disclosure of the portfolio incentives that have long been the focus of pri-vate equity firms' bargains over CEO pay.61
A. Bargains Over CEO Incentives
Because public company CEOs have long received the bulk of their pay instock, many have argued that CEO incentives at public companies are now ap-proaching the optimal bargain for shareholders. The evidence presented in thisArticle, however, shows that directors with undivided loyalty to shareholdersbargain for far stronger CEO portfolio incentives than directors at public com-panies.
Public company directors who seek to align CEO pay with performanceshould thus insist upon contractual arrangements that would limit their CEO'sability to unload the company's stock. The evidence from private equity offers im-portant lessons for public companies that are now developing these arrangements.
61. Since federal securities regulators have plenary authority to require additional disclosure of this type,no additional statutory authorization will be necessary for rulernakers to provide investors with thisinformation. See, e g., Securities Exchange Act of 1934, § 14, 15 U.S.C. § 78n(a) (2006) (providingthe SEC with authority to require disclosure "necessary and appropriate in the public interest or for theprotection of investors").
660 60 UCLA L. REV. 638 (2013)

Private Equity and Executive Compensation 661
1. Magnitude of Public Company CEO Incentives
For more than two decades, public company CEOs have received the bulk oftheir compensation in the form of stock-based pay.62 The widespread adoptionof these pay practices has led many to argue that CEO pay at public companies isalready adequately linked to performance." Yet the evidence presented in thisArticle shows that directors with undivided loyalty to shareholders bargain for farstronger CEO portfolio incentives than directors in public companies. These di-rectors, like their public company counterparts, pay CEOs largely in stock.64 Unlike public company directors, however, directors appointed by private equity firmsrestrict CEOs' freedom to unload, and thus tie CEO pay much more closely toperformance.
To be sure, the optimal level of CEO portfolio incentives in public companiesis far from clear. Differences between public companies and companies owned byprivate equity firms may offer important explanations for some of the differences inCEO portfolio incentives identified in this Article.65 These differences, howev-er, do not explain why directors in both groups of companies pay CEOs similaramounts of stock yet obtain far different levels of CEO portfolio incentives.Instead, that outcome is explained by the fact that public company directors givetheir CEOs the freedom to unload company stock while the directors with undi-vided loyalty to savvy private equity investors do not.66
62. See, e.g., Walker, supra note 58, at 1225-26 (noting that stock-based pay accounts, on average, forabout 50 percent of public company CEO compensation).
63. See, e.g., Core et al., supra note 28, at 1156. Indeed, some have argued that the adoption of thesepractices suggests that public company directors have internalized the governance expertise ofprivateequity firms. See, e.g., Walker, supra note 58, at 1224 ("[P]ublic company executive pay practices havemoved in the direction of private equity portfolio company pay."); see also Bengt Holmstrom & StevenN. Kaplan, Corporate Governance andMergerActivity in the United States: Making Sense ofthe 1980s and1990sJ. ECON. PERSP., Spring 2001, at 121, 136 ("[M]anagement's acceptance of the shareholder'sperspective was greatly aided by lucrative stock option plans, which allowed executives to reap bigfinancial benefits from increased share prices.").
64. See supra note 52 (noting that CEOs in private equity-owned firms receive similar levels of stock-based pay as CEOs in comparable public companies).
65. For example, companies owned by private equity firms typically have more leverage than public com-panies. Cf Walker, supra note 58, at 1221-22 (concluding that the "observed difference in equityportfolio [incentives] is directionally consistent with" the fact that companies owned by private eq-uity firms are typically more leveraged than their public company counterparts). I note, however, thatthe economically and statistically significant differences in portfolio incentives identified in this Articleremain after controlling for several observable differences between the two types of firms, includingdifferences in capital structure. See supra note 51.
66. It bears noting that the differences in CEO portfolio incentives identified in this Article cannot frillybe explained by the fact that the stock of public companies is traded in highly liquid public marketswhile the stock of companies owned by private equity firms is not. These differences persist even after

2. Contracting for CEO Incentives
Public company boards seeking to strengthen the link between CEO pay andperformance should thus pursue contractual arrangements that address the CEO'sportfolio incentives-after accounting for the effects of any unloading. For exam-ple, CEOs could be required by contract to hold a given amount of stock and op-tions in the companies they run.
Indeed, several public companies have already adopted policies requiringCEOs to own a specified level of company stock. 7 For two reasons, however, thepolicies currently in use at most of these public companies are unlikely to strength-en CEO portfolio incentives. First, the required level of stock ownership tends tobe very low relative both to the CEO's compensation and to the firm's value; mostCEOs can sell substantial proportions of the stock they already own within thelimits of the policy." Second, many of these policies are purely voluntary, there isno penalty for CEOs who fall below the required amount of stock ownership. 9
The evidence from companies owned by private equity firms suggests that publiccompany directors should drive a far harder bargain over the CEO's ownershipof the company's equity. Instead of voluntary policies, companies seeking to im-prove the pay-performance link should pursue binding contractual agreementsaddressing the amount of stock and options the CEO will hold. Like their privateequity counterparts, public company directors concerned about the link betweenpay and performance should consider these arrangements central to the CEO paybargain-rather than matters adequately addressed by nonbinding statements ofpolicy.
Alternatively, public company boards seeking to align CEO pay and per-formance more closely could impose contractual restrictions on CEOs' freedomto unload. Indeed, several well-known public companies have imposed such re-strictions on their top executives. For example, Goldman Sachs now requires its
controlling for the illiquidity of the CEO's stock holdings when companies are not publicly traded.See supra note 51.
67. For an empirical assessment of public company stock ownership policies, see John E. Core & DavidF. Larcker, Peiformance Consequences ofMandatory Increases in Executive Stock Ownershi, 64 J. FIN.ECON. 317, 326 (2002).
68. For example, the Lockheed Martin Corporation has in place stock ownership guidelines that requireits CEO to hold stock equal to $10.8 million in value. See Lockheed Martin Corp., Definitive ProxyStatement (Schedule 14A), at51 (Mar. 9, 2012). This figure is less than 15 percent of the $70 millionthe CEO earned in total compensation between 2009 and 2011. See id. at 53. The company's mar-ket capitalization is over $30 billion. See, e.g., Stock Quote ofLockheed Martin Corporation, YAHOO!FINANCE, http://finance.yahoo.com/q?s= LMT (last visited Nov. 18, 2012). Thus, the mandatedlevel of stock ownership would cause the CEO to internalize just $0.38 of every $1,000 change in thecompany's value.
69. See, e.g., Core & Larcker, supra note 67, at 320.
662 60 UCLA L. REV. 638 (2013)

CEO to own, until his retirement, at least the number of shares equal to 75 percentof the number of shares he has received in stock-based pay during his tenure.70
While these restrictions will likely strengthen CEO portfolio incentives atthese companies, commentators have criticized these restrictions for leaving theCEO substantial freedom to unload." Of course, the exact nature of the optimalrestrictions on CEO unloading is far from clear. For present purposes, however,the evidence from private equity allows us to make two preliminary observations.First, although nearly all companies owned by private equity firms meaningfullyrestrict the CEO's freedom to unload, relatively few public companies have adopt-ed such restrictions. 72 Second, although companies owned by private equity firmsgenerally prohibit CEOs from unloading, the few public companies that haveadopted any contractual limits on unloading still permit their CEOs to unload sub-stantial amounts of stock.73
B. Regulation of CEO Incentives
It is unsurprising that most public companies have not adopted contractualarrangements governing CEO portfolio incentives. For one thing, CEOs can usetheir influence to persuade directors not to insist on contractual terms that re-quire CEOs to accept riskier pay. For another, because current law does not requireclear, salient disclosure of CEO portfolio incentives, directors have little reason toworry that low levels of CEO equity ownership will be detected by investors or thepublic.
Indeed, current law requires public companies to provide extensive disclosureof CEO pay levels but not incentives, encouraging directors to weaken the pay-performance link. And new rules that Congress has required regulators to developin the wake of the financial crisis will likely exacerbate this problem. Regulatorsshould thus respond by requiring that public companies disclose the bargains over
70. See Robertj. Jackson, Jr., Stock Unloading andBanker Incentives, 112 COLUI. L. REv. 951, 962 n.35(2012) (describing these restrictions).
71. See Lucian A. Bebchuk &Jesse M. Fried, Payingfor Long-Term Peiformance, 158 U. PA. L. REv.1915, 1926-27 (2 0 10 ) (arguing that restrictions on unloading that are lifted upon retirement haveseveral important disadvantages, including the possibility that "the arrangement will encourage [themanager] to place excessive weight on short-term results in her last year or two of service").
72. See id.73. See, e.g., DEALLAWYERS, supra note 53, at 4. Interestingly, even sophisticated investors who are not
associated with private equity firms appear to be unsatisfied with contractual arrangements that leaveCEOs substantial freedom to unload. In connection with Warren Buffett's purchase of preferredstock in Goldman Sachs during the financial crisis, the company agreed to adopt significant addi-tional restrictions on its CEO's freedom to unload. See Goldman Sachs Grp., Inc., Definitive ProxyStatement (Schedule 14A), at 16 (Apr. 6, 2009).
Private Equity and Executive Compensation 663

CEO portfolio incentives that have long been the focus of directors at companiesowned by private equity firms.
1. Existing Disclosure Rules
Under current law, public companies are required to disclose extensive andhighly salient information about CEO pay levels. By contrast, existing rules re-quire relatively little disclosure of CEO incentives. Taken together, current rulesmay discourage public company directors from insisting upon a strong link be-tween CEO pay and performance.
All public companies are required to disclose the amount of their CEO's payin a clear, simple table, known as the "Summary Compensation Table," in theirannual proxy statements.74 Over time, securities rules have evolved to require thatthis table include more detailed information on pay levels, including the value ofeach element of the CEO's pay-salary, bonus, stock-based pay, retirement bene-fits, and other compensation-as well as the total value of the CEO's pay package.The total levels of CEO pay, as disclosed in these tables, have been the subject ofconsiderable scrutiny from investors and the public.
Yet the Summary Compensation Table provides no information, summary orotherwise, about CEO portfolio incentives. While some of the information need-ed to calculate the CEO's portfolio incentives can be gleaned from informationscattered throughout the proxy statement and filings public companies are requiredto make under insider-trading rules, these disclosures offer only limited infor-mation on unloading.7 Particularly in contrast to the extensive disclosure regimethat governs pay levels, public company investors receive very little information onCEO portfolio incentives. Given the evidence that the divided loyalties of publiccompany directors are associated with significantly weaker CEO incentives, thelaw's emphasis on the magnitude of pay appears to be misplaced.
Worse, this unhealthy emphasis on pay levels may give public company direc-tors additionalreason not to drive harder bargains over CEO incentives. We wouldexpect risk-averse CEOs to demand additional compensation in exchange for ac-
74. See generally 17 C.F.R. § 229.402(a) (2012).75. Public companies are required to provide some information about CEO stock ownership, and
outstanding grants of stock and stock options, in separate tables in the companys annual proxy state-ment. See, e.g., id§ 229.402(f) (describing disclosure requirements related to outstanding grants ofstock-based pay). In addition, some information on unloading is dispersed among a series of filingsthat public companies provide pursuant to Section 16 of the Securities Exchange Act of 1934.Researchers have long noted the difficulties associated with estimating CEO portfolio incentives onthe basis of these disclosures, however. See, e.g., Hall & Liebman, supra note 45, at 687 (describingseveral difficulties that arise when attempting to calculate CEO portfolio incentives with precisionfrom these disclosures).
664 60 UCLA L. REV. 638 (2013)

cepting pay that is more closely linked to performance. Directors who demand astronger pay-performance link will likely have to agree to pay CEOs more in thebargain. These directors know, however, that information on the CEO's increasedlevel of pay will be prominently described in the company's proxy statement, whileinformation on her stronger incentives will be obscured. Fearing that investorswill object to increased levels of CEO pay, directors may choose not to demandthat the CEO accept a stronger pay-performance link.
2. Post-Crisis Rulemaking
After the recent financial crisis, lawmakers became convinced that addition-al rules were needed to regulate CEO pay at large public companies. Congressdirected securities regulators to adopt two types of reforms. First, it directed theSEC to require additional disclosure related to CEO pay. Second, it requiredthe SEC to adopt new rules mandating that public company shareholders be givena nonbinding vote on executive compensation. Neither addresses the link betweenCEO pay and performance, and both risk exacerbating the consequences of thelaw's existing emphasis on CEO pay levels.
The Dodd-Frank Wall Street Reform and Consumer Protection Act of 2010requires all public companies to disclose the ratio of the amount of the CEO's payto the median pay of all of the company's employees. This requirement wouldnot, of course, give investors any information about CEO portfolio incentives.And, like existing law, the rule's emphasis on pay levels may have the unintendedconsequence of encouraging directors to weaken the pay-performance link.
Directors of public companies may fear that the public will object to high ra-tios between the levels of CEO and employee pay. Ifpublic company directors in-sist that their CEOs accept a stronger link between pay and performance, we canexpect that CEOs will respond by demanding higher levels ofpay. Yet there is noreason to expect that the median pay of the company's employees will changebecause of this new bargain. As a result, the new rules might require directorsbargaining for stronger CEO portfolio incentives to disclose a higher ratio be-tween the CEO's pay and the median pay of the company's employees. To the ex-tent that directors suffer, or fear to suffer, approbation for such disclosure, this rule
76. See, e.g., Timothy F. Geithner, Secretary of the Treasury, Statement on Compensation (June 10,2009), available at http://www.treasury.gov/press-center/press-releases/Pages/tg163.aspx ("Thisfinancial crisis had many significant causes, but executive compensation practices were a contributingfactor.").
77. Dodd-Frank Wall Street Reform and Consumer Protection Act, Pub. L. No. 111-203, § 953(b), 124Stat. 1376, 1904 (2010) (codified at 15 U.S.C. § 7Sn-1 (Supp. V 2011)).
665Private Equity and Executive Compensation

may give directors additional reason not to bargain for stronger CEO portfolio in-centives in the first place.
The Dodd-Frank Act also requires that public companies allow shareholdersto vote on nonbinding resolutions approving the executive pay disclosures includ-ed in proxy statements.78 As we have seen, however, these disclosures include noinformation on CEO portfolio incentives-and their emphasis on CEO pay levelsmay well discourage directors from bargaining for a stronger pay-performance link.Giving shareholders the power to vote on these disclosures-armed only with in-formation on CEO pay levels-may render the law's already unhealthy emphasison pay levels even more virulent.7 1
It is too soon to tell whether the shareholder votes mandated by Dodd-Frankwill actually have this effect.8 By giving investors the right to vote to approve dis-closures that provide extensive information on CEO pay levels but none on CEOincentives, however, Dodd-Frank may well exacerbate the law's existing tendencyto discourage directors from bargaining for the pay-performance link that is inshareholders' best interest.
3. Disclosing Portfolio Incentives
Current law provides shareholders and the public with extensive disclosureon CEO pay levels but relatively little information about incentives. And thepost-crisis rulemaking mandated by the Dodd-Frank Act will lead to new dis-closures that further emphasize pay levels. Yet the evidence from private equitysuggests that directors with undivided loyalty to investors emphasize incentives,
78. Id. § 951(a), 124 Stat. at 1899 (codified at 15 U.S.C. § 781.79. See Jeffrey N. Gordon, Essay, "Say on Pay": Cautionary Notes on the UK Experience and the Casefor
Shareholder Opt-In, 46 HARY.J. ON LEGIS. 323, 352 (2009) (predicting that the introduction of man-datory shareholder votes on executive pay in the United States might distort managerial incentives).
80. The effects of these votes will depend, among other things, on the influence of the advisory servicesthat provide recommendations to institutional shareholders on how their votes should be cast onthese matters. Although commentators have debated the extent to which these advisors influenceshareholder voting more generally, see, e.g., Stephen Choi et al., The Power ofProxyAdvisors: Myth orReality?, 59 EMORY LJ. 869 (2010), the early evidence suggests that these advisors wield consid-erable influence over shareholder votes on executive pay. See Yonca Ertimur et al., ShareholderVotes and Proxy Advisors: Evidence From Say on Pay 32-33 (July 13, 2012) (unpublished manu-script), available at http://papers.ssrn.com/sol3/papers.cfimabstract-id=2019239. These advisorshave developed guidelines for their recommendations on shareholder votes on executive pay. See id at3. These guidelines currently do not include CEO portfolio incentives among the considerations thatthe advisors take into account when making a recommendation on how shareholders should vote onexecutive pay. See GARY HEWITT &CAROLBOWIE, INST'L S'HOLDER SERXS., EVALUATINGPAY FOR PERFORMANCE ALIGNMENT: ISS' QUANTITATIVE AND QUALITATIVE APPROACH(2011), avai/able at http://www.issgovernance.com/sites/default/f iles/EvaluatingPayForPeformance20111219.pdf.
666 60 UCLA L. REV. 638 (2013)

rather than pay levels, in their bargains with executives. Regulators should re-spond by requiring clear, summary disclosure of CEO portfolio incentives.
Because public companies already have the information necessary to calculatetheir CEOs' portfolio incentives, this disclosure is unlikely to be administrativelyexpensive."' The information would allow investors to ascertain, with some meas-ure of precision, the relationship between the CEO's wealth and the company'svalue. Moreover, the data would allow shareholders to monitor whether paying theCEO in stock has strengthened the pay-performance link-or whether CEOunloading has undermined the incentive effects of stock-based pay. To the extentthat regulators are concerned about the effects of managerial influence on CEOpay, it is difficult to see why CEO portfolio incentives should not be summarilydisclosed to public company investors. By mandating that public companies pro-vide this information, regulators could mitigate the potentially deleterious effectsof the law's current emphasis on pay levels.
It might be argued that some of the information necessary to estimate aCEO's portfolio incentives is already disclosed in filings public companies are re-quired to make under insider-trading rules. But because these disclosures are notdesigned to provide information on portfolio incentives, they are of limited value toinvestors concerned about the link between CEO pay and performance. Insteadof requiring shareholders to rely on these filings, regulators should require publiccompanies to include clear, summary disclosures of CEO portfolio incentives intheir annual proxy disclosure on CEO pay.
Moreover, the fact that shareholders now have the power to vote on execu-tive pay makes the case for summary disclosure of CEO portfolio incentives evenstronger. Disclosure of this information will allow shareholders to incorporatethe pay-performance link into their voting decisions, giving directors reasonto hew more closely to shareholder preferences when bargaining with CEOsover compensation.
The law's existing emphasis on pay levels discourages public company direc-tors from pursuing the pay-performance link that is in shareholders' best interest,and post-crisis rulemaking required by the Dodd-Frank Act risks exacerbating thisproblem. Regulators should require that public companies provide clear, salientinformation on the CEO incentives that have long been the focus of directors withundivided loyalty to the company's owners.
81. Because calculation of a CEO's portfolio incentives only requires information on the CEO's stock andoption ownership, companies are likely to have this information readily available. In any event, thecosts of calculating CEO incentives will be far lower for public companies than for shareholdersattempting to monitor the compensation decisions of directors.
Private Equity and Executive Compensation 667

CONCLUSION
Directors of public companies have reason to favor the interests of managersover those of shareholders when they negotiate with CEOs over compensation.No such conflict exists, however, for directors appointed by private equity investors.In this Article, I have used the first study of how companies owned by private equi-ty firms pay CEOs to illustrate the impact of divided director loyalties on CEO payat public companies.
The evidence shows that directors appointed by private equity firms create astronger link between CEO pay and performance than public company directors.These differences in CEO incentives are not explained by the existing compensa-tion practices ofthe companies private equity firms choose to buy or the risk prefer-ences of the CEOs they hire. Instead, the stronger pay-performance link we see incompanies owned by private equity firms arises from their directors' unconflictedmotivation to maximize shareholder value.
This finding has important implications for investors and regulators who wishto neutralize managerial influence over CEO pay at public companies. Boards ofpublic companies seeking to align CEO pay more closely with performance shouldpursue contractual arrangements that address CEO portfolio incentives. And reg-ulators should recognize that current law, by requiring disclosure of information onCEO pay levels but not on incentives, perversely discourages public company di-rectors from pursuing pay packages that are in shareholders' interests. Moreover,post-crisis rulemaking on executive pay will likely exacerbate this problem. Regu-lators should respond by supplementing existing rules on executive pay with arequirement that public companies provide shareholders with clear, salient infor-mation on CEO portfolio incentives.
The data presented here merely scratch the surface of what can be learnedfrom companies owned by private equity firms. All questions of public companycorporate governance, to the extent they arise from the separation of ownershipand control, can be illuminated by comparison with practices in private equity.This Article offers a first glimpse of the governance lessons that can be drawnfrom the boardrooms of companies owned by private equity investors.
APPENDIXA. DATA
The evidence presented in the Article is based on data drawn by hand fromfilings that public companies are required to provide to the SEC. Prior to an IPO,companies are required to file a registration statement with the Commission de-scribing, among other matters, CEO pay. In the years following the IPO, cm
panies must annually file a proxy statement providing the same information. All
668 60 UCLA L. REV. 638 (2013)

Private Equity and Executive Compensation 669
of the filings used to assemble the dataset are available on the SEC's website, andall of the data used in this Article are available upon request.
A. DatasetAssembly
1. Companies Owned by Private Equity Firms
To examine how private equity investors pay CEOs, I identified companiesthat private equity firms took public between 2000 and 2005. Because no publicdatabase reliably identifies which companies completing an IPO are owned by pri-vate equity firms, I identified those companies by searching two proprietary da-tabases: the Dealogic Sponsor Analytics database and the Standard & Poor'sCapitalIQ database. My dataset includes only IPOs that were identified in bothproprietary databases as involving a company owned by a private equity firm.
These databases included several companies whose CEOs had also foundedthe firm. In this Article, I focus only on evidence from negotiations between pro-fessional managers and directors. Previous work has established, however, thatfounders who also serve as CEOs receive different compensation, and have differ-ent motivations, from professional managers.83 Thus, I excluded companies withfounder-CEOs from my sample,84 leaving 108 companies owned by private equi-ty investors that completed an IPO during the sample period. I drew data onCEO pay, portfolio incentives, and CEO and company characteristics by hand foreach company. Data for the year prior to each company's IPO were drawn fromthe company's registration statement, and data for years following each company'sIPO were drawn from the company's annual proxy statements.
I then identified a separate group of public companies that were not owned bya private equity firm, including all of the companies that were included in the S&P1500 index during the sample period. The sample of companies owned by privateequity firms, however, included only companies that recently completed an IPO.
82. See generally DEALOGIC EQITY CAPITAL MARKETS ANALYTICS (proprietary data on file withauthor), available at http://www.dealogic.com/en/ecm.htm; STANDARD &POOR'S, CAPITAL IQ(proprietary data on file with author), available at http://www.standardandpoors.com/products-services/capitaliq-compustat. I am gratefil to Dealogic and Standard &Poor's for providing me withaccess to their proprietary databases.
83. See, e.g., John C. Coates IV & Reinier Kraakman, CEO Tenure, Peformance and Turnover in S&P500Companies 15 (ECGI Finance Working Paper No. 191, 2010), available at http://papers.ssrn.com/sol3/papers.cfm?abstract id= 925532.
84. To proxy for founder-CEOs, I excluded from the sample any company with a CEO who ownedmore than 5 percent of the company at the time of the IPO. See, e.g., Jerry Cao & Josh Lerner,The Performance of Reverse Leveraged Buyouts (Oct. 15, 2006) (unpublished manuscript),avai/ab/e athttp://papers.ssrn.com/sol3/papers.cfm?abstract id=937801 (using a similar method).

To ensure that the group of public companies also included only firms close to theIPO stage, I used the proprietary Bloomberg Financial Services Database to iden-tify the date on which each company in the group of public companies was takenpublic. 5 I then removed from the group of public companies any company thatwas more than seven years from the date of its IPO or for which information onthe IPO date was not available." Finally, I drew data on CEO pay, portfolio in-centives, and CEO and company characteristics for all firms in this group from theStandard &Poor's ExecuComp database."
2. Companies Targeted by Private Equity Firms
To explore whether private equity firms systematically invest in companiesthat already have a strong link between pay and performance, I separately identifieda group of companies that were the targets of private equity investments during mysample period. No public database reliably identifies such companies. Thus, Iused the proprietary CapitalIQ database to search for firms that were the targets ofprivate equity investments between 2000 and 2005." Once again, I excluded com-panies whose CEOs founded the company from this group, leaving 53 companiesthat were the targets of private equity investments during the sample period.89 Foreach of these companies, I drew data on CEO pay, portfolio incentives, and CEOand company characteristics by hand from the last available proxy statement filedby the firm before the private equity investment took place.
I then identified a separate group ofpublic companies that were not the targetof private equity investments, including all of the firms in the S&P 1500 index."
85. BLOOMBERG L.P., BLOOMBERG FINANCIAL SERVICES DATABASE (proprietary data on file withauthor), available at http://www.bloomberg.com.
86. In addition, I also control separately for the number ofyears since each company's IPO in the multivar-iate regressions presented below.
87. See STANDARD &POOR'S, EXECUCOMP ANNUAL COMPENSATION DATASET (data on file withauthor), available at http://wrds.wharton.upenn.edu.
88. See STANDARD &POOR'S, supra note 82.89. I used the same method for identifying and excluding companies with founder-CEOs from this group
of companies as I did for the group of companies owned by private equity firms. See supra note 84.90. The companies that were targeted by private equity firms were significantly smaller than the com-
panies in the S&P 1500. Thus, to ensure that the two groups of companies were comparable, I elim-inated from the group of companies in the S&P 1500 any company with a market capitalizationgreater than that of the largest company in the group targeted by private equity firms. Because thegroup of companies in the S&P 1500 may still not be fully comparable to the group of companiestargeted by private equity firms, as a robustness check I also conducted a separate analysis of CEOportfolio incentives in the two groups of companies using a more precise matching procedure. See
infa note 101.
670 60 UCLA L. REV. 638 (2013)
For each of these companies, I drew data on CEO pay, portfolio incentives, andCEO and company characteristics from the ExecuComp database.9
B. Constructed Variables
1. CEO Pay Levels
I calculated each CEO's total pay as the sum of the CEO's salary, bonus, oth-er compensation, and stock-based pay, including the value of stock and stock op-tions. The values for each element of the CEO's pay were generally drawn fromthe companies' securities filings.
Following previous literature, I used the Black-Scholes method to value stockoptions granted to the CEO as compensation.92 To calculate an option's value,the Black-Scholes formula requires information on the volatility of the price of thestock underlying the option. Some stock options for CEOs in the group of com-panies owned by private equity firms, however, were granted to CEOs before theircompany's IPO. To value these options, I assumed that the volatility of the un-derlying stock was equal to the actual volatility of the stock from the time of theIPO through the end of the sample period. As a robustness check, I recalculatedthe value of each option grant based on the average annualized volatility of thestocks in the firm's Standard Industry Classification.93 The results described belowremained unchanged.
2. Portfolio Incentives
To calculate both measures for CEO portfolio incentives described in PartII.B.2, one must know the delta of the CEO's options-that is, the amount bywhich the value of each option changes based on a given change in firm value.94 Inturn, to calculate the option delta one must know the exercise price and term-thatis, the amount of time remaining until the expiration-of each stock option. Thisinformation could not be obtained for some of the options granted to the CEOs inmy sample.
91. See STANDARD &POOR'S, supra note 87.92. See supra note 38; see also Fischer Black & Myron S choles, The Pricing of Options and Corporate
Liabilities, 81 J. POL. ECON. 637 (1973).93. I am grateful to James Zeitler of Harvard Business School's Baker Library Research Services for his as-
sistrance in conducting this analysis.94. See sup ra note 45.
Private Equity and Executive Compensation 671

In these cases, I assumed that option delta was equal to the median optiondelta for all option grants made by the company during the sample period. Asa robustness check, I recalculated all CEO portfolio incentives on the basis of twoalternative assumptions. First, I assumed that option delta was equal to the mediandelta for all options granted during the sample period, which was 0.87. Second,following an approach previously employed in the literature, I assumed that deltafor all stock options was equal to 0.70.s The results presented in the Article, anddescribed in the tables below, remained unchanged.
3. Company Characteristics
Data on the characteristics of each company in my sample, such as firm sizeand equity volatility, were generally drawn by hand from the company's securitiesfilings or from the Center for Research in Security Prices.96 Because previous workhas shown that a company's industry is particularly relevant to CEO incentives,however, I took two additional steps to control for industry.
First, I identified each company's Standard Industry Classification code.Based on this code, I then identified each company's Fama-French industry des-ignation, which captures industry-specific company characteristics more accurate-ly than Standard Industry Classification codes.9" All of the results in the Article,and described in the tables below, control separately for each company's Fama-French industry classification.
Second, I separately controlled for measures of company value that were ad-justed by Fama-French industry. Following previous work in this area, I proxiedfor company value using Tobin's Q which is the ratio of the company's equityvalue to the book value of its assets. I then adjusted each company's Tobin's Qtoreflect its Fama-French industry. The results presented in the Article, and de-scribed in the tables below, control for the ratio of each company's Tobin's Qtothe median Tobin's Qfor all of the companies in the company's Fama-French in-dustry.
95. See Hall & Liebman, supra note 45 (using this approach).96. See CTR. FOR RESEARCH IN SECURITY PRICES, CSRP-ANNUAL UPDATE, available at http://
wrds.wharton.upenn.edu (accessed Dec. 14,2007).97. See Eugene F. Fama & Kenneth R. French, Industry Costs ofEquity, 43 J. FIN. ECON. 153, 179-81
(1997). Kenneth French's online library identifies Fama-French industry codes for each StandardIndustry Classif ication code. Detail for 49lndusty Porfolios, KENNETH R. FRENCH, http://mba.tuck.dartmouth.edu/pages/faculty/ken.french/DataLibrary/det_49_ind port.html (last visitedNov. 18, 2012).
672 60 UCLA L. REV. 638 (2013)

APPENDIX B. ANALYSIS
Below I provide the results of econometric analysis that describes the statisti-cal relationships identified in the Article. Tables 7 through 10 provide correlationcoefficients and measures of statistical significance from ordinary least squares re-gressions using the data described in Appendix A. All models include controls forobservation year and the characteristics of each company (including company size(expressed as the log of the firm's market capitalization), equity volatility, indus-try, and industry-relative firm value) and CEO (including each CEO's age andtenure-that is, the number ofyears the executive has served as CEO). Each mod-el also includes controls for managerial continuity through a dummy variable indi-cating whether a company's CEO was replaced in the year prior to the observationyear. I separately report the results of models that include year fixed effects. In thetables below, robust standard errors, which are clustered by firm, are given in pa-rentheses. Mean values for dependent variables are also given in parentheses.
A. CEO Pay Levels
To test whether companies owned by private equity firms pay their CEOsdifferent amounts than public companies, I specify a multivariate regression modelin which the dependent variable is a proxy for the CEO's cash compensation (thesum of the CEO's salary and bonus, in models (a) and (b)) or for the CEO's totalcompensation (models (c) and (d)). Each model includes separate controls for thenumber of years since each company's IPO.98 "Private Equity Ownership" is adummy variable equal to one for companies owned by a private equity firm and ze-ro for all others."
98. The CEO of a company owned by a private equity firm may face a systematically different probabil-ity ofbeing dismissed than the CEO of a comparable public company, and this difference could affectthe relative value of the CEO's compensation. See supra note 41. As an additional check, each of themodels in Table 7 was recalculated, this time including a control for a variable measuring the interac-tion between the dummy variable for private equity ownership and CEO tenure to approximate theeffects of different levels of CEO tenure in companies owned by private equity firms. The results wereconsistent with those described in Table 7.
99. Because the CEOs of companies owned by private equity firms have an economically and statisticallysignificantly stronger link between pay and performance than their public company counterparts, Irecalculated the models described in Table 7 with separate controls for each CEO's portfolio incen-fives, using both the dollar-on-dollar and equity-returns measures. See inflaTable 8. These models,too, revealed no statistically significant relationship between CEO pay levels and private equityownership.
Private Equity and Executive Compensation 673

TABLE 7. CEO Pay Levels
Salaryand Salary and Total Annual Total AnnualBonus Bonus Compensation Compensation
($1,394,311) ($1394,311) ($6,222491) ($6,222,291)(a) (b) (c) (d)
Log of Mar-1,180,002* 1,186,838*** 9,526,383*** 9,561,815*
ket Capitali-(165,807) (165,968) (1,703,017) (1,710,747)zation
16,575" 17,030" -123,419 -123,169
(6,786) (6,484) (144,322) (144,399)
Prvate 54,609 107,496 637Y876 851,789Equity (117,444) (1,32,251) (1,287, 769) (1265,898)Ownership
Year rFixedEffecrsx dNo Yes No YesEffects
Observations 1,029 1,029 1,029 1,029
IF __ 0.32 0.32 0.15 0.16
B. CEO Portfolio Incentives
To explore whether the CEOs of companies owned by a private equity firmhave different portfolio incentives than CEOs of public companies, I specify mul-tivariate models in which the dependent variable is one of the two metrics for CEOportfolio incentives described in the Article (dollar-on-dollar incentives (as inmodels (a) and (b)) or equity returns incentives (as in models (c) and ())." In ad-dition to the controls described above, all of the models in Table 8 include a sepa-rate control for whether the firm was private in the observation year ("Private Year,"equal to one for any year in which the firm was not yet public and zero for all otheryears). Again, "Private Equity Ownership" is a dummy variable equal to one forcompanies owned by a private equity firm and zero for others.
100. See supra text accompanying notes 44-47.
674 60 UCLA L. REV. 638 (2013)

TABLES. CEO Portfolio Incentives
Dollar-on- Dollar-on- Equity EquityDollar - DollarIncen- Returns Returs
centives ives Incentives Incentives($20.28) (S20.28) (399,08) ($399'088)
(a) (b) (d
0.03** 0.03** 96.19 132.12R4e~lae i(0.01) (0.01) (209.17) (215.16)
Value
6.47** 6.66** 51,601.61 45,130.13P4aY(1.73) (1.83) (34,932.97) (40,166.64)
Private Equity 12.5 12.38 r 244720t 296398{St0Ownership (234) (2.36) (56008.92) (6196732)YearFixNo Yes No Yes
Effects?
Observations 1,029 1,029 1,029 1,029I2 0.32 0.32 0.31 0.32
C. Private Equity Selection Effects
To evaluate whether private equity firms choose to invest in companies thatalready have strong CEO portfolio incentives in place, I turn to the sample of com-panies that were the targets of private equity investments, once again specifying amultivariate regression in which the dependent variable is one of the two metricsfor CEO portfolio incentives (dollar-on-dollar incentives (models (a) and (b)) orequity returns incentives (models (c) and (d))."' In addition to the controls de-scribed above, each model includes a control for the level of the CEO's cash com-pensation, calculated as the sum of the CEO's salary and bonus. "Private EquityTarget" is a dummy variable equal to one for companies that were the targets ofpri-vate equity transactions and zero for all others.
101. The models described in Table 9 reflect a comparison between companies that were the targets of pri-vate equity investment and companies in the S&P 1500. See supra text accompanying notes 88-91.As a robustness check, in unreported analysis I matched the companies targeted by private equity firmsto companies in the S&P 1500 on the basis of propensity-score analysis depending on Fama-Frenchindustry, firm size, and CEO tenure. The results were consistent with those described in Table 9.
Private Equity and Executive Compensation 675

TABLE 9. Private Equity Selection Effects
Dolar-on- Dolla-on- Equity EquityDollarlIn- DollarT- Returns Returns
centives centives Incentives Incentives($14.40) ($14.40) ($124,081) ($124,081)
(a) (b) (C) (4)
(2VOAge -0.14t -0.14" -1757*** -1747***
(0.04) (0.04) (447.90) (447.69)
0.76*** 0.76*** 7,289* 7,304**(0.07) (0.07) (754.61) (756.55)
-0.66 - 15,437 14942Private Equity ITarget
(2.21) (2.23) (11613.37) (111636.49)
YearFixed No Yes No YesEffects?
Observations 9,667 9,667 9,667 9,667
IR 0.16 0.16 0.26 0.26
D. Private Equity Ownership and CEO Portfolio Incentives
To examine whether the exit of a private equity investor is associated withchanges in CEO portfolio incentives, I return to the sample of companies ownedby private equity investors. I specify a multivariate regression in which the levelof the CEO's dollar-on-dollar incentives is the dependent variable. Both modelsinclude separate controls for the number of years since the company's IPO andfor the ratio of each firm's total debt to its total assets. "Percentage Held by PrivateEquity" refers to the percentage of the firm's equity held by the private equityowner.102
102. It is possible that significant changes in private equity ownership in the months immediately follow-ing the IPO drive the relationship I observe between CEO portfolio incentives and private equityownership. To explore this possibility, I conducted the tests described in Table 10 again, this timeexcluding from the sample any observation less than six months following the company's IPO. Theresults were consistent with those described in Table 10.
676 60 UCLA L. REV. 638 (2013)
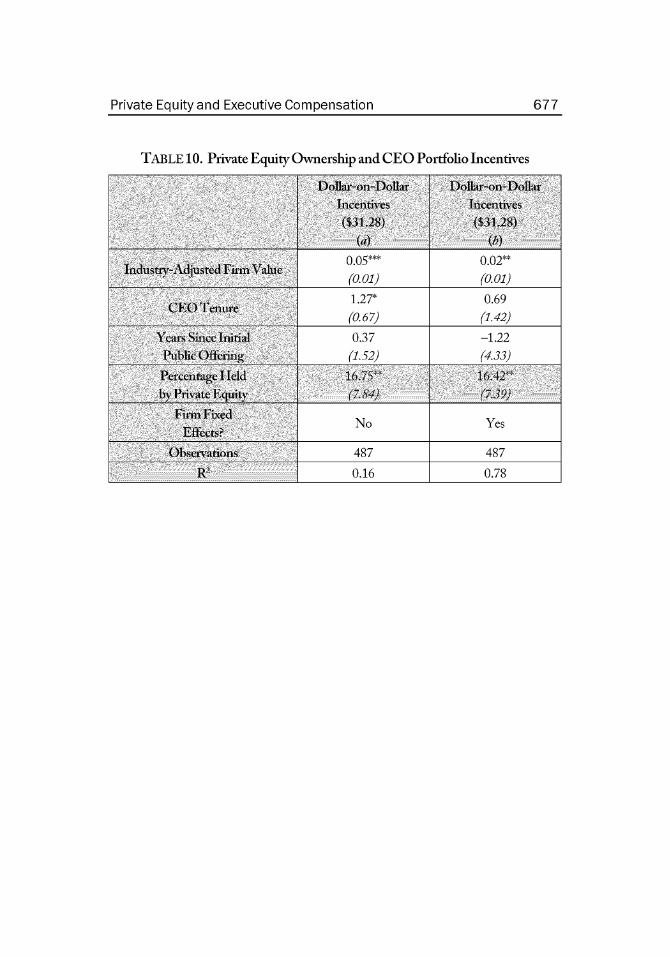
TABLE 10. Private Equity Ownership and CEO Portfolio Incentives
Dollr-on-Dollar Dollar-on-DollarIncentives Incentives
($31.28) ($31t28)(b)
0.05* 0.02"Industry-Adjusted t Firm Value
(0.01) (0.01)1.27* 0.69
CEO Tenlure(0.67) (1.42)
Years Since Initial 0.37 -1.22Public Offering (1.52) (4.33)
PercentagefHeld 16.75" 16.42 4
by Private Equity (7.84)(739)Firm Fixed:
No YesEffects?
Observations 487 487
I2 0.16 0.78
Private Equity and Executive Compensation 677