private sector development - the case of...
TRANSCRIPT

DEVELOPMENT OF PRIVATE SECTOR
(DRAFT)
Ahmet Mançellari
Faculty of Economics, Tirana University
Introduction
These 10 years of transition from a centralized economy to a market economy can briefly
be described as a transition from an economy almost entirely dominated by the state to
an economy in which the private sector plays a dominant role.
How thave he dimensions and the profile of the private sector have changed in Albania
over the last 10 years? To what extent has it become a dominant factor in the country's
economic development? To what extent has this development been efficient and at the
same time comprehensive, thereby creating opportunities also for the poorer strata of
society? Which are the main obstacles the development of the private sector comes up
against and what political measures can back a positive development of the private
sector? In what manner can advantages for the poor be maximized?
In this presentation we will try to address these questions or other questions connected
with them, trying rather to "adapt" them in order to serve as starting points for a debate
than to give exhaustive answers.
I. How the Private Sector Has Developed in Albania over the Last 10 Years?
I.1 How the Dimensions of the Private Sector Have Changed?
The growth of the private sector share of the GDP, in other words, the shift of the
production sources from the state sector to the private sector, represents a radical
transformation that has to an overwhelming extent been already completed in Albania.
As table 1 and graph 1.1 show, the private sector share of the GDP has grown from 5%
1
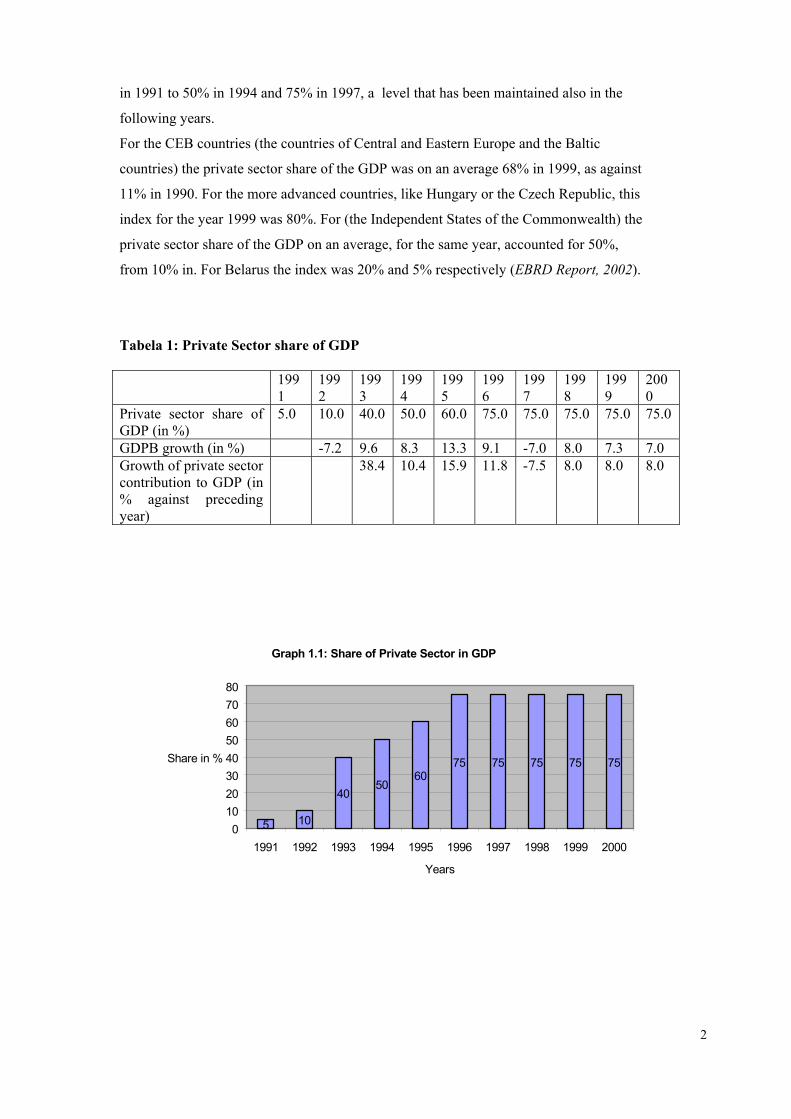
in 1991 to 50% in 1994 and 75% in 1997, a level that has been maintained also in the
following years.
For the CEB countries (the countries of Central and Eastern Europe and the Baltic
countries) the private sector share of the GDP was on an average 68% in 1999, as against
11% in 1990. For the more advanced countries, like Hungary or the Czech Republic, this
index for the year 1999 was 80%. For (the Independent States of the Commonwealth) the
private sector share of the GDP on an average, for the same year, accounted for 50%,
from 10% in. For Belarus the index was 20% and 5% respectively (EBRD Report, 2002).
Tabela 1: Private Sector share of GDP 199
1 1992
1993
1994
1995
1996
1997
1998
1999
2000
Private sector share of GDP (in %)
5.0 10.0 40.0 50.0 60.0 75.0 75.0 75.0 75.0 75.0
GDPB growth (in %) -7.2 9.6 8.3 13.3 9.1 -7.0 8.0 7.3 7.0 Growth of private sector contribution to GDP (in % against preceding year)
38.4 10.4 15.9 11.8 -7.5 8.0 8.0 8.0
Graph 1.1: Share of Private Sector in GDP
5 10
4050
6075 75 75 75 75
01020304050607080
1991 1992 1993 1994 1995 1996 1997 1998 1999 2000
Years
Share in %
2
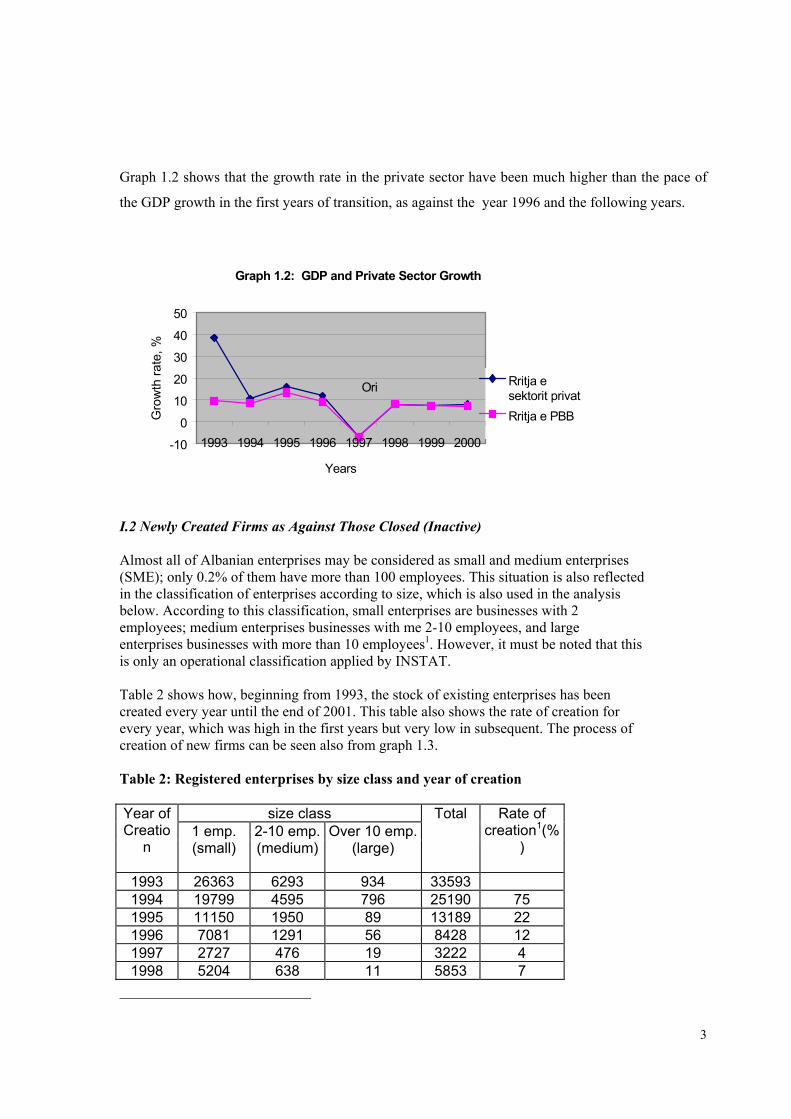
Graph 1.2 shows that the growth rate in the private sector have been much higher than the pace of
the GDP growth in the first years of transition, as against the year 1996 and the following years.
Graph 1.2: GDP and Private Sector Growth
-10
0
10
20
30
40
50
1993 1994 1995 1996 1997 1998 1999 2000
Years
Gro
wth
rate
, %
Rritja esektorit privatRritja e PBB
Ori
I.2 Newly Created Firms as Against Those Closed (Inactive) Almost all of Albanian enterprises may be considered as small and medium enterprises (SME); only 0.2% of them have more than 100 employees. This situation is also reflected in the classification of enterprises according to size, which is also used in the analysis below. According to this classification, small enterprises are businesses with 2 employees; medium enterprises businesses with me 2-10 employees, and large enterprises businesses with more than 10 employees1. However, it must be noted that this is only an operational classification applied by INSTAT. Table 2 shows how, beginning from 1993, the stock of existing enterprises has been created every year until the end of 2001. This table also shows the rate of creation for every year, which was high in the first years but very low in subsequent. The process of creation of new firms can be seen also from graph 1.3. Table 2: Registered enterprises by size class and year of creation
size class Year of Creatio
n
1 emp. (small)
2-10 emp. (medium)
Over 10 emp.(large)
Total Rate of creation1(%
)
1993 26363 6293 934 33593 1994 19799 4595 796 25190 75 1995 11150 1950 89 13189 22 1996 7081 1291 56 8428 12 1997 2727 476 19 3222 4 1998 5204 638 11 5853 7
3
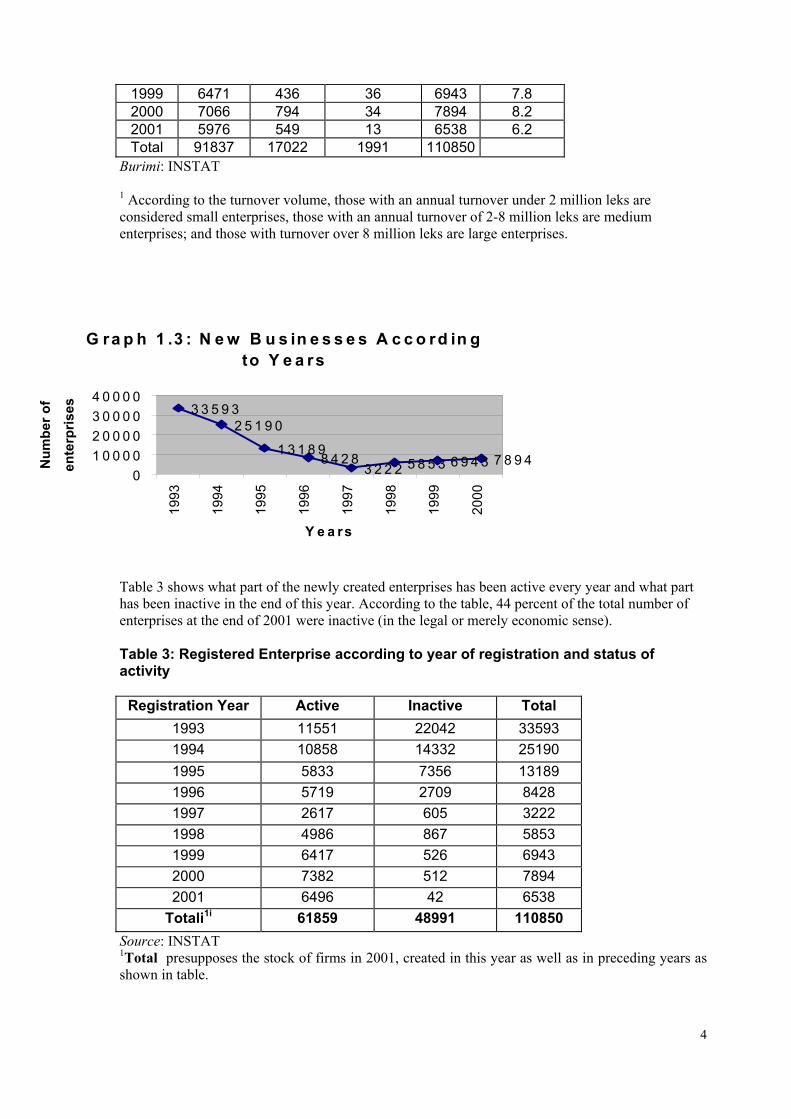
1999 6471 436 36 6943 7.8 2000 7066 794 34 7894 8.2 2001 5976 549 13 6538 6.2 Total 91837 17022 1991 110850
Burimi: INSTAT 1 According to the turnover volume, those with an annual turnover under 2 million leks are considered small enterprises, those with an annual turnover of 2-8 million leks are medium enterprises; and those with turnover over 8 million leks are large enterprises.
G ra p h 1 .3 : N e w B u s in e s s e s A c c o rd in g to Y e a rs
3 3 5 9 32 5 1 9 0
1 3 1 8 98 4 2 8
3 2 2 2 5 8 5 3 6 9 4 3 7 8 9 40
1 0 0 0 02 0 0 0 03 0 0 0 04 0 0 0 0
1993
1994
1995
1996
1997
1998
1999
2000
Y e a rs
Num
ber o
f en
terp
rises
Table 3 shows what part of the newly created enterprises has been active every year and what part has been inactive in the end of this year. According to the table, 44 percent of the total number of enterprises at the end of 2001 were inactive (in the legal or merely economic sense). Table 3: Registered Enterprise according to year of registration and status of activity
Registration Year Active Inactive Total 1993 11551 22042 33593 1994 10858 14332 25190 1995 5833 7356 13189 1996 5719 2709 8428 1997 2617 605 3222 1998 4986 867 5853 1999 6417 526 6943 2000 7382 512 7894 2001 6496 42 6538
Totali1i 61859 48991 110850 Source: INSTAT 1Total presupposes the stock of firms in 2001, created in this year as well as in preceding years as shown in table.
4

Graphs 1.4 and 1.5 show new enterprises per year respectively and their distribution according to size.
Graph 1.4: Number of new enterprises per year
0
5000
10000
15000
1 2 3 4 5 6 7 8 9
Years
Num
ber o
f ent
erpr
ises
Graph 1.5: Distribution of active firms by size, 2001
82%
16% 2%
një punonjës 2-10 punonjës mbi 10 punonjës
Table 4 shows distribution of active enterprises according to size per year and the SME ratio per 1000 inhabitants. Table 4: Distribution of active enterprises according to registration year and size
Group according to size Population SME 5
Registration year
Group according to size (in 1000) Per 1000 inhabitants
1 empl. 2-10 empl.
SME total
Over 10 empl.
1993 8386 2694 11080
22042 3167 3
1994 8179 2307 10486
14332 3202 3
1995 4598 1176 5774 7356 3248 2 1996 4778 898 5676 2709 3283 2 1997 2191 411 2602 605 3324 1 1998 4403 572 4975 867 3354 1 1999 5985 397 6382 526 3373 2 2000 6580 770 7350 512 3401 2 2001 5940 543 6483 42 3087 2 Total 51040 9768 6080
8 48991 (?)
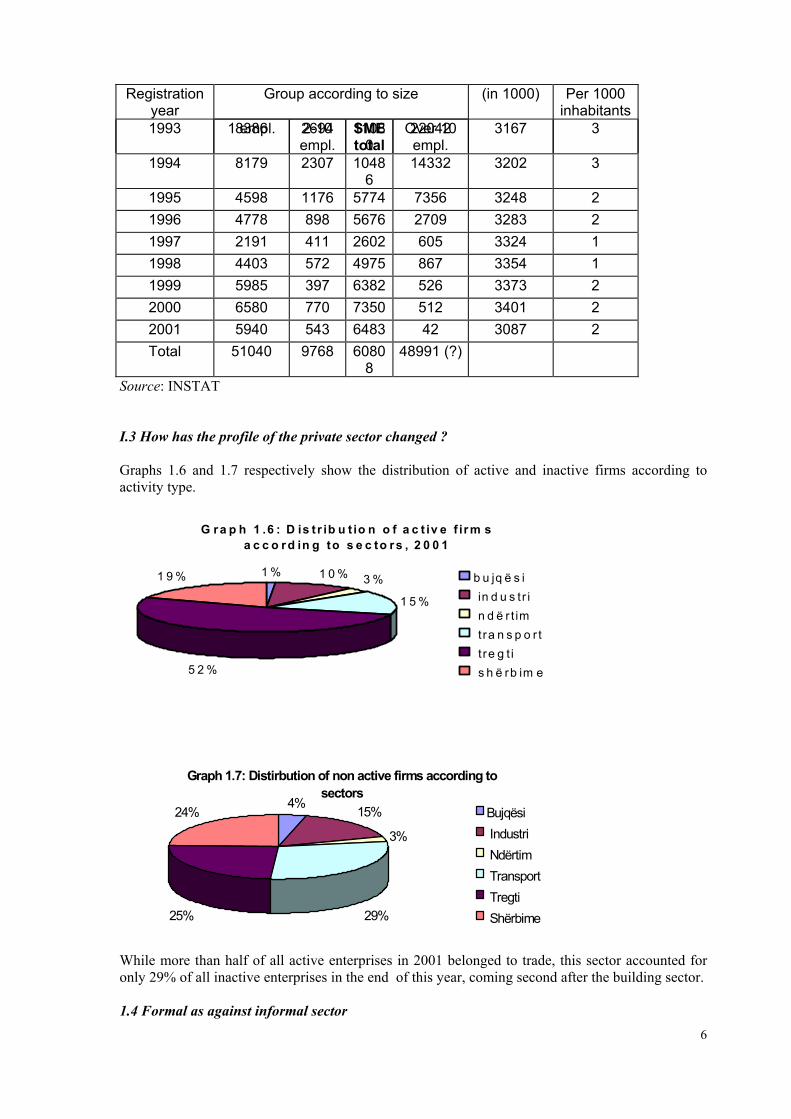
Source: INSTAT I.3 How has the profile of the private sector changed ? Graphs 1.6 and 1.7 respectively show the distribution of active and inactive firms according to activity type.
G ra p h 1 .6 : D is t r ib u t io n o f a c t iv e f irm s a c c o rd in g to s e c to rs , 2 0 0 1
1 % 1 0 % 3 %
1 5 %
5 2 %
1 9 % b u jq ë s i in d u s tr i n d ë r t im tra n s p o r t t re g t i s h ë rb im e
Graph 1.7: Distirbution of non active firms according to sectors
4% 15%
3%
29%25%
24% Bujqësi Industri Ndërtim Transport Tregti Shërbime
While more than half of all active enterprises in 2001 belonged to trade, this sector accounted for only 29% of all inactive enterprises in the end of this year, coming second after the building sector. 1.4 Formal as against informal sector 6
The experience of the countries in transition indicates that the degree of formalization of the economy is positively linked with the degree of reformation of the economy and the stabilization of democratic and regulatory institutions. In particular, institutional weaknesses can be seen as one of the main sources of the informality of the economy in these countries. The experience of these countries, that is, Albania too, indicates that the informal economy and corruption go hand in hand and there is a strong positive correlation between them. The informal economy presupposes that rules are not respected. It includes both legal and unreported (or unaccounted) activities and illegal activities. In general, the types of the informal economy may be classified according to the rules that are violated. It is difficult to measure the informal economy. This calls for the simultaneous use of some methods and the comparing of the relative results. Studies of the informal economy level in Albania give different and contradictory figures. Among them, the 40-60% level seems more credible. However, more exhaustive studies based on comparing the results of different methods are necessary. Generally, the consequences of the formal economy as seen as negative. Among them we can single out:
(1) Distortion of information, which is negatively reflected on building various economic or social policies
(2) Impact on efficiency, (which can be negative when the rules violated are good) (3) Impact on distribution, which comes along with the damage of social cohesion (Edgar I.
Feige, 2001, Katarina Ott, 2002). The dimensions of the informal economy are closely linked with poverty. In the literature is it admitted that the norm of involvement in informal activities is higher both among the poorer and the richer. Questions for discussion: • Is poverty the main generator of the informal economy? Is the informal economy generator of poverty? (Starting point for discussion: Poverty and the informal economy are in positive correlation between them. Still, poverty cannot be the main cause of the informal economy. The informal economy is first of all linked with institutional weaknesses. Likewise, the informal economy does not pull its employees out of poverty. Failure to pay social insurance, the high degree of job insecurity and failure to respect technical provisions at work, low wages, and so on only add to the stagnation of poverty and recycle it. Yet, the informal economy in itself cannot be considered the main cause of poverty, lack of security in employment has an influence, too). • What has been the impact of the informal economy on economic efficiency in Albania? (Negative examples: misallocation of resources, unlicensed buildings.) • Recently there is talk of a fiscal amnesty. What arguments might be put forward in favor of a fiscal amnesty? Or against? What conditions do you think should exist before a fiscal amnesty is carried out? (Starting point for discussion: (1) Setting up an efficient and rigorous taxation system? (2) A clear-cut separation in treating the illegal economy and the criminal activity linked with it from the simply informal economy? (3) Setting up a strong and reliable judicial system? (4) Existence of a spirit of understanding between the government and the opposition?)
II. What is the connection between the development of the private sector and poverty? The inefficient allocation of resources and the low living standards of the broad popular masses were the main economic motives for the transition from a centralized to a market economy.
7
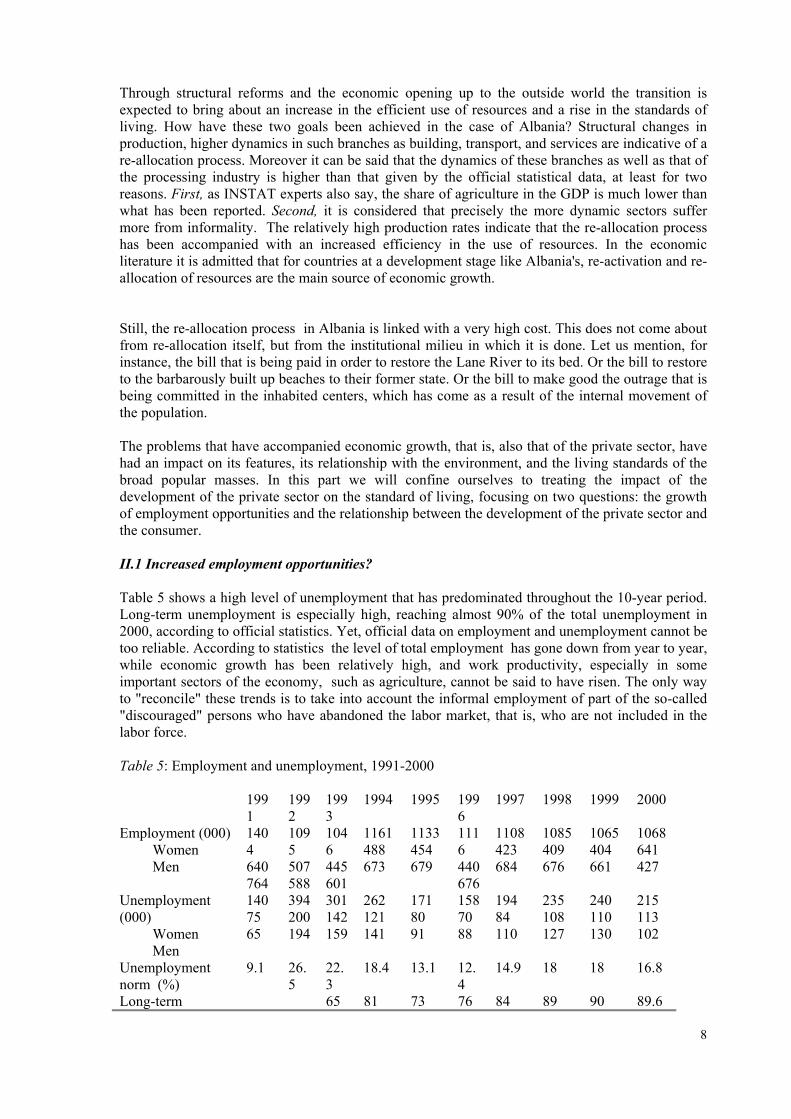
Through structural reforms and the economic opening up to the outside world the transition is expected to bring about an increase in the efficient use of resources and a rise in the standards of living. How have these two goals been achieved in the case of Albania? Structural changes in production, higher dynamics in such branches as building, transport, and services are indicative of a re-allocation process. Moreover it can be said that the dynamics of these branches as well as that of the processing industry is higher than that given by the official statistical data, at least for two reasons. First, as INSTAT experts also say, the share of agriculture in the GDP is much lower than what has been reported. Second, it is considered that precisely the more dynamic sectors suffer more from informality. The relatively high production rates indicate that the re-allocation process has been accompanied with an increased efficiency in the use of resources. In the economic literature it is admitted that for countries at a development stage like Albania's, re-activation and re-allocation of resources are the main source of economic growth. Still, the re-allocation process in Albania is linked with a very high cost. This does not come about from re-allocation itself, but from the institutional milieu in which it is done. Let us mention, for instance, the bill that is being paid in order to restore the Lane River to its bed. Or the bill to restore to the barbarously built up beaches to their former state. Or the bill to make good the outrage that is being committed in the inhabited centers, which has come as a result of the internal movement of the population. The problems that have accompanied economic growth, that is, also that of the private sector, have had an impact on its features, its relationship with the environment, and the living standards of the broad popular masses. In this part we will confine ourselves to treating the impact of the development of the private sector on the standard of living, focusing on two questions: the growth of employment opportunities and the relationship between the development of the private sector and the consumer. II.1 Increased employment opportunities? Table 5 shows a high level of unemployment that has predominated throughout the 10-year period. Long-term unemployment is especially high, reaching almost 90% of the total unemployment in 2000, according to official statistics. Yet, official data on employment and unemployment cannot be too reliable. According to statistics the level of total employment has gone down from year to year, while economic growth has been relatively high, and work productivity, especially in some important sectors of the economy, such as agriculture, cannot be said to have risen. The only way to "reconcile" these trends is to take into account the informal employment of part of the so-called "discouraged" persons who have abandoned the labor market, that is, who are not included in the labor force. Table 5: Employment and unemployment, 1991-2000 199
1 1992
1993
1994 1995 1996
1997 1998 1999 2000
Employment (000) Women Men
1404 640 764
1095 507 588
1046 445 601
1161 488 673
1133 454 679
1116 440 676
1108 423 684
1085 409 676
1065 404 661
1068 641 427
Unemployment (000) Women Men
140 75 65
394 200 194
301 142 159
262 121 141
171 80 91
158 70 88
194 84 110
235 108 127
240 110 130
215 113 102
Unemployment norm (%)
9.1 26.5
22.3
18.4 13.1 12.4
14.9 18 18 16.8
Long-term 65 81 73 76 84 89 90 89.6
8

unemployment in % as against employment total Source: INSTAT Table 6 shows the sector composition of employment according to years. Employment in the private sector, which was non-existent in the years before the transition, rose over 80% in 2000. Yet, here too there is something strange about the statistical data: employment in the private farming sector has gone on growing from year to year, regardless of the massive migration of the population from rural to urban areas. The decrease of employment in the public sector (which is easily measurable) might be expected to be accompanied with the growth of employment in the private non-farming sector, which is not apparent in official statistics. The conclusion would be that employment in this sector has been overvalued. The growth in the private non-farming sector should have had a more important impact on employment than that reported. Table 6: Employment according to sectors (in %) 199
1 1992
1993
1994
1995 1996 1997 1998 1999 2000
Total employment
100 100 100 100 100 100 100 100 100 100
Public sector 60.5 56.1
35.9
26.5
24.2 21.4 20.4 19.6 18.9 17.9
Cooperative sector
37.0 38.4
- - - - - - _ _
Agriculture Private farming sector
- - 56.4
64.5
65.9 68.2 68.7 70.1 71.5 71.2
Agriculture Private non-farming sector
2.1 5.4 7.6 8.9 9.9 10.4 10.9 10.3 9.6 10. 9
Source: INSTAT; Report on Human Development in Albania, 1998, 2000. Graphs 2.1 and 2.2 compare distribution of employment according to sectors in 1992 and 2000.
Graph 2.2: Employment according to sectors, 1992
56.1
38.4
5.40
Sektori publik
Sektorikooperativist Bujqësia
Sektori privat jobujqësor
9

G raph 2 .1: Em ploym ent accord ing to sectors, 2000
17.90
71 .2
10.9sektori pub lik
sekto rikoopera tiv is t sekto ri p riva tbu jqësor sekto ri p riva t jobu jqesor
Table 7 shows the share of small, medium, and large enterprises in total employment in the private non-farming sector and in total employment in 2001. For the SME these indices would be 43% 7,6%, respectively. Table 7: SME's share in total employment, 2001 Groups of firms Number of
firms Employment Share of
employment of each group in total employment of all groups in %
Share of employment of each group in total employment in %
Small enterprises 51040 51040 27 4.8 Medium enterprise 9768 30727 16 2.8 SME (small +medium) 60808 81767 43 7.6] Large enterprises (over 10 employees)
1051 108519 57 10.2
Total 61859 190286 100 17.8 Total employment in country
1068000 100
Source: INSTAT
G r a p h 2 .3 : S h a r e o f e a c h e n te r p r is e g r o u p in th e to ta l e m p lo y m e n t in th e p r iv a te n o n
fa r m in g s e c to r , 2 0 0 1
2 7 %
1 6 %5 7 %
n jë p u n o n jë s
2 -1 0 p u n o n jë s
m b i 1 0p u n o n jë s
However, in order to see the connection between the development of the private sector and increased employment opportunities, especially for the poorer strata of the population, a more microeconomic approach, focused rather on special regions or cities, would be more necessary. According to official data, if the general level of unemployment in 2000 was xxx%, in such districts as that of Kurbin, the xxx unemployment norm reached xxx%. Xxxx Further on, the countryside has been excluded from the official unemployment indices. However, the very small size of farms in the countryside and the very small charge of ha/person suggest a high level of concealed unemployment in the rural areas. II.2 Private sector and consumer
10
The development of the private sector along with Albania's economic opening up to the world have been accompanied with important effects for the Albanian consumer. If in the past system the gap between people's needs and the possibilities of their fulfillment was filled under pressure and narrowing the circle of needs through attempts at "Lei-Fenization" people through ideological instruments, Albania's opening up to the outside world and the development of the private sector were accompanied by an explosive expansion of the circle of needs. Now the Albanian citizen wants a comfortable life comparable to that of the neighboring countries. And there is no reason to believe that this trend will change. Questions for discussion: a) What are the effects accompanying the strong tendency of needs to increase? (Starting point for
discussion: First of all through the efforts of every family to increase possibilities for fulfillment of its needs in the shortest time possible. The still strong tendency to emigration, in many cases even at a high cost, is an expression of the impelling power of the increased needs.)
b) Is the impelling power of increased needs translated into impelling power of economic growth? c) Have emigration and enterprise been developing as replacements or complements of each
other? (or both, for example, first as replacement and then as complement?) d) What has the relationship been between increased income with increased consumption? Or its
structure? (Along with the income produced within the country which has grown also in real terms for the best part of the period, emigrants' remittances have been among the main factors of economic growth. Emigrants' remittances have also had an impact on the consumption structure. Changes in the consumption structure are also a result of the broadening range of production and services provided by private enterprises.)
e) Where is broadening of services to consumers expressed?
Examples: • Communication services • Transport services, etc.
f) Is the development of the private sector accompanied by broader possibilities of choice for the consumer? Examples:
• Free movement of citizens and housing • Needs for food, clothing, and other commodities
g) What relationship is there between increased possibilities of choice, that is, qualitative upgrading of goods and services, with price rises? Do price rises impose lower possibilities of choice for the poor strata of the population? Examples: Clothing, transport.
III. What policies and instruments support development of private? Despite reservations about official statistics in connection with the weight of the private non-farming sector in the GDP and general employment, the relatively low levels of these indices, the high figures of both absolute and relative poverty2 , the especially worrying extension of poverty in some areas of the country, the low competition capability of the local business on international markets, also reflected in the very high level of the trade deficit, speak of the need for better studied and more effective policies to encourage and support private businesses and to ensure a higher degree of involvement in economic growth.
2 According to GPRS,zzzzzzzzz 11
As said above, the creation rate of new businesses is relatively low. Likewise, the index of direct foreign investments is also low3. What can be done to improve the climate for private investments? What economic support should the government give private business? III.1 How the climate for private investments can be improved? Creation of a private business can be realized only by private enterprise. It is exclusively the private entrepreneur that will decide whether he will set up a business or in what branch he will invest, always market-oriented. Is there place for the role of the state here? The state can and must help in creating a stimulating climate for private enterprise. In what manner? Let us see the problem from the standpoint of the potential entrepreneur. What a businessman reckons before engaging in a private enterprise? The existence of a market (branch) with a stable, possibly rising, demand that guarantees
income, that is, considerable profit. Can this be a government responsibility? (No. It is a direct responsibility of the entrepreneur. However, the government can help by taking upon itself the encouragement of processing and distribution of adequate information. Basic information about market development trends, development trends of the economy in general, and its individual branches in particular must be considered as public facilities. In this manner the government contributes to an efficient allocation of resources. It is the responsibility of the government to ensure as broad access to it as possible. Moreover, a responsibility of the government is also the reliability of the basic information produced by its institutions. Lastly, the government can contribute to encouraging the setting up of specialized business consultative centers. How is their situation in this direction? What problems are there and what can be done more and better?)
Existence of a market with a high degree of access freedom. This means that there should be
as few as possible economic and legal obstacles for accessing the market. Economic obstacles mean a degree of monopoly of the relevant markets. It is the responsibility of the government to ensure competitive conditions on the market, and not allow its monopolization. How is the situation on the Albanian markets in this direction? How effective, complete, and operational are the law on competition and the law against monopolies? Are the institutional capacities at the Ministry of the Economy sufficient to enforce these laws?
Existence of clear market game rules. The formalization of commercial transactions is in the
interest of the sides involved in the transaction. In this manner business risks are perceptibly lowered. How much commercial transactions are regulated through formalized contracts in our country? How can they be made compulsory? Solution of differences through legal channels becomes indispensable when there is no other way. However, this is costly. Hence, extra-judicial solutions would be preferable from every standpoint. What mechanisms are there for the extra-judicial solution of differences?
Clear ownership rules, which is another important factor that a would-be entrepreneur is bound
to take into consideration. The responsibility of the state institutions in this direction is complete. Procrastination and unclarity about the restoration of property to its former owners has a high cost for the business.
Possibilities of financing investment, which make up one of the main preoccupations of the
entrepreneur. Of course, finding ways of financing is the entrepreneur's responsibility. It is not the government's responsibility to finance private business. The responsibility of the government and other relevant institutions is to encourage the creation of a favorable climate for the activity of private financial institutions and lower investment costs. The degree of investment crediting is an expression of the degree of dynamism of the economy.
3 According to EBRD, direct foreign investments in the period 1992-2002 were xxxxxxxx respectively. 12

• How is the situation of investment financing in Albania? ((1) There is a high degree of self-financing. (2) There is still a high degree of informal financing, regardless of the bitter experience of the pyramid fraudulent schemes. (3) There is a low level of crediting on the part of banking institutions.
• Why there is a low level of crediting on the part of banking institutions? (1) Is there a low availability of capital on the part of the financial institutions? (No. Data speak of the contrary. The index of the ratio credit-deposits for the banking system in general is very low. xxxxxx . the index of deposits of secondary level banks in foreign banks is very high. Both these indices speak of unexploited crediting possibilities) (2) Is there a low demand for credits? (Partially. Almost half of the interviewed in a survey conducted by the Ministry of the Economy in July 199 said that high interest norms or other conditions of crediting such as high demands for collateral, etc. are the main obstacle for obtaining credits from the banks. On the other hand, the use of other ways of financing, as happens with the building firms, has also an impact on lowering the demand for credit. Still, the situation of the demand for credit cannot fully explain the situation in the crediting field. In all cases, the demand for credits is much higher than the crediting. Xxxxx. (3) Is the offer of credits low? (Partially. The alternative ways of investment, especially buying treasury bonds, is more profitable for the banks, or at least less risky. The risk of crediting, especially for certain branches and regions, is still considered high by the banks. For various reasons, many businessmen are not completely reliable to the banks. The territorial extension of the banking institutions, despite the steps taken more recently, is still limited. The Savings Banks, which has a broad extension, actually does not function as a crediting institution. )
• What can the government (or other relevant institutions) do to encourage the financing of business? (1) Direct subsidization? (As a rule, no. The government can and must directly finance the infrastructure that serves the economy in general). (2) Direct crediting? (Again, no.) (3) Guaranteeing SME credits? Insurance against political risk? (It is envisaged to set up the Fund for Guaranteeing Credits2 and re-activating the Funds of Development in favor of the SMEs. It would be a difficult enterprise, with uncertain results.) (4) Efforts to lower the degree of risk through increasing security in the country? Efforts to create conditions for the extension of the financial institutions to the whole territory of the country? Orienting monetary policies toward lowering investment costs? Efforts to orient the crediting lines of financial institutions, local or international, to financing the SMEs? Efforts to create an effective capital market? (Yes, as well as other similar policies).
Costs of the implementation of registration and licensing procedures. These costs are in
indirect proportion to the size of the enterprise. They weigh heavier on medium and small enterprises, and especially on microbusinesses. They are intertwined with corruption manifestations that are found in all the links of the system. Can they be simplified further, especially for the SMEs and microbusinesses? Especially, registration procedures? Is it possible for part of "certificates" to be transferred from the relevant institutions to the taxation offices, thereby freeing the subject of these costs?
III.2 What sort of support can the government give private business? In general, the government can exercise an influence on the improvement of the investment climate and the development of the private business, especially the SMEs, (I) by establishing an adequate, clear and stable regulatory system and implementing it in an equal and correct manner, thereby eliminating unfair competition and the pressure coming from the informal economy; (II) by exercising rigorous efforts to deepen reforms, especially the institutional ones; by cutting down on bureaucratic costs and striking at manifestations of corruption; by stemming illegal trafficking and
2 Medium-term strategy for the development of small and medium enterprises. 13

limiting the informal economy; (III) by making investments to improve the economic infrastructure; (IV) by supporting the setting up of an efficient information and consultation network for the business; (V) by supporting training programs for the SMEs, especially new businesses; (VI) by encouraging the crediting of the SMEs. In particular, a positive and comprehensive development of the private sector would call for a better orientation of supporting policies precisely where major problems exist, in the poorer areas and among the poorer strata of the population. Support policies should be aimed at mobilizing community sources of development through the inclusion of the poorer strata of the population. Realization of this goal would call for serious involvement of the local government in drafting and implementing these policies.
IV. How can the poor profit more from the growth of private business? IV. 1 Increased possibilities of participating in economic activities
• Active employment policies? (Their limitation must be acknowledged. They suffer from ineffectiveness and inefficiency. The relative funds could be used better for vocational training and re-training.. Efforts might be made to encourage the creation of community colleges according to the American experience, which apart from the practical vocational schooling of the young generation would also very well be linked with the community in implementing programs of training and re-training). • Microcrediting? (Despite its modest results, it is proving efficient and well-oriented toward the strata in need.). Likewise, in some cases it is also being tested as a means to encourage the coordination of efforts and forces of groups of people with a view to creating joint businesses. It is helping the better identification of community interests.
IV.2 Offer of services by the private sector Private initiative is also making itself felt in such important activities as the health service, education, transport, housing, etc. In some of them, like housing and to a certain extent, transport, private initiative is already playing a dominant role. The role of private initiative is increasing in education and recently also in higher education. In the health service, perceptible progress has been made in those services that are offered by the private initiative, such as dentistry, etc. Water and power supply, which are also the more problematic services, have proved more "resistant" to the private initiative. The cost and shortcomings of these services weigh heavy especially on the poorer strata of the population. Although both these sectors need state regulation, the definitive solution of their problems cannot be achieved without the intervention of private initiative. Serious problems exist also in the health service, especially in those services in which private initiative has been more sluggish. What would the further privatization of health services bring? What is the relationship between privatization (or non-privatization) with corruption in this sector? What role should the state play or step up? Literature
Medium-term strategy for the development of small and medium enterprises
14

15
Katarina Ott, The Underground Economy in Croatia, occasional paper No. 12, March 2002)
INSTAT statistical bulletins
Reports by the Bank of Albania
Reports by EBRD, 200, 2001
The Strategy for Economic and Social Development (GPRS)
Results of Living Standards Survey October 1998, INSTAT
World Bank, Transition, the First Ten Years