private sector house condition survey 2006€¦ · newark and sherwood district council private...
TRANSCRIPT
Private Sector House Condition Survey 2006
March 2007
Newark and Sherwood District Council working in partnership with
Newark and Sherwood District Council Private Sector House Condition Survey March 2007
Contents 1 Executive Summary................................................................ 5
1.1 Stock profile ..................................................................... 5 1.2 Profile of residents............................................................. 5 1.3 The Decent Homes Standard............................................... 6 1.4 Unfitness and the Housing Health and Safety Rating System ... 6 1.5 Repair costs...................................................................... 7 1.6 Modern facilities ................................................................ 7 1.7 Thermal comfort and energy efficiency ................................. 8 1.8 Occupiers, Housing Condition & Environment......................... 8
2 Introduction......................................................................... 10 2.1 The Derby / Nottinghamshire Consortium ........................... 10 2.2 Purpose of the survey ...................................................... 10 2.3 Nature of the survey........................................................ 12 2.4 ODPM Guidance on house condition surveys........................ 13 2.5 Comparative statistics...................................................... 14 2.6 Sub-area analysis............................................................ 14 2.7 Statistical variance and standard deviation.......................... 16 2.8 Presentation of figures ..................................................... 16
3 Profile of the housing stock.................................................. 17 3.1 Size of the dwelling stock ................................................. 17 3.2 Age of the dwelling stock.................................................. 17 3.3 Dwelling type profile ........................................................ 17 3.4 Tenure........................................................................... 18 3.5 Tenure and age comparisons............................................. 19 3.6 Dwelling use and Houses in Multiple Occupation................... 19 3.7 Vacant dwellings ............................................................. 20
4 Profile of Residents .............................................................. 22 4.1 Introduction ................................................................... 22 4.2 Age profile...................................................................... 22 4.3 Household types.............................................................. 22 4.4 Income .......................................................................... 23 4.5 Income and age of head of household ................................ 24 4.6 Income and household type .............................................. 25 4.7 Income and residents with disabilities ................................ 26 4.8 Benefit receipt ................................................................ 26 4.9 Value of dwellings and equity ............................................ 27 4.10 Repairs and affordability ................................................ 28 4.11 Crime and security........................................................ 28 4.12 Residents with disabilities .............................................. 29 4.13 Ethnic origin ................................................................ 30 4.14 Residents’ attitude towards their area.............................. 32
2
Newark and Sherwood District Council Private Sector House Condition Survey March 2007
4.15 Moving and formation of new households ......................... 32 5 The Decent Homes Standard ................................................ 34
5.1 Introduction ................................................................... 34 5.2 Change of emphasis and the Housing Act 2004.................... 35 5.3 General Characteristics .................................................... 35 5.4 Reasons for non decency .................................................. 38 5.5 Numbers of failures per dwelling........................................ 39 5.7 Cost to Remedy .............................................................. 39 5.6 Private sector vulnerable occupier base-line ........................ 40
6 Unfitness and Category One Hazards ................................... 43 6.1 Requirement to remedy poor housing................................. 43 6.2 Reporting on the two standards......................................... 43 6.3 Definition of unfit dwellings............................................... 43 6.4 Definition of hazards under the HHSRS and Category level .... 44 6.5 Overall dwelling conditions................................................ 46 6.6 Reasons for unfitness and Category One Hazards................. 46 6.7 Severity of unfitness and Category One Hazards .................. 47 6.8 Overlap between Category 1 hazards and unfitness.............. 48 6.9 Unfitness & Category One Hazards by general characteristics 49 6.10 Cost of works to unfit dwellings & Category One Hazards ... 52
7 State of Repair ..................................................................... 54 7.1 Improving the stock......................................................... 54 7.2 Cost calculation............................................................... 54 7.3 Remedial repair works in non decent dwellings .................... 55 7.4 Comprehensive repair works in non decent dwellings............ 56 7.5 Overall repair costs.......................................................... 57 7.6 Repair costs and general characteristics.............................. 57 7.7 Cost of repairs by area..................................................... 59
8 Modern Facilities .................................................................. 60 8.1 Introduction ................................................................... 60 8.2 Key basic amenities ......................................................... 60 8.3 Key amenities bathrooms and kitchens............................... 61
9 Thermal Comfort and Energy Efficiency................................ 63 9.1 Thermal comfort failures .................................................. 63 9.2 Energy efficiency and SAP ratings ...................................... 64 9.3 Distribution of SAP ratings ................................................ 64 9.4 SAP by general characteristics........................................... 65 9.5 Energy efficiency improvement.......................................... 67 9.6 The cost and extent of improvement .................................. 68 9.7 Future improvement ........................................................ 69 9.8 Tackling fuel poverty........................................................ 69 9.9 Sub-area focus on fuel poverty.......................................... 70 9.10 Beyond fuel poverty ...................................................... 71 9.11 Energy efficiency works to all other dwellings ................... 71 9.12 Achieving the 30% target .............................................. 72
3
Newark and Sherwood District Council Private Sector House Condition Survey March 2007
10 Occupiers housing condition & environment ........................ 73 10.1 Relationships between factors ........................................ 73 10.2 Age of Head of Household and condition .......................... 73 10.3 Household income, benefit receipt and dwelling condition... 75 10.4 Residents with disabilities and residents in ill health .......... 76 10.5 Occupier health and dwelling condition ............................ 80 10.6 Environmental factors ................................................... 81
Appendix A - Index of tables and figures ................................ 82 Appendix B - Methodology ...................................................... 84 Appendix C - Survey Sampling ................................................ 87
Sample Design ....................................................................... 87 Stock total ............................................................................. 87 Response rates ....................................................................... 88 Weighting the data.................................................................. 88 Dealing with non-response ....................................................... 88 Sampling error ....................................................................... 90
Appendix D - Definition of a Non Decent Home ....................... 91 Measure of a decent home ....................................................... 91 Applying the standard.............................................................. 91
4
Newark and Sherwood District Council Private Sector House Condition Survey March 2007
1 Executive Summary
1.1 Stock profile
1.1.1 The private sector housing stock in Newark and Sherwood is more modern than the national average. In terms of dwelling type, Newark and Sherwood has higher proportions of detached houses and bungalows, and lower proportions of terraced houses and flats. There are considerably more owner occupied dwellings than average in Newark and Sherwood and the proportion of privately rented dwellings is only half the national average.
1.1.2 The proportions by dwelling age, tenure and dwelling type indicate a stock profile associated with better than average dwelling conditions overall.
1.1.3 There are very few Houses in Multiple Occupation (HMO) in Newark and Sherwood and of these only an estimated 40 will be subject to mandatory licensing, for which the authority has a responsibility to provide such licenses.
1.1.4 There are an estimated 740 empty dwellings, 1.8% of the private housing stock, which is lower than the national average of approximately 3%. There are an estimated 460 long term vacant properties (vacant for more than 6 months). At 1.1% of the stock, this represents a significant issue and a clear priority for future housing strategy. Under the Housing Act 2004, local authorities have increased powers and responsibilities in relation to empty properties.
1.2 Profile of residents
1.2.1 The household types and average incomes within Newark and Sherwood indicate an area with an above average proportion of older occupiers and a consequently above average proportion of low incomes and benefit receipt. This combination of circumstances, to some extent, off-sets the stock profile with regard to an expectation of good dwelling conditions. This is due to the capacity to carry out and afford repairs by such households.
1.2.2 House prices are well below the national average. Affordability of housing for younger residents and first time buyers is highly likely to become an issue for those with lower income levels in the relevant age groups and there are also likely to be concerns regarding necessary repairs/improvements for older residents who are “equity rich but cash poor”.
5

Newark and Sherwood District Council Private Sector House Condition Survey March 2007
1.2.3 The great majority of households (96.1%) described themselves as White British. The largest single ethnic minority group are households that describe themselves as White Other (1.6%).
1.2.4 The overall levels of household income and benefit receipt have a bearing on the affordability of repairs, meeting decent homes targets, vulnerability and fuel poverty.
1.3 The Decent Homes Standard
1.3.1 An estimated 13,390 dwellings in Newark and Sherwood (32.6% of the private sector stock) are non decent. This compares with the national average of 30.2% (although the national figure uses the former Housing Fitness Standard rather than the new Housing Health and Safety Rating System (HHSRS), and the fitness standard tends to produce a lower figure).
1.3.2 The most common reason for non decency is poor thermal comfort (9,600 dwellings; 23.3% of the stock, compared with 26.3% at national level). Failures due to an inadequate state of repair were the next largest group which occurs at a rate of 10.2% followed by failures due to Category 1 hazard at 9.9%. The lowest level of failure is for dwellings lacking adequate modern facilities at 1%. (This is also the lowest category nationally.)
1.3.3 In Newark and Sherwood non decent dwellings are most associated with pre-1919 properties; the private rented sector; converted and low-rise flats. The highest rate of non decency is found in the North West area, and the lowest in Newark South.
1.3.4 Local authorities are required to meet targets under Public Service Agreement (PSA7) to reduce the number of vulnerable occupiers in non decent, private sector dwellings. The targets are 65% for the year end 2005/06 and 70% for the year end 2010/11. At present it is estimated that in Newark and Sherwood 62.3% of vulnerable households live in decent homes, meaning that the target is not met for 2005/06 with a shortfall of approximately 250 dwellings. The estimated shortfall to the 70% target is 710 dwellings. The above average proportion of vulnerable occupiers is an important factor in this result, given a roughly average level of non decency overall.
1.4 Unfitness and the Housing Health and Safety Rating System
1.4.1 The overall rate of unfitness of 3.2% (1,320 dwellings) in private sector housing across Newark and Sherwood is above the proportion of unfit dwellings in England (4.6%). Since the new Housing Health and Safety Rating System has replaced the Fitness Standard from April 2006, the proportion of dwellings with a Category 1 hazard has become the more significant figure. At present 4,060 (9.9%) dwellings are estimated to have at least one Category 1 hazard.
6
Newark and Sherwood District Council Private Sector House Condition Survey March 2007
1.4.2 Both unfitness and Category 1 hazards are associated with pre-1919 properties; privately rented dwellings; and converted flats, as is typically the case.
1.4.3 The highest rates of unfitness is found in the North East sub-area and highest rate of category 1 hazards are to be found in Newark North, with the second highest rate of category 1 hazards in the Southwell & South area.
1.4.4 As the Housing Fitness Standard and the Housing Health and Safety Rating System operate on two different principles, it is not surprising that there is only a 13.9% overlap between the two (although this figure is much higher than commonly found). The consequence for the Council is that there will be 570 dwellings to deal with under the Housing Health and Safety Rating System which are not currently unfit.
1.5 Repair costs
1.5.1 Improving the repair condition of dwellings is also a key requirement of the new Decent Homes Standard. Originally Government targets applied only to the publicly rented sector but now apply to all dwellings in the private sector where a vulnerable occupier lives.
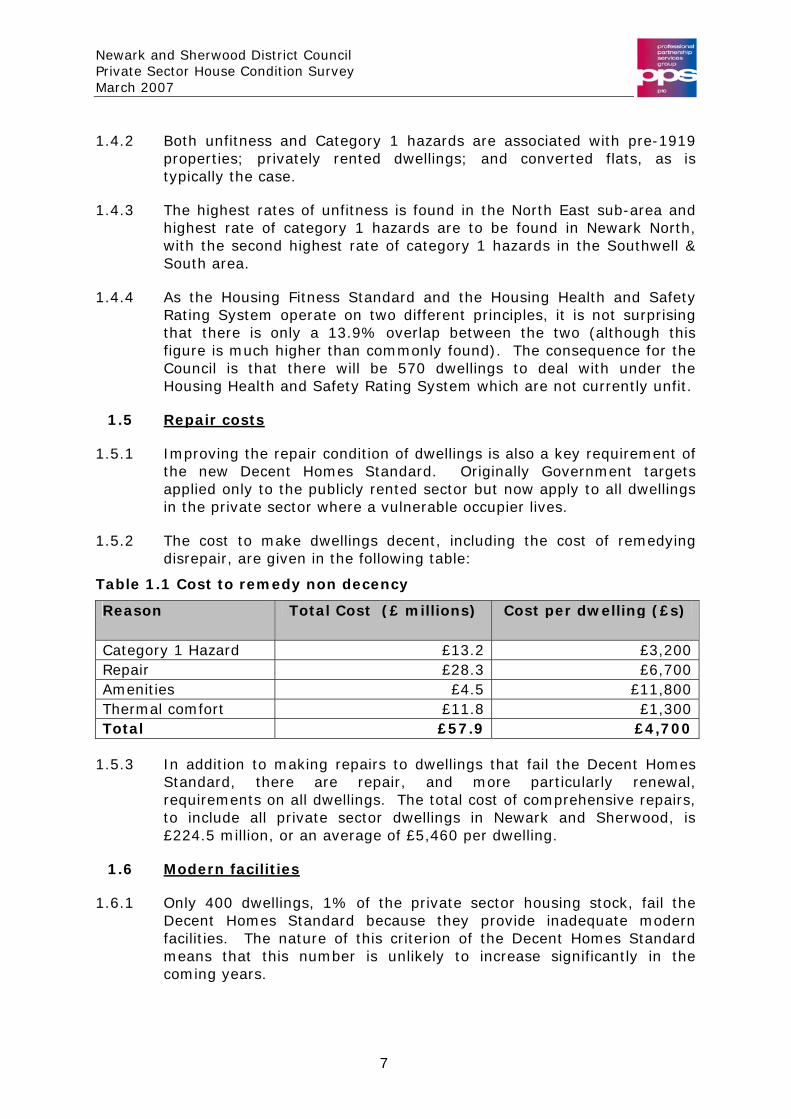
1.5.2 The cost to make dwellings decent, including the cost of remedying disrepair, are given in the following table:
Table 1.1 Cost to remedy non decency
Reason Total Cost (£ millions) Cost per dwelling (£s)
Category 1 Hazard £13.2 £3,200 Repair £28.3 £6,700 Amenities £4.5 £11,800 Thermal comfort £11.8 £1,300 Total £57.9 £4,700
1.5.3 In addition to making repairs to dwellings that fail the Decent Homes Standard, there are repair, and more particularly renewal, requirements on all dwellings. The total cost of comprehensive repairs, to include all private sector dwellings in Newark and Sherwood, is £224.5 million, or an average of £5,460 per dwelling.
1.6 Modern facilities
1.6.1 Only 400 dwellings, 1% of the private sector housing stock, fail the Decent Homes Standard because they provide inadequate modern facilities. The nature of this criterion of the Decent Homes Standard means that this number is unlikely to increase significantly in the coming years.
7
Newark and Sherwood District Council Private Sector House Condition Survey March 2007
1.6.2 The vast majority of dwellings in Newark and Sherwood (99%) have a provision of basic amenities: an internal W.C., an adequate kitchen, an adequate bathroom, an electrical supply and the provision of hot and cold water.
1.7 Thermal comfort and energy efficiency
1.7.1 Tackling fuel poverty is a key target for the Authority as it aids those residents most in need, as well as improving thermal comfort (required under the Decent Homes Standard). It also potentially reduces the number of dwellings that are unfit or where a Category 1 hazard exists. There are estimated to be 7,650 (18.6%) dwellings in fuel poverty within Newark and Sherwood.
1.7.2 Focusing particularly on dwellings with younger heads of household, dwellings with benefit recipients, households on low incomes, and the privately rented stock, will have the biggest impact on reducing fuel poverty. The Council will have to consider how to encourage landlords to improve the energy efficiency of their dwellings in the private rented sector.
1.7.3 The average energy efficiency level in Newark and Sherwood, using the government’s Standard Assessment Procedure (SAP), is 55 (on a scale of 1 to 120). This is somewhat above the all England average of 51 from the 2003 EHCS.
1.7.4 Achieving targets for improving energy efficiency is likely to be difficult, though possible, but will need to involve all dwellings that can have improvements made.
1.7.5 In general, mains gas is widespread (available to over 87% of homes) and gas central heating is common. This will be one of the factors in the SAP rating exceeding the national average.
1.8 Occupiers, Housing Condition & Environment
1.8.1 The highest rates of non decency are found in properties where the head of household is aged between 75 and 84 years, followed by those aged 25-34 years. This follows the usual trend of an association with the most vulnerable occupiers, who tend to be on the lowest incomes, at either end of the age range.
1.8.2 There were elevated levels of Category 1 hazards, disrepair and fuel poverty in dwellings occupied by older heads of household. The results indicate issues of affordability and ability to maintain dwellings with older households, and issues relating to property condition in privately rented dwellings occupied by young households.
1.8.3 In addition, the same key characteristics, indicating poor dwelling conditions, were found to present above average levels for dwellings
8
Newark and Sherwood District Council Private Sector House Condition Survey March 2007
occupied by those in receipt of benefit and those where a resident in ill health or with a disability live.
1.8.4 The survey identified approximately 4,780 dwellings in Newark and Sherwood with one or more residents with a disability (11.6% of the stock). Allowing for the impact of means testing, the cost of potential works of adaptation was estimated to be £3.9 million.
1.8.5 In terms of their environment, the most prevalent issue that residents highlighted was the presence of litter, followed by noise, dogs and vandalism.
9
Newark and Sherwood District Council Private Sector House Condition Survey March 2007
2 Introduction
2.1 The Derby / Nottinghamshire Consortium
2.1.1 This report presents the finding of one element of a unique study into the condition of the private sector housing stock of the East Midlands. A major project is being undertaken to map and monitor private sector housing conditions across the region, drawing on local stock condition surveys, national data, geographic mapping tools and a variety of other data sources.
2.1.2 Within the wider regional context a decision was made to commission a joint private sector housing stock condition survey across nine local authorities. The eight authorities within Nottinghamshire as well as Derby commissioned the joint study to provide a common methodology and common reporting framework in order that findings of the surveys are comparable at this sub-regional level.
2.1.3 This report presents the findings of the survey conducted within Newark and Sherwood, upon the private sector (owner-occupied and privately rented) dwelling stock.
2.2 Purpose of the survey
2.2.1 Section 605 of the Housing Act 1985 (as amended) placed a duty on local authorities to consider the condition of the stock within their area in terms of their statutory responsibilities to deal with unfit housing and to provide assistance with housing renewal. Section 3 of the Housing Act 2004 replaced this with a similar duty to keep housing conditions under review. In 2005 Newark and Sherwood District Council (as part of the wider consortium described above) commissioned a comprehensive House Condition Survey to address this legal requirement, and also to inform the housing strategy and other housing policies. The house condition survey was conducted in summer 2006.
2.2.2 The Regulatory Reform (Housing Assistance) (England and Wales) Order 2002 came into effect on the 19 July 2003 and led to major change in the way local authorities can give financial help for people to repair or improve private sector homes. Before the Order, the Government set clear rules which controlled the way financial help could be given and specified the types of grant which could be offered. The Order set aside most of these rules (apart from the requirement to give mandatory Disabled Facility Grants). It now allows local authorities to adopt a flexible approach, using discretion to set up their own framework for giving financial assistance to reflect local circumstances, needs and resources.
10
Newark and Sherwood District Council Private Sector House Condition Survey March 2007
2.2.3 The ODPM published guidance under Circular 05/2003. In order to use the new freedom, a local authority must prepare and publish a Private Sector Renewal Strategy. The strategy must show that the new framework for financial assistance is consistent with national, regional and local policies. In particular, it has to show that the local priorities the strategy is seeking to address have been identified from evidence of local housing conditions including stock condition.
2.2.4 The Housing Act 2004 received Royal Assent in November 2004. The Act makes a number of important changes to the statutory framework for private sector housing, which came into effect in April 2006:
• The existing fitness standard and the enforcement system have been replaced by the new Housing Health and Safety Rating System (HHSRS).
• The compulsory licensing of higher risk houses in multiple occupation (three or more storeys, five or more tenants and two or more households).
• New discretionary powers including the option for selective licensing of private landlords, empty dwelling management orders and tenancy deposit protection.
2.2.5 Operating Guidance was published on the Housing Health and Safety Rating System in November 2005. This guidance describes the new system and the methods for measurement of hazards, as well as the division of category 1 and 2 hazards. Interim guidance has been issued by the ODPM (now DCLG) on the licensing provisions for HMOs, which describes the high risk HMOs that will require mandatory licensing and those that fall under additional, voluntary licensing. Full guidance is expected shortly.
2.2.6 Reference will be made throughout this report to data based on both the existing Housing Fitness Standard and the HHSRS. Because of its recent replacement of the fitness standard, greater emphasis will be placed on findings relating to the HHSRS.
Mandatory Duties
• Unfit houses (Housing Act 1985) - to take the most satisfactory course of action being: renovation, closure/demolition or clearance.
With effect from April 2006 replaced by:
• Category one hazards, Housing Health and Safety Rating System (HHSRS) (Housing Act 2004) – to take the most satisfactory course of action being: improvement notices, prohibition orders, hazard awareness notices, emergency remedial action, emergency prohibition orders, demolition orders or slum clearance declarations.
-----------------------------------------------------------------------------------
11
Newark and Sherwood District Council Private Sector House Condition Survey March 2007
• Houses in Multiple Occupation (Housing Act 1985) - to inspect certain HMOs, to keep a register of notices served, to require registration where a registration scheme is in force.
With effect from July 2006 replaced by:
• HMO Licensing by the Authority (Housing Act 2004) of all HMOs of three or more storeys, with five or more residents and two or more households. Certain exceptions apply and are defined under sections 254 to 259 of the Housing Act 2004.
-----------------------------------------------------------------------------------
• Overcrowding - (Housing Act 1985) - to inspect and report on overcrowding.
Replaced by
• Overcrowding – (Housing Act 2004) – to inspect and report on overcrowding as defined under sections 139 to 144 of the Housing Act 2004.
-----------------------------------------------------------------------------------
• The provision of adaptations and facilities to meet the needs of people with disabilities (Housing Grants, Construction and Regeneration Act 1996) - to approve applications for Disabled Facilities Grants for facilities and/or access.
• Energy Conservation (Home Energy Conservation Act 1995) - to have in place a strategy for the promotion and adoption of energy efficiency measures and to work towards specified Government targets to reduce fossil fuel use.
2.2.7 In addition to the mandatory duties outlined above there are a number of non-mandatory powers available to the Authority under the Housing Act 2004. These include: taking the most satisfactory course of action in relation to category 2 hazards under the HHSRS (hazard categories are defined in Chapter 5 of this report); additional licensing of HMOs that do not fall under the definition for mandatory licensing; and serving of overcrowding notices.
2.2.8 This report will provide much of the evidence base, recommended under the ODPM guidance 05/2003, for the Authority’s private sector renewal strategy. In addition, information in the report is likely to prove useful as a source for a wide variety of private sector housing issues.
2.3 Nature of the survey
2.3.1 The survey was a sample survey (1,240 dwellings) and covered private sector dwellings only. The survey was based on a stratified random sample of addresses in Newark and Sherwood in order to gain a representative picture across the District. An unusual method of stratification was chosen in order to provide highly detailed information
12
Newark and Sherwood District Council Private Sector House Condition Survey March 2007
and provide a depth of coverage not normally associated with a house condition survey (described below). A total of 2,728 addresses were selected during sampling and in practice 1,240 dwellings were surveyed.
2.3.2 Prior to the survey, information was provided in relation to all the East Midlands authorities from the Building Research Establishment’s (BRE) Housing Stock Modelling Service. This service provides detailed projections of housing stock conditions down to the Census Output Area (COA) level. COAs are the smallest sub-area used by the Census and usually constitute between 100 and 150 addresses that are geographically adjacent.
2.3.3 The HSMS uses a combination of Census data and data from the English House Condition Survey (EHCS) to predict the likely level of non decency under the Decent Homes Standard. The Decent Homes Standard and its sub-criteria are explained in detail in Chapter 5 and in the appendices. A more detailed description of the HSMS is also given in the appendices.
2.3.4 On the basis of the complex projections produced by this model, survey sampling was conducted to ensure one dwelling would be surveyed in as large a number as possible of the 368 COAs. Where the model predicted below average housing conditions, a larger number of surveys was designated for an individual COA. This complex form of sampling enables the final survey data to be weighted and grouped in such a way as to give a detailed picture of private sector dwelling conditions.
2.4 ODPM Guidance on house condition surveys
2.4.1 The 1993 DoE Local House Condition Survey Guidance Manual sets out a methodology that includes a detailed survey form in a modular format, and a step-by-step guide to survey implementation.
2.4.2 The 1993 guidance was updated in 2000 and under the new guidance local authorities are encouraged to make full use of the data gathered from house condition surveys in conjunction with data from other sources. Also included is guidance on the Housing Health and Safety Rating System. The 2006 Newark and Sherwood HCS followed the ODPM 2000 guidance.
2.4.3 The Comprehensive Local Authority Stock Survey Information Collation (CLASSIC) software system (a pps plc package) was used to analyse the results of the survey and to produce the outputs required from the data to write this report.
2.5
13
Newark and Sherwood District Council Private Sector House Condition Survey March 2007
Comparative statistics
2.5.1 Comparisons to the position for all England are drawn from the 2003 English House Condition Survey (EHCS), published by the ODPM and available as a download document from their website (now the Department for Communities and Local Government website, www.communities.gov.uk).
2.6 Sub-area analysis
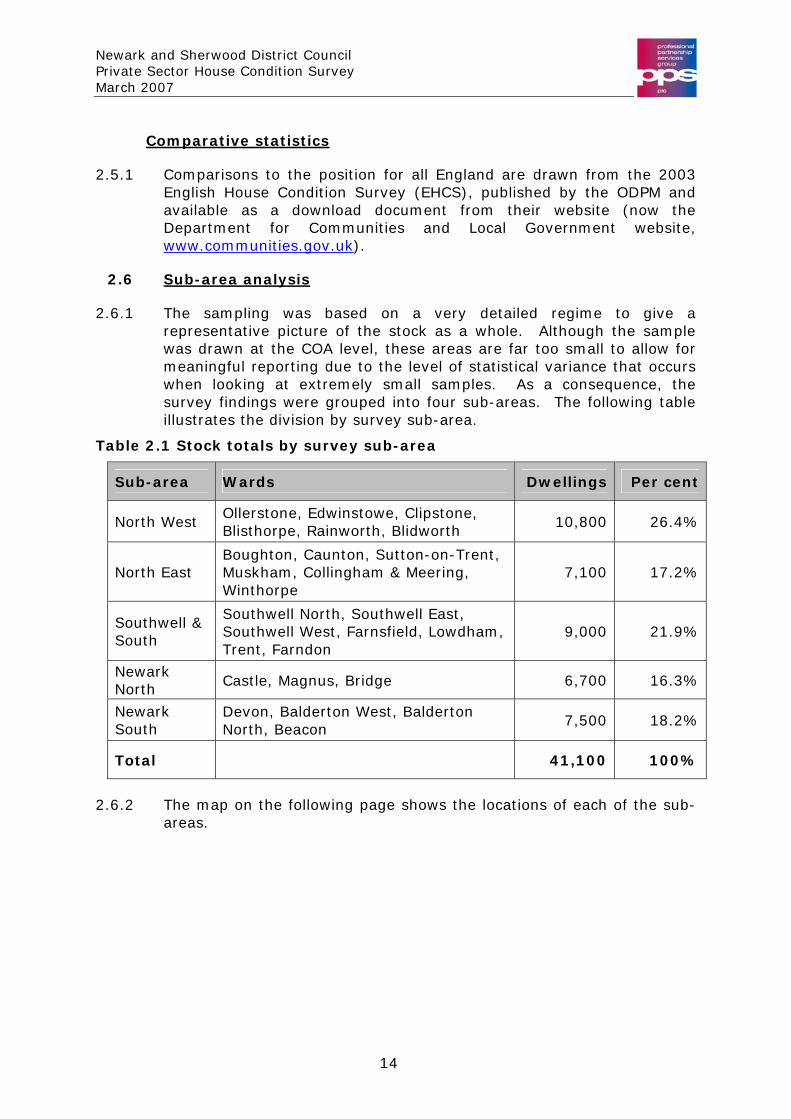
2.6.1 The sampling was based on a very detailed regime to give a representative picture of the stock as a whole. Although the sample was drawn at the COA level, these areas are far too small to allow for meaningful reporting due to the level of statistical variance that occurs when looking at extremely small samples. As a consequence, the survey findings were grouped into four sub-areas. The following table illustrates the division by survey sub-area.
Table 2.1 Stock totals by survey sub-area
Sub-area Wards Dwellings Per cent
North West Ollerstone, Edwinstowe, Clipstone, Blisthorpe, Rainworth, Blidworth
10,800 26.4%
North East Boughton, Caunton, Sutton-on-Trent, Muskham, Collingham & Meering, Winthorpe
7,100 17.2%
Southwell & South
Southwell North, Southwell East, Southwell West, Farnsfield, Lowdham, Trent, Farndon
9,000 21.9%
Newark North Castle, Magnus, Bridge 6,700 16.3%
Newark South
Devon, Balderton West, Balderton North, Beacon
7,500 18.2%
Total 41,100 100%
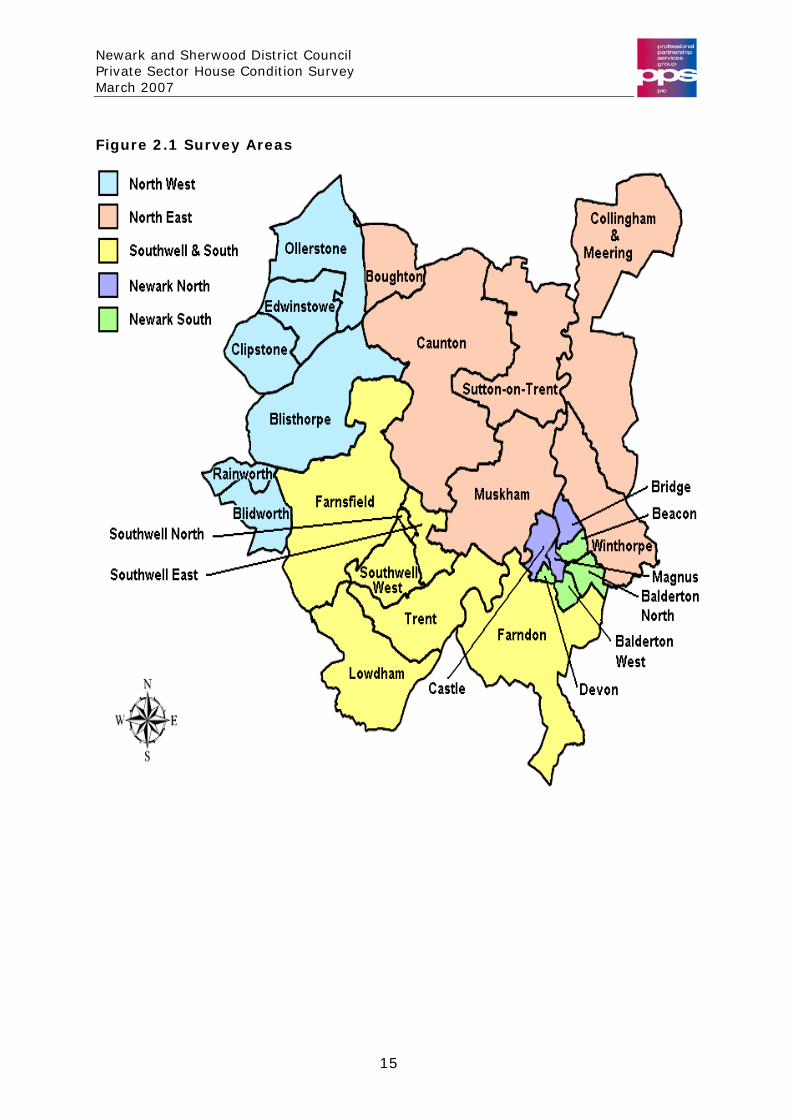
2.6.2 The map on the following page shows the locations of each of the sub-areas.
14
Newark and Sherwood District Council Private Sector House Condition Survey March 2007
Figure 2.1 Survey Areas
15
Newark and Sherwood District Council Private Sector House Condition Survey March 2007
2.7 Statistical variance and standard deviation
2.7.1 By definition, sample surveys are seeking to give an accurate representation of a larger number of dwellings than those surveyed. The total to be represented is referred to in statistical terms as the “population”, and in the case of this survey the population is all private sector dwellings in Newark and Sherwood. Because any figure from a survey is based on a sample, it will be subject to some degree of variation. This statistical variance can be expressed in terms of “standard deviation” and “confidence limits”.
2.7.2 Standard deviation is the amount by which a given figure may be inaccurate either above or below its stated level. Confidence limits state that if the entire survey process were repeated, out of how many of these repetitions would there be confidence in staying within the variation. Traditionally, and in the case of this report, 95% confidence limits have been used, which state that if the survey were carried out 100 times, in 95 cases the standard deviation would be a given amount.
2.7.3 It should be borne in mind, therefore, that the figures in this report are estimates, and it is for this reason that figures are rounded, as described below. More detail on the calculation of standard deviation is given in the appendices.
2.8 Presentation of figures
2.8.1 Due to the nature of statistical variation, as outlined above, it is not necessary to quote each individual figure to the nearest dwelling, as this implies a spurious level of accuracy. As with the English House Condition Survey (EHCS), figures in this report are either quoted to the nearest 100 dwellings or 10 dwellings, dependent upon the size of any given figure. Percentages within the report are only quoted to 1 decimal place for the same reason.
16
Newark and Sherwood District Council Private Sector House Condition Survey March 2007
3 Profile of the housing stock
3.1 Size of the dwelling stock
3.1.1 At the time of the survey there were an estimated 41,100 private sector dwellings in Newark and Sherwood. The 41,100 total for the stock is the current estimated private sector stock total, as provided by Newark and Sherwood District Council and based on Council Tax Records. Individual weights were created for each dwelling surveyed, in accordance with the stratified sampling regime, such that each survey would represent a specific number of dwellings within Newark and Sherwood. Details of the sample stratification and weighting method are given in the Appendices.
3.2 Age of the dwelling stock
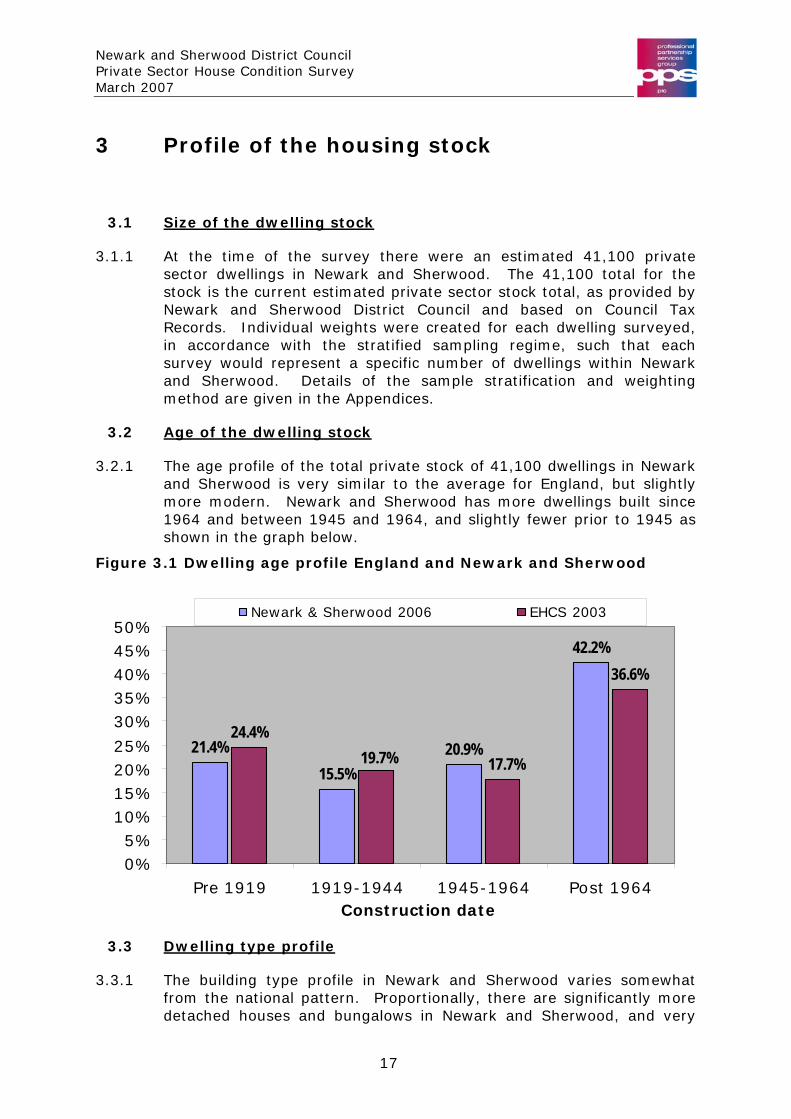
3.2.1 The age profile of the total private stock of 41,100 dwellings in Newark and Sherwood is very similar to the average for England, but slightly more modern. Newark and Sherwood has more dwellings built since 1964 and between 1945 and 1964, and slightly fewer prior to 1945 as shown in the graph below.
Figure 3.1 Dwelling age profile England and Newark and Sherwood
21.4%15.5%
20.9%
42.2%
24.4%
36.6%
19.7% 17.7%
0%5%
10%15%20%25%
30%35%40%45%50%
Pre 1919 1919-1944 1945-1964 Post 1964Construction date
Newark & Sherwood 2006 EHCS 2003
3.3 Dwelling type profile
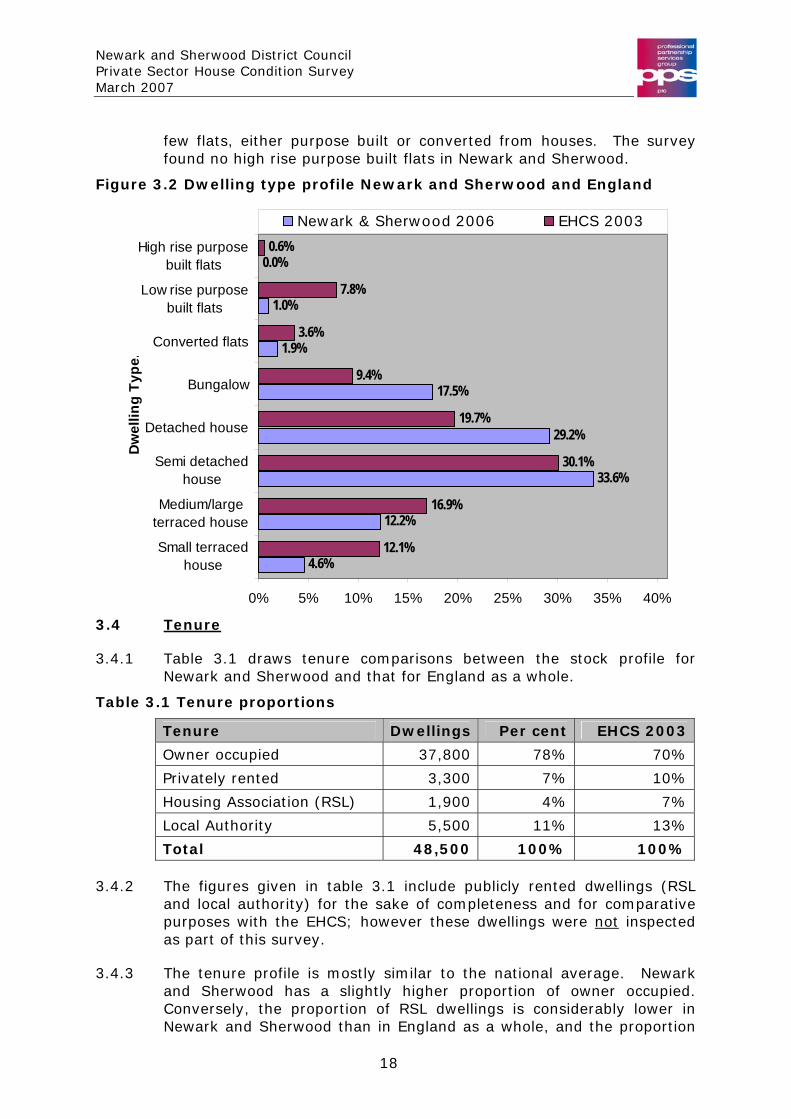
3.3.1 e in Newark and Sherwood varies somewhat from the national pattern. Proportionally, there are significantly more detached houses and bungalows in Newark and Sherwood, and very
The building type profil
17
Newark and Sherwood District Council Private Sector House Condition Survey March 2007
few flats, either purpose built or converted from houses. The survey found no high rise purpose built flats in Newark and Sherwood.
.2 Dwelling type profile Newark and Sherwood and England Figure 3
3.4
4.6%
12.2%
33.6%
29.2%
17.5%
1.9%
1.0%
0.0%
12.1%
16.9%
30.1%
19.7%
9.4%
3.6%
7.8%
0% 5% 10% 15% 20% 25% 30% 35% 40%
Small terracedhouse
Medium/largeterraced house
Semi detachedhouse
Detached house
Bungalow
Converted flats
Low rise purposebuilt flats
built flats
Dw
ellin
g Ty
pe
Tenure
3.4.1 Table 3.1 draws tenure comparisons between the stock profile for nd Sherwood and that for England as a whole. Newark a
Table 3.1 Tenure proportions
Tenure Dwellings Per cent EHCS 2003
Owner occupied 37,800 78% 70%
Privately rented 3,300 7% 10%
Housing Association (RSL) 1,900 4% 7%
Local Authority 5,500 11% 13%
Total 48 100% 100% ,500
3.4.2 n in table 3.1 inc blicly dwellings al authority) for the sake etene for com
purposes with the EHCS; however these dwellings were not
The figures give lude pu rented (RSLand loc of compl ss and parative
inspected
3.4.3 slightly higher proportion of owner occupied.
Conversely, the proportion of RSL dwellings is considerably lower in Newark and Sherwood than in England as a whole, and the proportion
as part of this survey.
The tenure profile is mostly similar to the national average. Newark and Sherwood has a
0.6%High rise purpose
.
Newark & Sherwood 2006 EHCS 2003
18
Newark and Sherwood District Council Private Sector House Condition Survey March 2007
0%10%20%30%40%50%60%70%80%90%
100%
Owner occupied Privately rented Overall
Tenure
Pre 1919 1919-1944 1945-1964 Post 1964
3.5
of local authority and privately rented dwellings in Newark and Sherwood is also lower than that found nationally.
Tenure and age comparisons
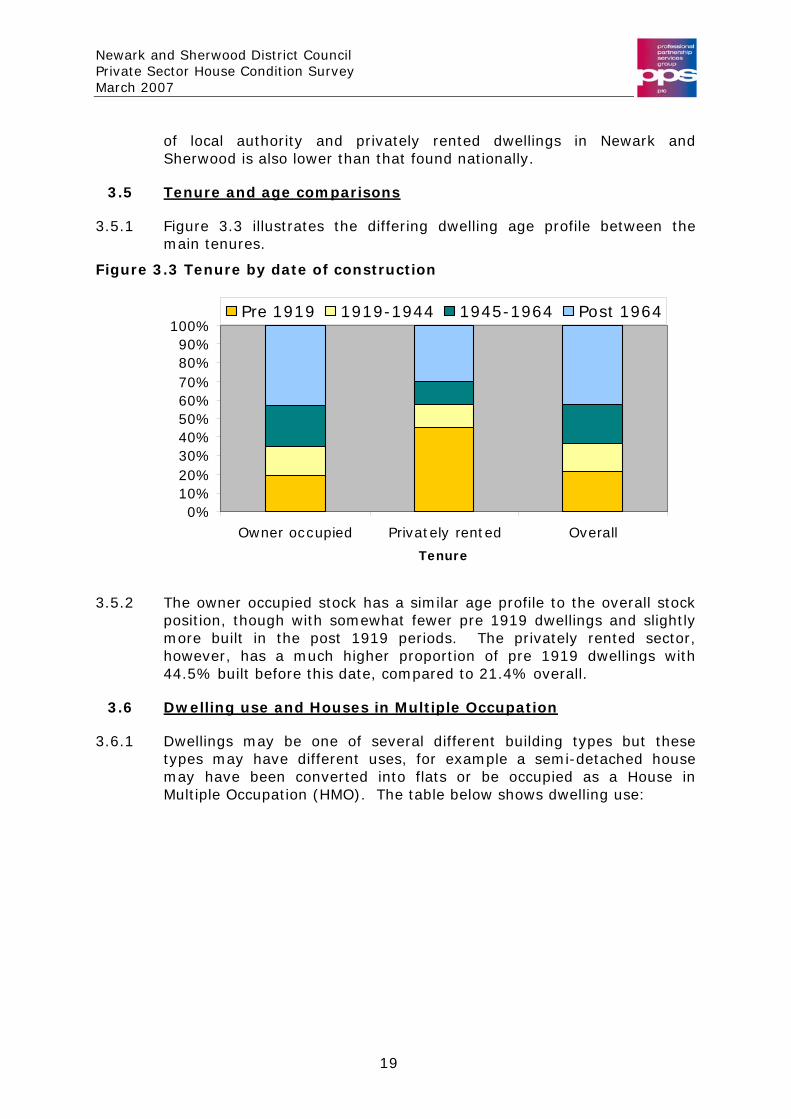
Figure 3.3 illustrates the differing dwelling age 3.5.1 profile between the main tenures.
F 3
3.5.2 The owner occupied stock has a similar age profile to the overall stock position, though with somewhat fewer pre 1919 dwellings and slightly more built in the post 1919 periods. The privately rented sector, however, has a much higher proportion of pre 1919 dwellings with
3.6
igure .3 Tenure by date of construction
44.5% built before this date, compared to 21.4% overall.
Dwelling use and Houses in Multiple Occupation
Dwellings may be one of several different building typ3.6.1 es but these types may have different uses, for example a semi-detached house
as a House in Multiple Occupation (HMO). The table below shows dwelling use: may have been converted into flats or be occupied
19
Newark and Sherwood District Council Private Sector House Condition Survey March 2007
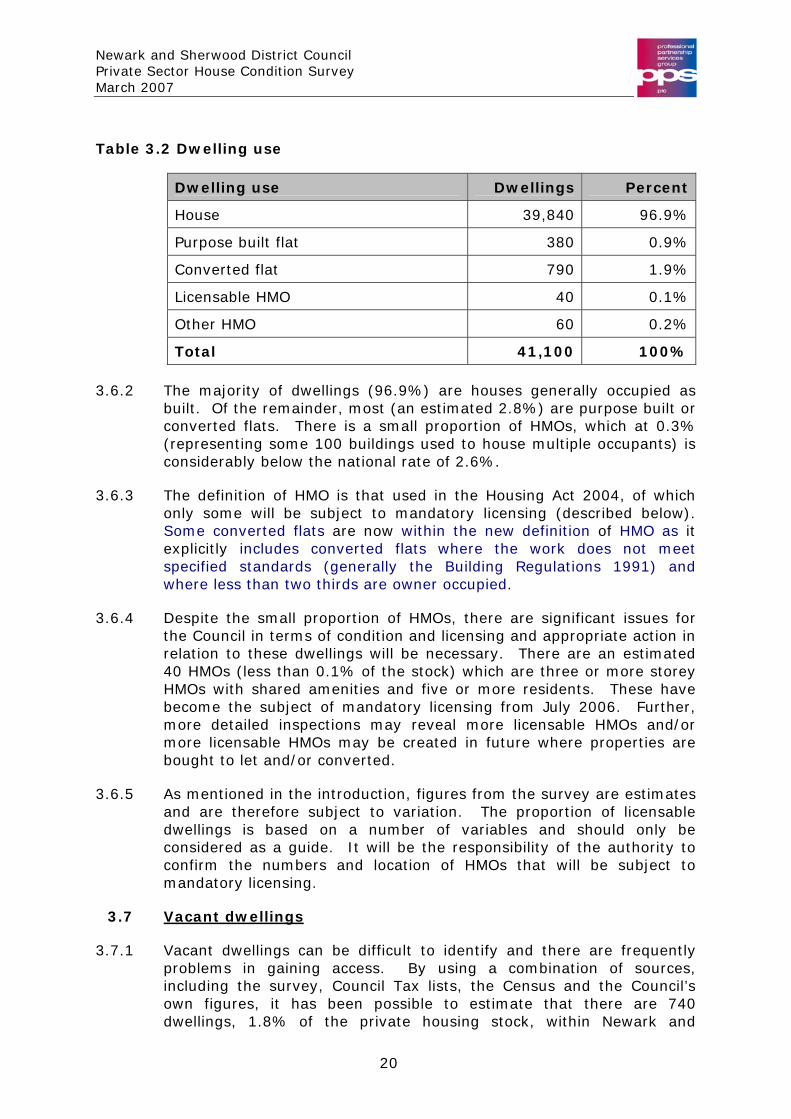
Table 3.2 Dwelling use
Dwelling use Dwellings Percent
House 39,840 96.9%
Purpose built flat 380 0.9%
Converted flat 790 1.9%
Licensable HMO 40 0.1%
Other HMO 60 0.2%
Total 41,100 100%
3.6.2 The majority of dwellings (96.9%) are houses generally occupied as built. Of the remainder, most (an estimated 2.8%) are purpose built or converted flats. There is a small proportion of HMOs, which at 0.3% (representing some 100 buildings used to house multiple occupants) is considerably below the national rate of 2.6%.
3.6.3 The definition of HMO is that used in the Housing Act 2004, of which only some will be subject to mandatory licensing (described below). Some converted flats are now within the new definition of HMO as it explicitly includes converted flats where the work does not meet specified standards (generally the Building Regulations 1991) and where less than two thirds are owner occupied.
3.6.4 Despite the small proportion of HMOs, there are significant issues for the Council in terms of condition and licensing and appropriate action in relation to these dwellings will be necessary. There are an estimated 40 HMOs (less than 0.1% of the stock) which are three or more storey HMOs with shared amenities and five or more residents. These have become the subject of mandatory licensing from July 2006. Further, more detailed inspections may reveal more licensable HMOs and/or more licensable HMOs may be created in future where properties are bought to let and/or converted.
3.6.5 As mentioned in the introduction, figures from the survey are estimates and are therefore subject to variation. The proportion of licensable dwellings is based on a number of variables and should only be considered as a guide. It will be the responsibility of the authority to confirm the numbers and location of HMOs that will be subject to mandatory licensing.
3.7 Vacant dwellings
3.7.1 Vacant dwellings can be difficult to identify and there are frequently problems in gaining access. By using a combination of sources, including the survey, Council Tax lists, the Census and the Council’s own figures, it has been possible to estimate that there are 740 dwellings, 1.8% of the private housing stock, within Newark and
20
Newark and Sherwood District Council Private Sector House Condition Survey March 2007
Sherwood, that are considered vacant. This figure does not include vacant Housing Association properties. The national average for all tenures of vacant dwelling is approximately 3%.
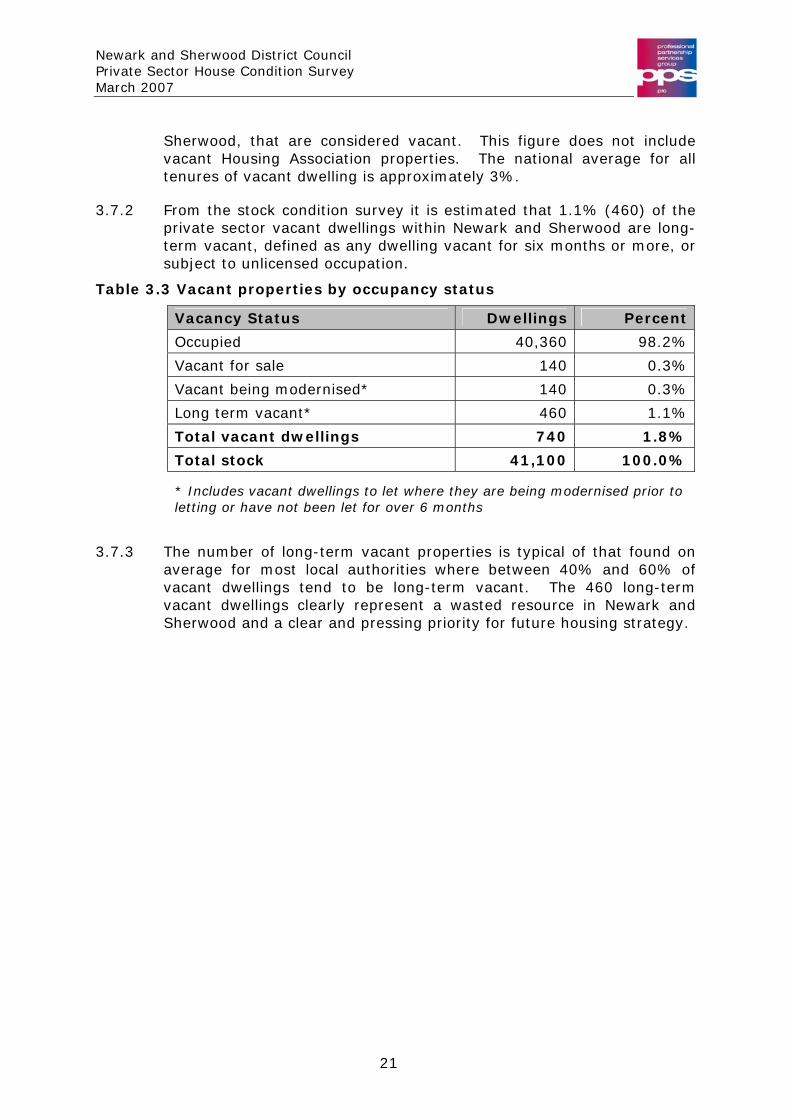
3.7.2 From the stock condition survey it is estimated that 1.1% (460) of the private sector vacant dwellings within Newark and Sherwood are long-term vacant, defined as any dwelling vacant for six months or more, or subject to unlicensed occupation.
Table 3.3 Vacant properties by occupancy status
Vacancy Status Dwellings Percent
Occupied 40,360 98.2%
Vacant for sale 140 0.3%
Vacant being modernised* 140 0.3%
Long term vacant* 460 1.1%
Total vacant dwellings 740 1.8%
Total stock 41,100 100.0%
* Includes vacant dwellings to let where they are being modernised prior to letting or have not been let for over 6 months
3.7.3 The number of long-term vacant properties is typical of that found on average for most local authorities where between 40% and 60% of vacant dwellings tend to be long-term vacant. The 460 long-term vacant dwellings clearly represent a wasted resource in Newark and Sherwood and a clear and pressing priority for future housing strategy.
21
Newark and Sherwood District Council Private Sector House Condition Survey March 2007
4 Profile of Residents
4.1 Introduction
4.1.1 This chapter will look at some of the key characteristics of households within the surveyed dwellings to determine whether links exist with dwelling condition. The links with dwelling condition are examined in detail in Chapter 10.
4.2 Age profile
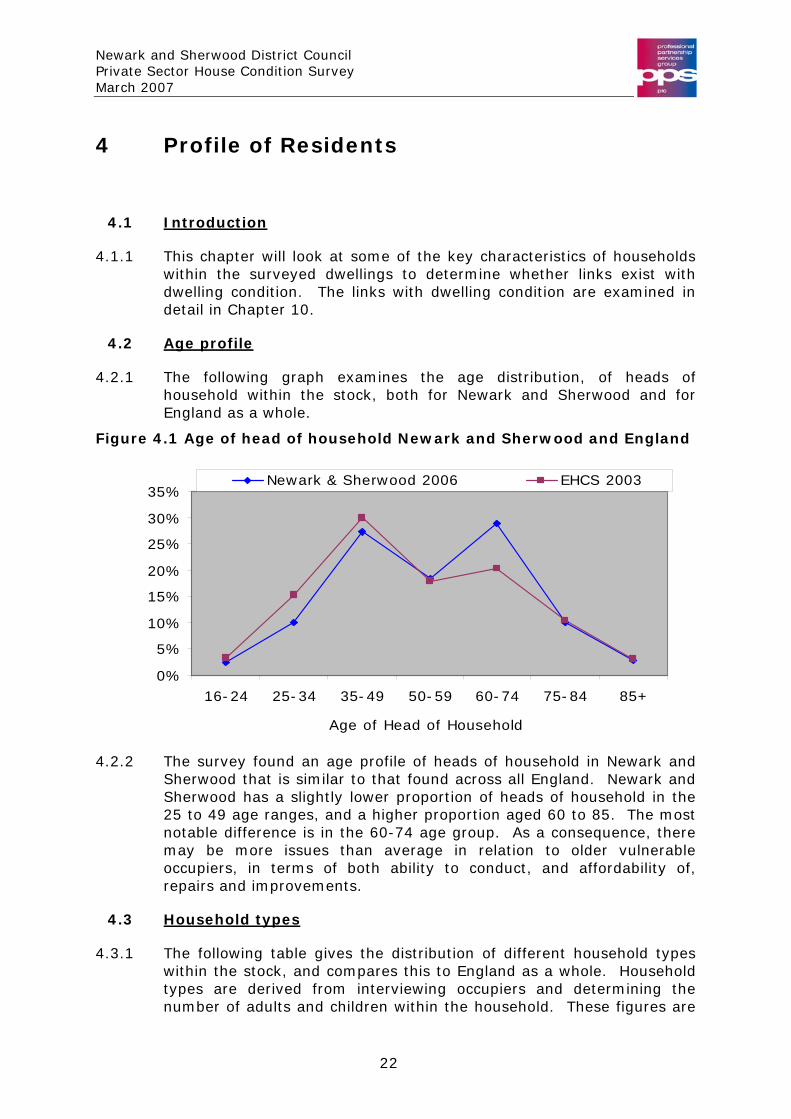
4.2.1 The following graph examines the age distribution, of heads of household within the stock, both for Newark and Sherwood and for England as a whole.
Figure 4.1 Age of head of household Newark and Sherwood and England
0%
5%
10%
15%
20%
25%
30%
35%
16-24 25-34 35-49 50-59 60-74 75-84 85+
Age of Head of Household
Newark & Sherwood 2006 EHCS 2003
4.2.2 The survey found an age profile of heads of household in Newark and Sherwood that is similar to that found across all England. Newark and Sherwood has a slightly lower proportion of heads of household in the 25 to 49 age ranges, and a higher proportion aged 60 to 85. The most notable difference is in the 60-74 age group. As a consequence, there may be more issues than average in relation to older vulnerable occupiers, in terms of both ability to conduct, and affordability of, repairs and improvements.
4.3 Household types
4.3.1 The following table gives the distribution of different household types within the stock, and compares this to England as a whole. Household types are derived from interviewing occupiers and determining the number of adults and children within the household. These figures are
22
Newark and Sherwood District Council Private Sector House Condition Survey March 2007
then used to determine household type. For example, two or more adults with one or more children are considered a “traditional family” for the purposes of this analysis.
Table 4.1 Household type distribution
Household type Newark and
Sherwood 2006 England 2003
Adult group (3+ adults) 3,500 8.5% 7%
Lone Adult 4,100 10.0% 12%
Lone Older (60+ years) 5,400 13.1% 15%
Single Parent 2,000 4.9% 8%
Traditional Family 8,900 21.7% 24%
Two Adults 17,200 41.8% 34%
Total Household Type 41,100 100% 100%
4.3.2 Proportionally, Newark and Sherwood has lower percentages within most of the household type groups with the exception that Newark and Sherwood has greater proportions of two adults and large adult group households. Large adult groups include residents over the age of 16 sharing with at least two other adults and no children. This pattern tends to fit with an area that has large proportions of owner-occupied dwellings and fewer flats than average.
4.4 Income
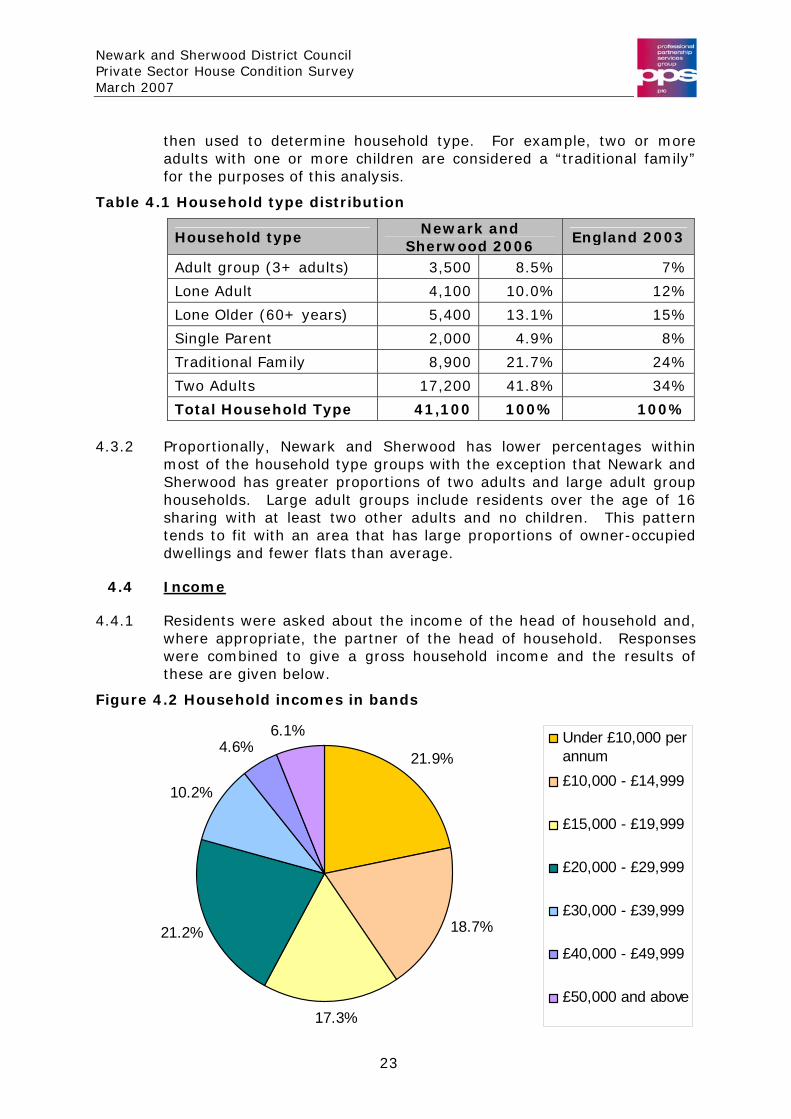
4.4.1 Residents were asked about the income of the head of household and, where appropriate, the partner of the head of household. Responses were combined to give a gross household income and the results of these are given below.
Figure 4.2 Household incomes in bands
21.9%
18.7%
17.3%
21.2%
10.2%
4.6%6.1% Under £10,000 per
annum£10,000 - £14,999
£15,000 - £19,999
£20,000 - £29,999
£30,000 - £39,999
£40,000 - £49,999
£50,000 and above
23
Newark and Sherwood District Council Private Sector House Condition Survey March 2007
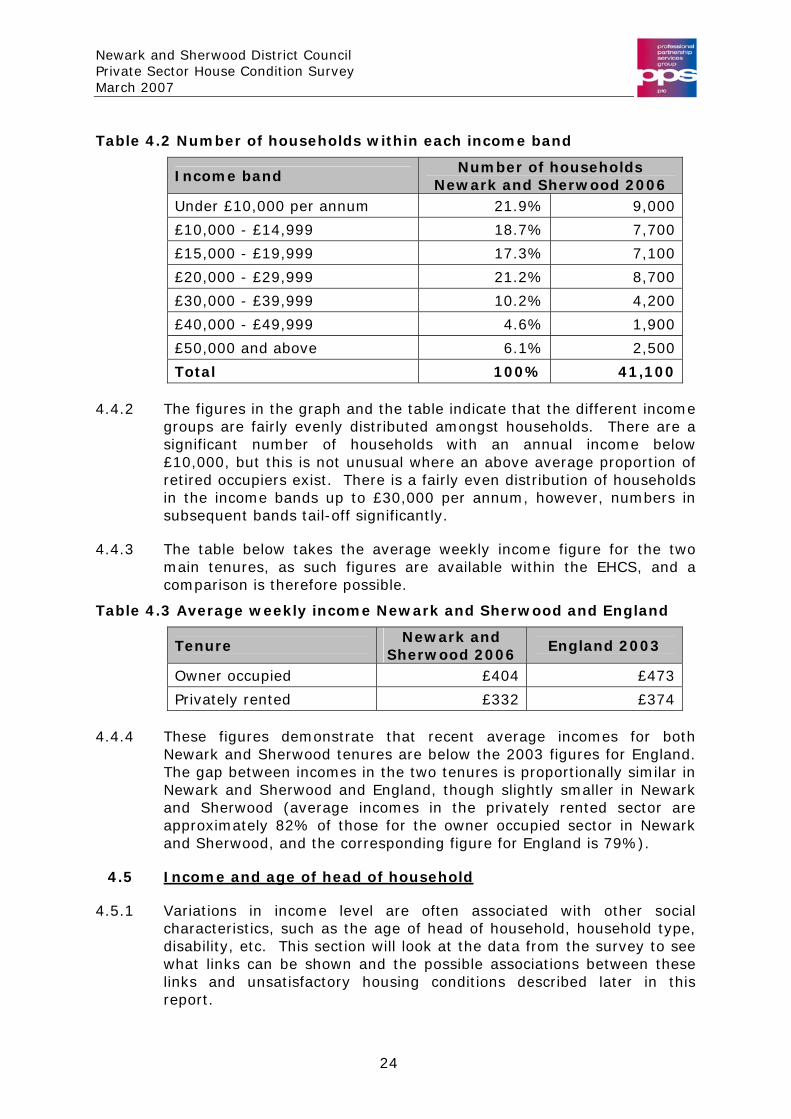
Table 4.2 Number of households within each income band
Income band Number of households
Newark and Sherwood 2006 Under £10,000 per annum 21.9% 9,000
£10,000 - £14,999 18.7% 7,700
£15,000 - £19,999 17.3% 7,100
£20,000 - £29,999 21.2% 8,700
£30,000 - £39,999 10.2% 4,200
£40,000 - £49,999 4.6% 1,900
£50,000 and above 6.1% 2,500
Total 100% 41,100
4.4.2 The figures in the graph and the table indicate that the different income groups are fairly evenly distributed amongst households. There are a significant number of households with an annual income below £10,000, but this is not unusual where an above average proportion of retired occupiers exist. There is a fairly even distribution of households in the income bands up to £30,000 per annum, however, numbers in subsequent bands tail-off significantly.
4.4.3 The table below takes the average weekly income figure for the two main tenures, as such figures are available within the EHCS, and a comparison is therefore possible.
Table 4.3 Average weekly income Newark and Sherwood and England
Tenure Newark and
Sherwood 2006 England 2003
Owner occupied £404 £473
Privately rented £332 £374
4.4.4 These figures demonstrate that recent average incomes for both Newark and Sherwood tenures are below the 2003 figures for England. The gap between incomes in the two tenures is proportionally similar in Newark and Sherwood and England, though slightly smaller in Newark and Sherwood (average incomes in the privately rented sector are approximately 82% of those for the owner occupied sector in Newark and Sherwood, and the corresponding figure for England is 79%).
4.5 Income and age of head of household
4.5.1 Variations in income level are often associated with other social characteristics, such as the age of head of household, household type, disability, etc. This section will look at the data from the survey to see what links can be shown and the possible associations between these links and unsatisfactory housing conditions described later in this report.
24
Newark and Sherwood District Council Private Sector House Condition Survey March 2007
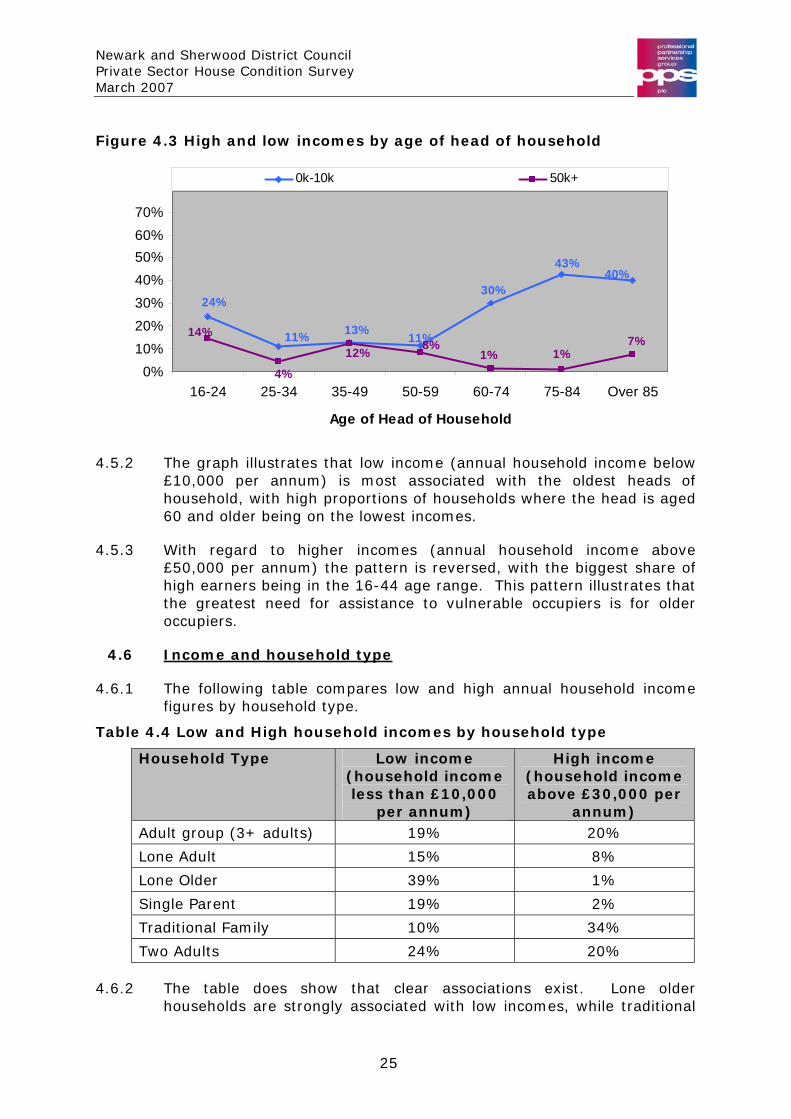
Figure 4.3 High and low incomes by age of head of household
24%
40%43%
30%
11%13%11% 7%14%
1%1%8%
4%
12%0%
10%20%30%40%50%60%70%
16-24 25-34 35-49 50-59 60-74 75-84 Over 85
Age of Head of Household
0k-10k 50k+
4.5.2 The graph illustrates that low income (annual household income below £10,000 per annum) is most associated with the oldest heads of household, with high proportions of households where the head is aged 60 and older being on the lowest incomes.
4.5.3 With regard to higher incomes (annual household income above £50,000 per annum) the pattern is reversed, with the biggest share of high earners being in the 16-44 age range. This pattern illustrates that the greatest need for assistance to vulnerable occupiers is for older occupiers.
4.6 Income and household type
4.6.1 The following table compares low and high annual household income figures by household type.
Table 4.4 Low and High household incomes by household type
Household Type Low income (household income less than £10,000
per annum)
High income (household income above £30,000 per
annum) Adult group (3+ adults) 19% 20%
Lone Adult 15% 8%
Lone Older 39% 1%
Single Parent 19% 2%
Traditional Family 10% 34%
Two Adults 24% 20%
4.6.2 The table does show that clear associations exist. Lone older households are strongly associated with low incomes, while traditional
25
Newark and Sherwood District Council Private Sector House Condition Survey March 2007
families have a high proportion of higher incomes. Two adult household types have an a roughly equal distribution of incomes less than £10,000 and greater than £30,000.
4.7 Income and residents with disabilities
4.7.1 It is important to note that this survey used a broad definition of disabled person. This included residents that are frail elderly, as well as registered disabled persons and other persons with a disability.
4.7.2 There is an association between disability and low income, as 21.8% of households with a disabled resident have a household income below £10,000 per annum, compared to 11.4% of households overall. The residents of these dwellings may not only have physical difficulty dealing with repairs, but may be less likely to be able to afford alternative provision.
4.8 Benefit receipt
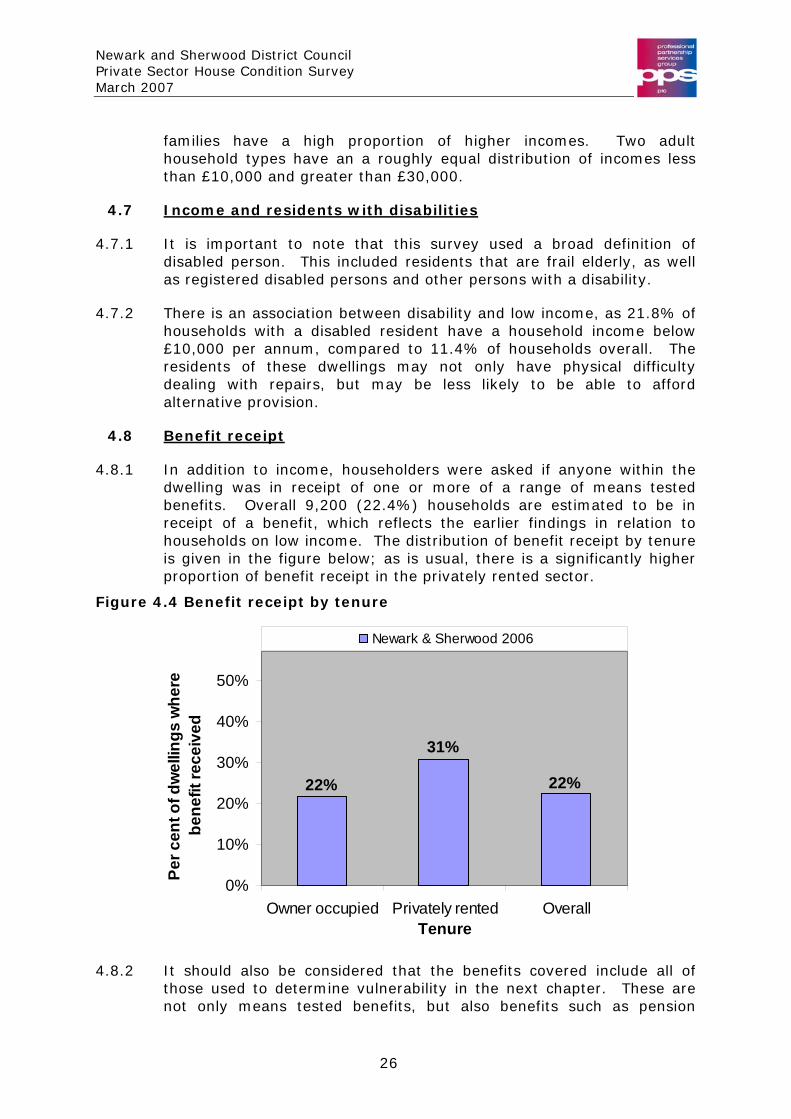
4.8.1 In addition to income, householders were asked if anyone within the dwelling was in receipt of one or more of a range of means tested benefits. Overall 9,200 (22.4%) households are estimated to be in receipt of a benefit, which reflects the earlier findings in relation to households on low income. The distribution of benefit receipt by tenure is given in the figure below; as is usual, there is a significantly higher proportion of benefit receipt in the privately rented sector.
Figure 4.4 Benefit receipt by tenure
31%
22% 22%
0%
10%
20%
30%
40%
50%
Owner occupied Privately rented OverallTenure
Per c
ent o
f dw
ellin
gs w
here
be
nefit
rece
ived
Newark & Sherwood 2006
4.8.2 It should also be considered that the benefits covered include all of those used to determine vulnerability in the next chapter. These are not only means tested benefits, but also benefits such as pension
26
Newark and Sherwood District Council Private Sector House Condition Survey March 2007
credit, which given the above average proportion of older residents, may explain a proportion as high as 22.4%.
4.9 Value of dwellings and equity
4.9.1 Owner occupiers were asked about the value of their dwelling, the level of any outstanding mortgage, any other debt and the consequent total equity. This was to allow the relationship between available equity and dwelling condition to be examined. Such relationships are relevant to the Regulatory Reform Order 2002.
4.9.2 Traditionally assistance for private residents who could not afford repairs came in the form of a number of grants schemes, most notably renovation grants. Since the introduction of the Regulatory Reform Order (described in detail in the introduction) authorities have had far more flexibility in how they choose to offer assistance. In the past three to four years a number of councils across the country have tried different schemes: Loans: initially considered a good option loans have proven very difficult to source. Hope that major lenders would get behind low interest loans has not materialised and few local authorities are pursuing this route.
Equity release: was considered an improvement on an unsecured loan, but has met with a great deal of resistance from residents in most areas. There term has negative connotations and among older occupiers is seen as reducing the value of any inheritance they will be able leave for their children
Repayable grants: these have probably been the most successful system and have a number of alternative versions. They continue the theme of grants but require the grant to ultimately be repaid. This can be done as a charge against the property (recovered at sale of property) or via a fixed period by which the grant has to be repaid.
4.9.3 Newark & Sherwood Council is currently looking at the options for a repayable grant system. Given the above average proportion of older occupiers and shortfall against PSA7 this is likely to be the best option as the residents that most require assistance are likely to be resistant to equity release or similar schemes.
4.9.4 Owner occupiers were asked what they thought their properties were worth, and this gave an estimated value of £167,900. The average value of a dwelling in Newark and Sherwood taken from Land Registry figures for the period from April to June 2006 is approximately £163,700. The figure is below the average value across England of £199,180, again based again on Land Registry figures. (The average value in Nottinghamshire is £150,220).
27
Newark and Sherwood District Council Private Sector House Condition Survey March 2007
4.9.5 The average mortgage level on owner-occupied dwellings in Newark and Sherwood, based upon occupier responses, is £57,500 resulting in an average equity of £106,200 per dwelling using the Land Registry average value. The level of equity in unfit and Category 1 hazard owner occupied dwellings will be referred to later in this report when considering the likelihood of owners being able to meet the cost of necessary repairs.
4.10 Repairs and affordability
4.10.1 In addition to the general household questions referred to so far, owner occupiers were asked additional questions regarding spending on repairs and improvements and their perceived need for repair work to their dwelling.
4.10.2 All occupiers (regardless of tenure) were also asked if they were aware of any repair issues to the dwelling and an estimated 4,440 (10.8%) households were aware of repair issues. The average estimate, by the occupiers, of the cost of these repairs, is £3,370. Again this is a mean average and is based on a wide range of estimates.
4.10.3 Where the household was aware of a repair issue to the dwelling, they were then asked if they felt they could afford to carry out the necessary works. Only 1,590 (35.7%) of households who responded felt that they could afford the repair works where they were aware repairs were needed.
4.11 Crime and security
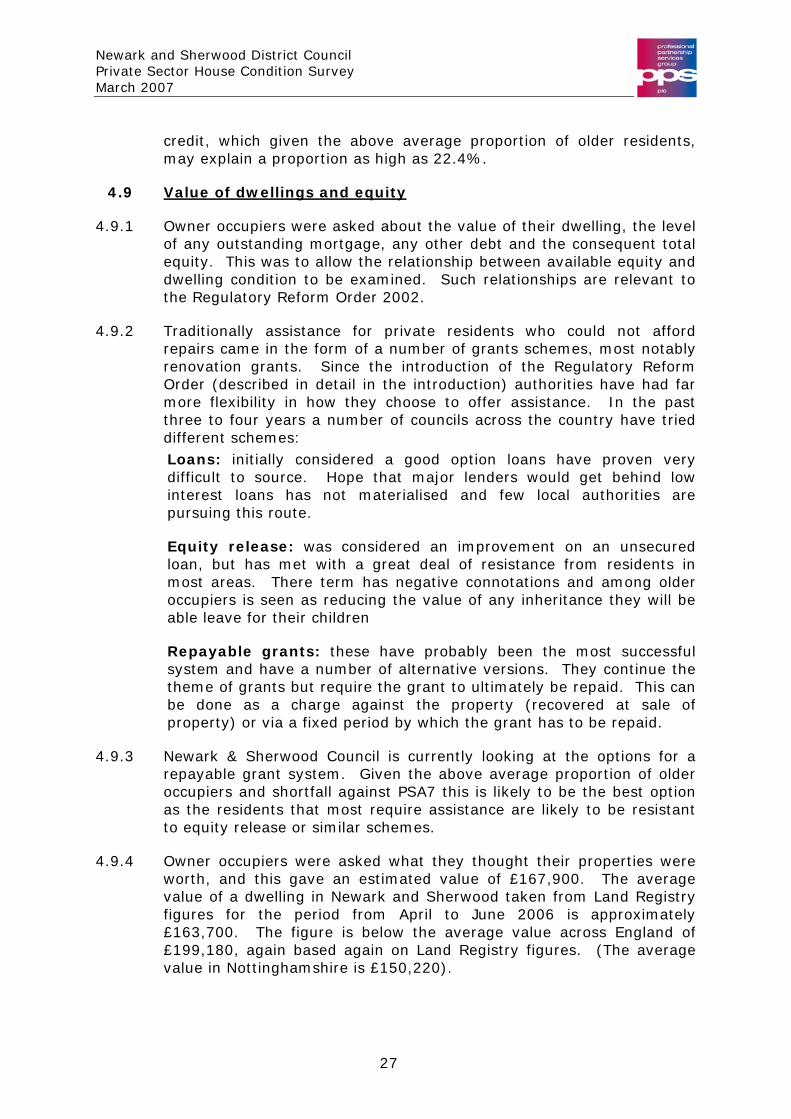
4.11.1 All residents were asked about their experiences of crime whilst living in Newark and Sherwood and the level of security measures, to their dwelling, for crime prevention. Figure 4.5 below shows the proportions of residents experiencing crime in Newark and Sherwood.
Figure 4.5 Percent of households experiencing crime in Newark and Sherwood
3.1%
91.1%
3.7%2.1%
Car Burg Harass None
28
Newark and Sherwood District Council Private Sector House Condition Survey March 2007
4.11.2 The majority of residents (91.1%) have not experienced crime whilst living in Newark and Sherwood. The most common form of crime experienced was car crime at 3.7%. Residents were then asked about what type of security measures exist on their dwelling and the results are given in the following table:
Table 4.5 Provision of security measures
Security Measure Dwellings Percent
Burglar alarm 11,700 28.5%
Secure doors 38,500 93.7%
Window locks 36,300 88.3%
Other security 5,900 14.4%
4.12 Residents with disabilities
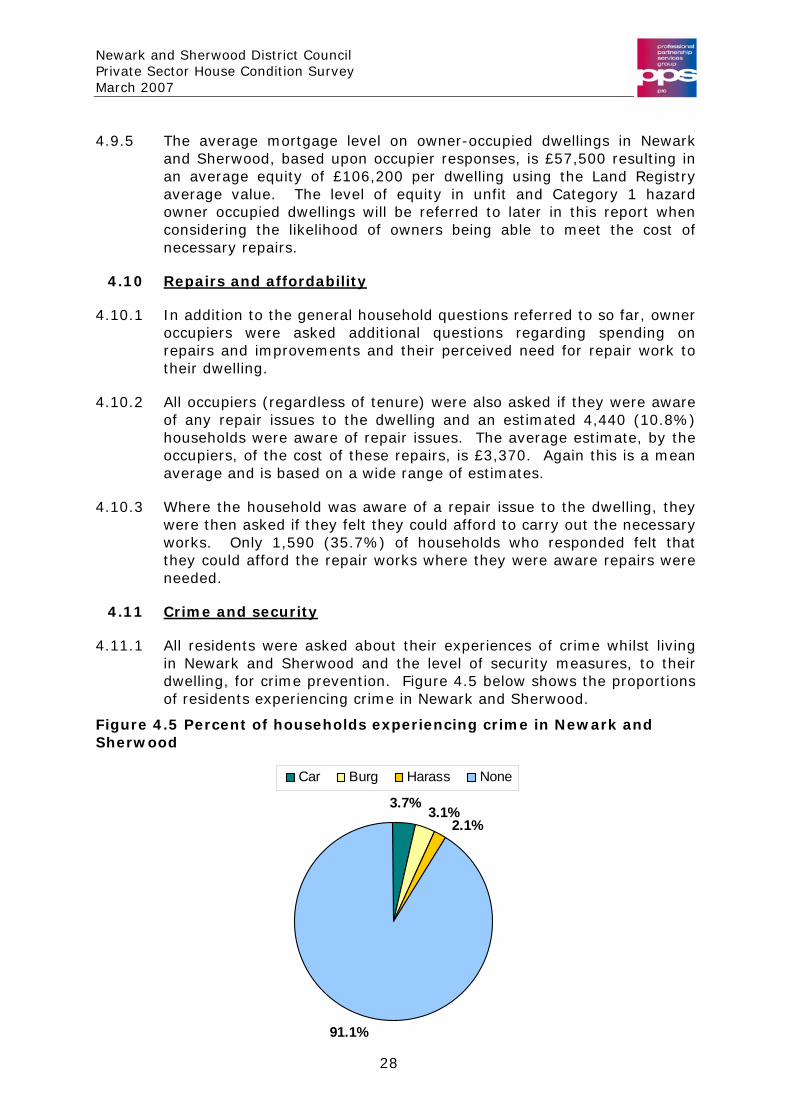
4.12.1 Residents were asked if any member of the household suffers from a long term illness or disability. It is estimated from the results of this question that 4,780 (11.6%) dwellings have at least one resident with a long term illness or disability. Residents were further asked to indicate the condition that best described their disability and the following graph illustrates the results of this.
Figure 4.6 Residents with disabilities by type
38.4%
2.3%
4.8%
15.5% 3.4%
31.2%
3.4%1.0%
Mainly wheelchair (can stand) A total wheelchair user
Only wheelchair outdoors Walks using frame or aid
Walks unaided, but unsteady Visually impaired
Deaf Other (fully mobile)
29
Newark and Sherwood District Council Private Sector House Condition Survey March 2007
4.12.2 The disability definition used is quite a broad one. The graph shows that just under 70% of people who responded stated that their disability was either walking using a frame or walking unaided but unsteadily. The vast majority of these residents are frail elderly, but do represent people who are likely to have specific housing needs.
4.12.3 In order to address the specific housing needs of residents with a disability, Disabled Facilities Grants (DFG) are a mandatory requirement for local authorities to provide. The potential requirement for adaptations for disabled occupiers and the potential DFG demand are discussed in more detail in Chapter 10.
4.13 Ethnic origin
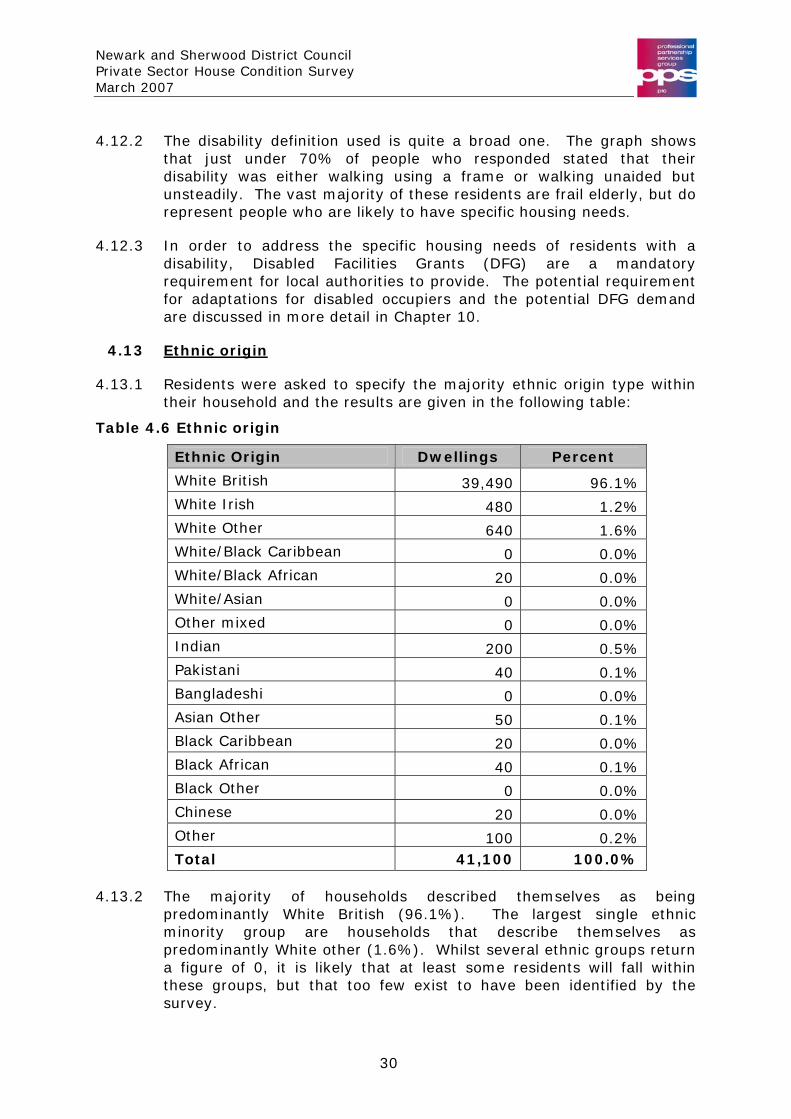
4.13.1 Residents were asked to specify the majority ethnic origin type within their household and the results are given in the following table:
Table 4.6 Ethnic origin
Ethnic Origin Dwellings Percent
White British 39,490 96.1% White Irish 480 1.2% White Other 640 1.6% White/Black Caribbean 0 0.0% White/Black African 20 0.0% White/Asian 0 0.0% Other mixed 0 0.0% Indian 200 0.5% Pakistani 40 0.1% Bangladeshi 0 0.0% Asian Other 50 0.1% Black Caribbean 20 0.0% Black African 40 0.1% Black Other 0 0.0% Chinese 20 0.0% Other 100 0.2% Total 41,100 100.0%
4.13.2 The majority of households described themselves as being predominantly White British (96.1%). The largest single ethnic minority group are households that describe themselves as predominantly White other (1.6%). Whilst several ethnic groups return a figure of 0, it is likely that at least some residents will fall within these groups, but that too few exist to have been identified by the survey.
30
Newark and Sherwood District Council Private Sector House Condition Survey March 2007
4.14
31
Newark and Sherwood District Council Private Sector House Condition Survey March 2007
Residents’ attitude towards their area
4.14.1 All occupiers were asked about their feelings regarding the quality of their home and the area in which it is located. The answers to these questions were then compiled to give the following results.
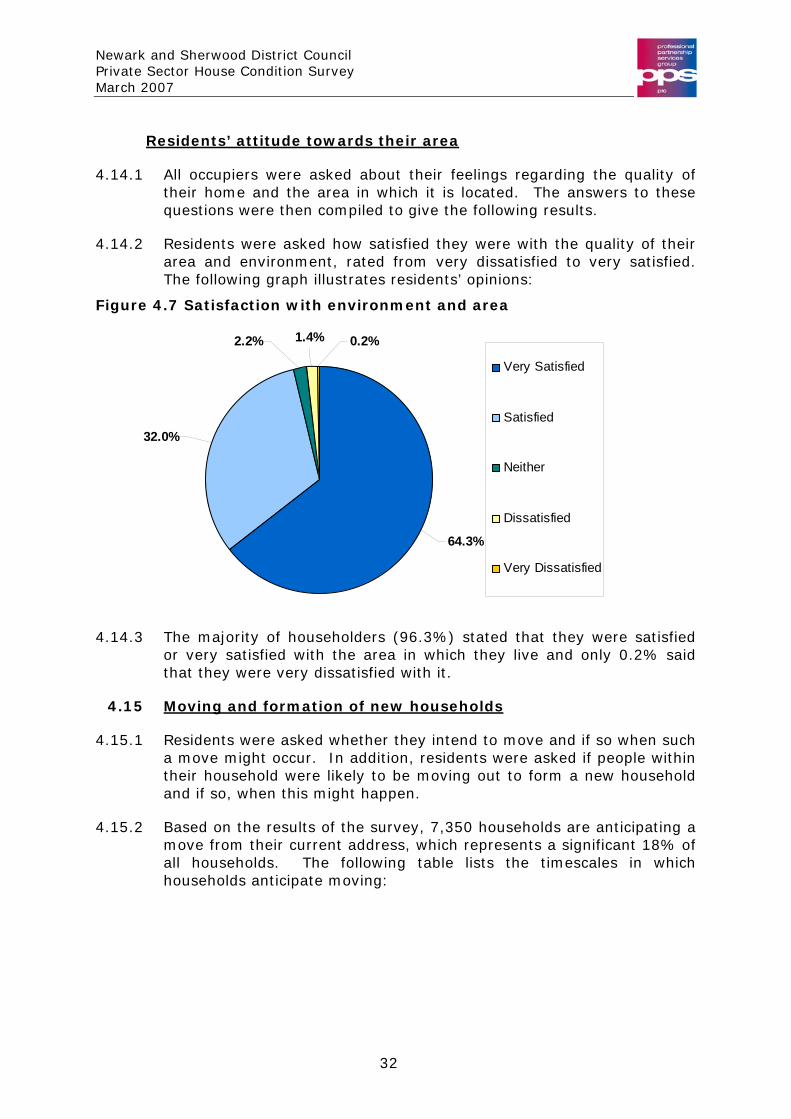
4.14.2 Residents were asked how satisfied they were with the quality of their area and environment, rated from very dissatisfied to very satisfied. The following graph illustrates residents’ opinions:
Figure 4.7 Satisfaction with environment and area
64.3%
0.2%1.4%2.2%
32.0%
Very Satisfied
Satisfied
Neither
Dissatisfied
Very Dissatisfied
4.14.3 The majority of householders (96.3%) stated that they were satisfied or very satisfied with the area in which they live and only 0.2% said that they were very dissatisfied with it.
4.15 Moving and formation of new households
4.15.1 Residents were asked whether they intend to move and if so when such a move might occur. In addition, residents were asked if people within their household were likely to be moving out to form a new household and if so, when this might happen.
4.15.2 Based on the results of the survey, 7,350 households are anticipating a move from their current address, which represents a significant 18% of all households. The following table lists the timescales in which households anticipate moving:
32
Newark and Sherwood District Council Private Sector House Condition Survey March 2007
Table 4.7 Timescale for household move
Moving Households Percent Percent all
stock Within next year 2,960 40% 7%
Within next 1-2 years 1,400 19% 3%
Within next 2-3 years 800 11% 2%
Within next 3-4 years 80 1% 0%
Within next 4-5 years 1,760 24% 4%
In more than 5 years 350 5% 1%
Total 7,350 100% 18%
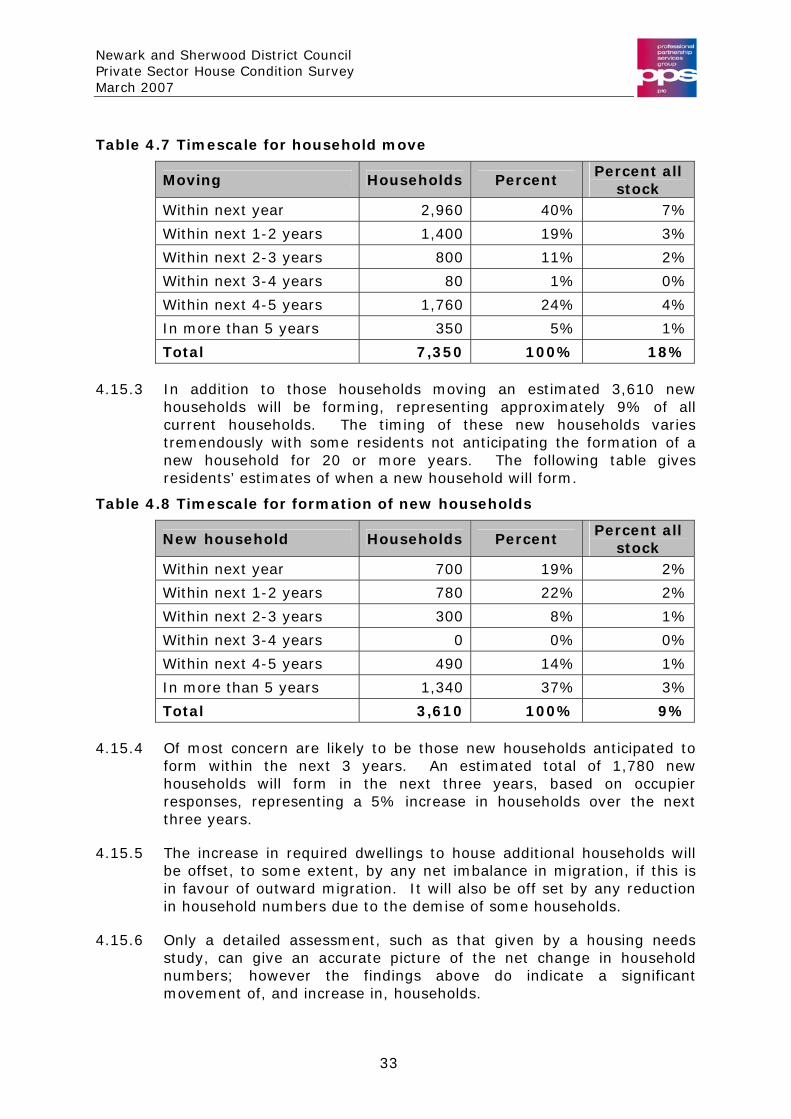
4.15.3 In addition to those households moving an estimated 3,610 new households will be forming, representing approximately 9% of all current households. The timing of these new households varies tremendously with some residents not anticipating the formation of a new household for 20 or more years. The following table gives residents’ estimates of when a new household will form.
Table 4.8 Timescale for formation of new households
New household Households Percent Percent all
stock Within next year 700 19% 2%
Within next 1-2 years 780 22% 2%
Within next 2-3 years 300 8% 1%
Within next 3-4 years 0 0% 0%
Within next 4-5 years 490 14% 1%
In more than 5 years 1,340 37% 3%
Total 3,610 100% 9%
4.15.4 Of most concern are likely to be those new households anticipated to form within the next 3 years. An estimated total of 1,780 new households will form in the next three years, based on occupier responses, representing a 5% increase in households over the next three years.
4.15.5 The increase in required dwellings to house additional households will be offset, to some extent, by any net imbalance in migration, if this is in favour of outward migration. It will also be off set by any reduction in household numbers due to the demise of some households.
4.15.6 Only a detailed assessment, such as that given by a housing needs study, can give an accurate picture of the net change in household numbers; however the findings above do indicate a significant movement of, and increase in, households.
33
Newark and Sherwood District Council Private Sector House Condition Survey March 2007
5 The Decent Homes Standard
5.1 Introduction
5.1.1 It is Government policy that everyone should have the opportunity of living in a “decent home”. The Decent Homes Standard contains four broad criteria that a property should:
A - be above the legal minimum standard for housing, and
B - be in a reasonable state of repair, and
C - have reasonably modern facilities (such as kitchens and bathrooms) and services, and
D - provide a reasonable degree of thermal comfort (effective insulation and efficient heating).
5.1.2 If a dwelling fails any one of these criteria it is considered to be “non decent”. A detailed definition of the criteria and their sub-categories are described in the ODPM guidance: “A Decent Home – The definition and guidance for implementation” February 2004.
5.1.3 The revised guidance does not substantially change the criteria for the decent homes standard laid out in 2002 with the exception of thermal comfort. This has changed from a calculated, energy efficiency based approach to a simpler, but more practical system which takes into account the heating systems, fuel and insulation in a dwelling to determine if it provides adequate thermal comfort.
5.1.4 Until recently, obligations under the Decent Homes Standard were directed solely at the social housing sector. Under “The Decent Homes Target Implementation Plan” June 2003 – as modified April 2004, the ODPM outlined its commitments under Public Service Agreement (PSA) 7. These state that PSA 7 will have been met if:
• There is a year on year increase in the proportion of
vulnerable private sector households in decent homes;
• If the proportion of vulnerable private sector households in decent homes is above 65% by 2006/07.
• If the proportion of vulnerable private sector households in decent homes is above 70% by 2010/11.
• If the proportion of vulnerable private sector households in decent homes is above 75% by 2020/21.
5.1.5 The English House Condition Survey now focuses on the Decent Homes Standard and it seems likely that the standard will remain the primary
34
Newark and Sherwood District Council Private Sector House Condition Survey March 2007
measure of housing conditions for all tenures in future. For this reason the 2006 Newark and Sherwood survey collected adequate and appropriate data to allow judgement of dwellings across all tenures against the Decent Homes Standard.
5.2 Change of emphasis and the Housing Act 2004
5.2.1 Whilst the changes under the revised definition and guidance for the decent homes standard apply, there has been a change in Criterion A of the standard from April 2006. Prior to this change Criterion A used the Housing Fitness Standard as the measure of whether a dwelling meets the minimum legal standard. From April 2006 the new Housing Health and Safety Rating System (HHSRS) under Part 1 of the Housing Act 2004 replaced the existing statutory fitness standard.
5.2.2 The new system assesses “hazards” within dwellings and categorises them into Category 1 and Category 2 hazards. Local Authorities will have a duty to take action to deal with Category 1 hazards. The HHSRS also applies to the Decent Homes Standard – if there is a Category 1 hazard at the property it will fail Criterion A of the standard.
5.2.3 As the new HHSRS regime came into effect in April 2006, this Newark and Sherwood District private sector HCS report will present findings relating to decent homes primarily using Category 1 hazards. Where appropriate, findings using the Housing Fitness Standard will be given for comparison. Unless the criterion is specifically referred to, it can be assumed that figures given in this section are based on the HHSRS. Detailed definitions of both the Rating System and Housing Fitness Standard are given in the following chapter.
5.3 General Characteristics
5.3.1 Based on the House Condition Survey data 13,390 dwellings (32.6%) can be classified non decent, which is marginally above the proportion in England (30.2%) as a whole. The all England figure is taken as the proportion of non decent private sector dwellings from the 2003 EHCS. The EHCS uses the Housing Fitness Standard which tends to produce a lower result.
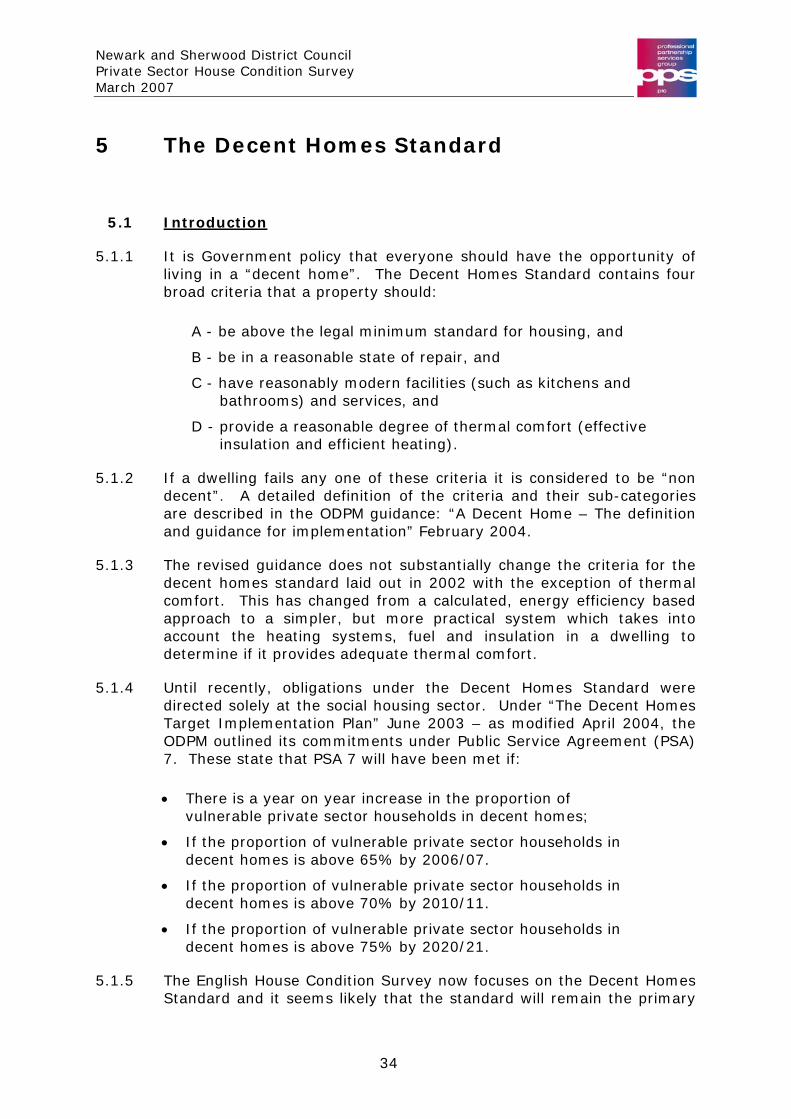
5.3.2 The chart on the next page shows the proportions of non decent dwellings by tenure. The distribution by tenure is typical of the national picture in that privately rented dwellings have the highest rate of non decency (59.8% in Newark and Sherwood). (This is true regardless of whether the figures are based on housing fitness or health and safety hazards).
35
Newark and Sherwood District Council Private Sector House Condition Survey March 2007
Figure 5.1 Tenure by non decent dwellings
30.2%
59.8%
32.6%27.7%
47.5%
30.2%
0%
10%
20%
30%
40%
50%
60%
70%
Owner occupied Privately rented OverallTenure
Newark & Sherwood 2006 EHCS 2003
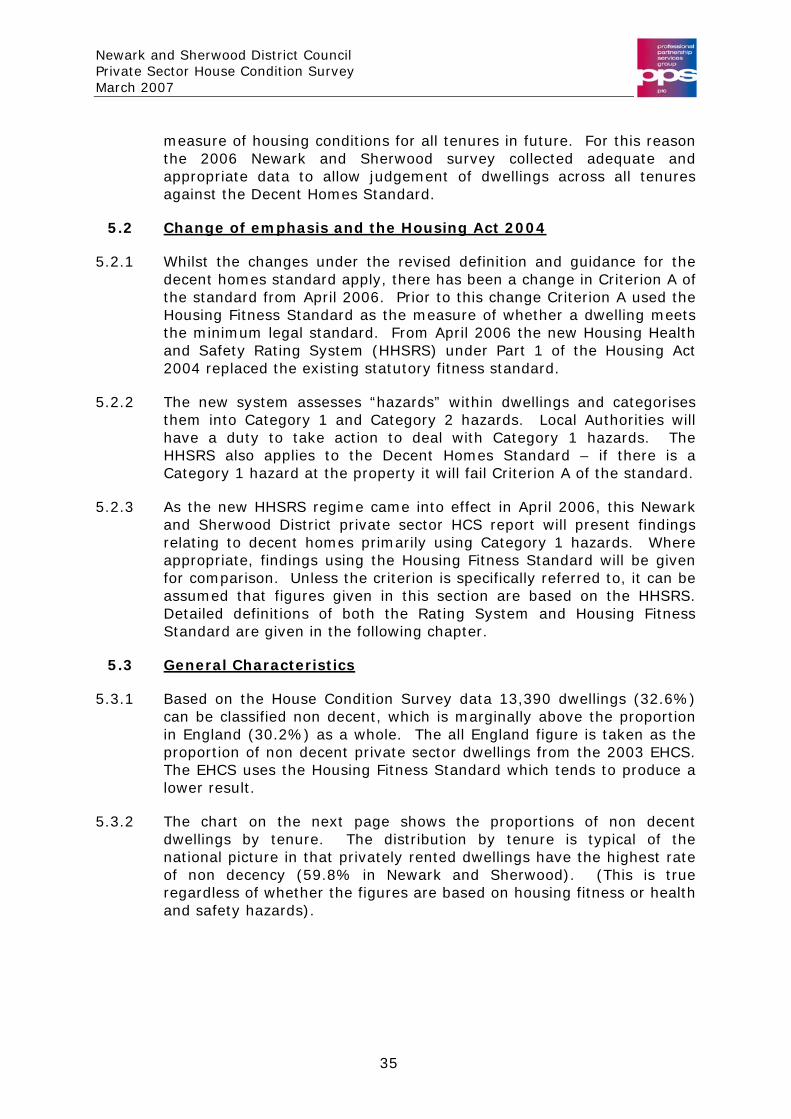
5.3.3 The next graph examines decent homes failures by dwelling type.
Figure 5.2 Non decent dwellings by dwelling type
5.3.4 Converted flats have the highest rate of failure of the Decent Homes Standard at 90.3% which is common across the country, reflecting the
44.7%
51.0%
32.7%
22.2%
25.9%
90.3%
58.4%
0% 20% 40% 60% 80% 100%
Small terracedhouse
Medium/largeterraced house
Semi detachedhouse
Detached house
Bungalow
Converted flats
Low rise purposebuilt flats
Dw
ellin
g ty
pe
Newark & Sherwood 2006
higher proportions of privately rented dwellings in such flats and the
36
Newark and Sherwood District Council Private Sector House Condition Survey March 2007
higher incidence of disrepair. Low rise purpose built flats and terraced houses also have particularly high rates of failure, which in the case of terraced houses, reflects some areas where there are significant numbers of older, poorer condition terraced houses. The lowest proportion of failures is found among detached houses.
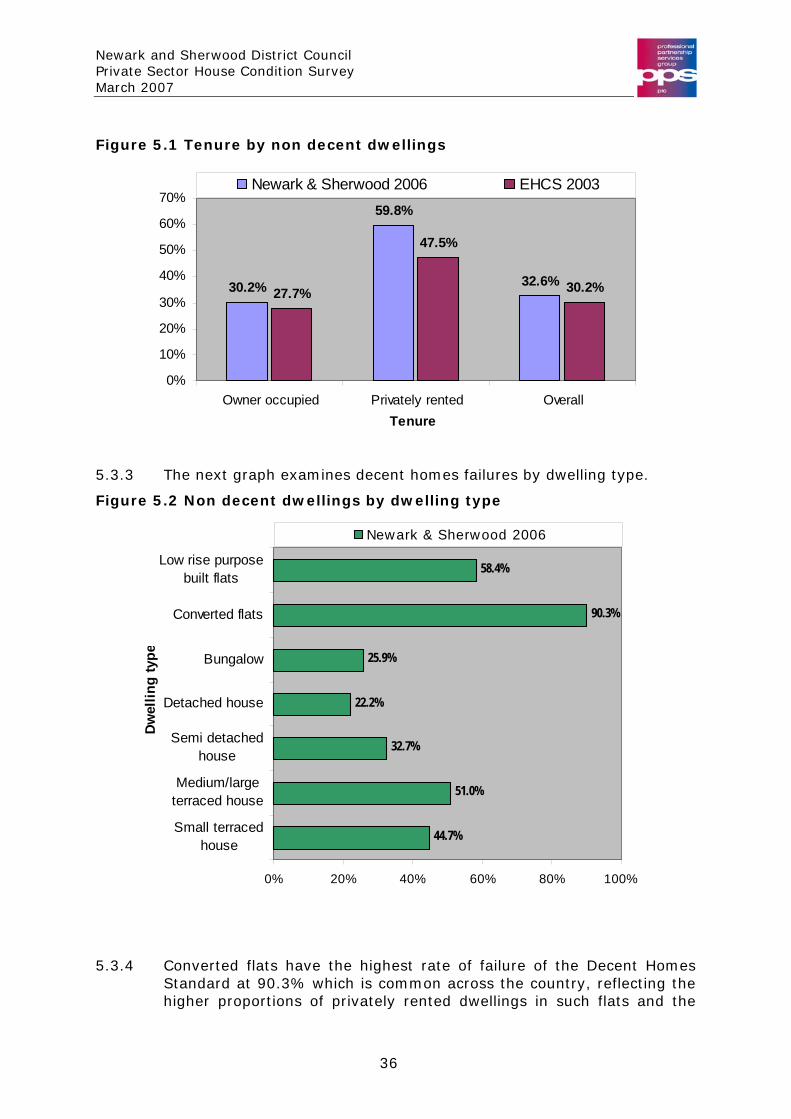
.3 Non decent dwellings by date of construction Figure 5
5.3.5 o
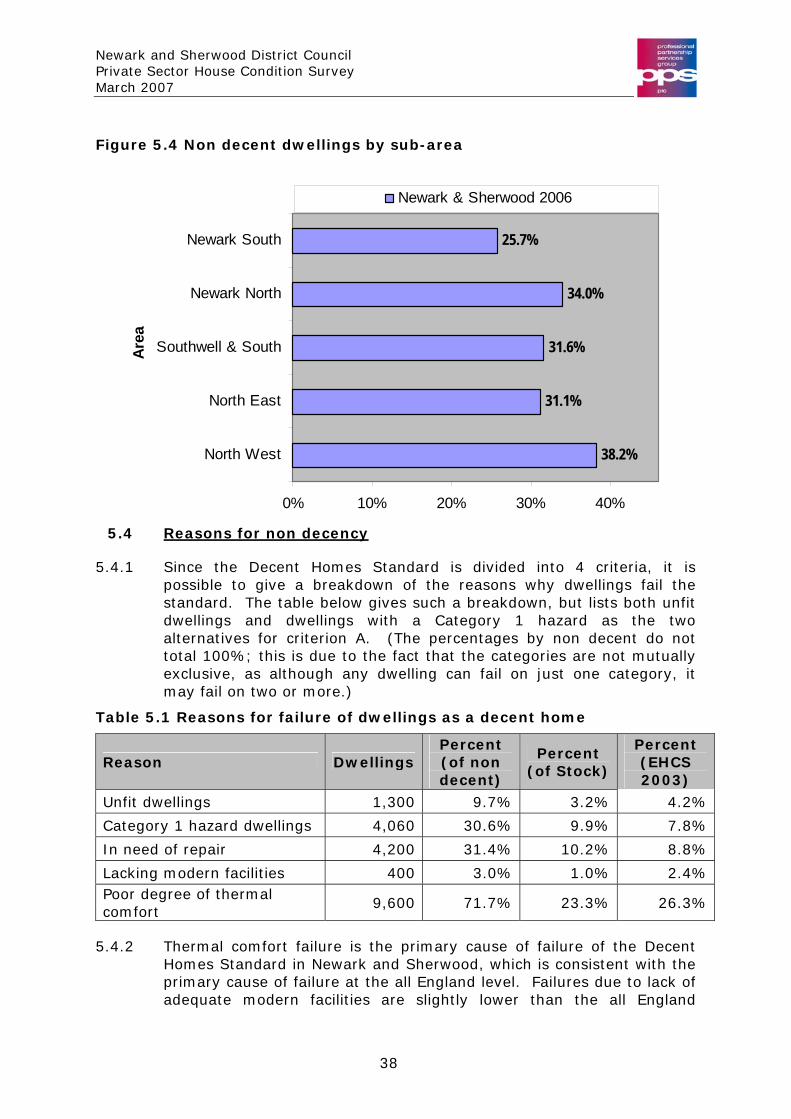
5.3.6 The distribution by sub-area is shown in the next figure. The highest
53.1%
40.9%
32.9%
18.9%
0% 10% 20% 30% 40% 50% 60% 70%
Pre 1919
1919-1944
1945-1964
Post 1964
Co
nstr
ucti
on
da
te
Newark & Sherwood 2006
The usual pattern is for rate of failure of the Decent Homes Standard tincrease with age of dwelling. This pattern is reflected in Newark and Sherwood, with the highest rate of failure, by a significant margin, in properties built pre-1919.
non decency is recorded in North West (38.2%). The lowest rate of non decency is for Newark South (25.7%).
37
Newark and Sherwood District Council Private Sector House Condition Survey March 2007
Figure 5.4 Non decent dwellings by sub-area
38.2%
31.1%
31.6%
34.0%
25.7%
0% 10% 20% 30% 40%
North West
North East
Southwell & South
Newark North
Newark South
Area
Newark & Sherwood 2006
5.4 Reasons for non decency
5.4.1 Since the Decent Homes Standard is divided into 4 criteria, it is possible to give a breakdown of the reasons why dwellings fail the standard. The table below gives such a breakdown, but lists both unfit dwellings and dwellings with a Category 1 hazard as the two alternatives for criterion A. (The percentages by non decent do not total 100%; this is due to the fact that the categories are not mutually exclusive, as although any dwelling can fail on just one category, it may fail on two or more.)
Table 5.1 Reasons for failure of dwellings as a decent home
Reason Dwellings Percent (of non decent)
Percent (of Stock)
Percent (EHCS 2003)
Unfit dwellings 1,300 9.7% 3.2% 4.2%
Category 1 hazard dwellings 4,060 30.6% 9.9% 7.8%
In need of repair 4,200 31.4% 10.2% 8.8%
Lacking modern facilities 400 3.0% 1.0% 2.4% Poor degree of thermal comfort
9,600 71.7% 23.3% 26.3%
5.4.2 Thermal comfort failure is the primary cause of failure of the Decent Homes Standard in Newark and Sherwood, which is consistent with the primary cause of failure at the all England level. Failures due to lack of adequate modern facilities are slightly lower than the all England
38
Newark and Sherwood District Council Private Sector House Condition Survey March 2007
position. The proportion failing in Newark and Sherwood and England, however, is very low, which reflects the fact that the guidelines for this category are not stringent. For example, even if a kitchen or bathroom had an item older than the specified period it would not fail unless there were multiple items over the specified age.
5.4.3 Failures of the Decent Homes Standard due to Category 1 hazards and disrepair are both higher than the national average.
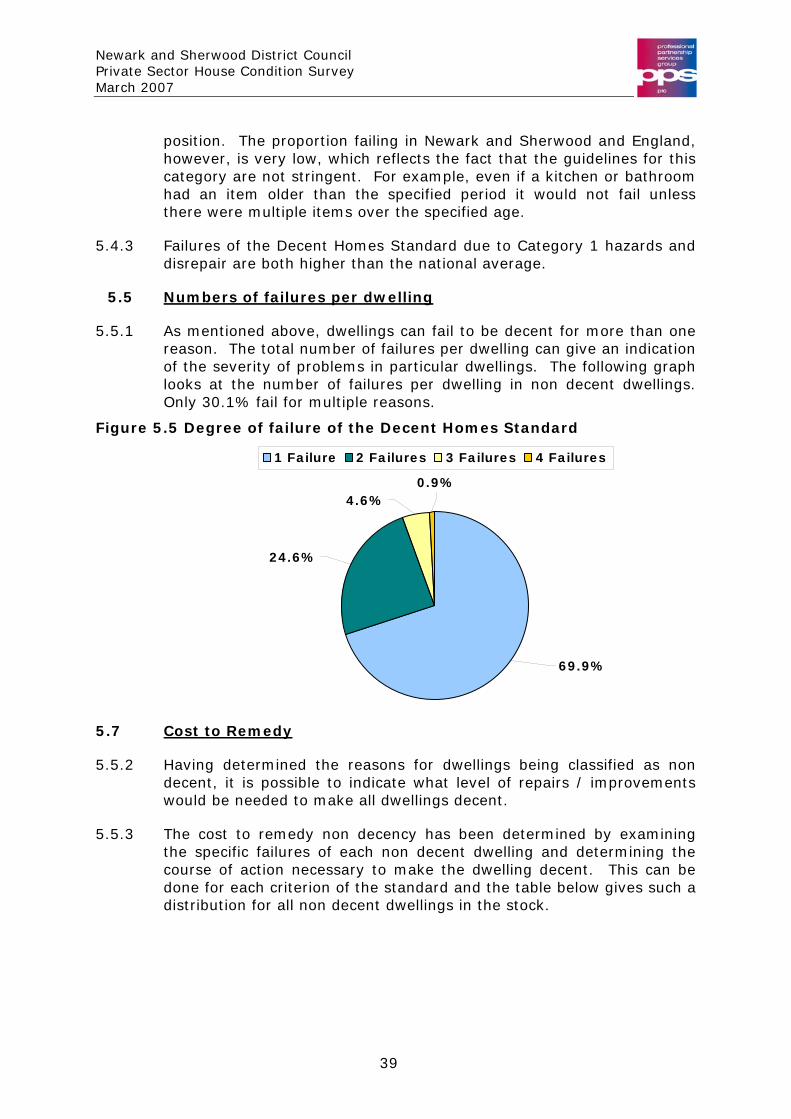
5.5 Numbers of failures per dwelling
5.5.1 As mentioned above, dwellings can fail to be decent for more than one reason. The total number of failures per dwelling can give an indication of the severity of problems in particular dwellings. The following graph looks at the number of failures per dwelling in non decent dwellings. Only 30.1% fail for multiple reasons.
Figure 5.5 Degree of failure of the Decent Homes Standard
69.9%
24.6%
4.6%0.9%
1 Failure 2 Failures 3 Failures 4 Failures
5.7 Cost to Remedy
5.5.2 Having determined the reasons for dwellings being classified as non decent, it is possible to indicate what level of repairs / improvements would be needed to make all dwellings decent.
5.5.3 The cost to remedy non decency has been determined by examining the specific failures of each non decent dwelling and determining the course of action necessary to make the dwelling decent. This can be done for each criterion of the standard and the table below gives such a distribution for all non decent dwellings in the stock.
39

Newark and Sherwood District Council Private Sector House Condition Survey March 2007
Table 5.2 Repair cost by non-decency reason (HHSRS)
Reason Total Cost (£ million)
Cost per dwelling (£s)
Category 1 Hazard £13.2 £3,200
Repair £28.3 £6,700
Amenities £4.5 £11,800
Thermal comfort £11.8 £1,300
Total £57.9 £4,700
5.5.4 The costs are based on the assumption that only the items that cause dwellings to be non decent are tackled. Comprehensive repairs (referred to later) most closely resemble traditional renovation grant costs, but the costs given here are lower as they relate to the works necessary to deal only with failing items and not all repair issues.
5.5.5 The cost to remedy Category 1 hazards is generally lower than the cost to rectify unfitness. This is due to the fact that many of these hazards can be rectified at low cost as they do not involve the expensive work to the fabric of the dwelling often associated with some fitness failures.
5.5.6 Remedying the problems of thermally inefficient dwellings is more complex. Limited individual improvements to dwellings would move some into thermal comfort, whereas others would require multiple improvements.
5.6 Private sector vulnerable occupier base-line
5.6.1 At present the government target set for achieving decency standards in the private sector is that under PSA 7, where 65% of all dwellings occupied by vulnerable residents should be made decent by 2006/07. In practice, the most challenging target will be the 70% to be met by 2010/11. Vulnerable households are defined as those in receipt of the benefits listed below, certain of which are means tested:
• Income support
• Housing benefit
• Council tax benefit
• Income based job seekers allowance
• Attendance allowance
• Disabled living allowance
• Industrial injuries disablement benefit
• War disablement pension
• Pension credit
40
Newark and Sherwood District Council Private Sector House Condition Survey March 2007
• Working tax credit (with a disability element) [total income < £15,050]
• Child tax credit [total income < £15,050]
5.6.2 In Newark and Sherwood, at present, there are 9,190 private sector dwellings (owner occupied and privately rented) occupied by residents in receipt of one of the benefits listed above. Of these an estimated 3,470 are classified non decent using the HHSRS, which represents 37.7% of dwellings occupied by a vulnerable resident. Conversely this means that 62.3% are decent.
5.6.3 On this basis Newark and Sherwood currently falls short of the minimum standard required by 2006/07 for decent homes occupied by vulnerable people in the private sector (65%). The shortfall against this target is approximately 252 dwellings that would need to be made decent to raise the proportion of vulnerable occupiers living in decent homes to 65%.
5.6.4 In order to raise the proportion of private sector dwellings, occupied by vulnerable people, above the 70% threshold for decency (2010 target), 712 dwellings would need to be made decent. As both of these figures are based on a sample survey they will be subject to statistical variance and may therefore actually be higher or lower, but regardless work will need to be done to ensure the Council meets the targets set by Central Government.
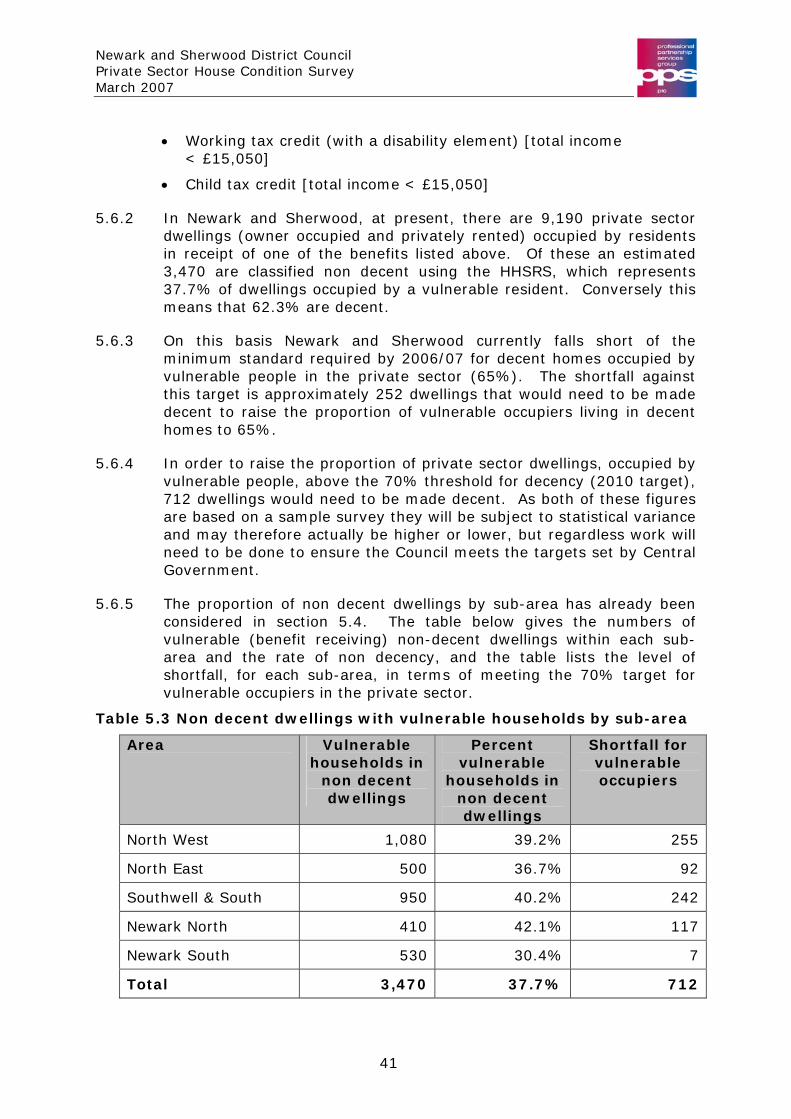
5.6.5 The proportion of non decent dwellings by sub-area has already been considered in section 5.4. The table below gives the numbers of vulnerable (benefit receiving) non-decent dwellings within each sub-area and the rate of non decency, and the table lists the level of shortfall, for each sub-area, in terms of meeting the 70% target for vulnerable occupiers in the private sector.
Table 5.3 Non decent dwellings with vulnerable households by sub-area
Area Vulnerable households in
non decent dwellings
Percent vulnerable
households in non decent dwellings
Shortfall for vulnerable occupiers
North West 1,080 39.2% 255
North East 500 36.7% 92
Southwell & South 950 40.2% 242
Newark North 410 42.1% 117
Newark South 530 30.4% 7
Total 3,470 37.7% 712
41
Newark and Sherwood District Council Private Sector House Condition Survey March 2007
5.6.6 These figures suggest that Newark North represents the best target for Newark and Sherwood District Council, as the shortfall against the ODPM target is proportionally higher, but not by a significant degree. Unlike the figures for non decency only, the above figures are affected by the proportion of vulnerable occupiers in these sub-areas and not just the rate of non decency. The figures tend to indicate that vulnerable occupiers are fairly widely distributed by sub-area, but that within each area they tend to gravitate toward non decent dwellings.
42
Newark and Sherwood District Council Private Sector House Condition Survey March 2007
6 Unfitness and Category One Hazards
6.1 Requirement to remedy poor housing
6.1.1 Formerly, under Part XI of the Housing Act 1985, local authorities had a statutory duty to take “the most satisfactory course of action” with regard to unfit dwellings and the Act was supported by relevant statutory guidance. A range of enforcement measures were available including service of statutory notices to make properties fit. Closure or demolition was only appropriate in the most extreme cases.
6.1.2 With owner occupied dwellings in particular, many local authorities looked to offer financial assistance, especially where owners were on low incomes. In the private rented sector enforcement action was much more likely in respect of unfit homes.
6.1.3 From April 2006 Part XI of the Housing Act 1985 was replaced by Part 1 of the Housing Act 2004. The new Act repeals the existing housing fitness standard and through statutory instruments and statutory guidance replaces it with the Housing Health and Safety Rating System.
6.1.4 As described in Chapter 2, the Act differentiates between Category 1 and Category 2 hazards. Local authorities have a duty to take “the most appropriate course of action” in respect of any hazard scored under the HHSRS as Category 1 and in effect this duty replaces the existing fitness standard. Authorities have discretionary power to take action with Category 2 hazards (which do not score past the threshold for Category 1). Further information on the fitness standard and on the HHSRS is given in Chapter 2, the Appendices and below.
6.2 Reporting on the two standards
6.2.1 The previous chapter lists the overall proportion of dwellings that are unfit and the proportion that contain Category 1 hazards. This chapter will take these two measures of condition further by examining the relationship between the two and other dwelling and social characteristics. However, given the April 2006 introduction of the HHSRS, the chapter will focus to a greater degree on the new system.
6.2.2 In addition the chapter will examine the cost implications for remedying these condition issues, as well as considering affordability for the residents, in terms of carrying out repair and/or improvement work.
6.3 Definition of unfit dwellings
6.3.1 A dwelling was deemed to be unfit for human habitation if it did not comply with the Housing Fitness Standard, as defined in the Housing Act 1985. The standard was a “whole house” standard. A surveyor
43
Newark and Sherwood District Council Private Sector House Condition Survey March 2007
noted defects in the dwelling inspected, and then made a judgment regarding the fitness of the dwelling, based upon this accumulated information.
6.3.2 A dwelling was unfit if it failed to meet one or more of one of 11 different requirements and due to the failure, was not reasonably suitable for occupation. The 11 criteria were as follows:
• Structural Stability • Disrepair • Dampness • Ventilation • Heating • Lighting • Water Supply • Food preparation • WC • Bath/Shower/WHB • Drainage
6.4 Definition of hazards under the HHSRS and Category level
6.4.1 The Housing Health and Safety Rating System (HHSRS) is intended to be a replacement for the fitness standard and is a prescribed method of assessing individual hazards, rather than a conventional standard to give a judgment of fit or unfit. The HHSRS is evidence based – national statistics on the health impacts of hazards encountered in the home are used as a basis for assessing individual hazards.
6.4.2 After the trial, the system for collecting hazard information was subsequently reviewed, along with the underlying statistics and a new, second version produced. Statutory guidance on Version 2 of the HHSRS was subsequently published in February 2006 and it is Version 2 that has been brought into force from April 2006, by statutory instruments made under the Housing Act 2004. The results from this survey will give an indication of likely future problems and will provide a useful comparative tool.
6.4.3 The new system deals with a much broader range of issues than the previous fitness standard. It covers a total of 29 hazards in four main groups:
• Physiological Requirements (e.g. damp & mould growth,
excess cold, asbestos, carbon monoxide, radon, etc).
• Psychological Requirements (crowding and space, entry by intruders, lighting, noise).
• Protection Against Infection (domestic hygiene, food safety, personal hygiene, water supply).
44
Newark and Sherwood District Council Private Sector House Condition Survey March 2007
• Protection Against Accidents (e.g. falls on the level, on stairs and steps and between levels, electrical hazards, fire, collision, etc.).
6.4.4 The HHSRS scoring system combines two elements: firstly, the probability that deficiency (i.e. a fault in a dwelling, whether due to disrepair or a design fault) will lead to a harmful occurrence (e.g. an accident or illness). Secondly, the spread of likely outcomes (i.e. the nature of the injury or illness). If an accident is very likely to occur and the outcome is likely to be extreme or severe (e.g. death or a major or fatal injury) then the score will be very high.
6.4.5 The approach adopted for this survey mirrors the EHCS 2003 methodology whereby the most common 7 hazards are examined; these being:
• Falls associated with stairs and steps • Falls on the level • Falls between levels • Fire • Hot surfaces & materials • Damp & mould growth • Excessive cold
6.4.6 The surveyor records the first five of these hazards during the inspection. The remaining two hazards (excessive cold and damp & mould growth) are modelled, based on the energy data and damp / condensation information collected. In practice, the great majority of hazards found are one of these seven types. Additional space is allocated on the form to collect hazards of any other category in case the surveyor comes across an unusual hazard that they wish to score.
6.4.7 All dwellings contain certain aspects that can be perceived as potentially hazardous, such as staircases and steps, heating appliances, electrical installation, glass, combustible materials, etc. It is when disrepair or inherent defective design makes an element of a dwelling significantly more likely to cause a harmful occurrence that it is scored under the HHSRS.
6.4.8 The exact scores generated under the HHSRS can be banded into one of ten bands from A to J, with bands A to C being further defined as Category 1 hazards and those in bands D to J as Category 2. The threshold score for a Category 1 hazard is 1,000. As stated earlier, a local authority has a duty to deal with any Category 1 hazards found, and a discretionary power to deal with Category 2 hazards. This survey focuses particularly on Category 1 hazards, but describes all hazards, including Category 2, for comparative purposes.
6.5
45
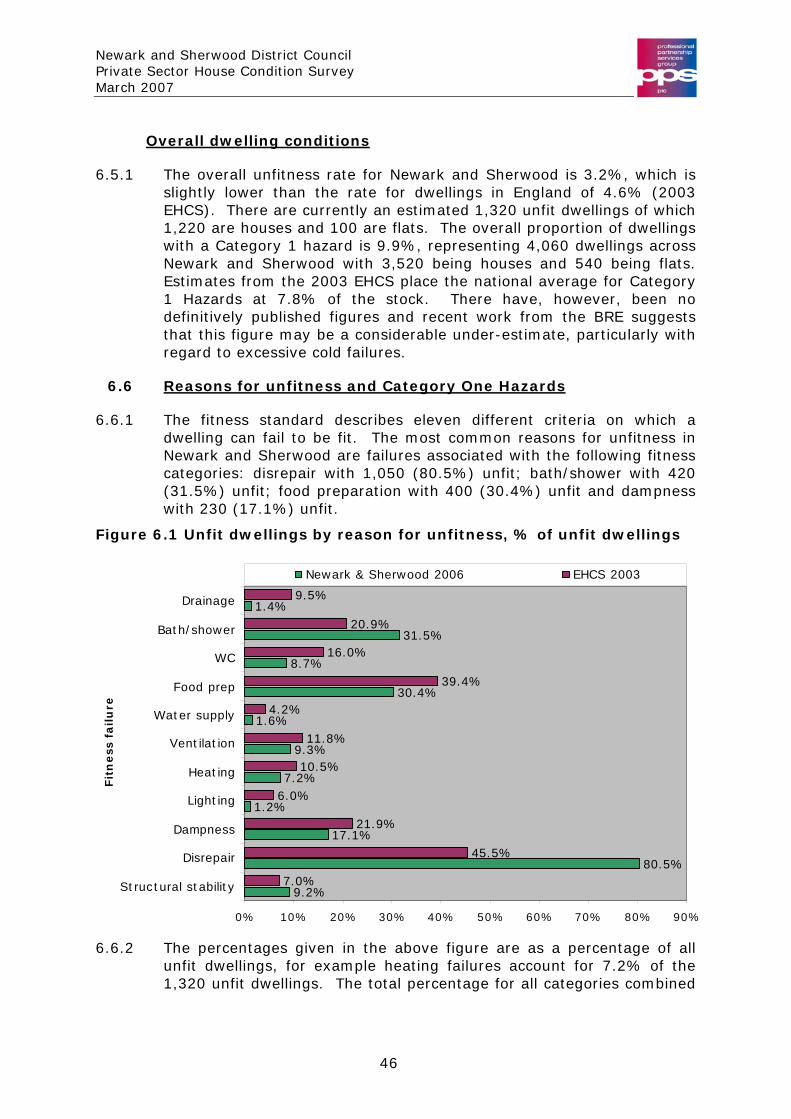
Newark and Sherwood District Council Private Sector House Condition Survey March 2007
Overall dwelling conditions
6.5.1 The overall unfitness rate for Newark and Sherwood is 3.2%, which is slightly lower than the rate for dwellings in England of 4.6% (2003 EHCS). There are currently an estimated 1,320 unfit dwellings of which 1,220 are houses and 100 are flats. The overall proportion of dwellings with a Category 1 hazard is 9.9%, representing 4,060 dwellings across Newark and Sherwood with 3,520 being houses and 540 being flats. Estimates from the 2003 EHCS place the national average for Category 1 Hazards at 7.8% of the stock. There have, however, been no definitively published figures and recent work from the BRE suggests that this figure may be a considerable under-estimate, particularly with regard to excessive cold failures.
6.6 Reasons for unfitness and Category One Hazards
6.6.1 The fitness standard describes eleven different criteria on which a dwelling can fail to be fit. The most common reasons for unfitness in Newark and Sherwood are failures associated with the following fitness categories: disrepair with 1,050 (80.5%) unfit; bath/shower with 420 (31.5%) unfit; food preparation with 400 (30.4%) unfit and dampness with 230 (17.1%) unfit.
Figure 6.1 Unfit dwellings by reason for unfitness, % of unfit dwellings
9.2%
80.5%
17.1%
1.2%
7.2%
9.3%
1.6%
30.4%
8.7%
31.5%
1.4%
7.0%
45.5%
21.9%
6.0%
10.5%
11.8%
4.2%
39.4%
16.0%
20.9%
9.5%
0% 10% 20% 30% 40% 50% 60% 70% 80% 90%
Structural stability
Disrepair
Dampness
Lighting
Heating
Ventilation
Water supply
Food prep
WC
Bath/shower
Drainage
Fit
ness
failu
re
Newark & Sherwood 2006 EHCS 2003
6.6.2 The percentages given in the above figure are as a percentage of all unfit dwellings, for example heating failures account for 7.2% of the 1,320 unfit dwellings. The total percentage for all categories combined
46
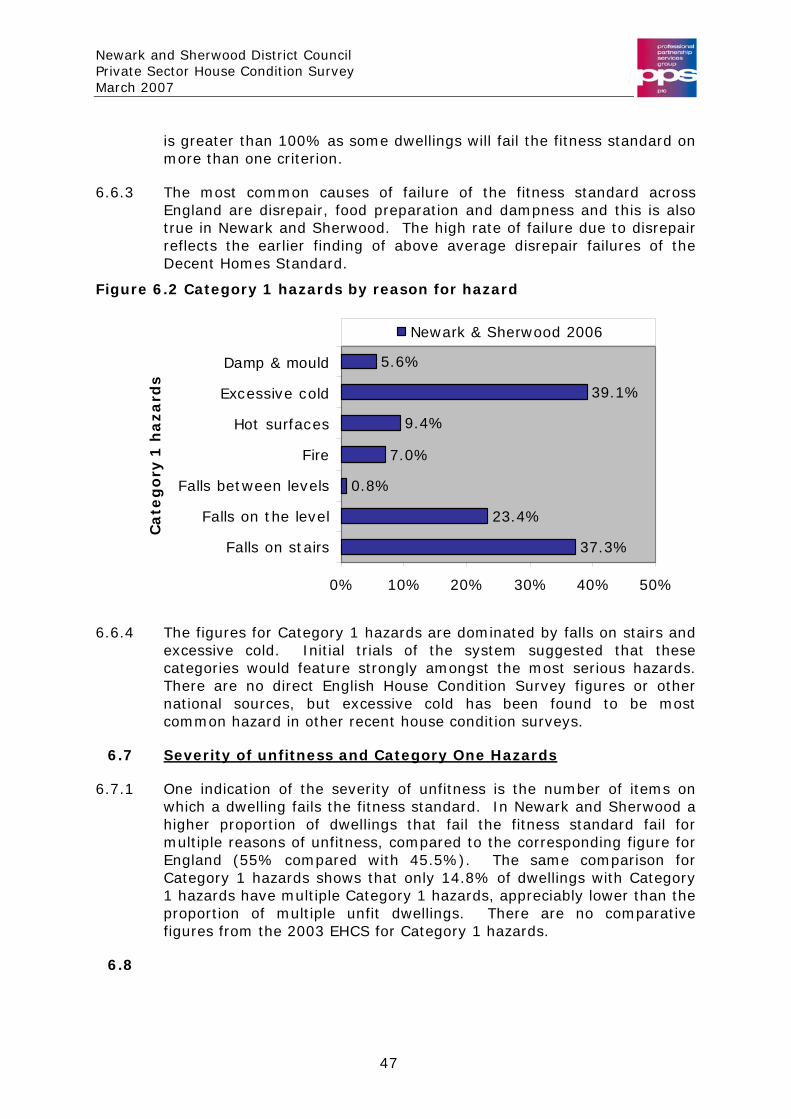
Newark and Sherwood District Council Private Sector House Condition Survey March 2007
is greater than 100% as some dwellings will fail the fitness standard on more than one criterion.
6.6.3 The most common causes of failure of the fitness standard across England are disrepair, food preparation and dampness and this is also true in Newark and Sherwood. The high rate of failure due to disrepair reflects the earlier finding of above average disrepair failures of the Decent Homes Standard.
Figure 6.2 Category 1 hazards by reason for hazard
37.3%
23.4%
0.8%
7.0%
9.4%
39.1%
5.6%
0% 10% 20% 30% 40% 50%
Falls on stairs
Falls on the level
Falls between levels
Fire
Hot surfaces
Excessive cold
Damp & mould
Ca
teg
ory
1 h
aza
rds
Newark & Sherwood 2006
6.6.4 The figures for Category 1 hazards are dominated by falls on stairs and excessive cold. Initial trials of the system suggested that these categories would feature strongly amongst the most serious hazards. There are no direct English House Condition Survey figures or other national sources, but excessive cold has been found to be most common hazard in other recent house condition surveys.
6.7 Severity of unfitness and Category One Hazards
6.7.1 One indication of the severity of unfitness is the number of items on which a dwelling fails the fitness standard. In Newark and Sherwood a higher proportion of dwellings that fail the fitness standard fail for multiple reasons of unfitness, compared to the corresponding figure for England (55% compared with 45.5%). The same comparison for Category 1 hazards shows that only 14.8% of dwellings with Category 1 hazards have multiple Category 1 hazards, appreciably lower than the proportion of multiple unfit dwellings. There are no comparative figures from the 2003 EHCS for Category 1 hazards.
6.8
47
Newark and Sherwood District Council Private Sector House Condition Survey March 2007
Overlap between Category 1 hazards and unfitness
6.8.1 Whilst the new HHSRS deals with a number of similar issues as the fitness standard, it is important to appreciate that the new system is significantly different in approach.
(i) It is a prescribed method of assessment which refers to a national evidence base on the health impacts of deficiencies in dwellings as opposed to a standard which focuses on building condition, i.e. it is more concerned with the effect on health of a fault in a building rather than the fact that a fault exists.
(ii) The new system is concerned with deficiencies in dwellings which can include inherent poor design as well as simply disrepair.
(iii) “Health” in the new Act is defined to include “physical, mental and social wellbeing”, i.e. it includes stress and issues such as social exclusion.
(iv) The range of hazards covered is broad and includes many matters not covered by the fitness standard, for example the presence of lead and radon, excess heat, noise, falls, fire, and hot surfaces.
6.8.2 Comparing “adequate provision of heating” under the fitness standard and “excess cold” under the HHSRS illustrates the differences. The fitness standard on heating has been criticised – it is met even if a dwelling does not have a fixed heating appliance, provided there is provision for one in the main living room (e.g. dedicated gas point or dedicated 13 amp socket outlet) and socket outlets/gas fires in other habitable rooms.
6.8.3 In contrast, the hazard of excess cold refers to the national evidence base which shows that a minimum of 20,000 excess winter deaths occur because of cold conditions (Housing Health and Safety Rating System: Operating Guidance, 2004, ODPM). Scoring the hazard takes into account both the effectiveness of the heating system (if any) and the thermal insulation of the dwelling. It is likely that a Category 1 hazard would exist at a dwelling with full gas central heating but no loft insulation.
6.8.4 The example of heating and excessive cold illustrates the shift of emphasis from unfitness to the HHSRS. Heating failures did not consider the overall efficiency of the dwelling at all. Failures due to excessive cold are designed to look at the potential health impact of having a dwelling that cannot be heated properly. The latter has a direct bearing on excess winter deaths and secondary problems with potential mould growth and respiratory problems.
48
Newark and Sherwood District Council Private Sector House Condition Survey March 2007
6.8.5 Because of the significant differences in approach with the new system, it is common that there is no direct overlap between dwellings which fail the fitness standard and those where there is a Category 1 hazard.
6.8.6 In Newark and Sherwood, for dwellings with a Category 1 hazard, there is a 13.9% overlap with unfit dwellings, i.e. of all the dwellings found to have a Category 1 hazard, 13.9% also fail the former Housing Fitness Standard and the remaining 86.1% have a Category 1 hazard, but no corresponding fitness failure. This degree of overlap corresponds closely to the average found in most studies conducted by pps in recent years. An analysis of the overlap for several authorities with different stock types showed an average overlap of 13% with the lowest at 8% and the highest at 30%.
6.8.7 The lack of a greater degree of overlap does present an important issue for the Council, as given that 86.1% of dwellings with a Category 1 hazard are not unfit (3,500 properties), they present a whole new set of dwellings that now require action. This reinforces the message that the HHSRS is an evidence based system drawing upon national figures, which show the health impact of deficiencies in dwellings, whereas the fitness standard was based on the failure of the dwelling to meet standards, on the condition of building elements, or provision of elements. Only if unfitness items cause a potential hazard will they score under the HHSRS.
6.8.8 The 13.9% overlap between serious hazards and unfitness represents 570 dwellings that are both unfit and have a Category 1 hazard, which is 1.4% of the private sector stock. Those dwellings that are currently unfit, however, still represent clear targets for action as such dwellings are still far more prone to having serious hazards than dwellings that are not unfit.
6.9 Unfitness & Category One Hazards by general characteristics
6.9.1 This section examines the relationship between those general stock characteristics set out in Chapter 3 with the level of unfitness and Category 1 hazards. The following charts and commentary examine the rates of unfitness and Category 1 hazards by tenure, dwelling type and construction date.
6.9.2 The first chart below shows the rates of unfitness and Category 1 hazards by tenure. For both unfitness and Category 1 hazards, rates are higher for privately rented dwellings. The tenure difference with category 1 hazards, however, appears more pronounced than is the case for unfit dwellings.
49

Newark and Sherwood District Council Private Sector House Condition Survey March 2007
Figure 6.3 Rates of unfitness and Category 1 hazards by tenure
2.9%
6.4%
3.2%
21.3%
8.9%9.9%
0%
5%
10%
15%
20%
25%
Owner occupied Privately rented OverallTenure
Unfit Cat 1 Hazard
6.9.3 As shown in the figure below, converted flats have the highest rate of category 1 hazards at 53.3%, followed by low rise purpose built flats (27.1%) and terraced houses at 24.4%. The EHCS 2003 found that more progress had been made with houses than flats and as a result flats were around twice as likely to fail as houses. This is certainly true in Newark and Sherwood.
Figure 6.4 Rates of unfitness and Category 1 hazards by building type
0.9%
5.0%
4.5%
2.0%
1.3%
12.9%
0.0%
12.6%
12.4%
9.4%
7.5%
6.4%
53.3%
27.1%
0% 5% 10% 15% 20% 25% 30% 35% 40% 45% 50% 55% 60%
Small terraced house
Medium/large terracedhouse
Semi detached house
Detached house
Bungalow
Converted flats
Low rise purpose builtflats
Dw
ellin
g ty
pe.
Unfit Cat 1 Hazard
50
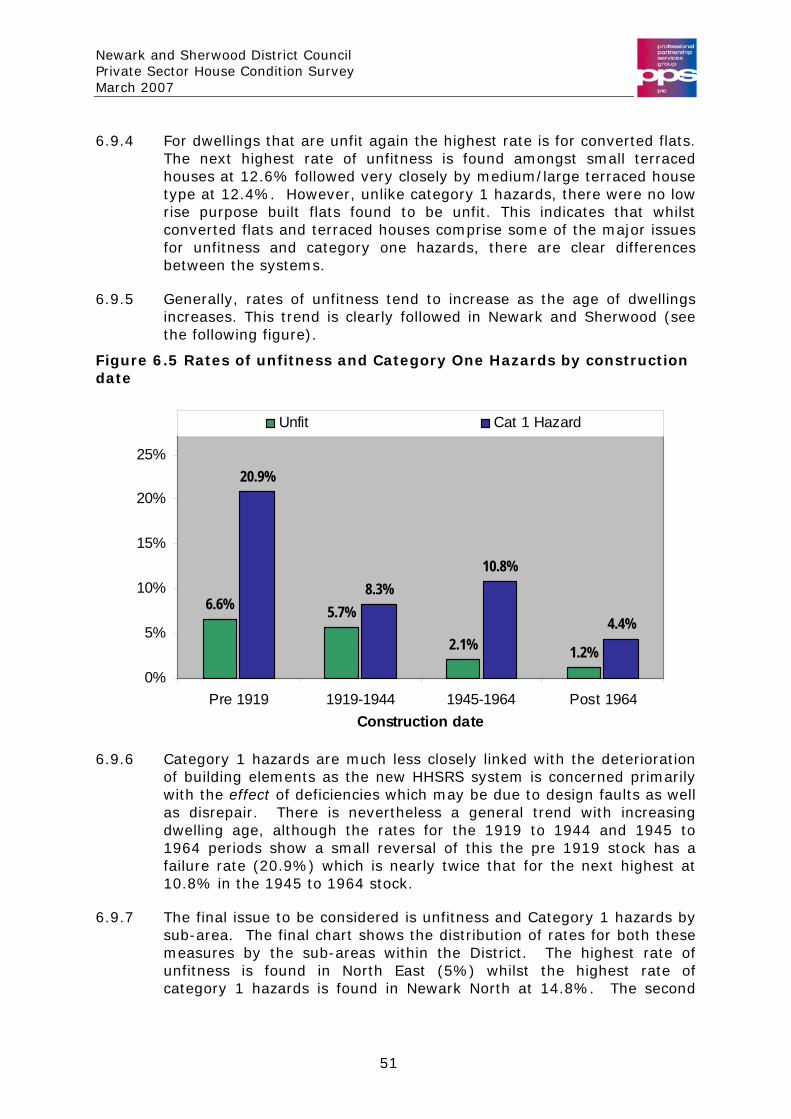
Newark and Sherwood District Council Private Sector House Condition Survey March 2007
6.9.4 For dwellings that are unfit again the highest rate is for converted flats. The next highest rate of unfitness is found amongst small terraced houses at 12.6% followed very closely by medium/large terraced house type at 12.4%. However, unlike category 1 hazards, there were no low rise purpose built flats found to be unfit. This indicates that whilst converted flats and terraced houses comprise some of the major issues for unfitness and category one hazards, there are clear differences between the systems.
6.9.5 Generally, rates of unfitness tend to increase as the age of dwellings increases. This trend is clearly followed in Newark and Sherwood (see the following figure).
Figure 6.5 Rates of unfitness and Category One Hazards by construction date
6.6% 5.7%
2.1% 1.2%
20.9%
8.3%10.8%
4.4%
0%
5%
10%
15%
20%
25%
Pre 1919 1919-1944 1945-1964 Post 1964Construction date
Unfit Cat 1 Hazard
6.9.6 Category 1 hazards are much less closely linked with the deterioration of building elements as the new HHSRS system is concerned primarily with the effect of deficiencies which may be due to design faults as well as disrepair. There is nevertheless a general trend with increasing dwelling age, although the rates for the 1919 to 1944 and 1945 to 1964 periods show a small reversal of this the pre 1919 stock has a failure rate (20.9%) which is nearly twice that for the next highest at 10.8% in the 1945 to 1964 stock.
6.9.7 The final issue to be considered is unfitness and Category 1 hazards by sub-area. The final chart shows the distribution of rates for both these measures by the sub-areas within the District. The highest rate of unfitness is found in North East (5%) whilst the highest rate of category 1 hazards is found in Newark North at 14.8%. The second
51
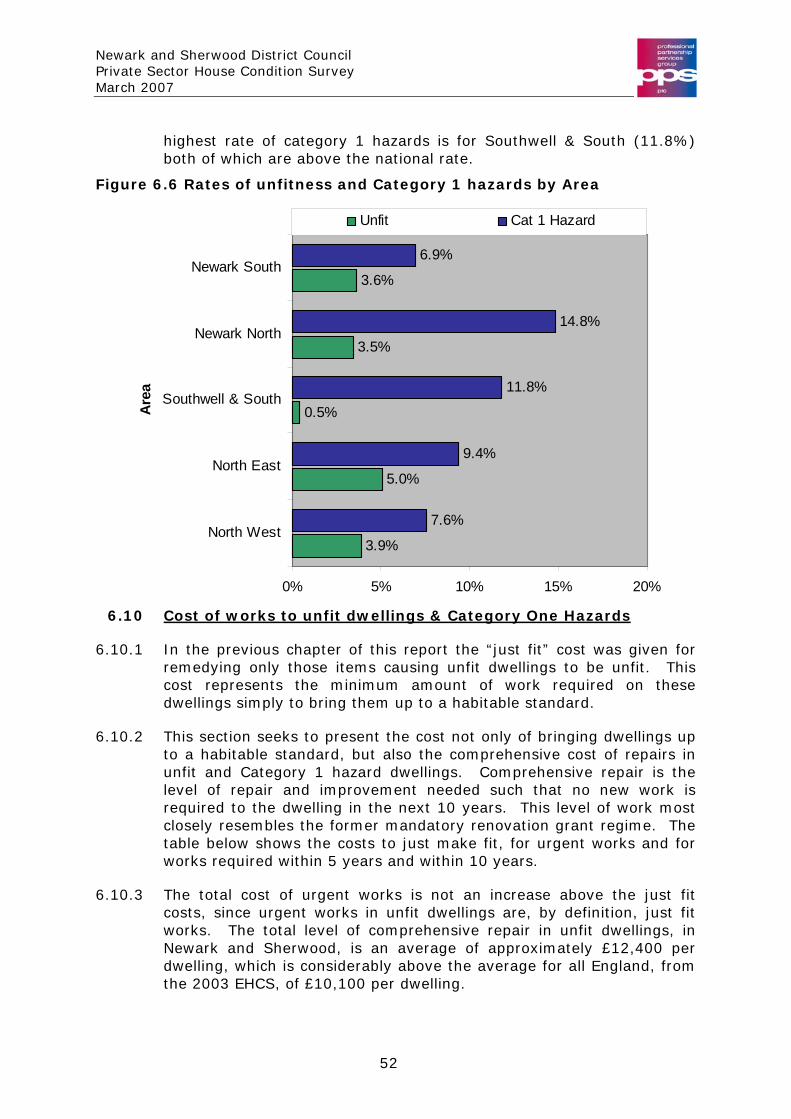
Newark and Sherwood District Council Private Sector House Condition Survey March 2007
highest rate of category 1 hazards is for Southwell & South (11.8%) both of which are above the national rate.
Figure 6.6 Rates of unfitness and Category 1 hazards by Area
3.9%
5.0%
0.5%
3.5%
3.6%
7.6%
9.4%
11.8%
14.8%
6.9%
0% 5% 10% 15% 20%
North West
North East
Southwell & South
Newark North
Newark South
Are
a
Unfit Cat 1 Hazard
6.10 Cost of works to unfit dwellings & Category One Hazards
6.10.1 In the previous chapter of this report the “just fit” cost was given for remedying only those items causing unfit dwellings to be unfit. This cost represents the minimum amount of work required on these dwellings simply to bring them up to a habitable standard.
6.10.2 This section seeks to present the cost not only of bringing dwellings up to a habitable standard, but also the comprehensive cost of repairs in unfit and Category 1 hazard dwellings. Comprehensive repair is the level of repair and improvement needed such that no new work is required to the dwelling in the next 10 years. This level of work most closely resembles the former mandatory renovation grant regime. The table below shows the costs to just make fit, for urgent works and for works required within 5 years and within 10 years.
6.10.3 The total cost of urgent works is not an increase above the just fit costs, since urgent works in unfit dwellings are, by definition, just fit works. The total level of comprehensive repair in unfit dwellings, in Newark and Sherwood, is an average of approximately £12,400 per dwelling, which is considerably above the average for all England, from the 2003 EHCS, of £10,100 per dwelling.
52

Newark and Sherwood District Council Private Sector House Condition Survey March 2007
Table 6.1 Repair costs in unfit dwellings by tenure
Tenure Just fit Urgent2 5 year2 Comprehensive2
Owner occupied (£millions)1 4.1 4.1 8.8 13.1
Average (£s) 3,700 3,700 7,900 11,700
Privately Rented (£millions)1 1.3 1.3 2.8 3.3
Average (£s) 6,300 6,300 13,300 15,600
All tenures (£millions)1 5.4 5.4 11.6 16.4
Average (£s) 4,100 4,100 8,800 12,400
1. Figures given in millions of pounds sterling 2. Figures are cumulative and therefore include the previous column
6.10.4 The following table gives the same distribution, but for dwellings with a Category 1 hazard instead.
Table 6.2 Repair costs in Category 1 hazard dwellings by tenure
Tenure Remedial Urgent2 5 year2 Comprehensive2
Owner occupied (£millions)1 6.7 6.8 11.9 27.5
Average (£s) 2,000 2,000 3,500 8,200
Privately Rented (£millions)1 2.2 2.2 4.1 7.2
Average (£s) 3,100 3,100 5,900 10,200
All tenures (£millions)1 8.8 9.0 16.0 34.7
Average (£s) 2,200 2,200 3,900 8,600
1. Figures given in millions of pounds sterling 2. Figures are cumulative and therefore include the previous column
6.10.5 Unlike with unfitness, it is possible to have urgent repair required to the fabric of the dwelling and this disrepair not result in a Category 1 hazard. In addition, since hazards have a weaker relationship to the fabric of the dwelling, repair costs are not as dependent upon the size of the dwelling.
53
Newark and Sherwood District Council Private Sector House Condition Survey March 2007
7 State of Repair
7.1 Improving the stock
7.1.1 This chapter seeks to examine the extent of work required to rectify further defects in private sector housing. In order to do this, three key questions must be considered:
• What is the cost of carrying out repairs and renewal? • Where are the problems concentrated: what types of dwelling;
which tenures; what ages of dwellings and what geographical areas?
• What are the financial circumstances of residents occupying these dwellings and how likely is it that they will be able to afford necessary repairs?
7.1.2 This chapter considers: (i) What works are required to remedy those dwellings failing
the Decent Homes Standard on the repair category.
(ii) What works are required to all other dwellings that are decent but where more minor repair issues exist.
7.2 Cost calculation
7.2.1 Costs derived from the house condition survey are calculated for each individual dwelling surveyed. Costs are calculated in four separate areas: external repairs, internal repairs, amenities costs and costs relating to common parts of flats (where common parts exist). A schedule of rates is used that lists the unit cost of all elements of the dwelling recorded during the survey (for example: the cost of roofing slates per square metre, or the cost of guttering per metre length). The schedule of rates is derived from national information on building costs.
7.2.2 For external repair, a spatial model of the building is created using the dimension information. The proportion of repair is multiplied by the overall quantity for a given element and then by the unit cost for that element. For internal repair to elements, such as plasterwork, flooring etc, the actual quantity of repair required is recorded. Amenities are recorded on the basis of whether they require no work; repair; replacement; or installation. Common parts repairs are recorded on the basis of the specific quantity noted by the surveyor.
7.2.3 Once all costs have been calculated, they are assigned to a time frame. Where a dwelling is unfit, certain works relating to this unfitness are indicated as being urgent and these costs are isolated to form the “just fit” costs, described in the previous chapter. The remaining urgent
54
Newark and Sherwood District Council Private Sector House Condition Survey March 2007
costs represent those works that should be carried out within the next year. All other costs are generated based on the age of element and renewal period of that element. These costs are banded into 5 year, 10 year and 30 year costs.
7.2.4 The term “works” is used in relation not only to repair costs but also to other activities in relation to housing condition. This term is used, as frequently the cost described does not solely relate to repair, but can relate to replacement of building elements or installation of elements and/or amenities (i.e. improvements).
7.3 Remedial repair works in non decent dwellings
7.3.1 The previous chapter examined the extent of unfitness and the extent of Category 1 hazards, as well as the cost of remedying these. The cost to carry out repairs to building elements, which fail the Decent Homes Standard under the repair criterion, can be calculated. A detailed definition of what constitutes a failure under the repair criterion is given in the appendices of this report, but a brief summary is given below:
• Wall structure: external wall construction old and in need of major repair.
• Lintels: as for external wall structure. • Brickwork (spalling): exterior wall finish requiring resurfacing or
replace. • Wall finish: other wall surface finishes in poor condition and old. • Roof structure: major repair problems to roof structure. • Roof covering: replacement of significant areas of roof covering
required. • Chimney: major repair or rebuild of chimneys required. • Windows: replacement of windows required. • External doors: replacement of external doors required. • Heating central heating gas boiler: boiler requires replacement. • Heating other: other heating system is non functional. • Electrical systems: electrical systems are old and non-compliant • Minor works: two or more of – kitchens; bathrooms; central heating
distribution.
7.3.2 It should be noted that, for all categories of repair, an element only fails if it is both old (beyond its design life) and in poor condition (as defined in the appendices).
7.3.3 The total cost to remedy all disrepair issues, covered under the Decent Homes Standard, is £28.2 million. Based upon the total number of dwellings requiring repairs under criterion B of the standard (4,200) this equates to an average repair cost of £6,700 per dwelling that fails the Decent Homes Standard on repair. The remedial cost is an average and in this case is based on a wide range of costs, from the limited
55
Newark and Sherwood District Council Private Sector House Condition Survey March 2007
(e.g. a replacement boiler) and the most extensive (e.g. a replacement roof).
7.3.4 The table below gives a breakdown of the total cost, within each repair category, and the average cost per dwelling.
Table 7.1 Cost to remedy repairs under the Decent Homes Standard
Total cost to remedy
Average Cost Category
£milllions £s
Windows cost 5.4 3,070
Electrics cost 3.3 1,430
Boiler cost 2.2 900
Roof cost 6.2 7,570
Minor repairs 1.9 1,000
Doors cost 1.3 420
Other heating cost 0.8 500
Wall surface2 3.5 4,910
Wall structure1 1.9 4,070
Chimney cost 1.7 5,130
Total 28.2 6,700 1. Includes the cost of repair for lintels 2. Includes the cost of repair for spalling brickwork
7.3.5 The table above gives a good indication of the distribution of repairs. It is typically the case that works to windows, electrics and boilers form the predominant part of failures under the repair criterion of the Decent Homes Standard. In Newark and Sherwood, unusually, the total cost of repairs to roofs is considerably higher than repairs to boilers. It should be noted, however, that these results are based on a sub-set of data from a sample survey and therefore should only be regarded as indicative.
7.4 Comprehensive repair works in non decent dwellings
7.4.1 In addition to the cost of works to bring dwellings up to the Decent Homes Standard where they fail due to poor state of repair, as with unfitness and Category 1 hazards, it is also possible to consider the comprehensive cost of repairs in these dwellings.
56
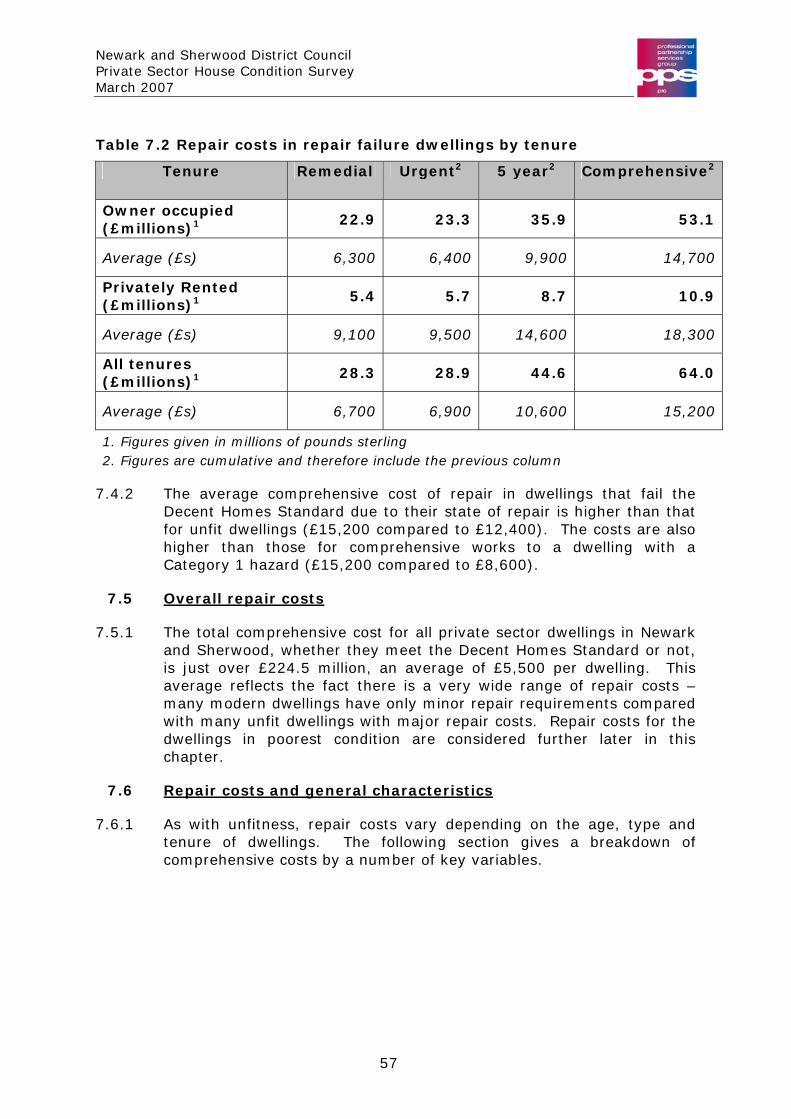
Newark and Sherwood District Council Private Sector House Condition Survey March 2007
Table 7.2 Repair costs in repair failure dwellings by tenure
Tenure Remedial Urgent2 5 year2 Comprehensive2
Owner occupied (£millions)1 22.9 23.3 35.9 53.1
Average (£s) 6,300 6,400 9,900 14,700
Privately Rented (£millions)1 5.4 5.7 8.7 10.9
Average (£s) 9,100 9,500 14,600 18,300
All tenures (£millions)1 28.3 28.9 44.6 64.0
Average (£s) 6,700 6,900 10,600 15,200
1. Figures given in millions of pounds sterling 2. Figures are cumulative and therefore include the previous column
7.4.2 The average comprehensive cost of repair in dwellings that fail the Decent Homes Standard due to their state of repair is higher than that for unfit dwellings (£15,200 compared to £12,400). The costs are also higher than those for comprehensive works to a dwelling with a Category 1 hazard (£15,200 compared to £8,600).
7.5 Overall repair costs
7.5.1 The total comprehensive cost for all private sector dwellings in Newark and Sherwood, whether they meet the Decent Homes Standard or not, is just over £224.5 million, an average of £5,500 per dwelling. This average reflects the fact there is a very wide range of repair costs – many modern dwellings have only minor repair requirements compared with many unfit dwellings with major repair costs. Repair costs for the dwellings in poorest condition are considered further later in this chapter.
7.6 Repair costs and general characteristics
7.6.1 As with unfitness, repair costs vary depending on the age, type and tenure of dwellings. The following section gives a breakdown of comprehensive costs by a number of key variables.
57
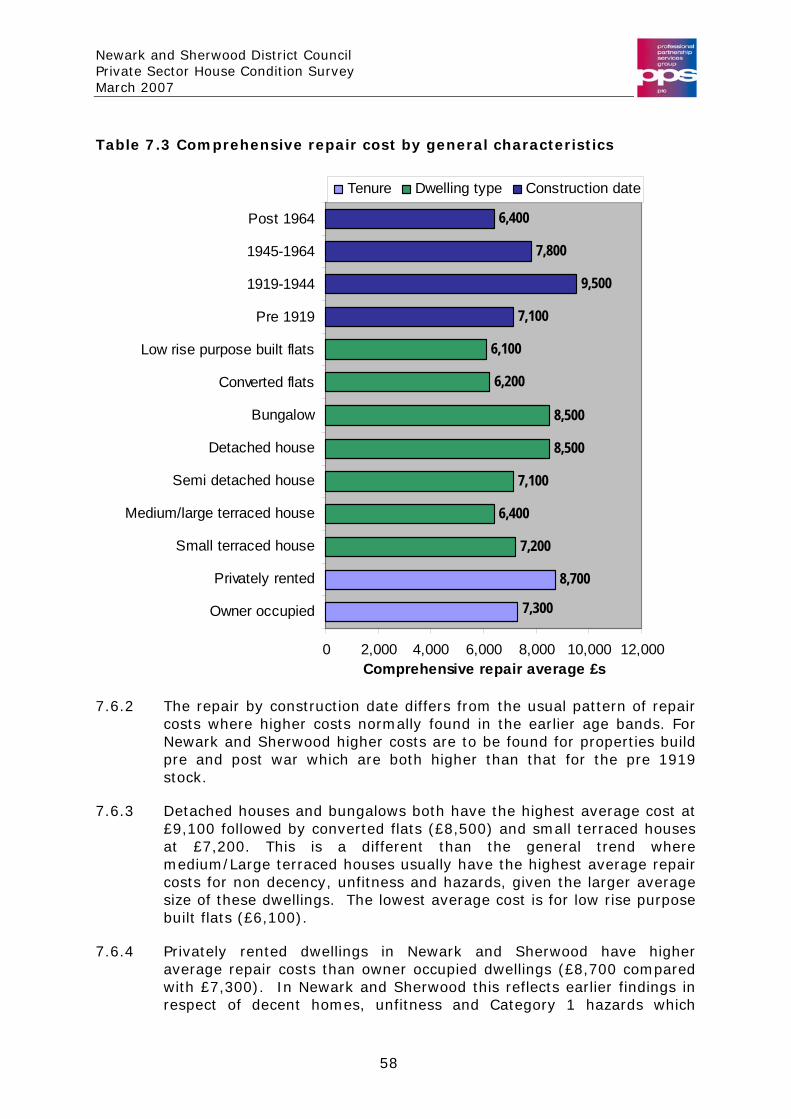
Newark and Sherwood District Council Private Sector House Condition Survey March 2007
Table 7.3 Comprehensive repair cost by general characteristics
8,700
7,200
6,400
7,100
8,500
8,500
6,200
6,100
7,100
9,500
7,800
6,400
7,300
0 2,000 4,000 6,000 8,000 10,000 12,000
Owner occupied
Privately rented
Small terraced house
Medium/large terraced house
Semi detached house
Detached house
Bungalow
Converted flats
Low rise purpose built flats
Pre 1919
1919-1944
1945-1964
Post 1964
Comprehensive repair average £s
Tenure Dwelling type Construction date
7.6.2 The repair by construction date differs from the usual pattern of repair costs where higher costs normally found in the earlier age bands. For Newark and Sherwood higher costs are to be found for properties build pre and post war which are both higher than that for the pre 1919 stock.
7.6.3 Detached houses and bungalows both have the highest average cost at £9,100 followed by converted flats (£8,500) and small terraced houses at £7,200. This is a different than the general trend where medium/Large terraced houses usually have the highest average repair costs for non decency, unfitness and hazards, given the larger average size of these dwellings. The lowest average cost is for low rise purpose built flats (£6,100).
7.6.4 Privately rented dwellings in Newark and Sherwood have higher average repair costs than owner occupied dwellings (£8,700 compared with £7,300). In Newark and Sherwood this reflects earlier findings in respect of decent homes, unfitness and Category 1 hazards which
58
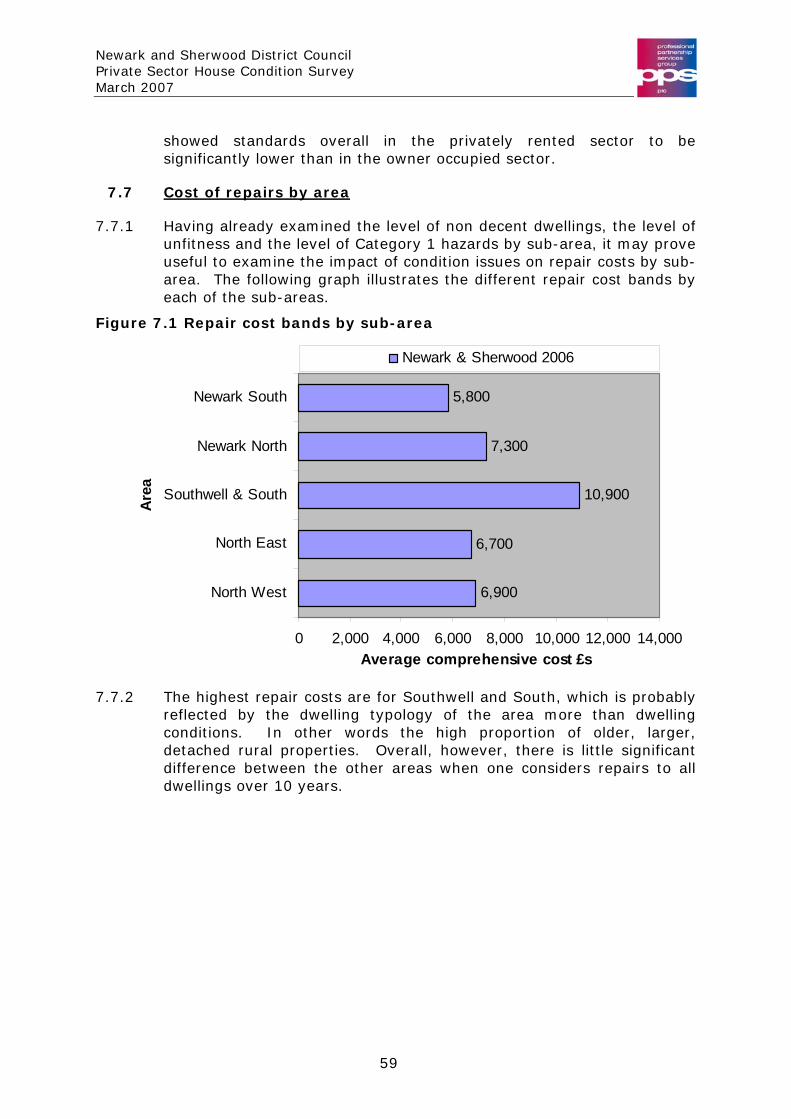
Newark and Sherwood District Council Private Sector House Condition Survey March 2007
showed standards overall in the privately rented sector to be significantly lower than in the owner occupied sector.
7.7 Cost of repairs by area
7.7.1 Having already examined the level of non decent dwellings, the level of unfitness and the level of Category 1 hazards by sub-area, it may prove useful to examine the impact of condition issues on repair costs by sub-area. The following graph illustrates the different repair cost bands by each of the sub-areas.
Figure 7.1 Repair cost bands by sub-area
well and South, which is probably reflected by the dwelling typology of the area more than dwelling
6,900
6,700
10,900
7,300
5,800
0 2,000 4,000 6,000 8,000 10,000 12,000 14,000
North West
North East
Southwell & South
Newark North
Newark South
Area
Average comprehensive cost £s
Newark & Sherwood 2006
7.7.2 The highest repair costs are for South
conditions. In other words the high proportion of older, larger, detached rural properties. Overall, however, there is little significant difference between the other areas when one considers repairs to all dwellings over 10 years.
59
Newark and Sherwood District Council Private Sector House Condition Survey March 2007
8 Modern Facilities
8.1 Introduction
8.1.1 So far this report has considered Criterion A of the Decent Homes Standard: Category 1 hazards (and the former standard - unfitness) and Criterion B: dwellings failing due to disrepair issues. The third criterion of the Decent Homes Standard is that a dwelling should have adequate modern facilities, and this chapter deals with that issue.
8.1.2 Few dwellings fail on this criterion at national level, and this is the case in Newark and Sherwood with only 400 (1%) dwellings failing for this reason. The low level of failure, both in Newark and Sherwood and nationally, is due to the relative leniency of this criterion. A dwelling only fails if it lacks three or more of the following:
• A kitchen which is 20 years old or less • A kitchen with adequate space and layout • A bathroom that is 30 years old or less • An appropriately located bathroom and WC • Adequate noise insulation • Adequate size and layout of common parts of flats
8.1.3 For example, if a dwelling had a kitchen and bathroom older than the specified date, it would not fail unless the kitchen had a poor layout or the bathroom was not properly located. In a largely urban environment, such as Newark and Sherwood, and with a reasonable turnover in the housing stock, failure on this criterion is unusual.
8.1.4 As a result of the relatively small number of dwellings failing the Decent Homes Standard on this criterion, it is not possible to further subdivide those failures to examine their tenure distribution or other characteristics. However, this chapter will examine the general provision of facilities and in particular consider the potential for a greater level of failure in the future.
8.2 Key basic amenities
8.2.1 The provision of key basic amenities has long been one of the key drivers of housing policy, with the aim that all dwellings should have an internal W.C., an adequate kitchen, an adequate bathroom, an electrical supply and the provision of hot and cold water.
8.2.2 In Newark and Sherwood 99% of dwellings have the provision of these basic five key amenities. There are estimated to be 400 dwellings that lack one or more of these facilities.
8.3
60
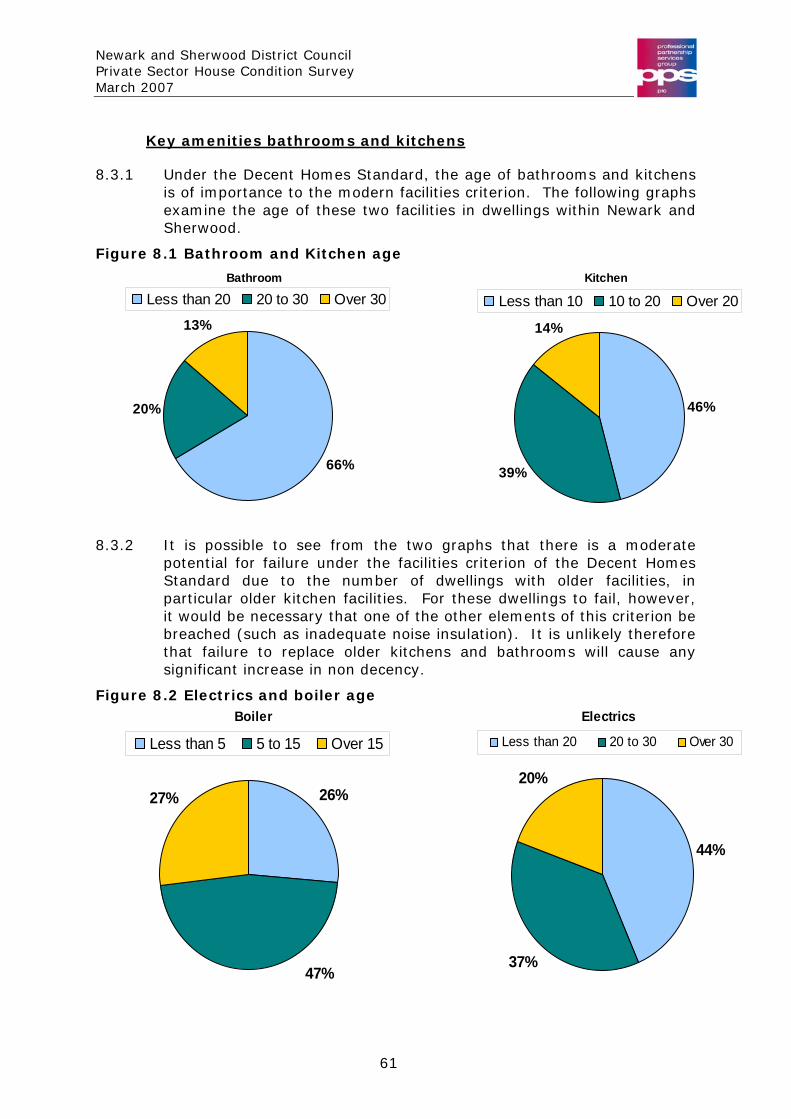
Newark and Sherwood District Council Private Sector House Condition Survey March 2007
Key amenities bathrooms and kitchens
8.3.1 Under the Decent Homes Standard, the age of bathrooms and kitchens is of importance to the modern facilities criterion. The following graphs examine the age of these two facilities in dwellings within Newark and Sherwood.
Figure 8.1 Bathroom and Kitchen age
Kitchen
52%38%
10%Less than 10 10 to 20 Over 20
Bathroom
66%
20%
13%
Less than 20 20 to 30 Over 30Kitchen
46%
39%
14%
Less than 10 10 to 20 Over 20
8.3.2 It is possible to see from the two graphs that there is a moderate potential for failure under the facilities criterion of the Decent Homes Standard due to the number of dwellings with older facilities, in particular older kitchen facilities. For these dwellings to fail, however, it would be necessary that one of the other elements of this criterion be breached (such as inadequate noise insulation). It is unlikely therefore that failure to replace older kitchens and bathrooms will cause any significant increase in non decency.
Figure 8.2 Electrics and boiler age
Boiler
26%27%
47%
Less than 5 5 to 15 Over 15
Electrics
44%
37%
20%
Less than 20 20 to 30 Over 30
61

Newark and Sherwood District Council Private Sector House Condition Survey March 2007
8.3.3 The second set of graphs examines the position for electrical systems and boilers. Electrical systems over 30 years of age are considered as reaching a point where regular inspection and testing is advisable to ensure that they are not likely to present a hazard. Many boilers over the age of 15 will still be working satisfactorily but they will be reaching the end of their economic life and their energy efficiency is likely to be declining. Boilers installed now have much higher levels of efficiency in order to meet current Building Regulations.
8.3.4 The age bands used in the four graphs above differ, dependent upon the design life of the amenity in question. The second band in each graph represents where the amenity will become older than its design life during the next ten years. Thus, for example, 47% of dwellings have a boiler that will become older than the recommended life-span in the next ten years, in addition to the 27% of boilers that are more than 15 years old already.
62
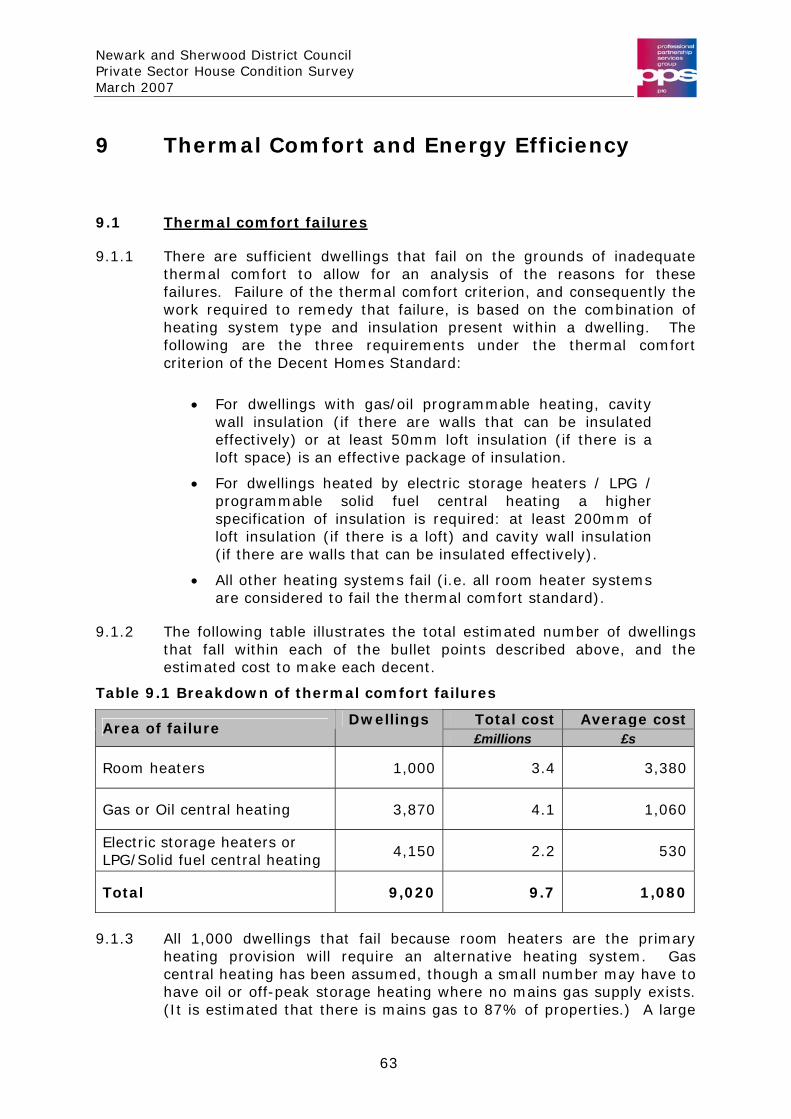
Newark and Sherwood District Council Private Sector House Condition Survey March 2007
9 Thermal Comfort and Energy Efficiency
9.1 Thermal comfort failures
9.1.1 There are sufficient dwellings that fail on the grounds of inadequate thermal comfort to allow for an analysis of the reasons for these failures. Failure of the thermal comfort criterion, and consequently the work required to remedy that failure, is based on the combination of heating system type and insulation present within a dwelling. The following are the three requirements under the thermal comfort criterion of the Decent Homes Standard:
• For dwellings with gas/oil programmable heating, cavity
wall insulation (if there are walls that can be insulated effectively) or at least 50mm loft insulation (if there is a loft space) is an effective package of insulation.
• For dwellings heated by electric storage heaters / LPG / programmable solid fuel central heating a higher specification of insulation is required: at least 200mm of loft insulation (if there is a loft) and cavity wall insulation (if there are walls that can be insulated effectively).
• All other heating systems fail (i.e. all room heater systems are considered to fail the thermal comfort standard).
9.1.2 The following table illustrates the total estimated number of dwellings that fall within each of the bullet points described above, and the estimated cost to make each decent.
Table 9.1 Breakdown of thermal comfort failures
Total cost Average cost Area of failure
Dwellings £millions £s
Room heaters 1,000 3.4 3,380
Gas or Oil central heating 3,870 4.1 1,060
Electric storage heaters or LPG/Solid fuel central heating
4,150 2.2 530
Total 9,020 9.7 1,080
9.1.3 All 1,000 dwellings that fail because room heaters are the primary heating provision will require an alternative heating system. Gas central heating has been assumed, though a small number may have to have oil or off-peak storage heating where no mains gas supply exists. (It is estimated that there is mains gas to 87% of properties.) A large
63
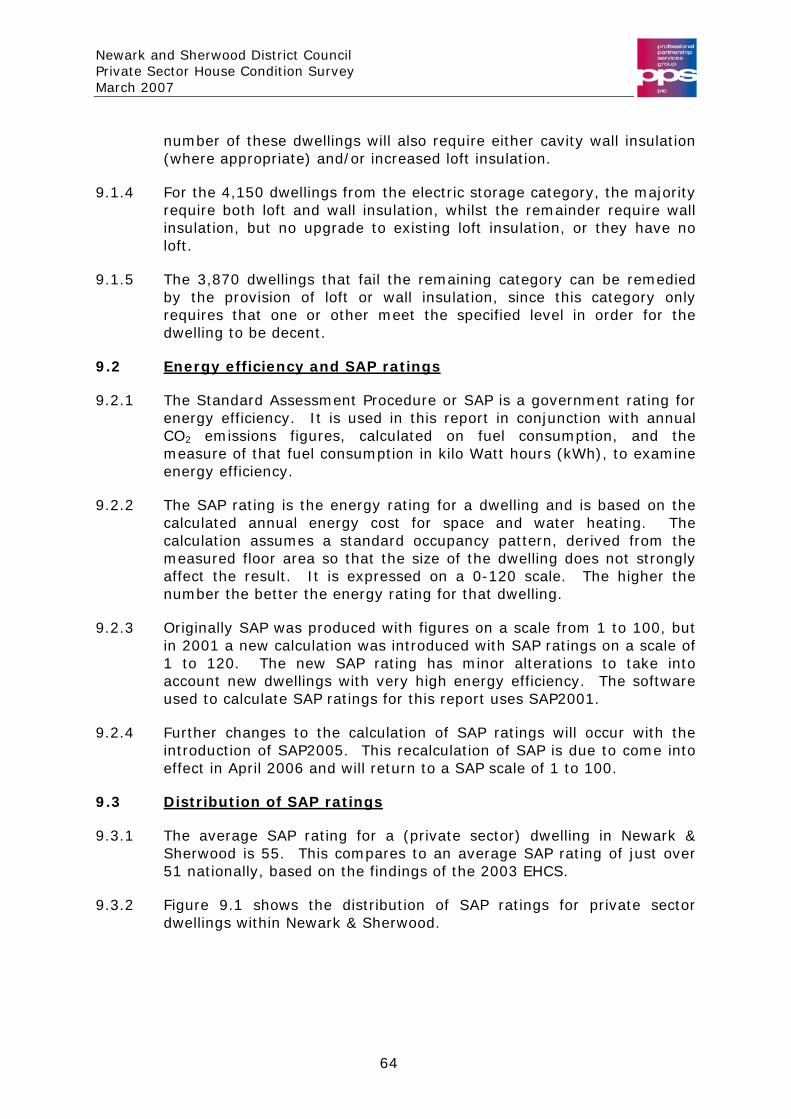
Newark and Sherwood District Council Private Sector House Condition Survey March 2007
number of these dwellings will also require either cavity wall insulation (where appropriate) and/or increased loft insulation.
9.1.4 For the 4,150 dwellings from the electric storage category, the majority require both loft and wall insulation, whilst the remainder require wall insulation, but no upgrade to existing loft insulation, or they have no loft.
9.1.5 The 3,870 dwellings that fail the remaining category can be remedied by the provision of loft or wall insulation, since this category only requires that one or other meet the specified level in order for the dwelling to be decent.
9.2 Energy efficiency and SAP ratings
9.2.1 The Standard Assessment Procedure or SAP is a government rating for energy efficiency. It is used in this report in conjunction with annual CO2 emissions figures, calculated on fuel consumption, and the measure of that fuel consumption in kilo Watt hours (kWh), to examine energy efficiency.
9.2.2 The SAP rating is the energy rating for a dwelling and is based on the calculated annual energy cost for space and water heating. The calculation assumes a standard occupancy pattern, derived from the measured floor area so that the size of the dwelling does not strongly affect the result. It is expressed on a 0-120 scale. The higher the number the better the energy rating for that dwelling.
9.2.3 Originally SAP was produced with figures on a scale from 1 to 100, but in 2001 a new calculation was introduced with SAP ratings on a scale of 1 to 120. The new SAP rating has minor alterations to take into account new dwellings with very high energy efficiency. The software used to calculate SAP ratings for this report uses SAP2001.
9.2.4 Further changes to the calculation of SAP ratings will occur with the introduction of SAP2005. This recalculation of SAP is due to come into effect in April 2006 and will return to a SAP scale of 1 to 100.
9.3 Distribution of SAP ratings
9.3.1 The average SAP rating for a (private sector) dwelling in Newark & Sherwood is 55. This compares to an average SAP rating of just over 51 nationally, based on the findings of the 2003 EHCS.
9.3.2 Figure 9.1 shows the distribution of SAP ratings for private sector dwellings within Newark & Sherwood.
64
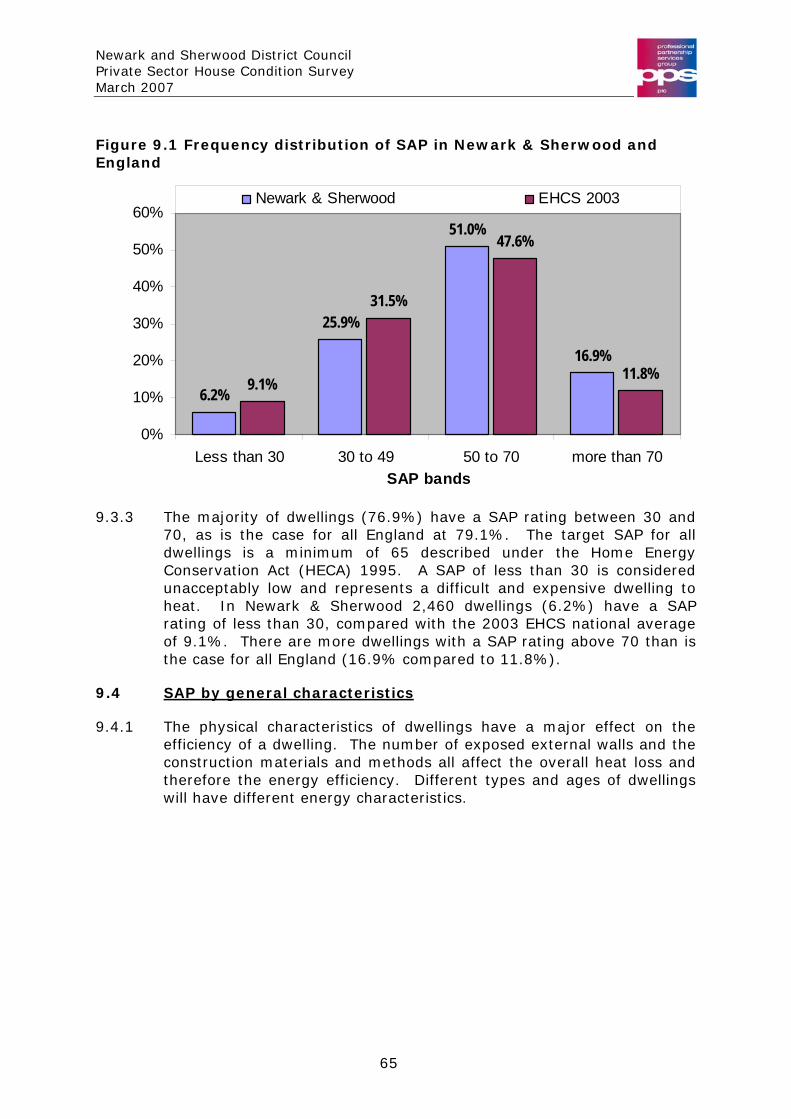
Newark and Sherwood District Council Private Sector House Condition Survey March 2007
Figure 9.1 Frequency distribution of SAP in Newark & Sherwood and
9.3.3 T
England
he majority of dwellings (76.9%) have a SAP rating between 30 and
9.4
6.2%
25.9%
51.0%
16.9%
9.1%
31.5%
47.6%
11.8%
0%
10%
20%
30%
40%
50%
60%
Less than 30 30 to 49 50 to 70 more than 70SAP bands
Newark & Sherwood EHCS 2003
70, as is the case for all England at 79.1%. The target SAP for all dwellings is a minimum of 65 described under the Home Energy Conservation Act (HECA) 1995. A SAP of less than 30 is considered unacceptably low and represents a difficult and expensive dwelling to heat. In Newark & Sherwood 2,460 dwellings (6.2%) have a SAP rating of less than 30, compared with the 2003 EHCS national average of 9.1%. There are more dwellings with a SAP rating above 70 than is the case for all England (16.9% compared to 11.8%).
SAP by general characteristics
9.4.1 The physical characteristics of dw ellings have a major effect on the efficiency of a dwelling. The number of exposed external walls and the construction materials and methods all affect the overall heat loss and therefore the energy efficiency. Different types and ages of dwellings will have different energy characteristics.
65
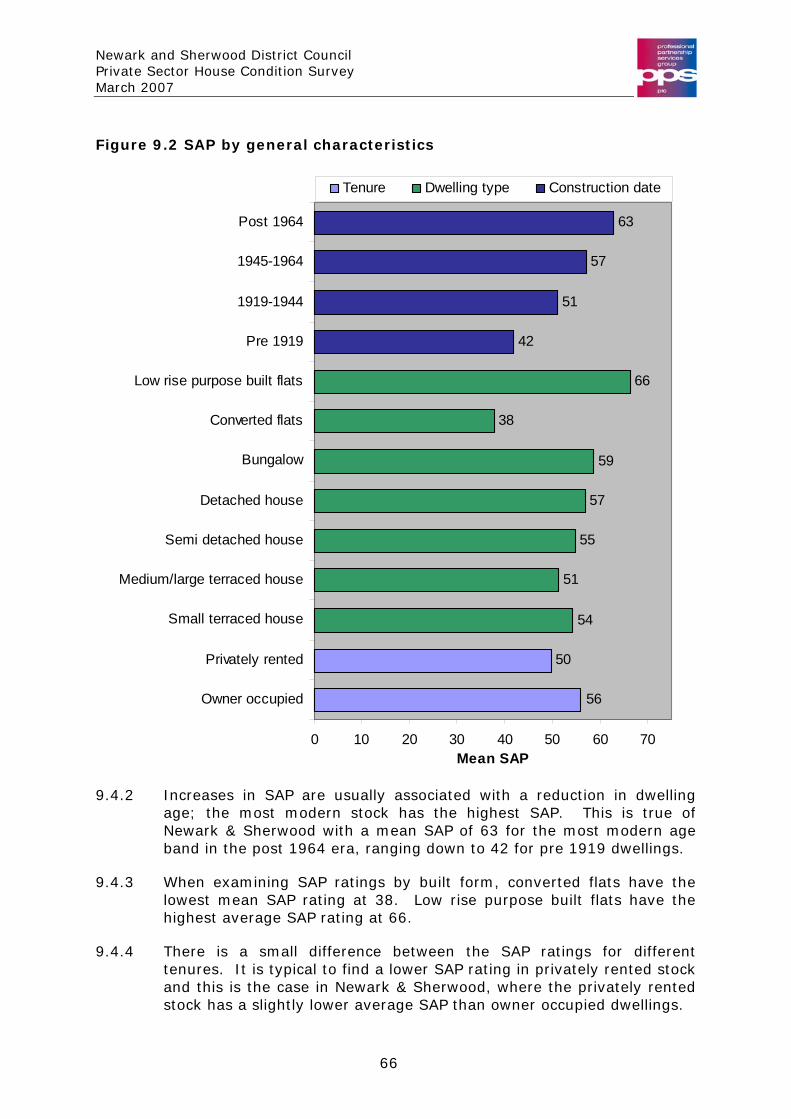
Newark and Sherwood District Council Private Sector House Condition Survey March 2007
Figure 9.2 SAP by general characteristics
50
54
51
55
57
59
38
66
42
51
57
63
56
0 10 20 30 40 50 60 70
Owner occupied
Privately rented
Small terraced house
Medium/large terraced house
Semi detached house
Detached house
Bungalow
Converted flats
Low rise purpose built flats
Pre 1919
1919-1944
1945-1964
Post 1964
Mean SAP
Tenure Dwelling type Construction date
9.4.2 Increases in SAP are usually associated with a reduction in dwelling age; the most modern stock has the highest SAP. This is true of Newark & Sherwood with a mean SAP of 63 for the most modern age band in the post 1964 era, ranging down to 42 for pre 1919 dwellings.
9.4.3 When examining SAP ratings by built form, converted flats have the lowest mean SAP rating at 38. Low rise purpose built flats have the highest average SAP rating at 66.
9.4.4 There is a small difference between the SAP ratings for different tenures. It is typical to find a lower SAP rating in privately rented stock and this is the case in Newark & Sherwood, where the privately rented stock has a slightly lower average SAP than owner occupied dwellings.
66

Newark and Sherwood District Council Private Sector House Condition Survey March 2007
9.4.5 The following graph shows the distribution of mean SAP ratings by sub-area.
Figure 9.3 Mean SAP by sub-area
55
51
50
56
56
0 10 20 30 40 50 60 7
North West
North East
Southwell & South
Newark North
Newark South
Area
Mean SAP
Newark & Sherwood
0
9.4.6 The lowest mean SAP rating is for Southwell & South and the highest are for Newark South and Newark North. The difference in SAP rating between sub-areas is minimal – only the mean SAP ratings for Southwell & South and the North East sub-areas show a statistically significant difference from the average mean SAP for Newark & Sherwood of 55.
9.4.7 Tenure, dwelling type age and sub-area are helpful in establishing the efficiency of the stock, but insulation and heating provision need to be examined to give a full picture.
9.5 Energy efficiency improvement
9.5.1 The 1995 Home Energy Conservation Act (HECA) aims to improve the energy efficiency of dwellings across the country. The Act is part of a broader government strategy to reduce the consumption of fossil fuels and thereby reduce the impact of energy use on the environment. The provision of effective insulation and more efficient heating systems (e.g. condensing boilers) reduces the fuel burnt to provide space heating and domestic hot water.
67
Newark and Sherwood District Council Private Sector House Condition Survey March 2007
9.5.2 The target local authorities were asked to achieve, was a 30% reduction in energy consumption over 15 years (1996 to 2011). As part of this strategy, local authorities were required to implement schemes that would encourage and assist with measures to reduce energy usage, to submit an annual return detailing the amount of energy being consumed by dwellings in their area, and to indicate how much of a reduction in consumption has occurred. The energy audit component of the HCS will provide a useful evidence base to determine if measures have been successful and identify new sub-areas that can be tackled in future.
9.5.3 The provision of different heating systems and insulation within the dwelling stock does allow scope for some dwellings to have additional insulation, improved heating, draught proofing, etc. Such improvements can lead to a reduction in energy consumption with consequent reduction in the emission of gases, such as carbon dioxide, implicated in climate change.
9.5.4 However, it should be noted that improving energy efficiency does not necessarily equate to a reduction in energy consumption. In the majority of cases there will be a reduction, but, for example, where a household is in fuel poverty and improvements are made, energy consumption may well go up. In such dwellings the occupiers may well have been heating the dwelling to an inadequate level using expensive fuel. Use of cheaper fuels can create affordable warmth, but also lead to increased energy consumption.
9.6 The cost and extent of improvement
9.6.1 The following figures are based on modelling changes in energy efficiency, brought about by installing combinations of items listed below. These are based on measures that have been provided by many Local Authorities and are loosely based on the Warm Front scheme. Loft insulation to 270mm
Cylinder insulation to 70mm Jacket (unless foam already)
Double Glazing to all windows
Cavity wall insulation
Installation of a modern high efficiency gas boiler where none is present
Full central heating where none is present
9.6.2 The computer model enters whatever combination of these measures is appropriate for a particular dwelling, taking into account the provision of heating and insulation shown by the survey.
9.7
68
Newark and Sherwood District Council Private Sector House Condition Survey March 2007
Future improvement
9.7.1 If all combinations of improvements listed above were carried out to all dwellings, the total cost would be £56.4 million, at an average cost of £1,490 per dwelling where improvements are required.
9.7.2 The total cost of improvements given above is distributed among 40,300 dwellings, 98% of the stock. The majority of these dwellings will have complied with Building Regulations current at the time they were built and realistically most of them will currently provide an adequate level of thermal efficiency. In most cases, however, there is still scope for improvement even if only minor.
9.7.3 The following analysis looks at how many dwellings could have each type of measure applied.
Table 9.2 All energy efficiency measures that could be carried out
Measure Dwellings Percent of stock
Loft insulation 39,200 95.3%
Wall insulation 13,800 33.6%
Double glazing 5,300 12.9%
Cylinder insulation 0 0.0%
New boiler 10,300 25.0%
New central heating 700 1.7%
Any measures 40,300 98.0%
9.7.4 The wide range of measures indicates that, in most cases, two or more improvements could be carried out. Generally loft insulation will be an improvement on existing insulation, rather than an installation where none exists. The same will also be true of cylinder insulation, where most improvements would be the replacement of old cylinders with jackets for new integral foam insulated cylinders. Installation of new central heating is only indicated where the dwelling currently relies solely on room heaters as the primary heating source.
9.8 Tackling fuel poverty
9.8.1 A key issue in reducing energy consumption is tackling fuel poverty. The occupiers of a dwelling are considered to be in fuel poverty if more than 10% of their net household income would need to be spent on heating and hot water to give an adequate provision of warmth and hot water. Not only do dwellings where fuel poverty exists represent dwellings with poor energy efficiency, but they are, by definition, occupied by residents with low incomes least likely to be able to afford improvements.
9.8.2 There are an estimated 7,650 (18.6%) dwellings in fuel poverty in Newark & Sherwood, compared to approximately 11% in England
69
Newark and Sherwood District Council Private Sector House Condition Survey March 2007
based on 2003 EHCS data, although the figure for England is likely to have reduced since 2003.
9.8.3 The 7,650 dwellings represent a significant number of dwellings that are in fuel poverty and will present issues in terms of both energy efficiency and occupier health. As is typical, the highest rate of fuel poverty is found in the private rented sector where 27.1% of dwellings are in fuel poverty, compared to 18.0% in the owner-occupied stock.
9.8.4 By the very nature of fuel poverty, it is almost always associated with those residents on the lowest incomes. Only 780 dwellings were found to be in fuel poverty where household incomes were above £15,000 per annum; a further 1,210 dwellings where income was between £10,000 - £15,000 per annum; and the remaining 5,650 (13.7% of private sector stock) were found where household incomes are below £10,000 per annum. This means the rate of fuel poverty is 63.1% amongst those households on the lowest incomes.
9.8.5 Fuel poverty is usually associated with dwellings where one or more residents are in receipt of a means tested benefit as such benefits are indicative of low income. This is true in Newark & Sherwood where fuel poverty is found in 2,960 households (32.1%) where a benefit is received, compared to 14.7% of dwellings where occupiers do not receive benefit.
9.8.6 For owner-occupiers, assistance in the form of advice can be given, as well as grants and other partnership schemes with energy efficiency companies and other organisations. The total cost of energy efficiency improvements to dwellings in fuel poverty in the owner-occupied sector is just over £14.2 million at an average cost per dwelling of £2,050. This expenditure requirement is distributed between the 6,900 owner-occupied dwellings in fuel poverty where works are possible.
9.9 Sub-area focus on fuel poverty
9.9.1 The highest proportion of fuel poverty is found in the North East area at 23.8%, followed by the North West at 21.6%. Since fuel poverty is strongly associated with income, these sub-areas are liable to have a high proportion of low income households. In the case of these areas, however, it is also the high proportion of rural, older dwellings which also has a negative effect on energy efficiency. The lowest level of fuel poverty is found in Newark South at 13.2%.
70
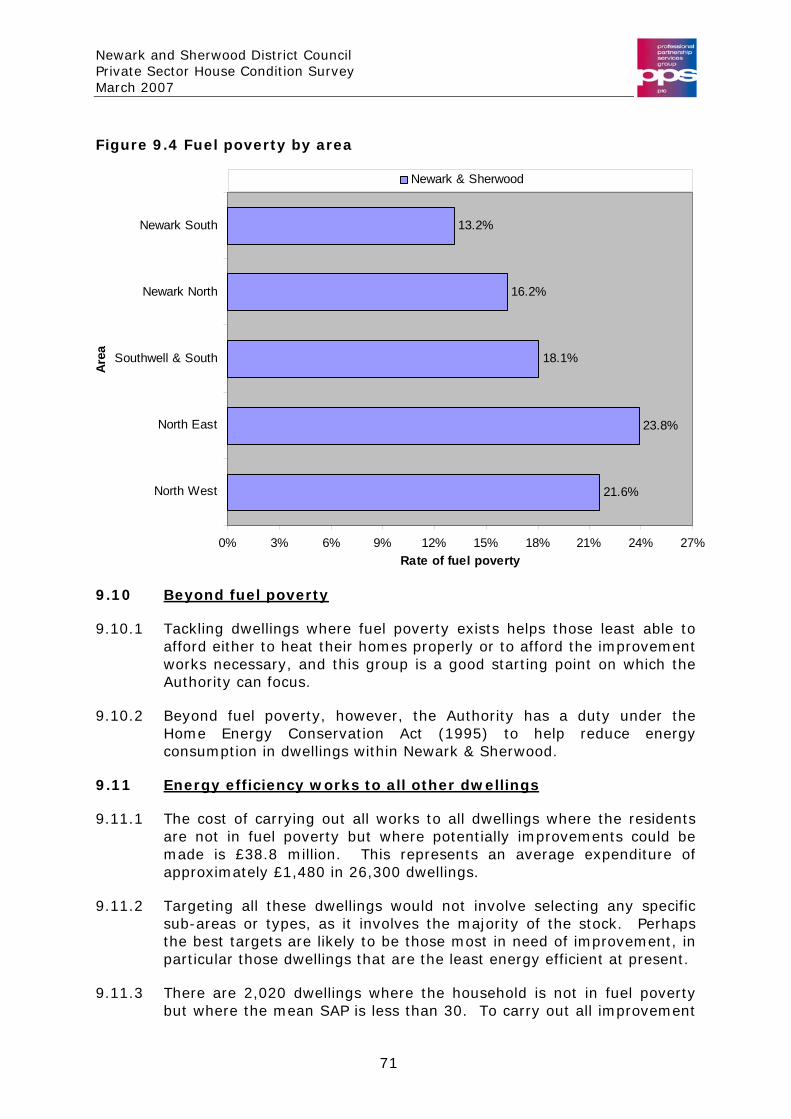
Newark and Sherwood District Council Private Sector House Condition Survey March 2007
Figure 9.4 Fuel poverty by area
21.6%
23.8%
18.1%
16.2%
13.2%
0% 3% 6% 9% 12% 15% 18% 21% 24% 27%
North West
North East
Southwell & South
Newark North
Newark South
Area
Rate of fuel poverty
Newark & Sherwood
9.10 Beyond fuel poverty
9.10.1 Tackling dwellings where fuel poverty exists helps those least able to afford either to heat their homes properly or to afford the improvement works necessary, and this group is a good starting point on which the Authority can focus.
9.10.2 Beyond fuel poverty, however, the Authority has a duty under the Home Energy Conservation Act (1995) to help reduce energy consumption in dwellings within Newark & Sherwood.
9.11 Energy efficiency works to all other dwellings
9.11.1 The cost of carrying out all works to all dwellings where the residents are not in fuel poverty but where potentially improvements could be made is £38.8 million. This represents an average expenditure of approximately £1,480 in 26,300 dwellings.
9.11.2 Targeting all these dwellings would not involve selecting any specific sub-areas or types, as it involves the majority of the stock. Perhaps the best targets are likely to be those most in need of improvement, in particular those dwellings that are the least energy efficient at present.
9.11.3 There are 2,020 dwellings where the household is not in fuel poverty but where the mean SAP is less than 30. To carry out all improvement
71
Newark and Sherwood District Council Private Sector House Condition Survey March 2007
works required for these dwellings would cost just over £5.7 million, with almost all of this cost being required for the owner-occupied stock. The mean cost per dwelling in the owner-occupied stock would be £2,840. The reason the average cost of improvements is higher is that many of these dwellings would require the installation of full central heating, insulation and other measures to bring their SAP above 30.
9.12 Achieving the 30% target
9.12.1 Improvements will have been made in reducing energy consumption since 1996, and these will need to be taken into account when considering what further improvements can be made. Given the work that has already been carried out on reducing energy consumption since 1996, the target of 30% is achievable, though difficult.
9.12.2 Since 1996 a reduction in energy consumption in the existing stock has been measured and this reduction has exceeded 30% since 1996. On this basis there is no requirement to improve energy efficiency to meet HECA targets. The fact that there are still dwellings that fail thermal comfort, have an excess cold hazard or have a household in fuel poverty means that energy efficiency improvement will need to continue well beyond the 30% level as set out under HECA.
9.12.3 To achieve a total reduction in energy consumption of 30% by 2011 will require a comprehensive range of measures to most dwellings where this is possible. It is likely to prove difficult to locate sufficient dwellings to carry out these works and any strategy will need considerable engagement with residents.
72
Newark and Sherwood District Council Private Sector House Condition Survey March 2007
10 Occupiers housing condition & environment
10.1 Relationships between factors
10.1.1 The third and fourth chapters of this report examined the general characteristics of dwellings and the general characteristics of occupiers. Subsequent chapters then examined the condition of dwellings and their energy efficiency. Having established this picture for Newark and Sherwood, it is worth considering what relationships exist between these factors.
10.1.2 There are many causal links that can be considered, for example a low household income may lead to difficulty in affording repairs leading to a dwelling in poor condition. It may also mean a household has little choice in available dwellings.
10.1.3 In statistical terms, defining causality can be difficult; in our example, does low income lead to poor conditions or are people on low incomes forced to choose dwellings in poor condition? Realistically both are true to a degree. This chapter aims to look at combinations of physical, social and environmental factors and seeks to establish what relationships can be demonstrated.
10.2 Age of Head of Household and condition
10.2.1 As part of the social survey a grid was completed containing basic details for each of the residents in a dwelling, such as their age, working status, sex, etc. It was left to residents to determine who was considered the head of the household, and therefore what the relationship between all other residents and the head was (e.g. spouse, child, parent lodger, etc.).
10.2.2 Age of head of household is a useful indicator as it generally gives an impression of the age of the household and its profile. It has also been found that dwelling conditions often vary according to the age of the head of household.
10.2.3 The following graph illustrates the relationship between age of head of household and levels of non decency. Within age groups, the highest rate of non decency is for households where the age of head of household is between 75 and 84 at 40.3%, followed by those where the head of household is aged 25 and 34 at 38.5%. In general, the pattern is that older and younger households occupy dwellings with higher rates of non decency. These results are indicative of the association of younger households to the private rented sector, and also raise issues of affordability with the oldest households.
73
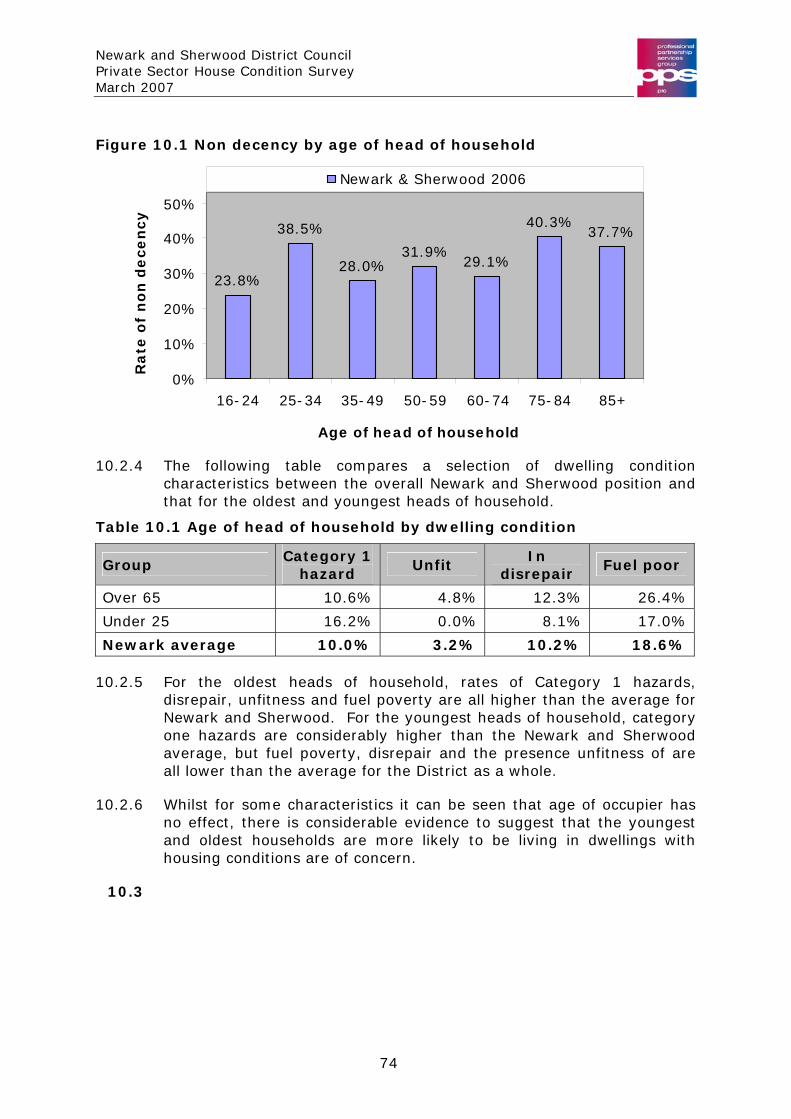
Newark and Sherwood District Council Private Sector House Condition Survey March 2007
Figure 10.1 Non decency by age of head of household
23.8%
38.5%
28.0%31.9%
29.1%
40.3%37.7%
0%
10%
20%
30%
40%
50%
16-24 25-34 35-49 50-59 60-74 75-84 85+
Age of head of household
Ra
te o
f n
on
de
ce
ncy
Newark & Sherwood 2006
10.2.4 The following table compares a selection of dwelling condition
characteristics between the overall Newark and Sherwood position and that for the oldest and youngest heads of household.
Table 10.1 Age of head of household by dwelling condition
Group Category 1
hazard Unfit
In disrepair
Fuel poor
Over 65 10.6% 4.8% 12.3% 26.4%
Under 25 16.2% 0.0% 8.1% 17.0%
Newark average 10.0% 3.2% 10.2% 18.6%
10.2.5 For the oldest heads of household, rates of Category 1 hazards, disrepair, unfitness and fuel poverty are all higher than the average for Newark and Sherwood. For the youngest heads of household, category one hazards are considerably higher than the Newark and Sherwood average, but fuel poverty, disrepair and the presence unfitness of are all lower than the average for the District as a whole.
10.2.6 Whilst for some characteristics it can be seen that age of occupier has no effect, there is considerable evidence to suggest that the youngest and oldest households are more likely to be living in dwellings with housing conditions are of concern.
10.3
74
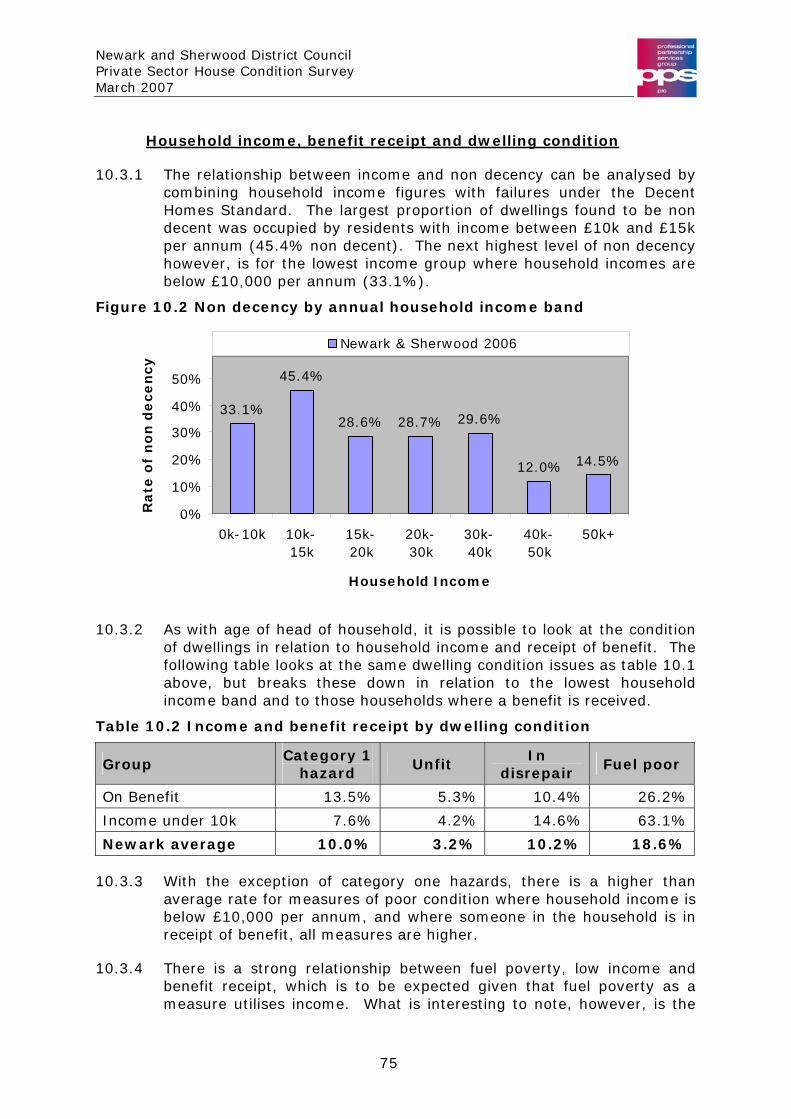
Newark and Sherwood District Council Private Sector House Condition Survey March 2007
Household income, benefit receipt and dwelling condition
10.3.1 The relationship between income and non decency can be analysed by combining household income figures with failures under the Decent Homes Standard. The largest proportion of dwellings found to be non decent was occupied by residents with income between £10k and £15k per annum (45.4% non decent). The next highest level of non decency however, is for the lowest income group where household incomes are below £10,000 per annum (33.1%).
Figure 10.2 Non decency by annual household income band
33.1%
45.4%
28.6% 28.7% 29.6%
12.0% 14.5%
0%
10%
20%
30%
40%
50%
0k-10k 10k-15k
15k-20k
20k-30k
30k-40k
40k-50k
50k+
Household Income
Ra
te o
f n
on
de
ce
ncy
Newark & Sherwood 2006
10.3.2 As with age of head of household, it is possible to look at the condition of dwellings in relation to household income and receipt of benefit. The following table looks at the same dwelling condition issues as table 10.1 above, but breaks these down in relation to the lowest household income band and to those households where a benefit is received.
Table 10.2 Income and benefit receipt by dwelling condition
Group Category 1
hazard Unfit
In disrepair
Fuel poor
On Benefit 13.5% 5.3% 10.4% 26.2%
Income under 10k 7.6% 4.2% 14.6% 63.1%
Newark average 10.0% 3.2% 10.2% 18.6%
10.3.3 With the exception of category one hazards, there is a higher than average rate for measures of poor condition where household income is below £10,000 per annum, and where someone in the household is in receipt of benefit, all measures are higher.
10.3.4 There is a strong relationship between fuel poverty, low income and benefit receipt, which is to be expected given that fuel poverty as a measure utilises income. What is interesting to note, however, is the
75
Newark and Sherwood District Council Private Sector House Condition Survey March 2007
stark difference between low income and benefit receipt (63.1% and 26.2% respectively). This tends to suggest that systems to provide for the most vulnerable (benefit recipients) have had an effect in ensuring that they are less likely to be living in fuel poverty than low income occupiers in general.
10.4 Residents with disabilities and residents in ill health
10.4.1 In Chapter 4 it was indicated that there are approximately 4,780 households in Newark and Sherwood with one or more residents with a disability, representing 11.6% of the stock. Where residents indicated such disabilities, the surveyor also filled in a section of the form relating to the existence of adaptations to meet disabled occupier needs, but also any future requirement and potential for such adaptations.
10.4.2 The provision of adaptations for disabled residents is mandatory under the Disabled Facilities Grants (DFG) scheme, and local authorities must consider this when assigning budgets to housing provision. There are two factors that mitigate this demand: firstly, DFGs are subject to means testing and secondly, it is up to an occupational health worker to assess the need for an adaptation before providing a DFG to fund this.
10.4.3 The following graph illustrates the proportion of dwellings, with residents who have disabilities that have and need adaptation. The graph is broken down by adaptation type.
76
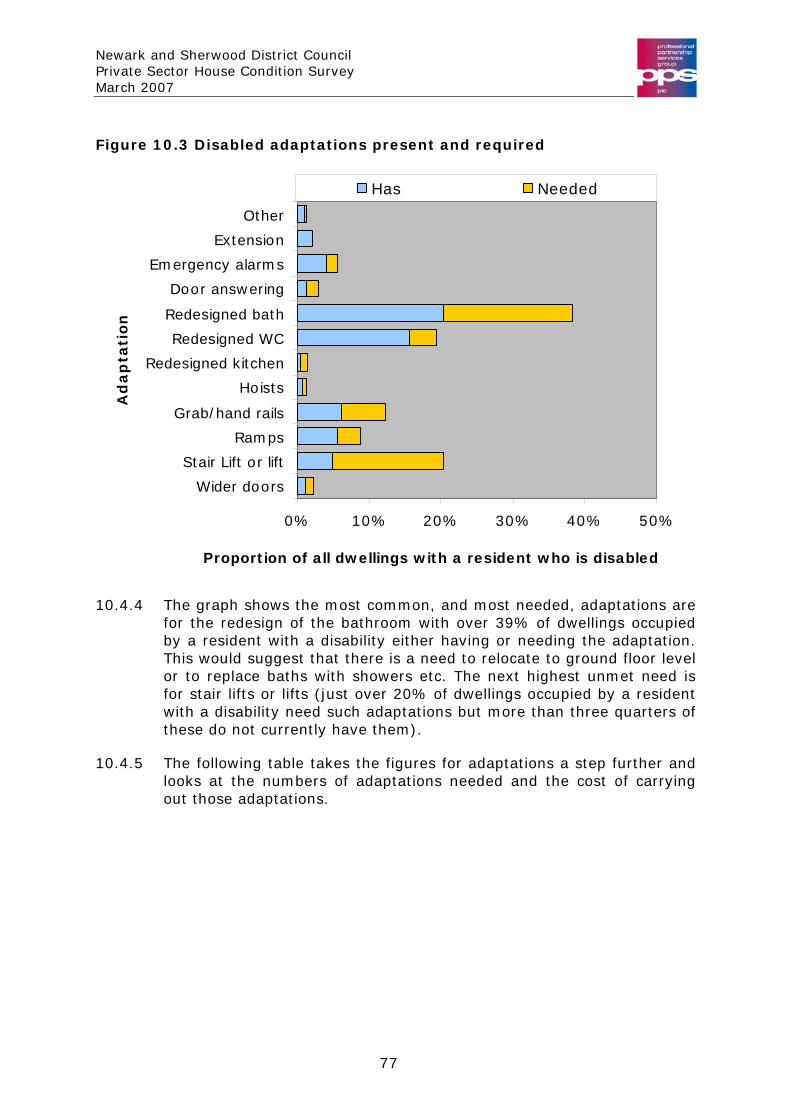
Newark and Sherwood District Council Private Sector House Condition Survey March 2007
Figure 10.3 Disabled adaptations present and required
0% 10% 20% 30% 40% 50%
Wider doors
Stair Lift or lift
Ramps
Grab/hand rails
Hoists
Redesigned kitchen
Redesigned WC
Redesigned bath
Door answering
Emergency alarms
Extension
Other
Ad
ap
tati
on
Proportion of all dwellings with a resident who is disabled
Has Needed
10.4.4 The graph shows the most common, and most needed, adaptations are for the redesign of the bathroom with over 39% of dwellings occupied by a resident with a disability either having or needing the adaptation. This would suggest that there is a need to relocate to ground floor level or to replace baths with showers etc. The next highest unmet need is for stair lifts or lifts (just over 20% of dwellings occupied by a resident with a disability need such adaptations but more than three quarters of these do not currently have them).
10.4.5 The following table takes the figures for adaptations a step further and looks at the numbers of adaptations needed and the cost of carrying out those adaptations.
77
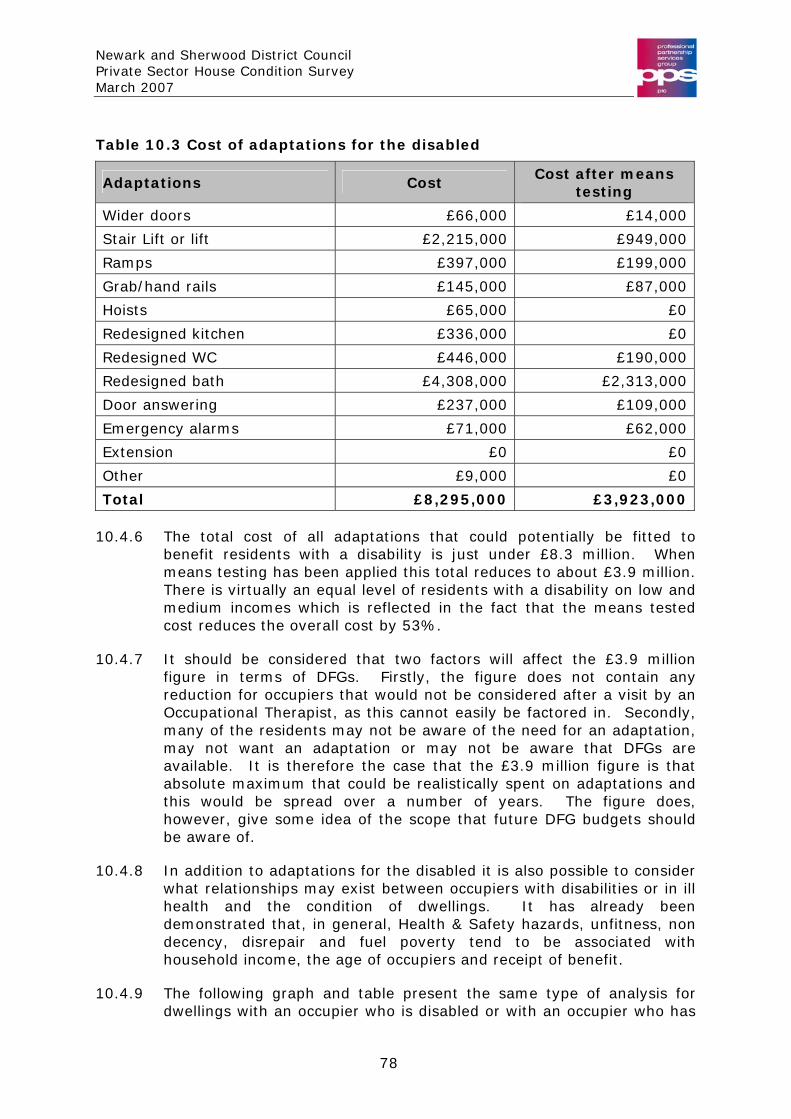
Newark and Sherwood District Council Private Sector House Condition Survey March 2007
Table 10.3 Cost of adaptations for the disabled
Adaptations Cost Cost after means
testing
Wider doors £66,000 £14,000
Stair Lift or lift £2,215,000 £949,000
Ramps £397,000 £199,000
Grab/hand rails £145,000 £87,000
Hoists £65,000 £0
Redesigned kitchen £336,000 £0
Redesigned WC £446,000 £190,000
Redesigned bath £4,308,000 £2,313,000
Door answering £237,000 £109,000
Emergency alarms £71,000 £62,000
Extension £0 £0
Other £9,000 £0
Total £8,295,000 £3,923,000
10.4.6 The total cost of all adaptations that could potentially be fitted to benefit residents with a disability is just under £8.3 million. When means testing has been applied this total reduces to about £3.9 million. There is virtually an equal level of residents with a disability on low and medium incomes which is reflected in the fact that the means tested cost reduces the overall cost by 53%.
10.4.7 It should be considered that two factors will affect the £3.9 million figure in terms of DFGs. Firstly, the figure does not contain any reduction for occupiers that would not be considered after a visit by an Occupational Therapist, as this cannot easily be factored in. Secondly, many of the residents may not be aware of the need for an adaptation, may not want an adaptation or may not be aware that DFGs are available. It is therefore the case that the £3.9 million figure is that absolute maximum that could be realistically spent on adaptations and this would be spread over a number of years. The figure does, however, give some idea of the scope that future DFG budgets should be aware of.
10.4.8 In addition to adaptations for the disabled it is also possible to consider what relationships may exist between occupiers with disabilities or in ill health and the condition of dwellings. It has already been demonstrated that, in general, Health & Safety hazards, unfitness, non decency, disrepair and fuel poverty tend to be associated with household income, the age of occupiers and receipt of benefit.
10.4.9 The following graph and table present the same type of analysis for dwellings with an occupier who is disabled or with an occupier who has
78
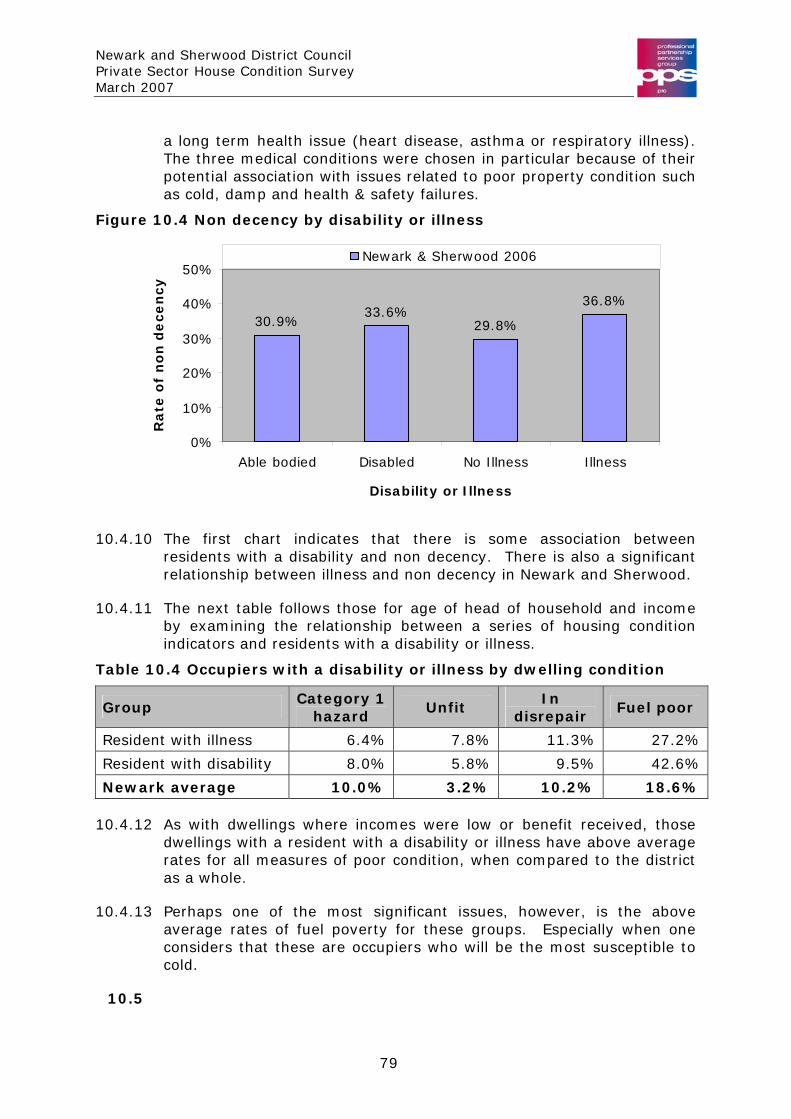
Newark and Sherwood District Council Private Sector House Condition Survey March 2007
a long term health issue (heart disease, asthma or respiratory illness). The three medical conditions were chosen in particular because of their potential association with issues related to poor property condition such as cold, damp and health & safety failures.
Figure 10.4 Non decency by disability or illness
30.9%33.6%
29.8%
36.8%
0%
10%
20%
30%
40%
50%
Able bodied Disabled No Illness Illness
Disability or Illness
Ra
te o
f n
on
de
ce
ncy
Newark & Sherwood 2006
10.4.10 The first chart indicates that there is some association between residents with a disability and non decency. There is also a significant relationship between illness and non decency in Newark and Sherwood.
10.4.11 The next table follows those for age of head of household and income by examining the relationship between a series of housing condition indicators and residents with a disability or illness.
Table 10.4 Occupiers with a disability or illness by dwelling condition
Group Category 1
hazard Unfit
In disrepair
Fuel poor
Resident with illness 6.4% 7.8% 11.3% 27.2%
Resident with disability 8.0% 5.8% 9.5% 42.6%
Newark average 10.0% 3.2% 10.2% 18.6%
10.4.12 As with dwellings where incomes were low or benefit received, those dwellings with a resident with a disability or illness have above average rates for all measures of poor condition, when compared to the district as a whole.
10.4.13 Perhaps one of the most significant issues, however, is the above average rates of fuel poverty for these groups. Especially when one considers that these are occupiers who will be the most susceptible to cold.
10.5
79
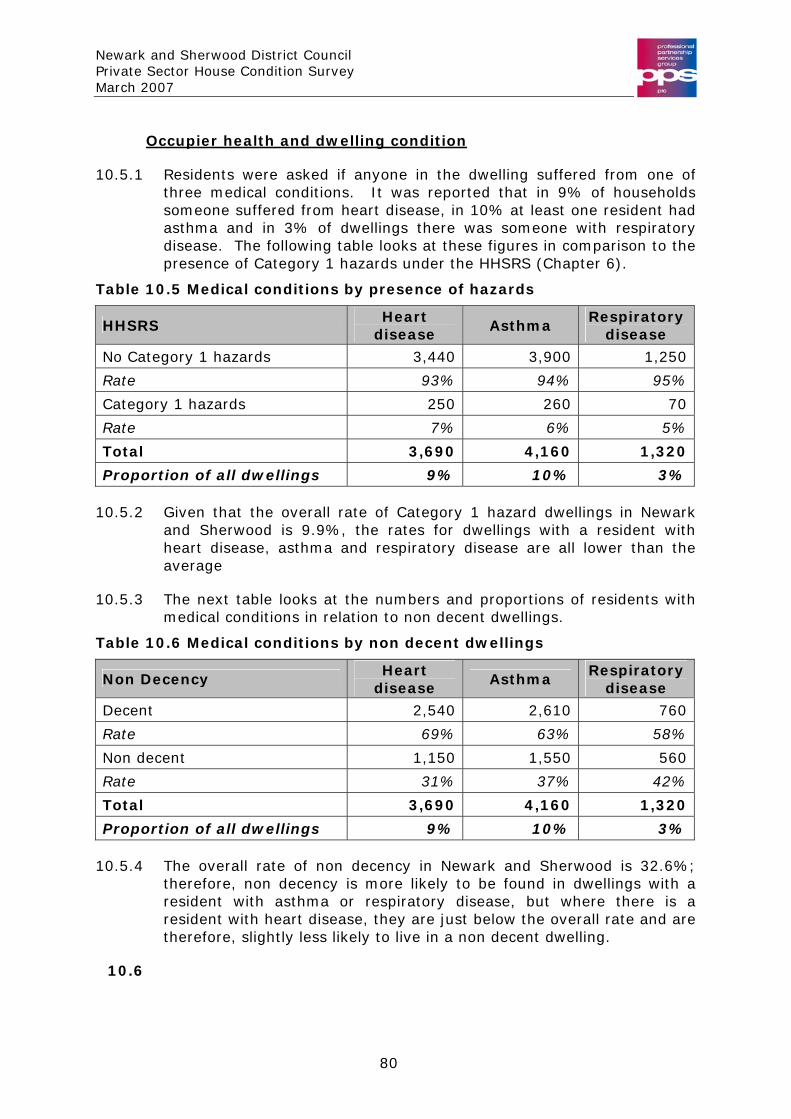
Newark and Sherwood District Council Private Sector House Condition Survey March 2007
Occupier health and dwelling condition
10.5.1 Residents were asked if anyone in the dwelling suffered from one of three medical conditions. It was reported that in 9% of households someone suffered from heart disease, in 10% at least one resident had asthma and in 3% of dwellings there was someone with respiratory disease. The following table looks at these figures in comparison to the presence of Category 1 hazards under the HHSRS (Chapter 6).
Table 10.5 Medical conditions by presence of hazards
HHSRS Heart
disease Asthma Respiratory
disease
No Category 1 hazards 3,440 3,900 1,250
Rate 93% 94% 95%
Category 1 hazards 250 260 70
Rate 7% 6% 5%
Total 3,690 4,160 1,320
Proportion of all dwellings 9% 10% 3%
10.5.2 Given that the overall rate of Category 1 hazard dwellings in Newark and Sherwood is 9.9%, the rates for dwellings with a resident with heart disease, asthma and respiratory disease are all lower than the average
10.5.3 The next table looks at the numbers and proportions of residents with medical conditions in relation to non decent dwellings.
Table 10.6 Medical conditions by non decent dwellings
Non Decency Heart
disease Asthma
Respiratory disease
Decent 2,540 2,610 760
Rate 69% 63% 58%
Non decent 1,150 1,550 560
Rate 31% 37% 42%
Total 3,690 4,160 1,320
Proportion of all dwellings 9% 10% 3%
10.5.4 The overall rate of non decency in Newark and Sherwood is 32.6%; therefore, non decency is more likely to be found in dwellings with a resident with asthma or respiratory disease, but where there is a resident with heart disease, they are just below the overall rate and are therefore, slightly less likely to live in a non decent dwelling.
10.6
80
Newark and Sherwood District Council Private Sector House Condition Survey March 2007
Environmental factors
10.6.1 In addition to asking occupiers about their feelings toward their immediate environment, residents were also asked about specific environmental issues. The following graph lists those concerns and illustrates to what extent each is felt to be a problem or a serious problem within residents’ immediate neighbourhood.
Figure 10.5 Environmental issues
residents highlighted in relation to their
10.6.3 over 9%
10.6.4 th 0.9% of
0% 10% 20% 30% 40% 50% 60% 70% 80% 90% 100%
Vandalism
Graffiti
Dogs
Litter
Neighbours
Racism
Noise people
Noise Environment
Criminal damage
Drug dealing
Other
En
vir
on
me
nta
l co
nce
rn
Percent
Not a problem Slight problem Serious problem
10.6.2 The most prevalent issue that local environment was litter, with almost 11.7% stating that litter was a problem. Litter also had the second highest proportion (4.1%) of residents stating that this was a serious problem, with noise environment having the highest serious problem rate at 4.8%
Noisy environment was the next most common concern with of households saying this was a problem. Other concerns were dogs (9.1%); vandalism (8.5%) and noisy people at 7.4%.
The local problem occurring least was racial harassment wihouseholds saying that this was a problem, including 0.4% saying that it was a serious problem.
81
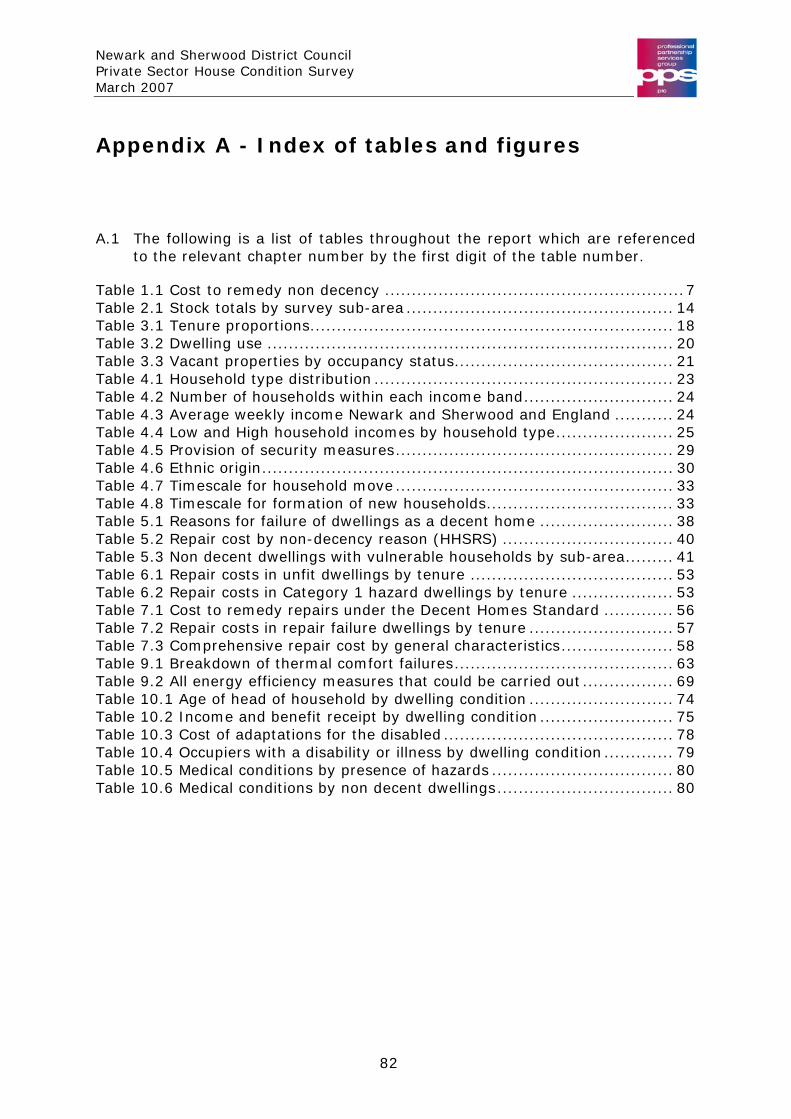
Newark and Sherwood District Council Private Sector House Condition Survey March 2007
Appendix A - Index of tables and figures
A.1 The following is a list of tables throughout the report which are referenced to the relevant chapter number by the first digit of the table number.
Table 1.1 Cost to remedy non decency ........................................................7 Table 2.1 Stock totals by survey sub-area .................................................. 14 Table 3.1 Tenure proportions.................................................................... 18 Table 3.2 Dwelling use ............................................................................ 20 Table 3.3 Vacant properties by occupancy status......................................... 21 Table 4.1 Household type distribution ........................................................ 23 Table 4.2 Number of households within each income band............................ 24 Table 4.3 Average weekly income Newark and Sherwood and England ........... 24 Table 4.4 Low and High household incomes by household type...................... 25 Table 4.5 Provision of security measures.................................................... 29 Table 4.6 Ethnic origin............................................................................. 30 Table 4.7 Timescale for household move.................................................... 33 Table 4.8 Timescale for formation of new households................................... 33 Table 5.1 Reasons for failure of dwellings as a decent home ......................... 38 Table 5.2 Repair cost by non-decency reason (HHSRS) ................................ 40 Table 5.3 Non decent dwellings with vulnerable households by sub-area......... 41 Table 6.1 Repair costs in unfit dwellings by tenure ...................................... 53 Table 6.2 Repair costs in Category 1 hazard dwellings by tenure ................... 53 Table 7.1 Cost to remedy repairs under the Decent Homes Standard ............. 56 Table 7.2 Repair costs in repair failure dwellings by tenure ........................... 57 Table 7.3 Comprehensive repair cost by general characteristics..................... 58 Table 9.1 Breakdown of thermal comfort failures......................................... 63 Table 9.2 All energy efficiency measures that could be carried out ................. 69 Table 10.1 Age of head of household by dwelling condition ........................... 74 Table 10.2 Income and benefit receipt by dwelling condition ......................... 75 Table 10.3 Cost of adaptations for the disabled ........................................... 78 Table 10.4 Occupiers with a disability or illness by dwelling condition ............. 79 Table 10.5 Medical conditions by presence of hazards .................................. 80 Table 10.6 Medical conditions by non decent dwellings................................. 80
82
Newark and Sherwood District Council Private Sector House Condition Survey March 2007
A.2 The following is a list of tables throughout the report which are referenced to the relevant chapter number by the first digit of the table number.
Figure 2.1 Survey Areas .......................................................................... 15 Figure 3.1 Dwelling age profile England and Newark and Sherwood ............... 17 Figure 3.2 Dwelling type profile Newark and Sherwood and England .............. 18 Figure 3.3 Tenure by date of construction .................................................. 19 Figure 4.1 Age of head of household Newark and Sherwood and England........ 22 Figure 4.2 Household incomes in bands ..................................................... 23 Figure 4.3 High and low incomes by age of head of household ...................... 25 Figure 4.4 Benefit receipt by tenure .......................................................... 26 Figure 4.5 Percent of households experiencing crime in Newark and Sherwood 28Figure 4.6 Residents with disabilities by type .............................................. 29 Figure 4.7 Satisfaction with environment and area ...................................... 32 Figure 5.1 Tenure by non decent dwellings ................................................. 36 Figure 5.2 Non decent dwellings by dwelling type ........................................ 36 Figure 5.3 Non decent dwellings by date of construction............................... 37 Figure 5.4 Non decent dwellings by sub-area .............................................. 38 Figure 5.5 Degree of failure of the Decent Homes Standard .......................... 39 Figure 6.1 Unfit dwellings by reason for unfitness, % of unfit dwellings .......... 46 Figure 6.2 Category 1 hazards by reason for hazard .................................... 47 Figure 6.3 Rates of unfitness and Category 1 hazards by tenure .................... 50 Figure 6.4 Rates of unfitness and Category 1 hazards by building type ........... 50 Figure 6.5 Rates of unfitness and Category One Hazards by construction date . 51 Figure 6.6 Rates of unfitness and Category 1 hazards by Area....................... 52 Figure 7.1 Repair cost bands by sub-area................................................... 59 Figure 8.1 Bathroom and Kitchen age ........................................................ 61 Figure 8.2 Electrics and boiler age............................................................. 61 Figure 9.1 Frequency distribution of SAP in Newark & Sherwood and England.. 65 Figure 9.2 SAP by general characteristics ................................................... 66 Figure 9.3 Mean SAP by sub-area.............................................................. 67 Figure 9.4 Fuel poverty by area ................................................................ 71 Figure 10.1 Non decency by age of head of household ................................. 74 Figure 10.2 Non decency by annual household income band ......................... 75 Figure 10.3 Disabled adaptations present and required ................................ 77 Figure 10.4 Non decency by disability or illness........................................... 79 Figure 10.5 Environmental issues.............................................................. 81
83

Newark and Sherwood District Council Private Sector House Condition Survey March 2007
Appendix B - Methodology
B.1 The survey used a stratified random sample of 2,728 dwellings from an address file supplied by Newark and Sherwood District Council. The sample was a stratified random sample to give representative findings across the District and by five sub-areas. The address file supplied was divided between 368 Census Output Areas (COAs) with the objective of gaining at least one survey in each and more surveys in those where poor conditions were anticipated. The total number of surveys for each sub-area are given below:
Table B.1 Number of surveys completed in each Area
Area Committee Surveys Newark North 282 Newark South 229 North East 231 North West 245 Southwell & South 256
B.2 All addresses on the original address list were assigned an ID number and a random number generating computer algorithm was used to select the number of addresses specified within each sub area.
B.3 The sample was selected in order to ensure that all COAs were covered and that 1,229 surveys be completed. In practice 358 of the 368 COAs had a full survey and a total of 1,240 surveys were completed.
B.4 The survey incorporates the entire private sector stock, excluding registered social landlords (Housing Association) and Council properties. The Housing Association (or Registered Social Landlord – RSL) stock includes a small number of independent Housing Associations.
B.5 Each dwelling selected for survey was visited a minimum of three times where access failed and basic dwelling information was gathered including a simple assessment of condition if no survey was ultimately possible. To ensure the sample was not subject to a non-response bias, the condition of the dwellings where access was not achieved was systematically compared to those where the surveyors were successful. Where access was achieved, a full internal inspection was carried out including a detailed energy efficiency survey. In addition to this, where occupied, an interview survey was undertaken.
84
Newark and Sherwood District Council Private Sector House Condition Survey March 2007
B.6 The basic unit of survey was the ‘single self-contained dwelling’. This could comprise a single self-contained house or a self contained flat. Where more than one flat was present the external part of the building, encompassing the flat and any access-ways serving the flat were also inspected.
B.7 The house condition survey form is based on the survey schedule published by the ODPM in the 2000 guidelines (Local House Condition Surveys 2000 HMSO ISBN 0 11 752830 7).
B.8 The data was weighted using the CLASSIC Reports software. Two approaches to weighting the data have been used.
B.9 The first method is used for data such as building age, which has been gathered for all dwellings visited. In this case the weight applied to the individual dwellings is very simple to calculate, as it is the reciprocal of the sample fraction. Thus if 1 in 10 dwellings were selected the sample fraction is 1/10 and the weight applied to each is 10/1.
B.10 Where information on individual data items is not always present, i.e. when access fails, then a second approach to weighting the data is taken. This approach is described in detail in the following appendix, but a short description is offered here.
B.11 The simplest approach to weighting the data to take account of access failures is to increase the weight given to the dwellings where access is achieved by a proportion corresponding to the access failures. Thus if the sample fraction were 1/10 and 10 dwellings were in a sample the weight applied to any dwelling would be 10/1 which would give a stock total of 100. However, if access were only achieved in 5 dwellings the weight applied is the original 10/1 multiplied by the compensating factor, 10/5. Therefore 10/1 x 10/5 = 20. As there are only 5 dwellings with information the weight, when applied to five dwellings, still yields the same stock total of 100. The five dwellings with no data are ignored.
B.12 With an access rate above 40% there may be concern that the results will not be truly representative and that weighting the data in this manner might produce unreliable results. There is no evidence to suggest that the access rate has introduced any bias. When externally gathered information (which is present for all dwellings) is examined the stock that was inspected internally is present in similar proportions to those where access was not achieved suggesting no serious bias will have been introduced.
B.13 Only those dwellings where a full survey of internal and external elements, energy efficiency, fitness, housing health and safety and social questions were used in the production of data for this report. A total of 1,243 such surveys were produced.
85
Newark and Sherwood District Council Private Sector House Condition Survey March 2007
B.14 The use of a sample survey to draw conclusions about the stock of the nine Area Committees as a whole introduces some uncertainty. Each figure produced is subject to sampling error, which means the true result will lie between two values, e.g. 5% and 6%. For ease of reading, the data are presented as single figures rather than as ranges. A full explanation of these confidence limits is included in the following appendix.
86
Newark and Sherwood District Council Private Sector House Condition Survey March 2007
Appendix C - Survey Sampling
Sample Design
C.1 The sample was drawn from the Newark and Sherwood address file derived from Council Tax records. The total number of dwellings on the list, after social rented housing was removed, was 41,100 and this total constituted all private addresses within the Local Authority boundaries. The Council Tax register contains a reference for each individual address, whether or not it is occupied. In addition, there will be a number of dwellings with multiple addresses, such as certain houses in multiple occupation (HMOs), and non-residential address within the register.
C.2 The target number of complete surveys was 1,229, but unlike a conventionally sampled survey this was not to be met at a specific access rate, but rather to be met across as many Census Output Areas (COA) as possible.
Stock total
C.3 The stock total is based initially on the address list; this constitutes the sample frame from which a proportion (the sample) is selected for survey. Any non-dwellings found by the surveyors are marked as such in the sample; these will then be weighted to represent all the non-dwellings that are likely to be in the sample frame. The remaining dwellings surveyed are purely dwellings eligible for survey. These remaining dwellings are then re-weighted according to the original sample fractions and produce a stock total.
C.4 In producing the stock total the amount by which the total is adjusted to compensate for non-dwellings is estimated, based on how many surveyors found. With a sample as large as the final achieved data-set of 1,243 dwellings however, the sampling error is likely to be very small and the true stock total is likely, therefore, to be very close to the 41,100 figure reported. Sampling error is discussed later in this section.
C.5 Table C.1 shows the response rates to the survey.
87
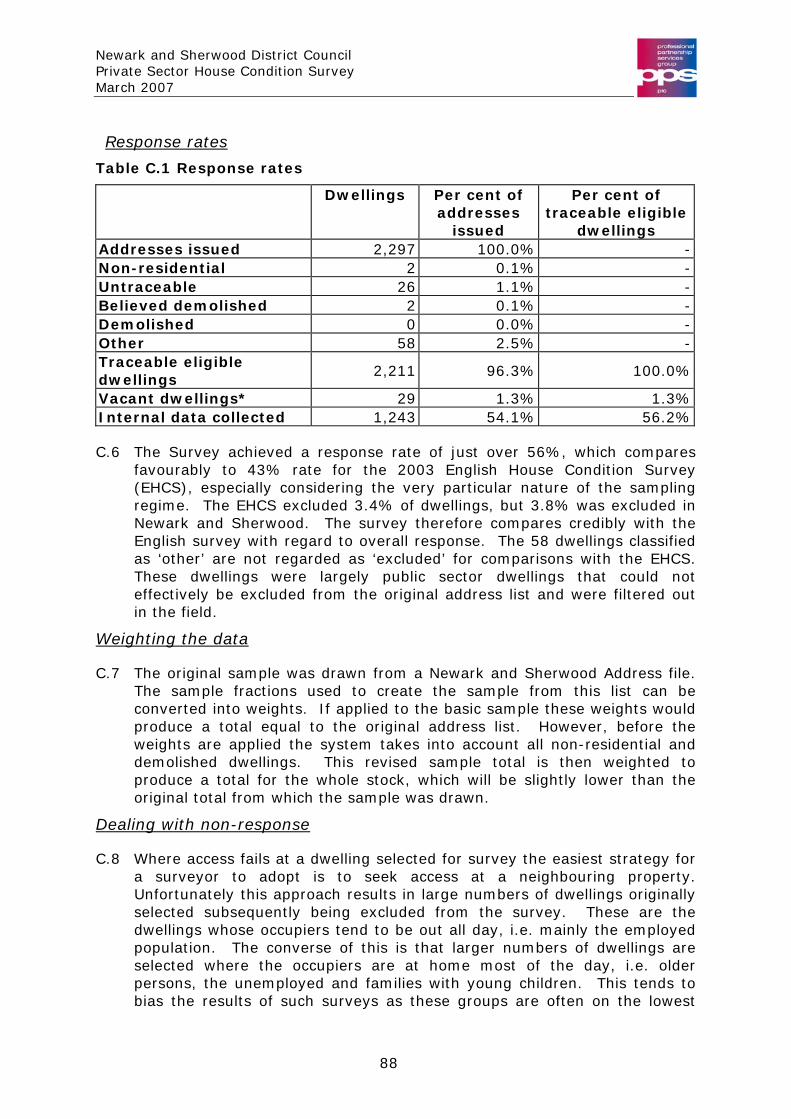
Newark and Sherwood District Council Private Sector House Condition Survey March 2007
Response rates
Table C.1 Response rates
Dwellings Per cent of addresses
issued
Per cent of traceable eligible
dwellings Addresses issued 2,297 100.0% - Non-residential 2 0.1% - Untraceable 26 1.1% - Believed demolished 2 0.1% - Demolished 0 0.0% - Other 58 2.5% - Traceable eligible dwellings
2,211 96.3% 100.0%
Vacant dwellings* 29 1.3% 1.3% Internal data collected 1,243 54.1% 56.2%
C.6 The Survey achieved a response rate of just over 56%, which compares favourably to 43% rate for the 2003 English House Condition Survey (EHCS), especially considering the very particular nature of the sampling regime. The EHCS excluded 3.4% of dwellings, but 3.8% was excluded in Newark and Sherwood. The survey therefore compares credibly with the English survey with regard to overall response. The 58 dwellings classified as ‘other’ are not regarded as ‘excluded’ for comparisons with the EHCS. These dwellings were largely public sector dwellings that could not effectively be excluded from the original address list and were filtered out in the field.
Weighting the data
C.7 The original sample was drawn from a Newark and Sherwood Address file. The sample fractions used to create the sample from this list can be converted into weights. If applied to the basic sample these weights would produce a total equal to the original address list. However, before the weights are applied the system takes into account all non-residential and demolished dwellings. This revised sample total is then weighted to produce a total for the whole stock, which will be slightly lower than the original total from which the sample was drawn.
Dealing with non-response
C.8 Where access fails at a dwelling selected for survey the easiest strategy for a surveyor to adopt is to seek access at a neighbouring property. Unfortunately this approach results in large numbers of dwellings originally selected subsequently being excluded from the survey. These are the dwellings whose occupiers tend to be out all day, i.e. mainly the employed population. The converse of this is that larger numbers of dwellings are selected where the occupiers are at home most of the day, i.e. older persons, the unemployed and families with young children. This tends to bias the results of such surveys as these groups are often on the lowest
88
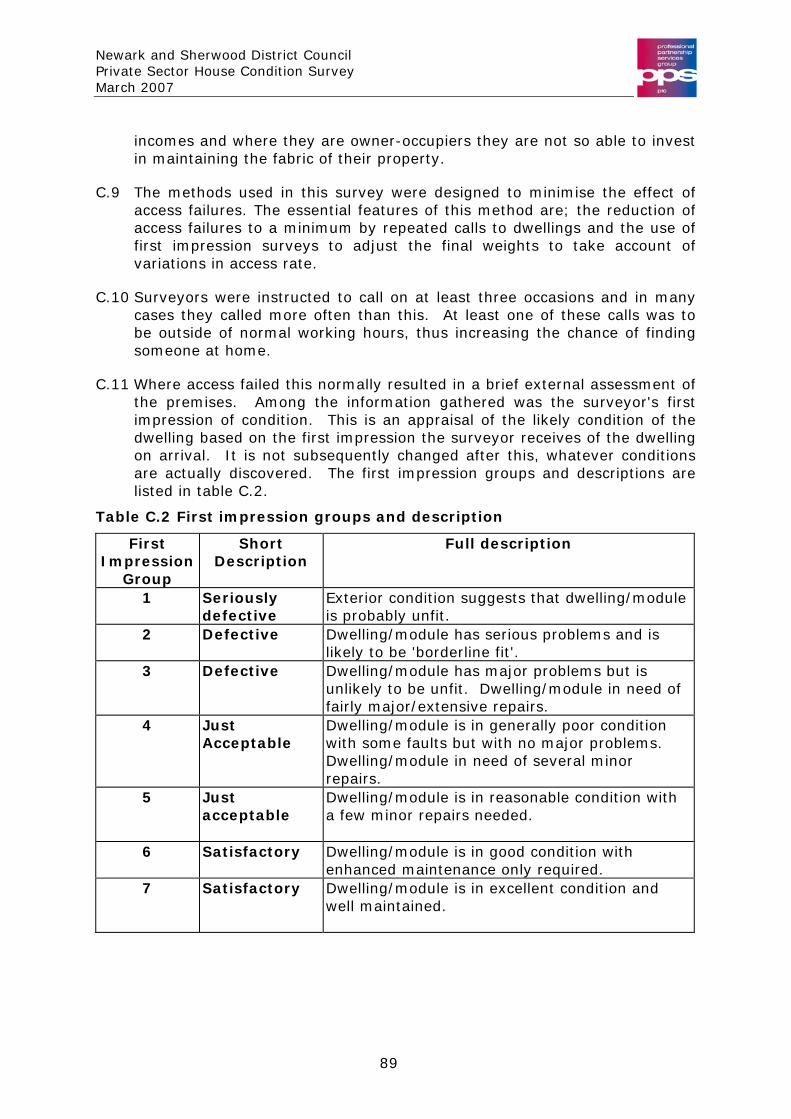
Newark and Sherwood District Council Private Sector House Condition Survey March 2007
incomes and where they are owner-occupiers they are not so able to invest in maintaining the fabric of their property.
C.9 The methods used in this survey were designed to minimise the effect of access failures. The essential features of this method are; the reduction of access failures to a minimum by repeated calls to dwellings and the use of first impression surveys to adjust the final weights to take account of variations in access rate.
C.10 Surveyors were instructed to call on at least three occasions and in many cases they called more often than this. At least one of these calls was to be outside of normal working hours, thus increasing the chance of finding someone at home.
C.11 Where access failed this normally resulted in a brief external assessment of the premises. Among the information gathered was the surveyor's first impression of condition. This is an appraisal of the likely condition of the dwelling based on the first impression the surveyor receives of the dwelling on arrival. It is not subsequently changed after this, whatever conditions are actually discovered. The first impression groups and descriptions are listed in table C.2.
Table C.2 First impression groups and description
First Impression
Group
Short Description
Full description
1 Seriously defective
Exterior condition suggests that dwelling/module is probably unfit.
2 Defective Dwelling/module has serious problems and is likely to be 'borderline fit'.
3 Defective Dwelling/module has major problems but is unlikely to be unfit. Dwelling/module in need of fairly major/extensive repairs.
4 Just Acceptable
Dwelling/module is in generally poor condition with some faults but with no major problems. Dwelling/module in need of several minor repairs.
5 Just acceptable
Dwelling/module is in reasonable condition with a few minor repairs needed.
6 Satisfactory Dwelling/module is in good condition with enhanced maintenance only required.
7 Satisfactory Dwelling/module is in excellent condition and well maintained.
89
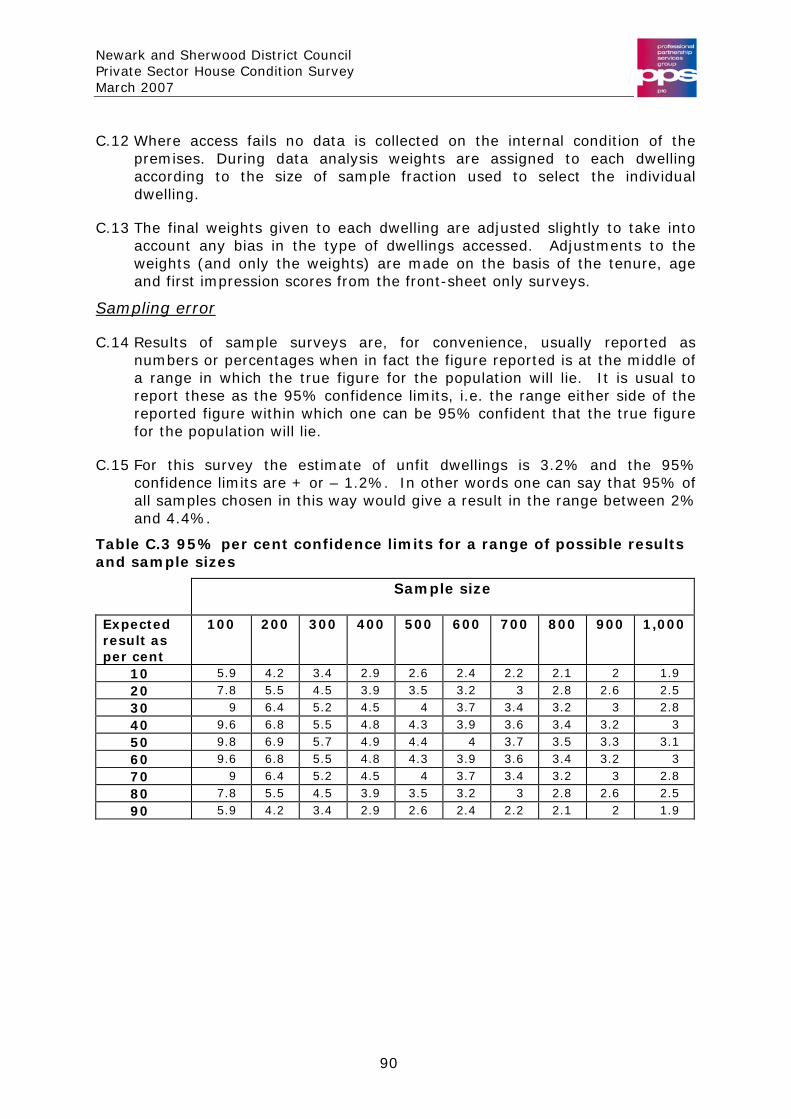
Newark and Sherwood District Council Private Sector House Condition Survey March 2007
C.12 Where access fails no data is collected on the internal condition of the premises. During data analysis weights are assigned to each dwelling according to the size of sample fraction used to select the individual dwelling.
C.13 The final weights given to each dwelling are adjusted slightly to take into account any bias in the type of dwellings accessed. Adjustments to the weights (and only the weights) are made on the basis of the tenure, age and first impression scores from the front-sheet only surveys.
Sampling error
C.14 Results of sample surveys are, for convenience, usually reported as numbers or percentages when in fact the figure reported is at the middle of a range in which the true figure for the population will lie. It is usual to report these as the 95% confidence limits, i.e. the range either side of the reported figure within which one can be 95% confident that the true figure for the population will lie.
C.15 For this survey the estimate of unfit dwellings is 3.2% and the 95% confidence limits are + or – 1.2%. In other words one can say that 95% of all samples chosen in this way would give a result in the range between 2% and 4.4%.
Table C.3 95% per cent confidence limits for a range of possible results and sample sizes
Sample size
Expected result as per cent
100 200 300 400 500 600 700 800 900 1,000
10 5.9 4.2 3.4 2.9 2.6 2.4 2.2 2.1 2 1.9
20 7.8 5.5 4.5 3.9 3.5 3.2 3 2.8 2.6 2.5
30 9 6.4 5.2 4.5 4 3.7 3.4 3.2 3 2.8
40 9.6 6.8 5.5 4.8 4.3 3.9 3.6 3.4 3.2 3
50 9.8 6.9 5.7 4.9 4.4 4 3.7 3.5 3.3 3.1
60 9.6 6.8 5.5 4.8 4.3 3.9 3.6 3.4 3.2 3
70 9 6.4 5.2 4.5 4 3.7 3.4 3.2 3 2.8
80 7.8 5.5 4.5 3.9 3.5 3.2 3 2.8 2.6 2.5
90 5.9 4.2 3.4 2.9 2.6 2.4 2.2 2.1 2 1.9
90
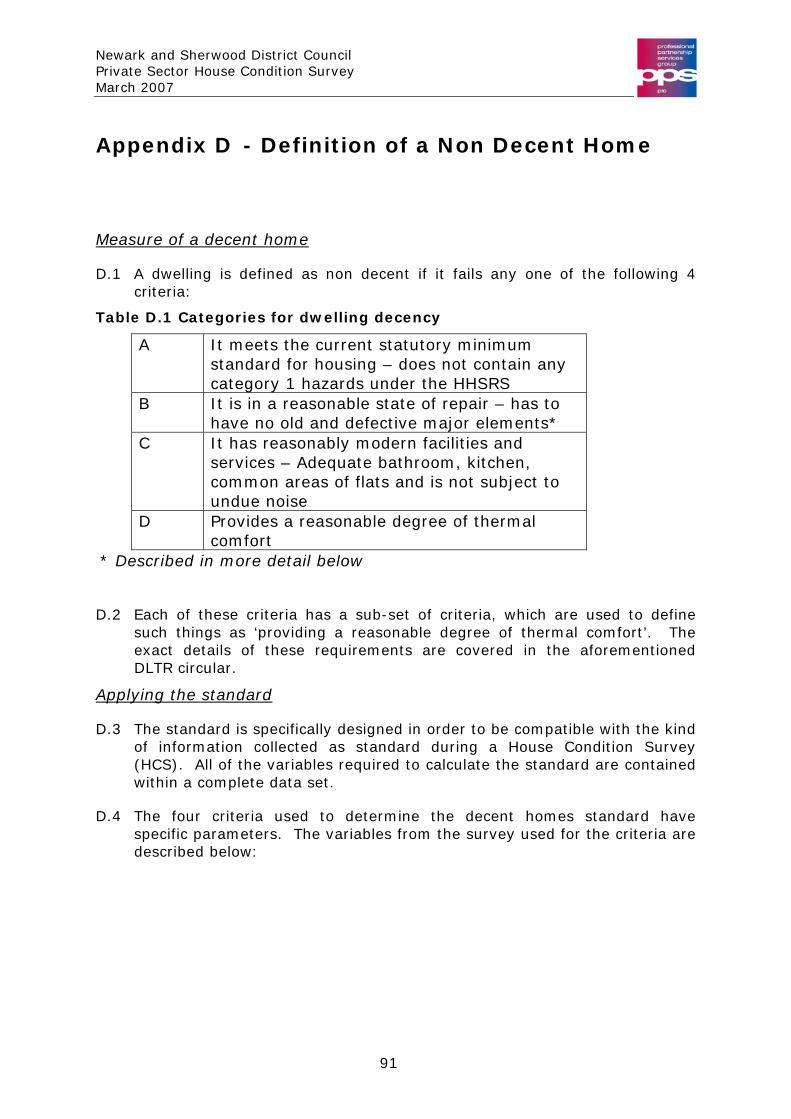
Newark and Sherwood District Council Private Sector House Condition Survey March 2007
Appendix D - Definition of a Non Decent Home
Measure of a decent home
D.1 A dwelling is defined as non decent if it fails any one of the following 4 criteria:
Table D.1 Categories for dwelling decency
A It meets the current statutory minimum standard for housing – does not contain any category 1 hazards under the HHSRS
B It is in a reasonable state of repair – has to have no old and defective major elements*
C It has reasonably modern facilities and services – Adequate bathroom, kitchen, common areas of flats and is not subject to undue noise
D Provides a reasonable degree of thermal comfort
* Described in more detail below
D.2 Each of these criteria has a sub-set of criteria, which are used to define such things as ‘providing a reasonable degree of thermal comfort’. The exact details of these requirements are covered in the aforementioned DLTR circular.
Applying the standard
D.3 The standard is specifically designed in order to be compatible with the kind of information collected as standard during a House Condition Survey (HCS). All of the variables required to calculate the standard are contained within a complete data set.
D.4 The four criteria used to determine the decent homes standard have specific parameters. The variables from the survey used for the criteria are described below:
91
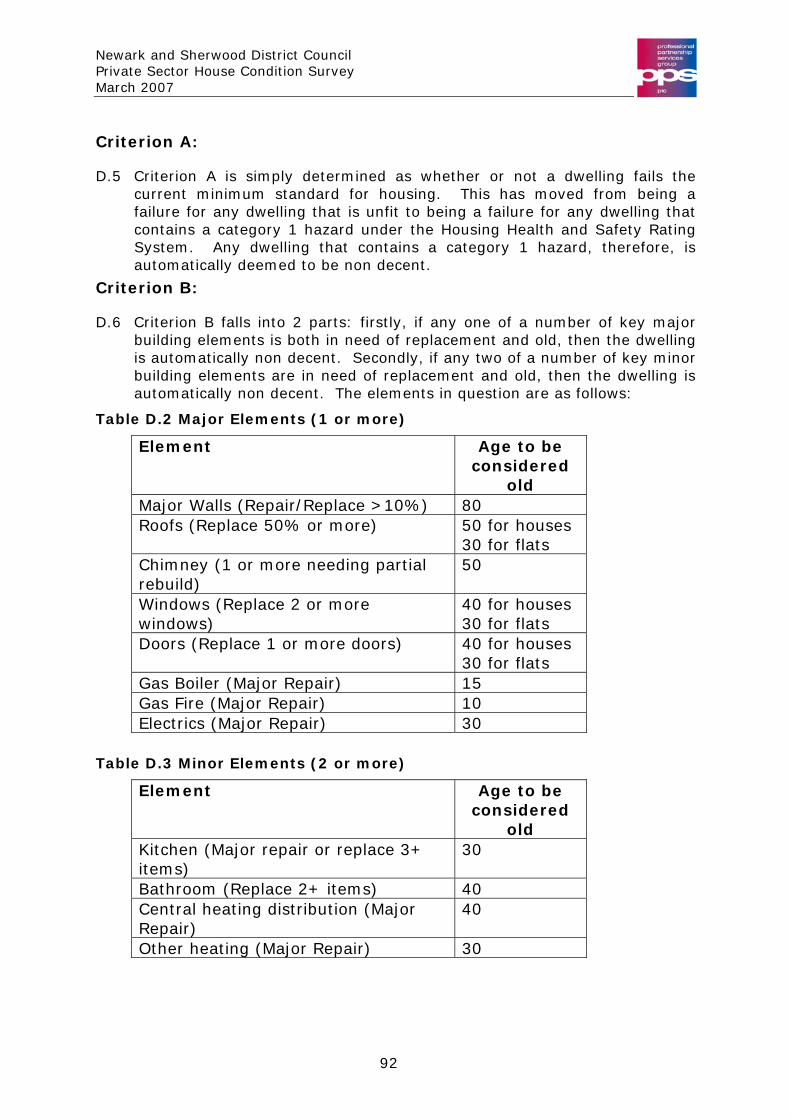
Newark and Sherwood District Council Private Sector House Condition Survey March 2007
Criterion A:
D.5 Criterion A is simply determined as whether or not a dwelling fails the current minimum standard for housing. This has moved from being a failure for any dwelling that is unfit to being a failure for any dwelling that contains a category 1 hazard under the Housing Health and Safety Rating System. Any dwelling that contains a category 1 hazard, therefore, is automatically deemed to be non decent.
Criterion B:
D.6 Criterion B falls into 2 parts: firstly, if any one of a number of key major building elements is both in need of replacement and old, then the dwelling is automatically non decent. Secondly, if any two of a number of key minor building elements are in need of replacement and old, then the dwelling is automatically non decent. The elements in question are as follows:
Table D.2 Major Elements (1 or more)
Element Age to be considered
old Major Walls (Repair/Replace >10%) 80 Roofs (Replace 50% or more) 50 for houses
30 for flats Chimney (1 or more needing partial rebuild)
50
Windows (Replace 2 or more windows)
40 for houses 30 for flats
Doors (Replace 1 or more doors) 40 for houses 30 for flats
Gas Boiler (Major Repair) 15 Gas Fire (Major Repair) 10 Electrics (Major Repair) 30
Table D.3 Minor Elements (2 or more)
Element Age to be considered
old Kitchen (Major repair or replace 3+ items)
30
Bathroom (Replace 2+ items) 40 Central heating distribution (Major Repair)
40
Other heating (Major Repair) 30
92
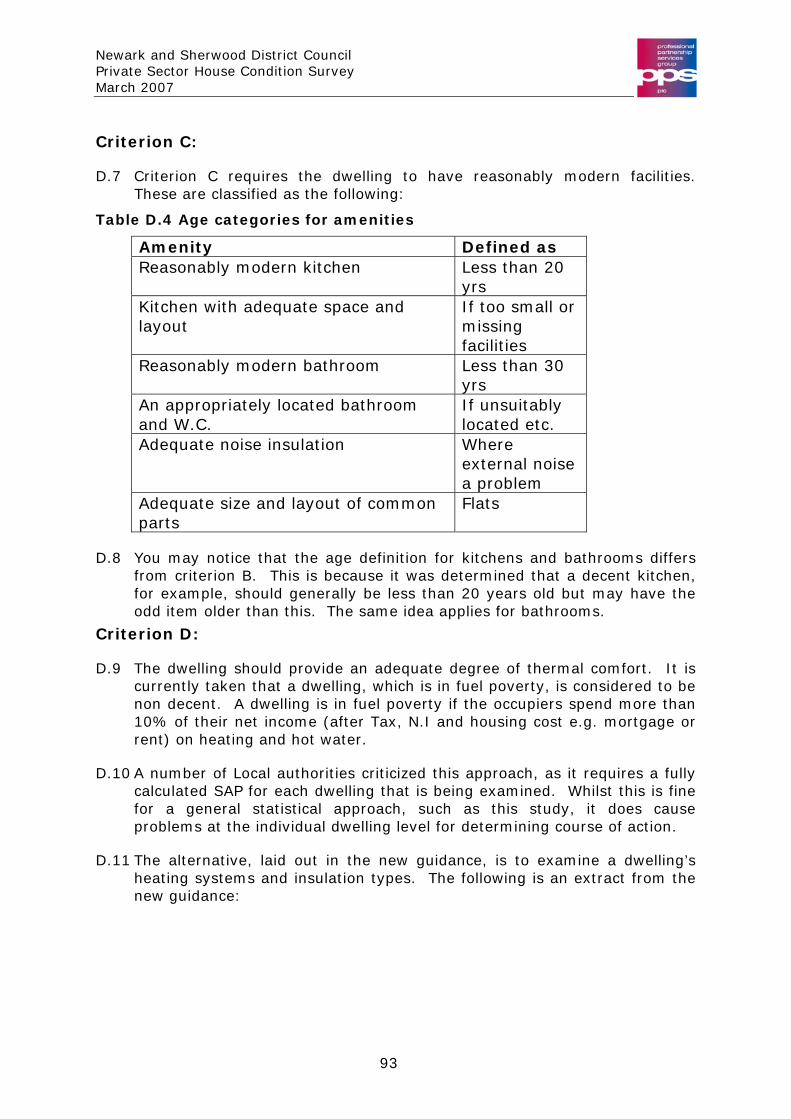
Newark and Sherwood District Council Private Sector House Condition Survey March 2007
Criterion C:
D.7 Criterion C requires the dwelling to have reasonably modern facilities. These are classified as the following:
Table D.4 Age categories for amenities
Amenity Defined as Reasonably modern kitchen Less than 20
yrs Kitchen with adequate space and layout
If too small or missing facilities
Reasonably modern bathroom Less than 30 yrs
An appropriately located bathroom and W.C.
If unsuitably located etc.
Adequate noise insulation Where external noise a problem
Adequate size and layout of common parts
Flats
D.8 You may notice that the age definition for kitchens and bathrooms differs from criterion B. This is because it was determined that a decent kitchen, for example, should generally be less than 20 years old but may have the odd item older than this. The same idea applies for bathrooms.
Criterion D:
D.9 The dwelling should provide an adequate degree of thermal comfort. It is currently taken that a dwelling, which is in fuel poverty, is considered to be non decent. A dwelling is in fuel poverty if the occupiers spend more than 10% of their net income (after Tax, N.I and housing cost e.g. mortgage or rent) on heating and hot water.
D.10 A number of Local authorities criticized this approach, as it requires a fully calculated SAP for each dwelling that is being examined. Whilst this is fine for a general statistical approach, such as this study, it does cause problems at the individual dwelling level for determining course of action.
D.11 The alternative, laid out in the new guidance, is to examine a dwelling’s heating systems and insulation types. The following is an extract from the new guidance:
93
Newark and Sherwood District Council Private Sector House Condition Survey March 2007
D.12 The revised definition requires a dwelling to have both: Efficient heating; and
Effective insulation
Efficient heating is defined as any gas or oil programmable central heating or electric storage heaters or programmable LPG/solid fuel central heating or similarly efficient heating systems, which are developed in the future. Heating sources, which provide less efficient options, fail the decent homes standard. Because of the differences in efficiency between gas/oil heating systems and other heating systems listed, the level of insulation that is appropriate also differs:
For dwellings with gas/oil programmable heating, cavity wall insulation (if there are cavity walls that can be insulated effectively) or at least 50mm loft insulation (if there is loft space) is an effective package of insulation;
For dwellings heated by electric storage radiators/LPG/programmable solid fuel central heating a higher specification of insulation is required: at least 200mm of loft insulation (if there is a loft) and cavity wall insulation (if there are cavities that can be insulated effectively).
D.13 For the purposes of this study the above definition will be used in calculating the proportion of dwellings that are considered non decent.
94