private wealth management
DESCRIPTION
Harvard UniversityFinance Course PresentationTRANSCRIPT

PORTFOLIO MANAGEMENT
Managing Individual Investor PortfolioBy
Shoaib Chatta

Client Profile
Mr. & Mrs. Johnson
Politically and financially stable country
GDP 8%, Inflation 3%, Flat-tax rate 35%, Avg. age 65
Mark Johnson 37, Susan Johnson 35
Combined salary $225,000
Inheritance $7.9 million, savings acct. balance $200,00

Client Profile (Contd.)
Porsche $52,000, Lexus $33,000, Condominium $300,000
Can take calculated risk, interested in high return especially in alternative assets and emerging market classes
Want to see return in pre-retirement & post-retirement basis

Objectives
Return:
A return that should replace 80% of their combined salary, should offset inflation impact, translate into an inflation adjusted pre-tax ROR of 10.32%, risk adjusted ROR of 8.9% and inflation adjusted post-tax ROR of 6.71% before retirement
Risk:
Ability to absorb moderate volatility, willing to take calculated risk

Constraints
Internal:
Liquidity requirements include $20,000 for recreation, $38,000 for 529-A education plan for their kids, $10,000 for IRA, $15,000 rainy day and $25,000 emergency in post-retirement arena and 80% of combined salary in pre-retirement period
Time horizon is 30 years both pre and post-retirement
Due to their unique experience with use of options to hedge interest rate risk and stock market risk, they propose to consider it

Constraints (Contd.)
External:
Want to stay in 35% flat-tax bracket
Want retirement savings account to be managed in compliance with prevalence fiduciary standards for diversification and prudence
Not interested in South Asian market due to child labor problem and tobacco market due to health hazard concerns

Investment Policy Statement
Written records & minutes of all decisions will be maintained pertaining to choice & monitoring of investment funds
Investment option will based upon diversification and to cover a wide risk/return spectrum to maximize returns within reasonable and prudent levels of risk to provide returns comparable to returns for similar investment options and to control administrative and management costs to the plan and participants.

Investment Policy Statement (Contd.)
The investment selection criterion will take into consideration the investment option’s volatility and performance relative to benchmarks
It’s demonstrated adherence to stated investment objectives competitiveness of fees and expense ratios
It will be compared to similar investments, the organization’s size, structure, and history; management profile and investment philosophy
Investment Policy Statement (Contd.)
The investment committee will reevaluate each asset class and investment vehicle based upon the foregoing criteria, no less frequently than annually, in order to determine the continuing suitability of each such option under the plan.
The benchmarks that will be pursued to meet risk, return and rating objectives of different asset classes will be S&P 500 index, Moody’s, Russell 2000 and MSCIA

Capital Market Expectations
Bonds and Private Equity 30 year US treasuries predicted to yield 4.95%
and 10 year US treasuries to yield 4.25% in 2010
High yield bonds expected to provide a return of 10% with a standard deviation of
The corporate default rate is predicted to reach 4.5 to 6%
5 year private equity’s annualized return was nearly 12%
The slow growth of the economy and the lock-in period makes PE a “no go”

Capital Market Expectations
Equities Analyst have predicted the bull market to continue
in 2010 with large cap stocks outperforming the small cap
Equity return is expected to be around 10% in 2010
The healthcare sector is expected to provide better returns in 2010
The technology stocks will be the first to take advantage of the bull market
The mid cap and the small cap is expected to provide a return of 7.43% and 8.8%
Capital Market Expectations
Real Estate Housing prices will be low or further decrease
due to the high unemployment rate
The current housing prices are still above the 2000 level
Supply is way above the demand for the commercial sector
With the increase in companies spending commercial real estate will be a good investment in the future

Capital Market Expectations Absolute-Return Strategies
Performance in 2009
In 2009 Hedge Funds generated the best returns in the recent history
In 2009, Markets Normalizing, Uncertain events and Mergers, Uncertainty in Markets, Technical Factors Correcting, Global Economy recovering, Global Economy exiting the recession.
Returned were driven by Alpha
In 2009, Tremont Hedge Funds Index returned 19%
In 2009, HFRI Index returned around 20%

Capital Market ExpectationsThe Best Performers
Fixed-Income Convertible Arbitrage returning 60% with Standard Deviation 9.57%
Emerging Markets returning 40.38% with the Standard Deviation of 11.80%
Distressed Securities returning 28.18% with the Standard Deviation of 6.51%
Event Driven returning 25.19 % with the Standard Deviation of 5.64%
Relative Value Arbitrage returning 25.94% with the Standard Deviation of 3.62%
Equity Hedge returning 24.60% with the Standard Deviation of 1.78%
Merger Arbitrage returning 11.79% with the Standard Deviation of 1.80%.
Capital Market Expectations Absolute-Return Strategies
Going Forward
Still above normal returns, although lower than in 2009.
Today the markets are a lot more predictable and many opportunities are exhausted.
Many Opportunities Global, Economy is still recovering, Many uncertain events.
Capital Market ExpectationsThe Best Future Performers
Energy/Basic Materials Sector 13%
Distressed Securities returning around 12%
Merger Arbitrage returning around 11%.
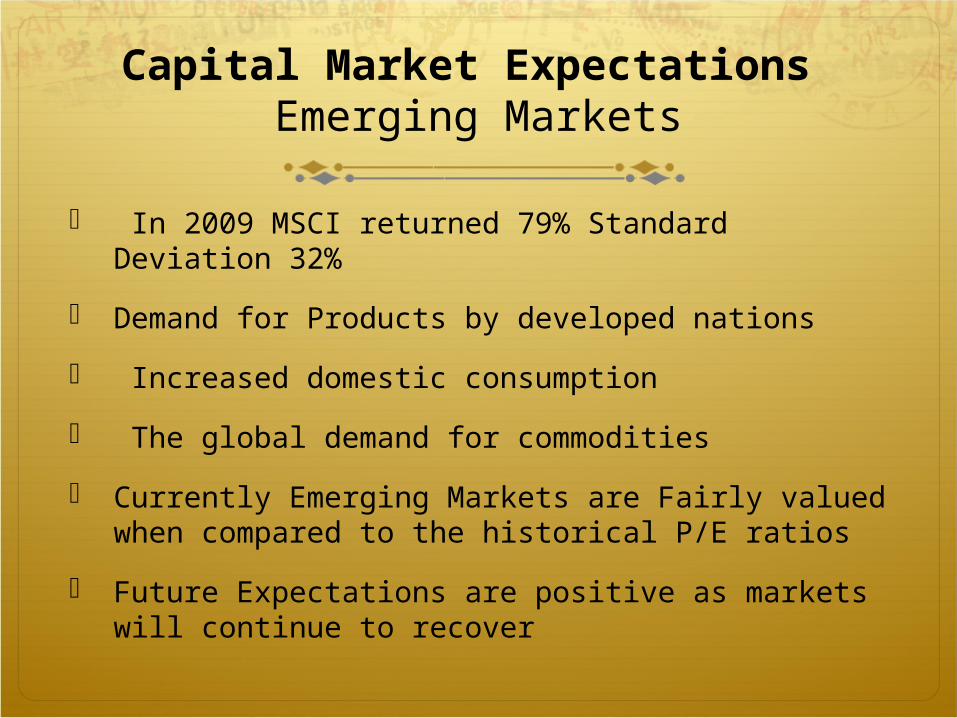
Capital Market Expectations Emerging Markets
In 2009 MSCI returned 79% Standard Deviation 32%
Demand for Products by developed nations
Increased domestic consumption
The global demand for commodities
Currently Emerging Markets are Fairly valued when compared to the historical P/E ratios
Future Expectations are positive as markets will continue to recover
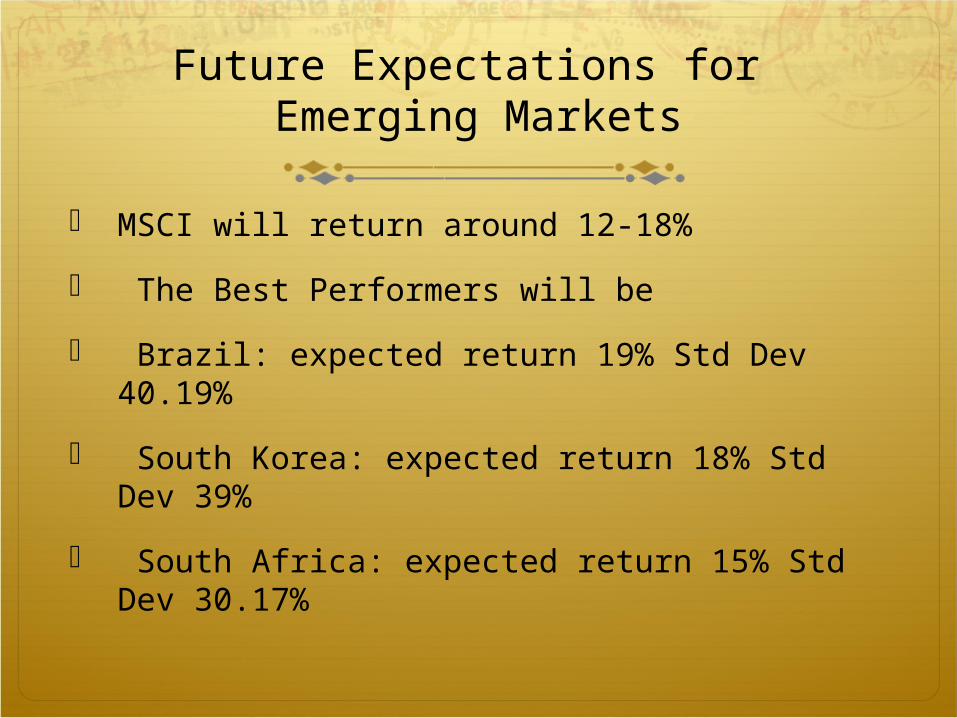
Future Expectations for Emerging Markets
MSCI will return around 12-18%
The Best Performers will be
Brazil: expected return 19% Std Dev 40.19%
South Korea: expected return 18% Std Dev 39%
South Africa: expected return 15% Std Dev 30.17%

Risk ManagementRisky Assets
Ability and willingness to take risk of the investor
Default risk of company’s issuing High Yielding Bonds
Interest rate risk in Bonds
Exchange rate risk in Emerging market Investments

Risk Management Bonds and Equities
Managers of Bonds and Equities will be asked to maintain a “Snake Tunnel”
Upper limit 4% and lower limit 2.5%
High Yielding Bond default risk to be hedged using “Credit Default SWAPS”
Calendar Rebalancing and constant mix strategy will be implemented every six months
Hedging Interest rate risk through repurchase agreements or futures
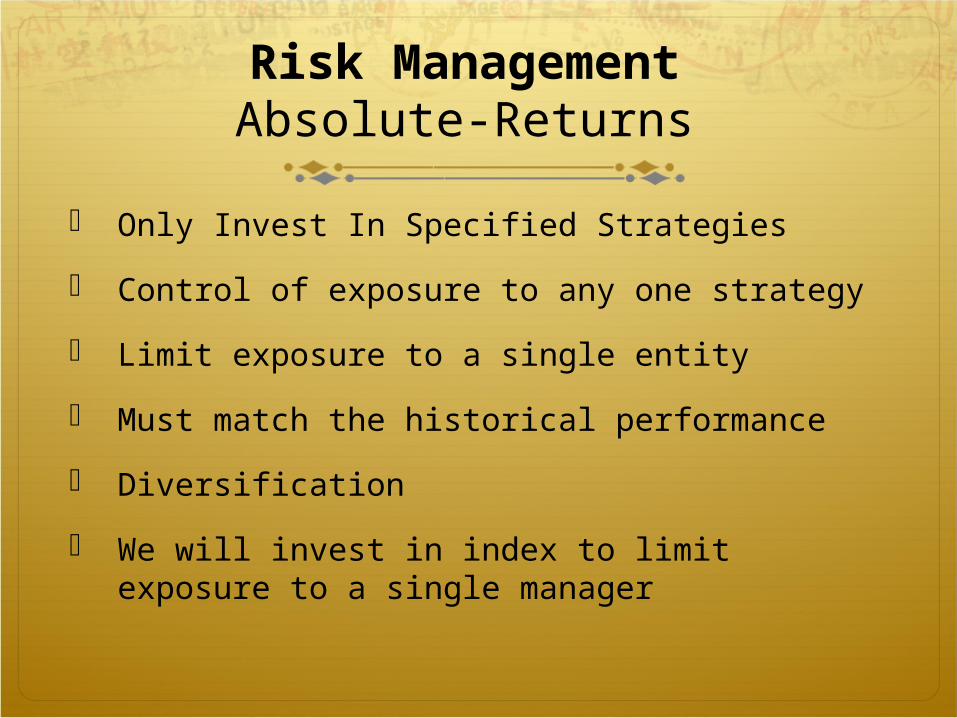
Risk Management Absolute-Returns
Only Invest In Specified Strategies
Control of exposure to any one strategy
Limit exposure to a single entity
Must match the historical performance
Diversification
We will invest in index to limit exposure to a single manager

Risk Management Emerging Markets
Diversification
Only invest in specified markets
Limit exposure to a single entity
Control amount at risk
Do not attempt to outperform the market
Follow the performance of the specified Index or Market
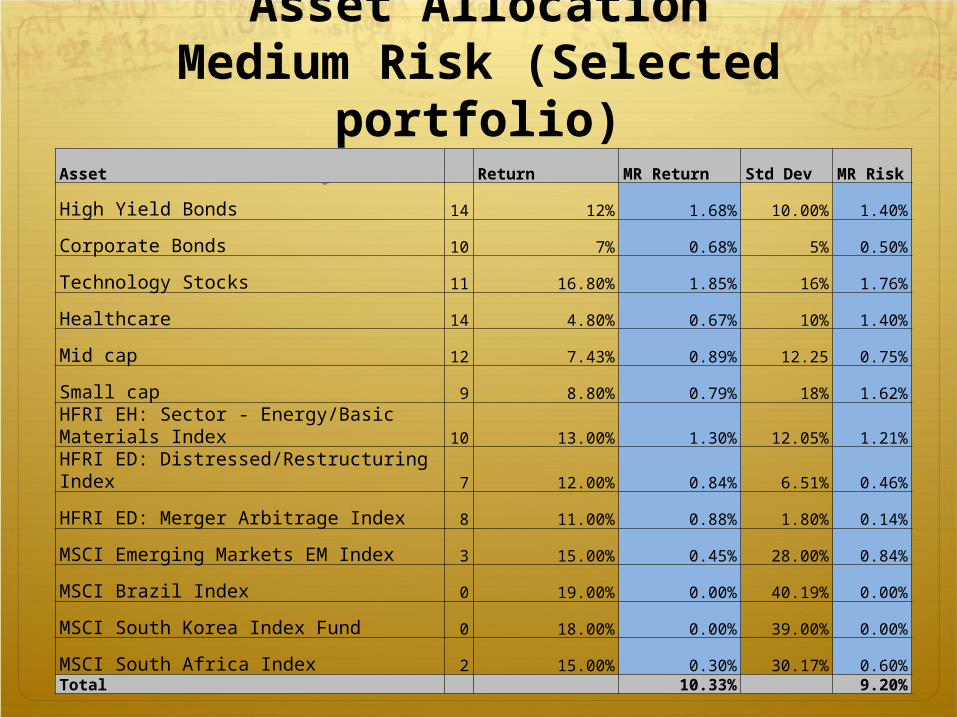
Asset AllocationMedium Risk (Selected
portfolio)Asset Return MR Return Std Dev MR Risk
High Yield Bonds 14 12% 1.68% 10.00% 1.40%
Corporate Bonds 10 7% 0.68% 5% 0.50%
Technology Stocks 11 16.80% 1.85% 16% 1.76%
Healthcare 14 4.80% 0.67% 10% 1.40%
Mid cap 12 7.43% 0.89% 12.25 0.75%
Small cap 9 8.80% 0.79% 18% 1.62%
HFRI EH: Sector - Energy/Basic Materials Index 10 13.00% 1.30% 12.05% 1.21%
HFRI ED: Distressed/Restructuring Index 7 12.00% 0.84% 6.51% 0.46%
HFRI ED: Merger Arbitrage Index 8 11.00% 0.88% 1.80% 0.14%
MSCI Emerging Markets EM Index 3 15.00% 0.45% 28.00% 0.84%
MSCI Brazil Index 0 19.00% 0.00% 40.19% 0.00%
MSCI South Korea Index Fund 0 18.00% 0.00% 39.00% 0.00%
MSCI South Africa Index 2 15.00% 0.30% 30.17% 0.60%Total 10.33% 9.20%

[C] Conservative Portfolio and[HR] High Risk Portfolio
Asset C weights C return C Risk HR Weights HR Return HR Risk
High Yield Bonds 10% 1.20% 1.00% 10% 1.20% 1.00%
Corporate Bonds 35% 2.380% 1.75% 5% 0.34% 0.25%
Technology Stocks 5% 0.8400% 0.80% 30% 5.04% 4.80%
Healthcare 12% 0.5760% 1.20%
Mid cap 10% 0.74% 0.015
Small cap 5% 0.44% 0.90%
HFRI EH: Sector - Energy/Basic Materials Index 0.00% 10% 1.30% 1.21%
HFRI ED: Distressed/Restructuring Index 9% 1.0800% 0.59% 5% 0.60% 0.33%
HFRI ED: Merger Arbitrage Index 29% 3.1900% 0.52% 0.00%
MSCI Emerging Markets EM Index 10% 1.50% 2.80%
MSCI Brazil Index 10% 1.90% 4.02%
MSCI South Korea Index Fund 5% 0.90% 1.95%
MSCI South Africa Index
Total 9.27% 5.86% 13.96% 18.75%

Performance January 1 2010 – March 31 2010
Asset Actual Return
High Yield Bonds 7%
Corporate Bonds 5%
Technology Stocks 5.8%
Healthcare 1.24%
Mid cap 8.9%
Small cap 7.5%
HFRI EH: Sector - Energy/Basic Materials Index 1.86%
HFRI ED: Distressed/Restructuring Index 5.70%
HFRI ED: Merger Arbitrage Index 1.86%
MSCI Emerging Markets EM Index 2.40%
MSCI Brazil Index -0.12%
MSCI South Korea Index Fund 3.75%
MSCI South Africa Index 4.57%
Total 4.97%