probabilistic advisory subsystem as a part of distributed ... · technical report no....
TRANSCRIPT

University of West Bohemia
Department of Computer Science and Engineering
Univerzitni 8
30614 Pilsen
Czech Republic
Probabilistic Advisory Subsystem as a Part of Distributed Control System of Complex Industrial Process The State of the Art and Concept of Ph.D. Thesis
Ivan Puchr
Technical Report No. DCSE/TR-2015-01
June, 2015
Distribution: public

Technical Report No. DCSE/TR-2015-01 June 2015
Probabilistic Advisory Subsystem as a Part of Distributed Control System of Complex Industrial Process
Ivan Puchr
Abstract Complex industrial processes are usually controlled by advanced control systems. The control system guarantees basic functioning of the process, but a part of responsibility for the setting of several parameters is left to operators. As the settings of these parameters can substantially influence the behaviour of the whole process and possibly the quality of production, it is reasonable to provide the operator with a support tool that can help him to avoid improper settings of these parameters. One possibility is to provide the operator with an advisory system.
In this work, a probability based advisory system and its integration into the whole control system is discussed. As the advisory system is highly dependent on the availability of process data of a good quality, attention is devoted to data acquisition, transfer and storage within the distributed control system. The processing of data for the purposes of the advisory system, in this case based on the Bayesian probability theory, is discussed in detail further in this work.
For better understanding, the problems and solutions are explained by using of an example of complex industrial process—metal strip rolling.
Copies of this report are available on http://www.kiv.zcu.cz/publications/ or by surface mail on request sent to the following address: University of West Bohemia in Pilsen Department of Computer Science and Engineering Univerzitni 8 30614 Pilsen Czech Republic Copyright © YYYY University of West Bohemia in Pilsen, Czech Republic
Contents 1 INTRODUCTION .......................................................................................................... 5
2 REASONS FOR DEVELOPMENT OF AN ADVISORY SYSTEM ............................................ 7
3 STATE OF THE ART ...................................................................................................... 8
3.1 Decision Support System for Value Engineering in Flour Mills......................................... 8
3.2 An Architecture of a Multi-Agent System for SCADA, Dealing With Uncertainty, Plans and Actions ....................................................................................................................... 9
3.3 Framework of a Machining Advisory System with Application to Face Filling Processes 9
3.4 Improving Drilling Results with a Real-time Performance Advisory System .................. 10
3.5 Research and Applications of AHP/ANP and MCDA for Decision Making in Manufacturing ................................................................................................................ 10
3.6 A Multi-modal Teaching-Advisory System using Complementary Operator and Sensor Information ..................................................................................................................... 11
3.7 An Integrated Transport Advisory System for Commuters, Operators and City Control Centres ............................................................................................................................ 11
3.8 Development of an Integrated Decision Support System to Aid the Cognitive Activities of Operators in Main Control Rooms of Nuclear Power Plants ...................................... 12
3.9 A Hybrid Neural Network and Expert System for Monitoring Fossil Fuel Power Plants 13
3.10 Intelligent Online Process Monitoring and Fault Isolation ............................................. 13
3.11 ALLY: an Operator's Associate Model for Cooperative Supervisory Control Situations. 13
3.12 The ANN (Assistant Naval Navigator) System ................................................................. 14
3.13 EPAS: An Emitter Piloting Advisory Expert System for IC Emitter Deposition................ 14
3.14 The Intelligent Alarm Management System ................................................................... 14
3.15 Energy Management of the Multi-Mission Space Exploration Vehicle using a Goal-Oriented Control System ................................................................................................ 15
3.16 Operator Support Systems in S&C of Large Technical Systems ...................................... 15
3.17 Data Mining Approaches for Sustainable Chiller Management in Data Centers ........... 16
3.18 State of the Art Summary ............................................................................................... 17
4 OPERATOR ADVISORY SYSTEM .................................................................................. 20
4.1 Integration of the Advisory Subsystem into Distributed Control System ...................... 20
4.1.1 Hardware and Operating System Platforms ....................................................................... 21
4.1.2 Structure of the Advisory System ........................................................................................ 22
4.1.3 Data Acquisition .................................................................................................................. 24
4.1.4 Improvement of Data Quality ............................................................................................. 28
4.2 Data Processing Based on Bayesian Probability ............................................................. 29

Ivan Puchr Probabilistic Advisory Subsystem as a Part of Distributed Control System of Complex Industrial Process
University of West Bohemia 4
4.2.1 Bayesian Statistics ............................................................................................................... 29
4.2.2 Underlying Theory of Probability Mixtures ......................................................................... 38
4.2.3 MixTools Function Library as the Key Software Tool for Probability Mixture Handling ..... 45
4.2.4 Offline Processing of Historical Data and Creation of Historical Mixture ........................... 46
4.2.5 Actual Production Mode and Creation of Target Mixture .................................................. 56
4.2.6 Final Data Processing and Generation of Advices ............................................................... 58
5 PROSPECTS OF FUTURE WORK ................................................................................... 60
6 CONCLUSION ............................................................................................................. 61
7 REFERENCES .............................................................................................................. 62
Appendix 1 Real-time Database—Description of Principles ..............................................................................................65
Appendix 2 Listing of priorInformationInfluenceDemoFunction .......................................................................................71
Appendix 3 Listing of priorInformationInfluenceDemoFunction Call with a Set of Parameters and Plot of Results .......72
Appendix 4 Example of MATLAB Code Generating Figure 18 ............................................................................................73
Appendix 5 Description of MixTools Library ......................................................................................................................74
Appendix 6 MATLAB Code Snippet that Demonstrates Creation of Mixture of pdfs from Acquired Data .......................78
Appendix 7 MATLAB Code Snippet for Demonstration of Marginal pdf Creation with the Help of MixTools Toolbox ...79
Appendix 8 List of Author's Publications ............................................................................................................................80

Ivan Puchr Probabilistic Advisory Subsystem as a Part of Distributed Control System of Complex Industrial Process
University of West Bohemia 5
1 Introduction Up-to-date control systems of industrial processes can manage to control the particular process even without substantial help of an operator in many cases. Yet, there exists a set of applications where operator's involvement in process control is unavoidable. There are several reasons for this. Let us quote the most frequent one: process is affected by influences that are not or even cannot be measured, and the operator uses his experience and intuition to replace the missing information.
In this situation, an experienced operator can be, at least temporarily, quite successful, but it is a hard work for the operator in any case. The quality of control and thus the quality of production is highly dependent on operator's long-term experience and on his actual psychical and physical condition. With change of this condition or with change of the operator for a less experienced one, the quality of production can vary significantly. The reason need not be subjective ability of the operator only, but also objective reasons such as for example that operator cannot follow all measured variables at the same time. It is usually presumed that people can continually follow five values at most [1].
To help the operator and to minimize the variation of production quality, advisory system can be introduced as an extension of control system. Development of the probability based advisory system takes advantage of results of several research projects aimed to utilization of probabilistic theory for industrial applications. Projects are listed in the following table:
Period Acronym Name Partners Grant Program/Call
2000-2002
ProDaCTool Decision Support Tool for Complex Industrial Processes based on Probabilistic Data Clustering
University of Reading (UK), ÚTIA AV ČR, Trinity College Dublin (IRL), KOR Rokycany, COMPUREG Plzeň, s.r.o.
IST-1999-12058
IST-Shared cost RTD (FET)
2005-2011
DAR Data Algoritmy Rozhodování ÚTIA AV ČR, COMPUREG Plzeň, s.r.o, FAV ZČU, ...
1M6798555601
MŠMT PP2-DP01
07/2009-06/2012
ProBaSensor Probabilistic Bayesian soft sensor—a tool for on-line estimation of the key process variable in cold rolling mills
COMPUREG Plzeň, s.r.o, ÚTIA AV ČR, Josef Stefan Institute (SLO), INEA d.o.o (SLO)
E!4632 EUREKA-Eurostars, MŠMT
01/2013-12/2015
ProDisMon Probabilistic distributed industrial system monitor
COMPUREG Plzeň, s.r.o, ÚTIA AV ČR, Josef Stefan Institute (SLO), INEA d.o.o (SLO)
E!7262 EUREKA-Eurostars, MŠMT
Author of this document has cooperated as a team member of COMPUREG project partner on all these projects.
For illustration and for better understanding of particular problems and solutions of the advisory system, an example of complex industrial process with distributed control system is used—metal strip rolling.

Ivan Puchr Probabilistic Advisory Subsystem as a Part of Distributed Control System of Complex Industrial Process
University of West Bohemia 6
Reasons for development of an advisory system are presented in chapter 0. As the research and development process started several years ago and because the advisory system is relatively complex, not all details will be described in this work. Attention will be paid mainly to key parts of the system—data acquisition and data processing.
Chapter 0 brings a survey of various approaches to the solution of advisory systems, together with several examples of different types of applications.
Development of the system can be roughly divided into several stages. Process data is to be acquired within the distributed control system. All available data that can hold information about the controlled process are useful. This topic is described in chapter 4.1.3., while hardware and software structure of the advisory system can be found in chapters 4.1.1 and 4.1.2. Attention is devoted mainly to inter-process communication within the distributed control system.
The key part is data processing of the acquired data with the use of methods based on Bayesian probability theory. Key principles of the theory are the topic of chapter 4.2.1. Chapter 4.2.2 is focused on the theory of mixtures of probability density functions, which is the basic tool for the processing of acquired data.
In chapter 0, prospects of future work are described.

Ivan Puchr Probabilistic Advisory Subsystem as a Part of Distributed Control System of Complex Industrial Process
University of West Bohemia 7
2 Reasons for Development of an Advisory System As mentioned in chapter 1, there is a set of processes and their control systems where direct and continuous involvement of operator in control of the process is unavoidable. Typically, these processes are complex, controlled by a control system with a relatively high number of input and output signals. Control system is usually formed by a set of cooperating subsystems that control local parts of the system and at lower hierarchical levels. These local control tasks can be managed quite easily because of their low-dimensional nature and because low-dimensional problems can be modeled relatively easily with the aim to find suitable control strategy ([2] page 15). Principles and technical realisations of these local control subsystems have been elaborated usually in detail and realized successfully during the past decades.
Operator controlling a complex industrial process has usually a lot of variables available. These variables may describe the behaviour of the process sufficiently but the operator is not able to follow them in their complexity. His physical and psychical conditions influence the performance and results substantially [3]. On the other hand, operator can use his intuition and involves into the decision even the extraneous influences that are not available to the control system (for lack of sensors) [1].
On the contrary, a computerized control system, that would replace the operator, would have the following advantages and disadvantages:
the ability to follow almost unlimited number of variables,
operation with almost stable performance,
no intuition,
cannot involve conditions that are not supported by input signals. This obviously results in not to supersede operator by a computer but to take advantages of both and support operator by a computer—by an advisory system.

Ivan Puchr Probabilistic Advisory Subsystem as a Part of Distributed Control System of Complex Industrial Process
University of West Bohemia 8
3 State of the Art In the following subchapters, sources of information are concentrated that are related to the investigated theme of advisory systems. Principles of related projects are summed up here. Evaluation and categorization of principles used in these projects and their relation to our approach are summarized finally.
3.1 Decision Support System for Value Engineering in Flour Mills
In [4], a decision support system is described that helps the operator to adjust parameters of flour mill control system close to optimum from the point of view of selected criterion. The decision support system is designed for a special industrial application, the control of mixing of dozens of material streams (input streams) with different technological properties into a substantially smaller number of final (output) streams. Output streams are required to have specified properties, which are reached by suitable combination of input streams. There are some limitations, e.g. not each input stream can be directed to each output stream from topological reasons. On the other hand, there exist usually several combinations of input streams that can produce required output stream properties.
The solution formulates the problem as linear optimization or linear programming problem. Linear combination of input streams should reach selected criterion under several conditions that must be met. There exist several algorithms that solve linear programming problems but in this case, some obstacles prevented straightforward solution. The main obstacle to overcome was high complexity that resulted in too high computational performance requirements. The problem had to be simplified in several aspects. During the development process, methods of integer linear programming (input stream attributes were quantified by integer values) and binary (zero-one) linear programming were used besides continuous value linear programming. Acceptable solution with reasonable computation time was find in the end. Decision support system was successfully tested in a real industrial environment. Interface to the operator is a special graphical user interface. It offers several possible computed adjustments (combinations of input streams that meet the requested criterion) the operator can choose from. Operator uses his experience and possibly other aspects not known to the advisory system to select among the offered combinations the right one.
From the point of view of developed probabilistic advisory system, following properties of the linear programming based decision support tool should be taken into account:
Solution with a help of linear programming needs the problem to be described by a linear function, that is to be minimized or maximized, and a set of constraints. This is a limitation that cannot be overcome in all considered applications.
The use of the described decision support tool is limited to a special industrial process.
As the solution of the general linear programming problem took much computational time and power, the general linear programming problem had to be simplified with a good knowledge of the industrial process to get reasonable time delays.
The graphical user interface of the decision support system may be inspirational as it offers not only one possibility but lets operator choose from several acceptable settings. An expertise knowledge based on experience of the operator can help him to make the right choice.

Ivan Puchr Probabilistic Advisory Subsystem as a Part of Distributed Control System of Complex Industrial Process
University of West Bohemia 9
3.2 An Architecture of a Multi-Agent System for SCADA, Dealing With Uncertainty, Plans and Actions
In [5], the authors deal with the problem how to extend a standard SCADA (Supervisory Control and Data Acquisition) system by a possibility to assist operator in making decisions under uncertainty. As application example, control of electrical power generation, transmission and distribution is given. The system is designed to help operator to control balance between power generation and consumption, while information from multiple sources is uncertain.
Handling of uncertain information is based mainly on Dempster-Shafer theory. This approach is similar to Bayesian statistics approach described in next chapters. Dempster-Shafer theory is specific in that respect that instead of probability of a proposition it uses the notion of belief. The difference is that belief that proposition is true plus belief that proposition is false need not be equal to one in Dempster-Shafer theory. In other words, the Dempster-Shafer theory handles also the situation that we have not enough information to express either the probability that the proposition is true or the probability that the proposition is false.
Another approaches to handling of uncertain information (e. g. possibility theory) are used in the multi-agent system for SCADA project too. The project exploits also fusion rules for combination of uncertain information from several sources.
The project aims mainly for specific applications characterized by relatively slow processes in an environment with high uncertainty.
3.3 Framework of a Machining Advisory System with Application to Face Filling Processes
In [6], a specific advisory system for the use in the field of machining processes is described. Users of this advisory system are manufacturing engineers who face the problem to plan the production of a new product with a machine tool. Production parameters, machine tool settings are to be adjusted to new conditions. In the article, situation is demonstrated on face milling operation. Inputs of the advisory system are machining parameters such as speed, feed, depth of cut etc., further cutter geometry and material constants. Outputs are cutting forces, workpiece vibrations and spindle vibrations. The advisory system works basically with model of the face milling process in cooperation with some heuristic rules. The system is designed for offline processing. The operator inputs all requested parameters and after a calculation phase, system displays output parameters. The system is not intended as an online advisory system for the operator of the machine tool.
Features of the advisory system can be summed up as follows:
Advisory system is based on a model of the investigated process. So the model of the process must be known, which is a request that is not always possible to be fulfilled.
Some properties of the investigated process not included in the model are described with a set of heuristic rules.
Solution is an example of a grey box model approach.
Advisory system is not suitable for online support of operator controlling the machinery tool.
Designed for one specific application only.

Ivan Puchr Probabilistic Advisory Subsystem as a Part of Distributed Control System of Complex Industrial Process
University of West Bohemia 10
3.4 Improving Drilling Results with a Real-time Performance Advisory System
In [7], an advisory system is described that is used in oil industry. Operator-driller is supported by the advisory system during the process of drilling of an oil well. As the advisory system is an example of a commercial product, information about its principles is very limited. Generally, the system is based on model of drilling process. The model is probably adjusted for each location conditions, especially geological parameters are taken into account. This model is created offline during the planning phase days before drilling actually starts. During the drilling phase, the advisory system compares actual drilling conditions with the planned ones in online mode and offers the operator possible adjustments. Data acquired in the online phase are then used for upgrade of the drilling process model. Thorough attention is focused to presentation of information to the operator. 3D and simplified graphic objects are used to attract operator's attention and to let him to recognize the meaning in the wink of an eye. It is especially important in harsh environment of the rig.
In short:
Grey box model based.
Model repeatedly adjusted with the use of newly acquired data.
Heavy duty operator panel due to harsh environment.
Simplified visualization readable even under bad weather conditions.
3.5 Research and Applications of AHP/ANP and MCDA for Decision Making in Manufacturing
In [8], the author introduces the use of AHP/ANP and MCDA methods for the support of decision in manufacturing. MCDA (Multiple-Criteria Decision Analysis) is an approach to solution of problems where the best alternative is chosen not on the base of one criterion but multiple criteria are taken into account. Criteria are dependent or independent. The dependence of criteria brings the necessity to optimize them as a complex and to cope with possible contradiction of criteria. The most precise machine is usually not the cheapest one, e.g. that is why, solution of these problems is instead of one best possibility a set of most suitable alternatives.
AHP (Analytic Hierarchy Process) is a method for solving of MCDA problems. Problem is decomposed to sub-problems. Sets of alternatives and criteria are chosen and composed to a hierarchy. All alternatives are evaluated by a number in relation to each criterion. The importance of criteria in relation to final goal is evaluated by a number for each of them. The evaluation advances from lover to higher level in hierarchy. In the end, alternatives are evaluated by numbers that enable to choose the most suitable alternative with the respect to desirable goal under selected criteria.
ANP (Analytic Network Process) is a method similar to AHP, but alternatives and criteria are generally taken as independent of each other and are not composed to a hierarchy but to a network.
The author states examples of applications of this approach and draws attention to articles describing the use of MCDA methods in following areas:
How to reach a competitiveness of a manufacturer on the market

Ivan Puchr Probabilistic Advisory Subsystem as a Part of Distributed Control System of Complex Industrial Process
University of West Bohemia 11
How to choose the right type of a power plant
Enterprise profitability analysis
Risk analysis for improvement of safety of manufacturing system
And others.
An interesting example of using the MCDA methods for decision support in document printing field can be found in [9].
There exist several software products on the market that support operator in solving MCDA problems. These software tools communicate with operator in the manner of a dialog which is given by the nature of the MCDA problems. The operator have to specify basic initial information and requested goal together with criteria and their weights. The software offers alternatives and enables the operator to experiment with criteria and their weights while displaying how the priorities of alternatives may change.
This type of problems and the approach to the solution of them is not fully compatible with our intended operator support system but it is inspirational. For example, there may exist more than one way how to get from one operating mode of a machine to another one. One way may be to increase the value of parameter A and then to decrease the value of parameter B. Another way may be the reverse order of parameter adjusting. Because both the ways may not be equivalent in consequences, operator than faces the decision which way to choose. MCDA approach may help to solve this problem.
3.6 A Multi-modal Teaching-Advisory System using Complementary Operator and Sensor Information
[10] offers an example of an specialized advisory system used for support of operator teaching an industrial robot to do an operation. The teaching is done by generation of commands for the robot by the operator. The main contribution of the advisory system is the joining of information that is available to robot (inputs from sensors) and of information the operator has available (intuition, experience, the goal of teaching). There is no special mathematical theory support according to information available. The advisory system just presents a concentrated information to the operator and supports him in reaching more precise teaching results.
This advisory system is interesting in it that it uses, besides usual visual interface, an audio output too. This enables the operator to keep watching robot's tool and to be more precise in navigating this tool.
3.7 An Integrated Transport Advisory System for Commuters, Operators and City Control Centres
[11] describes interesting application of advisory system for users and operators of city transportation system. This application is interesting in that respect that traffic control is one of fields which was used for evaluation of developed probabilistic principles in the above mentioned DAR project.
The transport advisory system has three categories of users: passengers, vehicle drivers and operators in control centres. Especially, the use of the advisory system by operators in a control centre and data acquisition are interesting from the point of view of the developed system. The most frequently used information in this system is geo location of

Ivan Puchr Probabilistic Advisory Subsystem as a Part of Distributed Control System of Complex Industrial Process
University of West Bohemia 12
transportation vehicles and passengers. As the system is intended for heavily populated cities where there is no problem with Internet connection of mobile devices, no GPS is used for the purpose of localisation of passengers and vehicles. The system uses HTML5 geo location services provided by third party for this purpose. This enables to monitor locations of passengers' mobile devices and build in driver's consoles in vehicles in real time. Acquired location data are concentrated in control centres and create the main base of information for decision support of the advisory system users.
As it is not known what amount of resources the system will need but it is known that high scalability is necessary, the system is not built on a special hardware but it exploits, at least in the development stage, Amazon cloud computing services. The use of cloud computing services may be inspirational because demands for relatively high computing power are expected in our project too, especially for advisory mixtures of probability density functions.
Another interesting moment is how the advisory system tries to reduce amount of transmitted data. The principle consists in grouping of passengers' requests and system replies and suggestions. For example, passengers boarding the same vehicle or waiting at the same bus stop are most probably interesting in the same information.
3.8 Development of an Integrated Decision Support System to Aid the Cognitive Activities of Operators in Main Control Rooms of Nuclear Power Plants
In [12], support tools for operators of a very complex industrial process, nuclear power plant, are described from the point of view of main problems of this specific field. Similarly to other complex processes, the operator faces the problem that he has all necessary information available but he is not able to follow all sources of information simultaneously, recognize all non-standard situations, find solution and carry out proper actions.
The importance of the operator support is demonstrated in the article by the statistics showing that almost in one half of incidents in US nuclear power plants a human error was involved. Another interesting information is that experiments proved that operator supporting system may decrease operator's awareness in special cases. This stresses the importance of proper design of the operator support system. The design of the decision support system in [12] is based on detailed knowledge of human cognitive process.
The support functions of the system are divided into two categories in the article. Improvement of displays and indicators like colours, use of 3D technology and use of latest information presentation approaches like multimedia are called "indirect support". In other words, the ways information is brought to operator. The other category is called "direct support" and comprises means that bring information with added value to the operator. This category consists of advisory and decision support systems, expert systems and knowledge-based systems.
A part of described decision support system is worth noticing. One of subsystems validates operator's actions. Operator after evaluation of information and after making a decision makes a plan of actions that e. g. should return the process from an unstable state to a standard one. Validation subsystem checks the sequence of planned actions and warns the operator or even interrupts the intended action plan with the aim to avoid dangerous or otherwise faulty sequence of actions.

Ivan Puchr Probabilistic Advisory Subsystem as a Part of Distributed Control System of Complex Industrial Process
University of West Bohemia 13
As far as the underlying theory is concerned, neural networks are mentioned in the article. Neural networks are used in fault diagnosis advisory system. To increase the reliability and credibility of generated advices, two neural networks are used. One network processes logical input signals concerning alarms and statuses of particular parts of the process. The second one processes analog input signals bringing similar information as the logical ones. Outputs of both networks are merged with the aim to increase the reliability of information presented to the operator.
3.9 A Hybrid Neural Network and Expert System for Monitoring Fossil Fuel Power Plants
In [13], authors introduce an operator support tool consisting of combination of a neural network model of power plant and a rule-based expert system. This hybrid system is designed to help operator to keep the power plant in standard conditions, especially the power plant boiler. The neural network model undergoes an adaptation to the particular power plant. This is called learning phase. The learning makes portability of this system to another power plant easier. On the other hand, the set of rules of the expert system must be changed substantially with an new power plant. This must be done by hand.
The concept with learning phase corresponds partially with the advisory system described in this work where the learning phase is replaced with the phase of data mining from historical data.
3.10 Intelligent Online Process Monitoring and Fault Isolation
In [14] article, besides standard principles of operator support based on an expert system, an important function of operator support tool for diagnostic purposes is highlighted. In case of an emergency situation of a controlled process, diagnostic systems produce usually an overwhelming amount of alarms, messages and other information. This can confuse the operator. The operator support tool should process all these sources of information, separate substantial information from less important one and present it to the operator with the aim to let them concentrate on really important corrective actions.
3.11 ALLY: an Operator's Associate Model for Cooperative Supervisory Control Situations
Authors in [15] offer an remarkable approach how to support operator of a complex process. In standard situations, process may be controlled by one operator, but under abnormal conditions, one operator cannot manage the situation. That is why more than one operator is usually in charge. This is not very effective because operators are underutilized in most cases. The key idea is to let one operator control the process and create a computer-based associate / assistant to human operator that will help the operator in abnormal situation of the process. The communication between operator and associate is based on human to human communication principles. Operator and associate cooperate in the manner of two humans, while operator has always the priority in making decisions. The operator can delegate a control function to the associate but the operator must have right to seize back the initiative under all circumstances.
This article is inspirational not in used technologies with respect to its date of publication, but mainly in the principles how the human operator cooperates with the advisory system.

Ivan Puchr Probabilistic Advisory Subsystem as a Part of Distributed Control System of Complex Industrial Process
University of West Bohemia 14
3.12 The ANN (Assistant Naval Navigator) System
Assistant system described in [16] is a special purpose advisory / warning system. It is used for the support of operators of small vessels in US, especially recreational and small commercial. The necessity of this system arose from the number of deaths and severe injuries and amount of property losses in boat accidents. The ANN system has client server architecture. ANN clients are small handheld devices, equipped among others with a colour display, GPS module, wireless Ethernet interfaces and module for voice synthesis. ANN clients are present on the vessels operating in close-to-shore waters and communicate with a network of servers located along the coast. Servers acquire information from many sources like GPS position, speed and direction of particular vessels, weather conditions and forecast. Software modules are both knowledge based and operating on cybernetics principles and process this information with the aim to find possible collisions and other dangerous situations. Results are directed to ANN involved clients in the form of warnings and advisories.
In spite of the fact that this field is not related to our intent, we can find some similarities in that respect that the operator has enough information even without ANN system to navigate the boat safely but he is not able to interpret all the information correctly in a limited time period. The operator is usually provided with a set of navigation assistance instrumentation that provide relevant information but the operator is usually not able to navigate the boat by hand and follow and interpret all devices simultaneously, especially under dangerous conditions. The ANN client device presents the information to the operator in a concentrated form and based on significance priorities
3.13 EPAS: An Emitter Piloting Advisory Expert System for IC Emitter Deposition
Among knowledge based systems for support of operators, the expert system described in [17] can be named. The system solves a problem in the production of integrated circuits. A diffusion operation was parameterized by a set of parameters that influence the quality of operation substantially. In case of low quality of operation, operator had to call for an experienced production engineer that changed the set of parameters. The change was based mainly on the engineer's experience. There were some attempts to describe the relations between set of parameters and quality of operation by mathematical equations, which would enable to calculate the parameters. The attempts were unsuccessful and that is why a solution with an expert system was introduced.
The expert system was built with the help of a commercial expert system building tool. Experience of production engineers was transformed to objects and rules of the expert system. Irrespective of the date of publication, this article well demonstrates the reasons for introduction of an expert system:
Process is too complex to be described by a simple model.
Engineers with experience can reach relatively good results by application of a heuristic approach.
3.14 The Intelligent Alarm Management System
In this article [18], support of operator is described that helps him to better recognize what is important and what is not. The alarm management system improves the situation in

Ivan Puchr Probabilistic Advisory Subsystem as a Part of Distributed Control System of Complex Industrial Process
University of West Bohemia 15
control room of a large petrochemical plant where operator is overburdened by a big amount of alarms generated by a standard SCADA system. The number of alarms is typically 100 in 10 minutes.
The system acquires statistical information of occurrences of particular alarms, makes analysis of nuisance alarms and separates alarms connected with critical process variables. This information is processed online and as its output, system provides an interface to operator that enables him to set particular filters that enable to reduce the number of alarms while preserving important information that enable the operator to control the process and make appropriate actions to avoid any emergencies.
This is further example of a typical operator support system that helps the operator by reducing insignificant information presented to operator while keeping the substantial one.
3.15 Energy Management of the Multi-Mission Space Exploration Vehicle using a Goal-Oriented Control System
[19] introduces use of operator advisory system in the field of aeronautics. The system is used in space exploration vehicle both during the tests on earth and during the space missions. On earth, it is used for coordination of energy consumption and planed day's activities of the crew. For creation of the plan of activities, human-in-the-loop model of the vehicle with the crew is used. Advices generated by the advisory system are interpreted by astronauts. Astronauts are taken as smart actuators. The advisory system calculates predictions of energy consumption. Planed crew activities are taken into account, as different activities need different amount of energy. Actual environment conditions like temperature and terrain influence energy consumption calculations. Another interesting condition that is incorporated into power consumption model is the ability of the exploration vehicle to rescue the tandem vehicle if it gets into difficulties.
The article shows that even in NASA projects, not all software must necessarily be created as special-purpose but that generally used software may advantageously be exploited too. The example is Google Earth service that was used as a tool for route planning of the exploration vehicles.
GUI of the advisory system is surprisingly a standard simple screen using description and value labels complemented with a line chart that represents energy supply change during the mission. This shows that even a simple GUI can meet requirements of a prestigious project. On the other hand, the GUI would deserve at least some bar representation of numerical values for better readability.
3.16 Operator Support Systems in S&C of Large Technical Systems
In [20] article, general aspects of operator advisory systems can be found. In spite of the early date of publishing, the article brings classification of advisory systems and questions concerning operator's GUI that are valid up to now.
Alarm filtering systems are one category of systems for support of operators mentioned in the article. The main task of these systems is reduction of information presented to operator. This category is represented by [18] in our survey. Knowledge based advisory systems are classified as another category. These systems are used very often, in our survey are represented by [17]. Advisory systems based on neural networks form another category

Ivan Puchr Probabilistic Advisory Subsystem as a Part of Distributed Control System of Complex Industrial Process
University of West Bohemia 16
mentioned in the article. These systems are regarded as very promising because of the 'fuzzyness' and probability that can be incorporated in these systems. System described in [12] belongs to this category. The last category mentioned in [20] is formed by self learning advisory systems. Systems of this type exploit similarity of newly emerging situations to former ones. Operator acknowledges that newly emerged situation was recognized by the system correctly and that the system can remember (learn) it for next time use. Similar principle is used in [13], e.g.
As far as GUI is concerned, the article discusses so called Mass Data Display (MDD) principle. It is an approach how to present status of thousands of process variables to the operator. Each variable is represented by a small graphical object that changes its properties (shape, colour) according to changes of variable status. This enables to create a pattern of these small object on a screen. The pattern is perceived by the operator as a whole and operator can recognize its changes that indicate changes of the monitored process. According to the authors, tests showed that MDD must be taken as an additional tool for the operator only, not as a replacement of standard operator screens with objects like Pipe & Instrumentation Diagrams, numerical and bar graph representations of variables, trend curves and so on.
Further, the use of three-dimensional presentation of process status and multimedia use in control rooms are discussed in the article, but this information can be taken for obsolete with respect to the date of publication.
3.17 Data Mining Approaches for Sustainable Chiller Management in Data Centers
The [21] article deals with the problem how to help an operator to manage the cooling of a data centre. CAMAS (Chiller Advisory and MAnagement System) is described here. The authors stress the importance of this theme by giving example values that 1-2% of all electricity are consumed by data centres and that 30-50% of data centres electricity consumption is spent on cooling. So it is worth to optimize the cooling.
The CAMAS system does not use an model approach. There exist theoretical models of particular units of data centres but the use of these models is limited because of inevitable simplifications and big amount of necessary computational resources. That is why CAMAS exploits data-driven approach. Inputs of the system are data from sensors positioned around the data centre, in particular racks and in all cooling equipments. As a part of cooling system, a cooling tower is located in the open air. Sensors are positioned outside the data centre too, to measure ambient temperature and humidity. Cooling tower together with evaporator and condenser form chiller, where cooling water is produced. Other parts of the cooling system are Computer Room Air Conditioning (CRAC) units positioned in the data centre room. CRAC units cool air that is blown through computer racks. Power of the cooling system can be controlled.
Previous experience with operation of the cooling system showed that inefficiency of the system is caused mainly by the following issues:
Frequent start / stop cycles of the cooling system cause degradation of reliability of the cooling system, MTBF (Mean Time Between Failure) decreases.
Energy efficiency of chiller is low if cooling load is too low or too high.

Ivan Puchr Probabilistic Advisory Subsystem as a Part of Distributed Control System of Complex Industrial Process
University of West Bohemia 17
There exist unknown dependences between cooling system efficiency and environment conditions.
Performance of the cooling system is influenced by factors that are not measured by sensors.
These problems cause that the cooling systems are usually operated and controlled on the base of heuristic rules and operator's experience. This is insufficient especially if cooling load changes frequently.
With the aim to find efficient working points of the cooling system, the CAMAS uses motifs. Motif is a time sequence of multivariate data values that form a typical pattern and the pattern occurs in data stream repeatedly. CAMAS utilizes special algorithms for finding motifs in data stream. Found motifs are taken as states of cooling system and are evaluated from the point of view of cooling system sustainability. Sustainability comprises power consumption, carbon footprint and amount of energy reserved for consumption regardless of whether is consumed or not.
Motifs cover a smaller part of time the cooling system is working. The rest of time periods, the CAMAS tries to cover by states with correlation to external conditions of the cooling system. For finding these states, clusters in multivariate data space are identified. Clusters are taken for states and transitions between states are investigated. In this respect, the whole operation of chillers in the cooling system is decomposed to sequence of states and transitions between them. This composition is then used to investigate the cooling system and to find principles how to operate it in an efficient and sustainable way with respecting the economical aspects.
The aim is to create a tool for support of administrators of data centres but further investigation is necessary according to authors of the article.
3.18 State of the Art Summary The survey stated above is naturally not fully comprehensive but all main directions and trends of development in this field may be recognized from it. The incompleteness has several reasons. Operator advisory systems often have some properties of knowledge-based systems, expert systems and other decision support tools, which widens the field extremely. Other reason is that this course of study develops very quickly, especially rush computing power enhancements and network interconnection intensification enable the use of approaches that were inconceivable recently. Substantial part of information about achievements in this field is not available because it is often developed in corporate and not in academic environment, which causes the results to become commercial and not publicly available.
The survey shows that systems for support of operators can be broken up into several areas from different points of view:
1. Description of process behaviour:
Very often approach is the description of process behaviour based on a model. White box model describes the process completely with as little as possible of approximation. The model is represented by a set of differential equations usually. White box model is very rear and is used for simple processes only. The

Ivan Puchr Probabilistic Advisory Subsystem as a Part of Distributed Control System of Complex Industrial Process
University of West Bohemia 18
reason is that it is very problematic and in most cases even impossible to find the appropriate representation. If we intend to develop the operator advisory system not for one particular process only but for a set of similar processes, the white box model approach is not suitable for us. It would be necessary to find the model for each particular process.
In many cases, the white box model is replaced by grey box model (see [6], [7]). This approach is characterized by finding of a simplified model of the process controlled by operator. A reasonable amount of approximation is used. Special behaviour of the process not supported by the simplified model is covered by a set of parameters and circumferences. For grey box model approach to advisory system, constraints similar to white box model are valid too, in the respect of our intentions.
An approach that often produces good results is to describe the behaviour of process by a set of heuristic rules and constraints only (see [4], [6], [17]). This strategy originates from natural idea to sum up the historical knowledge of experienced operators and exploit it in the operator advisory system. Principle is simple but it is usually a tedious and time consuming work to concentrate the historical knowledges of operators and transform them into a formal expression exploitable by computerized advisory system. And what is more, it must be repeated for each particular process.
An example of another approach is given in [8]. In this case, decision problem can be described by a set of criteria and operator is to be adviced in making right decisions in a hierarchy of alternatives with the aim to reach as good as possible result according to selected criterion. The methodology is called MCDA—Multiple-Criteria Decision Analysis. As mentioned in chapter 3.5, this strategy is not suitable for continuous control of process by operator, but it can help the operator to decide if the advisory system generates more than one way how to reach requested status of process.
From the point of view of our intention, solution based on black box model (or data-driven solution in [21]) is interesting. Principles of process behaviour are mined out from historical data. This operation may be automated in principle and thus may avoid necessity of human professional formulating model of the process. Principles of this approach will be described in next chapters in detail.
2. Handling of uncertainty:
In cases where the behaviour of process controlled by operator is not fully known and exactly described, we must handle a certain amount of uncertainty. First example of theory for handling of uncertainty is described in our survey in chapter 3.2. The mentioned Dempster-Shafer theory with its key notion called belief is especially suitable for processes with high uncertainty and enables even to express that we do not know anything about a statement.
In [12], [13] uncertainty is handled with the use of neural networks.
In [21] Bayesian statistics is used as the key theory and that is our choice too, as it will be explained in next chapters.
3. Type of operator support:
The simplest way how to process available information and support the operator is a simple concentration of information and presentation in an ergonomic way.

Ivan Puchr Probabilistic Advisory Subsystem as a Part of Distributed Control System of Complex Industrial Process
University of West Bohemia 19
In this case no artificial intelligence or complex data processing is used. No new information is added, the support system helps the operator to perceive more information at the same time (see [10]).
An often used approach is intelligent prioritization of important and hiding of insignificant information. In this case the support system provides additional information to the operator in that respect that it decides what is important at a given moment and what is not (see [14], [16], [18]).
Another special category of support systems create solutions that hold dialogue with operator. Main representative of this category are expert systems of various types ([17]). In this case, operator must actively communicate with the support system by asking questions and selecting alternatives.
Another type of operator advisory system, that differs from expert systems to a large degree, is the system that online follows process status and operator's actions and generate advices for operator, to enable him to direct the controlled process to a desired status. This is the type of advisory system, development of which is described in next chapters.

Ivan Puchr Probabilistic Advisory Subsystem as a Part of Distributed Control System of Complex Industrial Process
University of West Bohemia 20
4 Operator Advisory System From the facts stated in the State of the Art chapter, it is obvious that there exist a lot of different approaches to the concept of a system that helps human to make better decisions. The solver's team of scientists and people from industry mentioned in chapter 1 had not the aim to find the "best for all" solution of the advisory system. The team aims to create an advisory system that is suitable for branches of human activity the research participants were interested in. It means industrial applications but with the respect to possibility to generalize results for the use in other fields.
From the integration point of view, the advisory system was composed not as standalone system but as an integral part of distributed control system consisting of several subsystems. It was mainly COMPUREG participant who defended the subsystem strategy, in spite of the fact that a standalone solution would have been much simpler. On the other hand, with the integration of the advisory system into the COMPUREG's distributed control system proved by several industrial applications, some advantages and even spare of development time were expected.
From the control theory point of view, "... the adopted approach relies on black-box modelling. This orientation on building of universal data-based models is driven by the problem addressed. The modelled processes are so complex that grey-box or white-box modelling would be too expensive. Whenever possible, the grey-box approaches should however be used to complement the advocated approach. They can strengthen it, for instance, by providing prior physical information at factor and component levels" ([2] page 20.), as will be shown in next chapters.
As far as mathematical theory is concerned, Bayesian decision making was chosen. Main reason for this was fact that ÚTIA participant had long term experience in the field of Bayesian statistics, proved by many publications and successful research projects, and that during the projects, this theory showed its big potential in the field of decision making support.
4.1 Integration of the Advisory Subsystem into Distributed Control System
As mentioned above the advisory system is composed as an integral part of distributed control system. A schematic layout of such a composition is drawn in the following picture.

Ivan Puchr Probabilistic Advisory Subsystem as a Part of Distributed Control System of Complex Industrial Process
University of West Bohemia 21
Process is controlled by a set of local controllers cooperating via local area network. Advisory system is connected to the same LAN as another peer. This enables the advisory system to share control system's data. Advisory subsystem presents results of its calculations for operator to the screen. Operator evaluates suggestions and recommendations of the advisory system and realizes results of his decision by control desk. Thus the control loop closes. (Control desk is in the figure connected to LAN which presumes that local controllers have remote IO's installed there.)
4.1.1 Hardware and Operating System Platforms
In the following chapters, explanations will be bound to a particular hardware and operating system environment sometimes. As mentioned above, the advisory system is intended as an integral part of COMPUREG's distributed control system. In this aspect, we will limit ourselves to hardware and software platforms used in these systems. They are characterised by the following item:
industrial PC (IPC),
Siemens PLC,
Microsoft Windows,
Linux with real-time extensions: o Xenomai real-time framework for Linux [22], o RTAI RealTime Application Interface for Linux [23].
Process
Control system
Local controller 1
Local controller 2
Local controller 3
Local controller n
Operator advisory subsystem
Screen
LAN
Control system output signals
Control system input signals
Figure 1 Integration of advisory subsystem into control system of a process

Ivan Puchr Probabilistic Advisory Subsystem as a Part of Distributed Control System of Complex Industrial Process
University of West Bohemia 22
4.1.2 Structure of the Advisory System
As mentioned in the previous chapter, the advisory subsystem is integrated into the control system of process which enables the advisory subsystem to exploit the control system's data. This is very important for the advisory subsystem because its functioning is fully dependent on the supply of quality data containing information about behaviour of the controlled process. In the concept of advisory system as a standalone one, it would be necessary to build new interface for input signal acquisition (interface cards, wiring and even new sensors) which may mean, depending on number of input signals, substantial additional costs for the advisory system. That is the reason, the concept of integration into the control system is preferred to the standalone solution.
If the concept of integration is adopted, a simplified logical structure of the advisory subsystem can be drawn as in the following picture. (Notion pdf mixture means mixture of probability density functions, it will be explained in next chapters.)
Simplified schema in the picture shows information flow from the input of control system's data to output of information for operator to screen. Data acquired by means of control system are transferred to advisory subsystem via local area network connection. These, from the point of view of advisory subsystem, raw data are stored in real-time database inside the advisory subsystem. Real-time database (RDb) technology will be described in next chapters. Then, the turn of pre-processing of raw data comes. It means scaling, normalization, re-sampling, filtration and other methods of data (input signals values) improvement. Pre-processed data are archived. It is not only archiving in the form of disk files but also short history archiving in RDb memory resident database for fast access to historical data.
Now the data processing splits into two streams. From archived data, mixture of probability density functions (pdf) called historical mixture is calculated. This mixture comprises
Data acquisition
Acquired raw data
Connection to control system
Data preprocessing
Preprocessed data
Archiving of data
Archived data
Calculation of historical pdf mixture
Historical pdf mixture
Calculation of target pdf mixture from actual working point
Target pdf mixture
Calculation of advisory pdf mixture
Generation of recommendations and advices
Advisory pdf mixture
Recommendactions and advices
Visualization of actual working point, recommendations and advices to operator
Screen
Figure 2 Logical structure of advisory system
Ivan Puchr Probabilistic Advisory Subsystem as a Part of Distributed Control System of Complex Industrial Process
University of West Bohemia 23
information about process behaviour in the past. Historical mixture is calculated during the offline (start up) phase and is updated continuously then. The other branch calculates so called target mixture that contains information about actual working point of the process.
From historical mixture and target mixture, advisory mixture is calculated then. The advisory mixture expresses the information how the process parameters should be set to reach process working conditions close to optimum from the production quality point of view.
As this is not the final output of the advisory system, advices and recommendations are generated leading the operator to reach the optimum settings via a shortest and trouble-free way.
Presentation of the advisory system outputs is carried out by visualization module. Beside the current values of technological variables, advices and recommendations are visualized to tell the operator in a comprehensible way what to do.
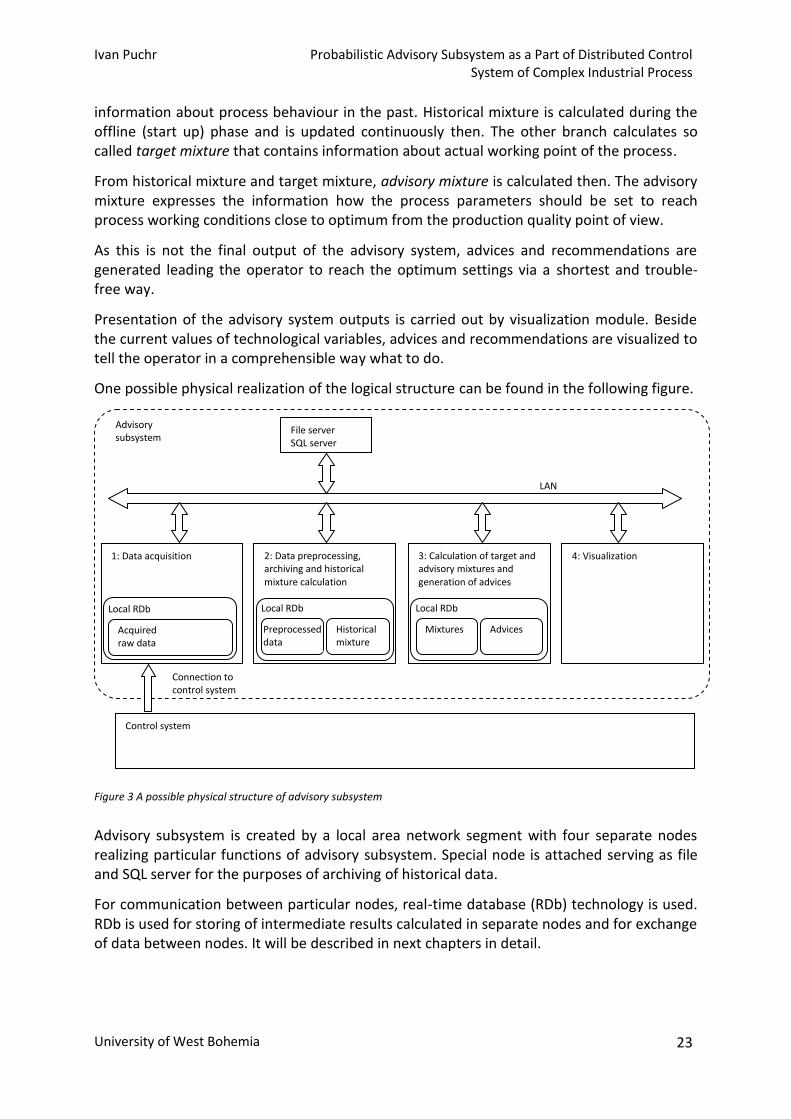
One possible physical realization of the logical structure can be found in the following figure.
Advisory subsystem is created by a local area network segment with four separate nodes realizing particular functions of advisory subsystem. Special node is attached serving as file and SQL server for the purposes of archiving of historical data.
For communication between particular nodes, real-time database (RDb) technology is used. RDb is used for storing of intermediate results calculated in separate nodes and for exchange of data between nodes. It will be described in next chapters in detail.
Figure 3 A possible physical structure of advisory subsystem
2: Data preprocessing, archiving and historical mixture calculation
Control system
Connection to control system
1: Data acquisition
Acquired raw data
Local RDb
3: Calculation of target and advisory mixtures and generation of advices
Mixtures Advices
Local RDb
File server SQL server
4: Visualization
LAN
Advisory subsystem
Preprocessed data
Historical mixture
Local RDb
Ivan Puchr Probabilistic Advisory Subsystem as a Part of Distributed Control System of Complex Industrial Process
University of West Bohemia 24
4.1.3 Data Acquisition
Functionality of the advisory system is based on data mining algorithms. These algorithms need to be supplied with sufficient amount of quality data. And that is why data acquisition is one of the most important parts of the advisory system. First, data are acquired during the advisory system's start-up phase. In this phase, data are acquired to accumulate information that describes nature of the controlled process sufficiently (historical data in short). In this preparatory phase, the advisory system produces no outputs useful for operator yet.
In standard working phase, data are acquired for two main purposes. One purpose is the improvement of the historical data acquired during the start-up phase. A reason for this is that the more data the better evidently. Another reason is that the behaviour of the process may change in time and can differ from behaviour during the start-up phase. This may be caused by replacement of some parts of process or of control system's parts, e.g. Also new working modes may be introduced with production of products with new properties. Newly acquired data are also necessary for recognition of actual working mode of the process.
4.1.3.1 Sources of Data
Data are acquired from several sources. In case where advisory system is added to an existent control system of a process, data can be acquired from archives of the control system, especially in the start-up phase when historical data are acquired. In this case, data are usually available in the form of files of different formats. This can be easily overcome by unification of all formats with the help of conversion software modules. As the conversion output, the Microsoft Access file database format MDB is used. The reasons for selection of this format were as follows:
The format is widely spread and easily accessible from all commonly used software platforms.
This format enables to divide long history period recordings into several files and indicate in file name the time period they represent.
With the division into files, database properties are not lost, especially indexing of records is kept.
In case of utilization of an existent control system as the source of data in the standard working phase of the advisory system, the control system must provide standard communication interfaces and enable connection of at least one other node. It is only a rear situation that existent control system provides one interface with a standard communication protocol with the possibility to acquire all necessary data. Therefore, it is often inevitable for the advisory system to make several communication connections to the control system. For the situation when all necessary data are not accessible via a communication interface, advisory system must connect to the process with the use of signal inputs and sensors. In the next figure, there are three main possibilities of configuration for the purpose of data acquisition.

Ivan Puchr Probabilistic Advisory Subsystem as a Part of Distributed Control System of Complex Industrial Process
University of West Bohemia 25
Possibility 1 is the purest one because data come from one source, from interface node where control system publishes all data acquired from local controllers. Control system is not influenced by the connection of the advisory system. The interface node of up-to-date control systems usually provides standard communication protocols which enables easy connection of the advisory system. The most often used communication protocols for this type of connection in industrial applications is OPC (Object Linking and Embedding for Process Control [24]) protocol or its innovated version OPC UA (OPC Unified Architecture) [24].
Possibility 2 covers the situation where not all data required by advisory system are published by the interface node. In this case, the advisory system must make additional connections to control system's local controllers to acquire data. Control system is influenced by the new connections, timing on the control system's LAN may change to such an extent that it can degrade functionality of local controllers. At the factory floor level, such communication networks are usually used that provide deterministic timing of data exchange among communication nodes. Response time is calculated with the known number of peers and changes with addition of another one. Other problem may occur if the advisory system has to be connected to fieldbus type factory floor network with master-slave concept of communication media access control and especially if single master only is allowed. In this case, the advisory system should be the master to query local controllers (slaves) for requested data but single master is occupied by control system's node and no other master is allowed. Examples of industrial networks with deterministic timing are industrial clones of Ethernet network, so called real-time Ethernets (EtherCAD [25], PROFINET [26], etc. ). Master-slave networks are mainly based on RS-422 or RS-485 physical layers respectively. An example of a network of this type is Siemens's PROFIBUS [27], often
Figure 4 Three examples of connection of advisory subsystem to an existing control system for the purpose of data acquisition
Control system
Advisory subsystem
Control system LAN
Process
Interface node
Local controller node
Local controller node
Local controller node
Advisory subsystem
Advisory subsystem
LAN
Possibility 1 Possibility 2 Possibility 3

Ivan Puchr Probabilistic Advisory Subsystem as a Part of Distributed Control System of Complex Industrial Process
University of West Bohemia 26
used in Europe. The advisory system should provide at least several of mentioned network interfaces to be able to connect to existing control systems.
Possibility 3 represents a situation where data necessary for advisory system are not all available either via interface node or direct connections to local controllers. In this case, advisory system must provide input cards for connection of input signals directly from the process using existing or newly added sensors. The usage of additional input signals does not influence the control system, but it represents substantial additional costs.
If the advisory subsystem is deployed together with control system, the integration can be more consistent. Some data acquisition subtasks are implemented directly in local controllers and cooperate with advisory subsystem's data acquisition node.
Cooperation consists in data exchange and synchronization of local controllers and data acquisition node. For this purposes, Real-time Database concept is used.
4.1.3.2 Real-time Database Concept of Inter-process Data Exchange
Real time Database technology (RDb) was developed by COMPUREG participant in ProDaCTool and subsequent projects as by-product. Author of this document is author of the basic RDb concept too, and implemented and evaluated all basic data structures, mutual exclusion mechanisms and other functions in a real-time environment. Primarily, RDb was meant as a tool for tasks in multitasking environment to exchange data addressed by symbolic names. After further development, RDb is used for inter-platform integration too. It means that e.g. a task running under Xenomai, real-time framework for Linux, can write a value to a variable with a symbolic name, and another task running under Microsoft Windows Embedded Standard 7 operating system can address the same variable with the symbolic name and read the value (see [28]). (Here, the notion task represents an activity competing for access to shared data whether it is process or thread.)
RDb was developed not to replace generally used standard software technologies of this type as OPC e.g., but to cover a limited range of COMPUREG's applications of distributed control systems for fast industrial processes. Great emphasis was put on real-time aspects of the solution because RDb is used as standard part of local controllers running under real-
Figure 5 Integration of advisory subsystem's data acquisition node directly into the control system
Control system
Control system LAN
Process
Advisory subsystem's data acquisition node
Local controller node
Local controller node
Local controller node
Ivan Puchr Probabilistic Advisory Subsystem as a Part of Distributed Control System of Complex Industrial Process
University of West Bohemia 27
time operating system. Requested real-time properties are met by accepting the following principles:
simplicity of code,
direct conversion of symbolic names to memory address, search operations used only in initialization phase,
atomicity of most of operations ensured on instruction level, use of system calls reduced to minimum with the aim to minimize system overhead,
system calls used for critical sections of manipulations with complex data structures only.
More detailed description of RDb technology can be found in Appendix 1.
4.1.3.3 Historical Data Acquisition and Storage
Features of RDb technology described above and in Appendix 1 are used advantageously for data acquisition of historical data for the purposes of the advisory subsystem of distributed control system.
4.1.3.3.1 Time Period and Sampling Strategy of Recordings
For further needs of the advisory system, series of data records sequential in time are necessary. The time period of data acquisition should be long enough to record as much as possible different states and working modes of the process. In practice, it means rather months than days. The time may be continuous from the beginning to the end of data acquisition period or series of continuous periods separated from each other by breaks with no data acquisition can be used. First alternative is used e.g. in a case of an continuous production process like power generation in a power plant or water purification in a water treatment plant. The data acquisition with breaks is, on the contrary, used if the nature of the investigated production process is discontinuous. An example of such a process is the steel strip production on a reversing rolling mill. In this case, it is reasonable to stop the data acquisition in time periods when rolling direction is changed or when finished strip coil is replaced for a new one.
In both cases of data acquisition strategy, it is pretended that data samples are equidistant in continuous time periods. The term "equidistant" need not mean equidistant in time in all cases. There are processes where coefficients of quality production are not linked with time of production. As an example of such a process, we state the steel strip production here again. The quality coefficients are measured or calculated not in relation to time instants of production but in relation to the current length of produced strip. In this case, the acquisition of another data sample is triggered not by a time tick but when a certain strip length section has been rolled, when the measured strip length changes by a certain increase.
It is apparent that both the continuity of acquisition and the triggering of sample acquisition influence the calculation of statistical coefficients substantially and that is why the proper strategy must be selected according to the nature of the investigated process. As an example, we present here plots of two different recordings of the same time period of production and calculation of mean value of signal representing position of rolls in a rolling mill. In the first case, ending phase of a steel strip production is recorded with the sample triggering by each 37.88 millimetres. In the second case, the same strip part production is

Ivan Puchr Probabilistic Advisory Subsystem as a Part of Distributed Control System of Complex Industrial Process
University of West Bohemia 28
recorded but samples are triggered by time ticks of 5 milliseconds. Comparison of both the recordings and an example of calculated statistical coefficient is demonstrated in the following figure.
Figure 6 Comparison of recordings with samples triggered by length increments and by time ticks respectively.
In the upper plot, there is the recording with samples triggered by increase of strip length, each 37.88 mm a sample of roll position signal value is stored. In the middle plot, the same signal is recorded with sample triggering by time ticks, each 5 milliseconds a sample of signal value is stored. In the lower plot, strip speed signal recording can be seen. To demonstrate the influence of sampling strategy on statistical coefficient calculation, a time period was chosen when the strip speed is changing substantially. In time periods with a constant strip speed, the influence of sampling strategy is minimal.
In the first half of the recording, the strip speed is higher than in the second half and thus the recording with sampling triggered by length increase has more samples in the first half. More samples mean higher weight in the mean value calculation and thus the mean value of roll position is lower than in the case of the recording with sampling triggered by time. See the red lines and titles of the upper and middle plots.
In paragraphs above, the reasons were shown why the advisory system distinguishes the nature of signals in the phase of data acquisition.
4.1.4 Improvement of Data Quality
As the final results of the advisory system outputs are dependent on the quality of measured signals—inputs of the system, process of improvement of signal quality became a substantial

Ivan Puchr Probabilistic Advisory Subsystem as a Part of Distributed Control System of Complex Industrial Process
University of West Bohemia 29
part of development of the advisory system. Quality improvement consists mainly in filtering and signal reconstruction and forms a relatively independent course of study. That is why it will not be mentioned in this work in detail. Some examples can be found in [31], [32].
4.2 Data Processing Based on Bayesian Probability
4.2.1 Bayesian Statistics
As the Bayesian statistics is the key theoretical background of this work, in this chapter, we will explain the basic ideas of this theory, foundations of which were laid by Thomas Bayes, British mathematician of the 18th century. More detailed explanation of this problematic can be found in [33] e.g. This chapter is fully inspired by this article, only the example of the probabilistic system is chosen from a more practical field (an example from traffic control) and more stress is put on the explanation of importance of the prior knowledge which substantially differentiates the Bayesian statistics from the classical one.
4.2.1.1 Theoretical Minimum
Text in this chapter is based on [33] . We will demonstrate the principles of utilization of the Bayesian approach on an example of cars going through a simple crossroad. Coming cars
turn left or right randomly. For a possible traffic control system, the information whether the coming car is going to turn left or right will be highly useful.
Remark: This example was chosen because the traffic problem was one of the fields where the theory was verified in the frame of the research and development projects mentioned in chapter 1.
According to [33] we will describe the process as follows:
The turns of particular cars are registered as values of a stochastic variable. The values form a sequence
(1)
Figure 7 Cars on a simple crossroad as the demonstration of a stochastic process

Ivan Puchr Probabilistic Advisory Subsystem as a Part of Distributed Control System of Complex Industrial Process
University of West Bohemia 30
where represents the turn of t-th car. Value of 0 represents the turn to the left and value of 1 the turn to the right. We understand the behaviour of particular cars as independent of each other.
According to [33] we will describe the process by a model that will help us to explore the behaviour of process. Parametric model describing the process in one time instance t (for t-th car) is as follows:
Where (2)
behaviour of t-th car, 0-turns left, 1-turns right
probability that cars turn right
probability density function (pdf) of occurrence of event conditioned by unknown parameter
When a sequence of T cars is passing through the crossroad and some cars turn left and some cars turn right, we are interested in probability that a number of cars turn right and the remaining turn left. An example of the sequence of 10 cars can look like this:
(3)
According to [33] the model (1) can be rewritten for a sequence of T cars (under condition of independence of particular cars):
(4)
If we denote the number of cars in the sequence of T cars that turned right:
(5)
and the number of cars in the sequence of T cars that turned left:
(6)
we can write the model for the sequence of T cars in the following form:
(7)

Ivan Puchr Probabilistic Advisory Subsystem as a Part of Distributed Control System of Complex Industrial Process
University of West Bohemia 31
For the purposes of the advisory system, it is useful to exploit this model for two possible tasks:
to estimate unknown parameter with the use of historical data and
to predict future data with the use of historical data.
Bayes' theorem explains the relation between a conditioned probability of occurrence of an event and the reverse conditioned probability. With the use of it we can write according to [33]:
Where (8)
prior probability density function expressing the expected value of parameter at the start of the estimation, the expectation is based on the so far known data
posterior probability density function expressing the expected value of parameter at the time instant when the T-th car went through the crossroad, it is function of and is taken as constant
is taken as normalization constant because is a function of and is taken as constant, can be omitted now and the posterior probability density function (pdf) can be normalized if necessary (integral of pdf must be equal to one)
After the use of (7) for replacement of and for expression of and after omission of described in detail in [33], we can get the final form of expression for the posterior probability density function expressing the expected value of parameter:
Where (9)
see (5)
see (6)
The constants and express the prior information.
There is the most important point of explanation of Bayes statistics here—prior information. This new notion will be discussed in the next chapter.
4.2.1.2 Prior Information as a Notion of Bayesian Statistics
Classical statistics does not know this notion. In classical statistics, the results are influenced only by the events that happened as late as after the start of observation of the stochastic
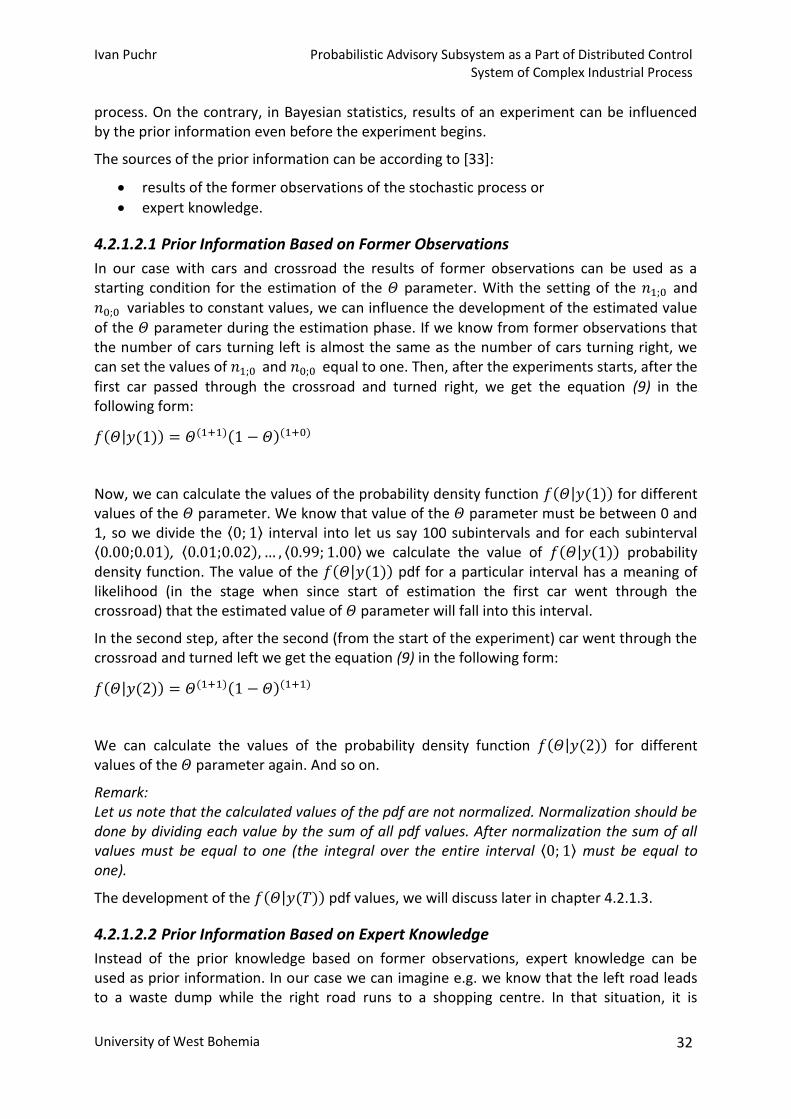
Ivan Puchr Probabilistic Advisory Subsystem as a Part of Distributed Control System of Complex Industrial Process
University of West Bohemia 32
process. On the contrary, in Bayesian statistics, results of an experiment can be influenced by the prior information even before the experiment begins.
The sources of the prior information can be according to [33]:
results of the former observations of the stochastic process or
expert knowledge.
4.2.1.2.1 Prior Information Based on Former Observations
In our case with cars and crossroad the results of former observations can be used as a starting condition for the estimation of the parameter. With the setting of the and variables to constant values, we can influence the development of the estimated value of the parameter during the estimation phase. If we know from former observations that the number of cars turning left is almost the same as the number of cars turning right, we can set the values of and equal to one. Then, after the experiments starts, after the first car passed through the crossroad and turned right, we get the equation (9) in the following form:
Now, we can calculate the values of the probability density function for different values of the parameter. We know that value of the parameter must be between 0 and 1, so we divide the interval into let us say 100 subintervals and for each subinterval , we calculate the value of probability density function. The value of the pdf for a particular interval has a meaning of likelihood (in the stage when since start of estimation the first car went through the crossroad) that the estimated value of parameter will fall into this interval.
In the second step, after the second (from the start of the experiment) car went through the crossroad and turned left we get the equation (9) in the following form:
We can calculate the values of the probability density function for different values of the parameter again. And so on.
Remark: Let us note that the calculated values of the pdf are not normalized. Normalization should be done by dividing each value by the sum of all pdf values. After normalization the sum of all values must be equal to one (the integral over the entire interval must be equal to one).
The development of the pdf values, we will discuss later in chapter 4.2.1.3.
4.2.1.2.2 Prior Information Based on Expert Knowledge
Instead of the prior knowledge based on former observations, expert knowledge can be used as prior information. In our case we can imagine e.g. we know that the left road leads to a waste dump while the right road runs to a shopping centre. In that situation, it is

Ivan Puchr Probabilistic Advisory Subsystem as a Part of Distributed Control System of Complex Industrial Process
University of West Bohemia 33
reasonable to presume that much more cars will turn right than to left. In this case we would set the values of and .as follows, e.g.:
= 1
It is the unique property of the Bayesian statistics in comparison to the classical one the possibility to apply an expert knowledge with the aim to improve the results of an experiment. In the classical statistics, we would have to wait for a much longer series of events before the process is able to show its real nature in acquired data.
4.2.1.2.3 Weight of Prior Information
Not only the relation between the and values is important but Bayesian statistics enables also to assign a specific weight or strength to prior information.
In case of prior information based on former observations, the weight of prior information is apparently given by the number of events observed. On the other hand, in case of expert knowledge, the weight corresponds to that how sure we are. This is a problem because it is a very subjective matter to express the level of certainty exactly.
In practice, the weight of prior information is given by the values of and . We can demonstrate it on the case of cars passing through a crossroad. If we want to express that presence of waste dump and shopping centre in directions to left and to right respectively and if we set
and
= 1
the prior information is not very strong. This prior information can be overcome by a relatively small number of cars passing through the crossroad.
But if we set
and
= 100
the prior information is much stronger and if it were set improperly, hundreds of cars would have to went through the crossroad to overcome the prior information.
Influence of prior information on the results of an experiment we will discuss in the next chapter 4.2.1.3 in detail.
4.2.1.3 Demonstration of Influence of Prior Information
With the help of a simple MATLAB function, we will demonstrate the influence of prior information on the construction of the posterior probability density function expressing the expected value of parameter (9). The MATLAB function is inspired by the script published in [33].

Ivan Puchr Probabilistic Advisory Subsystem as a Part of Distributed Control System of Complex Industrial Process
University of West Bohemia 34
The principle of the demonstration is as follows:
During this demonstration we use not real but simulated data. The simulation of data is based on a selected constant value of parameter. Then we calculate values of the posterior pdf expressing the expected value of parameter (9). As the value of parameter is known in this case, we know what the results of estimation should look like. We know what value should be the result of estimation. Before the start of calculation of pdf values, we repeatedly assign a different prior information to see its influence on the results. The listing of the function code in MATLAB can be found in 0.
We will call this function repeatedly with different parameters and plot results to demonstrate the influence of different prior information in a MATLAB script. Function call with one set of parameters and plotting sequence is in Appendix 3. All experiments will use the same set of parameters except for n0_0 and n1_0 that represent the prior information.
parameter is set to 0.7 which characterizes the process in that way that most cars turn right (7 of 10 in average).
interval of parameter is divided into 100 subintervals by parameter pdfXAxisIntervalWidth.
Number of simulation steps (estimation iterations) is set to 150. See Appendix 3 for code snippet in MATLAB.
4.2.1.3.1 Incorrect Prior information
In this chapter, we study the influence of incorrect prior information on the simulation results. Incorrect prior information means in practice that e.g. the observations of the process before the experiment were interpreted wrongly or that the expert knowledge is bad.
4.2.1.3.1.1 Low Weight
In the first experiment, we use prior information with low weight. We set
(n0_0 identifier in MATLAB) and
= 3 (n1_0 identifier in MATLAB)
Low weight is given by low values of n0_0 and n1_0 parameters in comparison to number of simulation steps. Incorrectness is given by the fact that we expect the estimated value of parameter equal to 0.7 but prior information corresponds to a value from the first half of
interval. Exactly, it is
. Results of experiment are in Figure 8.

Ivan Puchr Probabilistic Advisory Subsystem as a Part of Distributed Control System of Complex Industrial Process
University of West Bohemia 35
Figure 8 Results of experiment with incorrect prior information with low weight
Three curves represent pdf values in different steps of simulation (estimation). The curves correspond to results after 1, after 50 and after 150 steps respectively.
Blue curve represents the stage after one step of simulation. One randomly generated value where cannot overcome incorrect prior information and thus the pdf denotes that parameter value is kept near to 0.3. Uncertainty is relatively high as the curve is wide and low.
Magenta curve represents the situation after fifty steps of simulation. Fifty randomly generated values where apparently easily overcome incorrect prior information with low weight and thus the pdf denotes that parameter value is drawn near to expected 0.7. Uncertainty is lower, the curve is narrower and low.
Red curve represents the end of simulation after 150 steps. 150 randomly generated values where enforced real nature of the stochastic process against incorrect prior information with low weight. The pdf shows that the most probable value of parameter value is near to expected 0.7. Uncertainty is relatively low, the curve is narrow and high.
4.2.1.3.1.2 High Weight
In the second experiment, we use prior information with high weight. We set
(n0_0 identifier in MATLAB) and
= 30 (n1_0 identifier in MATLAB)
High weight is given by relatively high values of n0_0 and n1_0 parameters in comparison to
number of simulation steps. Prior information corresponds to
again. Results
of experiment are in Figure 9.
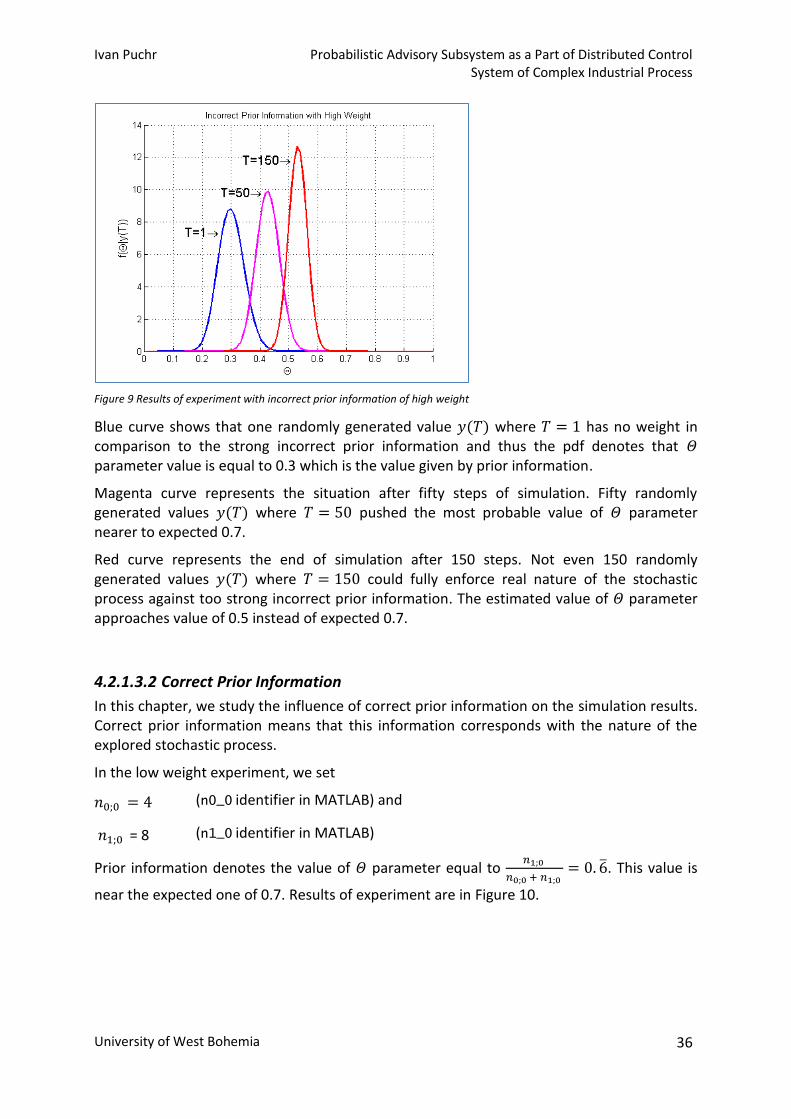
Ivan Puchr Probabilistic Advisory Subsystem as a Part of Distributed Control System of Complex Industrial Process
University of West Bohemia 36
Figure 9 Results of experiment with incorrect prior information of high weight
Blue curve shows that one randomly generated value where has no weight in comparison to the strong incorrect prior information and thus the pdf denotes that parameter value is equal to 0.3 which is the value given by prior information.
Magenta curve represents the situation after fifty steps of simulation. Fifty randomly generated values where pushed the most probable value of parameter nearer to expected 0.7.
Red curve represents the end of simulation after 150 steps. Not even 150 randomly generated values where could fully enforce real nature of the stochastic process against too strong incorrect prior information. The estimated value of parameter approaches value of 0.5 instead of expected 0.7.
4.2.1.3.2 Correct Prior Information
In this chapter, we study the influence of correct prior information on the simulation results. Correct prior information means that this information corresponds with the nature of the explored stochastic process.
In the low weight experiment, we set
(n0_0 identifier in MATLAB) and
= 8 (n1_0 identifier in MATLAB)
Prior information denotes the value of parameter equal to
. This value is
near the expected one of 0.7. Results of experiment are in Figure 10.

Ivan Puchr Probabilistic Advisory Subsystem as a Part of Distributed Control System of Complex Industrial Process
University of West Bohemia 37
Figure 10 Results of experiment with correct prior information with low weight
In the high weight experiment, we set
(n0_0 identifier in MATLAB) and
= 80 (n1_0 identifier in MATLAB)
Prior information denotes the value of parameter equal to
again, near to
expected 0.7. Results of experiment are in Figure 11.
Figure 11 Results of experiment with correct prior information with high weight
In Figure 10, we can see that correct prior information with even a low weight can speed up the movement of the top of pdf curve to the expected value (0.7) during the simulation process.
By comparing the results of both the weak and strong prior information experiments, we can see that the strong prior information has much bigger influence on the simulation process. In the case of the strong prior information, the top of pdf curve is even at the beginning of

Ivan Puchr Probabilistic Advisory Subsystem as a Part of Distributed Control System of Complex Industrial Process
University of West Bohemia 38
simulation very close to the expected value of 0.7 and the curve is very slim which means small uncertainty.
4.2.1.4 Conclusions Concerning Prior Information
From the theoretical explanation and from the demonstration experiments described above, we can form some conclusions concerning Bayesian statistics and prior information that will be useful for further considerations. Let us sum up at least some of them here:
correct prior information can help to get more precise results,
correct prior information can speed up the way to correct results,
the stronger the correct prior information is, the sooner we approach the correct results,
incorrect prior information that is too strong can prevent finding correct results.
In chapters above, main principles of Bayesian statistics were explained and demonstrated on a simple stochastic process with one random variable. The random variable could take on only two values—true / false or turn right / turn left. In practice, the developed advisory system is intended for multivariate problems. Tens of signals acquired from the process are taken as stochastic variables. Moreover, nature of these signals is often not logical but continuous and thus can take on unlimited number of values.
4.2.2 Underlying Theory of Probability Mixtures
Probability mixtures or more precisely mixtures of probability density functions are the key notion of the statistical theory, the developed advisory system is based on. In the next chapter we explain the motivation for using of these mixtures.
4.2.2.1 Information Contained in Historical Data
As mentioned above, information about the investigated process is obtained by acquiring of values of signals connected to the process. Signals are sampled with predefined frequency and stored with a certain history. These data records we will denote as follows (according to [34] or [35] pages 573-4):
sequence of data records
data record of signal / channel values
where is number of signals / channels
value of i-th channel in time instant t
In computer representation, the sequence of data records is a two-dimensional matrix:
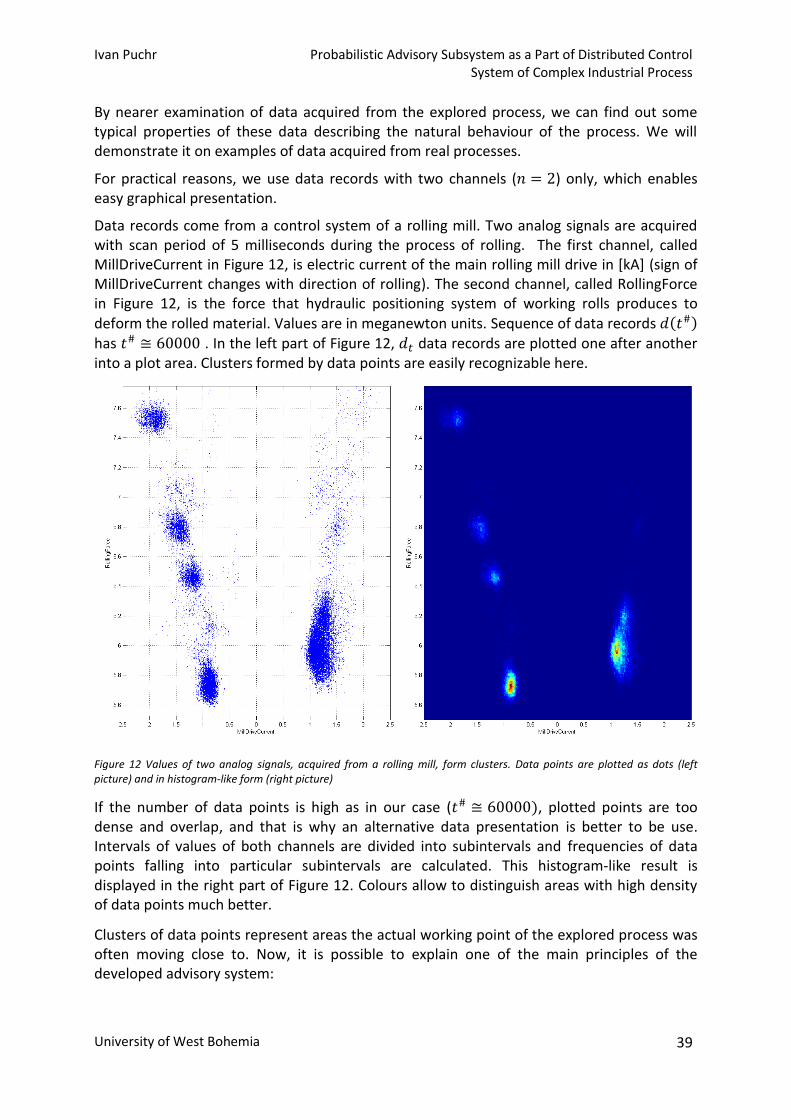
Ivan Puchr Probabilistic Advisory Subsystem as a Part of Distributed Control System of Complex Industrial Process
University of West Bohemia 39
By nearer examination of data acquired from the explored process, we can find out some typical properties of these data describing the natural behaviour of the process. We will demonstrate it on examples of data acquired from real processes.
For practical reasons, we use data records with two channels ( ) only, which enables easy graphical presentation.
Data records come from a control system of a rolling mill. Two analog signals are acquired with scan period of 5 milliseconds during the process of rolling. The first channel, called MillDriveCurrent in Figure 12, is electric current of the main rolling mill drive in [kA] (sign of MillDriveCurrent changes with direction of rolling). The second channel, called RollingForce in Figure 12, is the force that hydraulic positioning system of working rolls produces to deform the rolled material. Values are in meganewton units. Sequence of data records has . In the left part of Figure 12, data records are plotted one after another into a plot area. Clusters formed by data points are easily recognizable here.
Figure 12 Values of two analog signals, acquired from a rolling mill, form clusters. Data points are plotted as dots (left picture) and in histogram-like form (right picture)
If the number of data points is high as in our case ( , plotted points are too dense and overlap, and that is why an alternative data presentation is better to be use. Intervals of values of both channels are divided into subintervals and frequencies of data points falling into particular subintervals are calculated. This histogram-like result is displayed in the right part of Figure 12. Colours allow to distinguish areas with high density of data points much better.
Clusters of data points represent areas the actual working point of the explored process was often moving close to. Now, it is possible to explain one of the main principles of the developed advisory system:

Ivan Puchr Probabilistic Advisory Subsystem as a Part of Distributed Control System of Complex Industrial Process
University of West Bohemia 40
1. We choose a criterion that characterises the requested state of the explored process. As examples we can name:
a. power consumption of a production machine, b. quality of production characterized by statistical coefficients,
c. energy conversion efficiency in a power plant, etc. 2. From all historical data recordings, we select a subset that contains data acquired at
time periods where explored process met the determined criterion. 3. We process the selected data recordings and plot them in a similar way as in Figure
12. 4. Clusters of data points represent areas where working point should reside if we want
the process to meet the selected criterion.
4.2.2.2 Motivation for the Use of Probability Mixtures
In previous chapter in Figure 12 we saw that there is useful information contained in the historical data. This information can be easily visible in two-dimensional space but there are two problems related with the information:
how to describe this information and
how to calculate with this information even in multi-dimensional data space
so that we could exploit it for the purposes of the advisory system.
We must be able to describe each particular cluster of data points, its shape and distribution of density of occurrences of data points within the data cluster. At the same time, we must be able to describe distribution of data clusters within the whole multi-dimensional data space.
During the ProDaCTool project, the theory of mixtures of probability density functions was selected for representation of data and for calculations for the purposes of the advisory system.
Key principles of the use of the theory of mixtures of probability density functions are in short described further in this chapter.
As mentioned above, the sequence of data records of signal / channel values represents history of discrete (in time) values of continuous variables describing the behaviour of the explored process. In the theory of mixtures of probability density functions, the sequence is modelled by the joint probability density function (see [34])
(10)
The equation (10) says that the probability density function of the whole sequence of data records conditioned by vector of parameters is constructed as product of probability density functions of data records in all previous time instances, each conditioned by sequence of data
records until time instance and by vector of parameters. In other words, the pdf of the whole data sequence is the product of pdf's of all previous data sub-sequences.

Ivan Puchr Probabilistic Advisory Subsystem as a Part of Distributed Control System of Complex Industrial Process
University of West Bohemia 41
The vector of parameters characterizes the explored process. As we do not know the process, the vector of parameters must be estimated with the use of measured historical data.
Probability density function of a data record in particular time instances can be described as follows (see [34]).
(11)
The equation (11) is called parameterized mixture model. The right side of the equation is called mixture of parameterized components—mixture of probability density functions. Coefficient identifies particular components. Each component has its vector of parameters. The coefficients has the meaning of weights of particular components. The coefficients must meet the following conditions
(12)
Components on the right side of (11) represent distribution of probability in one data cluster and is the number of data clusters. Each component corresponds to a particular system status. In one system status data points are concentrated in one data cluster. Each component represents a model of the system in a particular status.
Because the data is modelled under uncertainty, we cannot expect output of the model in the form of a vector of values but as distribution of probability of appearance of values in the data space (see [36]).
Explanation concerning mixtures of probability density functions introduced in this chapter is very simplified and should be taken as motivation for further study only. Detailed description of the theory can be found in [2] or [37], e.g.
4.2.2.3 Demonstration of Use of Probability Mixtures in 1D a 2D Data Space
For representation of probability density functions mentioned in previous sections, the Gaussian function is usually used. This well known function has several advantageous properties that enable its use in mixtures for approximation of general probability density functions representing distribution of data points in the whole data space. Advantages and some key properties of Gaussian functions are demonstrated in this chapter.
Univariate Gaussian function
(13)
is parameterized by two parameters only. Parameter has the meaning of average value and parameter is called standard deviation or variance in its form.
Gaussian function also meets the following condition for probability density functions
Ivan Puchr Probabilistic Advisory Subsystem as a Part of Distributed Control System of Complex Industrial Process
University of West Bohemia 42
(14)
As the Gaussian function is parameterized by its mean and variance, the function is often denoted by . Its special case is called standard normal distribution.
For the purposes of the probabilistic advisory system, we need the probability density function to have different shapes and positions in data space. This is enabled by the and parameters. Following figure demonstrates shaping and positioning of univariate Gaussian functions.
Figure 13 Demonstration of shaping of Gaussian functions by μ and σ parameters. Blue curve has μ=-2 and σ=1, red curve has μ=0 and σ=1, magenta curve has μ=2 and σ=0.5.
For all values of and parameters, the function meets the (14) condition of probability density function.
In the multivariate version of Gaussian function we express that vector of random variables has normal distribution with mean vector and covariance matrix by the following expression ([38] page 121):
(15)
vector of random variables
vector of means
covariance matrix, positive definite, symmetric matrix
Covariance matrix expresses relations between particular random variables . For elements of covariance matrix, we can write according to [38] page 119:
denotes mean (16)
Multivariate version of Gaussian function has the following form ([38] page 125):

Ivan Puchr Probabilistic Advisory Subsystem as a Part of Distributed Control System of Complex Industrial Process
University of West Bohemia 43
for (17)
To express the Gaussian function for two random variables in another form, we introduce the correlation coefficient ([38] page 126):
correlation coefficient (18)
With the correlation coefficient we can write for two random variables
(19)
where
With this form, we can simply demonstrate shaping and positioning of bivariate Gaussian functions.
First, we demonstrate shaping and positioning of bivariate Gaussian function by parameters while . See the following pictures.
Figure 14 Bivariate Gaussian function with positioned at [0,0] data point.

Ivan Puchr Probabilistic Advisory Subsystem as a Part of Distributed Control System of Complex Industrial Process
University of West Bohemia 44
Figure 15 Bivariate Gaussian function with positioned by values of at [5,5] data point.
Figure 16 Bivariate Gaussian function with positioned at [0,0] data point.
All above displayed functions have and flattening is done by ratio in or axis directions only. Nonzero correlation coefficient enables to rotate the flattened function as demonstrated in the following picture.

Ivan Puchr Probabilistic Advisory Subsystem as a Part of Distributed Control System of Complex Industrial Process
University of West Bohemia 45
Figure 17 Demonstration of how to rotate a flattened bivariate Gaussian function by nonzero correlation coefficient.
All above stated pictures illustratively show the capability of Gaussian functions to represent clusters of data points (see Figure 12) in one- and two-dimensional data spaces. Multivariate Gaussian functions can apparently be used for representation of data clusters in -dimensional data space where .
Use of a mixture of two bivariate Gaussian functions is demonstrated in the following picture.
Figure 18 Simple mixture of two bivariate Gaussian functions.
According to (11) and (12), probability density functions are combined with their respective weights in the mixture. In Figure 18, weights and are used.
Figures in this chapter were generated by MATLAB code. Example of the code generating Figure 18 can be seen in Appendix 4.
4.2.3 MixTools Function Library as the Key Software Tool for Probability Mixture Handling
There was shown in previous chapters that data containing information about behaviour of a process or system can be represented by weighted combination of probability density

Ivan Puchr Probabilistic Advisory Subsystem as a Part of Distributed Control System of Complex Industrial Process
University of West Bohemia 46
functions where particular probability density functions are represented by parameterized Gaussian functions.
The main idea is simple but there arise several problems in practice, e.g. how to find the representation of real data in the form of a probability mixture, how to generate data simulated by a mixture, how to calculate with mixtures, etc. These problems has been solved during several past years by the colleagues from the Department of Adaptive Systems, Institute of Information Theory and Automation of the ASCR. The underlying theory and algorithms were worked out and these results were implemented into the function library called MixTools.
MixTools function library is a wide set of functions coded originally as MATLAB scripts. The development of this library started more than ten years ago and was supported by several research and development projects. During the whole development period, the library was continuously extended by newly achieved knowledge in the form of new or extended library functions. Now, the library has the form of a standard MATLAB toolbox with interactive help and wide set of examples. Nevertheless it is not distributed as a real MATLAB toolbox.
Author of this document participated in the development of the MixTools function library in the stage when it was formed as MATLAB toolbox.
MixTools function library covers a wide range of functions for handling with probability mixtures. MixTools library is the key software tool used during the development of the probabilistic advisory system. A short survey of this library can be found in Appendix 5.
4.2.4 Offline Processing of Historical Data and Creation of Historical Mixture
In this chapter, the initial processing of acquired historical data will be described.
As mentioned in previous chapters (the acquisition of signals was described earlier in chapter 4.1.3 in detail), information about the behaviour of observed process is acquired by acquisition of series of values of signals connected to the process. Potential problems consist in that fact that resulting sequences of data records
are stored generally in files of different formats,
they are continuous in time or separated by time periods where no data are acquired,
they are located in one database table or in separate tables in separate files,
samples are triggered by time ticks or by some other events.
There are four main tasks in this phase of data processing:
unification of historical data,
selection of criterion that characterizes the desirable state of the process,
separation of historical data recordings meeting the criterion,
finding the representation of separated historical data in the form of a mixture of probability density functions, called historical mixture.
4.2.4.1 Unification of Historical Data
As mentioned above, data recordings may be miscellaneous especially if data were not acquired for the purposes of the advisory system. In some cases, it is not possible to install

Ivan Puchr Probabilistic Advisory Subsystem as a Part of Distributed Control System of Complex Industrial Process
University of West Bohemia 47
new purpose-built data acquisition system and data recordings provided by an existing system must be used instead.
The main task of this phase of data processing is to unify all possible sources of data and prepare a unified form of data that will server as input for the next phase of data processing. A MATLAB data structure stored in .MAT file was selected during the development within the framework of the ProDaCTool project and it is still used until now. From the wide range of possible sources of historical data, the Microsoft Access database format in files with .MDB extension is, as the most frequently used source, fully covered by software tools ensuring the conversion to the selected unified form.
Format of MATLAB data structure stored in .MAT file is as follows:
Sequence of data records of signal
/ channel values is stored in a two-dimensional matrix. Each column corresponds to a channel. Number of rows corresponds to the number of samples.
Names of columns of the matrix with data samples are stored in a matrix where each row corresponds to a name of a column and the maximum length of column name is 20 characters.
Figure 19 Example of the MATLAB data structure used to store
This approach has one disadvantage. In case of a big number of samples, the DATA matrix exceeds the maximum variable size allowed in MATLAB if the .MAT file is loaded into MATLAB workspace. To solve this problem, all MixTools estimation functions accept the ndat argument (number of data samples) in the following form as well. (Estimation
functions have the DATA matrix as input and produce the representation of DATA in the form of a mixture which is very compressed information and thus requires only a small memory space.)
Ndat={'RecordingsFileName',mdat}
RecordingsFileName is the name of file containing the sequence of data samples. Samples are written as a table in binary double format and mdat is the byte-size of a sample. This enables the so-called buffered estimation. This feature is available in functions written in C language (in MEX modules) only. MEX modules enable allocation of a huge DATA matrix and the matrix is then loaded from file.
Buffered estimation is very useful in the phase of transformation of historical data to the mixture representation because the number of records must be high, so that the data could contain as much information as possible and thus cover all possible states of the investigated process.

Ivan Puchr Probabilistic Advisory Subsystem as a Part of Distributed Control System of Complex Industrial Process
University of West Bohemia 48
4.2.4.2 Selection of Criterion of Desired State of Process
In this chapter, we will explain how to select the criterion that will enable to separate sequences of data samples that represent required status of the process.
The aim of the advisory system is to help the operator to produce more efficiently, with higher quality, with less power consumption etc. The criteria should meet this requests.
The simplest strategy is to choose a signal / channel and to set a range of desired values of this signal. The condition for selection of recordings that meet the criterion is as follows: Select all samples where criterion signal value is between lower and upper range boundary.
We will explain disadvantage of this simple criterion on an examples. In the following figure, the criterion is applied to an sample signal. Lower and upper range boundaries are set to -10 and +10.
Figure 20 Original sample signal recording (upper plot) and selected samples meeting the criterion that signal value must be between -10 and +10 boundaries (lower plot).
In the lower plot of the Figure 20, we can see that the recording can be significantly fragmented by application of the criterion. By the fragmentation, the time dependence of subsequent samples is lost and samples are not equidistant any more. The narrower the criterion range is the worse the fragmentation is. On the contrary, a too wide range makes the criterion weaker.
The problem how to separate suitable recordings from all acquired data showed to be quite complex during the work on the ProDaCTool project and a methodology was not fully developed yet, but the following strategy showed to be much better than the one mentioned above. One feature of this strategy is that acquired data are partitioned into such sequences of samples that they represent the whole compact production periods which can be qualified good or bad as a whole. This approach takes into account that one production period consists of a set of operation modes that depend one on the others.
Another feature of this strategy is the use of statistical coefficients for the qualification of the production period. This approach enables to qualify the whole production period, in

Ivan Puchr Probabilistic Advisory Subsystem as a Part of Distributed Control System of Complex Industrial Process
University of West Bohemia 49
spite of the fact that particular operation modes that create the production period can show highly different relation to qualification criterion. Data recordings from the time when system operates in modes with poor qualification cannot be omitted because these modes are integral parts of the whole production period. (Car cannot reach a constant travel speed without an acceleration phase.)
We can name the following examples as production periods consisting of several production modes:
1. In a power plant, an example of one production period is a start-up after a planned shutdown. Or the switching between power production and power consumption in a pumped storage plant.
2. In medicine, one production period (with awareness that "production" is not very suitable adjective in this branch) can be one sequence of chemotherapy.
3. In steel industry, one pass of rolling of steel strip can be named as example of production sequence. We will describe this example in more details in the next chapter.
If the data acquisition system produces long-time recordings, whole shifts e.g., it may be hard to find the sought production period sample sequences in the whole data repository with a huge amount of data. That is why, if the data acquisition system is developed for the purpose of advisory system, it is convenient to separate particular production periods online during the phase of data acquisition.
4.2.4.3 Separation of Recordings Meeting the Given Criterion
As mentioned above, no consistent methodology for separation of recordings meeting the criterion was developed yet. The criterion has to be formulated from case to case especially if investigated processes differ so significantly as in the examples in previous chapter. That is why we will demonstrate this phase of data processing on the third example from the previous chapter.
Production of metal strip on a reversing rolling mill consists usually of several production periods. In this case these periods are called passes. In each pass, the strip is unwound on the input side of the rolling mill, passes through the rolling gap, where the thickness is reduced, and is wound up on the output side. If the whole strip passes through the rolling gap in one direction, direction is reversed. Number of passes is between 1 and 15 usually. Each pass is characterized by special operating conditions, by special settings of process parameters. Especially the first and the last passes have a specific position among other ones and influence the final production quality substantially.
One pass is characterized by a set of technological parameter settings. A common minimal subset of these parameters is listed in the following table.

Ivan Puchr Probabilistic Advisory Subsystem as a Part of Distributed Control System of Complex Industrial Process
University of West Bohemia 50
Parameter name Description
ThicknessReduction Relation between input and output strip thicknesses.
InputTension Tension exerted in strip by de-coiler on the input side.
OutputTension Tension exerted in strip by coiler on the output side.
MillSpeed Peripheral speed of working rolls.
RollTilting Tilting of working rolls that influences the cross profile of the strip.
RollBending Bending of working rolls that influences the cross profile of the strip.
RollCooling Cooling of rolls that influences the cross profile and surface quality of the strip.
Table 1 A minimal subset of technological parameters influencing steel strip production.
Setting of these parameters during one production period (pass), influences the resulting quality of produces steel strip. Resulting quality is characterized by the quality attributes listed in the following table.
Quality attribute Description
Thickness The thickness of strip has to be of the required thickness with an allowed difference given by positive and negative tolerances.
Cross profile During the rolling the cross profile of strip becomes a required specific shape. The required shape is dependent mainly on the purpose the strip is used for and on material type. It is reviewed to what extend the cross profile of produced strip meets the parameters of requested profile.
Mechanical properties Material changes during the forming its mechanical properties. The way of forming must follow predefined sequence of operations to reach required target mechanical properties.
Table 2 Attributes characterizing outgoing quality of produced strip.
It is a complex problem to find a criterion that would cover all quality attributes. That is why, for the purpose of explanation of principles, we will simplify the criterion as much as possible.
We measure the final quality of produced strip by the quality of strip thickness only and in the last pass only. For the explanation, strip thickness is taken as discrete random variable and we use symbols listed in the following table.

Ivan Puchr Probabilistic Advisory Subsystem as a Part of Distributed Control System of Complex Industrial Process
University of West Bohemia 51
Symbol Meaning
, Discrete values of random variable strip thickness in one pass.
Mean value of . in one pass.
Nominal output thickness of strip. Required thickness in a particular pass.
,
Mean value of thickness deviation. Equals to .
Positive tolerance.
Negative tolerance
Table 3 Symbols used for description of output thickness quality.
The ideal thickness would meet the criterion for all but it is impossible in practice. That is why positive and negative tolerances are introduced. Then the weaker condition for acceptable values is .
With this criterion, we are at the point described in the chapter 4.2.4.2, where it was shown that selection according to this criterion is not a good choice. We use statistical coefficients instead, that enable to evaluate the production period as a whole.
Known statistical coefficients and showed to be the right choice. is called
capability index and is called centring capability index.
where is standard deviation
and is mean value of ,
Meaning of these two coefficients is to be seen in histogram representation of

Ivan Puchr Probabilistic Advisory Subsystem as a Part of Distributed Control System of Complex Industrial Process
University of West Bohemia 52
Figure 21 Relation between histogram and , coefficients.
In Figure 21, the bars in most left and right positions of x-axis (red coloured if present) represent all values that fall out of interval.
Capability index expresses how narrow the histogram is and centring capability index
tells how much the bars of histogram are centred on x-axis. Values of lower than
signalize that histogram is too wide and that exist values out of interval. Values tells that histogram is narrow
enough that all values would fall into interval if
histogram were centred.
Values of signalize that histogram is narrow and centred enough that all
values fall into interval.
In Figure 21, the left histogram is narrow enough ( ) but indicates that
histogram is not centred and that is why we must expect some beyond interval boundaries. In the right histogram in Figure 21, there can
be seen that is sufficient condition for all values being in allowed interval.
Based on this theoretical assumptions, is chosen as criterion for evaluation of data
recordings representing particular production periods, passes. Based on this value, we
can select recordings of production periods representing results of production, that are of desired quality.
As mentioned in previous chapter, if the data acquisition system produces long-time recordings not corresponding to desired production periods, it is necessary to divide these recordings into parts that represent production periods first. In other words it is necessary to reconstruct what exactly was produced at each recording time. Then, additional attributes must be assigned to the recordings. Attributes of that king that enable division of recordings to corresponding production periods. This is generally a complex problem, that is why we pretend that data acquisition system is constructed for the purpose of the advisory system and acquires data in a form suitable for application of criterion.
For this explanation we pretend the data acquisition system described in Chapter 4.1.3. Resulting structure of acquired data consists of a database tables comprising parameters of produced strips and parameters of particular production periods (passes). Detailed recordings of particular passes are stored in separate files containing database tables with

Ivan Puchr Probabilistic Advisory Subsystem as a Part of Distributed Control System of Complex Industrial Process
University of West Bohemia 53
values of all acquired data channels. Structure of acquired data is described in Figure 22 in detail.
Figure 22 Structure of acquired data
In Figure 22, the CoilsTab database table contains parameters of particular coils of strip. A coil is characterised by a set of parameters that identify it and denote its material properties and dimensions. These parameters will be useful for the selection of similar coils later in this chapter. PassTab database table stores parameters that characterize properties of strip at the time of the particular pass, especially statistical coefficients that enable to consider the quality being reached during the production period. Samples of signal values are stored in a database table during one particular pass. The database table is stored in a file, name of the file is constructed from several parameters stored in CoilTab and PassTab respectively.
This data structure enables easy separation of production periods of required quality level. With a simple SQL query, the required data can be selected:
PARAMETERS CpkMinimumPar Double;
SELECT * FROM PassTab
INNER JOIN CoilTab ON CoilTab.Id=PassTab.CoilId
WHERE PassTab.Cpk >= CpkMinimumPar
CoilTab
Id CoilNumber Material StripWidth [mm] TargetThickness [mm] ... 101 C122A1 11300 1020 0.200 ... 102 C123A1 11300 1020 0.200 ... 103 C124A1 11300 1020 0.800 ... ... ... ... ... ... ...
PassTab
Id CoilId PassNumber PassStartTime NominalThickness [mm] Cpk ... 151 101 1 20013/04/012 6:23:12 0.300 1.22 ... 152 101 2 20013/04/012 6:58:42 0.200 1.58 ... 153 102 1 20013/04/012 7:03:12 0.800 0.79 ... ... ... ... ... ... ...
File system
2001304012062312_ C122A1_1.mdb 2001304012065842_ C122A1_2.mdb 2001304012070312_ C123A1_1.mdb ...
ProcessDataTab
RecNum DateTime StripLength [m] StripThickness[mm] ... 1 20013/04/012 6:23:12 0.00 0.224 ... 2 20013/04/012 6:23:12 0.10 0.220 ... 3 20013/04/012 6:23:13 0.20 0.215 ... ... ... ... ... ...

Ivan Puchr Probabilistic Advisory Subsystem as a Part of Distributed Control System of Complex Industrial Process
University of West Bohemia 54
With setting the CpkMinimumPar, records that correspond to the production of required quality can be selected. For each selected record, the corresponding database file with ProcessDataTab, can be found. This way, a set of database files containing required data can be prepared for further processing.
These principles were verified during the ProDaCTool project and following research.
4.2.4.4 Representation of Data by Historical Mixture
In this phase, the advisory system has enough information describing behaviour of the investigated process in time periods when the system meets the selected criterion. The behaviour is described by a number of records with signal values. The number of records may often be, and is recommended to be, enormous. It is hard to work with this huge amount of data. The information contained in data is to be represented in a concentrated form. And now, the representation of statistical data by a mixture of probability density functions described in previous chapters comes into consideration.
Data are transformed into the mixture representation. For this transformation, functions from MixTools function library are used. MixTools and underlying theory are described in chapters above. In Appendix 6, there is a MATLAB code example that demonstrates (in a simplified form) the process of transformation of information contained in acquired data to the compressed form of mixture of probability density functions.
The resulting mixture is plotted by the last lines of code into Figure 23. As the signal channel samples contained in DATA matrix are same as those plotted in Figure 12, the figures can be visually compared. Signal channels come from data acquisition system of a rolling mill again.

Ivan Puchr Probabilistic Advisory Subsystem as a Part of Distributed Control System of Complex Industrial Process
University of West Bohemia 55
Figure 23 Historical mixture representing data from Figure 12.
The mixture is denoted as historical mixture because it represents the behaviour of system in history. In our case, data points are covered by 9 components of the mixture. Colours show that two of them situated in lower part of the figure has a dominant position. These two components represent regions where most of data points fall into.
Visual representation of the historical mixture enables us to read some useful information from this form of acquired data. Mentioned dominant components are situated in positive and negative parts of MillDriveCurrent-axis respectively. Positive and negative current corresponds to different rolling directions in this case. Rolling in one direction (let use say to left) is characterized by MillDriveCurrent having value around -0.8 and RollingForce around 5.7 while in the opposite rolling direction, MillDriveCurrent is around 1.2 and RollingForce around 6.0. (We omit physical units because we explain the principle only and. Values of MillDriveCurrent change sign with direction of rolling.)
If we disregard influence of other parameters or signal channels and if we simplify the problem very much, we can demonstrate the main idea of the advisory system by deducing the following conclusion:
Ivan Puchr Probabilistic Advisory Subsystem as a Part of Distributed Control System of Complex Industrial Process
University of West Bohemia 56
"If the operator is keeping MillDriveCurrent close to -0.8 and RollingForce close to 5.7 while rolling to left, and MillDriveCurrent close to 1.2 and RollingForce close to 6.0 while rolling to right, the quality of production will be good."
There may arise a question why to use the mixture representation of data if the same conclusion may be deduced from other representations of data, e.g. in Figure 12. The answer is that the main reasons are as follows:
Mixture representation comprises huge number of data records to a relatively small set of parameters that is much easier to operate with.
There exist mathematical functions for handling with mixtures.
Mixtures are suitable for -dimensional data space and not limited to or .
The existence of historical mixture as the result of initial data processing functions is the base for proper functionality of the whole advisory system.
4.2.5 Actual Production Mode and Creation of Target Mixture
In previous chapter, the offline phase of data processing was described while online phase of data processing begins in this chapter. Now, advisory system disposes of information describing behaviour of the investigated system in history—historical mixture. The history comprises lots of operation modes of the system. If the operator wants to exploit the advisory system, he has to express his intention to use the system in a particular mode. In case of power station, operator wants to operate the power station at full power, e.g. In case of traffic control, the operator wants to operate the traffic lights under condition that one of four roads of a crossroad is under reconstruction and closed, e.g. Operator of a rolling mill has to roll, let us say, steel strip from input thickness of 1.00 mm to output thickness of 0.75 mm, width of 620 mm.
Generally said, operator with his requests narrows a wide range of operation modes of the system. In the concept of the advisory system, the intention of operator is expected in the form of a mixture called target mixture. Same set of channels is used for the construction of target mixture as for the calculation of historical mixture. During the construction of target mixture, all possible ranges of values in all channels are narrowed. There are two subsets of channels. One subset contains channels that operator knows how to set. With the other subset of channels, operator does not know how to, or does not want to set the values of channels. If operator knows how to set a channel, he has two possibilities:
Operator sets the channel to a constant value. This way, the -dimensional data space ( is number of channels) is reduced by one dimension.
Operator expresses the requested value of the channel by a univariate Gaussian function (13). With , he expresses the average value and with he says how much the value may fluctuate around .
Channels set to a constant are usually type of material or strip width e.g. (in case of rolling mill production).
For channels where operator does not set a channel value, two methods were tested during the ProDaCTool project and following research. Both methods are based on calculation of marginal pdf in each concerned channel of historical mixture. Marginal pdf
for two
channels (random variables) , is defined as follows:

Ivan Puchr Probabilistic Advisory Subsystem as a Part of Distributed Control System of Complex Industrial Process
University of West Bohemia 57
where is joint pdf of two random variables. In other words, the marginalization
applied on historical mixture means that for all values of one channel, pdf values are summed up for all possible values of the other channels.
Demonstration of marginal pdf is shown in the following figure.
Figure 24 Demonstration of marginal pdf
In the top left subplot, there is a sample joint pdf of two channels (random variables) represented in the form of mixture pdf consisting of three components. In the bottom subplot, there is marginal pdf of channel 1. It can be imagined as bottom up view of top left subplot. Right left view of top left subplot corresponds to marginal pdf of channel 2 that is plotted in top right subplot. Marginal pdf is not a simple projection of two-dimensional joint pdf in one axis direction. The influence of integral is to be seen well in the top right subplot where one component behind another in top left subplot result in a higher "hill" in the marginal pdf.
Simplified MATLAB code demonstrating creation of marginal pdfs with the help of MixTools functions is shown in Appendix 7.
With the knowledge of marginal pdf, we can come back to methods mentioned above, that help to determine possible values of channels where operator does not set a range of channel values himself. In the first step, marginal pdf is calculated for each of those channels. Then the methods differ:
In the first method, target pdf is chosen as the component "nearest" to the historical pdf with maximum density.

Ivan Puchr Probabilistic Advisory Subsystem as a Part of Distributed Control System of Complex Industrial Process
University of West Bohemia 58
In the second method, target pdf is chosen as the component replacing the whole cluster of pdfs with high density.
Both methods are demonstrated in the following figure.
Figure 25 Top right subplot demonstrates method 1 for replacing of marginal pdf of channel 2 with one component in the position with the highest probability density. Bottom left subplot demonstrates method 2 for replacing of a cluster of marginal pdf components of channel 1 with one component.
In the process of creation of target mixture, each channel is represented by a constant or by a univariate Gaussian function. As a result of this, target mixture is a one-component mixture. This one-component condition is important for further data processing, as it is explained in the next chapter.
4.2.6 Final Data Processing and Generation of Advices
At this stage of data processing, we have historical and target mixtures available. Historical mixture contains the information where the working point should reside in order to meet selected criterion (requested production quality, e.g.). Target mixture is a one-component mixture and represents the ideal area in data space, where the working point should reside, as the result of actual operator's requests. As the target mixture does not respect the historical data, the target mixture component does usually overlap none of historical mixture components. In other words, target mixture can tend to position the working point to an area outside areas recommended by historical mixture.
This problem solves the advisory mixture. During the generation of advisory mixture, the historical and target mixtures and actual working point are confronted. The advisory mixture is a one-component mixture again. The component is chosen as a component of historical mixture, that is the "nearest" one to the target mixture component while respecting the actual working point. The notion "nearest" is meant in the Kullback-Leibler divergence sense (see [2] page 28).

Ivan Puchr Probabilistic Advisory Subsystem as a Part of Distributed Control System of Complex Industrial Process
University of West Bohemia 59
The resulting one-component advisory mixture represents the area in data space, where the working point should reside according to operator's request given by target mixture while respecting the position of actual working point. Next step is how to instruct the operator to move the actual working point to the area in data space that is recommended by the advisory mixture. The intended way is to generate advices (recommendations) in the form of sentences like "Increase parameter1 to 5.6", e.g. This is not a simple task. We have to take into account (among others) that the "shortest" (in Kullback-Leibler divergence sense again) way is not always the best one. In other words, if operator wants to move the actual working point to the recommended area, it need not be necessarily the same, whether he changes parameter1 before parameter2 or on the contrary. There were some approaches tested but this field is not fully investigated yet.

Ivan Puchr Probabilistic Advisory Subsystem as a Part of Distributed Control System of Complex Industrial Process
University of West Bohemia 60
5 Prospects of Future Work It is apparent from previous chapters, that in the frame of research projects, there was created a big potential of theoretical background and software tools for utilization of probabilistic approaches in industrial applications. The probabilistic advisory system for operators is based on these result. The system was designed and a first prototype was prepared. It was tested in basic principles with the use of pilot application for a small rolling mill. The rolling mill was equipped with a suitable control system, so it was possible to exploit its input signals from sensors for the purposes of the advisory system. During the prototype testing, data acquisition worked well, so sufficient amount of data of requested quality was available. In the data processing stage based on Bayesian probability, there emerged some performance issues. In spite of that fact it was proved that this approach is well applicable. Tests showed that the generation of advices for the operator should be improved, together with the presentation of results on the operator's screen.
In my successive work I would like to apply myself to the following topics:
Evaluation of data processing principles in distributed environment. In the prototype of the advisory system, the data acquisition and all parts of data processing (calculations of historical, advisory and target mixtures) were executed in one computer only. As performance problems arose even in the pilot application with a limited number of input signals, it is necessary to prepare a solution that would enable to distribute the advisory system into a network of cooperating nodes.
Improvement of generation of advices and extended presentation of results on operator's screen. There was shown during the tests that the generation of advices and proper visualization of information for the operator is the key part of the whole advisory system. If this is not presented in a comprehensible form, the operator is confused and loses his confidence in the whole system. So the result of future work should be a reliable module for generation of advices and visualization module enabling to present both simple command-type information and comprehensive survey of actual working point surrounding.
Integration of information on input signal quality with the aim to improve advisory system outputs. I participate in the currently running ProDisMon project (see chapter 1) and a part of this project is the research in the field of quality of input signals of a
systemsignal health. Besides other methods, a method that uses Gaussian mixtures is being developed for signal health evaluation. Temporary results are promising and that is why I would like to integrate the signal health into the advisory system as a new complementary information. The reason is that the tests of advisory system showed that outputs of system are relatively highly dependent on the quality of input signals.
Extension of verified principles of the advisory system for diagnostics purposes. As mentioned in the previous paragraph, quality of input signals is very important for proper functionality of the advisory system. In some cases, the information contained in one signal itself is not sufficient for evaluation of the health of the signal. In this situation, exploitation of information contained in additional signals can help. I would like to take advantage of verified principles of the advisory system and examine the possibility to use them for diagnostics of signals used as both the advisory system and control system inputs.

Ivan Puchr Probabilistic Advisory Subsystem as a Part of Distributed Control System of Complex Industrial Process
University of West Bohemia 61
6 Conclusion In this work, we described the progress of development of probabilistic advisory system for support of operators of complex industrial processes. The advisory system and related theoretical background together with software technologies were developed in the frame of several research projects. Topics of these projects were focused on the use of results for industrial applications.
The introductory part contains the explanation of reasons for development of the advisory system and the survey of related published works with the attempt for a generalization of principles of systems for support of operators.
In next chapters, we described all important parts of the advisory system in a survey, but the main stress was laid on underlying probabilistic theory and used software technology. The probabilistic theory is explained in basic principles only with respect to its complexity. References to fundamental works are made for further study. The basic principles are discussed in detail for better understanding of data mining techniques and of the whole advisory system. Principles are demonstrated with the use of a few examples.
Several chapters are devoted to description of data acquisition. Cooperation between the developed advisory system and an existing control system in the phase of data acquisition are described. Software tools for data exchange between advisory system and cooperating control system are mentioned too.
Data processing is the key part of the whole advisory system. Its offline stage is mentioned first. It is shown that this stage mines information from historical data, with the result in the form of historical mixture of probability density functions. In the historical mixture, areas with high probability density represent process parameter adjustments that are desired for high-quality production, for example.
The online stage of data processing is explained in subsequent chapters then. It is shown that actual working point of the process and operator's aim are transformed into a probability mixture too, into a mixture called target mixture. The target mixture represents an ideal requested by the operator. But the ideal have to be confronted with real possibilities of the process given by the historical mixture. How the historical and target mixtures are used to generate advisory information is described in further chapters.
A prototype of the advisory system was designed and tested in a pilot application on a rolling mill. This brought valuable experience that showed that the final processing of data and generation of advisory information, together with its presentation to the operator deserve further improvements.
Generally, during the work, some partial problems appeared that would deserve deeper investigation. On the other hand, new perspectives emerged. Finally, main directions of future work, possible improvements and extensions are stated.

Ivan Puchr Probabilistic Advisory Subsystem as a Part of Distributed Control System of Complex Industrial Process
University of West Bohemia 62
7 References
[1] I. Nagy, P. Nedoma, M. Kárný, L. Pavelková and P. Ettler, “Modelování chování složitých systémů pro podporu operátorů,” Automa, pp. 54-57, 11 2002.
[2] M. Kárný, J. Böhm, T. V. Guy, L. Jirsa, I. Nagy, P. Nedoma and L. Tesař, Optimized Bayesian Dynamic Advising, Berlin: Springer, 2006.
[3] P. Ettler and P. Nedoma, “Data-based adviser to operators of complex processes,” in Proceedings of the 2002 International Conference on Control Applications, 2002, Glasgow, UK, 2002.
[4] J. P. Keller and M. Agarwal, “Decision Support System for Value Engineering in Flour Mills,” in Proceedings of ICINCO 2013, Reykjavvík, Iceland, 2013.
[5] S. Calderwood, W. Liu, J. Hong and M. Loughlin, “An Architecture of a Multi-Agent System for SCADA, Dealing With Uncertainty, Plans and Actions,” in Proceedings of ICINCO 2013, Reykjavvík, Iceland, 2013.
[6] Y. C. Shin and A. J. Waters, “Framework of a machining advisory system with application to face milling processes,” in Journal of Intelligent Manufacturing, London, 1998.
[7] B. Dow and J. Belaskie, “Improving drilling results with a real-time performance advisory system,” World Oil, vol. 6, no. 1., June 2012.
[8] F. D. Felice, “Research and applications of AHP/ANP and MCDA for decision making in manufacturing,” International Journal of Production Research, pp. 4735-4737, 21 August 2012.
[9] M. Dytczak, G. Ginda and M. Pergol, “Possibility and Benefits of MCDA Application for Decision Making Problems Support in Printing Activities,” International Circular of Graphic Education and Research, pp. 32-49, 2009.
[10] Y. Yanagihara, T. Kakizaki, K. Arakawa and A. Umeno, “Multi-modal Teaching-Advisory System using Complementary Operator and Sensor Information,” in RO-MAN'95 TOKYO, Proceedings., 4th IEEE International Workshop on Robot and Human Communication, Tokyo, 1995.
[11] M. Anutosh, B. Saurabh, G. Chiranjeeb and P. Sanjoy, “An Integrated Transport Advisory System for Commuters, Operators and City Control Centres,” in Vehicular Traffic Management for Smart Cities, Dublin, 2012.
[12] S. J. Lee, K. Mo and P. H. Seong, “Development of an Integrated Decision Support System to Aid the Cognitive Activities of Operators in Main Control Rooms of Nuclear Power Plants,” in Proceedings of the 2007 IEEE Symposium on Computational Intelligence in Multicriteria Decision Making (MCDM 2007), Honolulu, HI, 2007.
[13] T. Kraft, K. Okagaki, R. Ishii, P. Surko, A. Brandon, A. DeWeese, S. Peterson and R. Bjordal, “A hybrid neural network and expert system for monitoring fossil fuel power plants,” in Proceedings of the First International Forum on Applications of Proceedings of

Ivan Puchr Probabilistic Advisory Subsystem as a Part of Distributed Control System of Complex Industrial Process
University of West Bohemia 63
the First International Forum on Applications of Neural Networks to Power SystemsNeural Networks to Power Systems, Seattle, WA, 1991.
[14] C. Eaves-Walton, K. Hunt and S. Redfod, “Intelligent online process monitoring and fault isolation,” in IEE Colloquium on Condition Monitoring and Failure Diagnosis - Part 1, London, 1988.
[15] J. Bushman, C. Mitchell, P. Jones and K. Rubin, “ALLY: an operator's associate model for cooperative supervisory control situations,” in Proceedings of IEEE International Conference on Systems, Man and Cybernetics, Cambridge, MA, 1989.
[16] C. D. Rogers and J. J. Hudak, “The ANN (Assistant Naval Navigator) System,” in IEEE Conference on Technologies for Homeland Security (HST), 2012 , Waltham, MA, 2012.
[17] Y.-K. Yang, “EPAS: An Emitter Piloting Advisory Expert System for IC Emitter Deposition,” in IEEE Transactions on Semiconductor Manufacturing, 1990.
[18] J. Liu, K. W. Lim, W. K. Ho, K. C. Tan, R. Srinivasan and A. Tay, “The Intelligent Alarm Management System,” in IEEE Software, 2003.
[19] J. Braman and D. Wagner, “Energy Management of the Multi-Mission Space Exploration Vehicle using a Goal-Oriented Control System,” in IEEE Aerospace Conference, 2011 , Big Sky, MT, 2011.
[20] B. B. P. F. Elzer, “OPERATOR SUPPORT SYSTEMS IN S&C OF LARGE TECHNICAL SYSTEMS,” in International Conference on Human Interfaces in Control Rooms, Cockpits and Command Centre, Bath, UK, 1999.
[21] D. Patnaik, M. Marwah, R. K. Sharma and N. Ramakrishnan, “Temporal Data Mining Approaches for Sustainable Chiller Management in Data Centers,” in ACM Transactions on Intelligent Systems and Technology (TIST), New York, NY, USA, 2011.
[22] Xenomai, “Xenomai: Real-Time Framework for Linux,” [Online]. Available: www.xenomai.org.
[23] RTAI, “RTAI - the RealTime Application Interface for Linux,” RTAI, [Online]. Available: www.rtai.org.
[24] OPC, “OPC - OLE for Process Control,” OPC Foundation, [Online]. Available: https://opcfoundation.org/about/opc-technologies/opc-classic/.
[25] D. Jansen and H. Buttner, “Real-time ethernet the EtherCAT solution,” Computing & Control Engineering Journal, March 2004.
[26] Siemens, “PROFINET The Industrial Ethernet Standard,” in Proceedings of 8th IEEE International Workshop on Factory Communication Systems COMMUNICATION in AUTOMATION, Nancy, FR, 2010.
[27] M. Felser, PROFIBUS Manual [Elektronische Ressource] : A collection of information explaining PROFIBUS networks, Berlin: epubli GmbH, 2011.
[28] I. Puchr and P. Ettler, “Embedded System for Fast Data Acquisition Based on Cooperation
Ivan Puchr Probabilistic Advisory Subsystem as a Part of Distributed Control System of Complex Industrial Process
University of West Bohemia 64
of Two Operating System Platforms,” in Proceedings of MECO 2012 Mediterranean Conference on Embedded Computing, Bar, Montenegro, 2012.
[29] V. K. Garg, Concurrent and Distributed Computing in Java, Hoboken, New Jersey: John Wiley & Sons, lnc., 2004.
[30] D. E. Comer, Internetworking with TCP/IP, Englewood Clifs, NJ: Prentice-Hall, Inc., 1991.
[31] I. Puchr and P. Herout, “Signal Pre-processing Subsystem for the Purpose of Industrial Control,” in Proceedings of ICINCO 2011, 8th International Conference on Informatics in Control, Automation and Robotics, Noordwijkerhout, NL, 2011.
[32] P. Ettler, I. Puchr and J. Štika, “Combined Approach Helping to Reduce Periodic Disturbances in Speed Measuring,” in Proceedings of PSYCO 2010 Conference, Antalya, TR, 2010.
[33] I. Nagy, P. Nedoma, M. Kárný, L. Pavelková and P. Ettler, “O bayesovském učení,” Automa, pp. 56-61, 7 2002.
[34] P. Nedoma, M. Kárný, J. Böhm and T. V. Guy, “Mixtools Interactive User's Guide,” 2005. [Online]. Available: http://invenio.nusl.cz/record/35111.
[35] I. Nagy, E. Suzdaleva and M. Kárný, “Bayesian estimation of mixtures with dynamic transitions and known component parameters,” 2011. [Online]. Available: http://www.kybernetika.cz/content/2011/4/572.
[36] I. Nagy, P. Nedoma, M. Kárný, L. Pavelková and P. Ettler, “Modelování chování složitých systémů pro podporu operátorů,” Automa, pp. 54-57, 11 2002.
[37] J. Andrýsek, “Estimation of Dynamic Probabilistic Mixtures,” 2005. [Online]. Available: http://www.utia.cas.cz/node/631/0026117.
[38] A. Gut, An Intermediate Course in Probability, Dordrecht: Springer, 2009.
[39] B. Chen, “Conditional Probability, Total Probability Theorem and Bayes’ Rule,” [Online]. Available: http://140.122.185.120/Courses/Probability/2012Lectures/PROB2012F_Lecture-03-Conditional%20Probability,%20Total%20Probability%20Theorem,%20Bayes%20Rule.pdf.

Ivan Puchr Probabilistic Advisory Subsystem as a Part of Distributed Control System of Complex Industrial Process
University of West Bohemia 65
Appendix 1 Real-time Database—Description of Principles
The basis of the RDb technology is a memory resident database, a set of tables containing objects called RDb signals or simply signals. Signals are of different types according to usual data types in general:
RDb signal type Description
D Standard floating point 64-bit double.
F Standard floating point 32-bit float.
A Analog input. 16-bit word for write operations and 32-bit float for read operations (after recalculation to physical units).
L Standard 32-bit long integer.
I Standard 16-bit integer.
B Standard 8-bit byte.
T Text / string with the length of max. 255 characters.
G Group / structure of signals of different types. (It will be described later in detail.)
Table 4 RDb signal types
G signal type enables to create groups or structures of signals similarly as data structures in a programming language. Group can contain signals of same type (an array) or different types (data structure). A G-signal can contain G-signals together with other signal types. Main features of G-signals are:
atomicity of read / write operations that ensures consistency of the whole data structure for each read and write operation,
effectiveness of read / write operations, much less system overhead is spent than for signals being read / written item-by-item.
Each signal has the following basic properties:

Ivan Puchr Probabilistic Advisory Subsystem as a Part of Distributed Control System of Complex Industrial Process
University of West Bohemia 66
Property name Description
Type Data type of signal, see Table 4.
Name Symbolic name of signal. Together with Type uniquely identifies the signal.
Index Index in table of signals of same type. Together with Type uniquely identifies the signal. (It will be described later in detail.)
IniValue Initial value, valid before first write operation.
Value Actual (latest written) value.
HistoryLength Length of history. Signal history will be described later in detail.
HistoryStep Step of history. Signal history will be described later in detail.
Table 5 Basic properties of RDb signal object
Signals are generally identified by Type and Name but Type and Index may be used which is much more effective. During the first operation with a signal, Index is converted to Name. If the Index is remembered by the calling task and provided together with name as parameter to subsequent operations, operations spend much less processor time because no search by name must be done and signal is addressed by Index directly.
Signal history is a special feature of RDb. Each signal with HistoryLength>0 has a cyclic buffer assigned. With each write operation the written value is stored beside the actual value to the head of the history buffer. Parameter HistoryStep>1 enables not to store each value in history buffer. With HistoryStep=2, every second value written to the signal is stored to history buffer etc. History buffer is filled by standard write operations while for reading a special function is defined:
Figure 26 Function header of RdbReadHistory function (in C language)
Meaning of parameters is explained in the following table.

Ivan Puchr Probabilistic Advisory Subsystem as a Part of Distributed Control System of Complex Industrial Process
University of West Bohemia 67
Parameter name Description
Type Input: Type of signal, history of which is read. Values 'D', 'F', etc.
Name Input: Pointer to null terminated string representing symbolic name of signal.
Index Input/output: Pointer to index of signal. Before first referencing of signal should be set to -1. In first call, correct value of index is returned and in subsequent calls serves as input parameter holding direct reference to signal table and avoids searching of signal by name.
Buff Output: Pointer to buffer where the read history values should be stored.
BufLen Input: Length of buffer in bytes.
HistoryIndex Input: Pointer to index to cyclic buffer of signal history where the reading should start:
-32768 to -1 Start reading at position relative to current index. -1 means recently written value, -2 previous one, etc. If the requested value reaches beyond values written since start of RDb or beyond history length, the oldest value is read.
0 to
HistoryLength - 1
Start reading at absolute position / index in cyclic buffer.
Output: Absolute position to cyclic buffer is returned, so that next call with this value of HistoryIndex can continue with next history value.
NValues Input: Pointer to number of values to be read.
Output: Number of values actually read. It may be lower than requested if fewer new values are available since start or since last read value given by HistoryIndex.
Flag Input: For future use.
Actual Output: Number of bytes read.
Except Output: Exception.
Table 6 Parameters of RdbReadHistory function
For data acquisition, the combination of G-signals and signal history is highly useful. A task in real-time environment acquires a structure of data cyclically with a defined period and writes it to a G-signal with history in local RDb. Data samples stored by this "producer" task are strictly equidistant and consistent in structure. "Consumer" task can run with lower priority in the same real-time environment or in a non-real-time part of the same node or even in another node and can process all samples without loss.

Ivan Puchr Probabilistic Advisory Subsystem as a Part of Distributed Control System of Complex Industrial Process
University of West Bohemia 68
RDb Signals in Multitasking Environment of a Node
Basic data structures of RDb are taken as shared resource from the point of view of tasks running in the same node, in the same operating system environment. Concurrent access to this shared resource is solved by following concept.
RDb data structures are placed in a block of shared memory. Each task gets the base address of this memory in the initialization section. These addresses may differ because of different memory mappings of particular tasks. That is why there are no absolute pointers stored in data structures in the shared memory but offsets to the base address. The tasks use their shared memory base address together with offsets for addressing of RDb data structures residing in shared memory.
Each RDb signal is represented by a data structure in the shared memory. All signals of a type are represented by a one-dimensional array of data structures. This trivial arrangement enables that each signal of a type can be addressed in a simple way and thus quickly. If each task gets index to the array of signal data structures for each used signal as early as in initialization section, then the task can address each signal by two parameters only (SignalType and SignalIndex). Then, the access to signal is direct, free of search operation. This maximizes the efficiency of access to Rdb signals and speeds ups the operations with signals. In this aspect, it is possible for the tasks to use RDb signals directly in calculations and algorithms without making copies in local variables, because it has almost no impact on performance.
From the point of view of concurrent access to RDb signals, it is necessary to ensure atomicity of operations ([29] page 66) with RDb signals. The access methods can be divided into two groups. The first group contains the simplest signal operations where the atomicity of operations can be ensured without help of operating system calls for mutual exclusion. To this group belong mainly read and write operations with RDb signals of simple data types without history (HistoryLength=0). For simple data types, RDb signals of D, F, A, L, I, B types are taken. In this case, the atomicity of read / write operations can be ensured on the instruction level. Atomicity is guarantied if multi-byte value is written or read within an instruction.
All this mentioned about atomicity guarantied on an instruction level is valid for single-processor / single-core systems. In these systems, if the instruction begins, it cannot be interrupted before its completion and multi-byte value is written or read as a whole. Other situation is in multiprocessor or multi-core (much more frequent case with nowadays PC hardware platforms) systems. In these systems, the read / write operations executed by an instruction cannot be taken for uninterruptible, because the memory location can be accessed from multiple processors or cores simultaneously. This situation must be solved in RDb technology too, because multiprocessor or multi-core systems become standard even in industrial computer platforms.
There exist at least two possibilities how to solve this problem:
to ensure that all tasks accessing RDb signals run in one processor / core only,
to use LOCK prefix at instruction level.

Ivan Puchr Probabilistic Advisory Subsystem as a Part of Distributed Control System of Complex Industrial Process
University of West Bohemia 69
The first possibility is easy to ensure. In Windows environment, there is the AFFINITY switch of START command that enables to attach a process to a selected CPU in multiprocessor or multi-core system. The following example starts an application and assigns CPU 0 to this application:
START /AFFINITY 0x1 RDbApp1.exe
In Linux environment, we must distinguish between standard Linux and real-time Linux environments. In standard Linux a started process can be bound to a CPU by taskset command with -c switch, as in the following example a process with PID=12345 is bound to CPU 0:
taskset -c 1 -p 12345
In RTAI real-time Linux extension, the situation is dependent on task scheduler currently used, but in general, a task can be assigned to a CPU by calling the rt_set_runnable_on_cpus function with the following definition:
void rt_set_runnable_on_cpus(RT_TASK *task, unsigned int cpu_mask);
In Xenomai real-time framework for Linux, a real-time task can be assigned to a CPU in time of creation. rt_task_create function is used for it:
int rt_task_create(
RT_TASK *task,
const char *name,
int stksize,
int prio,
int mode
)
where in mode parameter, several bits are reserved to affine the new task to a CPU.
The second possibility to ensure the atomicity of simple read / write operations in multiprocessor or multi-core systems on instruction level is characterized by the use of LOCK instruction prefix. In this context we assume Intel x86 processors and successors. The LOCK instruction prefix can be used for a limited set of instructions only. As the MOV instruction is not among them, XCHG is the first candidate. Let us remark that XCHG instruction has LOCK prefix by default and locking mechanism is applied regardless of the presence or absence of the LOCK prefix. The locking mechanism ensures exclusive access of the CPU to a shared memory during the execution of instruction. Details of this locking mechanism varies with particular processors and besides external memory, cache memory is locked too.
The other group of access methods to RDb signals contains more complex operations concerning mainly G signals and signals with history (HistoryLength>0). In this case the atomicity of operations cannot be easily ensured at instruction level. Consistency of more complex data structures must be kept. For this purposes, standard operating system calls are used from the group of system calls for mutual exclusion of concurrent tasks. In all operating system platforms, solution with critical section (see [29] page 17-30) is accepted. The construction of RdbEnterCriticalSection and RdbLeaveCriticalSection functions differ in particular operating systems.
In Windows environment, mutex object is created and WaitForSingleObject system call is used in RdbEnterCriticalSection function.

Ivan Puchr Probabilistic Advisory Subsystem as a Part of Distributed Control System of Complex Industrial Process
University of West Bohemia 70
In standard Linux environment, semaphore object is used for construction of critical section. Semaphore is created and its maximum value set to 1, thus creating binary semaphore. semop function is called in RdbEnterCriticalSection and RdbLeaveCriticalSection functions then.
In Xenomai and RTAI real-time Linux environments, POSIX threads standard is used as unifying platform because it is implemented in both environments. Pthread mutex is created and pthread_mutex_lock and pthread_mutex_unlock functions are called inside RdbEnterCriticalSection and RdbLeaveCriticalSection functions respectively.
Let us remark that mutex is in principal the same object as binary semaphore. In this respect, critical section is implemented on base of the same object in all platforms.
The atomicity problems on instruction level in RDb with multiprocessor and multi-core systems are not fully sorted out and are the subject of further development.

Ivan Puchr Probabilistic Advisory Subsystem as a Part of Distributed Control System of Complex Industrial Process
University of West Bohemia 71
Appendix 2 Listing of priorInformationInfluenceDemoFunction

Ivan Puchr Probabilistic Advisory Subsystem as a Part of Distributed Control System of Complex Industrial Process
University of West Bohemia 72
Appendix 3 Listing of priorInformationInfluenceDemoFunction Call with a Set of Parameters and Plot of Results

Ivan Puchr Probabilistic Advisory Subsystem as a Part of Distributed Control System of Complex Industrial Process
University of West Bohemia 73
Appendix 4 Example of MATLAB Code Generating Figure 18

Ivan Puchr Probabilistic Advisory Subsystem as a Part of Distributed Control System of Complex Industrial Process
University of West Bohemia 74
Appendix 5 Description of MixTools Library
Global Variables
All functions work over global variables. List of main global variables follows:
TIME is dynamic time, it is denoted as in equations in this document.
DATA is matrix of data where particular data channels (signals) are located in rows, DATA(channel,TIME) denotes value of data channel channel in time instance TIME.
ACTIVE identifies the currently active component of a mixture. If a process is described by a particular mixture, active component is the component that represents or models the current state of the process.
DEBUG is a global flag that controls amount of debugging information displayed in runtime.
Objects
In spite of the fact that MixTools is not object oriented in the terminology of object oriented programming, we will use the term object for software structures used for representation of mixtures, components and other MixTools entities. Main objects used in MixTools are mixtures (of probability density functions) and components creating the mixtures. In previous chapters, mixtures and components were described. Moreover, factors are used for the representation of components in MixTools. We will explain factors here.
Factors
We will explain the decomposition of a component into factors on the case of a bivariate version of component from (11). Component
( identifier of component is omitted for simplicity) can be
decomposed according to the chain rule as follows:
(20)
Probability density function of two random variables is replaced by the product of two univariate probability density functions. This decomposition is also called factorisation and two functions on the right side are called factors ([2] page 55). Factor is probability density function describing particular data channel. This form of mixture component was chosen by authors of MixTools as the most convenient for software representation and operations.
Demonstration of factors was done here with the use of only two dimensional data space. Chain rule in its general form for probabilities of events (see [39] page 11) shows how the factorisation can be constructed in multidimensional data space.

Ivan Puchr Probabilistic Advisory Subsystem as a Part of Distributed Control System of Complex Industrial Process
University of West Bohemia 75
(21)
For the use in MixTools, factors are expressed in other forms. We show one of these forms in the example for two data channels:
(22)
The equation (22) tells that value of data channel 1 in time instant depends on linear combination of delayed values of the same channel and on values of the other channel, delayed and/or not delayed. Parameter is offset of the data channel and . is called
noise. expresses the other unknown influences that depends on. channel is called modeled channel.
In Mixtools, a factor is represented by a data structure. Main structure items are:
Identifier Description Data type
ychn Data channel represented by the factor. scalar
str Factor structure. It is a two dimensional matrix with two rows. In the first row, there are numbers of channels and in the second row, there are numbers indicating time delay of corresponding channels. See below for explanation.
matrix
type Factor type. scalar
Other structure items depend on factor type.
Table 7 Main items of factor data structure
The meaning of str will be explained by way of an example. Factor structure for channel 1
means that data channel represented by the factor is dependent
on channel 1 with delay 1 (DATA(1,TIME-1)),
on channel 1 with delay 2 (DATA(1,TIME-2)),
on channel 2 with no delay (DATA(2,TIME)) and
on channel 2 with delay 1 (DATA(2,TIME-1)). Factor structure represents the structure of regression vector.
Factor type differentiates type of factor representation in the form of MATLAB data structure. On the factor type, the other structure items depend. These items express in different forms the probabilistic nature of the factor. Different forms are suitable for different factor operations. See [34] page 14 for details.
We also differentiates dynamic and static factors. This division is based on the dependence of the modeled channel value in time instance on delayed values of this and/or other channels. Regression vector of static factor expressed by factor structure contains zero-delayed values only ( . On the contrary, dynamic factor has in its regression vector at least one delayed value ( .

Ivan Puchr Probabilistic Advisory Subsystem as a Part of Distributed Control System of Complex Industrial Process
University of West Bohemia 76
Components
Component is a multivariate probability density function that describes behaviour of selected channels called modeled channels. Behaviour of these channels may depend on other channels called non-modeled channels.
Components are expressed with the help of factors as described in (22). In this basic form, the component is represented as a list of factors, as a cell array in MATLAB terminology. This form is suitable for MixTools estimation functions. There are other forms of mixture representation suitable for simulation, e.g.
Mixtures
As mentioned above, mixture is a linear combination of parameterized probability density functions. In MixTools, the mixtures are represented by data structures of several different types. One possible representation of a mixture in MixTools is stated in the following table.
Identifier Description Data type
Coms Array of components. cell vector
ncom Number of components. scalar
dfcs Degrees of freedom of components. After normalization to sum of 1, it represents probability of particular components.
vector 1 x ncom
Table 8 Representation of mixture based on an array of components.
Another possible representation of mixture based on a list of factors is the data structure items of which are listed in the following table.
Identifier Description Data type
Facs Array of factors. cell vector
coms Matrix expressing which factor belongs to which component. Number of rows corresponds to the number of components. Number of columns is the number of factors each component consists of. (Number of factors in each component equals to the number of modeled channels nchn.)
Matrix ncom x nchn
dfcs Degrees of freedom of components. After normalization to sum of 1, it represents probability of particular components.
vector 1 x ncom
Table 9 Representation of mixture based on an array of factors.
Similarly to components, different mixture representations are used for different operations (simulation, estimation, ...)

Ivan Puchr Probabilistic Advisory Subsystem as a Part of Distributed Control System of Complex Industrial Process
University of West Bohemia 77
Function Categories
All functions in MixTools are divided into categories. List of main categories with a short description and function examples follows:
Construction category contains functions used for creation of data structures representing mixtures, mixture components, factors and other objects and contains functions that enable various conversions between particular types of object representations. Example of a creation function is mixconst that creates a mixture from a set of components and their weights. Example of a conversion function is mix2mix that converts mixture from one representation type to another one.
Pre-processing category contains functions that realize often used operations with data being investigated. Example of a useful pre-processing function is scaledata which is controlled by input string parameter that can e.g. equal to 'limit' or 'scale' which denotes limiting or rescaling of DATA. Filtering is done by preinit
function that enables removal of outliers, smoothing and filtering of DATA based on several different algorithms.
Estimation category represents the key category from the advisory system point of view. Functions collected in this category help to find the representation of DATA in the form of mixtures of probability density functions. mixest is a representative of this category that comprises a possibility to call several estimation algorithms. Input parameters enable to set prior information, number of iterations and to choose a particular estimation algorithm.
Simulation category comprises functions that simulate / generate DATA on the base of a mixture. It is, to a certain extent, a reverse operation to the estimation. Results of simulation are also used for verification of estimation results. By estimation functions, a representation of DATA is found in the form of a mixture. Then the mixture is used as input parameter of simulation function that generates simulated DATA. Original DATA and simulated DATA are compared and thus success of estimation can be measured.
There exist more categories in MixTools but we stated only that ones containing functions used for the purposes of the advisory system.
All substantial functions are available in MEX format as well (besides the M format). MEX modules are functions executable in MATLAB environment. They are written in C and compiled. This reduces the execution time substantially in comparison to interpreted M modules.

Ivan Puchr Probabilistic Advisory Subsystem as a Part of Distributed Control System of Complex Industrial Process
University of West Bohemia 78
Appendix 6 MATLAB Code Snippet that Demonstrates Creation of Mixture of pdfs from Acquired Data

Ivan Puchr Probabilistic Advisory Subsystem as a Part of Distributed Control System of Complex Industrial Process
University of West Bohemia 79
Appendix 7 MATLAB Code Snippet for Demonstration of Marginal pdf Creation with the Help of MixTools Toolbox

Ivan Puchr Probabilistic Advisory Subsystem as a Part of Distributed Control System of Complex Industrial Process
University of West Bohemia 80
Appendix 8 List of Author's Publications
Ettler P., Valečková M., Kárný M., Puchr I., “Towards a knowledge-based control of a complex industrial process”, in Proceedings of the 2000 American Control Conference, Chicago, US, 2000.
Ettler P., Puchr I., “Coping with time delay while controlling annealing furnaces”, in Proceedings of the 6th IFAC Workshop on Time-Delay Systems, L‘Aquila, IT, 2006.
Ettler P., Puchr I., Štika J., Křen J., “DAR and Achievements in the Metal Processing Domain”, in Proceedings of 5th International Workshop on Data – Algorithms – Decision Making, Plzeň, CZ, 2009.
Ettler P. Puchr I., Štika J., “Combined Approach Helping to Reduce Periodic Disturbances in Speed Measuring”, in Proceedings of the PSYCO 2010 IFAC Workshop, Antalya, TR, 2010.
Puchr I., Ettler P., “Continuous Decision Making for Specific Tasks Related to Metal Processing Industry”, in Proceedings of the ROADEF 2011, 12e congrès annuel de la Société française de Recherche Opérationnelle et d’Aide à la Décision, Saint-Étienne, FR, 2011.
Puchr I., Herout P., “Signal Pre-processing Subsystem for the Purpose of Industrial Control”, in Proceedings of the ICINCO 2011, 8th International Conference on Informatics in Control, Automation and Robotics, Noordwijkerhout, NL, 2011.
Puchr I., Ettler P., “Embedded system for fast data acquisition based on cooperation of two operating system platforms”, in Proceedings of the Embedded Computing (MECO), 2012 Mediterranean Conference, Bar, Montenegro, 2012.
Ettler P., Puchr I., Dedecius K., “Bayesian Model Mixing for Cold Rolling Mills: Test Results”, in Proceedings of the 2013 International Conference on Process Control (PC2013), Štrbské Pleso, SK, 2013.
Ettler P., Puchr I., “Utilization of MATLAB Classes to Streamline Experimental Software”, in Proceedings of the International Conference Technical Computing Prague (TCP 2013), Praha, CZ, 2013.