probabilistic graphical models (i):...
TRANSCRIPT

Probabilistic Graphical Models (I):
Representation
[70240413 Statistical Machine Learning, Spring, 2015]
http://bigml.cs.tsinghua.edu.cn/~jun
State Key Lab of Intelligent Technology & Systems
Tsinghua University
April 21, 2015

What are Graphical Models?

Reasoning under uncertainty!

Three Fundamental Questions
Representation
How to capture/model uncertainty in possible worlds?
How to encode our domain knowledge/assumptions/constraints?
Inference
How do I answer questions/queries according to my model and/or
based on given data?
Learning
What model is “right” for my data?

Recap of Basic Prob. ConceptsRepresentation: what is the joint prob. distribution on multiple variables
How many state configurations in total?
Are they all needed to be represented?
Do we get any scientific/medical insight?
Learning: where do we get all this probabilities? Maximum likelihood estimation? But how many data do we need?
Are there other estimation principles?
Where do we put domain knowledge in terms of plausible relationships between variables, and plausible values of probabilities?
Inference: if not all variables are observable, how to compute the conditional distribution of latent variables given evidence? Computing p(H|A) would require summing over all configurations of the
unobserved variables2 6

What is a Graphical Model?
A multivariate distribution in high-dimensional space!
A possible world for cellular signal transduction:

GM: Structure Simplifies Representation
Dependency/Independency among variables:

Probabilistic Graphical Models
If Xi’s are conditionally independent (as described by a PGM), the
joint can be factorized into a product of simpler terms, e.g.:
Why we may favor a PGM?
Incorporation of domain knowledge and causal (logical) structures
How many parameters in the above factorized distribution?

PGM: Data Integration
More examples:
Text + Image + Network Holistic Social Media

Probabilistic Graphical Models
If Xi’s are conditionally independent (as described by a PGM), the joint can be factorized into a product of simpler terms, e.g.:
Why we may favor a PGM?
Incorporation of domain knowledge and causal (logical) structures How many parameters in the above factorized distribution?
Modular combination of heterogeneous parts – data fusion!

Rational Statistical Inference
The Bayes Theorem
This allows us to capture uncertainty about the model in a
principled way
But how can we specify and represent a complicated model?

PGM: MLE and Bayesian Learning
Probabilistic statements of is conditioned on the values of
the observed variables and prior£

Probabilistic Graphical Models
If Xi’s are conditionally independent (as described by a PGM), the joint can be factorized into a product of simpler terms, e.g.:
Why we may favor a PGM? Incorporation of domain knowledge and causal (logical) structures
How many parameters in the above factorized distribution?
Modular combination of heterogeneous parts – data fusion Bayesian philosophy
Knowledge meets data
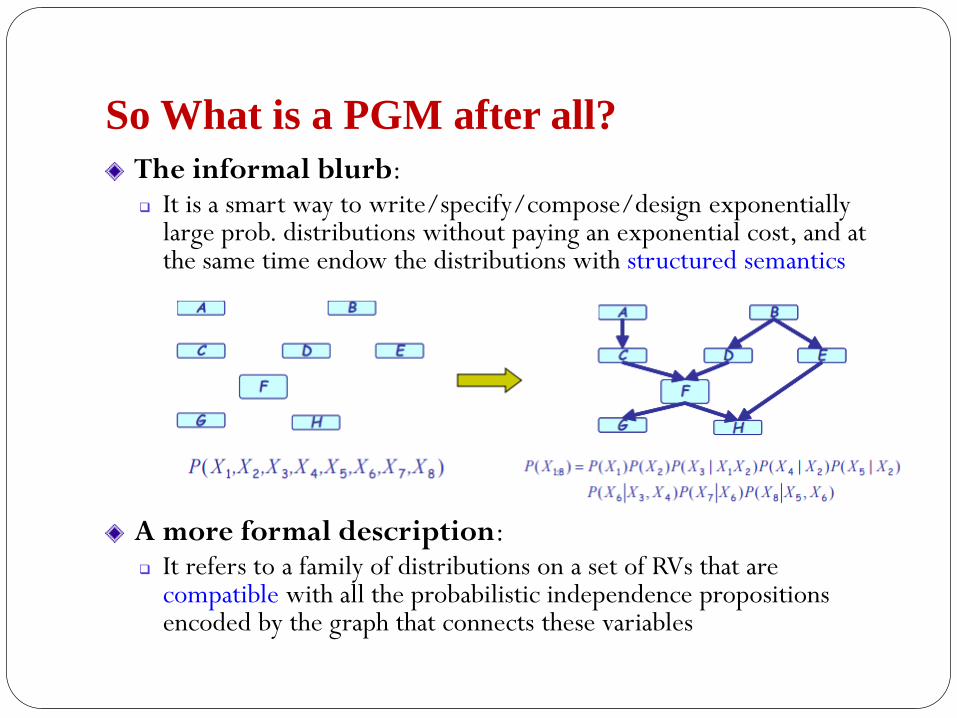
So What is a PGM after all?
The informal blurb: It is a smart way to write/specify/compose/design exponentially
large prob. distributions without paying an exponential cost, and at the same time endow the distributions with structured semantics
A more formal description: It refers to a family of distributions on a set of RVs that are
compatible with all the probabilistic independence propositions encoded by the graph that connects these variables

Two Types of PGMs
Directed edges give causality relationships (Bayesian
Network or Directed Graphical Models)
Undirected edges give correlations between variables
(Markov Random Field or Undirected Graphical Models)

Bayesian Networks
Structure: DAG
Meaning: a node is conditionally independentof every other node in the network outside its Markov blanket
Local conditional distributions (CPD) and the DAG completely determine the joint distribution

Markov Random Fields
Structure: undirected graph
Meaning: a node is conditionally independent of every other node in the network given its Direct Neighbors
Local contingency functions (potentials) and the cliques in the graph completely determine the joint distribution

Towards Structural Specification of
Probability Distribution
Separation properties in the graph imply independence properties
about the associated variables
For the graph to be useful, any conditional independence
properties we can derive from the graph should hold for the
probability distribution that the graph represents
The Equivalence Theorem:
For a graph G,
Let denote the family of distributions that satisfy I(G),
Let denote the family of distributions that factor according to G,
Then
D 1
D 2
D 1 = D 2

GMs are your old friends
Clustering
GMMs
Regression
Linear, conditional mixture
Classification
Generative and discriminative approach
Dimension reduction
PCA, FA, etc
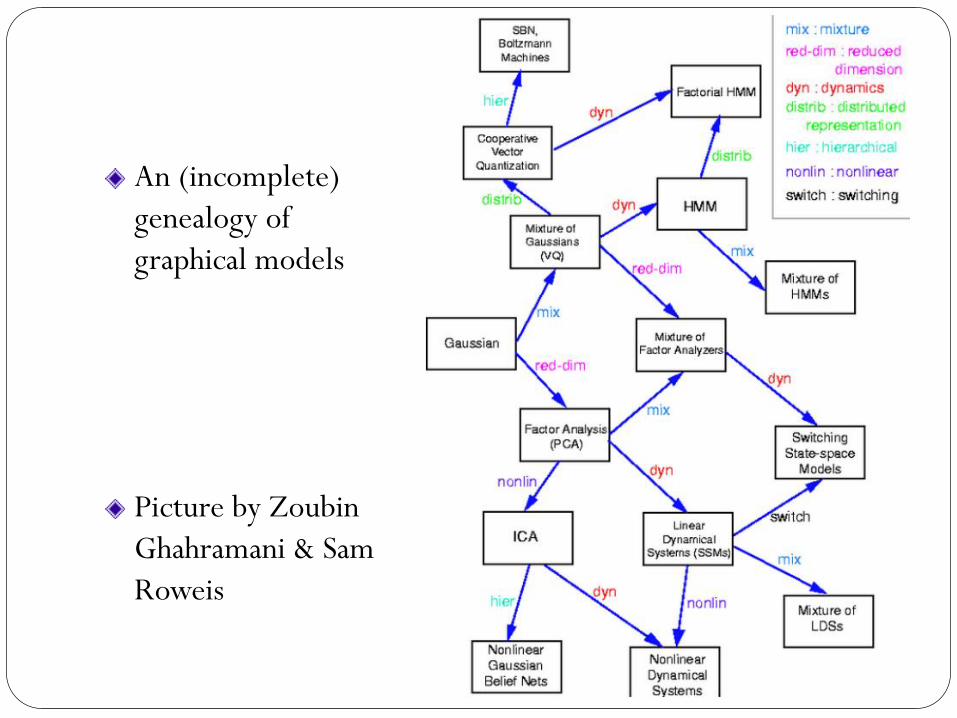
An (incomplete)
genealogy of
graphical models
Picture by Zoubin
Ghahramani & Sam
Roweis

Application of PGMs
Machine learning
Computational statistics
Computer vision and graphics
Natural language processing
Information retrieval
Robot control
Decision making under uncertainty
Error-control codes
Computational biology
Genetics and medical diagnosis/prognosis
Finance and economics
Etc.

Why graphical models
A language for communication
A language for computation
A language for development
Origins:
Independently developed by Spiegelhalter and Lauritzen in
statistics and Pearl in computer science in the late 1980’s
Why graphical models Probability theory provides the glue whereby the parts are combined, ensuring that the system as a whole is consistent, and providing ways to interface models to data
The graph theoretical side of GMs provides both an intuitively appealing interface by which humans can model highly-interacting sets of variables as well as a data structure that lends itself naturally to the design of efficient general-purpose algorithms
Many of the classical multivariate probabilistic systems studied in the fields such as statistics, systems engineering, information theory, pattern recognition and statistical mechanics are special cases of the general graphical model formalism
The graphical model framework provides a way to view all of these systems as instances of a common underlying formalism
--- M. Jordan

Bayesian Networks

Example: The dishonest casino
A casino has two dice:
Fair die: P(1)=P(2)=…=P(6)=1/6
Loaded die: P(1)=P(2)=…=P(5)=1/10; P(6)=1/2
Casino player switches back & forth between fair and loaded die once every 20 turns
Game:
You bet $1
You roll (always with a fair die)
Casino player rolls (maybe with fair die, maybe with loaded die)
Highest number wins $2

Puzzles regarding the dishonest casino
Given: a sequence of rolls by the casino player
Questions:
How likely is this sequence, given our model of how the casino
works?
This is the EVALUATION problem
What portion of the sequence was generated with the fair die, and
what portion with the loaded die?
This is the DECODING problem
How “loaded” is the loaded die? How “fair” is the fair die? How often
does the casino player change from fair to loaded, and back?
This is the LEARNING problem

Hidden Markov Models (HMMs)

Probability of a parse
Given a sequence
and a parse
To find how likely is the parse: (given our HMM and the
sequence)
Marginal probability:
Posterior probability:
We will learn how to do this explicitly (polynomial time)

Bayesian Networks in a Nutshell
A BN is a directed graph whose nodes represent the RVs and whose edges represent direct influence of one variable on another
It is a data structure that provides the skeleton for representing a joint distribution compactly in a factorized way
It offers a compact representation for a set of conditional independence assumptions about a distribution
We can view the graph as encoding a generative sampling process executed by nature, where the value for each variable is selected by nature using a distribution that depends only on its parents.

Bayesian Network: Factorization Theorem
Theorem:
Given a DAG, the most general form of the probability
distribution that is consistent with the graph factors according
to “node given its parents”:
where is the set of parents of Xi, d is the number of nodes
(variables) in the graph

Specification of a Directed GM
There are two components to any GM:
The qualitative specification
The quantitative specification

Qualitative Specification
Where does the qualitative specification come from?
Prior knowledge of causal relationships
Prior knowledge of modular relationships
Assessment from experts
Learning from data
We simply link a certain architecture (e.g., a layered graph)
…

Local Structure & Independence
Common parent
Fixing B decouples A and C
Cascade
Knowing B decouples A and C
V-structure
Knowing C couples A and B because A can “explain away” B w.r.t C
The language is compact, the concepts are rich!

I-Maps
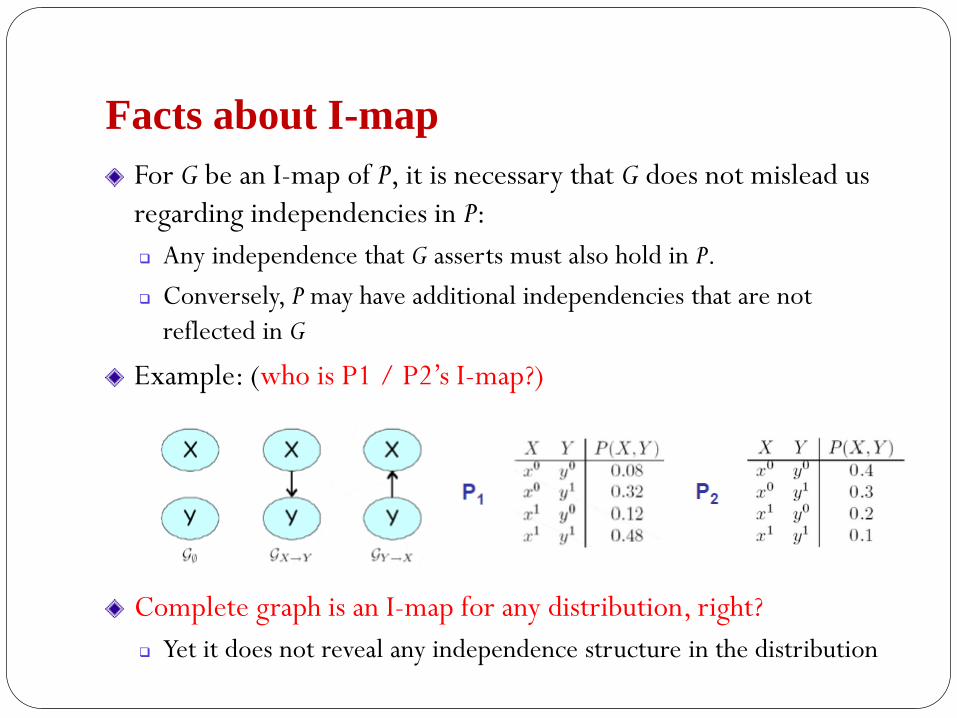
Facts about I-map
For G be an I-map of P, it is necessary that G does not mislead us
regarding independencies in P:
Any independence that G asserts must also hold in P.
Conversely, P may have additional independencies that are not
reflected in G
Example: (who is P1 / P2’s I-map?)
Complete graph is an I-map for any distribution, right?
Yet it does not reveal any independence structure in the distribution

What is in I(G) – Local Markov
Assumptions

Graph separation criterion

Active trail

What is in I(G) – Global Markov Property

Example
Complete the I(G) of this graph:

Toward quantitative specification of
probability distribution
Separation properties in the graph imply independence properties about the associated variables
The Equivalence Theorem:
For the graph to be useful, any conditional independence properties we can derive from the graph should hold for the probability distribution that the graph represents
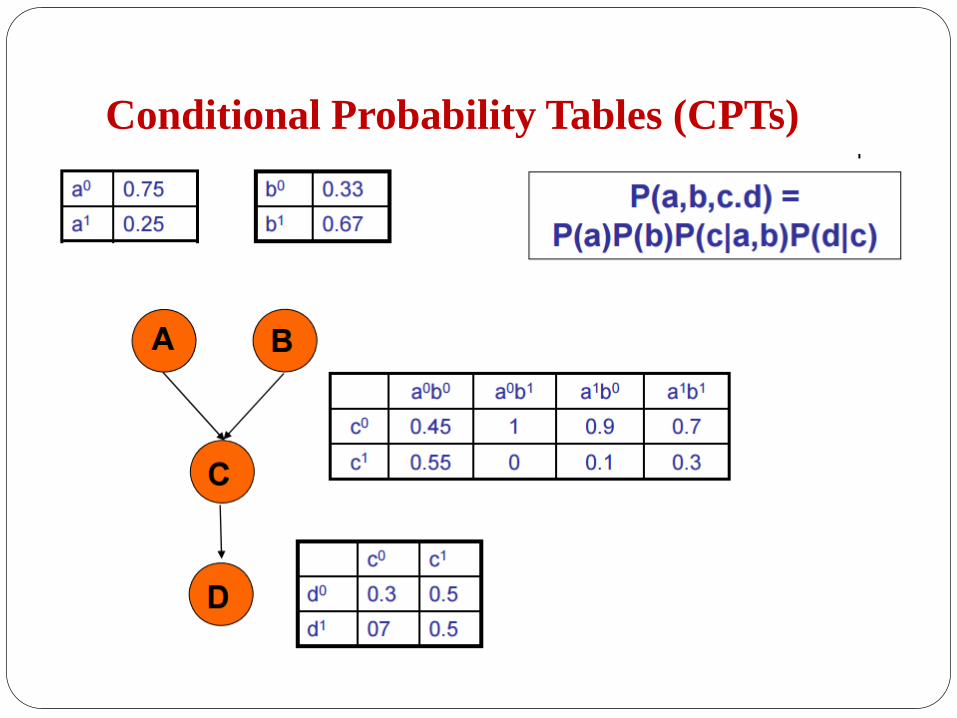
Conditional Probability Tables (CPTs)

Conditional Probability Density Functions
(CPDs)

Summary of BN Semantics

Soundness and Completeness

Soundness and Completeness
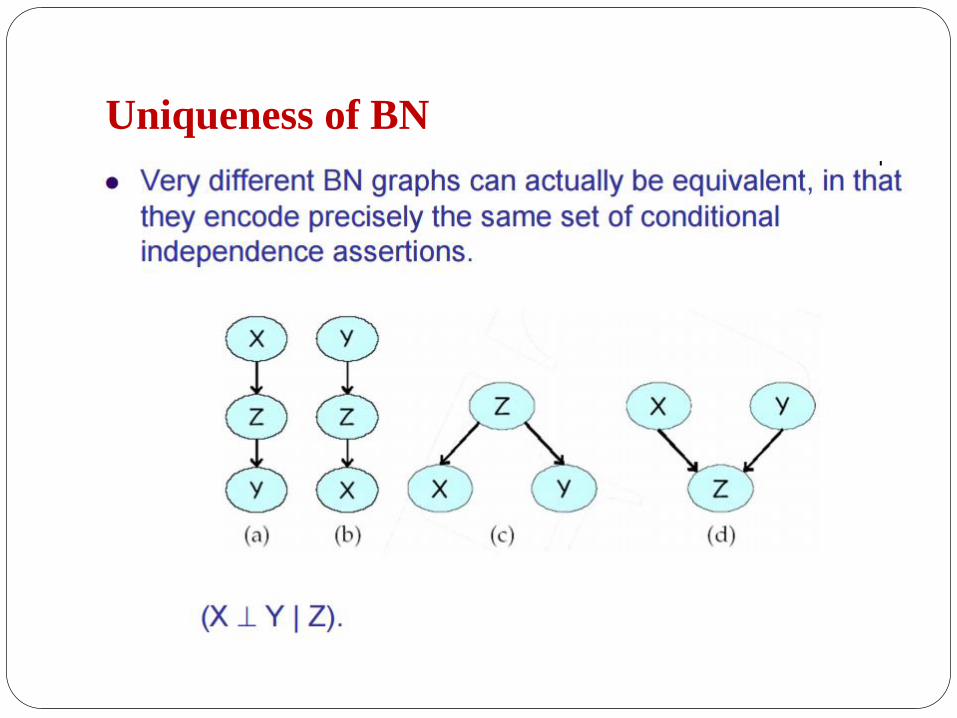
Uniqueness of BN

Simple BNs: Conditionally Indep.
Observations
The “Plate” Micro:

Hidden Markov Model:
from static to dynamic mixture

Definition of HMM

Markov Random Fields

P-maps
Definition: A DAG G is a perfect map (P-map) for a
distribution P is I(P) = I(G)
Theorem: not every distribution has a perfect map as DAG
Proof by counterexample: suppose we have a model where
This cannot be represented by any Bayes net
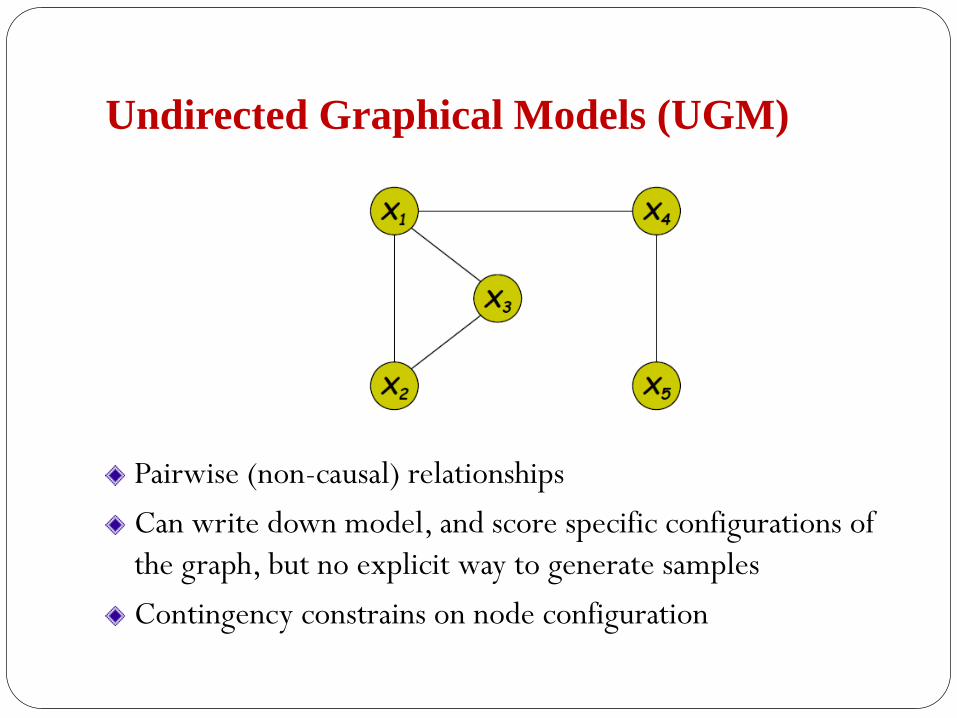
Undirected Graphical Models (UGM)
Pairwise (non-causal) relationships
Can write down model, and score specific configurations of
the graph, but no explicit way to generate samples
Contingency constrains on node configuration

A Canonical Example:
understanding complex scene
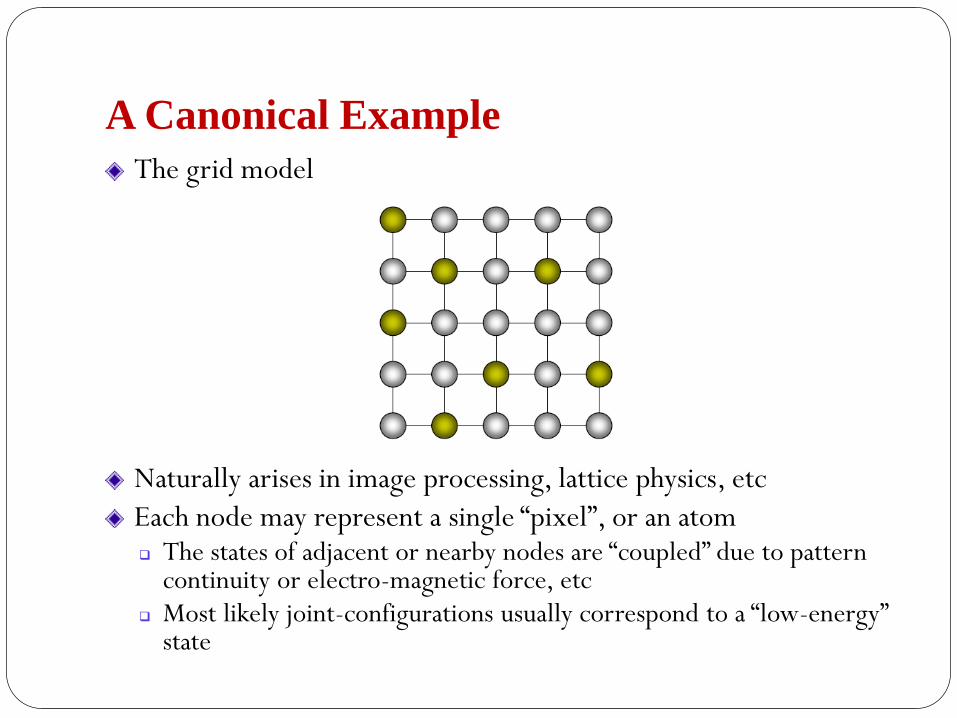
A Canonical Example
The grid model
Naturally arises in image processing, lattice physics, etc
Each node may represent a single “pixel”, or an atom The states of adjacent or nearby nodes are “coupled” due to pattern
continuity or electro-magnetic force, etc Most likely joint-configurations usually correspond to a “low-energy”
state

Representation

I. Quantitative Specification:
Cliques

Interpretation of Clique Potentials

Example UGM – using max cliques

Example UGM – using subcliques

II: Independence Properties
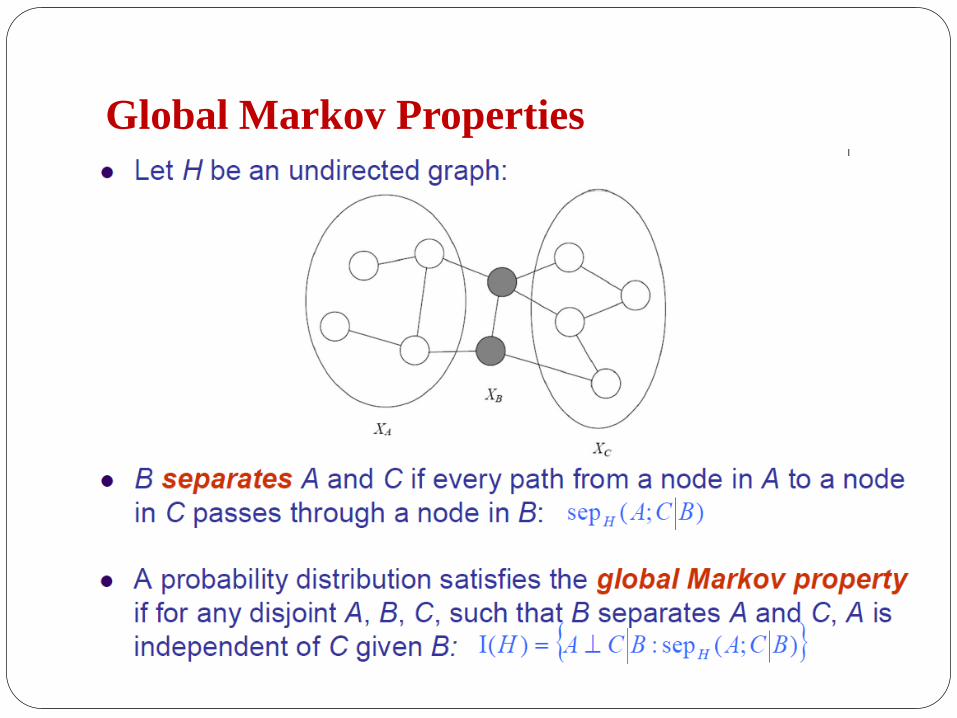
Global Markov Properties
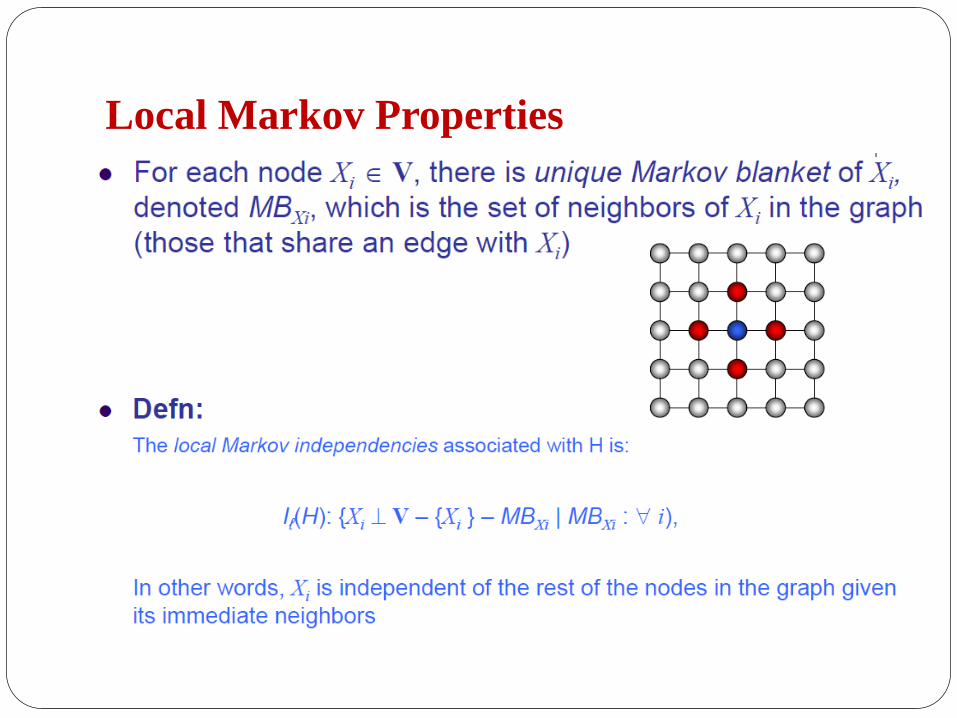
Local Markov Properties

Soundness and Completeness of global
Markov property

Hammersley-Clifford Theorem
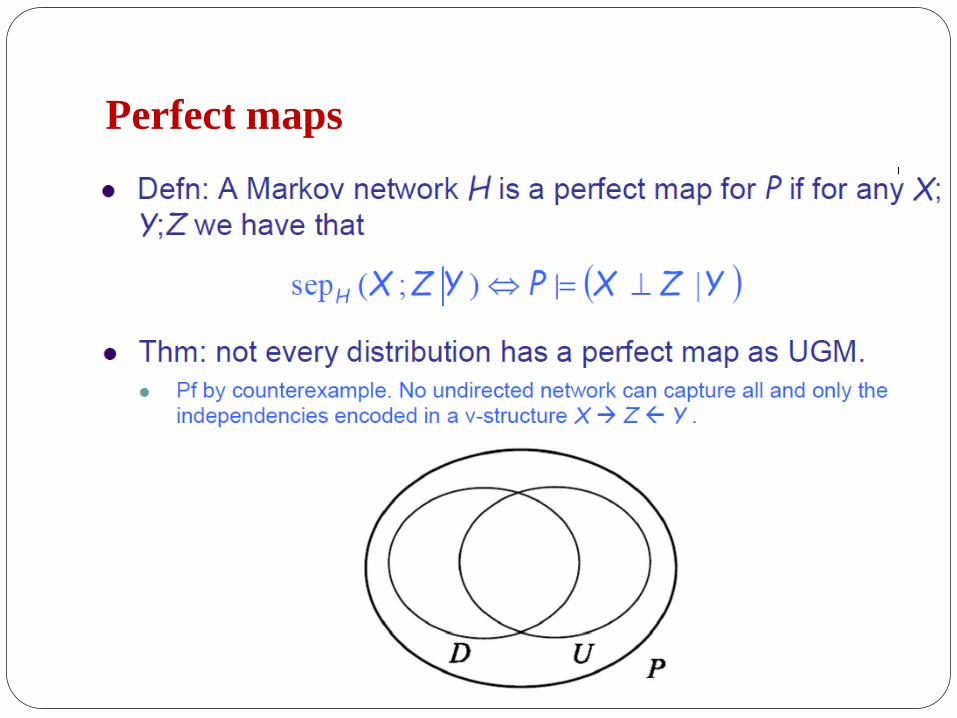
Perfect maps

Exponential Form
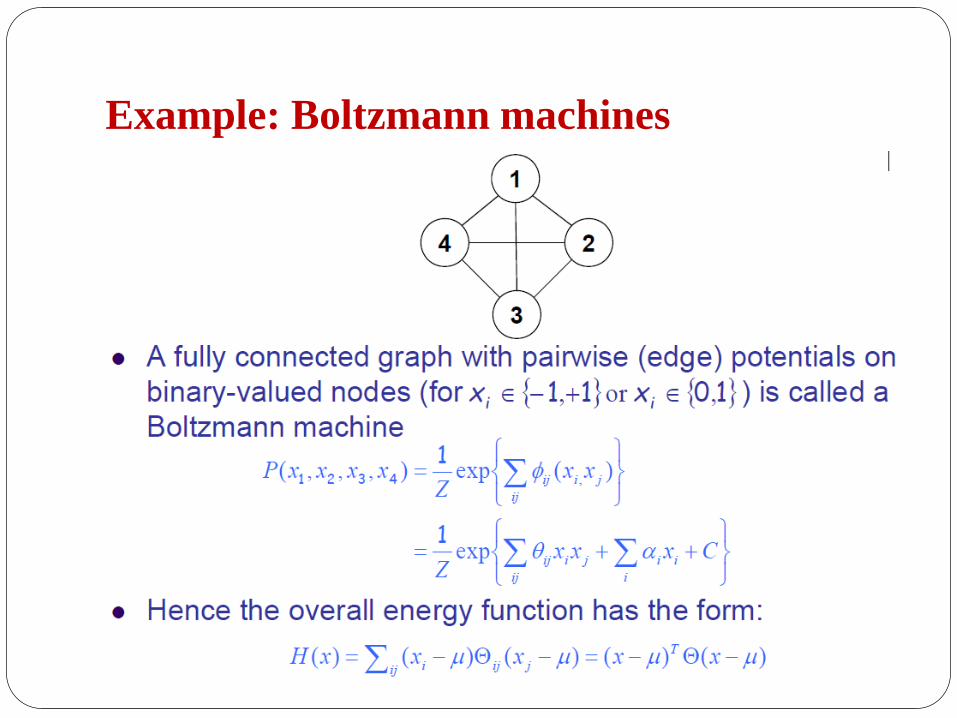
Example: Boltzmann machines

Ising Model

Restricted Boltzmann Machines

Properties of RBM
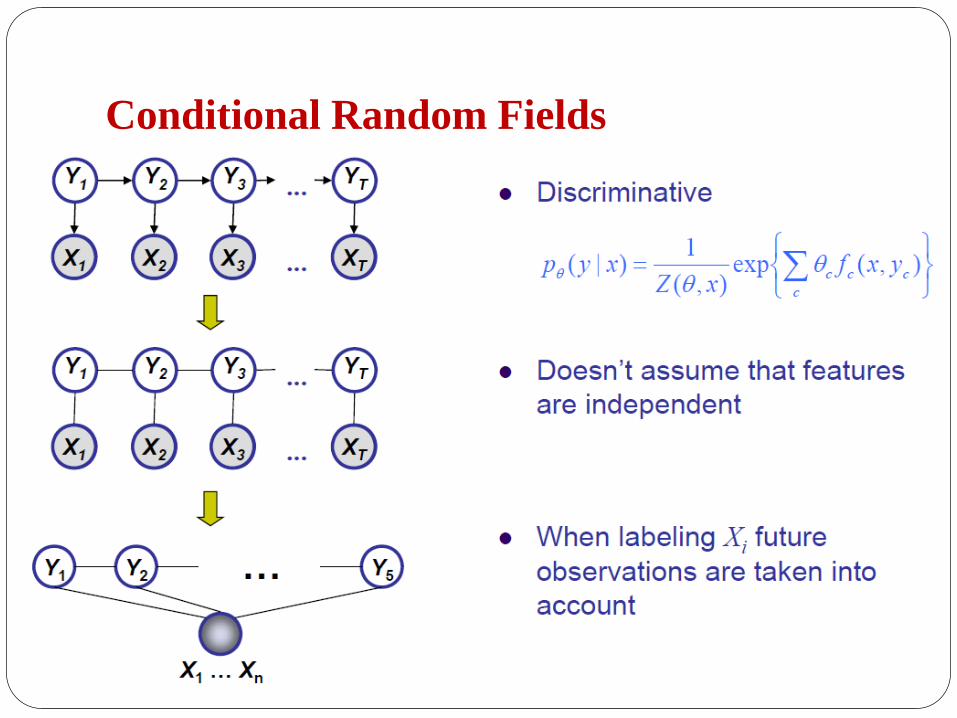
Conditional Random Fields

Conditional Models

Conditional Distribution

CRFs

Summary: Cond. Indep. Semantics in MRF

Where does the graph structure come
from?

Information Theoretical Interpretation of
ML
M: # of data samples

Information Theoretical Interpretation of
ML
For the fully observable case
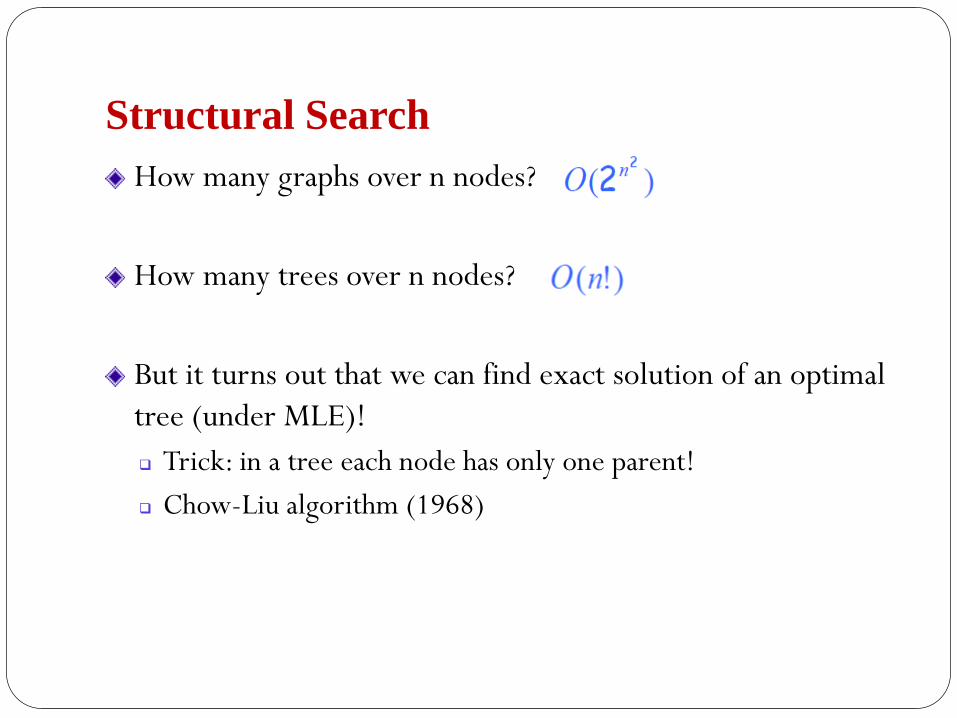
Structural Search
How many graphs over n nodes?
How many trees over n nodes?
But it turns out that we can find exact solution of an optimal
tree (under MLE)!
Trick: in a tree each node has only one parent!
Chow-Liu algorithm (1968)

Chow-Liu tree learning algorithm
Objective function
Chow-Liu algorithm:

Chow-Liu tree learning algorithm
Objective function
Chow-Liu algorithm:

Structure Learning for General Graphs

SummaryUndirected graphical models capture “relatedness”, “coupling”, “co-occurrence”, “synergism”, etc. between variables Local and global independence properties via graph separation criteria Defined on clique potentials
Can be used to define either joint or conditional distributions
Generally intractable to compute likelihood due to presence of “partition function” Not only inference but also likelihood-based learning is difficult in general
Important special cases Ising models; RBMs; CRFs
Learning GM structure Generally NP-hard Chow-Liu tree learning algorithm

References
Lecture notes from “Probabilistic Graphical Models”, 10-708,
Spring 2015. Eric Xing, CMU
Daphne Koller and Nir Friedman, Probabilistic Graphical
Models: Principles and Techniques