problem: space shuttle problem: no more space …...problem: space shuttle problem: no more space...
TRANSCRIPT

Problem: Space Shuttle Problem: No More Space Shuttles
On July 21, 2011, the 135th and final US Space Shuttle landed in Florida after its 13-day mission
into orbit, complete with a docking at the International Space Station (ISS). NASA will now
have to rely on other nations or commercial endeavors to travel into space until a replacement
vehicle is developed and constructed. Develop a comprehensive ten-year plan complete with
costs, payloads, and flight schedules to maintain the ISS.
Some interesting facts possibly worthy of your consideration:
The ISS is at full capacity with 6 astronauts, but can surge during shuttle docks to as high
as 13.
The ISS is scheduled to remain in service until at least the year 2020.
Historically, transport to the ISS using US Shuttles has cost between $5000-10,000 per
pound. Shuttle missions have lasted approximately 10-14 days in orbit. Missions on
board the ISS typically last around six months.
Recently, progress has been made within private industry to launch unmanned rockets
into space.
Russia is willing to launch US astronauts into space at a cost of about $60 million each.

High School Mathematical
Contest in Modeling
Problem A: No More Space Shuttles
Prepared by: #2930
Date: November 13, 2011
t

2011 HiMCM Team #2930
Page 2 of 53
Table of Contents
Problem Summary ........................................................................................................................... 3 Assumptions ...................................................................................................................................... 4 Glossary ............................................................................................................................................... 5 Background Research .................................................................................................................... 6 Part 1: Baseline Projections ......................................................................................................... 8
Part 1A: Transforming Raw to Adjusted Data ........................................................ 8 Part 1B: Supply by Tonnage ........................................................................................ 15 Part 1C: Supply by Proportion .................................................................................... 20 Part 1D: Supply by Combination ............................................................................... 23 Part 1E: State-funded Model ....................................................................................... 24 Part 1F: Procurement Costs ......................................................................................... 26
Part 2: Privatization Model ........................................................................................................ 27
Part 2A: Finding the Right Brand .............................................................................. 27 Part 2B: Finding Landing Craft Efficiency .............................................................. 29
Part 3: Experimental Solutions ................................................................................................. 32
Part 3A: Space Elevators ............................................................................................... 32 Part 3B: Spaceplanes ...................................................................................................... 35
Part 4: The 10-Year Plan ............................................................................................................. 36
Part 4A: Cost ...................................................................................................................... 36 Part 4B: Payload ............................................................................................................... 38 Part 4C: Flight Schedule ................................................................................................ 39
Appendix ........................................................................................................................................... 43 Appendix 1A: List of Modules Added to ISS .......................................................... 43 Appendix 1B: ISS Basic Configuration Visual ...................................................... 44 Appendix 2: List of Payloads of All Non-Soyuz ISS Missions .......................... 45 Appendix 3: Flight Times of Soyuz Missions ......................................................... 47 Appendix 4A: STS-133 Launch Windows ............................................................... 48 Appendix 4B: STS-135 Launch Windows ............................................................... 49 Appendix 5: TI-84 Program used to Determine Launch Times ..................... 50 Appendix 6: Bibliography ............................................................................................. 51

2011 HiMCM Team #2930
Page 3 of 53
Problem Summary
The International Space Station (ISS) is a satellite in low Earth orbit, where
scientists since 1998 have been investigating the long-term effects of a zero
gravity environment on humans. On July 21, 2011, the final US Space Shuttle
landed in Florida. Historically, these space shuttles have been used to maintain
the ISS, by bringing up additional modules and by having astronauts conduct
routine spacewalks and repairs. Without the space shuttles, we need to find a
way to continue maintaining the ISS. We will consider the funds appropriated by
the US government and the various methods of taking astronauts up into space
in order to develop a comprehensive plan to maintain the ISS until 2021.

2011 HiMCM Team #2930
Page 4 of 53
Assumptions:
Cost is the deciding factor in selecting the best option
Reliability and payload conditions are not an issue in selecting private
contractors; it is assumed that both are adequate before the brand is
considered.
National origins, political considerations and existing relationships with the
various governments are not considerations in deciding choices.
Launch prices of rockets remain consistent
Cost of personnel is negligible
2.2 lbs = 1 kg. This conversion was used throughout our model to convert
between units.
Research cost is done separately, thus we don’t have to consider it
No non-incremental technological breakthroughs
Trends are the same as current
We have the authority to override NASA’s existing plans
Cost of each launch was included in the fiscal year that it docked in
Dextre is included in the launch mass of Canadarm 2, therefore we do not
have to find a separate mass of Dextre
The payload of the docking spacecraft is proportional to the payload of the
rocket; therefore we can compare rocket payload/price ratios in order to find
the best choice, but still use the specifications of the docking spacecraft to
more accurate calculate the final costs.
Manned Dragon Spacecraft can also carry the same tonnage as unmanned
Dragon spacecraft flights.

2011 HiMCM Team #2930
Page 5 of 53
Glossary:
Fiscal Year (FY): A set period for counting annual financial statements. For US
government purposes, a fiscal year begins on October 1st of the previous
calender year and ends on September 30th of the corresponding calender
year. For example, FY 2012 goes from October 1st 2011 to September 30th
2012
ISS: International Space Station
Module: A large component that is attached to the main frame of the ISS
NASA: National Aeronautics and Space Administration
Payload: The amount in mass of cargo that a given rocket or spacecraft is
delivering to its destination
Spacecraft/Landing Craft (terms used interchangeably for our purposes): A
smaller vessel launched by a separate rocket which in turn is capable of
docking at the ISS and carrying the needed supplies

2011 HiMCM Team #2930
Page 6 of 53
Background Research:
As a group, we initially started out by just trying to understand what the
International Space Station (ISS) is, how it functions and all the “basics” that we
needed to understand before attacking this problem. We compiled a list of
guiding questions and answered them to acquaint ourselves with the problem
we were faced with.
Q: What is the ISS? What is its purpose? A: The ISS is a satellite in low Earth orbit, which normally houses six astronauts
in a zero gravity environment. It was established to help scientists determine the long-term effects of a zero gravity environment on the human body—so the astronauts are the main test subjects. The ISS is almost completely done with construction, with only one module left to deliver up to space, due to be done in 2012. The ISS was established in 1998, and is expected to remain in operation until 2020, and possibly even until 2018.
Q: What countries are involved with the ISS? Are they funding us (looking from
NASA’s perspective)? A: There are several countries involved with the ISS. Countries that are
contracted with the ISS include Japan, Russia, Denmark, Sweden, Norway, France, Germany, Italy, Netherlands, Belgium, Switzerland, Spain, Canada and the US. Brazil used to be apart of this, but is no longer affiliated with the ISS. These countries will not provide any additional funding for us.
Q: What is a “normal” mission? A: Soyuz missions are the Russian missions dealing with rotating astronauts,
usually three at a time every six months. These missions are primarily concerned with the maintenance of the ISS. Space shuttle missions are typically eight to fourteen days long, and are more concerned with spacewalks, specific repairs and the addition of modules for the space station. Space shuttle missions are run by the US only. Astronauts that are brought up to the ISS are always from one of the contracted countries, but they are usually American or Russian.
Q: How often does a space station need maintenance? What kind of
maintenance does a space station need? A: Whenever astronauts are delivered up to the ISS, they conduct their routine
maintenance duties. So there are routine check-ups every three months, when new astronauts are brought up to the ISS. However, aside from these general repairs, there are two irregular circumstances when urgent maintenance is required—software error and hardware malfunction. When there is software error, the ground control will fix it. When there is hardware malfunction, spacewalks are conducted. But either way, these costs are negligible in comparison to the overall scheme of things.

2011 HiMCM Team #2930
Page 7 of 53
Q: What is the “timeline” of the ISS? What is NASA’s current ISS plan? A: The ISS was built in 1998, and NASA intends to keep the ISS in operation
until at least 2020, possibly even 2028. They intend to use the ISS as a base for Mars expeditions in the future. The ISS is built by sending up additional modules built on Earth. These modules are typically assembled by various countries, but launched in the US. When the shuttles were decommissioned (due to safety reasons), all but one of the modules had already been attached to the ISS. This last module is produced and will be launched by Russia in 2012. This will complete the ISS.
Q: What is the ISS plan for the future? A: Because the space shuttles were decommissioned, NASA has looked to
commission private companies to supply them with spacecrafts to send up cargo and astronauts. NASA has commissioned two companies, Orbital Sciences and SpaceX, to send up payloads and astronauts for NASA in the period 2011-2015. There is no set plan after 2015. In response to a leaked email, Michael Griffin, OMB Officer, responded in a press conference, “We will take no action to preclude continued operation of the ISS past 2016.” In a statement released July 2011 by the Russian Space Agency, Russia and its partners plan to plunge the ISS into the ocean after 2020. Their rationale behind such a radical move is because they don’t want “space junk”.
From these questions, we decided to look at this model from a three-pronged
perspective. The first explored model will deal with NASA’s existing plan for the
ISS. The second explored model will deal with a business model, namely
privatization of transport to ISS and optimization of its cost. The third explored
model will deal with alternative approaches such as space elevators and space
planes. We will assess the efficiency of these models, and come up with a
summative 10-year plan, inclusive of costs, payloads and flight schedules.

2011 HiMCM Team #2930
Page 8 of 53
Part 1: Baseline Projections
Part 1A: Transforming Raw to Adjusted Data
We decided that the first logical step to take would be to see how the US is
appropriating their funds for the ISS. After researching, we obtained the data in
regard to the fiscal years of US. We decided that the best way to represent this
data was simply to graph it and observe a trend. The following tables and figures
represent these numbers.
Table 1.1: Raw US ISS Funding Data ($ million)
Fiscal Year Request Appropriated
1985 150 150
1986 230 205
1987 410 410
1988 767 425
1989 967 900
1990 2050 1750
1991 2430 1900
1992 2029 2029
1993 2250 2199
1994 2106 2106
1995 2113 2113
1996 2115 2144
1997 2149 2149
1998 2121 2441
1999 2270 2270
2000 2483 2323
2001 2115 2115
2002 2114 2093
2003 1839 1810
2004 2285 2085
2005 2412 2058
2006 1995 1972
2007 1894 1894
2008 1894 2209
2009 2060 2060
2010 2317 2317
2011 2780 2780

2011 HiMCM Team #2930
Page 9 of 53
Figure 1.1: Raw Space Station Funding v. Year
After looking at this scatter plot of data, we decided that the best fit would
probably be a logistic equation. This is because while other functions such as
cubic functions or other polynomials will be able to more accurately interpolate,
a logistic functions fits the logically expected overall trend; in which as the craft
nears completion, the maintenance costs will stabilize. This equation was
determined to be y2165
1 9626 e1.012 ( x 1980 )
through a regression. This model is
graphed in Figure 1.2, seen below.
Figure 1.2: Raw ISS Funding v. Fiscal Year (Logistics Curve)

2011 HiMCM Team #2930
Page 10 of 53
Because this is a logistic regression, there is no correlation “R-squared” value
available, and so we must rely on residuals and percentage error to determine
accuracy of this model.
Figure 1.3: Residual Graph of Raw Data
Figure 1.4: Percentage Error of Raw Data
We obtained residuals by subtracting the actual value from the predicted value,
and plotting that against time. For percentage error, we took the absolute value
of the residual, divided by the actual value, and multiplied by 100. By analyzing
these two graphs, we can see that because the residuals are randomly scattered,
that this is quite a good fit. The reason there is a high percentage error is because
of how a logistic model is formulated. A typical logistic model has to go through
the point (0, 0). However, because we shifted the graph 1980 units to the right,
the graph goes through (1980, 0). Therefore, in making that “curve” for the first
few points, it is likely that the equation underestimated funding costs for the
initial years of this project.

2011 HiMCM Team #2930
Page 11 of 53
The next step we took was to make adjustments to the data. We understood that
we could not just extrapolate off of the logistics model because the funds up to
this point include costs of launching modules, which the US no longer needs to
do, since the Russians are launching the last module in 2012 without US funds.
We researched all the modules that were sent up from US grounds, and
determined the total mass of these modules per fiscal year (See Appendix 1A).
Using the assumption given in the prompt that historically, transport to the ISS
using US shuttles costs about 1 lb = $5000 to $10,000, we subtracted the module
costs from the fiscal year fund. Upon further research, we found the cost of
development of these modules, and subtracted that value from the fiscal year
fund as well. The following tables and figures show these calculations.
Table 1.2: Modules Assembly and Development Data
Fiscal Year Appropriated ($mil) Cost of Module Development ($mil)
Mass of Modules (pounds)
1985 150 – – 1986 205 – – 1987 410 – – 1988 425 – – 1989 900 – – 1990 1750 – – 1991 1900 – – 1992 2029 – – 1993 2199 – – 1994 2106 – – 1995 2113 – – 1996 2144 – – 1997 2149 1766.3 0 1998 2441 1386.1 0 1999 2270 1055.5 25546 2000 2323 703.6 0 2001 2115 824.8 116012.6 2002 2093 437.1 33924 2003 1810 310.2 61864 2004 2085 153.5 0 2005 2058 78.1 5887.2 2006 1995 1972 34980 2007 1894 1894 66695 2008 1894 2209 105947.6 2009 2060 2060 44000 2010 2317 2317 61626.4 2011 2780 2780 43346.6

2011 HiMCM Team #2930
Page 12 of 53
The mathematical procedure to calculate the adjustment prices is as followed:
1) Appropriated Fund – Cost of Module Development – 5000Mass = Low Price
2) Appropriated Fund – Cost of Module Development – 10000Mass = High Price
Table 1.3: Adjusted Prices
Fiscal Year Adjusted price (1lb=$5000) Adjusted price (1lb=$10000)
1997 382.7 382.7
1998 1054.9 1054.9
1999 1011.5 1139.5
2000 1619.4 1619.4
2001 127.6 708.9
2002 1315.9 1485.9
2003 891.8 1195.8
2004 1931.5 1931.5
2005 1920.9 1950.4
2006 1489.4 1664.7
2007 1158.4 1492.6
2008 1106.3 1637.1
2009 1619 1839.5
2010 1699.4 2008.2
2011 2345.6 2562.8
*Note: we discounted all years previous to 1997 because costs did not exist at that time.
We decided to select the measure that 1 lb = $10,000 because upon further
research, this value is a closer estimate the actual value. The scatter plot of the
data is graphed below in Figure 1.5.
Figure 1.5: Adjusted ISS Fund v. Time

2011 HiMCM Team #2930
Page 13 of 53
We applied the logistic curve to this graph as well because of two reasons. First,
on a “naked eye” account, a logistic curve seems to fit the best. Second, because
thinking logically, there is no money invested in the beginning, and then there is
a period of exponential expansion before the funding levels out again. The
logistic regression equation is y1570
1 316 .5e0.3195 ( x 1980 )
.
Figure 1.6: Adjusted ISS Fund v. Time (Logistic Curve)
Once again, because this is a logistic regression, there is no correlation “R-
squared” value available. Therefore, we must rely on residuals and percentage
error to determine accuracy of this model.
Figure 1.7: Residual Graph of Adjusted Data

2011 HiMCM Team #2930
Page 14 of 53
Figure 1.8: Percentage Error of Adjusted Data
We followed the same procedure as above to derive the residual and percentage
error. Again, the residuals are randomly scattered, indicating a good fit. And in
terms of percentage error, there is a very obvious outlier during the fiscal year of
2001. The reason this outlier occurs in 2001 is because a lot of modules were
sent into space during that year (in comparison to other years), totaling up to
116012.6 pounds. This means that a lot of the funding from the government in
2001 went into constructing/launching modules in comparison to other years.
This point should therefore not be considered in observing the overall trend of
percentage error. Aside from that point, all the other years seem to have quite
low percentage errors, indicating that the logistic curve is once again, quite a
good fit for the data we calculated.
The reason we attempted this adjustment was to attempt modeling the amount
of money NASA spent on maintenance of the ISS. We believed this value could be
obtained by deducting values of things that would be unnecessary once the space
station was completed (i.e. construction, operations development, functionality
upgrades). However, that amount varied widely from year to year, suggesting
that rather than having a fixed amount for maintenance, NASA has a fixed budget
for the entire ISS. They appropriate money as they see fit. Therefore, this model
did not accurately estimate long-term costs of maintenance fees, which was what
we were attempting to model.
2011 HiMCM Team #2930
Page 15 of 53
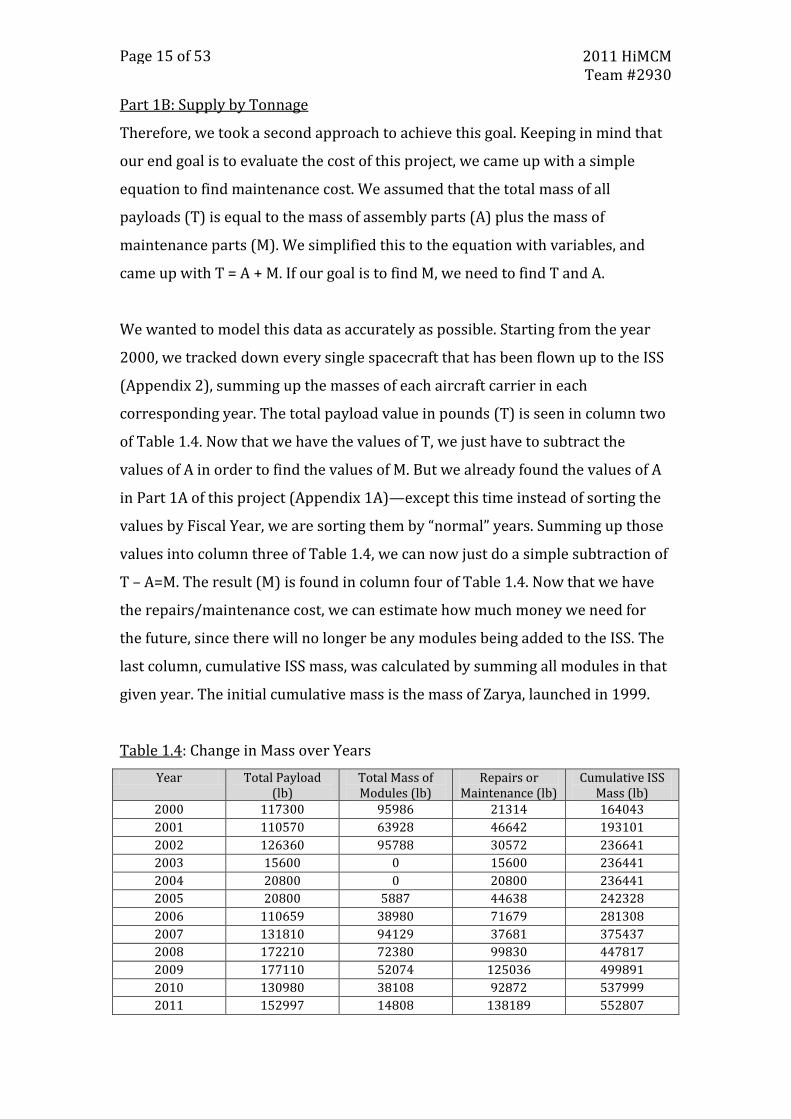
Part 1B: Supply by Tonnage
Therefore, we took a second approach to achieve this goal. Keeping in mind that
our end goal is to evaluate the cost of this project, we came up with a simple
equation to find maintenance cost. We assumed that the total mass of all
payloads (T) is equal to the mass of assembly parts (A) plus the mass of
maintenance parts (M). We simplified this to the equation with variables, and
came up with T = A + M. If our goal is to find M, we need to find T and A.
We wanted to model this data as accurately as possible. Starting from the year
2000, we tracked down every single spacecraft that has been flown up to the ISS
(Appendix 2), summing up the masses of each aircraft carrier in each
corresponding year. The total payload value in pounds (T) is seen in column two
of Table 1.4. Now that we have the values of T, we just have to subtract the
values of A in order to find the values of M. But we already found the values of A
in Part 1A of this project (Appendix 1A)—except this time instead of sorting the
values by Fiscal Year, we are sorting them by “normal” years. Summing up those
values into column three of Table 1.4, we can now just do a simple subtraction of
T – A=M. The result (M) is found in column four of Table 1.4. Now that we have
the repairs/maintenance cost, we can estimate how much money we need for
the future, since there will no longer be any modules being added to the ISS. The
last column, cumulative ISS mass, was calculated by summing all modules in that
given year. The initial cumulative mass is the mass of Zarya, launched in 1999.
Table 1.4: Change in Mass over Years
Year Total Payload (lb)
Total Mass of Modules (lb)
Repairs or Maintenance (lb)
Cumulative ISS Mass (lb)
2000 117300 95986 21314 164043
2001 110570 63928 46642 193101
2002 126360 95788 30572 236641
2003 15600 0 15600 236441
2004 20800 0 20800 236441
2005 20800 5887 44638 242328
2006 110659 38980 71679 281308
2007 131810 94129 37681 375437
2008 172210 72380 99830 447817
2009 177110 52074 125036 499891
2010 130980 38108 92872 537999
2011 152997 14808 138189 552807

2011 HiMCM Team #2930
Page 16 of 53
After collecting all that data, naturally we tried to find a model that would suit
the data. The scatter plot of the data, a comparison between time and
repair/maintenance mass is seen in Figure 1.9.
Figure 1.9: Maintenance Mass v. Time
The first thing we realize as we look at this scatter plot is that the maintenance
mass is steadily increasing over time. We attempted several regressions to the
model, and found that none of them were particularly good. The best correlation
value we had was the exponential model. But since we are attempting to
extrapolate data from this model, the exponential model is clearly not a viable
option. We also considered a linear model, but discovered that this is also not a
practical model because it is fairly safe assumption that maintenance cost will
remain fairly steady each year, since no more modules are being added to the
ISS. Therefore, we can logically assume that the best fit will be with a logistic
curve.
When we put the AutoFit for the logistic curve, the equation did not model our
data in the way we wanted at all (Figure 1.10). The equation that LoggerPro gave
us was y6044
1 1.198 e0.01275 ( x 2000 )
. This left us with an awkward vertical asymptote
in the year 2011, and an even more awkward negative horizontal asymptote,
implying we have negative supply requirements. This is obviously incorrect.

2011 HiMCM Team #2930
Page 17 of 53
Figure 1.10: Maintenance Mass v. Time (AutoFit Logistic Curve)
This left us with only one option—to manually adjust the variables of the logistic
curve, creating our own equation which we felt fit the data much better (Figure
1.11). Because we know that the ISS will complete construction by 2012,
maintenance costs should theoretically level out to some degree after that year.
With this thought in mind, the equation we found was y1.507
1 14 .04 e0.3737 ( x 2000 )
.
Figure 1.11: Maintenance Mass v. Time (Manual Logistic Curve)

2011 HiMCM Team #2930
Page 18 of 53
Figure 1.12: Residual Graph of Manual Logistic Fit
Figure 1.13: Percent Error of Manual Logistic Fit
We obtained residuals and percent error in the same method as Part 1A. By
analyzing these two graphs, we can see that because the residuals are randomly
scattered, that this is quite a good fit. The reason there is a high percentage error
is because of how a logistic model is formulated. A typical logistic model has to
go through the point (0, 0). However, because we shifted the graph 2000 units to
the right, the graph goes through (2000, 0). Therefore, in making that “curve” for
the first few points, it is likely that the equation underestimated a lot of the mass,
thus making the percent error for the first couple of points extremely high.
2011 HiMCM Team #2930
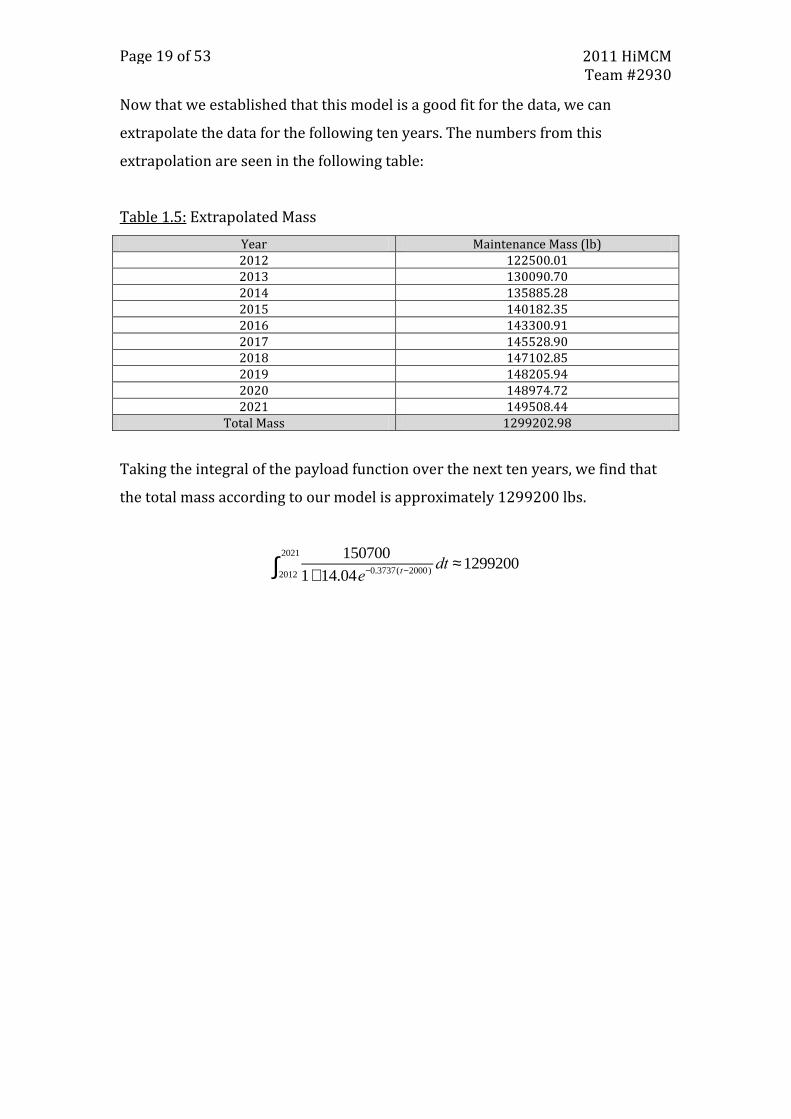
Page 19 of 53
Now that we established that this model is a good fit for the data, we can
extrapolate the data for the following ten years. The numbers from this
extrapolation are seen in the following table:
Table 1.5: Extrapolated Mass
Year Maintenance Mass (lb) 2012 122500.01 2013 130090.70 2014 135885.28 2015 140182.35 2016 143300.91 2017 145528.90 2018 147102.85 2019 148205.94 2020 148974.72 2021 149508.44
Total Mass 1299202.98
Taking the integral of the payload function over the next ten years, we find that
the total mass according to our model is approximately 1299200 lbs.
150700
1+14.04e-0.3737(t-2000)dt »1299200
2012
2021
ò

2011 HiMCM Team #2930
Page 20 of 53
Part 1C: Supply by Proportion
While we were calculating the supply by tonnage over time, we realized that it
might be more accurate to model the supply with respect to the percent
completed, rather than just using time passed. The most important factor we are
considering is how to effectively maintain the components of the ISS. In Part 1B,
we simply analyzed the data to form a function of time that modeled the data and
tried to extrapolate. However, we believe that alternatively, we can try to find
maintenance cost as a function of how much of the ISS has been completed. If we
model it this way, then we would get a constant value for the maintenance fee
after the last module is been added to the ISS in 2012.
Table 1.6: Maintenance Weight v. Proportion Completion
Proportion completion Maintenance Weight (lb) 0.29675 21314 0.34931 46642 0.42771 30572 0.42771 15600 0.42771 20800 0.43836 44638 0.50887 71679 0.67915 37681 0.81008 99830 0.90428 125036 0.97321 92872 1.00000 148189
We then graphed this data onto a scatter plot, seen in Figure 1.14.
Figure 1.14: Maintenance Weight v. Proportion Completion Scatter Plot

2011 HiMCM Team #2930
Page 21 of 53
We observe through the scatter plot that the general shape shows an increasing
trend. We also logically assume that after the ISS is complete, that the
maintenance cost should be consistent. Because we know that there is a built in
limit over time, the maintenance weight is just going to stabilize at whatever the
value is at proportion completion “1”. We fit a natural logarithm because the
weight appeared to increase at a decreasing weight. The equation derived using
regression is y 112800 86450 ln x .
Figure 1.15: Maintenance Weight v. Proportion Completion (Natural Logarithm)
In order to determine the accuracy of this model, we looked at the correlation
coefficient, residual plots and percent error. The correlation coefficient of this
model is 0.7359, which is quite accurate in terms of modeling “real life”
situations. The residual plot (seen in Figure 1.16) is randomly scattered, also
indicating a good fit.
Figure 1.16: Residual Graph of Maintenance Weight v. Proportion Completion

2011 HiMCM Team #2930
Page 22 of 53
We also used percent error to determine accuracy, as seen in Figure 1.17 below.
The reason that the first couple of points have such a high percent error is partly
because the point-values are really small. Percent error is the difference between
the predicted and the actual over the actual. Therefore, when the actual value is
extremely small, as seen in the first few cases, the same sort of residual values
will produce very high percent errors. But otherwise, the percent errors seem
quite low, also indicating a pretty good fit.
Figure 1.17: Percent Error of Maintenance Weight v. Proportion Completion
We used this regression because we wanted to determine an estimate of what
the weight is going to be at 100% completion without having to base it on a
single point (which is what Table 1.6 provides). Using this natural logarithmic
model, we conclude that when the ISS is completely finished, maintenance
weight should be approximately 112800 pounds. This is found by substituting
x=1 for the equation y 112800 86450 ln x .

2011 HiMCM Team #2930
Page 23 of 53
Part 1D: Supply by Combination (Tonnage and Proportion)
Now that we have established two different methods of obtaining maintenance
costs, we decided that we could try and find a weighted average between the two
models. We incorporated both models by writing them as a single multiple
regression function; one was multiplied by a constant “M” while the other was
multiplied by a constant “1–M”. The two values were then added together to
create our function.
In an attempt to find this optimal value “M”, we did a least square regression of
both models. However, when we did this, we got a value of “M” which was
greater than 1. This means that one of the functions had a negative weighting.
This also means that the long-term estimation was greater than either one of our
existing models. Although this function fit the data fairly well, it does not make
much sense. This function is modeled in Figure 1.18.
Figure 1.18: Combined Maintenance Weight v. Time

2011 HiMCM Team #2930
Page 24 of 53
Part 1E: State-funded Model
We decided to use the calculated data from Part 1B (Supply by Tonnage) because
the data was the most logically justifiable out of the three supply models. Also,
the data from Part 1B fit the expected long-term trends the most realistically.
This first model we created uses the assumption that after US space shuttles
were decommissioned, Russia is going to continue flying up maintenance parts
required to keep the ISS running. In Part 1A, we already concluded that the cost
per pound is $10,000. We apply this assumption to this extrapolated mass
calculated in Table 1.4, and came up with the costs for the following ten years.
Table 1.7: Extrapolated cost of State-funded Model
Year Maintenance Fees ($mill) 2012 1225 2013 1301 2014 1359 2015 1402 2016 1433 2017 1455 2018 1471 2019 1482 2020 1489 2021 1495
Total Cost 12992
Furthermore, using the same flight schedules, we found that the current system
for crew changes is that three out of the crew of six are switched out by Soyuz
shuttle every three months, for a total of twelve crew changes per year. While it
would undoubtedly be cheaper to require fewer astronauts to work longer shifts,
overexposure in zero gravity conditions will have unpredictable effects on the
astronaut’s physical health. It is best to leave the personnel schedule as is until
further data is collected, and even then to make only incremental changes.
We know that twelve astronauts are launched per year and the Russian
government is willing to pay $51 million for every US astronauts. Therefore, the
total annual cost of personnel changes will be $612 million per year, for a total of
$6.12 billion over the 2012-2021. Adding the costs for cargo transportation, this
totals $19.112 billion over that interval of time.

2011 HiMCM Team #2930
Page 25 of 53
Strengths and weaknesses
The main weakness in this model is that it is prohibitively expensive. Since cost
is our main consideration, this almost immediately rules out this model.
However, we still use it as a baseline comparison because out of all of the viable
options we have considered, this is the one that is most similar to the historical
approach.
In turn, a strength of this model is that it encourages international relations
between Russia and the USA. This approach is essentially financing the Russian
space program, which in turn runs the resupply of the day-to-day maintenance
needs of the ISS. As such, this would require large amounts of international
cooperation, and will facilitate future cooperation. In addition, the Russian Soyuz
has proven to be incredibly reliable, since this is the space rocket that the ISS has
been using since its launching. Moreover, the Soyuz had also been used by the
Soviet and then Russian space program since 1966. And it had also previously
supplied the Mir space station for its entire operative history, which is over ten
years. This would ensure our astronaut’s safety, and would also almost
guarantee that any given supply mission would succeed. Out of the forty-six
launches that have delivered supplies to the ISS, only one of them failed to
launch.
Figure 1.19: A Soyuz rocket
*Note: This picture is in the public domain because NASA originally published it, and NASA policy states that NASA material is not protected by copyright unless otherwise noted.

2011 HiMCM Team #2930
Page 26 of 53
Part 1F: Procurement costs
Aside from finding the maintenance cost (flying the missions), there is also the
cost of actually obtaining the supplies necessary to maintain the ISS, as well as
costs such as administration, training etc. We chose to estimate this cost by
taking the projection of the overall costs based on the logistic curve of the overall
budget and subtracted the projected maintenance cost to find the projection for
the remaining expenses of the NASA portion of ISS costs.
Table 1.8: Procurement Costs
Year Projected Budget Fee ($mill)
Projected Maintenance Fees
($mill)
Projected Procurement Cost
($mill) 2012 2165 1225 328 2013 2165 1301 252 2014 2165 1359 194 2015 2165 1402 151 2016 2165 1433 120 2017 2165 1455 98 2018 2165 1471 82 2019 2165 1482 71 2020 2165 1489 63 2021 2165 1495 58
Total Cost 21650 12992 1418 *Note: Projected Procurement Cost is calculated by subtracting Maintenance Fees and personnel change fees, which are constant at $612 million per year, from Budget Fees

2011 HiMCM Team #2930
Page 27 of 53
Part 2: Privatization Model
Part 2A: Finding the Right Brand
Since this entire problem is focusing on the retiring of the space shuttles, we
needed to find a suitable alternative to continue maintenance of the ISS. The
projection of Part 1B is based on the assumption that after the space shuttles
retire, the Russian Soyuz rockets would carry up the crew and cargo instead in
their Progress spacecraft, for a cost of approximately $10,000/pound. However,
we believe that it is possible to use charter flights to bring up the crew and cargo
for a much cheaper price, thereby lowering the total cost significantly. NASA
thought the same way, when faced with this same predicament.
When NASA looked into commercializing these crew and cargo flights, they ran a
program called the Commercial Orbital Transportation Services (COTS) in an
attempt to coordinate private companies interested in supplying spacecraft.
Instead of using government-operated vehicles, the proposed spacecraft is
supposed to be fully owned and financed by the private companies
commissioned by NASA. The private companies are not bound to the US
government—they are also allowed to serve commercial customers.
In the attempt to find the most suitable private company, NASA conducted a
competition that tested in four categories:
1) External unpressured cargo delivery and disposal
2) Internal pressurized cargo delivery and disposal
3) Internal pressurized cargo delivery, return and recovery
4) Crew Transportation
There were two rounds to NASA’s selections. In their first round in 2006, NASA
selected six semi-finalists, finally announcing that SpaceX and RpK had won
Phase I of the COTS program. Space X’s spacecraft was the Falcon series and RpK
was the K-1 rocket. However, because RpK did not raise sufficient funds by the
deadline set by NASA, NASA terminated this agreement.

2011 HiMCM Team #2930
Page 28 of 53
NASA needed a second company to assist their commercialization of flights, and
so they held another round of competitions. Several other brands jumped onto
this opportunity in November 2007. Although NASA did not promise financial
support, they agreed to share information to assist the development process of
these rockets. Orbital Sciences Corporation won the second round with their
Cygnus spacecraft, including the Taurus launchers.
With this COTS test in mind, we also compiled a list of potential rockets, as seen
in Table 2.1. We looked at all the companies that NASA considered and took the
“best of the best” out of those space rockets. In an attempt to decide which
vehicle best suited our needs, we decided that the deciding factor would be cost
per pound. In order to find this ratio, we needed to know the different payloads
and launch prices of each vehicle, which we compiled into column two and three
of Table 2.1.
Table 2.1: Potential Competitors
Launch Vehicle Payloads (lbs) Launch Price ($mill) Cost per Pound ($) Falcon 9 23050 59.5 2436
Falcon Heavy 117000 125 1068 Taurus II 12650 N/A N/A
Delta IV (Heavy) 49940 170 3404 K-1 4400 17 3864
Atlas V 551 4411 192 4353 Athena II 4520 26 5752
*Note: Taurus II did not release their data for the launch price.
Based off of our compiled list, we see the Falcon series made by SpaceX is clearly
the best choice out of the data we have. We assume that because NASA chose
Orbital Sciences Corporation (maker of Taurus II), that that rocket is also a
leading choice in terms of cost efficiency. However, the spokesperson of Orbital
Sciences Corporation, Pieczynski, refused to publically announce the launch
price of his rocket, stating only that it would be “quite a bit south” of $100
million. As we do not have enough data, we will not consider this rocket, and will
use the Falcon series instead.

2011 HiMCM Team #2930
Page 29 of 53
Part 2B: Finding Landing Craft Efficiency
SpaceX, the company that created the Falcon series, is currently designing the
Falcon Heavy. However, their earlier Falcon 9 design is already the most cost
efficient choice available, based on Table 2.1. The Falcon Heavy is not due to be
released until 2013, and they have not designed a landing craft for it yet either.
Therefore, we will assume the use of the Falcon 9 for all intensive purposes. The
Falcon 9’s Dragon landing craft carries 13,228 pounds, which is included in the
launch price. That gives a final cost efficiency of $4498/pounds.
If we use the baseline model that we created in Part 1B, we can apply this new
cost per pound ratio to the extrapolated mass we found in Table 1.5. Using the
same projected supply requirements by tonnage but the new cost efficiency ratio
we can calculate a new projection for cargo transportation costs for the Falcon 9
rocket instead of the Soyuz.
Table 2.2: Extrapolated Costs of Privatization
Year Maintenance Fees ($mill) 2012 551 2013 585 2014 611 2015 631 2016 645 2017 655 2018 662 2019 667 2020 670 2021 673
Total Cost 5891
Similarly, if we calculate the costs of crew transportation using the SpaceX
Dragon instead of the Russian Progress, the maximum crew change per flight
remains 3, which facilitates continued use of the same schedule, however launch
costs are reduced to $59.5 million, giving an average cost of just $19.8 million
per seat. However, since the manned version of the SpaceX Dragon will only be
completed in the beginning of 2014, we will continue to use Soyuz flights until
then.

2011 HiMCM Team #2930
Page 30 of 53
Using this revised cost for the 12 crew-changes per year, this requires $612
million per year for the years 2012-2013, and $238 million per year for all crew
changes from 2014-onwards, or $3.128 billion for the entire period. Adding this
to the costs of cargo transportation gives $9.019 billion dollars from 2012-2021,
saving $10.093 billion over the interval, or cutting costs by 52.8%. These amount
to quite dramatic savings.
Strengths and Weaknesses
One of the main weaknesses of this approach is that only seeks to improve the
efficiency of cargo transportation, and makes no changes to the tonnage of cargo,
the scheduling of launches or other factors which could have potentially
enormous inefficiencies hidden in the setup. However, this is almost inevitable,
as there is simply not enough data to go on in order to optimization of specific
needs of the astronauts, the science program and the station itself. The most
detailed data we have been able to find is only the tonnage of supplies going to
the space station, and even then we have had to separate out component mass to
find the tonnage of routine everyday supplies that are consumed by the station.
We have not been able to find the specific supplies that comprise these
shipments, and so are unable to tell whether superfluous, wasteful, or overly
expensive supplies are being sent and thus have been unable to streamline this
process.
Another weakness, also one related to data, is that we have been unable to find
whether the manned variant of our favored Dragon landing craft can carry cargo
as well; in the absence of data we have assumed that it carries only negligible
amounts of the astronaut’s personal goods like the Progress does, however for
all we know our 13,228 pound figure is for manned models, and unmanned
models can carry even more, leading to tremendous amounts of wasted capacity.
The most obvious strength in this model is that it is significantly cheaper than
the baseline model in using Soyuz rockets. This represents huge savings in
money, which is what we are main consideration when deciding what model to
use.

2011 HiMCM Team #2930
Page 31 of 53
A more “hidden” strength of this approach would be that private charter models
are flexible because it is not difficult to switch between different charter
companies. NASA seems to have noticed this, because of the two companies they
chose (SpaceX and Orbital Sciences Corporation), SpaceX was by far the most
cost efficient of the choices, while Orbital Sciences has a long history of launching
satellites for commercial or military purposes, which means it’s reliable.

2011 HiMCM Team #2930
Page 32 of 53
Part 3: Experimental Solutions
Part 3A: Space Elevators
A space elevator is literally an elevator that is able to take a payload up to space.
We looked into the space elevator, because we saw it as a very low-cost
possibility. In our initial stages of research, we saw that upon completion of the
space elevator, price of taking payload up to space could be as low as
$100/pound, or perhaps even lower.
A typical space elevator would require several parts:
1) A base anchoring the space elevator to earth
2) A single length of extremely strong material, able to support its own
weight over an extremely long distance
3) A counterweight at the top of the space elevator
4) A “climber” that is able to bring the payload up the length of the wire,
essentially the “elevator”
When people say “space elevator”, they are usually referring to a structure that
reaches the Geo-stationary Earth Orbit, which would include a 40,000km long
cord. However, in terms of modern technology, this is not physically possible.
The closest we have gotten to a space elevator of this type is a 400g payload
being carried up a 1km cable in 3 minutes and 48 seconds. This is clearly
nowhere near the payload or speed we need to maintain the ISS.
The only materials strong enough to create such a cord (the second requirement)
that humans have discovered are carbon nanotubes. The strongest nanotubes in
existence, while not strong enough to build a 40,000km long cable, is strong
enough to build a 1,000km long cable. This is more than enough for us to build a
space elevator to reach the ISS.
The ISS is located in low Earth orbit, slightly less than 400km above Earth’s
mean sea level. Because of counteracting forces, if we want to bring something a
certain payload up the space elevator to a certain distance “x”, the length of the
cable required is going to be at least “2x”, as there must be a counterweight at

2011 HiMCM Team #2930
Page 33 of 53
the top of the cable. This means that a cord is physically feasible to construct
with the technology available to us today.
We then seek to endeavor whether or not building a space elevator will result in
a more efficient plan than using space rockets to maintain the ISS. We found
material cost statistics of creating such a space elevator (from Earth to the ISS). If
this cost is less than all plans we previously modeled, we will then explore how
much we can reduce our expenditure by.
In order to find total cost of this specific space elevator, we realized that we
needed to find the cost of several components to create a space elevator:
1) Carbon nanotubes (to create the cord)
2) Base (on Earth)
3) Climber (“elevator”)
4) Cost of assembly
Figure 3.1: Space Elevator Diagram
*Note: This picture is in the public domain because NASA originally published it, and NASA policy states that NASA material is not protected by copyright unless otherwise noted.
We realized that the cost of the base and the climber was constant, so that could
be done later. The primary concern in building such a space elevator dealt with
the construction of the carbon nanotube cord.

2011 HiMCM Team #2930
Page 34 of 53
In order to find the cost of such a cord, we needed to find variables certain
commonly understood equations, and collect data for the corresponding
variables, as seen in Table 3.1.
Volume * Radius2* Height
DensityMass
Volume
TotalCostCost
Mass* Mass
Table 3.1: Data for Calculation for Cost of Space Elevator
Cost of industrial nanotubes per gram $100 Radius of carbon nanotubes required 0.3175 cm Density of carbon nanotubes 1.33g/cm3 Length of space elevator 1000 km
We then plugged in the variables and came up with the total cost of the carbon
nanotube cord:
V = pr2h = p (0.3175cm)2(1000km)*100000cm
1km= 3.167 *107cm3
m =V * r = 3.167 *107cm3 *1.33g
1cm3= 4.21*107g
P = 4.21*107g*$100
1g= 4.21*109
We see here that total cost of creating just the carbon nanotube cord will cost
$4.21 billion. We decided to stop investigating this option because it is already
more expensive than our Privatization model, seen in Part 2 of this paper.
In addition, construction time is not instant. Various figures have shown that
such a project would a minimum of ten years to complete. In order to recuperate
losses incurred by this project, the construction time needs to be one to two
years. Thus, we conclude that while such an elevator is feasible and may be a
great alternative the long run, it is not a possibility for a ten-year plan.

2011 HiMCM Team #2930
Page 35 of 53
Part 3B: Spaceplanes
Spaceplanes are vehicles that can fly in both orbital height (low Earth orbit) and
suborbital heights. They are modeled closely after airplanes that we are all
familiar with. This means that they have to be able to land, thus being reusable.
Upon initial research, we realized that this would be a low-cost alternative if it
were feasible. Thus, we decided to look into its feasibility.
The space shuttle is the most commonly cited example of a spaceplane. Space
shuttles took off vertically and land horizontally back on Earth, and were reused.
Now that space shuttles are obsolete, private companies have begun to invest
into spaceplanes that have the ability to enter orbit.
There are two major privately designed spaceplanes to date, one is manned and
one is unmanned. The manned spaceplane is called SpaceShipOne, which
attained maximum height of 112.4 km. However, if we are to send this to the ISS,
which is 400km in space, this spaceplane cannot reach the ISS. The unmanned
spaceplane is called Boeing X-37, which has actually been able to enter low Earth
orbit. Although this spaceplane has the ability to reach the ISS, because
spaceplane is very small, weighing only 11,000 pounds with virtually no space to
carry payload, this is also not a reasonable option to carry cargo up to the ISS.
Therefore, we reasonably assumed that spaceplanes are also not viable options.

2011 HiMCM Team #2930
Page 36 of 53
Part 4: The 10-Year Plan
Part 4A: Cost
After all the approaches we attempted in this paper, we found that the most
efficient cost-saving method was to switch away from the Russian-run Soyuz
cargo and personnel change flights, and to instead charter flights from private
companies. Looking at potential service providers in both the personnel changes
and cargo deliveries, we found that SpaceX’s Dragon spacecraft, delivered by the
Falcon 9, was the most cost effective option in both categories.
The following table (Table 4.1) compares the respective maintenance costs of
Russian run Soyuz space rockets and private run Falcon 9 space rockets, as well
as the savings from switching.
Table 4.1: Comparison between Soyuz and Falcon 9 Maintenance Fees
Year Soyuz Maintenance Fees ($mill)
Falcon 9 Maintenance Fees ($mill)
Savings ($mill)
2012 1225 551 674 2013 1301 585 716 2014 1359 611 748 2015 1402 631 771 2016 1433 645 788 2017 1455 655 800 2018 1471 662 809 2019 1482 667 815 2020 1489 670 819 2021 1495 673 822
Total Cost 12992 5891 7101 Total (With Personnel
Costs) 19112 9019 10093
*Note: The first two years for the Falcon 9 maintenance fees are still using Soyuz to carry personnel because the Falcon 9 manned spacecraft is still unavailable.
Since the projected procurement cost is all of the costs besides maintenance
costs, and we couldn’t find enough data on its composition to optimize it, we just
used the same projections from the baseline model, and added it to the
privatized model to find the final total NASA budget per year of the ISS. We had
to consider that SpaceX manned flights were not available until 2014, so we used
Soyuz flights until then, which still gave us pretty substantial savings.

2011 HiMCM Team #2930
Page 37 of 53
Table 4.2: Total ISS Expenses
Year Unmanned Maintenance Fees ($mill)
Manned Maintenance Fees ($mill)
Projected Procurement Cost ($mill)
Projected Total Cost ($mill)
2012 551 612 328 1491 2013 585 612 252 1449 2014 611 238 194 1043 2015 631 238 151 1020 2016 645 238 120 1003 2017 655 238 98 991 2018 662 238 82 982 2019 667 238 71 976 2020 670 238 63 971 2021 673 238 58 969
Total Cost 5891 3128 1418 10437
Overall, the total projected costs over the ten-year period from 2012 to 2021
have been reduced from $21.65 billion to $10.437 billion. This represents total
savings of $11.213 billion, which is 51.8% of the total budget. By implementing
the privatization model, we managed to save considerable amounts of money.

2011 HiMCM Team #2930
Page 38 of 53
Part 4B: Payload
Using our previously calculated values for the annual tonnage of necessary
supplies, we found that the annual supply requirements. Dividing these values by
the SpaceX Dragon’s tonnage capacity and then rounding to the nearest whole
number, we get that the annual number of required missions, as follows:
Table 4.3: Total Payload and Annual Flight Breakdown
Year Maintenance Weight (lb) Number of flights 2012 122500 9 2013 130091 10 2014 135885 10 2015 140182 11 2016 143301 11 2017 145529 11 2018 147103 11 2019 148206 11 2020 148975 11 2021 149508 11 Total 1299203 106

2011 HiMCM Team #2930
Page 39 of 53
Part 4C: Flight Schedule
In order to develop a comprehensive flight schedule, we needed to analyze the
amount of payload needed per year and optimal conditions for launching. The
most important factor dealing with optimal launching conditions is that the ISS
has to be directly above the launching facility, which is located at Cape Canaveral,
FL. This launch facility is called Cape Canaveral Air-force Station, which has the
coordinates of 28˚ 29’ N and 80˚ 34’ W. We selected this launch facility because it
is the ISS’s main launching facility.
The space shuttle must be launched within five minutes of the time when the ISS
is directly above (in the same plane with) the Cape Canaveral Air-force Station to
ensure rendezvous with the ISS. In order to determine how often this incidence
occurs, we need to consider the rotation of the Earth and the rotation speed of
Earth. The rotation speed of the earth is going to have the ratio of 1
circumference per day. The ISS rotates relative to Earth, since it is in orbit with
Earth. By dividing the circumference of the Earth (40,000km) by the rotational
speed of Earth (1665 km/hr), we find that the ISS is going to pass over the same
points of Earth’s surface about every 24.02 hours. (40 ,000 km
1665 km / hr24 .02 hr )
We also found that one of the main considerations that NASA took when it was
considering flight schedules was that it needed to make sure that sun beta angles
(angle of the sun relative to the plane of incidence) must be less than 60˚,
otherwise the space craft will be unable to land due to visibility reasons.
However, we were not able to find any sources that provided any information
with regard in how to actually calculate these values, and therefore we did not
consider this variable.
Other variables for launching dates include weather, lighting, time of day and
orbit inclination. Because these factors, especially weather, are inherently
unpredictable, the schedule needs to be flexible (as in real life).

2011 HiMCM Team #2930
Page 40 of 53
We also need to consider temperature of the launching site. In 2003, the
temperature of the launch site was below 4˚C, which is the normal minimum for
spaceship launches. This was one of the contributing factors to Columbia’s
subsequent disintegration, and the death of the onboard crewmembers. As such,
care must be taken to make sure that the temperature at the launch site is safely
above 4˚C. If the temperature is below 4˚C, the launch must be rescheduled.
Next, we looked at the launch windows of NASA’s past plans for STS-133 and
STS-135, which are space shuttles sent from Cape Canaveral Air Force Station to
the ISS in 2011. The data given to us tells us when the window was open, in
plane and closed. This window changes every day by a slight amount. We want to
find the difference of in plane time for every day in February and July of these
two space shuttles. We chose STS-133 and STS-135 launched in February and
July respectively to get a good idea of the general trend because these months
are the most extreme months in a year.
Table 4.4: Change in In-Plane Time for STS-133
STS-133 STS-135 -25:43 -22:34 -22:33 -22:32 -25:42 -25:42 -22:32 -22:32 -25:42 -25:43 -22:32 -22:33 -25:41 -22:32 -22:33 -25:43 -25:41 -22:33
-22:31 -25:44 -22:33 -25:41 -22:34 -22:32
*Note: See Appendix 4 and 5 for Launch Windows used
Since there were gaps in the data for STS-135, we looked more closely at STS-
133. We noticed that the in-plane time would shift back about 25 minutes and 42
seconds and 22 minutes and 33 seconds on alternating days. We used this to
determine our launch times. See Appendix 6.

2011 HiMCM Team #2930
Page 41 of 53
Table 4.5: Flight Schedule
Spacecraft Man or Unmanned Launch Date Launch Time
Soyuz 3P 01/01/2012 11:37:26 Falcon 9 Unmanned 02/10/2012 19:32:06
Falcon 9 Unmanned 03/21/2012 03:50:54 Falcon 9 Unmanned 04/30/2012 11:21:26
Soyuz 3P 06/09/2012 19:16:06 Falcon 9 Unmanned 07/19/2012 03:10:46
Falcon 9 Unmanned 08/28/2012 11:05:26 Falcon 9 Unmanned 10/07/2012 19:00:06
Soyuz 3P 11/16/2012 02:54:46 Soyuz 3P 01/01/2013 08:42:44
Falcon 9 Unmanned 02/06/2013 18:13:56 Falcon 9 Unmanned 03/14/2013 03:45:08
Falcon 9 Unmanned 04/19/2013 13:16:20 Soyuz 3P 05/25/2013 22:47:42
Falcon 9 Unmanned 06/30/2013 08:18:44
Falcon 9 Unmanned 08/05/2013 17:49:56 Falcon 9 Unmanned 09/10/2013 03:20:08
Soyuz 3P 10/16/2013 12:52:20 Falcon 9 Unmanned 11/21/2013 22:23:32
Falcon 9 3P 01/01/2014 05:48:02 Falcon 9 Unmanned 02/06/2014 15:19:14
Falcon 9 Unmanned 03/14/2014 00:15:26 Falcon 9 Unmanned 04/19/2014 10:21:38
Falcon 9 3P 05/25/2014 19:52:20 Falcon 9 Unmanned 06/30/2014 05:24:02
Falcon 9 Unmanned 08/05/2014 14:55:14 Falcon 9 Unmanned 09/10/2014 00:26:26
Falcon 9 3P 10/16/2014 09:57:38 Falcon 9 Unmanned 11/21/2014 19:28:50
Falcon 9 3P 01/01/2015 02:53:20
Falcon 9 Unmanned 02/03/2015 13:36:56 Falcon 9 Unmanned 03/08/2015 00:20:32
Falcon 9 Unmanned 04/10/2015 11:04:08 Falcon 9 3P 05/13/2015 21:47:44
Falcon 9 Unmanned 06/15/2015 08:31:20 Falcon 9 Unmanned 07/18/2015 19:14:56
Falcon 9 Unmanned 08/20/2015 05:58:32 Falcon 9 3P 09/28/2015 16:42:08
Falcon 9 Unmanned 10/25/2015 03:25:44 Falcon 9 Unmanned 11/27/2015 14:09:20
Falcon 9 3P 01/01/2016 23:58:38 Falcon 9 Unmanned 02/03/2016 10:42:14
Falcon 9 Unmanned 03/08/2016 21:01:42 Falcon 9 Unmanned 04/10/2016 07:45:18
Falcon 9 3P 05/13/2016 18:28:54 Falcon 9 Unmanned 06/15/2016 05:12:30
Falcon 9 Unmanned 07/18/2016 15:56:06
Falcon 9 Unmanned 08/20/2016 02:39:42 Falcon 9 3P 09/28/2016 10:58:30
Falcon 9 Unmanned 10/25/2016 00:06:54 Falcon 9 Unmanned 11/27/2016 10:50:30
Falcon 9 3P 01/01/2017 21:03:56 Falcon 9 Unmanned 02/03/2017 07:47:32

2011 HiMCM Team #2930
Page 42 of 53
Falcon 9 Unmanned 03/08/2017 18:31:08
Falcon 9 Unmanned 04/10/2017 05:14:44 Falcon 9 3P 05/13/2017 15:58:20
Falcon 9 Unmanned 06/15/2017 02:41:56 Falcon 9 Unmanned 07/18/2017 13:25:32
Falcon 9 Unmanned 08/20/2017 00:09:08 Falcon 9 3P 09/28/2017 08:27:56
Falcon 9 Unmanned 10/25/2017 21:36:20 Falcon 9 Unmanned 11/27/2017 08:19:56
Falcon 9 3P 01/01/2018 18:09:14 Falcon 9 Unmanned 02/03/2018 04:52:50
Falcon 9 Unmanned 03/08/2018 15:36:26
Falcon 9 Unmanned 04/10/2018 02:20:02 Falcon 9 3P 05/13/2018 13:03:38
Falcon 9 Unmanned 06/15/2018 23:47:14 Falcon 9 Unmanned 07/18/2018 10:30:50
Falcon 9 Unmanned 08/20/2018 21:14:26 Falcon 9 3P 09/28/2018 05:33:14
Falcon 9 Unmanned 10/25/2018 18:41:38 Falcon 9 Unmanned 11/27/2018 05:25:14
Falcon 9 3P 01/01/2019 15:14:32 Falcon 9 Unmanned 02/03/2019 01:58:08
Falcon 9 Unmanned 03/08/2019 12:41:44 Falcon 9 Unmanned 04/10/2019 23:25:20
Falcon 9 3P 05/13/2019 10:08:56 Falcon 9 Unmanned 06/15/2019 20:52:32
Falcon 9 Unmanned 07/18/2019 07:36:08
Falcon 9 Unmanned 08/20/2019 18:19:44 Falcon 9 3P 09/28/2019 02:38:32
Falcon 9 Unmanned 10/25/2019 15:46:56 Falcon 9 Unmanned 11/27/2019 02:30:32
Falcon 9 3P 01/01/2020 12:19:50 Falcon 9 Unmanned 02/03/2020 23:03:26
Falcon 9 Unmanned 03/08/2020 09:22:54 Falcon 9 Unmanned 04/10/2020 20:06:30
Falcon 9 3P 05/13/2020 06:50:06 Falcon 9 Unmanned 06/15/2020 17:53:42
Falcon 9 Unmanned 07/18/2020 04:17:18 Falcon 9 Unmanned 08/20/2020 15:00:54
Falcon 9 3P 09/28/2020 23:19:42 Falcon 9 Unmanned 10/25/2020 12:28:06
Falcon 9 Unmanned 11/27/2020 23:11:42
Falcon 9 3P 01/01/2021 09:25:08 Falcon 9 Unmanned 02/03/2021 20:08:44
Falcon 9 Unmanned 03/08/2021 06:52:20 Falcon 9 Unmanned 04/10/2021 17:35:56
Falcon 9 3P 05/13/2021 04:19:32 Falcon 9 Unmanned 06/15/2021 15:03:08
Falcon 9 Unmanned 07/18/2021 01:46:44 Falcon 9 Unmanned 08/20/2021 12:30:20
Falcon 9 3P 09/28/2021 20:49:08 Falcon 9 Unmanned 10/25/2021 09:57:32
Falcon 9 Unmanned 11/27/2021 20:41:08

2011 HiMCM Team #2930
Page 43 of 53
Appendix 1A: List of Modules Added to ISS
Date Launched Corresponding Fiscal Year
Spacecraft Mass (kg)
1998/11/20 1999 Zarya 19323 1998/12/04 1999 Unity
PMA-1 & PMA-2 11612
2000/10/11 2001 Z1 Truss PMA-3
8755
2000/11/30 2001 P6 Truss Solar Arrays
15824
2001/02/07 2001 Destiny 14515 2001/03/08 2001 ESP-1 7851 2001/04/19 2001 Canadarm2 4899 2001/07/12 2001 Quest 6064 2001/09/14 2001 Pirs 3580 2002/04/08 2002 S0 Truss 13970 2002/06/05 2002 Mobile Base System 1450 2002/10/07 2003 S1 Truss 14120 2002/11/23 2003 P1 Truss 14000 2005/07/26 2005 ESP-2 2676 2006/09/09 2006 P3/P4 Truss
Solar Arrays 15900
2006/12/09 2007 P5 Truss 1818 2007/06/08 2007 S5 Truss
ESP-3 12598
2007/10/23 2008 Harmony P6 Truss (Relocation)
14288
2008/02/07 2008 Columbus 12800 2008/03/11 2008 Dextre
ELM-PS 4200
2008/05/31 2008 JEM-PM 15900 2008/05/31 2008 JEM-RMS 970 2009/03/15 2009 S6 Truss
Solar Arrays 15900
2009/07/15 2009 JEM-EF 4100 2009/11/10 2010 Poisk 3670 2009/11/16 2010 ExPRESS Logistics
Carrier 1&2 8890
2010/02/08 2010 Cupola 1800 2010/02/08 2010 Tranquility 12247 2010/05/14 2010 Rassvet 5075 2011/02/24 2011 Leonardo 4082 2011/02/24 2011 ExPRESS Logistics
Carrier 4 4445
2011/05/16 2011 AMS-02 6731 2011/05/16 2011 ExPRESS Logistics
Carrier 3 4445
*Note: We only took the data from the spacecrafts that left from the US because we are subtracting the launching data from the fiscal year funds. Thus, we do not need to consider all the Russian spacecrafts **Note: Dextre mass is already accounted for in the Canadarm 2 launch

2011 HiMCM Team #2930
Page 44 of 53
Appendix 1B: ISS Basic Configuration Visual (As of January 2007)
Source: http://www.nasa.gov/images/content/166624main_iss_config_012007.jpg

2011 HiMCM Team #2930
Page 45 of 53
Appendix 2: List of Payloads of All Non-Soyuz ISS Missions
Launch Year Spacecraft/Mission (Unmanned or Manned)
Payload (lbs)
2000 Zvezda ISS-1R (U) 42000 2000 ISS-1P (U) 5200 2000 ISS-2P (U) 5200 2000 STS-101 (M) 3970 2000 STS-106 (M) 22530 2000 STS-92 (M) 2970 2000 STS-97 (M) 17430 2001 ISS-3P (U) 5200 2001 ISS-4P (U) 5200 2001 ISS-5P (U) 5200 2001 Pirs ISS-4R (U) 7900 2001 STS-98 (M) 32000 2001 STS-102 (M) 12700 2001 STS-100 (M) 10800 2001 STS-104 (M) 18170 2001 STS-105 (M) 20000 2001 STS-108 (M) 9000 2002 ISS-7P (U) 5200 2002 ISS-8P (U) 5200 2002 ISS-9P (U) 5200 2002 STS-110 (M) 28950 2002 STS-111 (M) 26580 2002 STS-112 (M) 27720 2002 STS-113 (M) 27510 2003 ISS-10P (U) 5200 2003 ISS-11P (U) 5200 2003 ISS-12P (U) 5200 2004 ISS-13P (U) 5200 2004 ISS-14P (U) 5200 2004 ISS-15P (U) 5200 2004 ISS-16P (U) 5200 2005 ISS-17P (U) 5200 2005 ISS-18P (U) 5200 2005 ISS-19P (U) 5200 2005 ISS-20P (U) 5200 2005 STS-114 (M) 29725 2006 ISS-21P (U) 5200 2006 ISS-22P (U) 5200 2006 ISS-23P (U) 5200 2006 STS-121 (M) 34885 2006 STS-115 (M) 32174 2006 STS-116 (M) 28000 2007 ISS-24P (U) 5200 2007 ISS-25P (U) 5200 2007 ISS-26P (U) 5200 2007 ISS-27P (U) 5200 2007 STS-117 (M) 42070 2007 STS-118 (M) 30940 2007 STS-120 (M) 38000 2008 ISS-28P (U) 5200 2008 ISS-ATV1 (U) 5060

2011 HiMCM Team #2930
Page 46 of 53
2008 ISS-29P (U) 5200 2008 ISS-30P (U) 5200 2008 ISS-31P (U) 5200 2008 STS-122 (M) 38160 2008 STS-123 (M) 37290 2008 STS-124 (M) 32600 2008 STS-126 (M) 38300 2009 ISS-32P (U) 5200 2009 ISS-33P (U) 5200 2009 ISS-34P (U) 5200 2009 ISS-HTV1 (U) 9900 2009 ISS-35P (U) 5200 2009 Poisk ISS-5R (U) 6200 2009 STS-119 (M) 37380 2009 STS-127 (M) 30080 2009 STS-128 (M) 37420 2009 STS-129 (M) 35330 2010 ISS-36P (U) 5200 2010 ISS-37P (U) 5200 2010 ISS-38P (U) 5200 2010 ISS-39P (U) 5200 2010 ISS-40P (U) 5200 2010 STS-130 (M) 39010 2010 STS-131 (M) 33800 2010 STS-132 (M) 32170 2011 ISS-HTV2 (U) 11685 2011 ISS-41P (U) 5200 2011 ISS-ATV2 (U) 15620 2011 ISS-42P (U) 5200 2011 ISS-43P (U) 5200 2011 ISS-44P (U) 5200 2011 ISS-45P (U) 5200 2011 STS-133 (M) 36514 2011 STS-134 (M) 34760 2011 STS-135 (M) 28418
*Note: Soyuz missions are excluded because it only has a payload of 220 pounds, making its payload comparatively negligible ** Note: After the Columbia crash in 2003, the US space shuttle program was put on hold for two years, canceling all its manned flights.

2011 HiMCM Team #2930
Page 47 of 53
Appendix 3: Flight Times of Soyuz Missions
Spacecraft Launch Time Docking Time Flight Time (Launch-
Docking) (min)
ISS-1P 6/8/2000 18:26:00 8/8/2000 20:12:00 2986
ISS-2P 11/16/2000 1:32:00 11/18/2000 3:47:00 3039
ISS-3P 2/26/2001 8:09:00 2/28/2001 9:50:00 2981
ISS-4P 5/20/2001 22:32:00 5/23/2001 0:24:00 2992
ISS-5P 8/21/2001 9:24:00 8/23/2001 9:51:00 2907
ISS-4R 9/14/2001 22:35:00 9/17/2001 1:05:00 3030
ISS-6P 11/26/2001
18:24:00 11/28/2001
19:43:00 2959
ISS-7P 3/21/2002 20:13:00 3/24/2002 20:57:00 4364
ISS-8P 6/26/2002 5:36:00 6/29/2002 6:23:00 4367
ISS-9P 9/25/2002 16:58:00 9/29/2002 17:00:00 5762
SS-10P 2/2/2003 12:59:00 2/4/2003 14:49:00 2990
ISS-11P 6/8/2003 10:34:00 6/11/2003 11:15:00 4361
ISS-12P 8/29/2003 1:48:00 8/31/2003 3:40:00 2992
ISS-13P 1/29/2004 11:58:00 1/31/2004 13:13:00 2955
ISS-14P 5/25/2004 12:34:00 5/27/2004 13:54:00 2960
ISS-15P 8/11/2004 5:03:00 8/14/2004 5:03:00 2880
ISS-16P 12/23/2004
22:19:00 12/25/2004
23:58:00 2979
ISS-17P 2/28/2005 19:09:00 3/2/2005 19:10:00 2881
ISS-18P 6/16/2005 23:09:00 6/19/2005 0:45:00 2976
ISS-19P 9/10/2005 9:08:00 9/10/2005 10:42:00 2974
ISS-20P 12/21/2005
18:38:00 12/23/2005
19:46:00 2948
ISS-21P 4/24/2006 16:03:00 4/26/2006 16:12:00 2889
ISS-22P 6/24/2006 15:08:00 6/26/2006 16:24:00 2956
ISS-23P 10/23/2006
13:41:00 10/26/2006
14:28:00 4367
ISS-24P 1/18/2007 2:12:00 1/20/2007 3:58:00 2987
ISS-25P 5/12/2007 3:25:00 5/15/2007 5:10:00 4425
ISS-26P 8/2/2007 17:34:00 8/5/2007 18:40:00 4386
ISS-27P 12/23/2007 7:12:00 12/26/2007 8:14:00 4382
ISS-28P 2/5/2008 13:02:00 2/7/2008 14:30:00 2968
ISS-29P 5/14/2008 20:22:00 5/16/2008 21:39:00 2957
ISS-30P 9/10/2008 19:50:00 9/17/2008 18:43:00 10013
ISS-31P 11/26/2008
12:38:00 11/30/2008
12:28:00 5750
ISS-32P 2/10/2009 5:49:46 2/13/2009 7:18:00 4408
ISS-33P 5/7/2009 18:37:09 5/12/2009 19:24:23 7247
ISS-34P 7/24/2009 10:56:53 7/29/2009 11:12:00 7215
ISS-35P 10/15/2009 1:14:37 10/18/2009 1:40:00 4345
ISS-5R 11/10/2009
14:22:04 11/12/2009
15:44:00 2962
ISS-36P 2/3/2010 3:45:31 2/5/2010 4:26:00 2920
ISS-37P 4/28/2010 17:15:09 5/1/2010 18:32:00 4397
ISS-38P 6/30/2010 15:35:05 7/4/2010 16:17:00 5802
ISS-39P 9/10/2010 10:22:58 9/12/2010 11:57:00 2974
ISS-40P 10/27/2010
15:11:50 10/30/2011
16:36:00 4404
ISS-41P 1/28/2011 1:31:39 1/30/2011 2:39:00 2947
ISS-42P 4/27/2011 13:05:22 4/29/2011 14:28:00 2963
ISS-43P 6/21/2011 14:38:15 6/23/2011 16:37:00 2999
ISS-45P 10/30/2011
10:11:13 11/2/2011 11:41:00 4410

2011 HiMCM Team #2930
Page 48 of 53
Appendix 4A: STS-133 Launch Windows
DATE.......WINDOW OPEN...IN PLANE......WINDOW CLOSE..DOCKING 02/24/11...04:45:27 PM...04:50:27 PM...04:55:27 PM...Flight Day 3 02/25/11...04:19:44 PM...04:24:44 PM...04:29:45 PM...FD 3 02/26/11...03:57:11 PM...04:02:11 PM...04:07:11 PM...FD 3 02/27/11...03:31:29 PM...03:36:29 PM...03:41:29 PM...FD 3 ..................................................................................03:44:38 PM...FD 4 02/28/11...03:08:57 PM...03:13:57 PM...03:18:57 PM...FD 3 03/01/11...02:46:46 PM...02:48:15 PM...02:53:15 PM...FD 3 ...................................................................................02:56:24 PM...FD 4 03/02/11...02:20:43 PM...02:25:43 PM...02:30:43 PM...FD 3 03/03/11...02:03:24 PM...02:00:02 PM...02:05:02 PM...FD 3** ..................................................................................02:08:11 PM...FD 4 03/04/11...01:32:29 PM...01:37:29 PM...01:42:29 PM...FD 3 03/05/11...01:09:56 PM...01:14:56 PM...01:19:56 PM...FD 03/06/11...12:44:15 PM...12:49:15 PM...12:54:15 PM...FD 3 ** In-plane launch time precedes the planar open due to phasing

2011 HiMCM Team #2930
Page 49 of 53
Appendix 4B: STS-135 Launch Windows
DATE.......WINDOW OPEN...IN PLANE......WINDOW CLOSE..DOCKING/NOTES Fri 07/08...11:21:46 AM...11:26:46 AM...11:31:47 AM...FD 3 ........................................11:35:04 AM...FD 4 Sat 07/09...10:59:15 AM...11:04:15 AM...11:09:16 AM...FD 3 Sun 07/10...10:33:31 AM...10:38:31 AM...10:43:31 AM...FD 3 ........................................10:46:45 AM...FD 4 ---------------------------------------------------------- NO LAUNCH BETWEEN 07/11-15 DUE TO DELTA 4 LAUNCH CONFLICT ---------------------------------------------------------- Mon 07/11...10:10:58 AM...10:15:58 AM...10:20:58 AM...FD 3 ........................................10:24:16 AM...FD 4 Tue 07/12...09:46:34 AM...09:50:16 AM...09:55:16 AM...FD 3 ........................................09:56:18 AM...FD 3 ........................................09:58:27 AM...FD 4 Wed 07/13...09:22:42 AM...09:27:42 AM...09:32:42 AM...FD 3 ........................................09:35:57 AM...FD 4 Thu 07/14...09:00:10 AM...09:05:10 AM...09:10:10 AM...FD 3 Fri 07/15...08:34:28 AM...08:39:28 AM...08:44:28 AM...FD 3 ........................................08:47:39 AM...FD 4 ---------------------------------------------------------- SHUTTLE LAUNCH WINDOW RE-OPENS AFTER DELTA 4 LAUNCH ---------------------------------------------------------- Sat 07/16...08:11:54 AM...08:16:54 AM...08:21:54 AM...FD 3 ........................................08:25:10 AM...FD 4 Sun 07/17...07:49:22 AM...07:54:22 AM...07:59:22 AM...FD 3 Mon 07/18...07:23:39 AM...07:28:39 AM...07:33:39 AM...FD 3 ........................................07:36:52 AM...FD 4 Tue 07/19...07:01:06 AM...07:06:06 AM...07:11:06 AM...FD 3 ........................................07:14:22 AM...FD 4 Wed 07/20...06:38:34 AM...06:43:34 AM...06:48:34 AM...FD 3 Thu 07/21...06:12:51 AM...06:17:51 AM...06:22:51 AM...FD 3 ........................................06:26:04 AM...FD 4 Fri 07/22...05:50:18 AM...05:55:18 AM...06:00:18 AM...FD 3 ........................................06:03:36 AM...FD 4 Sat 07/23...05:27:47 AM...05:32:47 AM...05:37:47 AM...FD 3 Sun 07/24...05:02:03 AM...05:07:03 AM...05:12:03 AM...FD 3 ........................................05:15:17 AM...FD 4 Mon 07/25...04:39:30 AM...04:44:30 AM...04:49:30 AM...FD 3 ........................................04:52:49 AM...FD 4 Tue 07/26...04:18:19 AM...04:18:49 AM...04:23:49 AM...FD 3 ** ........................................04:26:59 AM...FD 3 Wed 07/27...03:51:15 AM...03:56:15 AM...04:01:15 AM...FD 3 ........................................04:04:30 AM...FD 4 Thu 07/28...03:28:43 AM...03:33:43 AM...03:38:43 AM...FD 3 ........................................03:41:08 AM...FD 4 * Two window panes, both for flight day 3 dockings; in-plane time precedes window open ** Two window panes, both for flight day 3 dockings

2011 HiMCM Team #2930
Page 50 of 53
Appendix 5: TI-84 Program used to Determine Launch Times
: 0 H : 0 M : Prompt Y, N : (365.25)(Y-1)+N A : 734214.5 B : A – B C : 1448C D : Lbl 1 : If D ≤ 86400 : Then : Goto 2 : Else : D – 86400 D : Goto 1 : Lbl 2 : IF D ≤ 50400 : Then : 50400 – D D : Goto 3 : Else : 136800–DD : Goto 3 : Lbl 3 : If D > 3599 : Then : D-3600 D : H+1 H : Goto 3 : Else : Goto 4 : Lbl 4 : If D > 59 : Then : D-60 D : M+1 M : Goto 4 : Else : Goto 5 : Lbl 5 : Disp H, M, D

2011 HiMCM Team #2930
Page 51 of 53
Appendix 6: Bibliography
AFP. "Space Station to Be Sunk After 2020." Discovery News. Discovery Communications,
LLC, 27 July 2011. Web. 12 Nov. 2011.
<http://news.discovery.com/space/space-station-end-ocean-110727.html>.
"Athena - Specifications." Space and Tech. Andrews Space & Technology, 2001. Web. 12
Nov. 2011.
<http://www.spaceandtech.com/spacedata/elvs/athena_specs.shtml>.
"Atlas 5 Rocket." Dark Government. Dark Government, 2011. Web. 12 Nov. 2011.
<http://www.darkgovernment.com/news/atlas-5-rocket/>.
"Atlas V - Specifications." Space and Tech. Andrews Space & Technology, 2001. Web. 12
Nov. 2011.
<http://www.spaceandtech.com/spacedata/elvs/atlas5_specs.shtml>.
Behrens, Carl E. "The International Space Station and the Space Shuttle." Congressional
Research Service. Congress, 18 Mar. 2009. Web. 13 Nov. 2011.
<http://www.fas.org/sgp/crs/space/RL33568.pdf>.
Bizony, Piers. Island in the Sky: Building the International Space Station. London: Aurum,
1996. Print.
Bond, Peter. The Continuing Story of the International Space Station. London: Springer,
2002. Print.
"Combined White Knight/SpaceShipOne Flight Tests." Scaled Composites. Scaled
Composites, LLC., 2011. Web. 13 Nov. 2011.
<http://www.scaled.com/projects/tierone/combined_white_knight_spaceshipo
ne_flight_tests>.
De Selding, Peter B. "NASA Funds Keep August Debut of Orbitals Taurus 2 on
Track." Space News. Imaginova Corp., 17 Feb. 2011. Web. 12 Nov. 2011.
<http://www.spacenews.com/launch/110217-nasa-funds-taurus2-track.html>.
Duggins, Pat. Final Countdown: NASA and the End of the Space Shuttle Program.
Gainesville, FL: University of Florida, 2007. Print.
Edwards, Bradley C., and Eric A. Westling. The Space Elevator. Houston, TX: BC Edwards,
2003. Print.
2011 HiMCM Team #2930
Page 52 of 53
"Falcon 9 Overview." Space Exploration Technologies. Space Exploration Technologies
Corp., 2011. Web. 12 Nov. 2011. <http://www.spacex.com/falcon9.php>.
"Falcon Heavy Overview." Space Exploration Technologies. Space Exploration
Technologies Corp., 2011. Web. 12 Nov. 2011.
<http://www.spacex.com/falcon_heavy.php>.
"Fiscal Year 2012 Budget Estimates." NASA. US Government Office of Management and
Budget, 2011. Web. 13 Nov. 2011.
<http://www.nasa.gov/pdf/516674main_NASAFY12_Budget_Estimates-
Overview-508.pdf>.
Harland, David M., and John E. Catchpole. Creating the International Space Station. New
York: Praxis, 2002. Print.
Hartmut, Frommert. "International Space Station Flight Schedule." Spider. SEDS, 8 Nov.
2011. Web. 13 Nov. 2011. <http://spider.seds.org/shuttle/iss-sche.html>.
"International Space Station." NASA. US Government Office of Management and Budget,
2003. Web. 13 Nov. 2011. <http://www.nasa.gov/pdf/1977main_iss.pdf>.
"The International Space Station." NASA. US Government Office of Management and
Budget, 2005. Web. 13 Nov. 2011.
<http://www.nasa.gov/pdf/55411main_28%20ISS.pdf>.
Mosher, Dave. "Space Elevator." The Spaceward Foundation. The Spaceward Foundation,
2008. Web. 13 Nov. 2011. <http://www.spaceward.org/elevator>.
Mould, David. "Statement of NASA Administrator Michael Griffin on Aug. 18
Email." NASA. NASA, 7 Sept. 2008. Web. 12 Nov. 2011.
<http://www.nasa.gov/home/hqnews/2008/sep/HQ_08220_griffin_statement_
email.html>.
"National Aeronautics and Space Administration." NASA. US Government Office of
Management and Budget, 2011. Web. 13 Nov. 2011.
<http://www.nasa.gov/pdf/516675main_NASAFY12_Budget_Estimates-
508.pdf>.
"Physical Properties of Carbon Nanotubes." MSU Physics and Astronomy Department.
Michigan State University. Web. 13 Nov. 2011.
<http://www.pa.msu.edu/cmp/csc/ntproperties/equilibriumstructure.html>.

2011 HiMCM Team #2930
Page 53 of 53
"Previous Years' Budgets." NASA. US Government Office of Management and Budget,
2011. Web. 13 Nov. 2011.
<http://www.nasa.gov/audience/formedia/features/MP_Budget_Previous.html
>.
"Reference Guide to the InternatIonal Space Station." NASA. NASA, Nov. 2010. Web. 13
Nov. 2011.
<http://www.nasa.gov/pdf/508318main_ISS_ref_guide_nov2010.pdf>.
Smitherman, Jr., D.V. "Space Elevators: An Advanced Earth-Space Infrastructure for the
New Millennium." Marshall Space Flight Center. NASA, Aug. 2000. Web. 13 Nov.
2011.
"SpaceX Plans World's Largest Commercial Rocket." Flight International. Reed Business
Information Ltd, 11 Apr. 2011. Web. 12 Nov. 2011.
<http://www.flightglobal.com/news/articles/spacex-plans-worlds-largest-
commercial-rocket-355419/>.
"Taurus - Specifications." Space Exploration Technologies. Space Exploration
Technologies Corp., 2011. Web. 12 Nov. 2011.
<http://www.spaceandtech.com/spacedata/elvs/taurus_specs.shtml>.
"U.S. Destiny Laboratory." NASA. NASA, 2011. Web. 12 Nov. 2011.
<http://www.nasa.gov/mission_pages/station/structure/elements/destiny.htm
l>.
Wade, Mark. "ISS Zarya." Encyclopedia Astronautica. Encyclopedia Astronautica, 2011.
Web. 12 Nov. 2011. <http://www.astronautix.com/craft/isszarya.htm>.
Wade, Mark. "Kistler K-1." Encyclopedia Astronautica. Encyclopedia Astronautica. Web.
12 Nov. 2011. <http://www.astronautix.com/lvs/kislerk1.htm>.
"X-37 Orbital Test Vehicle." The Official Website of the United States Air Force. United
States Air Force, 03 Mar. 2011. Web. 13 Nov. 2011.
<http://www.af.mil/information/factsheets/factsheet.asp?fsID=16639>.
"Zvezda Service Module." NASA. NASA, 2011. Web. 12 Nov. 2011.
<http://www.nasa.gov/mission_pages/station/structure/elements/sm.html>.