problems by using pressed powder pellets for xrf … · problems by using pressed powder pellets...
TRANSCRIPT

PROBLEMS BY USING PRESSED POWDER PELLETS FOR XRF ANALYSIS OF FERROSILICON ALLOYS
Torkild Eivindson and 0yvind Mikkelsen
Central Laboratory, Elkem ASA Research, P.O.Box 8040 Vaagsbygd N-4675 Kristiansand, Norway, e-mail : [email protected]
ABSTRACT
The problems by using pressed powder pellets for XRF analysis of ferrosilicon alloys have been investigated. The origin of the problems is the heterogeneity of the solidified ferrosilicon. A variety of distinct crystallographic phases with varying X-ray absorption and grinding properties are formed from the molten metal resulting in large particle size effects. This in turn affects the accuracy and precision of the XRF analysis. A second effect that has to be accounted for is the stability of the powder pellets. The choice of binder agent is found to be essential to obtain stable pellets that are less affected by radiation and aging. The results show that grinding time, grinding vessel, grinding machine, cooling rate of the metal and choice of binder agent greatly influence the analysis results. To manage the problems it is of utmost importance to have a strict control of the sample preparation routines.
INTRODUCTION
In industrial metal production there is usually a need of fast analysis and the choice of sample preparation routines will then be a compromise between accuracy and speed. Since preparation of pressed powder pellets for XRF analysis is significantly faster than most alternative methods it is the most commonly used in ferrosilicon (FeSi) alloy production. The FeSi alloys are very heterogeneous and they consist of several distinct phases, which crystallize at different temperatures and elemental compositions. This causes the so called particle size effects, which may influence the analysis results if not accounted for when establishing the sample preparation routines. The heterogeneity also causes problems in the bulk sample taking but that is not a subject in this investigation.
The particle size effects have been thoroughly discussed by Jenkins [l] and the theory will only be briefly mentioned here. To make a distinction between the different mechanisms causing particle size effects it is normally classified into three categories, i.e. grain size effects, inter- mineral effects and mineralogical effects. All these effects may be of importance if the effective path length of the measured radiation is in the range of the particle size of the sample. The effective path length for a given wavelength is defined as the path length that absorbs 99% of the
Copyright(c)JCPDS-International Centre for Diffraction Data 2001,Advances in X-ray Analysis,Vol.44 1Copyright(c)JCPDS-International Centre for Diffraction Data 2001,Advances in X-ray Analysis,Vol.44 408Copyright(c)JCPDS-International Centre for Diffraction Data 2001,Advances in X-ray Analysis,Vol.44 409ISSN 1097-0002

This document was presented at the Denver X-ray Conference (DXC) on Applications of X-ray Analysis. Sponsored by the International Centre for Diffraction Data (ICDD). This document is provided by ICDD in cooperation with the authors and presenters of the DXC for the express purpose of educating the scientific community. All copyrights for the document are retained by ICDD. Usage is restricted for the purposes of education and scientific research. DXC Website – www.dxcicdd.com
ICDD Website - www.icdd.com
ISSN 1097-0002

initial radiation. If the particles are ground to less than one fifth of the effective path length the particle size effects normally become negligible [ 11. However, this requires sub-micron particles if you are measuring light elements in a heavier matrix and that is normally not obtainable with the applied equipment.
This paper demonstrates how grinding time, grinding vessel, grinding machine, cooling rate of the metal and choice of binder agent influence the analysis results. The origin of the problems will be discussed on the background of particle size effects and precaution to manage the problems will be suggested. The paper only focus on different 75% FeSi systems but the results also apply to other FeSi alloys and to a large range of other materials.
EXPERIMENTAL
Materials The material under investigation is FeSi, containing about 75 wt.% Si and 23 wt.% Fe. The minor elements are Al (1 wt.%), Mn (0.1 wt.%), Ca (0.1 wt.%) and Ti (0.1 wt.%). In addition there are several trace elements with concentration less than 1000 ppmw. The material is used in steel production. Two different FeSi qualities have been used, Standard 75% FeSi (denoted as Standard) and Gransil. The two samples match in chemical composition and the main difference is the cooling rate during casting. Standard solidifies during several minutes in a big cast mould whereas Gransil solidifies during a few seconds when it is granulated in a big water tank.
Sample preparation Herzog HSM 100 (1500 t-pm) grinding machine and Herzog HSM-SF36 (1400 rpm) grinding machine are used. Three 500 ml swing disc grinding vessels are tested, two WC vessels and one Cr-steel vessel. Herzog HTP hydraulic press is used for pelletizing.
Three techniques are used for preparing the sample specimens. Details are given in table 1. The sample is weighed together with the binder and ground in the mill. Subsequently the specimen is pressed with 25 ton pressure for 20 seconds using 5 gram boric acid as backing. The backing absorbs stress and shock in the pressing process, and gives a smooth and nice pellet surface. The preparation routines are similar to what is used at our FeSi plants.
Table 1: Sample preparation data. Sample Binder type Binder Grinding Grinding time
(8) (8) vessel (seconds) 10.0 Polyethene (Herzog - PE 190) 0.6 WClCr-steel 90 10.0 Starch (Merck pa, art. 1252) 2.0 WC 90 20.0 Wax(Herzog EMU a&6-01 100-335765-4) 3.6 WC 90
Copyright(c)JCPDS-International Centre for Diffraction Data 2001,Advances in X-ray Analysis,Vol.44 2Copyright(c)JCPDS-International Centre for Diffraction Data 2001,Advances in X-ray Analysis,Vol.44 409Copyright(c)JCPDS-International Centre for Diffraction Data 2001,Advances in X-ray Analysis,Vol.44 410ISSN 1097-0002

XRF measurements The XRF measurements are carried out on a Philips PW1404 and a Philips PW2404 wavelength dispersive XRF spectrometers.
On PW1404 the specimens are measured using an X-ray analysis program made for bulk and trace element analyses of FeSi. The program is calibrated for 27 elements. Table 2 shows the main parameter settings.
Table 2: The XRF parameters for Si, Fe, Cr, P and Mg on a Philips PW 1404 spectrometer. 2.5 kW tube effect was used for all elements. X-ray tube material : Cr. Element Line Crystal Angel Background Measurement time (seconds)
/20 /20 Peak Background Si Ka PE 109.195 10 Fe Ka LIF200 57.560 10 Cr Ka LIF200 69.405 70.905 30 10 P Ka PE 89.500 91.000 60 20
Mg KCt PXl 23.160 60
The Philips PW 2404 spectrometer is only used in the test of pellet stability upon X-ray radiation. The test is carried out without any concentration calibration and only counts per second are registred. Table 3 shows the main parameters.
Table 3: The XRF parameters for Si, Fe, and Al on a Philips PW2404 spectrometer. 3 kW tube effect was used for all elements. X-ray tube material : Rh. Total analysis time including not specified channels : 6 minutes. Element Line Crystal Angel Background Measurement time (seconds)
/20 120 Peak Background Si Ka PE 109.19 30 Al Kcx PE 145.04 144.03 30 30 Fe Ka LIF220 85.73 30
RESULTS AND DISCUSSIONS
Cooling rate When FeSi is solidifying, first the Si crystal will start to grow until the rest of the liquid metal reach a composition of about 50% Fe and 50% Si, then the FeSiz crystal start to solidify. The main two phases in the solid metal is therefor Si and FeSiz. Almost all the other elements solidify in several distinct phases on the grain boundaries.
Copyright(c)JCPDS-International Centre for Diffraction Data 2001,Advances in X-ray Analysis,Vol.44 3Copyright(c)JCPDS-International Centre for Diffraction Data 2001,Advances in X-ray Analysis,Vol.44 410Copyright(c)JCPDS-International Centre for Diffraction Data 2001,Advances in X-ray Analysis,Vol.44 411ISSN 1097-0002
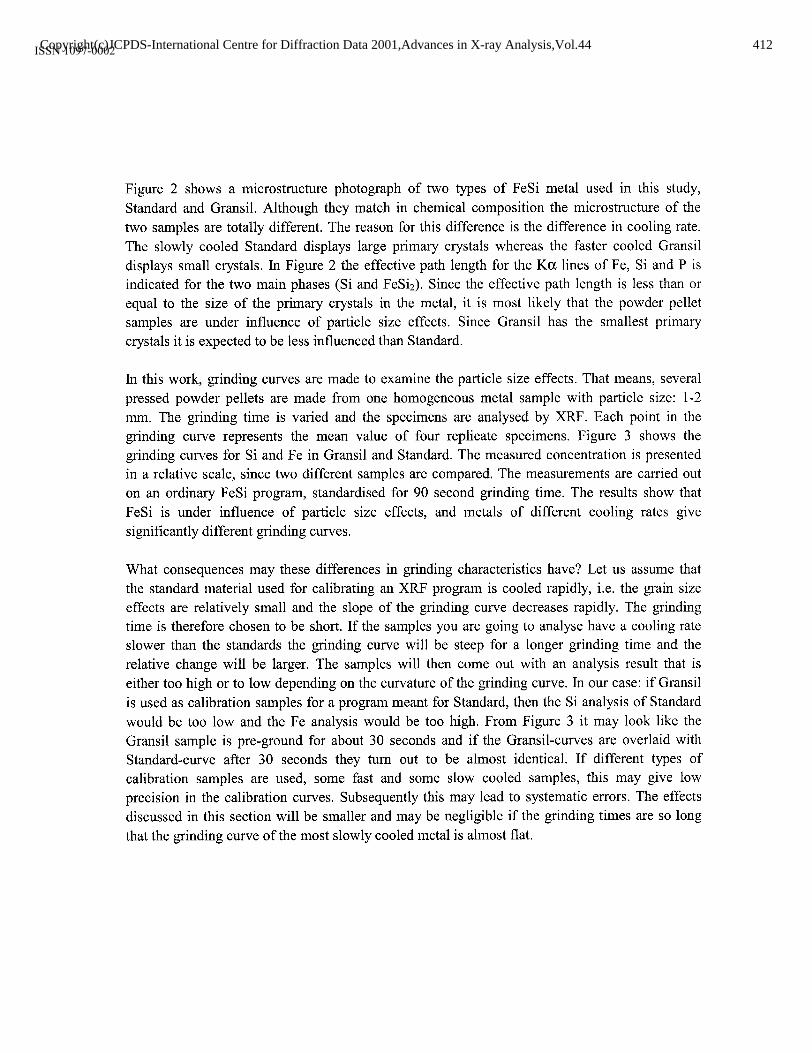
Figure 2 shows a microstructure photograph of two types of FeSi metal used in this study, Standard and Gransil. Although they match in chemical composition the microstructure of the two samples are totally different. The reason for this difference is the difference in cooling rate. The slowly cooled Standard displays large primary crystals whereas the faster cooled Gransil displays small crystals. In Figure 2 the effective path length for the Ka lines of Fe, Si and P is indicated for the two main phases (Si and FeSiz). Since the effective path length is less than or equal to the size of the primary crystals in the metal, it is most likely that the powder pellet samples are under influence of particle size effects. Since Gransil has the smallest primary crystals it is expected to be less influenced than Standard.
In this work, grinding curves are made to examine the particle size effects. That means, several pressed powder pellets are made from one homogeneous metal sample with particle size: l-2 mm. The grinding time is varied and the specimens are analysed by XRF. Each point in the grinding curve represents the mean value of four replicate specimens. Figure 3 shows the grinding curves for Si and Fe in Gransil and Standard. The measured concentration is presented in a relative scale, since two different samples are compared. The measurements are carried out on an ordinary FeSi program, standardised for 90 second grinding time. The results show that FeSi is under influence of particle size effects, and metals of different cooling rates give significantly different grinding curves.
What consequences may these differences in grinding characteristics have? Let us assume that the standard material used for calibrating an XRF program is cooled rapidly, i.e. the grain size effects are relatively small and the slope of the grinding curve decreases rapidly. The grinding time is therefore chosen to be short. If the samples you are going to analyse have a cooling rate slower than the standards the grinding curve will be steep for a longer grinding time and the relative change will be larger. The samples will then come out with an analysis result that is either too high or to low depending on the curvature of the grinding curve. In our case: if Gransil is used as calibration samples for a program meant for Standard, then the Si analysis of Standard would be too low and the Fe analysis would be too high. From Figure 3 it may look like the Gransil sample is pre-ground for about 30 seconds and if the Gransil-curves are overlaid with Standard-curve after 30 seconds they turn out to be almost identical. If different types of calibration samples are used, some fast and some slow cooled samples, this may give low precision in the calibration curves, Subsequently this may lead to systematic errors. The effects discussed in this section will be smaller and may be negligible if the grinding times are so long that the grinding curve of the most slowly cooled metal is almost flat.
Copyright(c)JCPDS-International Centre for Diffraction Data 2001,Advances in X-ray Analysis,Vol.44 4Copyright(c)JCPDS-International Centre for Diffraction Data 2001,Advances in X-ray Analysis,Vol.44 411Copyright(c)JCPDS-International Centre for Diffraction Data 2001,Advances in X-ray Analysis,Vol.44 412ISSN 1097-0002

Effective path length (Si) Effective path length (FeSiz)
Fe (282pm) Fe (104pm)
Si (61p.m) l
P (W-0 >
Si (7pm)
P (4cLm)
>
>
Figure 2: Microstructure photography of slow cooled FeSi (Standard) and fast cooled FeSi (Gransil). The arrows indicate the effective path length for Fe Ka, Si Ka and P Ka radiation.
94
93 ?‘t
/ t;
.----IX 92
91 Silicon
901 0 40 80 120 160 ;
116- 116-
114-
112-
IlO-
108-
106-
104-
102-
loo-& ? -3 Iron Iron
,,l--TTv- 0 40 80 120 160 200
Grinding time / seconds
Figure 3: Grinding curves for Si and Fe in Standard (slow cooled) and Gransil (fast cooled).
Copyright(c)JCPDS-International Centre for Diffraction Data 2001,Advances in X-ray Analysis,Vol.44 5Copyright(c)JCPDS-International Centre for Diffraction Data 2001,Advances in X-ray Analysis,Vol.44 412Copyright(c)JCPDS-International Centre for Diffraction Data 2001,Advances in X-ray Analysis,Vol.44 413ISSN 1097-0002

Effect of binder The binder influence on the particle size effects is examined by comparing the grinding curves obtained by preparing the specimens from one metal sample (Standard) and with two different binders. Figure 4 shows the grinding curves. It is obvious that the effect of choice of binder is smaller than the effect of cooling rate. However, some differences are seen and they are most clearly seen for the lightest elements.
Normally it is no problem to avoid accidental use of different types of binders, but if the sample preparation routines are going to be changed from using one type of binder to an other type of binder it is necessary to reconsider the grinding times. It should also be kept in mind that some of the binders contain significant amounts of impurities that may affect the analysis results. For instance starch contain phosphor and the phosphor signal decreases rapidly with grinding time down to a stable level.
91 - Silicon Iron
Grinding time / seconds
Figure 4: Grinding curves for Standard obtained using Polyethylene and Starch as binder.
Effect of grinding machine and grinding vessel The influence of changing grinding machine and grinding vessel on the grinding characteristics is examined by preparing specimens from the Standard sample using two different grinding machines and two types of grinding vessels. Figure 5 shows the grinding curves for the elements Fe, Si, Cr and Mg. The grinding curves show that in this case it has less effect to change the type of grinding vessel than to change grinding machine.
Copyright(c)JCPDS-International Centre for Diffraction Data 2001,Advances in X-ray Analysis,Vol.44 6Copyright(c)JCPDS-International Centre for Diffraction Data 2001,Advances in X-ray Analysis,Vol.44 413Copyright(c)JCPDS-International Centre for Diffraction Data 2001,Advances in X-ray Analysis,Vol.44 414ISSN 1097-0002

The general conclusion from Figure 5 is that the automatic mill is more efficient than the other mill. The curvature of the grinding curves decreases faster for the automatic mill. The steadily growing chromium signal shows that by using Cr-steel grinding vessel the sample is contaminated with chromium. This will make Cr determination in the sample difficult. Of course the sample will also be contaminated by iron, but in the case of FeSi the iron content is very high anyway so that contamination is insignificant. However, if silicon metal is analyzed a Cr-steel vessel can not be used due to this contamination, The grinding curves for Mg show that this element is the one most affected by the choice of grinding equipment. Mg is the lightest element measured in FeSi using XRF.
It is not only the type of mill and grinding vessel that influence the grinding curves. Also the age of the equipment is of importance. The efficiency of the grinding equipment do change during time and this will result in different grinding curves when you compare two samples prepared at different times. If this is not accounted for it may lead to systematic and time dependent errors.
Magnesium
G rinding time / seconds
Figure 5: Grinding curves for Cr, Mg, Si and Fe in Standard obtained from preparing a sample on two different grinding machines (Herzog HSM 100 manual mill and Herzog HSM-SF36 automatic mill) and with two types and grinding vessels (WC grinding vessel and Cr-steel grinding vessel).
Copyright(c)JCPDS-International Centre for Diffraction Data 2001,Advances in X-ray Analysis,Vol.44 7Copyright(c)JCPDS-International Centre for Diffraction Data 2001,Advances in X-ray Analysis,Vol.44 414Copyright(c)JCPDS-International Centre for Diffraction Data 2001,Advances in X-ray Analysis,Vol.44 415ISSN 1097-0002

Effect of radiation The XRF-analyses are normally assumed to be a non-destructive to the specimen, but in the case of powder pellets we have experienced that subsequent measurements on the same specimen give significantly different analytical results. Three sample briquettes, prepared with three different binders are investigated. The three sample briquettes are made from the Standard sample and ground on the same manual grinding machine for 90 seconds. Figure 6 shows the result of 30 repeated measurement on each sample briquette.
The results show that the powder pellet changes by X-ray radiation. This is most clearly expressed when starch binder is used as binder. The X-ray effect is also most clearly seen for the lightest element.
The reasons for this effect are not well understood. However, it is reasonable to assume that photochemical reactions and degradation of polymers may take place in the samples. Humidity and other volatile fragments from the reactions will evaporate from the sample and reduce the X-ray absorption in the sample surface and increase the signal. Such mechanism is in accordance with the results obtained using starch. It is more difficult to explain why the X-ray signal decreases during repeated measurements on polyethene or wax pellets. The results suggest that wax or polyethene should be chosen as binders in order to obtain more stable specimens. Regardless the choice of binder, powder pellets should not be used as instrument control samples. Repeated measurements of calibration specimens should also be avoided.
Aluminum Silicon Iron
- 100
- 99
- 98
- 97
Tube effect : 3 kW - 96
0 5 10 15 20 25 30 0 5 10 15 20 25 30 0 5 IO 15 20 25 30
measurment number
Figure 6: Effect of repeated XRF measurements on the same powder specimen.
Copyright(c)JCPDS-International Centre for Diffraction Data 2001,Advances in X-ray Analysis,Vol.44 8Copyright(c)JCPDS-International Centre for Diffraction Data 2001,Advances in X-ray Analysis,Vol.44 415Copyright(c)JCPDS-International Centre for Diffraction Data 2001,Advances in X-ray Analysis,Vol.44 416ISSN 1097-0002

Precautions This paper shows that particle size effects and the radiation effects can cause problems for the XRF analysis of FeSi. Therefore it is important to know about the potential problems and reduce their effects. This can be done by a survey of the grinding characteristics, using calibration samples made from the same process as the test samples, validate the XRF results with replicate measurements on a reference analytical method, and have good control routines for the specimen preparation and XRF-measurements.
Alternative XRF methods Two alternative XRF techniques for analyzing FeSi have been described in literature [3,4, 5, 61.
The first method is the “glass bead technique”. The metal samples are oxidized by air or an oxidizing agent and fused into a glass bead. The main advantages of this method are:
1. It is free from particle size effects since the glass bead is a perfect homogeneous sample.
2. Synthetic calibration samples can be utilized, made from well-defined and pure chemicals. Elements that are not certified in commercial CRM’s can be calibrated.
3. The perfect samples are well suited for theoretical inter element corrections. 4. The technique gives increased calibration range for all elements. 5. CRM’s can be used for validation of the “synthetic” calibrations.
But the glass bead technique has some drawbacks: 1. It is time consuming compared to the powder pellet technique, therefor it is not
suitable for process control. 2. It is a risk for compositional change of the sample when fused. 3. It is a technique for skilled lab personal.
The second method is the “fusion with pure iron technique”. The main purpose is to transfer the main elements in the metal sample to a well defined solid phase. This normally gives an increased accuracy for the main elements, compared to the powder pellet technique, but it is a risk of compositional change during remelting. The technique also gives considerably reduced sensitivity for trace element determination.
CONCLUSIONS Particle size effects can cause serious problems in XRF analysis of ferrosilicon. The origin of the problems is the heterogeneity of the solidified ferrosilicon. The results show that grinding time, grinding vessel, grinding machine, cooling rate of the metal and choice of binder agent significantly influence the analysis results. The problems can be handled properly by having good knowledge about the analyzed material and its grinding characteristics, and by using calibration samples of the same origin as the unknown samples. It is also of utmost importance to have strict control of the sample preparation routines and prepare the samples the same way every time.
Copyright(c)JCPDS-International Centre for Diffraction Data 2001,Advances in X-ray Analysis,Vol.44 9Copyright(c)JCPDS-International Centre for Diffraction Data 2001,Advances in X-ray Analysis,Vol.44 416Copyright(c)JCPDS-International Centre for Diffraction Data 2001,Advances in X-ray Analysis,Vol.44 417ISSN 1097-0002

REFERENCES
1. Jenkins, R., An Introduction to X-Ray Spectrometry, Heyden and Son Ltd.: London, 1976, 107-l 19.
2. Rutherford, R.T., X-ray Spectrom., 1996,24, 109-l 14. 3. Moon, K.H.; Hong, K.L.; Lee, D.E.; Cho, S.Y ., Rapid Analysis ofFerro-alloys by Xm,
Research Institute of Industrial Science and Technology (Pohang City, Korea), Technical research report, 1992,6,70-86.
4. Philips Analytical, Almelo-Holland, The Bead Cookbook, 1990. 5. Nieuwenhuizen, C., The anulysis of Ferro-Alloys, Report 5001, Philips Export B.V.
Application Laboratories for X-ray Analysis, 1982. 6. Bennett H.; Oliver, G., XM Analysis of Ceramics, Minerals and Allied Materials, John Wiley
and Sons Inc., New York, 1992.
Copyright(c)JCPDS-International Centre for Diffraction Data 2001,Advances in X-ray Analysis,Vol.44 10Copyright(c)JCPDS-International Centre for Diffraction Data 2001,Advances in X-ray Analysis,Vol.44 417Copyright(c)JCPDS-International Centre for Diffraction Data 2001,Advances in X-ray Analysis,Vol.44 418ISSN 1097-0002