probuilder is a basic-type programming language that ... · candlesticks patterns ... trading...
TRANSCRIPT

ProBuilder is a BASIC-type programming language that allows you to createpersonalized technical indicators, trading systems and market scanning programs forthe ProRealTime platform.
Follow ProRealTime Programming on Google+ for updates about ProRealTime programming languages.
V 4.1.1 – 20160502

TABLE OF CONTENTS
Introduction to ProBuilder__________________________________________1
Chapter I: Fundamentals___________________________________________2
Using ProBuilder...........................................................................................................2
Indicator creation quick tutorial......................................................................................................2
Programming window keyboard shortcuts....................................................................................5
Specificities of ProBuilder programming language.......................................................6
Financial constants........................................................................................................7
Price and volume constants adapted to the timeframe of the chart..............................................7
Daily price constants.....................................................................................................................8
Temporal constants.......................................................................................................................8
Constants derived from price.......................................................................................................12
The Undefined constant..............................................................................................................12
How to use pre-existing indicators?............................................................................12
Variables......................................................................................................................13
Chapter II: Math Functions and ProBuilder instructions________________15
Control Structures.......................................................................................................15
Conditional IF instruction.............................................................................................................15
One condition, one result (IF THEN ENDIF)...................................................................................15
One condition, two results (IF THEN ELSE ENDIF).......................................................................15
Sequential IF conditions................................................................................................................. 15
Multiple conditions (IF THEN ELSE ELSIF ENDIF)........................................................................16
Iterative FOR Loop......................................................................................................................17
Ascending (FOR, TO, DO, NEXT)..................................................................................................17
Descending (FOR, DOWNTO, DO, NEXT).....................................................................................18
Conditional WHILE Loop.............................................................................................................19
BREAK.........................................................................................................................................20
With WHILE.................................................................................................................................... 20
With FOR........................................................................................................................................ 20
CONTINUE..................................................................................................................................21
With WHILE.................................................................................................................................... 21
With FOR........................................................................................................................................ 21
ONCE..........................................................................................................................................22
Mathematical Functions..............................................................................................23
Common unary and binary Functions.........................................................................................23
Common mathematical operators...............................................................................................23
Charting comparison functions....................................................................................................23
Summation functions...................................................................................................................24
Statistical functions......................................................................................................................24
Logical operators.........................................................................................................24

ProBuilder instructions................................................................................................24
RETURN......................................................................................................................................25
REM or //......................................................................................................................................25
CustomClose...............................................................................................................................25
CALL............................................................................................................................................26
AS................................................................................................................................................26
COLOURED................................................................................................................................26
Drawing instructions....................................................................................................28
Chapter III: Practical aspects_______________________________________31
Why and how to create binary or ternary indicators...................................................31
Creating stop indicators to follow a position................................................................32
StaticTake Profit STOP................................................................................................................33
Static STOP loss..........................................................................................................................33
Inactivity STOP............................................................................................................................34
Trailing Stop.................................................................................................................................35
Chapter IV: Exercises_____________________________________________36
Candlesticks patterns..................................................................................................36
Indicators.....................................................................................................................37
Glossary________________________________________________________39
Warning: ProRealTime does not provide investment advisory services. This document is not in anycase personal or financial advice nor a solicitation to buy or sell any financial instrument. Theexample codes shown in this manual are for learning purposes only. You are free to determine allcriteria for your own trading. Past performance is not indicative of futrure results. Any tradingsystem may expose you to a risk of loss greater than your initial investment.

In t roduct ion to ProBui lder
Introduction to ProBuilder
ProBuilder is ProrealTime's programming language. It allows you to create personalized technical indicators,trading strategies (ProBacktest) or screening programs (ProScreener). A specific manual exists forProBacktest and ProScreener due to some specifics of each of these modules.
ProBuilder is a BASIC-type programming language, very easy to handle and exhaustive in terms of availablepossibilities.
You will be able to create your own programs using the quotes from any tool provided by ProRealTime.Some basic available elements include:
Opening of each bar: Open
Closing of each bar: Close
Highest price of each bar: High
Lowest price of each bar: Low
Volume of each bar: Volume
Bars or candlesticks are the common charting representations of real time quotes. Of course, ProRealTimeoffers you the possibility of personalizing the style of the chart. You can use Renko, Kagi, Haikin-Ashi andmany other styles.
ProBuilder evaluates the data of each price bar starting with the oldest one to the most recent one, and thenexecutes the formula developed in the language in order to determine the value of the indicators on thecurrent bar.
The indicators coded in ProBuilder can be displayed either in the price chart or in an individual one.
In this document, you will learn, step by step, how to use the available commands necessary to program inthis language thanks to a clear theoretical overview and concrete examples.
In the end of the manual, you will find a Glossary which will give you an overall view of all the ProBuildercommands, pre-existing indicators and other functions completing what you would have learned after readingthe previous parts.
Users more confident in their programming skills can skip directly to chapter II or just refer to the Glossary toquickly find the information they want.
For those who are less confident, we recommend watching our video video tutorial entitled "Programmingsimple and dynamic indicators" and reading the whole manual.
We wish you success and hope you will enjoy the manual!
V 4.1.1 – 20160502 www.prorealtime.com 1 / 47

Chapter I : Fundamenta ls
Chapter I: Fundamentals
Using ProBuilder
Indicator creation quick tutorial
The programming zone of an indicator is available by clicking the button "Indicator/Backtest" which can befound in the upper right corner of each chart of the ProRealTime platform.
The indicators management window will be displayed. You will then be able to:
Display a pre-existing indicator
Create a personalized indicator, which can be used afterwards on any security
If you choose the second possibility, click on "New indicator" to access the programming window.
At that time, you will be able to choose between:
Programming directly an indicator in the text zone designed for writing code or
Using the help function by clicking on "Insert Function". This will open a new window in which you canfind all the functions available. This library is separated in 7 categories, to give you constant assistancewhile programming.
V 4.1.1 – 20160502 www.prorealtime.com 2 / 47

Chapter I : Fundamenta ls
Let’s take for example the first specific ProBuilder element: the "RETURN" function (available in the"Keywords" category (see the image below).
V 4.1.1 – 20160502 www.prorealtime.com 3 / 47

Chapter I : Fundamenta ls
Select the word "RETURN" and click on "Add". The command will be added to the programming zone.
RETURN allows you to display the result
Suppose we want to create an indicator displaying the Volume. If you have already inserted the function"RETURN", then you just need to click one more time on "Insert function". Next, click on "Constants" in the"Categories" section, then in the right side of the window, in the section named "Functions", click on"Volume". Finally, click on "Add". Don't forget to add a space in between each command as shown below.
Before clicking on "Validate program", you need to enter the name of your indicator. Here, we named it"Volume DAX". To finish, click on "Validate program" and you will see your indicator displayed below theprice chart.
V 4.1.1 – 20160502 www.prorealtime.com 4 / 47

Chapter I : Fundamenta ls
Programming window keyboard shortcuts
The programming window has a number of useful features that can be accessed by keyboard shortcutsstarting with ProRealTime version 10:
Select all (Ctrl + A): Select all text in the programming window
Copy (Ctrl + C): Copy the selected text
Paste (Ctrl + X): Paste copied text
Undo (Ctrl + Z): Undo the last action in the programming window
Redo (Ctrl + Y): Redo the last action in the programming window
Find / Replace (Ctrl + F): Find a text in the programming window / replace a text in the programmingwindow (this feature is case-sensitive)
Comment / Uncomment (Ctrl + R): Comment the selected code / Uncomment the selected code(commented code will be preceded by "//" or "REM" and colored gray. It will not be taken into accountwhen the code is executed).
For Mac users, the same keyboard shortcuts can be accessed with the "Apple" key in place of the "Ctrl" key.Most of these features can also be accessed by right-clicking in the programming window.
V 4.1.1 – 20160502 www.prorealtime.com 5 / 47

Chapter I : Fundamenta ls
Specificities of ProBuilder programming language
Specificities
The ProBuilder language allows you to use many classic commands as well as sophisticated tools which arespecific to technical analysis. These commands will be used to program from simple to very complexindicators.
The main ideas to know in the ProBuilder language are:
It is not necessary to declare variables
It is not necessary to type variables
There is no difference between capital letters and small letters
We use the same symbol "=" for mathematic equality and to attribute a value to a variable
What does that mean ?
Declare a variable X means indicating its existence. In ProBuilder, you can directly use X without havingto declare it. Let’s take an example:
With declaration: let be variable X, we attribute to X the value 5
Without declaration: We attribute to X the value 5 (therefore, implicitly, X exists and the value 5 is attributedto it)
In ProBuilder you just need to write: X=5
Type a variable means defining its nature. For example: is the variable a natural number (ex: 3; 8; 21;643; …), a whole number which can be negative or positive (ex: 3; 632; -37; …), a decimal number (ex:1.76453534535…), a boolean (RIGHT=1, WRONG=0),…?
In ProBuilder, you can write your command with capital letters or small letters. For example, the groupof commands IF / THEN / ELSE / ENDIF can be written iF / tHeN / ELse / endIf (and many otherpossibilities!)
Exception: When you decide to create a variable and re-use it later in the program, you must not contradictthe spelling you used during its creation. If you started to name your variable: "vARiaBLe" and wish to re-use it in your program, then you must refer to it as "vARiaBLe", not as “variable” not anything else.
Affect a value to a variable means give the variable a value. In order to understand this principle, youmust assimilate a variable with an empty box which you can fill with an expression (ex: a number). Thefollowing diagram illustrate the Affectation Rule with the Volume value affected to the variable X:
X VolumeAs you can see, we must read from right to left: Volume is affected to X.
If you want to write it under ProBuilder, you just need to replace the arrow with an equal sign:
X = VolumeThe same = symbol is used:
For the affectation of a variable (like the previous example)
As the mathematical comparison operator (1+ 1= 2 is equivalent to 2 = 1 + 1).
V 4.1.1 – 20160502 www.prorealtime.com 6 / 47

Chapter I : Fundamenta ls
Financial constants
Before coding your personal indicators, you must examine the elements you need to write your code such asthe opening price, the closing price, etc.
These are the "fundamentals" of technical analysis and the main things to know for coding indicators.
You will then be able to combine them in order to draw out some information provided by financial markets.We can group them together in 5 categories:
Price and volume constants adapted to the timeframe of the chart
These are the "classical" constants and also the ones used the most. They report by default the value of thecurrent bar (whatever the timeframe used).
Open: Opening price of each bar
High: Highest price of each bar
Low: Lowest price of each bar
Close: Closing price of each bar
Volume: The number of securities or contracts exchanged at each bar
DECREASING CANDLESTICK INCREASING CANDLESTICK
Example: Range of the current bara = High
b = Low
MyRange = a - b
RETURN MyRange
If you want to use the information of previous bars rather than the current bar, you just need to add betweensquare brackets the number of bars that you want to go back into the past.
Let’s take for example the closing price constant:
Value of the closing price of the current bar: Close
Value of the closing price preceding the current bar: Close[1]
Value of the closing price preceding the nth bar preceding the current one: Close [n]
This rule is valid for any constant. For example, the opening price of the 2nd bar preceding the current canbe expressed as: Open[2].
The reported value will depend on the displayed timeframe of the chart.
V 4.1.1 – 20160502 www.prorealtime.com 7 / 47

Chapter I : Fundamenta ls
Daily price constants
Contrary to the constants adapted to the timeframe of the chart, the daily price constants refer to the value ofthe day, regardless the timeframe of the chart.
Another difference between Daily price constants and constants adapted to the timeframe of the chart is thatthe daily price constants use brackets and not square brackets to call the values of previous bars.
DOpen(n): Opening price of the nth day before the one of the current bar
DHigh(n): Highest price of the nth day before the one of the current bar
DLow(n): Lowest price of the nth day before the one of the current bar
DClose(n): Closing price of the nth day before the one of the current bar
Note: If "n" is equal to 0, "n" references the current day. As the maximum and minimum values are notdefined for n=0, we obtain a result for previous days but not for the current day.
The constants adapted to the timeframe of the chart use square brackets while the daily price
constants use brackets.
Close[3] The closing price 3 periods ago
Dclose(3) The closing price 3 days ago
Temporal constants
Time is often a neglected component of technical analysis. However traders know very well the importanceof some time periods in the day or dates in the year. It is possible in your programs to take into account timeand date and improve the efficiency of your indicators. The Temporal constants are described hereafter:
Date: indicates the date of the close of each bar in the format YearMonthDay (YYYYMMDD)
Temporal constants are considered by ProBuilder as whole numbers. The Date constant, for example, mustbe used as one number made up of 8 figures.
Let’s write down the program:RETURN Date
Suppose today is July 4th, 2020. The program above will return the result 20200704.
The date can be read in the following way:
20200704 = 2020 years 07 months and 04 days.
Note that MM can never be greater than 12 and JJ can never be greater than 31.
V 4.1.1 – 20160502 www.prorealtime.com 8 / 47

Chapter I : Fundamenta ls
Time: indicates the hour of the closing price of each bar in the format HourMinuteSecond (HHMMSS)
Example:RETURN Time
This indicator shows us the closing time of each bar in the format HHMMSS:
It is also possible to use Time and Date in the same indicator to do analysis or display results at a precisemoment. In the following example, we want to limit our indicator to the date of October 1st at precisely 9amand 1 second:a = (Date = 20081001)
b = (Time = 090001)
RETURN (a AND b)
The following constants work the same way:
Minute: Minute of the close of each bar (from 0 to 59): Only for intraday charts.
Hour: Hour of the close of each bar (from 0 to 23): Only for intraday charts.
Day: Day of the months of the closing price of each bar (from 1 to 28 or 29 or 30 or 31)
Month: Month of the closing price of each bar (from 1 to 12)
Year: Year of the closing price of each bar
DayOfWeek: Day of the Week of the close of each bar (does not use weekend days) (1=Monday,2=Tuesday, 3=Wednesday, 4=Thursday, 5=Friday)
Example:a = (Hour > 17)
b = (Day = 30)
RETURN (a AND b)
V 4.1.1 – 20160502 www.prorealtime.com 9 / 47

Chapter I : Fundamenta ls
CurrentHour: Current Hour (of the local market)
CurrentMinute: Current Minute (of the local market)
CurrentMonth: Current Month (of the local market)
CurrentSecond: Current Second (of the local market)
Today: Current Date (of the local market)
CurrentTime: Current HourMinuteSecond (of the local market)
CurrentYear: Current Year (of the local market)
CurrentDayOfWeek: Current Day of the week with the market time zone as a reference
The difference between the "Current" constants and the "non-Current" constants presented above is the"Current" aspect.
The following picture brings to light that difference (applied on the CurrentTime and Time constants). We canhighlight the fact that for "Current" constants, we must set aside the time axis and only take in consideration thedisplayed value (the value of the current time is displayed over the whole history of the chart).
Time indicates the closing time of each bar.
CurrentTime indicates the current market time.
If you want to set up your indicators with counters (number of days passed, number of bars passed etc…),you can use the Days, BarIndex and IntradayBarIndex constants.
Days: Counter of days since 1900
This constant is quite useful when you want to know the number of days that have passed. It is particularlyrelevant when you work with an (x) tick or (x) volume view.
The following example shows you the number of days passed since 1900.RETURN Days
(Be careful not to confuse the constants "Day" and "Days").
V 4.1.1 – 20160502 www.prorealtime.com 10 / 47

Chapter I : Fundamenta ls
BarIndex: Counter of bars since the beginning of the displayed historical data
The counter starts from left to right and counts each bar, including the current bar. The first bar loaded isconsidered bar number 0. Most of the time, BarIndex is used with the IF instruction presented later in themanual.
IntradayBarIndex: Counter of intraday bars
The counter displays the number of bars since the beginning of the day and then resets to zero at thebeginning of every new day. The first bar of the counter is considered bar number 0.
Let’s compare the two counter constants with two separated indicators:RETURN BarIndex
andRETURN IntradayBarIndex
We can clearly see the difference between them: IntradayBarIndex reset itself to zero at the beginning ofevery new day.
V 4.1.1 – 20160502 www.prorealtime.com 11 / 47

Chapter I : Fundamenta ls
Constants derived from price
These constants allows you to get more complete information compared to Open, High, Low and Close, since theycombine those prices so to emphasize some aspects of the financial market psychology shown on the current bar.
Range: difference between High and Low.
TypicalPrice: average between High, Low and Close
WeightedClose: weighted average of High (weight 1), Low (weight 1) and Close (weight 2)
MedianPrice: average between High and Low
TotalPrice: average between Open, High, Low and Close
Range shows the volatility of the current bar, which is an estimation of how nervous investors are.
You can create an indicator with one of the constants above only by creating a one-line indicator "RETURNRange" for example or use the constants to create a more complicated indicator.
The WeightedClose focuses on the importance of the closing price bar (even more important when appliedto daily bars or weekly bars).
The TypicalPrice and TotalPrice emphasize intraday financial market psychology since they take 3 or 4predominant prices of the current bar into account (see above).
MedianPrice uses the Median concept (the middle number) instead of the Average concept which is quiteuseful when trying to create theoretical models that don’t take investors psychology into account.
Range in %:MyRange = Range
Calcul = (MyRange / MyRange[1] - 1) * 100
RETURN Calcul
The Undefined constant
The keyword Undefined allows you to indicate to the software not to display the value of the indicator.
Undefined: undefined data (equivalent to an empty box)
You can find an example later in the manual.
How to use pre-existing indicators?
Up until now, we have described you the possibilities offered by ProBuilder concerning constants and how tocall values of bars of the past using these constants. Pre-existing indicators (the ones already programmedin ProRealTime) function the same way and so do the indicators you will code.
ProBuilder indicators are made up of three elements which syntax is:
NameOfFunction [calculated over n periods] (applied to which price or indicator)
When using the "Insert Function" button to look for a ProBuilder function and then enter it into your program,default values are given for both the period and the price or indicator argument.
Average[20](Close)
The values can be modified. For example, we can replace the 20 bars defined by default with any number ofbars (ex: Average[10], Average[15], Average[30], …, Average[n]). In the same way, we can replace "Close"with "Open" or RSI (Relative strength index). This would give us for example:
Average[20](RSI[5])
V 4.1.1 – 20160502 www.prorealtime.com 12 / 47

Chapter I : Fundamenta ls
Here are some sample programs:
Program calculating the exponential moving average over 20 periods applied to the closing price:RETURN ExponentialAverage[20](Close)
Program calculating the weighted moving average over 20 bars applied to the typical pricemm = WeightedAverage[20](TypicalPrice)
RETURN mm
Program calculating the Wilder average over 100 candlesticks applied to the Volumemm = WilderAverage[100](Volume)
RETURN mm
Program calculating the MACD (histogram) applied to the closing price. The MACD is built with the differencebetween the 12-period exponential moving average (EMA) minus the 26-period EMA. Then, we make asmoothing with an exponential moving average over 9 periods and applied to the MACD line to get theSignal line. Finally, the MACD is the difference between the MACD line and the Signal line.// Calculation of the MACD line
MACDLine = ExponentialAverage[12](Close) - ExponentialAverage[26](Close)
// Calculation of the MACD Signal line
MACDSignalLine = ExponentialAverage[9](MACDLine)
// Calculation of the difference between the MACD line and its Signal
MACDHistogramme = MACDLine - MACDSignalLine
RETURN MACDHistogramme
Variables
When you code an indicator, you may want to introduce variables. The variables option in the upper-rightcorner of the window allows you to attribute a default value to an undefined variable and manipulate it in the"settings" window of the indicator without modifying the code of your program.
Let’s calculate a simple moving average on 20 periods:RETURN Average[20](Close)
V 4.1.1 – 20160502 www.prorealtime.com 13 / 47

Chapter I : Fundamenta ls
In order to modify the number of periods for the calculation directly from the indicator "Settings" interface,replace 20 with the variable "n":RETURN Average[n](Close)
Then, click on "Add" in "Variables" and another window named "Variable definition" will be displayed. Fill it inas follows:
Click on the "OK" button. Then, in the "Settings" window (in this case "Settings MyMovingAverage") you willsee a new parameter which will allow you to modify the number of periods in the calculation of the movingaverage:
Of course, it is possible to do the same with many variables giving you the possibility to manipulate multipleparameters at the same time for the same indicator.
V 4.1.1 – 20160502 www.prorealtime.com 14 / 47

Chapter I I : Math Funct ions and ProBui lder inst ruct ions
Chapter II: Math Functions and ProBuilder instructions
Control Structures
Conditional IF instruction
The IF instruction is used to make a conditioned action, meaning executing the action if one or moreconditions is met.
The structure is made up of the instructions IF, THEN, ELSE, ELSIF, ENDIF, which are used depending onthe complexity of the conditions you defined.
One condition, one result (IF THEN ENDIF)
We can look for a condition and define an action if that condition is true. On the other hand, if the condition isnot valid, then nothing will happen (By default, Result = 0).
In this example, if current price is greater than the 20-period moving average, then we display: Result = 1and display this on the chart.Result = 0
IF Close > Average[20](Close) THEN
Result = 1
ENDIF
RETURN Result
Result is equal to 0.IF closing price > 20-period moving averageTHEN Result = 1, otherwise Result =0END OF CONDITION
RETURN must always be followed with the storage variable containing the result in order to
display the result on the chart (in the last example we use the variable "Result").
One condition, two results (IF THEN ELSE ENDIF)
We can also define a different result if the condition is not true. Let us go back to the previous example: if theprice is greater than the moving average on 20 periods, then display 1, else, displays -1.IF Close > Average[20](Close) THEN
Result = 1
ELSE
Result = -1
ENDIF
RETURN Result
NB: We have created a binary indicator. For more information, see the section on binary and ternaryindicators later in this manual.
Sequential IF conditions
You can create sub-conditions after the validation of the main condition, meaning conditions which must bevalidated one after another. For that, you need to build a sequence of IF structures, one included in the other.You should be careful to insert in the code as many ENDIF as IF. Example:
Double conditions on moving averages:IF (Average[12](Close) - Average[20](Close) > 0) THEN
IF ExponentialAverage[12](Close) - ExponentialAverage[20](Close) > 0 THEN
Result = 1
ELSE
Result = -1
ENDIF
ENDIF
RETURN Result
V 4.1.1 – 20160502 www.prorealtime.com 15 / 47

Chapter I I : Math Funct ions and ProBui lder inst ruct ions
Multiple conditions (IF THEN ELSE ELSIF ENDIF)
You can define a specific result for a specific condition. The indicator reports many states: if Condition 1 isvalid then do Action1; else, if Condition 2 is valid, then do Action 2 …if none of the previously mentionedconditions are valid then do Action n.
This structure uses the following instructions: IF, THEN, ELSIF, THEN.... ELSE, ENDIF.
The syntax is:IF (Condition1) THEN
(Action1)
ELSIF (Condition2) THEN
(Action2)
ELSIF (Condition3) THEN
(Action3)
...
...
...
ELSE
(Action n)
ENDIF
You can also replace ELSIF with ELSE IF but your program will take longer to write. Of course, you will haveto end the loop with as many instance of ENDIF as IF. If you want to make multiple conditions in yourprogram, we advise you to use ELSIF rather than ELSE IF for this reason.
Example: detection of bearish and bullish engulfing lines using the Elsif instruction
This indicator displays 1 if a bullish engulfing line is detected, -1 if a bearish engulfing line is detected, and 0if neither of them is detected.
// Detection of a bullish engulfing line
Condition1 = Close[1] < Open[1]
Condition2 = Open < Close[1]
Condition3 = Close > Open[1]
Condition4 = Open < Close
// Detection of a bearish engulfing line
Condition5 = Close[1] > Open[1]
Condition6 = Close < Open
Condition7 = Open > Close[1]
Condition8 = Close < Open[1]
IF Condition1 AND Condition2 AND Condition3 AND Condition4 THEN
a = 1
ELSIF Condition5 AND Condition6 AND Condition7 AND Condition8 THEN
a = -1
ELSE
a = 0
ENDIF
RETURN a
V 4.1.1 – 20160502 www.prorealtime.com 16 / 47

Chapter I I : Math Funct ions and ProBui lder inst ruct ions
Example: Resistance Demarks pivotIF DClose(1) > DOpen(1) THEN
Phigh = DHigh(1) + (DClose(1) - DLow(1)) / 2
Plow = (DClose(1) + DLow(1)) / 2
ELSIF DClose(1) < DOpen(1) THEN
Phigh = (DHigh(1) + DClose(1)) / 2
Plow = DLow(1) - (DHigh(1) - DClose(1)) / 2
ELSE
Phigh = DClose(1) + (DHigh(1) - DLow(1)) / 2
Plow = DClose(1) - (DHigh(1) - DLow(1)) / 2
ENDIF
RETURN Phigh , Plow
Example: BarIndex
In the chapter I of our manual, we presented BarIndex as a counter of bars loaded. BarIndex is often usedwith IF. For example, if we want to know if the number of bars in your chart exceeds 23 bars, then we willwrite:IF BarIndex <= 23 THEN
a = 0
ELSIF BarIndex > 23 THEN
a = 1
ENDIF
RETURN a
Iterative FOR Loop
FOR is used when we want to exploit a finite series of elements. This series must be made up of wholenumbers (ex: 1, 2, 3, ..., 6, 7 or 7, 6, ..., 3, 2, 1) and ordered.
Its structure is formed of FOR, TO, DOWNTO, DO, NEXT. TO and DOWNTO are used depending on theorder of appearance in the series of the elements (ascending order or descending order). We also highlightthe fact that what is between FOR and DO are the extremities of the interval to scan.
Ascending (FOR, TO, DO, NEXT)
FOR (Variable = BeginningValueOfTheSeries) TO EndingValueOfTheSeries DO
(Action)
NEXT
Example: Smoothing of a 12-period moving average
Let’s create a storage variable (Result) which will sum the 11, 12 and 13-period moving averages.
Result = 0
FOR Variable = 11 TO 13 DO
Result = Average[Variable](Close) + Result
NEXT
REM Let’s create a storage variable (AverageResult) which will divide Result by 3 anddisplay average result. Average result is a smoothing of the 12-period moving average.
AverageResult = Result / 3
RETURN AverageResult
V 4.1.1 – 20160502 www.prorealtime.com 17 / 47

Chapter I I : Math Funct ions and ProBui lder inst ruct ions
Let’s see step by step how the program does the calculation:
Mathematically, we want to calculate the average of the moving averages calculated on 11, 12 and 13 periods.
Variable will then get successively the values 11, 12 and 13 (FOR always works with whole numbers only).
Result = 0
When Period = 11: The new Result = the 11 - period moving average + the previous value of result (0).
The counter receives its next value
When Period = 12: The new Result = the 12 - period moving average + the previous value of result.
The counter receives its next value
When Period = 13: The new Result = the 13 - period moving average + the previous value of result.
13 is the last value of the counter.
We end the “FOR” loop with the “NEXT” instruction.
We then display AverageResult.
This code simply means the "Variable" will, first of all get the beginning value of the series, then variable willreceive the next one (previous + 1) and so on until variable is equal to or greater than the last number in theseries. Then the loop is over.
Example: Average of the highest price over the 20 last barsSUMhigh = 0
IF BarIndex < 5 THEN
MAhigh = Undefined
ELSE
FOR i = 0 TO 4 DO
SUMhigh = High[i]+SUMhigh
NEXT
ENDIF
MAhigh = SUMhigh / 5
RETURN MAhigh
If there are not yet 5 periods displayed
Then we attribute to MAhigh value "Undefined" (not displayed)
ELSE
FOR values of i between 1 to 5
We sum the 5 last "High" values
We calculate the average for the last 5 periods and
store the result in MAhigh
We display MAhigh
Descending (FOR, DOWNTO, DO, NEXT)
The descending loop uses the following instructions: FOR, DOWNTO, DO, NEXT.
Its syntax is:FOR (Variable = EndingValueOfTheSeries) DOWNTO BeginningValueOfTheSeries DO
(Action)
NEXT
Let us go back to the previous example (the 5-period moving average of "High"):
We can notice that we have just inverted the extremities of the scanned interval.Mahigh = 0
SUMhigh = 0
IF BarIndex = 0 THEN
Mahigh = Undefined
ELSE
FOR i = 4 DOWNTO 0 DO
SUMhigh = High[i] + SUMhigh
NEXT
ENDIF
Mahigh = SUMhigh / 5
RETURN Mahigh
V 4.1.1 – 20160502 www.prorealtime.com 18 / 47

Chapter I I : Math Funct ions and ProBui lder inst ruct ions
Conditional WHILE Loop
WHILE is used to keep doing an action while a condition remains true. You will see that this instruction isvery similar to the simple conditional instruction IF/THEN/ENDIF.
This structure uses the following instructions: WHILE, (DO optional), WEND (end WHILE)
Its syntax is:WHILE (Condition) DO
(Action 1)
…
(Action n)
WEND
This code lets you show the number of bars separating the current candlestick from a previous highercandlestick within the limit of 30 periods.i = 1
WHILE high > high [i] and i < 30 DO
i = i + 1
WEND
RETURN i
Example: indicator calculating the number of consecutive increasesIncrease = (Close > Close[1])
Count = 0
WHILE Increase[Count] DO
Count = Count + 1
WEND
RETURN Count
General comment on the conditional instruction WHILE:
Similar to IF, the program will not process the conditional loop if the condition is unknown.
For example:Count = 0
WHILE i <> 11 DO
i = i + 1
Count = Count + 1
WEND
RETURN Count
The WHILE instruction does not recognize the value of i. Therefore, it cannot test whether i is equal to 10 ornot and the loop will not be processed, hence the count is equal to 0.
The correct code would be:i = 0
Count = 0
WHILE i <> 11 DO
i = i + 1
Count = Count + 1
WEND
RETURN Count
In this code, i is initialized. The loop will then work correctly since the condition for beginning the loop is valid.
V 4.1.1 – 20160502 www.prorealtime.com 19 / 47

Chapter I I : Math Funct ions and ProBui lder inst ruct ions
BREAK
The BREAK instruction allows you to make a forced exit out of a WHILE loop or a FOR loop. Combinationsare possible with the IF command, inside a WHILE loop or a FOR loop.
With WHILE
When we want to exit a conditional WHILE loop, we use BREAK in the following way:WHILE (Condition) DO
(Action)
IF (ConditionBreak)
BREAK
WEND
The use of BREAK in a WHILE loop is only interesting if we want to test an additional condition for which thevalue can not be known while in the WHILE loop. For example, lets look at a stochastic which is onlycalculated in a bullish trend:line = 0
Increase = (Close - Close[1]) > 0
i = 0
WHILE Increase[i] DO
i = i + 1
// Si high - low, we exit the loop to avoid a division by zero.
IF (high-low) = 0 then
BREAK
ENDIF
osc = (close – low) / (high – low)
line = AVERAGE [i] (osc)
WEND
RETURN line
With FOR
When we try to get out of an iterative FOR loop, without reaching the last (or first) value of the series, we useBREAK.FOR (Variable = BeginningValueOfTheSeries) TO EndingValueOfTheSeries DO
(Action)
BREAK
NEXT
Let’s take for example an indicator cumulating increases of the volume of the last 19 periods. This indicatorwill be equal to 0 if the volume decreases.Count = 0
FOR i = 0 TO 19 DO
IF (Volume[i] > Volume[i + 1]) THEN
Count = Count + 1
ELSE
BREAK
ENDIF
NEXT
RETURN Count
In this code, if BREAK weren’t used, the loop would have continued until 19 (last element of the series) evenif the condition count is not valid.
However, with BREAK, as soon as the condition is valid, the result becomes 0.
V 4.1.1 – 20160502 www.prorealtime.com 20 / 47

Chapter I I : Math Funct ions and ProBui lder inst ruct ions
CONTINUE
The CONTINUE instruction allows you to resume the program reader at the line where WHILE or FOR iswritten, thus without restarting completely the loop (any incremented counter will thus keep its value and notbe reset to 0). This command is often used with BREAK, either to leave the loop (BREAK) or to stay in theloop (CONTINUE).
With WHILE
Let’s create a program counting the number of candlesticks whose close and open are greater than those ofthe candlestick preceding them. If the condition is not valid, then the counter will be reset to 0.
Increase = Close > Close[1]
Count = 0
WHILE Open < Open[1] DO
IF Increase[Count] THEN
Count = Count + 1
CONTINUE
ENDIF
BREAK
WEND
RETURN Count
When using CONTINUE, if the IF condition is not valid, then the WHILE loop is not ended. This allows us tocount the number of patterns detected with this condition. Without the CONTINUE instruction, the programwould leave the loop, even if the IF condition is validated. Then, we would not be able to continue countingthe number of patterns detected and the result would be binary (1, 0).
With FOR
Let’s create a program counting the number of candlesticks whose close and open are greater than those ofthe candlestick preceding them. If the condition is not valid, then the counter will be reset to 0.
Increase = Close > Close[1]
Count = 0
FOR i = 1 TO BarIndex DO
IF Increase[Count] THEN
Count = Count + 1
CONTINUE
ENDIF
BREAK
NEXT
RETURN Count
FOR gives you the possibility to test the condition over all the data loaded. When used with CONTINUE, ifthe IF condition is validated, then we do not leave the FOR loop and resume it with the next value of i. This ishow we count the number of patterns detected by this condition.
Without CONTINUE, the program would leave the loop, even if the IF condition is validated. Then, we wouldnot be able to count the number of patterns detected and the result would be binary (1, 0).
V 4.1.1 – 20160502 www.prorealtime.com 21 / 47

Chapter I I : Math Funct ions and ProBui lder inst ruct ions
ONCE
The ONCE instruction is used to initialize a variable at a certain value "only ONE TIME".
Knowing that for the whole program, the language will read the code for each bar displayed on the chartbefore returning the result, you must then keep in mind that ONCE:
Is processed only one time by the program including the second reading.
During the second reading of the program, it will stock the values calculated in the previous reading.
To fully understand how this command works, you need to perceive how the language processes thecode, hence the usefulness of the next example.
These are two programs returning respectively 0 and 15 and which only difference is the ONCE commandadded:
Program 1 Program 21
2
3
4
5
6
7
Count = 0
i = 0
IF i <= 5 THEN
Count = Count + i
i = i + 1
ENDIF
RETURN Count
1
2
3
4
5
6
7
ONCE Count = 0
ONCE i = 0
IF i <= 5 THEN
Count = Count + i
i = i + 1
ENDIF
RETURN Count
Let’s see how the language read the code.
Program 1:
For the first bar, the language will read line 1 (L1: Count = 0; i = 0), then L2, L3, L4, L5 and L6 (Count = 0; i =1). For the next bar, the program starts at the beginning and both i and count are set to 0, so count willalways return 0 for every bar.
Program 2:
For the first bar, the language will read L1 (Count = 0; i = 0), then L2, L3, L4, L5, L6 (Count = 0; i = 1). Whenit arrives at the line "RETURN", it restarts the loop to calculate the value of the next bar starting from L3 (thelines with ONCE are processed only one time), L4, L5, L6 (Count = 1; i = 2), then go back again (Count =3; i = 3) and so forth to (Count = 15; i = 6). Arrived at this result, the IF loop is not processed anymorebecause the condition is not valid anymore; the only line left to read is L7, hence the result is 15 for theremaining bars loaded.
V 4.1.1 – 20160502 www.prorealtime.com 22 / 47

Chapter I I : Math Funct ions and ProBui lder inst ruct ions
Mathematical Functions
Common unary and binary Functions
Let’s focus now on the Mathematical Functions. You will find in ProBuilder the main functions known inmathematics. Please note that a and b are examples and can be numbers or any other variable in yourprogram.
MIN(a, b): calculate the minimum of a and b
MAX(a, b): calculate the maximum of a and b
ROUND(a): round a to the nearest whole number
ABS(a): calculate the absolute value of a
SGN(a): shows the sign of a (1 if positive, -1 if negative)
SQUARE(a): calculate a squared
SQRT(a): calculate the square root of a
LOG(a): calculate the Neperian logarithm of a
EXP(a): calculate the exponent of a
COS(a): calculate the cosine of a
SIN(a): calculate the sine of a
TAN(a): calculate the tangent of a
ATAN(a): calculate the arc-tangent of a
Let’s code the example of the normal distribution in mathematics. It’s interesting because it use the squarefunction, the square root function and the exponential function at the same time:
REM Normal Law applied to x = 10, StandardDeviation = 6 and MathExpectation = 8
REM Let’s define the following variables in the variable option:
StandardDeviation = 6
MathExpectation = 8
x = 10
Indicator = EXP((1 / 2) * (SQUARE(x – MathExpectation) / Ecarttype)) / (StandardDeviation* SQRT(2 / 3.14))
RETURN Indicator
Common mathematical operators
a < b: a is strictly less than b
a <= b or a =< b: a is less than or equal to b
a > b: a is strictly greater than b
a >= b ou a => b: a is greater than or equal to b
a = b: a is equal to b (or b is attributed to a)
a <> b: a is different from b
Charting comparison functions
a CROSSES OVER b: the a curve crosses over the b curve
a CROSSES UNDER b: the a curve crosses under the b curve
V 4.1.1 – 20160502 www.prorealtime.com 23 / 47
Chapter I I : Math Funct ions and ProBui lder inst ruct ions
Summation functions
cumsum: Calculates the sum of a price or indicator over all bars loaded on the chart
The syntax of cumsum is:cumsum (price or indicator)
Ex: cumsum(Close) calculates the sum of the close of all the bars loaded on the chart.
summation: Calculates the sum of a price or indicator over the last n bars
The sum is calculated starting from the most recent value (from right to left)
The syntax of summation is:summation[number of bars]((price or indicator)
Ex: summation[20](Open) calculates the sum of the open of the last 20 bars.
Statistical functions
The syntax of all these functions is the same as the syntax for the Summation function, that is:lowest[number of bars](price or indicator)
lowest: displays the lowest value of the price or indicator written between brackets, over the number ofperiods defined
highest: displays the highest value of the price or indicator written between brackets, over the numberof periods defined
STD: displays the standard deviation of a price or indicator, over the number of periods defined
STE: displays the standard error of a price or indicator, over the number of periods defined
Logical operators
As any programming language, it is necessary to have at our disposal some Logical Operators to createrelevant indicators. These are the 4 Logical Operators of ProBuilder:
NOT(a): logical NO
a OR b: logical OR
a AND b: logical AND
a XOR b: exclusive OR
Calculation of the trend indicator: On Balance Volume (OBV):IF NOT((Close > Close[1]) OR (Close = Close[1])) THEN
MyOBV = MyOBV - Volume
ELSE
MyOBV = MyOBV + Volume
ENDIF
RETURN MyOBV
ProBuilder instructions
RETURN: displays the result
CustomClose: displays a customizable price value; by default, this price is "Close"
CALL: calls another ProBuilder indicator to use in your current program
AS: names the result displayed
COLOURED: colors the displayed curve in with the color of your choice
V 4.1.1 – 20160502 www.prorealtime.com 24 / 47
Chapter I I : Math Funct ions and ProBui lder inst ruct ions
RETURN
We have already seen in chapter I how important the RETURN instruction was. It has some specificproperties we need to know to avoid programming errors.
The main points to keep in mind when using RETURN in order to write a program correctly are that Return isused:
One and only one time in each ProBuilder program
Always at the last line of code
Optionally with other functions such as AS and COLOURED
To display many results; we write RETURN followed with what we want to display and separated with acomma (example: RETURN a,b)
REM or //
REM allows you to write remarks or comments inside the code. They are mainly useful to remember how afunction you coded works. These remarks will be read but of course not processed by the program. Let’sillustrate the concept with the following example:
REM This program returns the simple moving average over 20 periods applied to the closingprice
RETURN Average[20](Close)
Don‘t use special characters (examples: é,ù,ç,ê…) in ProBuilder. This does not apply in the REM
or // sections (comments).
CustomClose
CustomClose is a constant allowing you to display the Close, Open, High, Low constants and manyothers, which can be customized in the Settings window of the indicator.
Its syntax is the same as the one of the constants adapted to the timeframe of the chart:CustomClose[n]
Example:// Displays the average over 20 periods applied to CustomClose
RETURN CustomClose[2]
By clicking on the wrench in the upper left corner of the chart, you will see that it is possible to customize theprices used in the calculation.
V 4.1.1 – 20160502 www.prorealtime.com 25 / 47

Chapter I I : Math Funct ions and ProBui lder inst ruct ions
CALL
CALL allows you to use a personal indicator you have coded before in the platform.
The quickest method is to click “Insert Function” then select the "User Indicators" category and then selectthe name of the indicator you want to use and click "Add".
For example, imagine you have coded the Histogram MACD and named it HistoMACD.
Select your indicator and click on "Add". You will see in the programming zone:
myHistoMACD = CALL HistoMACD
The software gave the name "myHistoMACD" to the indicator "HistoMACD".
This means that for the rest of your program, if you want to use the HistoMACD indicator, you will have to callit "myHistoMACD".
AS
The keyword AS allows you to name the different results displayed. This instruction is used with RETURNand its syntax is:
RETURN Result1 AS "Curve Name", Result2 AS "Curve Name", …
The advantage of this command is that it makes it easier to identify the different curves on your chart.
Example:a = ExponentialAverage[200](Close)
b = WeightedAverage[200](Close)
c = Average[200](Close)
RETURN a AS "Exponential Average", b AS "Weighted Average", c AS "Arithmetical Average"
COLOURED
COLOURED is used after the RETURN command to color the curve displayed with the color of your choice,defined with the RGB norm (red, green, blue). These are the main colors of this norm:
COLORRGB VALUE
(RED, GREEN, BLUE)ENGLISH
(0, 0, 0) Black
(255, 255, 255) White
(255, 0, 0) Red
(0, 255, 0) Green
(0, 0, 255) Blue
(255, 255, 0) Yellow
(0, 255, 255) Cyan
(255, 0, 255) Magenta
V 4.1.1 – 20160502 www.prorealtime.com 26 / 47

Chapter I I : Math Funct ions and ProBui lder inst ruct ions
The syntax of the Coloured command is:RETURN Indicator COLOURED(Red, Green, Blue)
The AS command can be associated with the COLOURED(. , . , .) command. This association must be usedin this order:RETURN Indicator COLOURED(Red, Green, Blue) AS "Name Of The Curve"
Let’s go back to the previous example and insert COLOURED in the "RETURN" line.a = ExponentialAverage[200](Close)
b = WeightedAverage[200](Close)
c = Average[200](Close)
RETURN a COLOURED(255, 0, 0) AS "Exponential Moving Average", b COLOURED(0, 255, 0) AS"WeightedMoving Average", c COLOURED(0, 0, 255) AS "Simple Moving Average"
This picture shows you the color customization of the result.
V 4.1.1 – 20160502 www.prorealtime.com 27 / 47

Chapter I I : Math Funct ions and ProBui lder inst ruct ions
Drawing instructions
The following instructions were added in version 10.3 of the software. They are available to use from this versiononwards. These instructions let you draw objects on charts and also draw custom candles and bar charts.
BACKGROUNDCOLOR : Lets you color the background of the chart or specific bars (such as odd/evendays). The colored zone starts halfway between the previous bar and the next bar
Example: BACKGROUNDCOLOR (0, 127, 255, 25)
Its possible to use a variable for the colors if you want the background color to change based on yourconditions.
Example: BACKGROUNDCOLOR (0, color, 255, 25)
DRAWBARCHART : Draws a custom bar on the chart. Open, high, low and close can be constants orvariables.
Example: DRAWBARCHART (open, high, low, close) COLOURED (0, 255, 0)
DRAWCANDLE : Draws a custom candlestick on the chart. Open, high, low and close can be constants orvariables.
Example: DRAWCANDLE (open, high, low, close) COLOURED (0, 255, 0)
V 4.1.1 – 20160502 www.prorealtime.com 28 / 47
Chapter I I : Math Funct ions and ProBui lder inst ruct ions
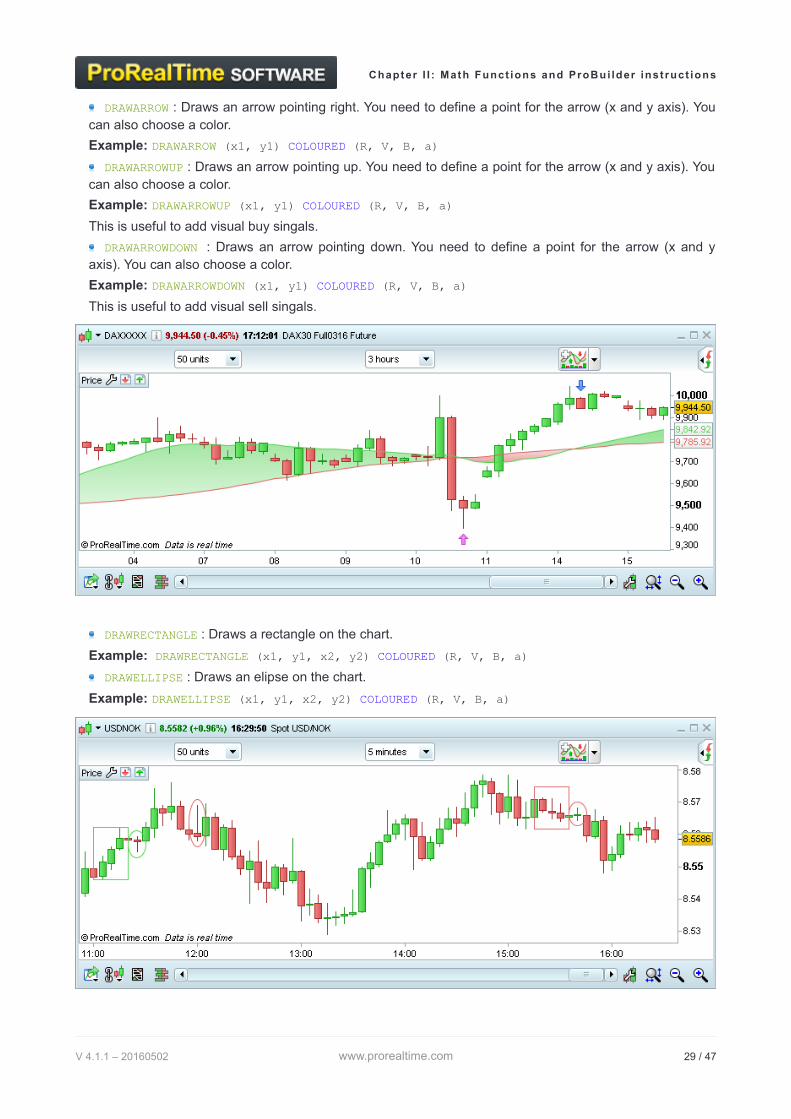
DRAWARROW : Draws an arrow pointing right. You need to define a point for the arrow (x and y axis). Youcan also choose a color.
Example: DRAWARROW (x1, y1) COLOURED (R, V, B, a)
DRAWARROWUP : Draws an arrow pointing up. You need to define a point for the arrow (x and y axis). Youcan also choose a color.
Example: DRAWARROWUP (x1, y1) COLOURED (R, V, B, a)
This is useful to add visual buy singals.
DRAWARROWDOWN : Draws an arrow pointing down. You need to define a point for the arrow (x and yaxis). You can also choose a color.
Example: DRAWARROWDOWN (x1, y1) COLOURED (R, V, B, a)
This is useful to add visual sell singals.
DRAWRECTANGLE : Draws a rectangle on the chart.
Example: DRAWRECTANGLE (x1, y1, x2, y2) COLOURED (R, V, B, a)
DRAWELLIPSE : Draws an elipse on the chart.
Example: DRAWELLIPSE (x1, y1, x2, y2) COLOURED (R, V, B, a)
V 4.1.1 – 20160502 www.prorealtime.com 29 / 47

Chapter I I : Math Funct ions and ProBui lder inst ruct ions
DRAWLINE : Draws a line on the chart.
Example: DRAWLINE (x1, y1, x2, y2) COLOURED (R, V, B, a)
DRAWHLINE : Draws a horizontal line on the chart.
Example: DRAWHLINE (y1) COLOURED (R, V, B, a)
DRAWVLINE : Draws a vertical line on the chart.
Example: DRAWVLINE (x1) COLOURED (R, V, B, a)
DRAWSEGMENT : Draws a segment on the chart.
Example: DRAWSEGMENT (x1, y1, x2, y2) COLOURED (R, V, B, a)
Example: DRAWSEGMENT (barindex, close, barindex[5], close[5])
DRAWTEXT : Adds a text field to the chart with the text of your choice at a specified location.
Example: DRAWTEXT ("your text", x1, y1) COLOURED (R, V, B, a)
DRAWONLASTBARONLY : Parameter that lets you draw drawn objects on the last bar only. This parametershould always be used with "CALCULATEONLASTBARS" to optimize calculations.
Example: DEFPARAM DRAWONLASTBARONLY = true
CALCULATEONLASTBARS : This parameter lets you increase the speed at which indicators are calculatedby defining the number of bars to display the results, starting with the most recent bar.
Example: DEFPARAM CALCULATEONLASTBARS = 200
V 4.1.1 – 20160502 www.prorealtime.com 30 / 47

Chapter I I I : Pract ica l asp ects
Chapter III: Practical aspects
Why and how to create binary or ternary indicators
A binary or ternary indicator is an indicator which returns only two or three possible results (usually 0, 1 or-1). Its main purpose in a trading context is to identify very quickly the pattern or conditions you defined inyour indicator with a visual signal.
Purpose of a binary or ternary indicator:
Detect the main candlestick patterns (ex: Harami, Morning Stars, Hammers, …)
Make it easier to read the chart when trying to identify specific conditions
Place simple 1-condition alerts on an indicator which includes several conditions you will have morealerts at your disposal!
Detect complex conditions on historical data loaded
Make it easier to create a backtest
Furthermore, you can find in the ProBacktest manual many examples of stops to be inserted in investmentstrategies.
Binary or ternary indicators are built essentially with IF structures. We advise you to read the IF sectionbefore continuing your reading.
Lets look at an example of a binary and ternary indicator:
Binary Indicator: hammer detection hammerHammer = Close>Open AND High = Close AND (Open-Low) >= 3*(Close-Open)
IF Hammer THEN
Result = 1
ELSE
Result = 0
ENDIF
RETURN Result AS "Hammer"
Ternary Indicator: Golden Cross and Death Cross detectiona = ExponentialAverage[10](Close)
b = ExponentialAverage[20](Close)
c = 0
// Golden Cross detection
IF a CROSSES OVER b THEN
c = 1
ENDIF
// Death Cross detection
IF a CROSSES UNDER b THEN
c = -1
ENDIF
RETURN c
V 4.1.1 – 20160502 www.prorealtime.com 31 / 47

Chapter I I I : Pract ica l asp ects
Note: we have displayed the exponential moving average over 10 and 20 periods both applied to the close inorder to highlight the results of the indicator.
You can find other candlestick pattern indicators in the "Exercises" chapter later in this manual.
Creating stop indicators to follow a position
It is possible to create STOP indicators, meaning potential places to exit the market defined by personalizedparameters.
With the backtesting module ProBacktest, which is the subject of another programming manual, you can alsodefine the stop levels of a backtest. However, programming a stop as an indicator is interesting because:
It allows to visualize the stop as a line which updates in real-time on the chart (ex: trailing stop)
It is possible to place real-time alerts to be immediately informed of the situation
It is not necessary to create long or short orders (contrary to ProBacktest)
Programming Stops is also a means to master the commands you saw in the previous chapters.
These are the 4 categories of stop we will focus on:
StaticTake Profit STOP
Static STOP Loss
Inactivity STOP
Trailing STOP (trailing stop loss or trailing take profit)
The indicators presented in the following examples are possible codes to create stop indicators. You willmost probably personalize them using the instructions you learned in the previous chapters.
V 4.1.1 – 20160502 www.prorealtime.com 32 / 47

Chapter I I I : Pract ica l asp ects
StaticTake Profit STOPA Static Take-Profit designates a level that if price reaches it, we plan to close our position and exit withgains. By definition, this STOP is a fixed level (horizontal line). The user of this kind of STOP will exit hisposition and take his profit when this level is reached.
The indicator coded below indicates two levels and “StartingTime” is the moment you entered your position:
If you are a buyer, you will take into account the higher curve, representing a 10% profit (110% of theprice when you took your long position).
If you are a seller, you will take into account the lower curve, representing a10% profit (90% of the pricewhen you took your short position).
// We define in the variable option:
// StartingTime = 100000 (this is an example for 10 am; set this to the time you enteredyour position)
// Price= Price when you took your position
// You can look at StopLONG if looking at a long position and StopShort if you arelooking at a short position. You can also remove StopLONG or StopSHORT if you only workwith long positions or only work with short positions.
// AmplitudeUp represents the variation rate of Price used to draw the Take Profit forlong position (default: 1.1)
// AmplitudeDown represents the variation rate of Price used to draw the Take Profit forshort position (default: 0.9)
IF Time = StartingTime THEN
StopLONG = AmplitudeUp * Price
StopSHORT = AmplitudeDown * Price
ENDIF
RETURN StopLONG COLOURED(0, 0, 0) AS "TakeProfit LONG 10%", StopSHORT COLOURED(0, 255, 0)AS "TakeProfit SHORT 10%"
Static STOP lossA Static STOP Loss is the contrary of a Static Take-Profit STOP, meaning if price reaches it, we plan to closeour position and exit with losses. This STOP is very useful when you are losing money and try exit themarket to limit your losses to the minimum. Just like the Static Take-Profit, this STOP defines a fixed level,but this time, the user will exit his position and cut his losses when this level is reached.
The indicator coded below indicates two levels and “StartingTime” is the moment you entered your position:
If you are a buyer, you will take into account the lower curve, representing a 10% loss (90% of the pricewhen you took your long position).
If you are a seller, you will take into account the higher curve, representing a 10% loss (110% of theprice when you took your short position).
The code of this indicator is:// We define in the variable option:
// StartingTime = 100000 (this is an example for 10 am; set this to the time you enteredyour position)
// Price= Price when you took your position
// You can look at StopLONG if looking at a long position and StopShort if you arelooking at a short position. You can also remove StopLONG or StopSHORT if you only workwith long positions or only work with short positions.
// AmplitudeUp represents the variation rate of Price used to draw the Stop Loss forshort position (default: 0.9)
// AmplitudeDown represents the variation rate of Price used to draw the Tsop Loss forlong position (default: 1.1)
IF Time = StartingTime THEN
StopLONG = AmplitudeUp * Price
StopSHORT = AmplitudeDown * Price
ENDIF
RETURN StopLONG COLOURED(0, 0, 0) AS "StopLoss LONG 10%", StopSHORT COLOURED(0, 255, 0)AS "StopLoss SHORT 10%"
V 4.1.1 – 20160502 www.prorealtime.com 33 / 47

Chapter I I I : Pract ica l asp ects
Inactivity STOP
An inactivity STOP closes the position when the gains have not obtained a certain objective (defined in % orin points) over a certain period (defined in number of bars).
Remember to define the variables in the "Variables" section.
Example of Inactivity Stop on Intraday Charts:
This stop must be used with those two indicators:
The first indicator juxtaposed to the curve of the price
The second indicator must be displayed in a separated chart
Indicator1
// We define in the variable option:
// MyVolatility = 0.01 represents variation rate between the each part of the range andthe close
IF IntradayBarIndex = 0 THEN
ShortTarget = (1 - MyVolatility) * Close
LongTarget = (1 + MyVolatility) * Close
ENDIF
RETURN ShortTarget AS "ShortTarget", LongTarget AS "LongTarget"
Indicator2
// We define in the variable option:
REM We supposed that you take an "On Market Price" position
// MyVolatility = 0.01 represents variation rate between the each part of the range andthe close
// NumberOfBars=20: the close can fluctuate within the range defined during a maximum ofNumberOfBars before the position is cut (Result = 1)
Result = 0
Cpt = 0
IF IntradayBarIndex = 0 THEN
ShortTarget = (1 - MyVolatility) * Close
LongTarget = (1 + MyVolatility) * Close
ENDIF
FOR i = IntradayBarIndex DOWNTO 1 DO
IF Close[i] >= ShortTarget AND Close[i] <= LongTarget THEN
Cpt = Cpt + 1
ELSE
Cpt = 0
ENDIF
IF Cpt = NumberOfBars THEN
Result = 1
ENDIF
NEXT
RETURN Result
V 4.1.1 – 20160502 www.prorealtime.com 34 / 47

Chapter I I I : Pract ica l asp ects
Trailing Stop
A trailing STOP follows the evolution of the price dynamically and indicates when to close a position.
We suggest you two ways to code the trailing STOP, the first one representing a Dynamic Trailing Stop Loss,and the other one a Dynamic Trailing Take Profit.
Dynamic Trailing STOP LOSS (to be used in intraday trading)
// Define the following variables in the variable section:
// StartingTime = 090000 (this is an example for 9 am; set this to the time you enteredyour position)
REM We supposed that you take an "On Market Price" position
// Amplitude represents the variation rate of the "Cut" curve compared to the "Lowest"curves (for example, we can take Amplitude = 0.95)
IF Time = StartingTime THEN
IF lowest[5](Close) < 1.2 * Low THEN
IF lowest[5](Close) >= Close THEN
Cut = Amplitude * lowest[5](Close)
ELSE
Cut = Amplitude * lowest[20](Close)
ENDIF
ELSE
Cut = Amplitude * lowest[20](Close)
ENDIF
ENDIF
RETURN Cut AS "Trailing Stop Loss"
Dynamic Trailing STOP Profit (to be used in intraday trading)
// Define the following variables in the variable section:
// StartingTime = 090000 (this is an example for 9 am; set this to the time you enteredyour position)
REM You take an “On Market Price” position
// Amplitude represents the variation rate of the "Cut" curve compared to the "Lowest"curves (for example, we can take Amplitude = 1.015)
IF Time = StartingTime THEN
StartingPrice = Close
ENDIF
Price = StartingPrice - AverageTrueRange[10]
TrailingStop = Amplitude * highest[15](Price)
RETURN TrailingStop COLOURED (255, 0, 0) AS "Trailing take profit"
V 4.1.1 – 20160502 www.prorealtime.com 35 / 47

Chapter IV: Exerc ises
Chapter IV: Exercises
Candlesticks patterns
GAP UP or DOWN
The candlesticks can be either black or white
A gap is defined by these two conditions:
(the current low is strictly greater than the high of the previous bar) or (the current high is strictly lesserthan the low of the previous bar)
the absolute value of ((the current low – the high of the previous bar)/the high of the previous bar) isstrictly greater than amplitude) or ((the current high – the low of the previous bar)/the low of the previousbar) is strictly greater than amplitude)
// Initialization of Amplitude
Amplitude = 0.001
// Initialization of detector
Detector = 0
// Gap Up
// 1st condition of the existence of a gap
IF Low > High[1] THEN
// 2nd condition of the existence of a gap
IF ABS((Low - High[1]) / High[1]) > Amplitude THEN
// Behavior of the detector
Detector = 1
ENDIF
ENDIF
// Gap Down
// 1st condition of the existence of a gap
IF High < Low[1] THEN
// 2nd condition of the existence of a gap
IF ABS((High - Low[1]) / Low[1]) > Amplitude THEN
// Behavior of the detector
Detector = -1
ENDIF
ENDIF
// Result display
RETURN Detector AS "Gap detection"
V 4.1.1 – 20160502 www.prorealtime.com 36 / 47

Chapter IV: Exerc ises
Doji (flexible version)
In this code, we define a doji to be a candlestick with a range (High – Close) is greater than 5 times the absolute value of (Open – Close).
Doji = Range > ABS(Open - Close) * 5
RETURN Doji AS "Doji"
Doji (strict version)
We define the doji with a Close equal to its Open.
Doji = (Open = Close)
RETURN Doji AS "Doji"
Indicators
BODY MOMENTUM
The Body Momentum is mathematically defined by:
BodyMomentum = 100 * BodyUp / (BodyUp + BodyDown)
BodyUp is a counter of bars for which close is greater than open during a certain number of periods.
BodyDown is a counter of bars for which open is greater than close during a certain number of periods.
Periods = 14
b = Close - Open
IF BarIndex > Periods THEN
Bup = 0
Bdn = 0
FOR i = 1 TO Periods
IF b[i] > 0 THEN
Bup = Bup + 1
ELSIF b[i] < 0 THEN
Bdn = Bdn + 1
ENDIF
NEXT
BM = (Bup / (Bup + Bdn)) * 100
ELSE
BM = Undefined
ENDIF
RETURN BM AS "Body Momentum"
V 4.1.1 – 20160502 www.prorealtime.com 37 / 47

Chapter IV: Exerc ises
ELLIOT WAVE OSCILLATOR
The Elliot wave oscillator shows the difference between two moving averages.
Parameters:
a: short MA periods (5 by default)
b: long MA periods (35 by default)
This oscillator permits to distinguish between wave 3 and wave 5 using Elliot wave theory.
The short MA shows short-term price action whereas the long MA shows the longer term trend.
When the prices form wave 3, the prices climb strongly which shows a high value of the Elliot WaveOscillator.
In wave 5, the prices climb more slowly, and the oscillator will show a lower value.
RETURN Average[5](MedianPrice) - Average[35](MedianPrice) AS "Elliot Wave Oscillator"
Williams %R
This is an indicator very similar to the Stochastic oscillator. To draw it, we define 2 curves:
1) The curve of the highest of high over 14 periods
2) The curve of the lowest of low over 14 periods
The %R curve is defined by this formula: (Close – Lowest Low ) / (Highest High – Lowest Low) * 100
HighestH = highest[14](High)
LowestL = lowest[14](Low)
MyWilliams = (Close - LowestL) / (HighestH - LowestL) * 100
RETURN MyWilliams AS "Williams %R"
Bollinger Bands
The middle band is a simple 20-period moving average applied to close.
The upper band is the middle band plus 2 times the standard deviation over 20 periods applied to close.
The lower band is the middle band minus 2 times the standard deviation over 20 periods applied to close.
a = Average[20](Close)
// We define the standard deviation.
StdDeviation = STD[20](Close)
Bsup = a + 2 * StdDeviation
Binf = a - 2 * StdDeviation
RETURN a AS "Average", Bsup AS "Bollinger Up", Binf AS "Bollinger Down"
V 4.1.1 – 20160502 www.prorealtime.com 38 / 47

Glo ssary
Glossary
A
CODE SYNTAX FUNCTION
ABS ABS(a) Mathematical function "Absolute Value" of a
AccumDistr AccumDistr(price) Classical Accumulation/Distribution indicator
ADX ADX[N] Indicator Average Directional Index or "ADX" of n periods
ADXR ADXR[N] Indicator Average Directional Index Rate or "ADXR" of n periods
AND a AND b Logical AND Operator
AroonDown AroonDown[P] Aroon Down indicator of n periods
AroonUp AroonUp[P] Aroon Up indicator of n periods
ATAN ATAN(a) Mathematical function "Arctangent" of a
AS RETURN Result AS "ResultName"
Instruction used to name a line or indicator displayed on chart. Used with "RETURN"
Average Average[N](price) Simple Moving Average of n periods
AverageTrueRange AverageTrueRange[N](price) "Average True Range" - True Range smoothed with the Wilder method
B
CODE SYNTAX FUNCTION
BACKGROUNDCOLOR BACKGROUNDCOLOR(R,G,B,a)
Sets the background color of the chart or a specific bar
BarIndex BarIndex Number of bars since the beginning of data loaded (in a chart in the case of a ProBuilder indicator or for a trading system in the case of ProBacktest or ProOrder)
BollingerBandWidth BollingerBandWidth[N](price) Bollinger Bandwidth indicator
BollingerDown BollingerDown[N](price) Lower Bollinger band
BollingerUp BollingerUp[N](price) Upper Bollinger band
BREAK (FOR...DO...BREAK...NEXT) or (WHILE...DO...BREAK...WEND)
Instruction forcing the exit of FOR loop or WHILE loop
V 4.1.1 – 20160502 www.prorealtime.com 39 / 47

Glo ssary
C
CODE SYNTAX FUNCTION
CALCULATEONLASTBARS DEFPARAM CalculateOnLastBars = 200
Lets you increase the speed at which indicators are calculated by defining the number of bars to display the results, starting with the most recent bar.
CALL myResult=CALL myFunction Calls a user indicator to be used in the program you are coding
CCI CCI[N](price) or CCI[N] Commodity Channel Index indicator
ChaikinOsc ChaikinOsc[Ch1, Ch2](price) Chaikin oscillator
Chandle Chandle[N](price) Chande Momentum Oscillator
ChandeKrollStopUp ChandeKrollStopUp[Pp, Qq, X]
Chande and Kroll Protection Stop on long positions
ChandeKrollStopDown ChandeKrollStopDown[Pp, Qq, X]
Chande and Kroll Protection Stop on short positions
Close Close[N] Closing price of the current bar or of the n-th last bar
COLOURED RETURN x COLOURED(R,G,B)
Colors a curve with the color you defined using the RGB convention
COS COS(a) Cosine Function
CROSSES OVER a CROSSES OVER b Boolean Operator checking whether a curve hascrossed over another one
CROSSES UNDER a CROSSES UNDER b Boolean Operator checking whether a curve hascrossed under another one
cumsum cumsum(price) Sums a certain price on the whole data loaded
CurrentDayOfWeek CurrentDayOfWeek Represents the current day of the week
CurrentHour CurrentHour Represents the current hour
CurrentMinute CurrentMinute Represents the current minute
CurrentMonth CurrentMonth Represents the current month
CurrentSecond CurrentSecond Represents the current second
CurrentTime CurrentTime Represents the current time (HHMMSS)
CurrentYear CurrentYear Represents the current year
CustomClose CustomClose[N] Constant which is customizable in the settings window of the chart (default: Close)
Cycle Cycle(price) Cycle Indicator
V 4.1.1 – 20160502 www.prorealtime.com 40 / 47

Glo ssary
D
CODE SYNTAX FUNCTION
Date Date[N] Reports the date of each bar loaded on the chart
Day Day[N] Reports the day of each bar loaded in the chart
Days Days[N] Counter of days since 1900
DayOfWeek DayOfWeek[N] Day of the week of each bar
DClose DClose(N) Close of the n-th day before the current one
DEMA DEMA[N](price) Double Exponential Moving Average
DHigh DHigh(N) High of the n-th bar before the current bar
DI DI[N](price) Represents DI+ minus DI-
DIminus DIminus[N](price) Represents the DI- indicator
DIplus DIplus[N](price) Represents the DI+ indicator
DLow DLow(N) Low of the n-th day before the current one
DO See FOR and WHILE Optional instruction in FOR loop and WHILE loop to define the loop action
DOpen DOpen(N) Open of the n-th day before the current one
DOWNTO See FOR Instruction used in FOR loop to process the loopwith a descending order
DPO DPO[N](price) Detrented Price Oscillator
DRAWARROW DRAWARROW(x1,y1) Draw an arrow pointing right at the selected point. Note: all drawing instructions mentionned hereafter are compatible with version 10.3 and higher of the platform
DRAWARROWDOWN DRAWARROWDOWN(x1,y1) Draw a down at the selected point
DRAWARROWUP DRAWARROWUP(x1,y1) Draw an up arrow at the selected point
DRAWBARCHART DRAWBARCHART(open,high,low,close)
Draws a custom bar on the chart. Open, high, low, and close can be constants or variables
DRAWCANDLE DRAWCANDLE(open,high,low,close)
Draws a custom candlestick. Open, high, low, and close can be constants or variables
DRAWELLIPSE DRAWELLIPSE(x1,y1,x2,y2) Draws an ellipse on the chart
DRAWHLINE DRAWHLINE(y1) Draws a horizontal line on the chart at the selected point
DRAWLINE DRAWLINE(x1,y1,x2,y2) Draws a line on the chart between the two selected points
DRAWONLASTBARONLY DEFPARAM DrawOnLastBarOnly = true
Parameter that lets you draw drawn objects on the last bar only
DRAWRECTANGLE DRAWRECTANGLE(x1,y1,x2,y2)
Draws an rectangle on the chart
V 4.1.1 – 20160502 www.prorealtime.com 41 / 47

Glo ssary
DRAWSEGMENT DRAWSEGMENT(x1,y1,x2,y2) Draws a segment on the chart
DRAWTEXT DRAWTEXT("your text", x1, y1)
Adds a text box on the chart at at the selected point with your text
DRAWVLINE DRAWVLINE(x1) Draws a vertical line on the chart
E
CODE SYNTAX FUNCTION
EaseOfMovement EaseOfMovement[I] Ease of Movement indicator
ELSE See IF/THEN/ELSE/ENDIF Instruction used to call the second condition of If-conditional statements
ELSEIF See IF/THEN/ELSIF/ELSE/ENDIF
Stands for Else If (to be used inside of conditional loop)
EMV EMV[N] Ease of Movement Value indicator
ENDIF See IF/THEN/ELSE/ENDIF Ending Instruction of IF-conditional statement
EndPointAverage EndPointAverage[N](price) End Point Moving Average of a
EXP EXP(a) Mathematical Function "Exponential"
ExponentialAverage ExponentialAverage[N](price) Exponential Moving Average
F - G
CODE SYNTAX FUNCTION
FOR/TO/NEXT FOR i=a TO b DO a NEXT FOR loop (processes all the values with an ascending (TO) or a descending order (DOWNTO))
ForceIndex ForceIndex(price) Force Index indicator (determines who controls the market (buyer or seller)
H
CODE SYNTAX FUNCTION
High High[N] High of the current bar or of the n-th last bar
highest highest[N](price) Highest price over a number of bars to be defined
HistoricVolatility HistoricVolatility[N](price) Historic Volatility (or statistic volatility)
Hour Hour[N] Represents the hour of each bar loaded in the chart
V 4.1.1 – 20160502 www.prorealtime.com 42 / 47

Glo ssary
I - J - K
CODE SYNTAX FUNCTION
IF/THEN/ENDIF IF a THEN b ENDIF Group of conditional instructions without secondinstruction
IF/THEN/ELSE/ENDIF IF a THEN b ELSE c ENDIF Group of conditional instructions
IntradayBarIndex IntradayBarIndex[N] Counts how many bars are displayed in one dayon the whole data loaded
L
CODE SYNTAX FUNCTION
LinearRegression LinearRegression[N](price) Linear Regression inidcator
LinearRegressionSlope LinearRegressionSlope[N](price)
Slope of the Linear Regression inidcator
LOG LOG(a) Mathematical Function "Neperian logarithm" of a
Low Low[N] Low of the current bar or of the n-th last bar
lowest lowest[N](price) Lowest price over a number of bars to be defined
M
CODE SYNTAX FUNCTION
MACD MACD[S,L,Si](price) Moving Average Convergence Divergence (MACD) in histogram
MACDline MACDLine[S,L,Si](price) MACD line indicator
MassIndex MassIndex[N] Mass Index Indicator applied over N bars
MAX MAX(a,b) Mathematical Function "Maximum"
MedianPrice MedianPrice Average of the high and the low
MIN MIN(a,b) Mathematical Function "Minimum"
Minute Minute Represents the minute of each bar loaded in thechart
MOD a MOD b Mathematical Function "remainder of the division"
Momentum Momentum[I] Momentum indicator (close – close of the n-th last bar)
MoneyFlow MoneyFlow[N](price) MoneyFlow indicator (result between -1 and 1)
MoneyFlowIndex MoneyFlowIndex[N] MoneyFlow Index indicator
Month Month[N] Represents the month of each bar loaded in the chart
V 4.1.1 – 20160502 www.prorealtime.com 43 / 47

Glo ssary
N
CODE SYNTAX FUNCTION
NEXT See FOR/TO/NEXT Ending Instruction of FOR loop
NOT Not A Logical Operator NOT
O
CODE SYNTAX FUNCTION
OBV OBV(price) On-Balance-Volume indicator
ONCE ONCE VariableName = VariableValue
Introduces a definition statement which will be processed only once
Open Open[N] Open of the current bar or of the n-th last bar
OR a OR b Logical Operator OR
P - Q
CODE SYNTAX FUNCTION
Pipsize Pipsize Size of a pip (forex)
PriceOscillator PriceOscillator[S,L](price) Percentage Price oscillator
PositiveVolumeIndex PriceVolumeIndex(price) Positive Volume Index indicator
PVT PVT(price) Price Volume Trend indicator
R
CODE SYNTAX FUNCTION
R2 R2[N](price) R-Squared indicator (error rate of the linear regression on price)
Range Range[N] calculates the Range (High minus Low)
REM REM comment Introduces a remark (not taken into account by the code)
Repulse Repulse[N](price) Repulse indicator (measure the buyers and sellers force for each candlestick)
RETURN RETURN Result Instruction returning the result
ROC ROC[N](price) Price Rate of Change indicator
ROUND ROUND(a) Mathematical Function "Round a to the nearest whole number"
RSI RSI[N](price) Relative Strength Index indicator
V 4.1.1 – 20160502 www.prorealtime.com 44 / 47

Glo ssary
S
CODE SYNTAX FUNCTION
SAR SAR[At,St,Lim] Parabolic SAR indicator
SARatdmf SARatdmf[At,St,Lim](price) Smoothed Parabolic SAR indicator
SIN SIN(a) Mathematical Function "Sine"
SGN SGN(a) Mathematical Function "Sign of" a (it is positive or negative)
SMI SMI[N,SS,DS](price) Stochastic Momentum Index indicator
SmoothedStochastic SmoothedStochastic[N,K](price)
Smoothed Stochastic
SQUARE SQUARE(a) Mathematical Function "a Squared"
SQRT SQRT(a) Mathematical Function "Squared Root" of a
STD STD[N](price) Statistical Function "Standard Deviation"
STE STE[N](price) Statistical Function "Standard Error"
Stochastic Stochastic[N,K](price) %K Line of the Stochastic indicator
summation summation[N](price) Sums a certain price over the N last candlesticks
Supertrend Supertrend[STF,N] Super Trend indicator
T
CODE SYNTAX FUNCTION
TAN TAN(a) Mathematical Function "Tangent" of a
TEMA TEMA[N](price) Triple Exponential Moving Average
THEN See IF/THEN/ELSE/ENDIF Instruction following the first condition of "IF"
Time Time[N] Represents the time of each bar loaded in the chart
TimeSeriesAverage TimeSeriesAverage[N](price) Temporal series moving average
TO See FOR/TO/NEXT Directional Instruction in the "FOR" loop
Today YYYYMMDD Today's date
TotalPrice TotalPrice[N] (Close + Open + High + Low) / 4
TR TR(price) True Range indicator
TriangularAverage TriangularAverage[N](price) Triangular Moving Average
TRIX TRIX[N](price) Triple Smoothed Exponential Moving Average
TypicalPrice TypicalPrice[N] Represents the Typical Price (Average of the High, Low and Close)
V 4.1.1 – 20160502 www.prorealtime.com 45 / 47

Glo ssary
U
CODE SYNTAX FUNCTION
Undefined a = Undefined Sets a the value of a variable to undefined
V
CODE SYNTAX FUNCTION
Variation Variation(price) Difference between the close of the last bar andthe close of the current bar in %
Volatility Volatility[S, L] Chaikin volatility
Volume Volume[N] Volume indicator
VolumeOscillator VolumeOscillator[S,L] Volume Oscillator
VolumeROC VolumeROC[N] Volume of the Price Rate Of Change
W
CODE SYNTAX FUNCTION
WeightedAverage WeightedAverage[N](price) Represents the Weighted Moving Average
WeightedClose WeightedClose[N] Average of (2 * Close), (1 * High) and (1 * Low)
WEND See WHILE/DO/WEND Ending Instruction of WHILE loop
WHILE/DO/WEND WHILE (condition) DO (action)WEND
WHILE loop
WilderAverage WilderAverage[N](price) Represents Wilder Moving Average
Williams Williams[N](close) %R de Williams indicator
WilliamsAccumDistr WilliamsAccumDistr(price) Accumulation/Distribution of Williams Indicator
X
CODE SYNTAX FUNCTION
XOR a XOR b Logical Operator eXclusive OR
V 4.1.1 – 20160502 www.prorealtime.com 46 / 47

Glo ssary
Y
CODE SYNTAX FUNCTION
Year Year[N] Year of the bar n periods before the current bar
Yesterday Yesterday[N] Date of the day preceeding the bar n periods before the current bar
Z
CODE SYNTAX FUNCTION
ZigZag ZigZag[Zr](price) Represents the Zig-Zag indicator introduced in the Eliott waves theory
ZigZagPoint ZigZagPoint[Zp](price) Represents the Zig-Zag indicator in the Eliott waves theory calculated on Zp points
Other
CODE FUNCTION CODE FUNCTION
+ Addition Operator < Strict Inferiority Operator
- Substraction Operator > Strict Superiority Operator
* Multiplication Operator <= Inferiority Operator
/ Division Operator >= Superiority Operator
= Equality Operator // Introduces a commentary line
<> Difference Operator
V 4.1.1 – 20160502 www.prorealtime.com 47 / 47
