procedures for experimental measurement and theoretical analysis … · · 2013-08-31procedures...
TRANSCRIPT
NASA TECHNICAL
MEMORANDUM
csCOIX
NASA TM X-3027
PROCEDURES FOR EXPERIMENTAL MEASUREMENT
AND THEORETICAL ANALYSIS OF
LARGE PLASTIC DEFORMATIONS
by Richard E. Morris
Lewis Research Center
Cleveland, Ohio 44135\
NATIONAL AERONAUTICS AND SPACE ADMINISTRATION • WASHINGTON, D. C. • JUNE 1974
https://ntrs.nasa.gov/search.jsp?R=19740018253 2018-06-19T09:32:20+00:00Z
1. Report No.
NASA TMX-3027
2. Government Accession No.
4. Title and SubtitlePROCEDURES FOR EXPERIMENTAL MEASUREMENT AND THEORETICAL
ANALYSIS OF LARGE PLASTIC DEFORMATIONS
7. Author(s)
Richard E. Morris
9. Performing Organization Name and Address
Lewis Research Center
National Aeronautics and Space Administration
Cleveland, Ohio 44135
12. Sponsoring Agency Name and Address
National Aeronautics and Space Administration
Washington, D.C. 2 0 S 4 6
3. Recipient's Catalog No.
5. Report DateJUNE 197J+
6. Performing Organization Code
8. Performing Organization Report
E-7661
No.
10. Work Unit No.
770-18
1 1 . Contract or Grant No.
13. Type of Report and Period Covered
Technical Memorandum
14. Sponsoring Agency Code
15. Supplementary Notes
16. Abstract
Theoretical equations are derived and analytical procedures are presented for the
interpretation of experimental measurements of large plastic strains in the
surface of a plate. Orthogonal gage lengths established on the metal surface are
measured before and after deformation. The change in orthogonality after
deformation is also 'measured. Equations yield the principal strains, deviatoric
stresses in the absence of surface friction forces, true stresses if the stress
normal to the surface is known, and the orientation angle between the deformed
gage line and the principal stress-strain axes. Errors in the measurement of
nominal strains greater than 3 percent are within engineering accuracy. Appli-
cations suggested for this strain measurement system include the large-strain -
stress analysis of impact test models, burst tests of spherical or cylindrical
pressure vessels, and to augment small-strain instrumentation tests where large
strains are anticipated.
17. Key Words (Suggested by Author(s))
Structural mechanics
18. Distribution Statement
Unclassified - unlimited
Category 32
19. Security Classif. (of this report)
Unclassified
20. Security Classif. (of this page)
Unclass i f ied21. No. of Pages
33
22. Price*
$3-25
* For sale by the National Technical Information Service, Springfield, Virginia 22151
PROCEDURES FOR EXPERIMENTAL MEASUREMENT AND THEORETICAL
ANALYSIS OF LARGE PLASTIC DEFORMATIONS
by Richard E. Morris
Lewis Research Center
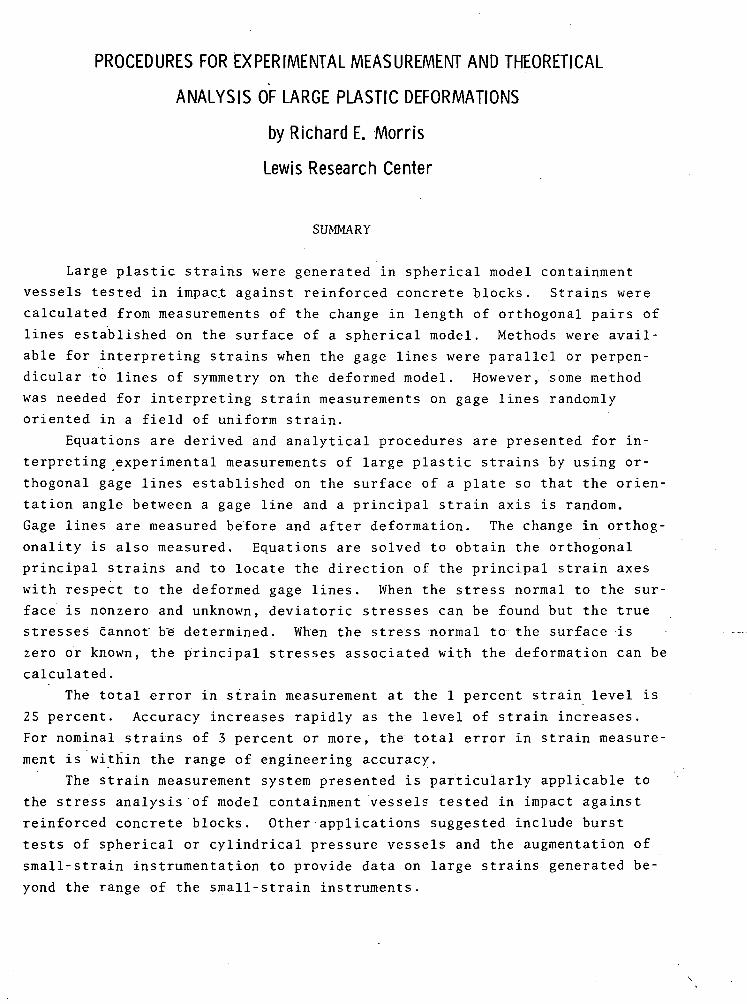
SUMMARY
Large plastic strains were generated in spherical model containment
vessels tested in impac.t against reinforced concrete blocks. Strains were
calculated from measurements of the change in length of orthogonal pairs of
lines established on the surface of a spherical model. Methods were avail-
able for interpreting strains when the gage lines were parallel or perpen-
dicular to lines of symmetry on the deformed model. However, some method
was needed for interpreting strain measurements on gage lines randomly
oriented in a field of uniform strain.
Equations are derived and analytical procedures are presented for in-
terpreting experimental measurements of large plastic strains by using or-
thogonal gage lines established on the surface of a plate so that the orien-
tation angle between a gage line and a principal strain axis is random.
Gage lines are measured before and after deformation. The change in orthog-
onality is also measured. Equations are solved to obtain the orthogonal
principal strains and to locate the direction of the principal strain axes
with respect to the deformed gage lines. When the stress normal to the sur-
face is nonzero and unknown, deviatoric stresses can be found but the true
"stresses cannot b"e determined. When the stress normal to the surface is
zero or known, the principal stresses associated with the deformation can be
calculated.
The total error in strain measurement at the 1 percent strain level is
25 percent. Accuracy increases rapidly as the level of strain increases.
For nominal strains of 3 percent or more, the total error in strain measure-
ment is within the range of engineering accuracy.
The strain measurement system presented is particularly applicable to
the stress analysis of model containment vessels tested in impact against
reinforced concrete blocks. Other applications suggested include burst
tests of spherical or cylindrical pressure vessels and the augmentation of
small-strain instrumentation to provide data on large strains generated be-
yond the range of the small-strain instruments.
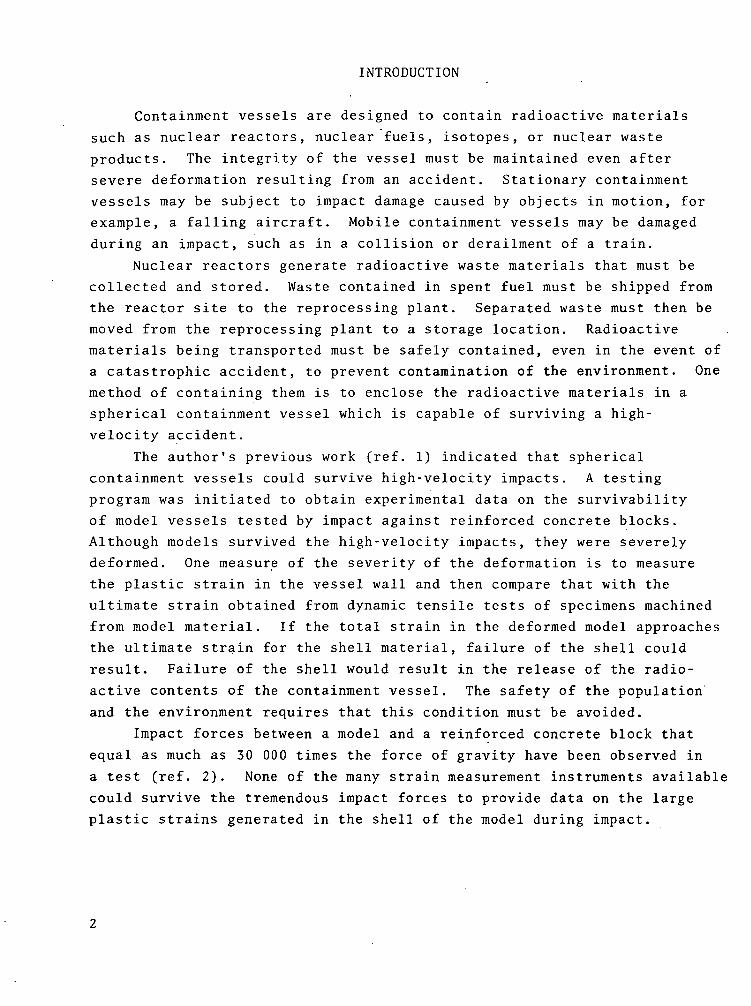
INTRODUCTION
Containment vessels are designed to contain radioactive materials
such as nuclear reactors, nuclear fuels, isotopes, or nuclear waste
products. The integrity of the vessel must be maintained even after
severe deformation resulting from an accident. Stationary containment
vessels may be subject to impact damage caused by objects in motion, for
example, a falling aircraft. Mobile containment vessels may be damaged
during an impact, such as in a collision or derailment of a train.
Nuclear reactors generate radioactive waste materials that must be
collected and stored. Waste contained in spent fuel must be shipped from
the reactor site to the reprocessing plant. Separated waste must then be
moved from the reprocessing plant to a storage location. Radioactive
materials being transported must be safely contained, even in the event of
a catastrophic accident, to prevent contamination of the environment. One
method of containing them is to enclose the radioactive materials in a
spherical containment vessel which is capable of surviving a high-
velocity accident.
The author's previous work (ref. 1) indicated that spherical
containment vessels could survive high-velocity impacts. A testing
program was initiated to obtain experimental data on the survivability
of model vessels tested by impact against reinforced concrete blocks.
Although models survived the high-velocity impacts, they were severely
deformed. One measure of the severity of the deformation is to measure
the plastic strain in the vessel wall and then compare that with the
ultimate strain obtained from dynamic tensile tests of specimens machined
from model material. If the total strain in the deformed model approaches
the ultimate strain for the shell material, failure of the shell could
result. Failure of the shell would result in the release of the radio-
active contents of the containment vessel. The safety of the population
and the environment requires that this condition must be avoided.
Impact forces between a model and a reinforced concrete block that
equal as much as 30 000 times the force of gravity have been observed in
a test (ref. 2). None of the many strain measurement instruments available
could survive the tremendous impact forces to provide data on the large
plastic strains generated in the shell of the model during impact.
An experimental method of strain measurement (ref.3) was devised
that involved establishing gage lines on the surface of the model.
Orientation of the model and target were controlled so that gage lines
were parallel and perpendicular to lines of symmetry on the model before
and after the impact test. Physical measurement of the change in length
of gage lines provided principal nominal strain data that could be
analyzed to obtain the maximum level of plastic strain in the model.
Control of the orientation of the model during impact was lost when
test procedures were changed to obtain higher velocity impacts. Strain
data were generated on deformed models that could not be analyzed because
the gage lines were not parallel to principal strain axes and thus the
experimental strain measurements were not principal strains. A method
was needed for the analysis of randomly oriented strain measurements to
obtain the direction and magnitudes of the principal plastic strains.
Analyses of finite strains contained in the literature on plasticity
were not applicable to the measurement of large deformations. The pro-
cedures for the experimental measurement and analysis of large plastic
strains and stresses presented herein were developed to solve this problem
of strain interpretation.
The measurements made in this study and used in the analysis were in
the U.S. customary system of units.. Conversion to the International
System of Units (S.I) was done for reporting purposes only.
SYMBOLS
E • •princlpal~nominial- plastic strain-, cm/cm —
EE AL/L on gage line, .nominal apparent plastic strain, cm/cm
G rise-gage length, cm2
K strength coefficient, N/cm
L gage-line surface length, cm
L gage-line vector, cm
L' gage-line surface length after deformation, cm
L~' deformed gage-line vector, cm
n strain-hardening exponent
R surface radius, cm
X chord length of a gage line, cm
Y rise measurement, cm
g gage-line strain ratio, (1 + EE )/(! + EE )
y total shear angle, rad
y shear angle adjacent to E principal axis, radi i
y shear angle adjacent to E principal axis, rad2 2
c true strain, ln(l + E), cm/cm
e equivalent strain by distortion energy theory, cm/cm
n principal strain ratio, (1 + E )/(! + E )
0 angle between gage line and principal axis, rad
a true stress, N/cm2
a" deviatoric stress, N/cm
a equivalent stress by distortion energy theory, N/cm2
Subscripts :
m mean
o equivalent
ANALYSIS
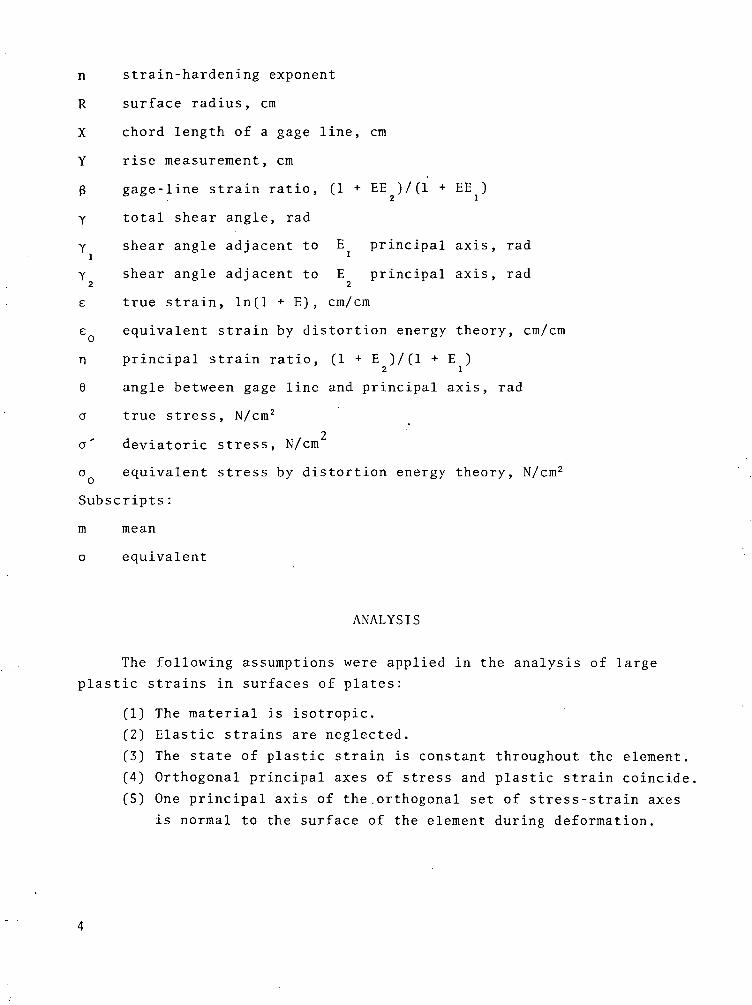
The following assumptions were applied in the analysis of large
plastic strains in surfaces of plates:
(1) The material is isotropic.
(2) Elastic strains are neglected.
(3) The state of plastic strain is constant throughout the element.
(4) Orthogonal principal axes of stress and plastic strain coincide,
(5) One principal axis of the .orthogonal set of stress-strain axes
is normal to the surface of the element during deformation.

(6) A gage line established on a metal surface has a uniform radius
before deformation. Although changed during deformation, the
radius of the gage line is assumed to be uniform after plastic
deformation.
(7) Plastic strains are proportional to and have directions parallel
to the lines of action of the stresses acting.
(8) Parallel lines are parallel before and after straining.
(9) Plastic strains result from monotonically increasing or decreasing
equivalent stress.
(10) Equivalent stress and strain associated with plastic flow in
the element are given by the distortion energy theory.
Most of the assumptions are common assumptions in plasticity. Assump-
tion 5 is made to avoid surfaces loaded with friction forces which cause
rotation of the stress axis away from the surface normal. Assumption 6
is needed for use in simplifying the measurement of the radii of the
metal surface. Assumption 9 eliminates stress calculation in locations
where stresses and strains undergo a reversal of sign. In such locations
the final level "of strain can be measured, but the final stress system
cannot be obtained. Thus, the assumptions delineated provide limitations
for the application of this system of plastic strain measurement and
analysis.
The procedure for the analysis involves presenting the geometry for
the strain measurement problem and solving geometric and vector equations
to obtain data on the principal nominal strains and stresses associated
with the large plastic deformations.
Figure-1 (-a)--shows -a- random -element on--a metal surface. Two
perpendicular gage lines are scribed on the surface of the element. In
the figure, gage line OA is perpendicular to OE~. Gage line OA~ makes
an angle 9 with the X-axis, a principal stress-strain axis. Figure l(b)
shows the same element after orthogonal stresses a and a have1 2
plastically deformed the element. The stresses are parallel to the X-Y
axes as shown. The stresses cause uniform nominal principal plastic
strains E parallel to the X-axis and E parallel to the Y-axis.1 2
Erecting OTT perpendicular to OA' forms the angle B'OC. This is the
shear angle y-
Physical measurements obtainable from the random element before and
after impact are the change in length of OA and OB~ and the shear angle
y. The principal stresses and strains remain parallel and orthogonal, but
the gage lines OA and OB rotate with respect to the principal X-Y axes.
Consequently, the change in the lengths of the gage lines cannot be direct-
ly interpreted as nominal strain in the random plate element. Relations
will be developed between the changes in the lengths of gage lines and the
shear angle so that the principal stresses and strains and the orientation
of the principal strain axes in the plastically deformed element can be
calculated.
Consider the case where the nominal principal plastic strain E is2
greater than E . Referring to figure 2, let OA = OB = L, the initial
length of a gage line. Denote the coordinates of point A by (x , y )
and point B by (x , y ). The figure shows the gage lines before and2 2 '
after plastic deformation. Primes denote the gage line and the
coordinates after straining.
According to assumption 3, each unit element in the plate parallel to
one of the principal strain axes undergoes a uniform plastic strain. The
principal strain parallel to the X-axis is denoted by E . Thus, the
element of length x from point A perpendicular to the Y-axis is
strained uniformly with the nominal principal plastic strain E . The
change in the length of the element is E x , as shown in figure 2.
Similarly, the element of length Y from point A perpendicular to the
X-axis is strained with the nominal principal plastic strain E . The
change in length is E y .
As plastic deformation takes place, point A moves to position A"
relative to the center of the coordinate system at point 0. As gage line
OA is rotated during deformation to position OA'', the shear angle y
is formed. Determination of the angle 9 + y will make it possible to
locate the principal plastic strain axis E on the deformed surface. Ini
a similar manner, point B moves to B' and shear angle y is formed.2
Since, in general, y is not equal to y , only the sum of the angles yi 2
can be measured experimentally.
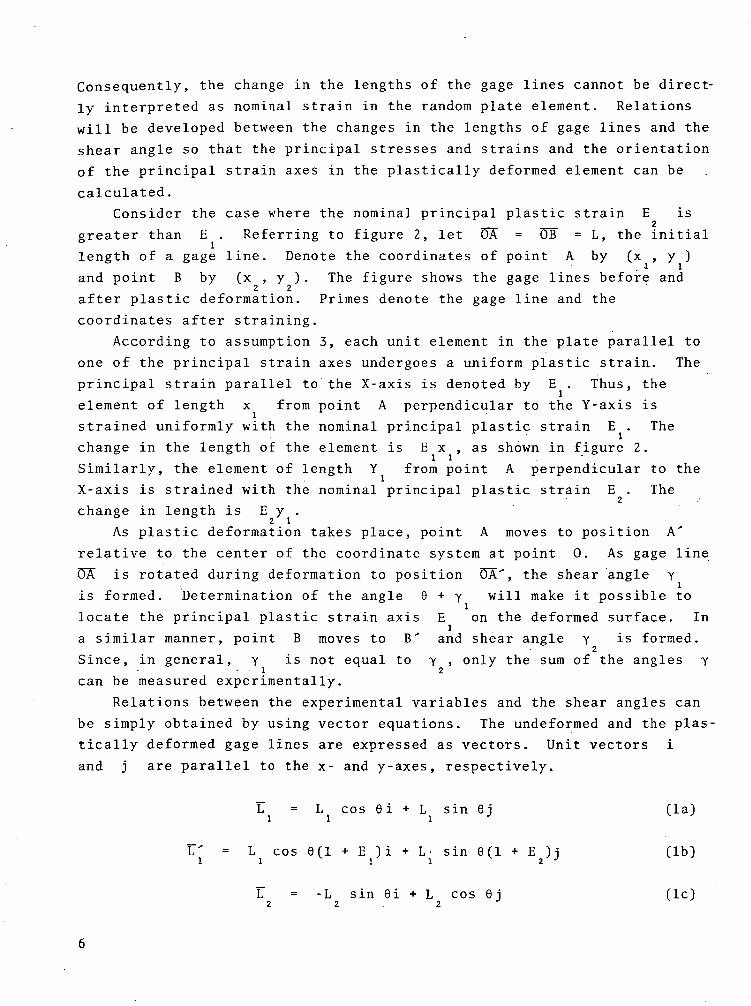
Relations between the experimental variables and the shear angles can
be simply obtained by using vector equations. The undeformed and the plas-
tically deformed gage lines are expressed as vectors. Unit vectors i
and j are parallel to the x- and y-axes, respectively.
L = L cos 6i + L sin 0j (la)
L' = L cos 9(1 + E )i + L< sin 6(1 + E )j (Ib)1 1 1 1 2 J
r = -L sin 6i + L cos 6j (Ic)2 2 2 J
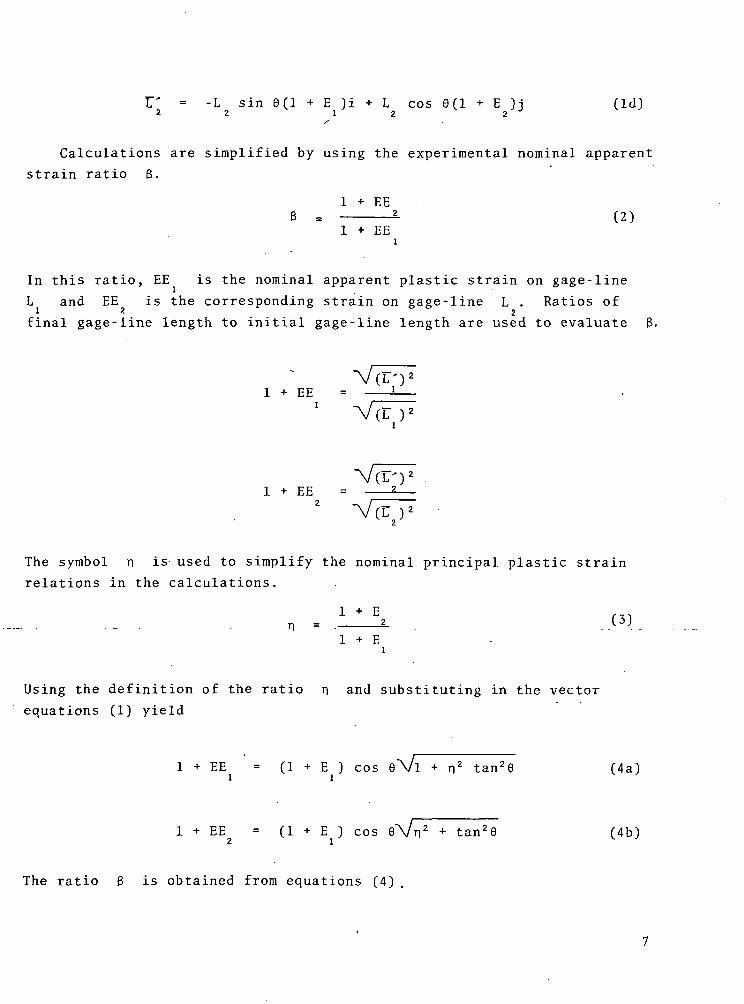
L' = -L sin 9(1 + E )i + L cos 9(1 + E )jO O t f\ n •*
(Id)
Calculations are simplified by using the experimental nominal apparent
strain ratio 3.
1 + EE
1 + EE(2)
In this ratio, EE is the nominal apparent plastic strain on gage-line
L and EE is the corresponding strain on gage-line L . Ratios of
final gage-line length to initial gage-line length are used to evaluate
1 + EE
1 + EE
The symbol n is used to simplify the nominal principal plastic strain
relations in the calculations.
n =1 + E
1 + E
(3)
Using the definition of the ratio n and substituting in the vector
equations (1) yield
1 + EE = (1 + E ) cos eVl + n2 tan26 (4a)
1 + EE = (1 + E ) cos eVn2 + tan: (4b)
The ratio 3 is obtained from equations (4)
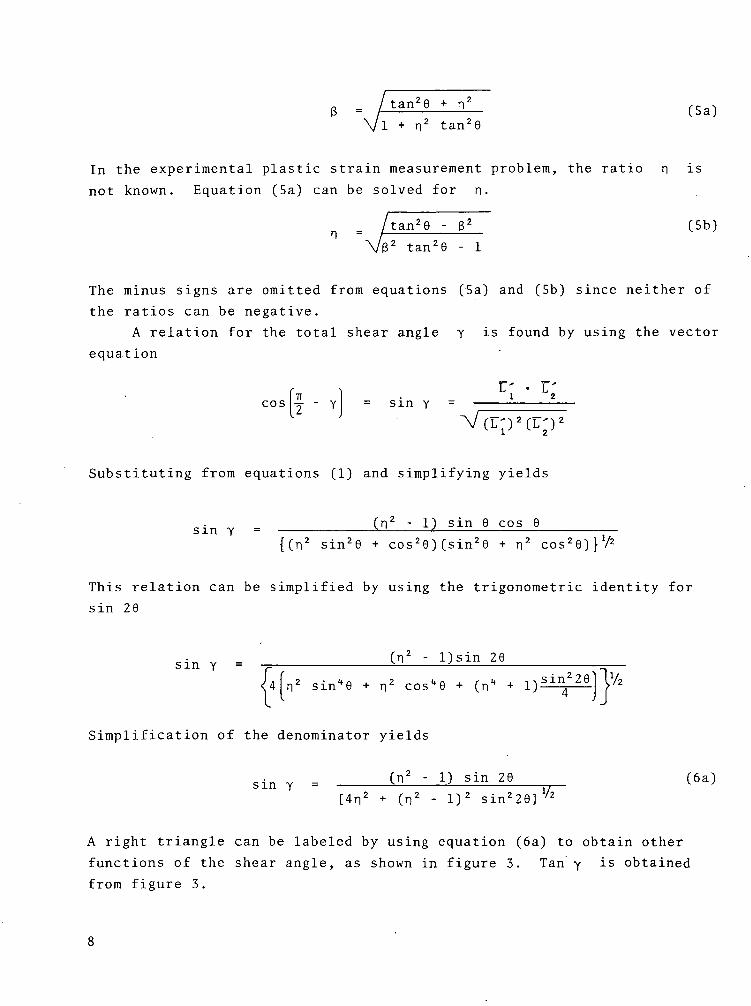
B = /tan26 + n? (Sa)VI + n2 tan26
In the experimental plastic strain measurement problem, the ratio n is
not known. Equation (5a) can be solved for n.
n = /tan29 - B2 (Sb)
"W tan26 - 1
The minus signs are omitted from equations (5a) and (5b) since neither of
the ratios can be negative.
A relation for the total shear angle y is found by using the vector
equation
1 L" • L "1 2= sin Y = ——~~~—:—
Substituting from equations (1) and simplifying yields
(n2 - 1) sin 9 cos 6sin
{(n2 sin26 + cos20)(sin2e + n2 cos26)}V2
This relation can be simplified by using the trigonometric identity for
sin 26
7 osin Y = -7=— v '
2 sin'e + n2 cos^e + (n" * i)51^29]]1/2
Simplification of the denominator yields
sin y = (n2 - 1) sin 29 (6a)
[4n2 + (n2 - I)2 sin226] 1/2
A right triangle can be labeled by using equation (6a) to obtain other
functions of the shear angle, as shown in figure 3. Tan y is obtained
from figure 3.
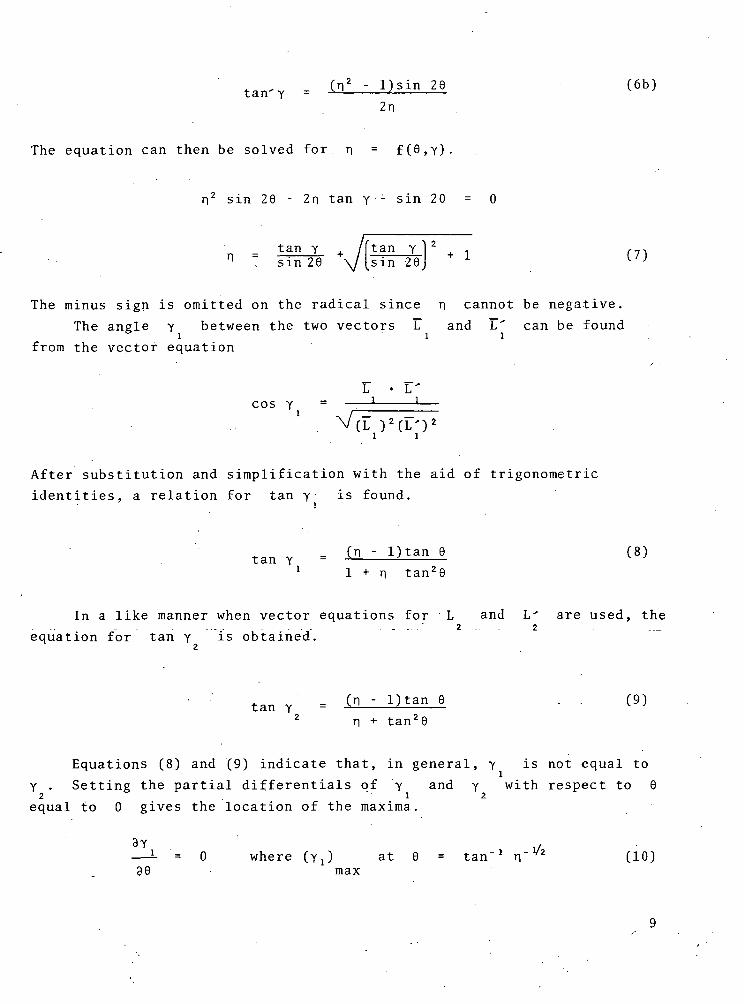
tan'y = (I2 - PS"* 29 (6b)2n
The equation can then be solved for n = f(9,y).
n2 sin 26 - 2n tan y - sin 26 = 0
= tan y /[tan y]2n , sin 29 \/ sin 26
The minus sign is omitted on the radical since n cannot be negative.
The angle y betw
from the vector equation
The angle y between the two vectors L and ~L' can be foundi ' i i
cos Yi
V(L )2(L')2
After substitution and simplification with the aid of trigonometric
identities, a relation for tan y is found.
tan y = 6 (8)1 1 + n tan29
In a like manner when vector equations for L and L' are used, the_ . . . . . . . . ' 2 ... 2
equation for tan y is obtained.2
tan Y = (n - Dtan 6 . . (9)2 n + tan29
Equations (8) and (9) indicate that, in general, y is not equal to
y . Setting the partial differentials of y and y with respect to 92 . 1 2
equal to 0 gives the location of the maxima.
8Y ' ., .—L = 0 where (yj at 9 = tan'1 n /2 (10)99 max
3Y-^- = 0 where (y ) at 9 = tan"1 n/2 (11),-i '/a
O max
Substitution of values of 9 for maximum shear angles into equations (8)
and (9) reveals that the maximum shear angles are equal although the
maximum values 'occur at different angles of orientation with respect to
the principal axes of plastic strain.
(Y ) (Y ) ." = tan-1 i(nV2- n~V2) (12)max . 2 max [_ J
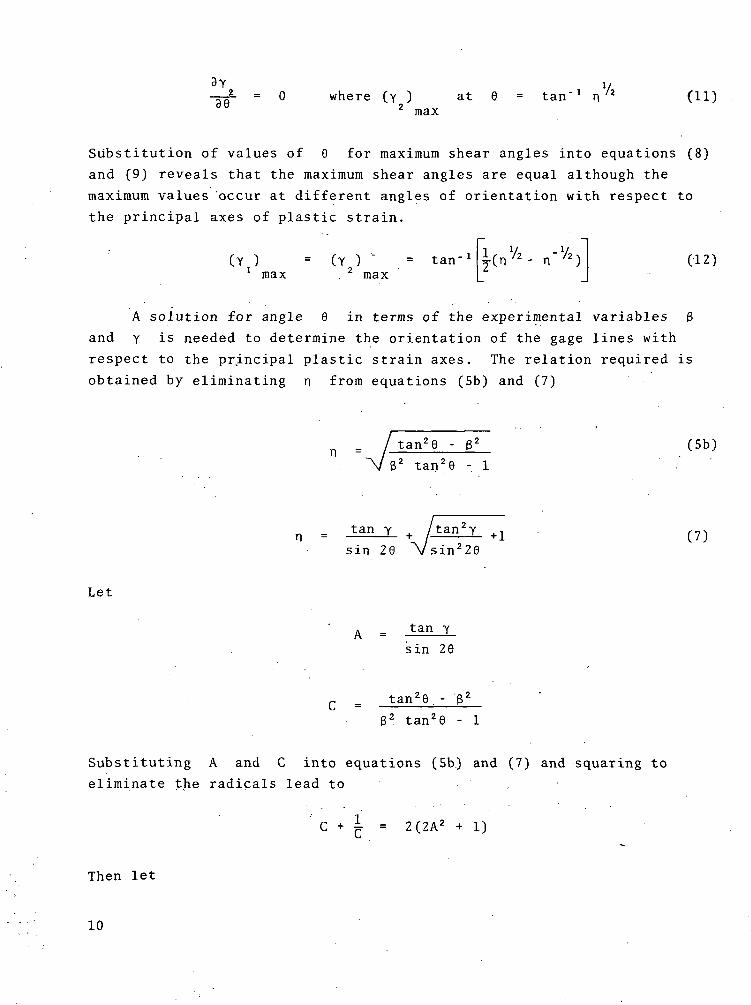
A solution for angle 9 in terms of the experimental variables g
and Y is needed to determine the orientation of the gage lines with
respect to the principal plastic strain axes. The relation required is
obtained by eliminating n from equations (5b) and (7)
tan29 - 32 (5b)
.2 tan29 - 1 .
n =sin 29 Vsin220
Let
A = tan
sin 29
r = tan26.- g2
6 2 i- ari 2 Q itan u i
Substituting A and C into equations (5b.) and (7) and squaring toeliminate the radicals lead to .
C + J = 2(2A2 + 1)
Then let
10
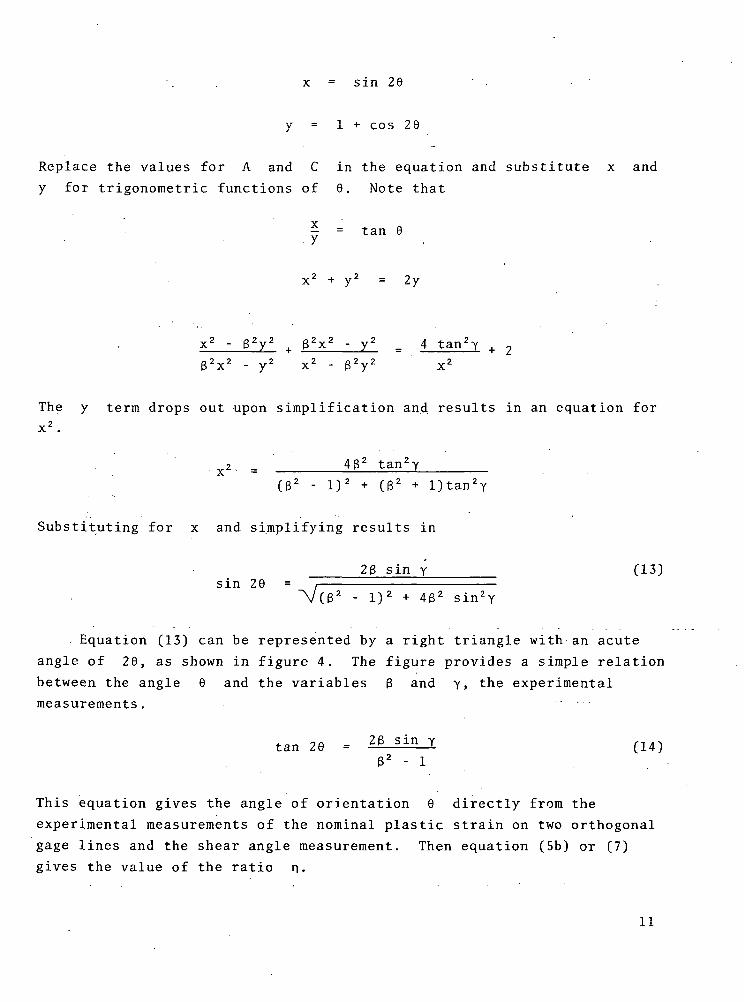
. . x = sin 29
y = 1 + cos 29
Replace the values for A and C in the equation and substitute x and
y for trigonometric functions of 9. Note that
J- = tan 9
x2 + y2 = 2y
x2 - g2y2 + 3
2x2 - y2 _ 4
The y term drops out upon simplification and results in an equation for
x2.
32 tan2y
(B2 - I)2 + (62 + I)tan2y
Substituting for x and simplifying results in
2g sin Y _ (13)sin 26
V(32 - I)2 + 462 sin2
- Equation (13) can be represented by a right triangle with an acute
angle of 29, as shown in figure 4. The figure provides a simple relation
between the angle 6 and the variables 8 and Y. the experimental
measurements. .. ...
tan 26 = 23_sin_jr (14)
B2 - 1
This equation gives the angle of orientation 9 directly from the
experimental measurements of the nominal plastic strain on two orthogonal
gage lines and the shear angle measurement. Then equation (5b) or (7)
gives the value of the ratio ri-

The angle between the E! principal axis and gage line OA' in
figure 2 is 6 + y . From the figure
U + E2)Yitan (9 + Y ) = --- = 0 tan 6 (15)
At point 0 in figure 2, the principal nominal strain normal to the
surface AOB is E3. The nominal change in length of a unit gage length
normal to the surface of the deformed element with sides parallel to gage
lines OA' and OB' • is EE3. Strains E3 and EE3 coincide and are
therefore equal.
Volume is constant during plastic deformation. A unit cubic element
with sides parallel to the principal strain axes has a volume equal to
unity before and after deformation.!
(1 .+ EiM.l + E2)(l •+ -E3) -. 1 (16)
Also a unit cubic element with sides parallel to the orthogonal strain
gage lines has Asides of a parallelepiped after deformation. Two sides of
the deformed element are parallel to the plastically strained gage lines,
and the third side is normal to the surface. Constant volume of a unit
cubic element whose sides are not initially parallel to the principal
strain axes may be stated .
(1 + EEi)(l + EE2)(1 + EE3)cos Y = 1 (17)
Combining equations (16) and (17) and the definition of n yields a
solution for the principal strain EI.
(1 + EEjHl + EE2) - 1 (18)
From the definition of n, E2 can be found. Then E3 is found from
equation (16) . The true principal strains are obtained
e. = ln(l + E.) i = 1,2,3 . (19)
Assumptions 3 and 8 require that two parallel lines of equal length
12
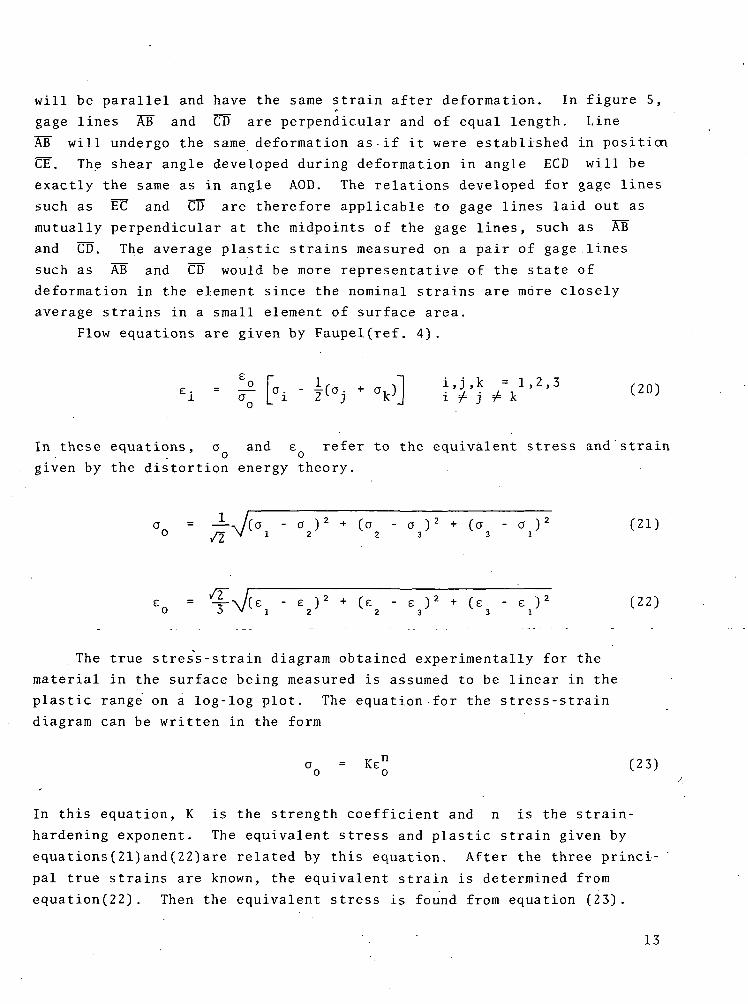
will be parallel and have the same strain after deformation. In figure 5,
gage lines A~F and CD are perpendicular and of equal length. Line
ATT will undergo the same deformation as-if it were established in position
CTT. The shear angle developed during deformation in angle ECD will be
exactly the same as in angle AOD. The relations developed for gage lines
such as EC" and CD are therefore applicable to gage lines laid out as
mutually perpendicular at the midpoints of the gage lines, such as AB
and CD. The average plastic strains measured on a pair of gage lines
such as AB and CD would be more representative of the state of
deformation in the element since the nominal strains are more closely
average strains in a small element of surface area.
Flow equations are given by Faupel(ref. 4).
- E° Fa - -fa + o ll i'J»k = 1 » 2 » :
-i - F- L0i 2C°j ak->J i * j + k (20)
In these equations, o and e refer to the equivalent stress and"strain
given by the distortion energy theory.
s - fv<The true stress-strain diagram obtained experimentally for the
material in the surface being measured is assumed to be linear in the
plastic range on a log-log plot. The equation for the stress-strain
diagram can be written in the form
% = Keo
In this equation, K is the strength coefficient and n is the strain-
hardening exponent. The equivalent stress and plastic strain given by
equations(21)and(22)are related by this equation. After the three princi-
pal true strains are known, the equivalent strain is determined from
equation(22). Then the equivalent stress is found from equation (23).
. 13
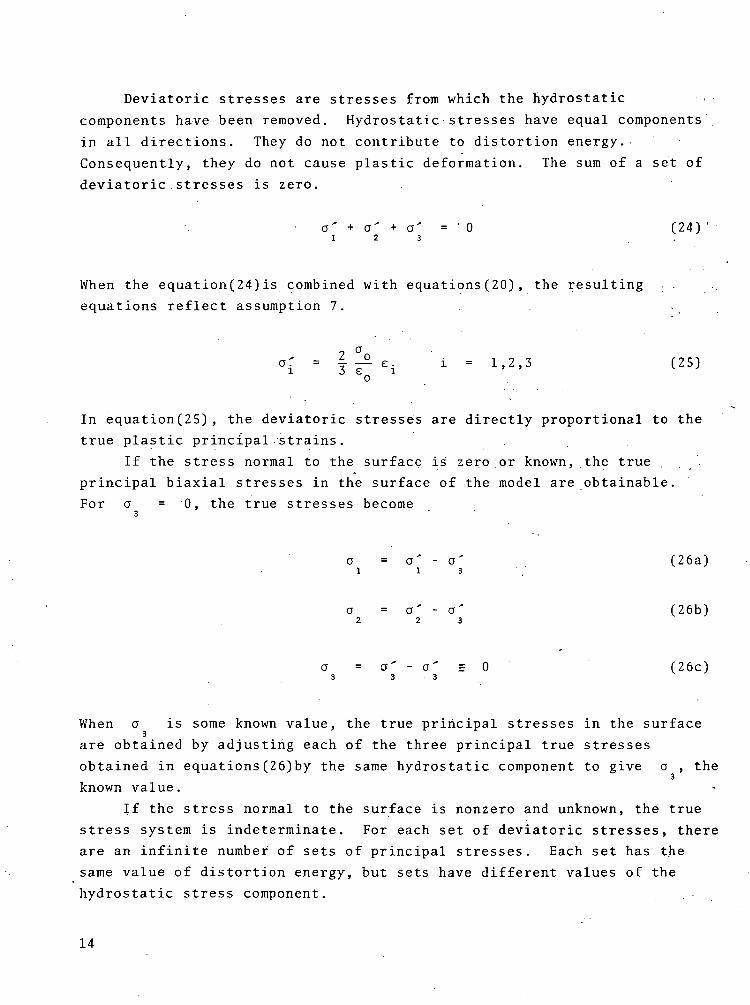
Deviatoric stresses are stresses from which the hydrostatic
components have been removed. Hydrostatic-stresses have equal components
in all directions. They do not contribute to distortion energy.
Consequently, they do not cause plastic deformation. The sum of a set of
deviatoric stresses is zero.
a + a + a1 2 3
= ' 0 (24)
When the equation(24)is combined with equations(20), the resulting
equations reflect assumption 7.
ai 1,2,3 (25)
In equation(25), the deviatoric stresses are directly proportional to the
true plastic principal-strains. .
If the stress normal to the surface is zero or known,.the true
principal biaxial stresses in the surface of the model are obtainable.
For 0, the true stresses become
a a - a1 1 3
a = a - a2 2 3
(26a)
(26b)
' - a" = 03 3
(26c)
When a is some known value, the true principal stresses in the surface
are obtained by adjusting each of the three principal true stresses
obtained in equations(26)by the same hydrostatic component to give o , the
known value.
If the stress normal to the surface is nonzero and unknown, the true
stress system is indeterminate. For each set of deviatoric stresses, there
are an infinite number of sets of principal stresses. Each set has the
same value of distortion energy, but sets have different values of the
hydrostatic stress component. .-
14
The final level of strain can be determined in the presence of a
strain reversal, but stresses cannot be calculated. Any set of principal
strains can be related to a set of deviatoric stresses if there is no
strain reversal. If the stress normal to the surface is zero or known,
the principal stresses can be calculated, in addition to the deviatoric
stresses.
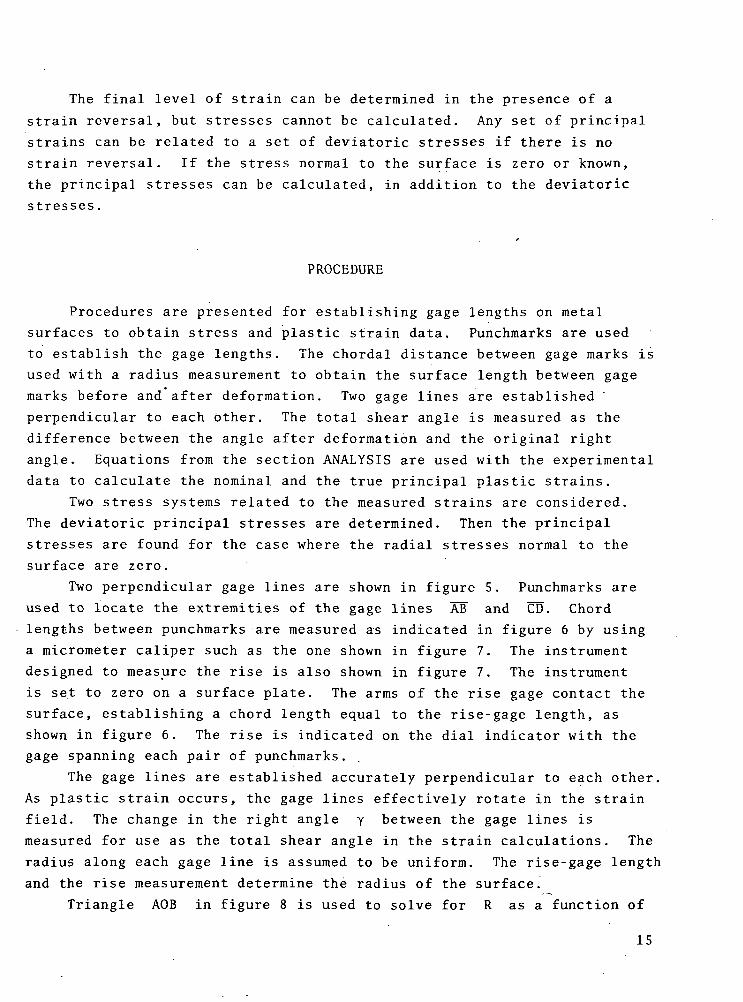
PROCEDURE
Procedures are presented for establishing gage lengths on metal
surfaces to obtain stress and plastic strain data. Punchmarks are used
to establish the gage lengths. The chordal distance between gage marks is
used with a radius measurement to obtain the surface length between gage
marks before and after deformation. Two gage lines are established
perpendicular to each other. The total shear angle is measured as the
difference between the angle after deformation and the original right
angle. Equations from the section ANALYSIS are used with the experimental
data to calculate the nominal and the true principal plastic strains.
Two stress systems related to the measured strains are considered.
The deviatoric principal stresses are determined. Then the principal
stresses are found for the case where the radial stresses normal to the
surface are zero.
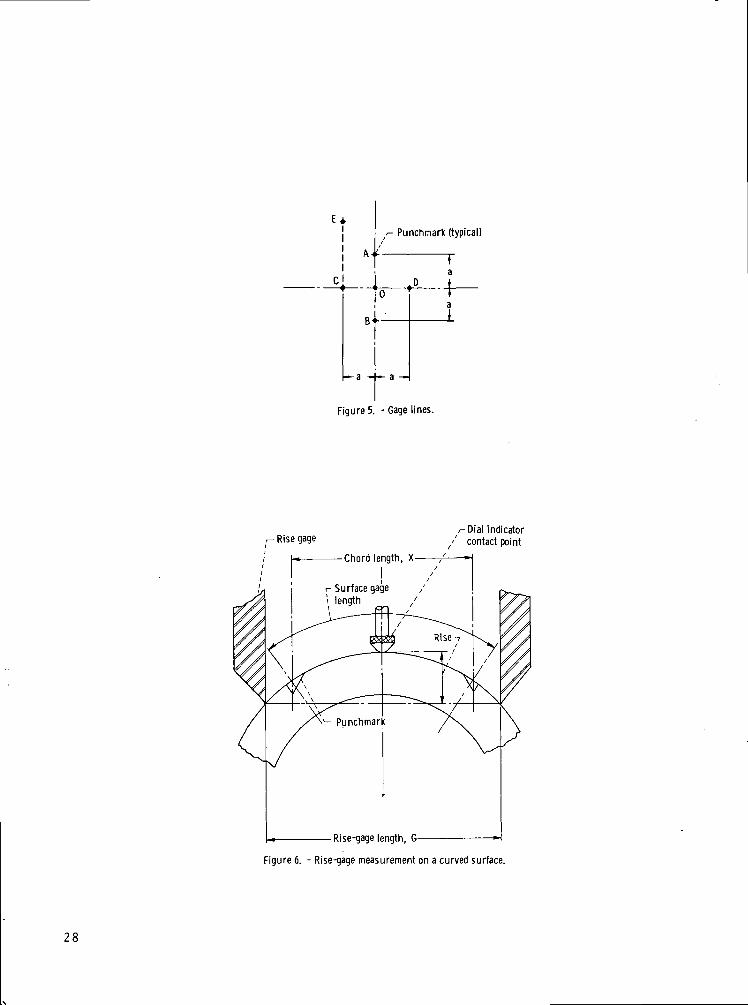
Two perpendicular gage lines are shown in figure 5. Punchmarks are
used to locate the extremities of the gage lines AB and CD. Chord
lengths between punchmarks are measured as indicated in figure 6 by using
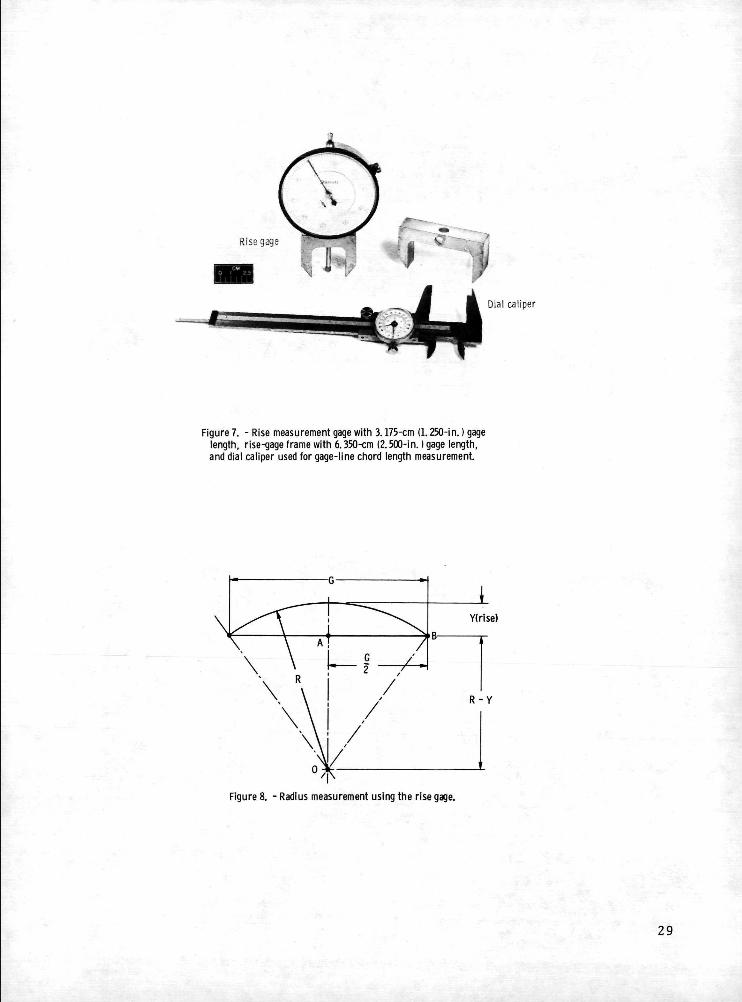
a micrometer caliper such as the one shown in figure 7. The instrument
designed to measure the rise is also shown in figure 7. The instrument
is set to zero on a surface plate. The arms of the rise gage contact the
surface, establishing a chord length equal to the rise-gage length, as
shown in figure 6. The rise is indicated on the dial indicator with the
gage spanning each pair of punchmarks.
The gage lines are established accurately perpendicular to each other.
As plastic strain occurs, the gage lines effectively rotate in the strain
field. The change in the right angle y between the gage lines is
measured for use as the total shear angle in the strain calculations. The
radius along each gage line is assumed to be uniform. The rise-gage length
and the rise measurement determine the radius of the surface.
Triangle AOB in figure 8 is used to solve for R as a function of
15
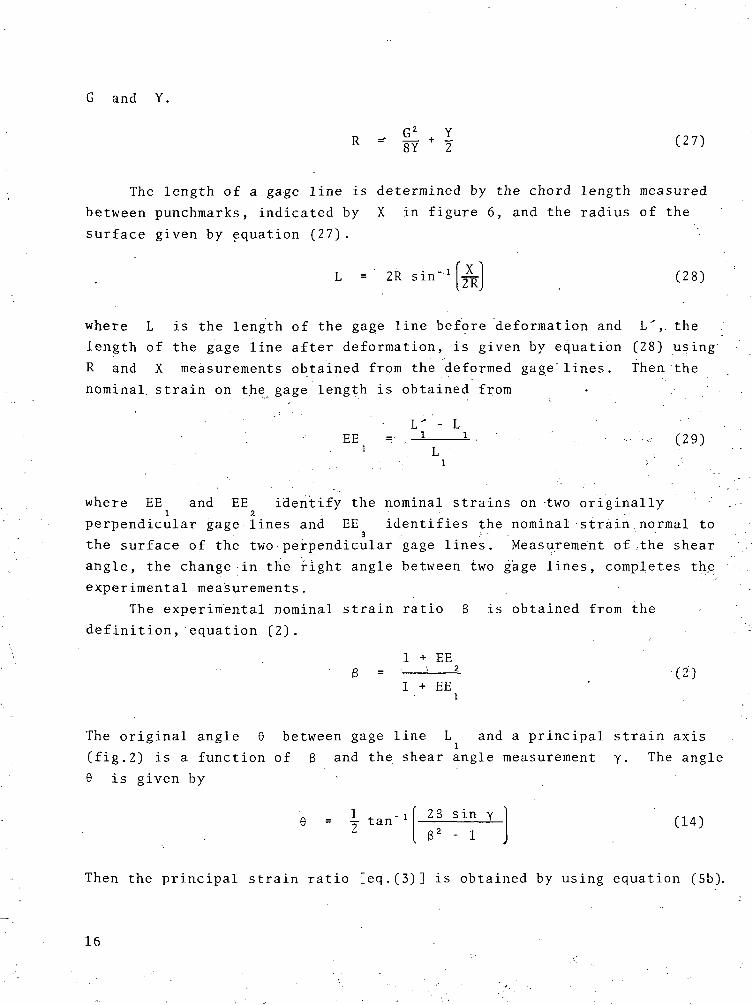
G and Y.
r2 Y
R - IY * I ^
The length of a gage line is determined by the chord length measured
between punchmarks , indicated by X in figure 6, and the radius of the
surface given by equation (27) .
L = 2R sin-1 fXl " (28)
where L is the length of the gage line before deformation and L'',. the
length of the gage line after deformation, is given by equation (28) using
R and X measurements obtained from the deformed gage' lines. Then the
nominal, strain on the gage length is obtained from • ,
L" - LEE = . -* - l- • • " .. • • . • - • - : (29)
1 L . • '- 1 ;
where EE and EE identify the nominal strains on -two originally1 2 .
perpendicular gage lines and EE identifies the nominal strain. normal to
the surface of the two perpendicular gage lines. Measurement of .the shear
angle, the change in the right angle between two gage lines, completes the
experimental measurements.
The experimental nominal strain ratio g is obtained from the
definition, equation (2).
1 + EE3 = - * - 2~ (2)
1 + EEi
The original angle 9 between gage line L and a principal strain axis
(fig. 2) is a function of g and the shear angle measurement Y- The angle
6 is given by
e = 1 tan- if 2B sin y (14)2
Then the principal strain ratio [eq.(3)] is obtained by using equation (5b).
16
(5b)i2 tan29 - 1
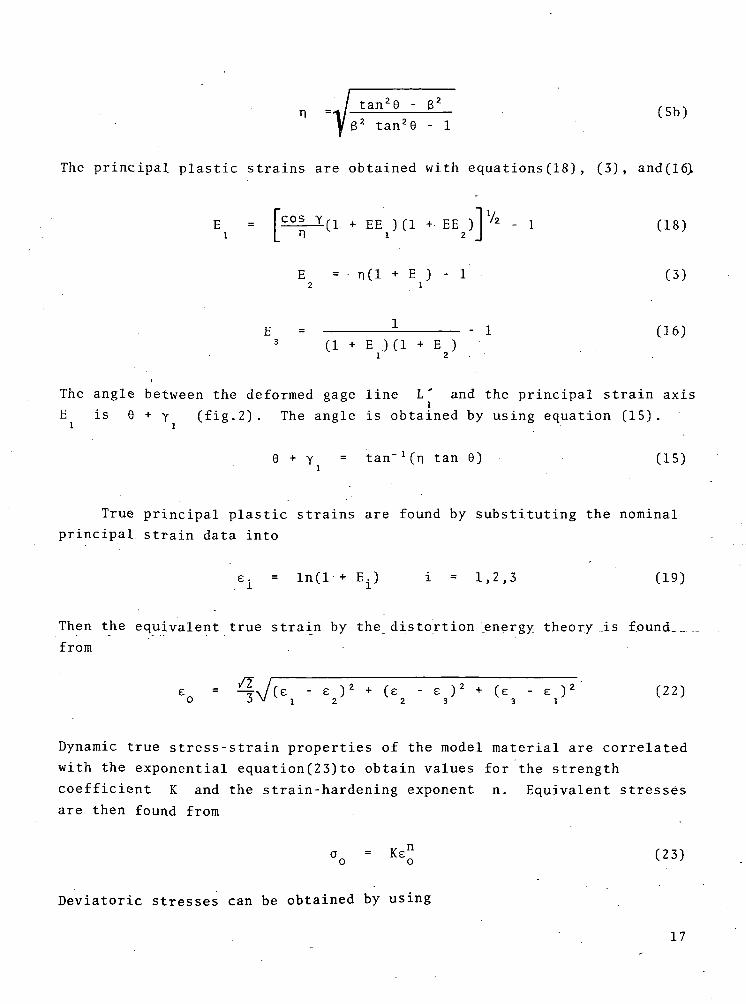
The principal plastic strains are obtained with equations(18), (3), and(16>
= F005 V(\ + EE )(1 +• EE ) 1i [_ n . i 2 j
+• EE ) /z - 1 (18)
E = • n(l + E ) - 1 (3)2 1
E = — - 1 (16)3 + +
The angle between the deformed gage line L' and the principal strain axis
E is 6 + Y (fig.2). The angle is obtained by using equation (15).
0 + Y = tan 'Hn tan 6) (15)
True principal plastic strains are found by substituting the nominal
principal strain data into
e± = ln(l + Ei) i = 1,2,3 (19)
Then the equivalent true strain by the distortion energy theory .is found. _.
from
eo = "rV^ - O2 + (e - e )2 + (e - e )2 ( 2 2 )O 0 ^ 1 2 2 3 3 1
Dynamic true stress-strain properties of the model material are correlated
with the exponential equation(23)to obtain values for the strength
coefficient K and the strain-hardening exponent n. Equivalent stresses
are then found from
°o = Keo (23)
Deviatoric stresses can be obtained by using
17
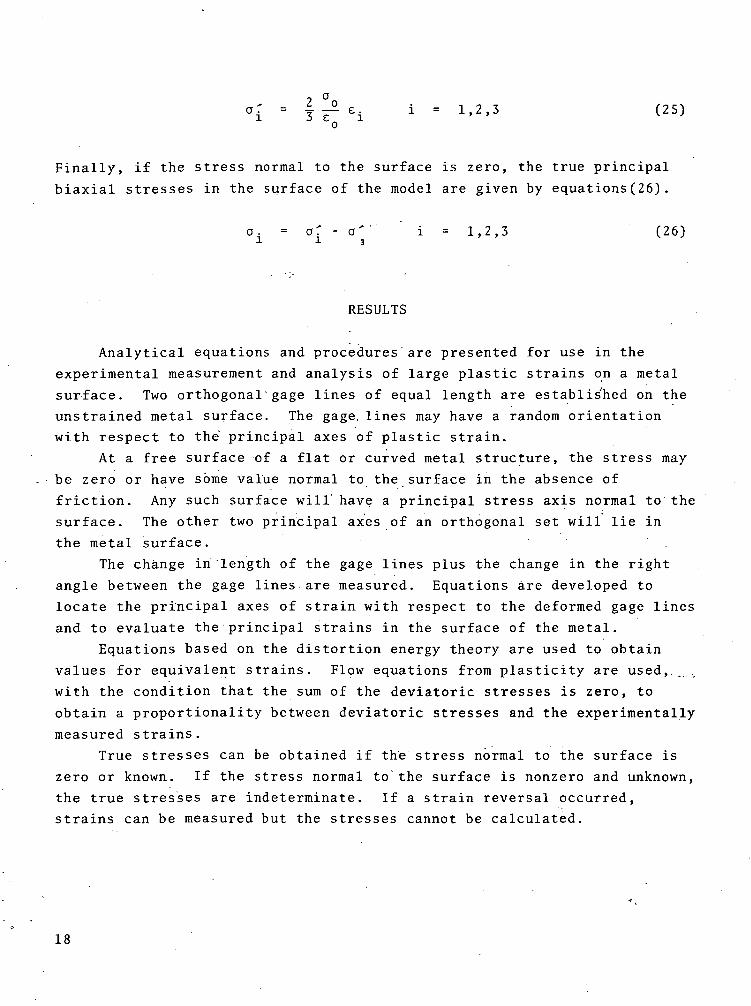
~ e i = 1 > 2 ' 3 (25)
Finally, if the stress normal to the surface is zero, the true principal
biaxial stresses in the surface of the model are given by equations (26) .
a. = aT - a' " i = 1 , 2 , 3 (26)1 1 3
RESULTS
Analytical equations and procedures are presented for use in the
experimental measurement and analysis of large plastic strains on a metal
surface. Two orthogonal'gage lines of equal length are established on the
unstrained metal surface. The gage, lines may have a random orientation
with respect to the principal axes of plastic strain.
At a free surface of a flat or curved metal structure, the stress may
be zero or have some value normal to the surface in the absence of
friction. Any such surface will have a principal stress axis normal to the
surface. The other two principal axes of an orthogonal set will lie in
the metal surface. .
The change in 'length of the gage lines plus the change in the right
angle between the gage lines are measured. Equations are developed to
locate the principal axes of strain with respect to the deformed gage lines
and to evaluate the principal strains in the surface of the metal.
Equations based on the distortion energy theory are used to obtain
values for equivalent strains. Flow equations from plasticity are used,.....,
with the condition that the sum of the deviatoric stresses is zero, to
obtain a proportionality between deviatoric stresses and the experimentally
measured strains.
True stresses can be obtained if the stress normal to the surface is
zero or known. If the stress normal to"the surface is nonzero and unknown,
the true stresses are indeterminate. If a strain reversal occurred,
strains can be measured but the stresses cannot be calculated.
18
DISCUSSION
Experimental Data
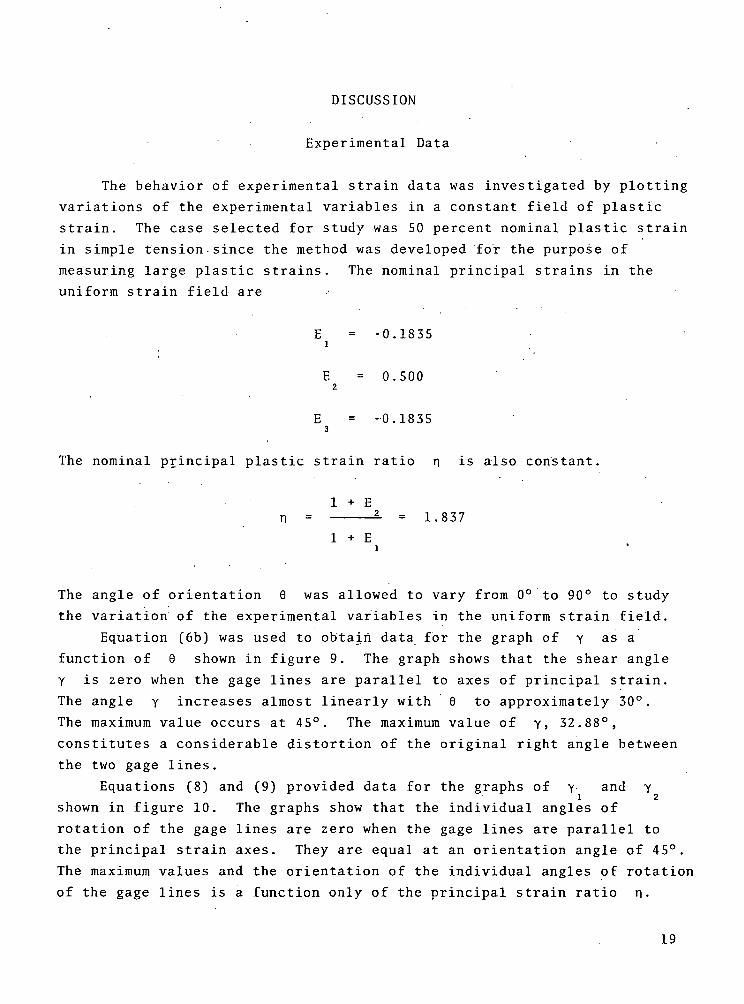
The behavior of experimental strain data was investigated by plotting
variations of the experimental variables in a constant field of plastic
strain. The case selected for study was 50 percent nominal plastic strain
in simple tension since the method was developed for the purpose of
measuring large plastic strains. The nominal principal strains in the
uniform strain field are
E = -0.1835i
E = 0.5002
E = -0.18353
The nominal principal plastic strain ratio r\ is also constant.
1 + En = = 1.837
1 + Ei
The angle of orientation 6 was allowed to vary from 0° to 90° to study
the variation of the experimental variables in the uniform strain field.
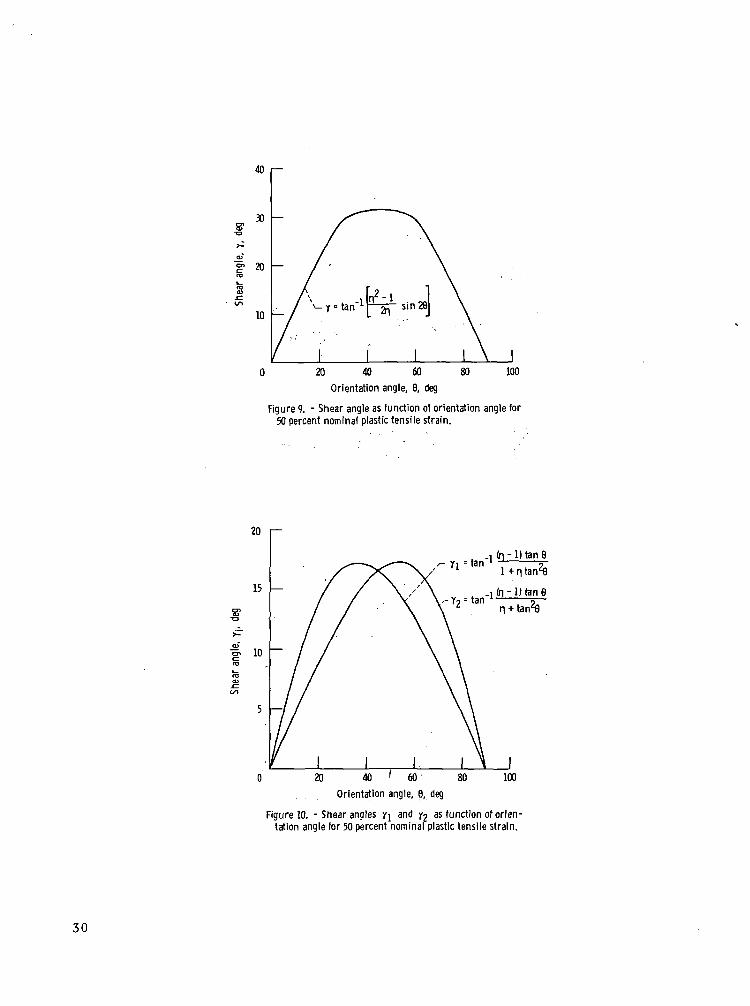
Equation (6b) was used to obtain data for the graph of y as a
function of 9 shown in figure 9. The graph shows that the shear angle
Y is zero when the gage lines are parallel to axes of principal strain.
The angle y increases almost linearly with 0 to approximately 30°.
The maximum value occurs at 45°. The maximum value of y, 32.88°,
constitutes a considerable distortion of the original right angle between
the two gage lines.
Equations (8) and (9) provided data for the graphs of y and Y
shown in figure 10. The graphs show that the individual angles of
rotation of the gage lines are zero when the gage lines are parallel to
the principal strain axes. They are equal at an orientation angle of 45°.
The maximum values and the orientation of the individual angles of rotation
of the gage lines is a function only of the principal strain ratio n •
19
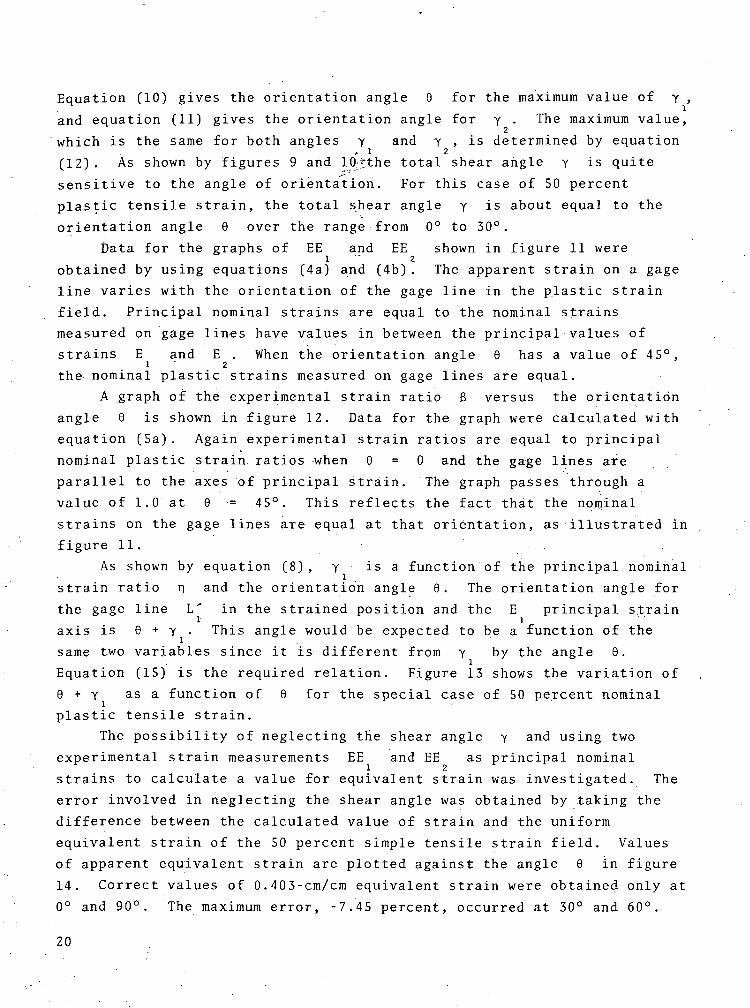
Equation (10) gives the orientation angle 9 for the maximum value of y ,
and equation (11) gives the orientation angle for y • The maximum value,
which is the same for both angles y and y , is determined by equation.•I 2
(12). As shown by figures 9 and lO^the total shear angle y is quite
sensitive to the angle of orientation. For this case of 50 percent
plastic tensile strain, the total shear angle y is about equal to the
orientation angle 6 over the range from 0° to 30°.
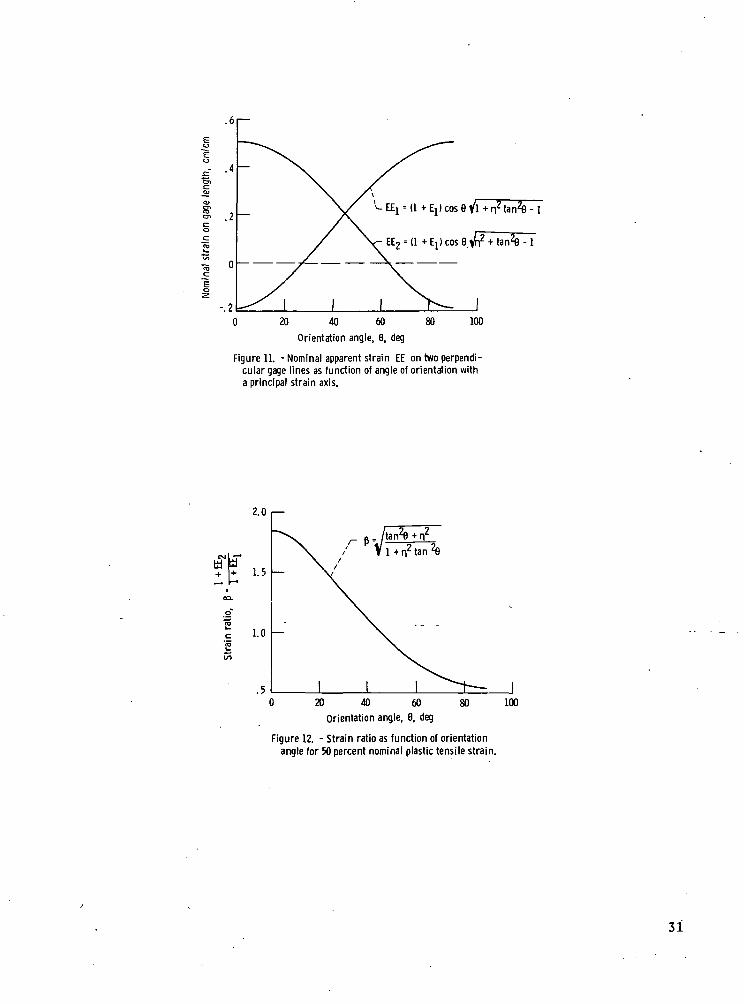
Data for the graphs of EE and EE shown in figure 11 were
obtained by using equations (4a) and (4b) . The apparent strain on a gage
line varies with the orientation of the gage line in the plastic strain
field. Principal nominal strains are equal to the nominal strains
measured on gage lines have values in between the principal values of
strains E and E . When the orientation angle 9 has a value of 45°,
the nominal plastic strains measured on gage lines are equal.
A graph of the experimental strain ratio 8 versus the orientation
angle 0 is shown in figure 12. Data for the graph were calculated with
equation (5a). Again experimental strain ratios are equal to principal
nominal plastic strain ratios when 6=0 and the gage lines are
parallel to the axes of principal strain. The graph passes through a
value of 1.0 at 9 = 45°. This reflects the fact that the nominal
strains on the gage lines are equal at that orientation, as illustrated in
figure 11. .
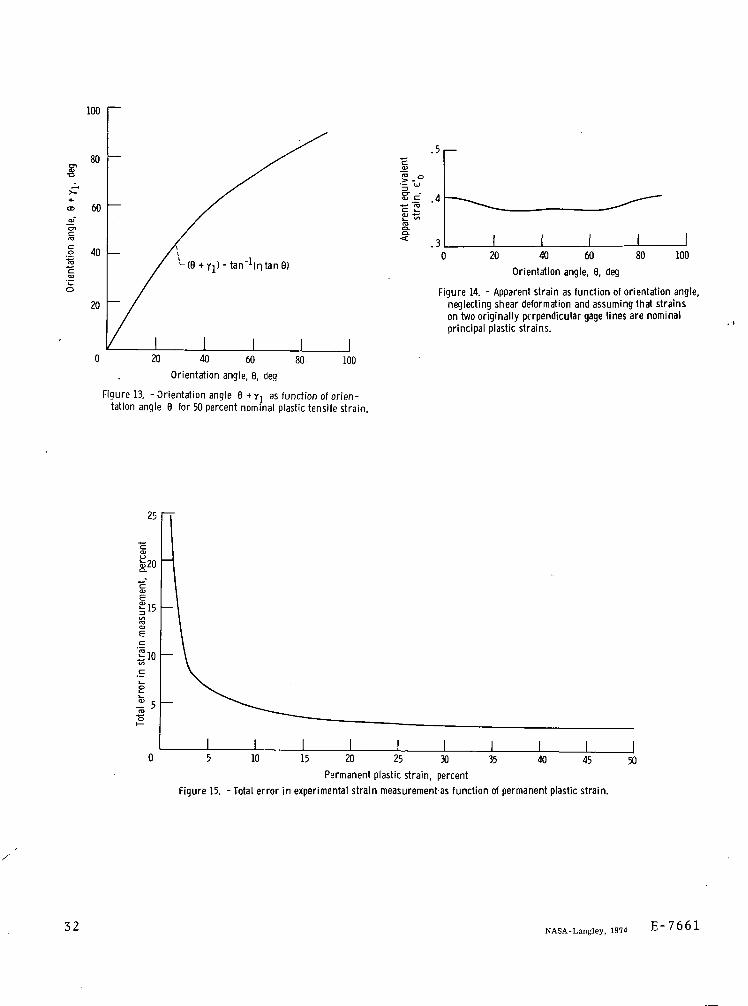
As shown by equation (8), y is a function of the principal nominal
strain ratio n and the orientation angle 9. The orientation angle for
the gage line L" in the strained position and the E principal strain
axis is 6 + y . This angle would be expected to be a function of the
same two variables since it is different from y by the angle 6.
Equation (15) is the required relation. Figure 13 shows the variation of
9 + y as a function of 6 for the special case of 50 percent nominal
plastic tensile strain.
The possibility of neglecting the shear angle y and using two
experimental strain measurements EE and EE as principal nominal
strains to calculate a value for equivalent strain was investigated. The
error involved in neglecting the shear angle was obtained by taking the
difference between the calculated value of strain and the uniform
equivalent strain of the 50 percent simple tensile strain field. Values
of apparent equivalent strain are plotted against the angle 9 in figure
14. Correct values of 0.403-cm/cm equivalent strain were obtained only at
0° and 90°. The maximum error, -7.45 percent, occurred at 30° and 60°.
20
The error at 45° was -7.0 percent. If all gage lines were within ±10° of
alinement with the principal axes of strain, the maximum error in assuming
that measured equivalent strain was the true equivalent strain would be
-1.0 percent.
Accuracy
Sources of error in the measurement of permanent deformations include
instrument errors and punchmark deformation. Other sources of error to be
assessed in using this method of measurement include the effects of
averaging strain on the gage length and the effect of variation of the
radius over the gage length. The assumption that elastic .strains may be
neglected may incorporate error in the form of elastic strains associated
with residual stresses.
Errors in measurement varied with the level of strain being measured.
Strains less than 0.1 percent could not be detected. Accuracy of
measurement increased as the level of strain being measured increased.
Two experimental measurements are required to determine the length of a
gage line on a curved surface before deformation. Two more measurements
are needed to obtain the deformed length. Measurement of the angle
between two gage lines is a source of error. Errors were analyzed for
three levels of strain: 1, 10, and 50 percent. The total error in strain
measurement is the sum of the errors in the pretest and the post-test
•measurements. Results of the analysis are listed in table I.
The error analysis presumes that -the pretest gage lengths are laid out/
and measured on a surface with a relatively uniform radius of 32 cm. .Post-
test error calculations are based on impact-deformed surface radii as short
as 4.6 cm. All errors are based on.gage lengths of 5.08 cm.
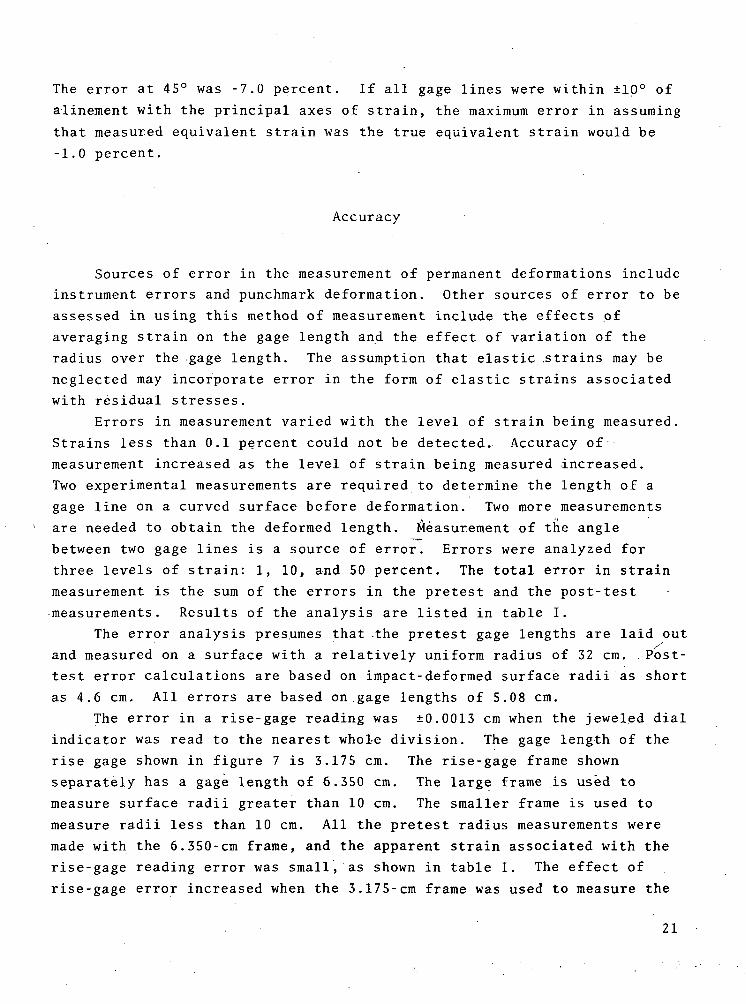
The error in a rise-gage reading was ±0.0013 cm when the jeweled dial
indicator was read to the nearest whole division. The gage length of the
rise gage shown in figure 7 is 3.175 cm. The rise-gage frame shown
separately has a gage length of 6.350 cm. The large frame is used to
measure surface radii greater than 10 cm. The smaller frame is used to
measure radii less than 10 cm. All the pretest radius measurements were
made with the 6.350-cm frame, and the apparent strain associated with the
rise-gage reading error was small, as shown in table I. The effect of
rise-gage error increased when the 3.175-cm frame was used to measure the
21

minimum radius on the deformed model. The maximum in this case was 5.6
percent error in the measurement of 1 percent strain.
The error in a dial caliper reading was ±0.0013. cm when the dial was
read to the nearest division. This error caused an error of 2.5 percent
in the measurement of 1 percent strain. Error decreased as the level of
strain increased. This error component was the same for measurements
before and after the test.
Deformation of the model affected the fit between the punchmarks and
the points of the caliper. The centerline of a punchmark rotated when
the surface radius changed. The shape of the conical punchmark surface
was deformed by the plastic strain in the'metal surface. This source of
error was a maximum' for the greatest change "in radius during deformation
of the model. 'This error increased-as- the level of strain increased, but'
the percent error was 'the same at all thre'e levels of strain;
Applications
The strain measurement system is applicable to high-velocity impact
since the gage lines established on the surface of a model do not
contribute to inertia forces generated during impact. Strain gage lines'
have been established ori the surfaces of 0.61-meter- (2.0-ft-) diameter
model containment vessels tested under conditions of high-velocity impact
against a reinforced-concrete block. Extremities of gage lines were
located by punchmarks. The strain measurement system survived the impact
tests described in references 2 and 5.
As noted'in the section ANALYSIS, the assumptions applied limit the
application of this method "of plastic strain measurement. Wherever the'
assumption's are in question, the use of this strain measurement metho.d
must also be questioned. The method cannot be used on a surface in the
presence of surface friction forces. One of the principal stresses acts
normal to a free surface. A friction force-acts to change the direction of
that principal- stress^ so that it is not perpendicular to the surface, and
thus assumption 5 does not hold. Stresses and strains are assumed to
increase or decrease moriotonically. This assumption eliminates -the
determination of principal stresses in surface locations where stresses and
plastic strains undergo a reversal of sign." In such locations the strains
can be measured, but the final stress system cannot be obtained.
The stress analysis of the hollow-sphere impact test reported in
22 .
reference 3 involved gage lines parallel and perpendicular to lines of
symmetry on the model before and after deformation. Thus, the orthogonal
gage lines were located parallel to the principal strain axes. The
equations developed in the analysis section of this report are presented
for use in the analysis of gage-line strain measurement data obtained from
surfaces where the orthogonal gage lines may not be located parallel to the
principal plastic strain axes.
This strain measurement system could be useful in tests of models or
structures where the plastic strains are greater than the strain range
measurement capability of available electronic or mechanical gages.
Strains could be measured in cylinders tested under conditions of combined
tension and torsion. Large creep deformation could be measured. Strains
generated during burst tests of spheres and cylinders could be measured.
Strain gage lines may be located on surfaces by other methods to
obtain lines capable of surviving other test conditions. For example,
gage lines might be established by etching or scribing lines or points on
surfaces of a model. Optical systems could be utilized to make possible
the use of smaller gage lengths in order to increase the accuracy of
measurement, or to obtain a more accurate measure of the average strain in
the model in the presence of strain gradients'.
This system of strain measurement could be used to augment other
instrumentation sensitive to small strains since the system presented in
this report cannot be used to measure small strains. The system can be
used to obtain reliable measurements of large permanent deformations on
metal surfaces wherever large strains are expected to occur.
The punchmarks defining two perpendicular gage lines were formed in
the surface of the metal with a four-punch tool so that gage lines were
accurately perpendicular before the test. After the test, angles were
measured to the nearest 0.2° so that the error in the determination of the
shear angle y was ±0.1°. Figure 9 is a plot of the shear angle as a
function of the angle of orientation in the strain field. The horizontal
slope at 0 = 45° corresponds with the gage-line orientation for the
maximum error in strain measurement resulting from error in the shear angle
measurement. As shown in table I, angle measurement error made the largest
component of total error at the 1 percent strain level. Shear angle meas-
urement error drops to 1 percent as the orientation angle goes to 0°. This
source of error is less than 1 percent for measurments in a 15 percent
strain area. The error decreases at higher levels of strain.
Total errors are the maximum errors that occur when all of the
23
component errors are maxima and act in the direction to increase the
total error. Total errors are relatively large in areas of low strain.
The error is within the range required for engineering accuracy of ±10
percent at higher levels of strain. Figure 15 shows that plastic strains
above 3 percent have total errors in measurement of less than 10 percent.
In. the usual case, some errors will be nonadditive or compensating
so that the total error in a measurement will fall below 'the curve in
figure 15. Error in the measurement of small strains can be reduced by
keeping the.orientation angle between a gage line and a principal strain
axis as small as possible. Error contributions resulting from strain
averaging over a gage length, variation of the radius on a gage length,
or the presence of residual stresses and elastic strains must be.
evaluated .for each measurement problenv. Errors from these sources are in
addition to the total error graphed in figure 15.
CONCLUDING REMARKS .. ,.. ; . .
Equations are derived and analytical procedures are .presented for
the experimental measurement of large plastic strains in the surface of
a plate. Two perpendicular gage lines of equal length are established
on the surface of the plate before deformation. The change in the lengths
of the gage lines and the change in the right angle between the gage lines
after deformation constitute the required experimental data.
Analysis of the data yields the principal plastic strains and the
angle between an experimental gage line and a principal strain axis in
the surface of the plate. True strains can be calculated and used to
obtain equivalent strain. The behavior of the..experimental variables was
investigated by evaluating equations for the case of 50 percent permanent
plastic deformation in simple .tension.
Sources of error in strain measurement are discussed. It was shown
that permanent plastic strains of 3 percent or more could be measured
with engineering accuracy. Although the maximum error in the measurement
of 1 percent strain is about 25 percent, the accuracy increases for
larger strains. When the plastic deformation is the result of
monotonically increasing strain, an orthogonal set of deviatoric stresses
can be calculated. In addition, if the stress normal to the surface is
24
zero or known, the true stresses associated with the plastic deformation
can be obtained.
Lewis Research Center,
National Aeronautics and Space Administration,
Cleveland, Ohio, November 19, 1973,
770-18.
REFERENCES
1. Morris, Richard E.: Empirical Correlation of Small Hollow Sphere Impact
Failure Data Using Dimensional Analysis. NASA TM X-52874, 1970.
2. Puthoff, R. L.; and Dallas, T.: Preliminary Results on 400 Ft/Sec Impact
Tests of Two 2-Foot Diameter Containment Models for Mobile Nuclear Re-
actors. NASA TM X-52915, 1970.
3. Morris, R. E.: Experimental Stress Analysis of Plastic Deformations in
a Hollow Sphere Deformed by Impact Against a Concrete Block. NASA TM
X-68270, 1973.
4. Faupel, Joseph H.: Engineering Design, John Wiley § Sons, Inc., 1964.
5. Puthoff, Richard L.: A 1055 Ft/Sec Impact Test of a Two-Foot Diameter
Model Nuclear Reactor Containment System Without Fracture. NASA TM
X-68103, 1972.
25
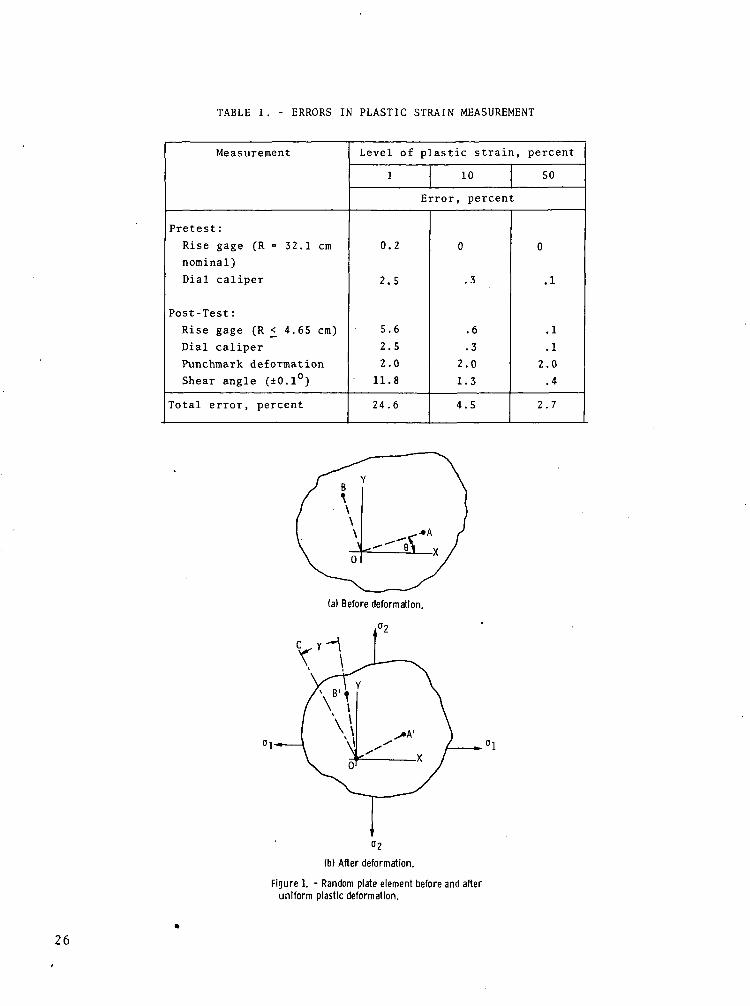
TABLE I. - ERRORS IN PLASTIC STRAIN MEASUREMENT
Measurement
Pretest :Rise gage (R = 32.1 cm
nominal)Dial caliper
Post-Test:Rise gage (R < 4.65 cm)Dial caliperPunchmark deformationShear angle (±0.1°)
Total error, percent
Level of plastic strain, percent
1 10 50
Error, percent
0.2
2.S
5.6
2.5
2.0
11.8
24.6
0
.3
.6
.3
2.0
1.3
4.5
0
.1
.1
.1
2.0
.4
2.7
(a) Before deformation.
(b) After deformation.
Figure 1. - Random plate element before and afteruniform plastic deformation.
26
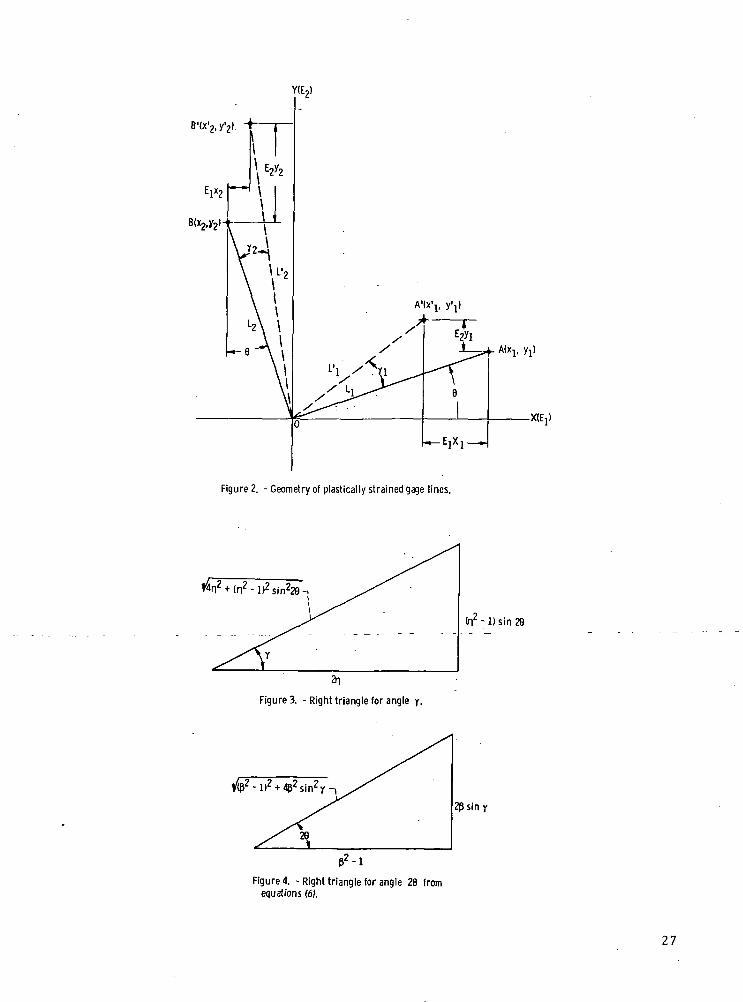
Figure 2. -Geometry of plastically strained gage lines.
(H2-l)sin 29
Figure 3. - Right triangle for angle y.
20 sin r
Figure 4. - Right triangle for angle 28 fromequations (6).
27
/- Punchmark (typical)
ra
ta -j— a
Figures. -Gage lines.
- Rise gager- Dial indicator
/ contact point
Figure 6. - Rise-gage measurement on a curved surface.
28
Dial caliper
Figure 7. - Rise measurement gage with 3.175-cm (1.250-in.) gagelength, rise-gage frame with 6.350-cm (2.500-in.) gage length,and dial caliper used for gage-line chord length measurement.
Y(rise)
R - Y
Figure 8. - Radius measurement using the rise gage.
29
S1
40
30
20
10
20 40 60
Orientation angle, 6, deg
80 100
Figure 9. - Shear angle as function of orientation angle for50 percent nominal plastic tensile strain.
., (n -1) tan 9l 5-1+n tan^B
'U ten 85—n + tan'fl
5 —I
20 40 ' 60
Orientation angle, 8, deg
100
Figure 10. - Shear angles yj and ̂ as 'unction of orien-tation angle for 50 percent nominal plastic tensile strain.
30
iff
~ 0
-.2
'<- EEj • (1 + Ej) cos 8 Vl+nZ tan%-l
EE2 • (1 + Ej) cos 8><i2 + tan^ -1
20 40 60 80Orientation angle, 8, deg
100
Figure 11. - Nominal apparent strain EE on two perpendi-cular gage lines as function of angle of orientation witha principal strain axis.
2.0 r—
1.0
20 40 60
Orientation angle, 8, deg80 100
Figure 12. - Strain ratio as function of orientationangle for 30 percent nominal plastic tensile strain.
31
.5
Sc .4
o 40 — 20 40 60
Orientation angle, 6, deg
100
Figure 14. - Apparent strain as function of orientation angle,neglecting shear deformation and assuming that strainson two originally perpendicular gage lines are nominalprincipal plastic strains.
20 40 60Orientation angle, 0, deg
80 100
Figure 13. - Orientation angle 8+Y i as function of orien-tation angle 9 for 50 percent nominal plastic tensile strain.
35 40 4520 25 30Permanent plastic strain, percent
Figure 15. - Total error in experimental strain measurement-as function of permanent plastic strain.
50
32 NASA-Langley, 1974 E-7661
NATIONAL AERONAUTICS AND SPACE ADMINISTRATION
WASHINGTON. D.C. 2O546
OFFICIAL BUSINESS
PENALTY FOR PRIVATE USE $3OO SPECIAL FOURTH-CLASS RATEBOOK
POSTAGE AND FEES PAIDNATIONAL AERONAUTICS AND
SPACE ADMINISTRATION451
POSTMASTER : If Undeliverable (Section 158Postal Manual) Do Not Return
"The aeronautical and space activities of the United States shall beconducted so as to contribute . . , to the expansion of human knowl-edge of phenomena in the atmosphere and space. The Administrationshall provide for the widest practicable and appropriate disseminationof information concerning its activities and the results thereof."
—NATIONAL AERONAUTICS AND SPACE ACT OF 1958
NASA SCIENTIFIC AND TECHNICAL PUBLICATIONSTECHNICAL REPORTS: Scientific andtechnical information considered important,complete, and a lasting contribution to existingknowledge.
TECHNICAL NOTES: Information less broadin scope but nevertheless of importance as acontribution to existing knowledge.
TECHNICAL MEMORANDUMS:Information receiving limited distributionbecause of preliminary data, security classifica-tion, or other reasons. Also includes conferenceproceedings with either limited or unlimiteddistribution.
CONTRACTOR REPORTS: Scientific andtechnical information generated under a NASAcontract or grant and considered an importantcontribution to existing knowledge.
TECHNICAL TRANSLATIONS: Informationpublished in a foreign language consideredto merit NASA distribution in English.
SPECIAL PUBLICATIONS: Informationderived from or of value to NASA activities.Publications include final reports of majorprojects, monographs, data compilations,handbooks, sourcebooks, and specialbibliographies.
TECHNOLOGY UTILIZATIONPUBLICATIONS: Information on technologyused by NASA that may be of particularinterest in commercial and other non-aerospaceapplications. Publications include Tech Briefs,Technology Utilization Reports andTechnology Surveys.
Details on the availability of fhese publications may be obtained from:
SCIENTIFIC AND TECHNICAL INFORMATION OFFICE
N A T I O N A L A E R O N A U T I C S A N D S P A C E A D M I N I S T R A T I O NWashington, D.C. 20546