proceedings of ecos 2016 th- the 29 … nafion ™ efficiency 0.5
TRANSCRIPT

PROCEEDINGS OF ECOS 2016 - THE 29TH INTERNATIONAL CONFERENCE ON
EFFICIENCY, COST, OPTIMIZATION, SIMULATION AND ENVIRONMENTAL IMPACT OF ENERGY SYSTEMS
JUNE 19-23, 2016, PORTOROŽ, SLOVENIA
LCA study of the Fuel Cell based UPS in manufacturing and operational phase
Mitja Mori a, Grega Štern b
a University of Ljubljana, Faculty of Mechanical Engineering, Aškerčeva 6, SI-1000 Ljubljana, Slovenia,
[email protected] bMiktra d.o.o. Gortina 142, 2366 Muta, [email protected]
Abstract:
Environmental impacts of a 3 kW UPS system based on PEM fuel cell are evaluated in manufacturing and operating stage at operational locations representing renewable (Norway) vs. fossil fuel (Morocco) based energy mix. The LCA method was applied; numerical models were set up using PE International Gabi 6 software; CML 2001 method was used for evaluating environmental impacts through environmental indicators. Numerical model consists of detailed model of manufacturing of 3 kW UPS with all mass and energy balances in manufacturing stage. In addition operation stage was compared with manufacturing stage in terms of environmental impacts. The scope of the study was cradle-to-end of utilization with functional unit of 1 kWh of produced uninterruptible electricity. Hydrogen in both end-locations is produced with different methods (electrolysis, EU hydrogen pipeline and steam reforming), so the influence of hydrogen production method (utilization phase) could be evaluated in comparison with manufacturing phase. Results show that electrolysis in Norway has the lowest and electrolysis in Morocco the highest environmental impact in almost all criteria in utilization phase. In manufacturing phase main impacts come from manufacturing of fuel cell stack, battery, auxiliary components and cabinet production. UPS’s GW till the end of utilization phase is 278 g of CO2 eq. per 1 kWh of uninterruptible electricity if operated in Norway, 416 g with hydrogen from EU H2 pipeline, 1,042 g with gas reforming and 4,390 g with electrolysis in Morocco putting hydrogen production method as a main source of environmental phase. Energy return of investment is 15.1 % in Morocco up to 21.9 % in EU hydrogen pipeline. If H2 is produced with electrolysis, the energy mix in Norway is more favourable from Morocco, where 91 % of electricity is produced from fossil fuels. Manufacturing phase has small environmental impact in comparison with operational phase and transport is almost negligible concerning environmental impacts.
Keywords:
Life cycle assessment, hydrogen technologies, polymer exchange membrane, uninterruptible power supply, hydrogen production, operational phase.
1. Introduction
The use of modern telecommunication services is based on telecommunications grids with different
base stations, transmitters, and other important infrastructure. For reliable operation without grid
break downs, electrical energy is needed all the time, without interference. Because of the complexity
of electrical grid system, the probability of the electricity cut outs is not negligible. In these cases the
reliable uninterruptible power supply systems (UPS) are needed to ensure undisturbed operation, [1].
Conventional UPS systems consist in most cases from battery stacks. In the cases of longer cut-outs,
UPS systems on the basis of internal combustion engine (ICE) are added to battery stack UPS system,
[2]. In the case of telecommunication services the most frequently used UPS system is on the basis
of lead battery stacks that are charged in normal operation of telecommunication system, but provide
electricity in cases of cut-outs, [2]. The main limit of latter systems is when long term cut-out occurs.
Main reason is limited stored energy in battery stacks, while their effectiveness is also affected by
operational conditions i.e. extreme temperatures, many charges/discharges cycles, etc., [3]. The life
time of lead battery based UPS system is estimated to 5 years and even in this period the capacity and
efficiency of charge/discharge cycle can be drastically lowered, [4]. This is not the case within UPS
systems on the basis of hydrogen technologies (HT-UPS). HT-UPS systems use fuel cells for
electricity generation and are limited mostly with fuel (hydrogen) availability. At normal operation
are able to operate without maintenance 10 years and more, [5]. In contrary to ICE-UPS systems they
have almost no moving parts that lowers the maintenance costs and emits no noise during operation.
In addition, the conversion of chemical energy in electricity occurs based on effective electrochemical
processes. The energy efficiency remains almost constant at wide operational temperatures (from
- 40°C to 80°C). The very important issue is that operation with HT-UPS releases less harmful
emissions for environment and for people’s health into earth’s atmosphere, soil and water than
operation with ICE UPS systems that use fossil fuel as fuel. Apart from their evidently decreasing
reserves, fossil fuels, which account for more than 80 % of today’s total primary energy supply, pose
also other problems, [6].
A life cycle assessment (LCA) that is the methodology used in the current study is a standardised
technique to determine the environmental impacts associated with all stages of a product’s life. It can
also serve to improve a product’s environmental profile, compare it to incumbent technology, make
environmental labels and declarations, etc. LCA of hydrogen production technologies and assembly
has been carried out by several authors, [7], [8], [9], [10], [11] and [12]. Hydrogen technologies in
UPS applications have been evaluated without assessing their environmental performance in [13],
[14], [15], [16] and [17]. Contrary to that the current paper evaluates environmental impacts of HT-
UPS system based on polymer membrane fuel cell in its manufacturing and operating stage at two
different operating locations. Operation in Norway and Morocco is evaluated for 10 years or 10,000h
of operation time with onsite hydrogen production with three different production technologies. The
study emphasis the contribution of manufacturing and operational phase to overall environmental
impact and the importance of hydrogen production method.
2. Hydrogen Based Uninterruptible Power Supply Systems Advantage of hydrogen based UPS systems (HT-UPS) is mainly the reliable operation in extreme
conditions. In addition HT-UPS systems are considered feasible to be integrated into advanced energy
supply systems on large scale, [18], [19], [20] and [21]. The three subsystems: hydrogen production
system, hydrogen storage tank and fuel cell have the ability to convert electric energy into hydrogen
based chemical energy, store it, and convert it back into electricity when needed. If hydrogen is
produced from renewable energy sources (RES), such a system emits very small amounts of CO2 in
its operational phase. However, in other stages of its life cycle: raw materials production,
manufacturing, transport and decomposition, it is expected to have certain environmental impact.
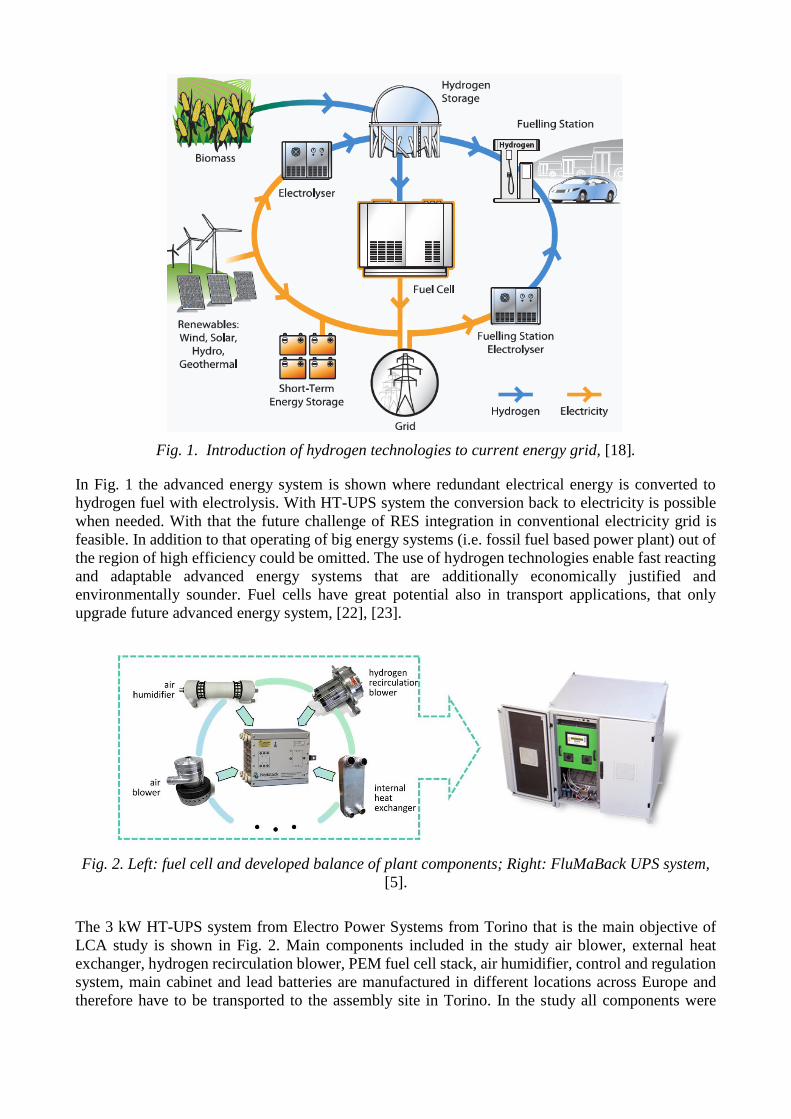
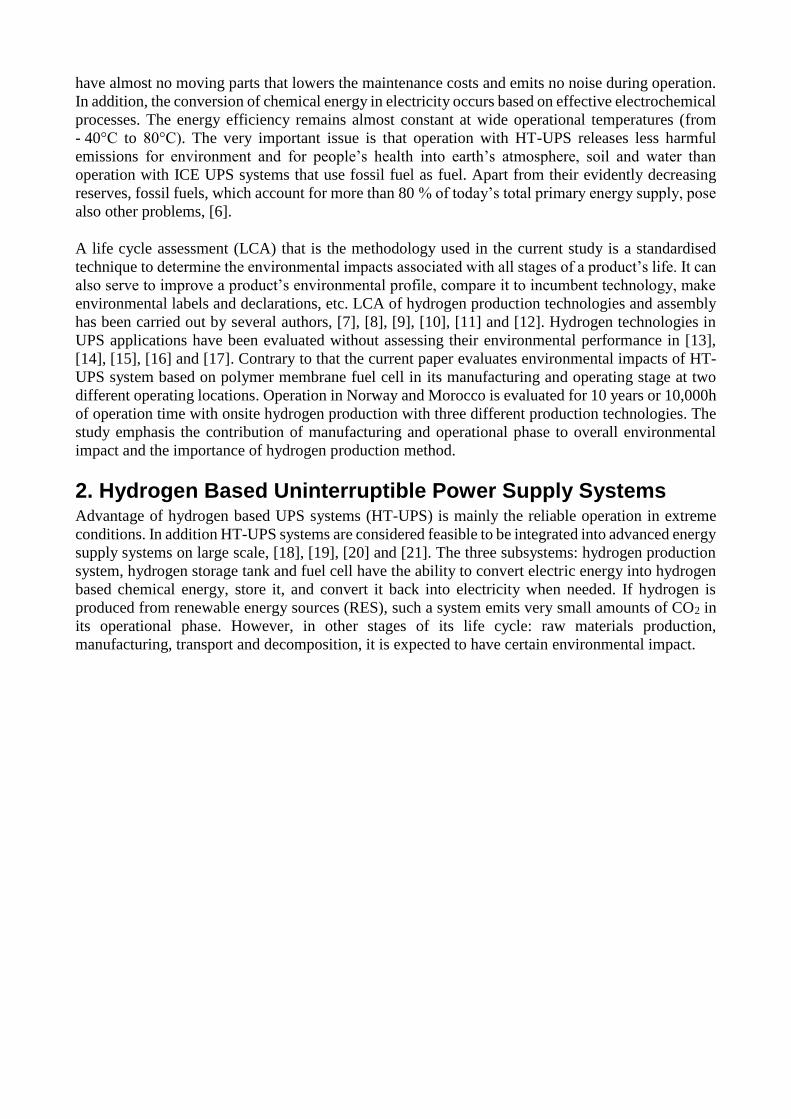
Fig. 1. Introduction of hydrogen technologies to current energy grid, [18].
In Fig. 1 the advanced energy system is shown where redundant electrical energy is converted to
hydrogen fuel with electrolysis. With HT-UPS system the conversion back to electricity is possible
when needed. With that the future challenge of RES integration in conventional electricity grid is
feasible. In addition to that operating of big energy systems (i.e. fossil fuel based power plant) out of
the region of high efficiency could be omitted. The use of hydrogen technologies enable fast reacting
and adaptable advanced energy systems that are additionally economically justified and
environmentally sounder. Fuel cells have great potential also in transport applications, that only
upgrade future advanced energy system, [22], [23].
Fig. 2. Left: fuel cell and developed balance of plant components; Right: FluMaBack UPS system,
[5].
The 3 kW HT-UPS system from Electro Power Systems from Torino that is the main objective of
LCA study is shown in Fig. 2. Main components included in the study air blower, external heat
exchanger, hydrogen recirculation blower, PEM fuel cell stack, air humidifier, control and regulation
system, main cabinet and lead batteries are manufactured in different locations across Europe and
therefore have to be transported to the assembly site in Torino. In the study all components were
modelled according to detailed manufacturer’s data and numerical models for all balance of plant
components were set up. In table 1 general data of HT-UPS is presented.
Table 1. Basic data of 3 kW FluMaBack HT-UPS system, [5]
FluMaBack 3kW
Dimensions / Weight 100 x 100 x 150 / 300 kg
Electrical power 3 kW
Fuel cell PEM fuel cell
Electrolyte Nafion™
Efficiency 0.5
Rated voltage output 24 V
Rated el. current output 125 A
Temperature range up to 65 °C
Lifetime 10,000 h
Fuel Hydrogen, 99.99 % purity
Fuel consumption (at 3 kW ) 0.0883334 kg/ kWh
3. Life Cycle Assessment Life cycle assessment (LCA) method that was used in the current paper is the most comprehensive
method for evaluating the environmental impact of the product in all its life cycle stages. The LCA
is a compilation and evaluation of material and energy inputs and outputs, and potential
environmental impacts of a product during its lifetime. It consists of four stages: the definition of the
goal and scope, the life cycle inventory analysis, which is the construction of the product’s life cycle
model where all relevant mass and energy flows are quantified; the life cycle impact assessment
which is the evaluation of the environmental relevance of these flows; and finally the interpretation
of results, [24], [25].
3.1. Numerical model of 3 kW HT-UPS, Goal, Scope and Functional Unit
3.1.1. The goal and the scope of the study
The goal and scope define the exact questions that the analysis will try to answer, and set its spatial,
temporal, and technological boundaries. The product’s function is defined and quantified by the
functional unit – which in the case of this study is 1 kWh of produced uninterrupted electricity. The
goal of the study was to determine environmental impacts of the 3kW UPS and evaluate those impacts
in manufacturing and operational phase at two end operation sites. The study is physically limited to
UPS system, while hydrogen production facility manufacturing process was not included in LCA
numerical model. The system’s physical boundaries include the all UPS’s subsystems.
Geographically system is assumed to be installed in northern Africa (Marrakesh, Morocco) or
northern Europe (Oslo, Norway). Transport via railway, cargo ship and truck has been included in
the numerical models. Operation phase is considered for 10 000 h in approximately 10 years’ time.
In the model the maintenance of the system is excluded since it has to operate mainly without
maintenance for 10 000 h. The type of analysis was cradle-to-end of utilization, covering raw
materials production, energy requirements for manufacturing process and assembly of parts, the
system’s transport from manufacturing site to operation site, and its operation (hydrogen from
different production methods). Not enough data was available to properly model the system’s end-
of-life phase (reuse, recycling and disposal of parts).
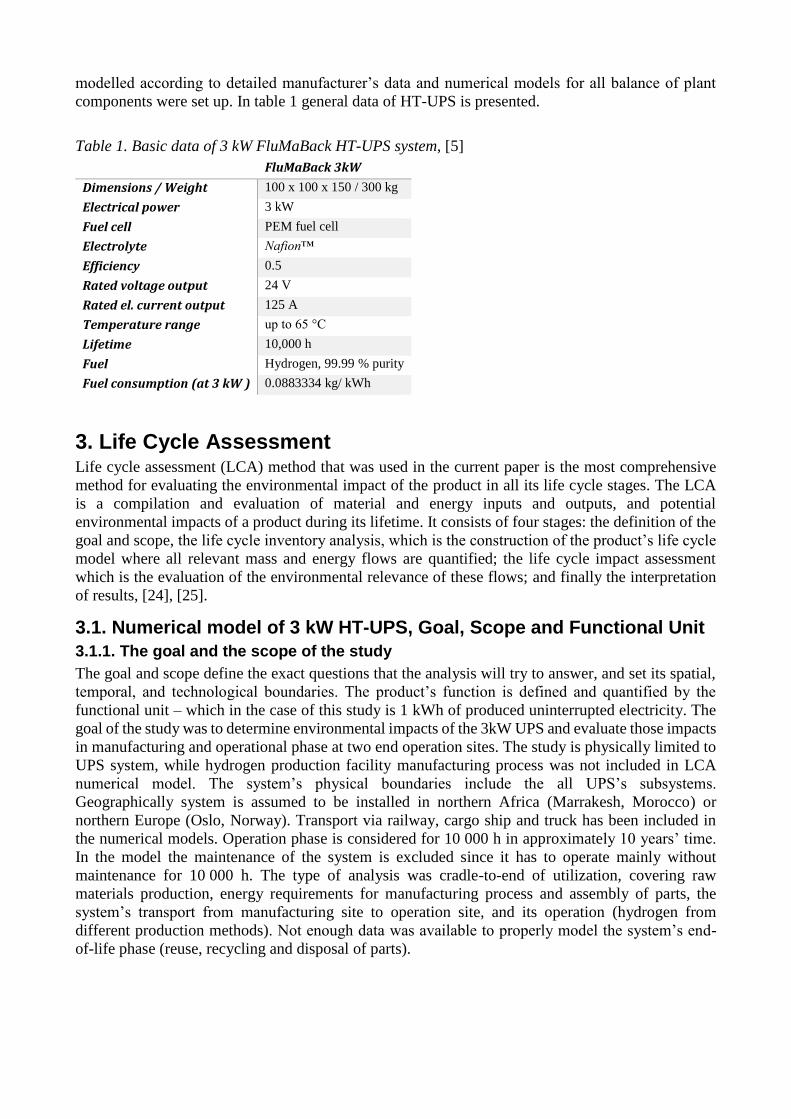
3.1.2 LCA Numerical model
Numerical model is shown in fig. 3 with all material and energy inputs. A top-to-bottom principle
was used to model the system, sequentially dividing it into smaller segments in order to reach the
most detailed description of the system’s design and function: one main integrating process, seven
manufacturing processes (FC, air blower, hydrogen blower, external heat exchanger, humidifier,
battery stack, additional components), nine transport processes (transport of components to assembly
place and transport of HT-UPS to end-operating sites), four operation processes (4 different hydrogen
production methods).
Fig. 3. The numerical LCA model of 3 kW UPS system with boundaries.
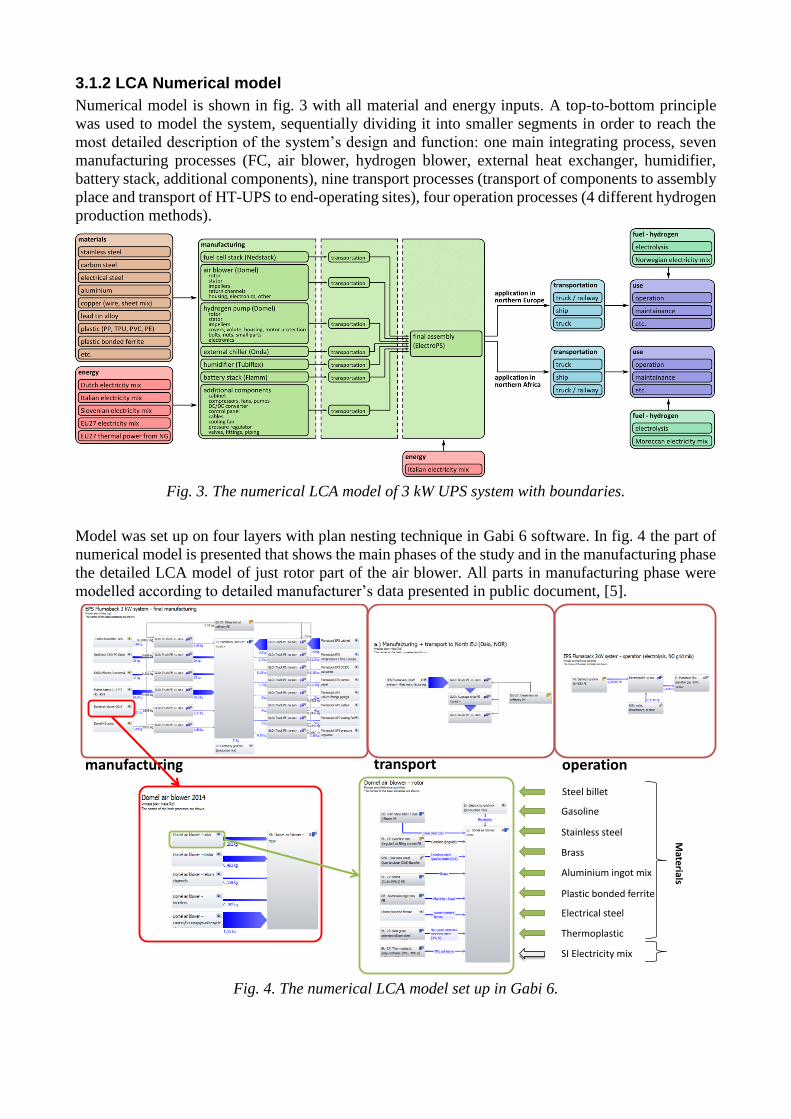
Model was set up on four layers with plan nesting technique in Gabi 6 software. In fig. 4 the part of
numerical model is presented that shows the main phases of the study and in the manufacturing phase
the detailed LCA model of just rotor part of the air blower. All parts in manufacturing phase were
modelled according to detailed manufacturer’s data presented in public document, [5].
Fig. 4. The numerical LCA model set up in Gabi 6.
manufacturing transport operation
Steel billet
Gasoline
Stainless steel
Brass
Aluminium ingot mix
Plastic bonded ferrite
Electrical steel
SI Electricity mix
Thermoplastic
Materials
Data used in the model were generic secondary data from PE International database that include raw
material production, electric energy mixes in the manufacturing phase, hydrogen production, type
Euro 4 cargo trucks, ship and railway transport in the transport phase, water, hydrogen and oxygen
in the operation phase.
3.2. Life Cycle Inventory Analysis
In the LCIA step, all input and output flows are translated into contribution to the chosen
environmental impact categories (e.g. global warming). In the study all virgin material mass flows in
BoP components manufacturing process are included as well as emissions during the phases of
materials extraction, manufacturing, transport and operation. Data consist of primary data gathered
on the basis of manufacturers' masses of materials as inputs in manufacturing process of BoP
components. Secondary data are used in all cases where primary data are not available. In this case
reference studies and generic databases are used, [26].
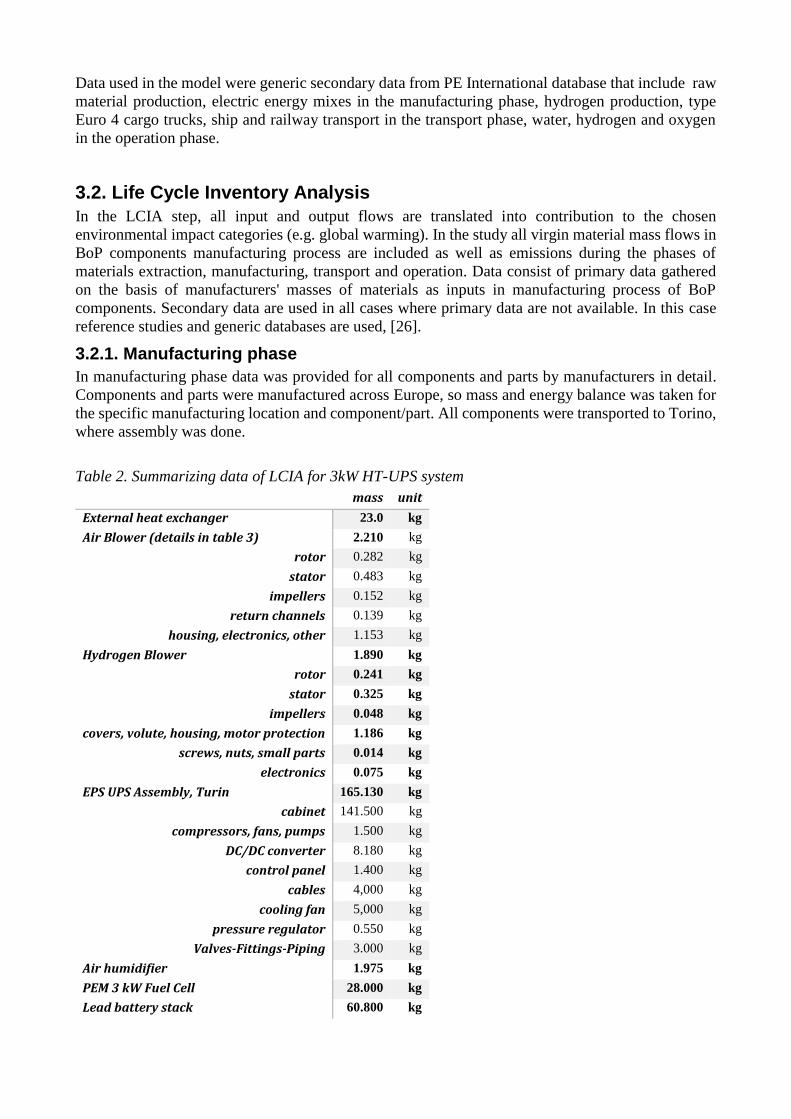
3.2.1. Manufacturing phase
In manufacturing phase data was provided for all components and parts by manufacturers in detail.
Components and parts were manufactured across Europe, so mass and energy balance was taken for
the specific manufacturing location and component/part. All components were transported to Torino,
where assembly was done.
Table 2. Summarizing data of LCIA for 3kW HT-UPS system
mass unit
External heat exchanger 23.0 kg
Air Blower (details in table 3) 2.210 kg
rotor 0.282 kg
stator 0.483 kg
impellers 0.152 kg
return channels 0.139 kg
housing, electronics, other 1.153 kg
Hydrogen Blower 1.890 kg
rotor 0.241 kg
stator 0.325 kg
impellers 0.048 kg
covers, volute, housing, motor protection 1.186 kg
screws, nuts, small parts 0.014 kg
electronics 0.075 kg
EPS UPS Assembly, Turin 165.130 kg
cabinet 141.500 kg
compressors, fans, pumps 1.500 kg
DC/DC converter 8.180 kg
control panel 1.400 kg
cables 4,000 kg
cooling fan 5,000 kg
pressure regulator 0.550 kg
Valves-Fittings-Piping 3.000 kg
Air humidifier 1.975 kg
PEM 3 kW Fuel Cell 28.000 kg
Lead battery stack 60.800 kg
All detailed data are presented in public available study from European funded project FluMaBack1,
[5]. In table 2 mass of all components or/and processes are presented for one HT-UPS system. All
parts and BoP components are broke down up to virgin materials in next level as a results of data
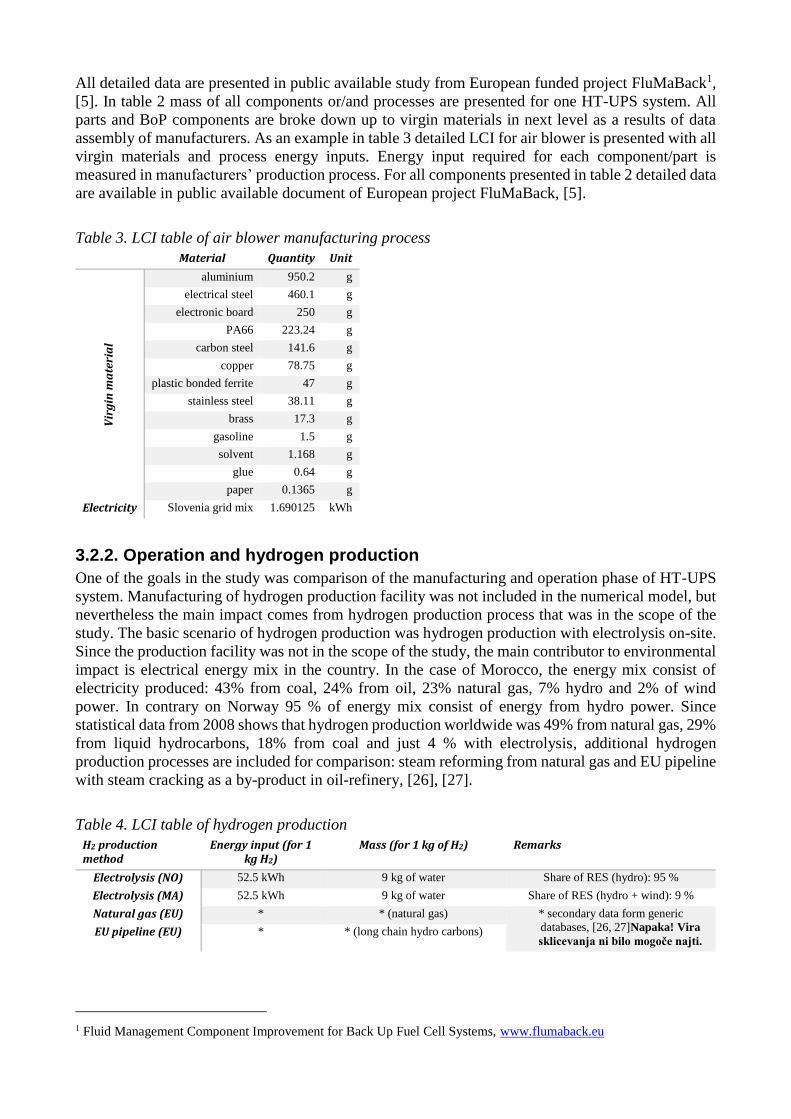
assembly of manufacturers. As an example in table 3 detailed LCI for air blower is presented with all
virgin materials and process energy inputs. Energy input required for each component/part is
measured in manufacturers’ production process. For all components presented in table 2 detailed data
are available in public available document of European project FluMaBack, [5].
Table 3. LCI table of air blower manufacturing process
Material Quantity Unit
Vir
gin
ma
teri
al
aluminium 950.2 g
electrical steel 460.1 g
electronic board 250 g
PA66 223.24 g
carbon steel 141.6 g
copper 78.75 g
plastic bonded ferrite 47 g
stainless steel 38.11 g
brass 17.3 g
gasoline 1.5 g
solvent 1.168 g
glue 0.64 g
paper 0.1365 g
Electricity Slovenia grid mix 1.690125 kWh
3.2.2. Operation and hydrogen production
One of the goals in the study was comparison of the manufacturing and operation phase of HT-UPS
system. Manufacturing of hydrogen production facility was not included in the numerical model, but
nevertheless the main impact comes from hydrogen production process that was in the scope of the
study. The basic scenario of hydrogen production was hydrogen production with electrolysis on-site.
Since the production facility was not in the scope of the study, the main contributor to environmental
impact is electrical energy mix in the country. In the case of Morocco, the energy mix consist of
electricity produced: 43% from coal, 24% from oil, 23% natural gas, 7% hydro and 2% of wind
power. In contrary on Norway 95 % of energy mix consist of energy from hydro power. Since
statistical data from 2008 shows that hydrogen production worldwide was 49% from natural gas, 29%
from liquid hydrocarbons, 18% from coal and just 4 % with electrolysis, additional hydrogen
production processes are included for comparison: steam reforming from natural gas and EU pipeline
with steam cracking as a by-product in oil-refinery, [26], [27].
Table 4. LCI table of hydrogen production
H2 production method
Energy input (for 1 kg H2)
Mass (for 1 kg of H2) Remarks
Electrolysis (NO) 52.5 kWh 9 kg of water Share of RES (hydro): 95 %
Electrolysis (MA) 52.5 kWh 9 kg of water Share of RES (hydro + wind): 9 %
Natural gas (EU) * * (natural gas) * secondary data form generic
databases, [26, 27]Napaka! Vira
sklicevanja ni bilo mogoče najti. EU pipeline (EU) * * (long chain hydro carbons)
1 Fluid Management Component Improvement for Back Up Fuel Cell Systems, www.flumaback.eu

In table 4 energy input and mass of the water required for electrolysis and the source of generic data
for hydrogen production are presented. In the case of electrolysis the theoretical case was used.
3.2.3. Life Cycle Impact Assessment
In the life cycle interpretation step, attention was paid to determine whether the methods, models and
data are consistent with the goals of the analysis. To ensure the credibility and comparability of such
analyses, standardisation documents have to be taken into account. Since 1997, ISO standards 14040
and 14044 have covered terminology, methods and procedures, environmental declarations, resource
management, measurements, audits, [24]. The results were analysed in terms of chosen environmental
indicators, and major contributors to environmental impacts were identified.
Global warming (GW), abiotic depletion (AD), ozone depletion (OD), acidification (A),
eutrophication (E), photochemical ozone creation (POC), and human toxicity (HT) were calculated
as environmental impact indicators, [28], according to the CML2001 methodology, [29].
4. Results and discussion In first part of discussion the comparison of manufacturing and operational phase is discussed in terms
of environmental indicators. In second part different operation strategies regarding hydrogen
production are compared.
4.1. Manufacturing Phase of UPS
In manufacturing process the main impacts come from manufacturing of fuel cell, battery and the
cabinet. Environmental impact is high due to the high mass of steel used in the case of cabinet. In the
case of fuel cell and battery in contrary high energy consumption (local electricity energy mix) during
manufacturing process is very important parameter. Transport of all components to assembly site in
Torino represents just 1 % of total GW (Figure 5).
Fig. 5. Global warming in kg CO2-eq. for manufacturing process (total of 2157 kg of CO2-eq.)
In table 5 relative contributions of environmental impacts of BoP components in manufacturing stage
are presented for all environmental impact criteria. Significant environmental impact in general
comes from manufacturing of the fuel cell, battery, auxiliary components (assembly process in
Torino) and air blower. Main cabinet has high GW and A because of high energy consumption of the
local energy mix, linked to big mass of used steel. The lowest impact have humidifier and external
climate because of low masses of material and optimized manufacturing technology that means low
energy consumption.
77,7; 4%
26,2; 2%
495,0; 28%
8,0; 0%
98,2; 6%
353,4; 20%
462,8; 26%
229,9; 13%
11,0; 1%
air blower
H2 blower
battery
humidifier
external climate
fuel cell stack
cabinet
auxiliary components
transport - manufacturing
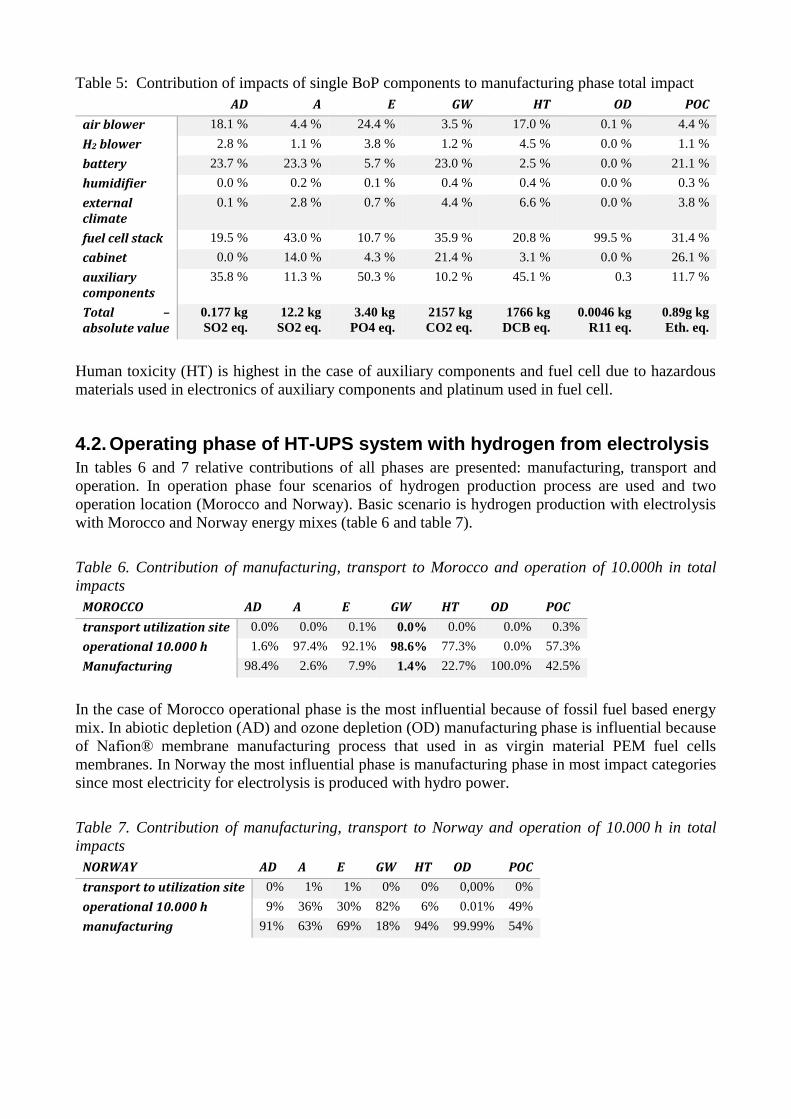
Table 5: Contribution of impacts of single BoP components to manufacturing phase total impact
AD A E GW HT OD POC
air blower 18.1 % 4.4 % 24.4 % 3.5 % 17.0 % 0.1 % 4.4 %
H2 blower 2.8 % 1.1 % 3.8 % 1.2 % 4.5 % 0.0 % 1.1 %
battery 23.7 % 23.3 % 5.7 % 23.0 % 2.5 % 0.0 % 21.1 %
humidifier 0.0 % 0.2 % 0.1 % 0.4 % 0.4 % 0.0 % 0.3 %
external climate
0.1 % 2.8 % 0.7 % 4.4 % 6.6 % 0.0 % 3.8 %
fuel cell stack 19.5 % 43.0 % 10.7 % 35.9 % 20.8 % 99.5 % 31.4 %
cabinet 0.0 % 14.0 % 4.3 % 21.4 % 3.1 % 0.0 % 26.1 %
auxiliary components
35.8 % 11.3 % 50.3 % 10.2 % 45.1 % 0.3 11.7 %
Total – absolute value
0.177 kg
SO2 eq.
12.2 kg
SO2 eq.
3.40 kg
PO4 eq.
2157 kg
CO2 eq.
1766 kg
DCB eq.
0.0046 kg
R11 eq.
0.89g kg
Eth. eq.
Human toxicity (HT) is highest in the case of auxiliary components and fuel cell due to hazardous
materials used in electronics of auxiliary components and platinum used in fuel cell.
4.2. Operating phase of HT-UPS system with hydrogen from electrolysis
In tables 6 and 7 relative contributions of all phases are presented: manufacturing, transport and
operation. In operation phase four scenarios of hydrogen production process are used and two
operation location (Morocco and Norway). Basic scenario is hydrogen production with electrolysis
with Morocco and Norway energy mixes (table 6 and table 7).
Table 6. Contribution of manufacturing, transport to Morocco and operation of 10.000h in total
impacts
MOROCCO AD A E GW HT OD POC
transport utilization site 0.0% 0.0% 0.1% 0.0% 0.0% 0.0% 0.3%
operational 10.000 h 1.6% 97.4% 92.1% 98.6% 77.3% 0.0% 57.3%
Manufacturing 98.4% 2.6% 7.9% 1.4% 22.7% 100.0% 42.5%
In the case of Morocco operational phase is the most influential because of fossil fuel based energy
mix. In abiotic depletion (AD) and ozone depletion (OD) manufacturing phase is influential because
of Nafion® membrane manufacturing process that used in as virgin material PEM fuel cells
membranes. In Norway the most influential phase is manufacturing phase in most impact categories
since most electricity for electrolysis is produced with hydro power.
Table 7. Contribution of manufacturing, transport to Norway and operation of 10.000 h in total
impacts
NORWAY AD A E GW HT OD POC
transport to utilization site 0% 1% 1% 0% 0% 0,00% 0%
operational 10.000 h 9% 36% 30% 82% 6% 0.01% 49%
manufacturing 91% 63% 69% 18% 94% 99.99% 54%
4.2. Operating phase with additional hydrogen production methods
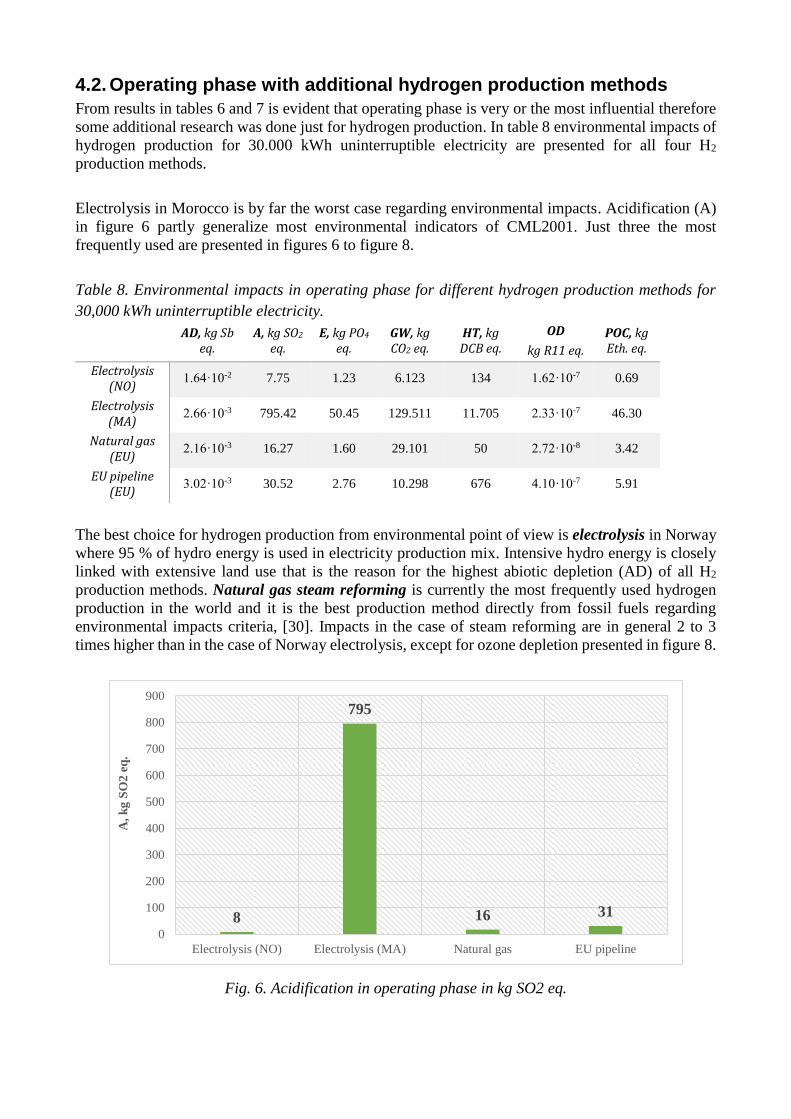
From results in tables 6 and 7 is evident that operating phase is very or the most influential therefore
some additional research was done just for hydrogen production. In table 8 environmental impacts of
hydrogen production for 30.000 kWh uninterruptible electricity are presented for all four H2
production methods.
Electrolysis in Morocco is by far the worst case regarding environmental impacts. Acidification (A)
in figure 6 partly generalize most environmental indicators of CML2001. Just three the most
frequently used are presented in figures 6 to figure 8.
Table 8. Environmental impacts in operating phase for different hydrogen production methods for
30,000 kWh uninterruptible electricity.
AD, kg Sb
eq. A, kg SO2
eq. E, kg PO4
eq. GW, kg CO2 eq.
HT, kg DCB eq.
OD
kg R11 eq.
POC, kg Eth. eq.
Electrolysis (NO)
1.64·10-2 7.75 1.23 6.123 134 1.62·10-7 0.69
Electrolysis (MA)
2.66·10-3 795.42 50.45 129.511 11.705 2.33·10-7 46.30
Natural gas (EU)
2.16·10-3 16.27 1.60 29.101 50 2.72·10-8 3.42
EU pipeline (EU)
3.02·10-3 30.52 2.76 10.298 676 4.10·10-7 5.91
The best choice for hydrogen production from environmental point of view is electrolysis in Norway
where 95 % of hydro energy is used in electricity production mix. Intensive hydro energy is closely
linked with extensive land use that is the reason for the highest abiotic depletion (AD) of all H2
production methods. Natural gas steam reforming is currently the most frequently used hydrogen
production in the world and it is the best production method directly from fossil fuels regarding
environmental impacts criteria, [30]. Impacts in the case of steam reforming are in general 2 to 3
times higher than in the case of Norway electrolysis, except for ozone depletion presented in figure 8.
Fig. 6. Acidification in operating phase in kg SO2 eq.
8
795
16 31
0
100
200
300
400
500
600
700
800
900
Electrolysis (NO) Electrolysis (MA) Natural gas EU pipeline
A,
kg
SO
2 e
q.

EU pipeline hydrogen represents the future idea of hydrogen pipeline in the Europe that is mainly
produced with steam cracking as a by-product in the process. Environmental impacts are up to 5 times
higher than environmental impacts with electrolysis in countries with RES hydro energy mix
(Norway). In addition the hydrogen from steam reforming and steam cracking needs additional
cleaning that is linked with more energy consumption and environmental impacts.
Fig. 7. Global warming (GW) in operating phase in kg CO2 eq.
Fig. 8. Ozone depletion in operating phase in kg R11 eq.
6,123
129,511
29,101
10,298
0
20,000
40,000
60,000
80,000
100,000
120,000
140,000
Electrolysis (NO) Electrolysis (MA) Natural gas EU pipeline
GW
, k
g C
O2
eq
.
1.62E-07
2.33E-07
2.72E-08
4.10E-07
0.00E+00
5.00E-08
1.00E-07
1.50E-07
2.00E-07
2.50E-07
3.00E-07
3.50E-07
4.00E-07
4.50E-07
Electrolysis (NO) Electrolysis (MA) Natural gas EU pipeline
OD
[k
g R
11
eq
.]
4.3. Energy efficiency, energy and mass balances
In the case of energy systems, mass and energy balances are of great importance. In the study in
addition to energy efficiency, energy return on investment (EROI) value was added. It represents the
ratio between produced energy and all input energy, [31]:
energyinputtotal
energyproducedEROI , (1)
In the case of energy systems produced (useful) energy represents electricity or/and heat produced in
operating phase. In special systems as HT-UPS systems heat is treated as a loss and is not useful
(produced energy, eq. 1) part of energy. Total input energy represents all energy flows in form of
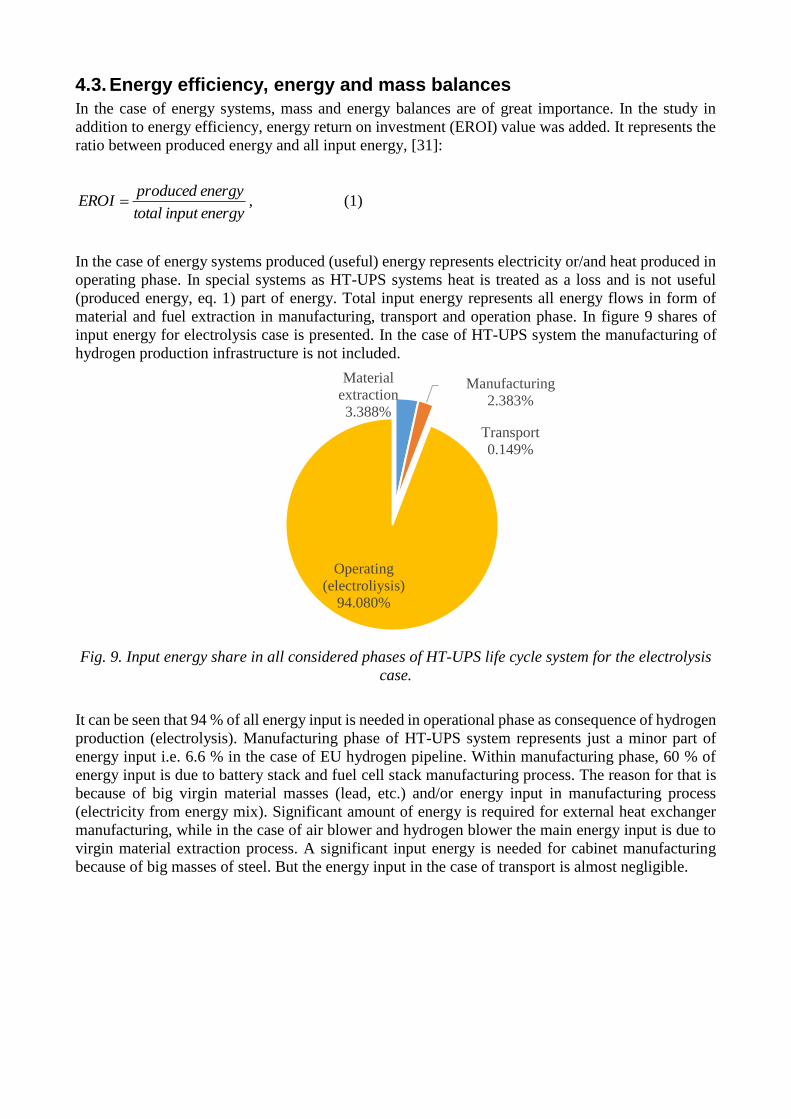
material and fuel extraction in manufacturing, transport and operation phase. In figure 9 shares of
input energy for electrolysis case is presented. In the case of HT-UPS system the manufacturing of
hydrogen production infrastructure is not included.
Fig. 9. Input energy share in all considered phases of HT-UPS life cycle system for the electrolysis
case.
It can be seen that 94 % of all energy input is needed in operational phase as consequence of hydrogen
production (electrolysis). Manufacturing phase of HT-UPS system represents just a minor part of
energy input i.e. 6.6 % in the case of EU hydrogen pipeline. Within manufacturing phase, 60 % of
energy input is due to battery stack and fuel cell stack manufacturing process. The reason for that is
because of big virgin material masses (lead, etc.) and/or energy input in manufacturing process
(electricity from energy mix). Significant amount of energy is required for external heat exchanger
manufacturing, while in the case of air blower and hydrogen blower the main energy input is due to
virgin material extraction process. A significant input energy is needed for cabinet manufacturing
because of big masses of steel. But the energy input in the case of transport is almost negligible.
Material
extraction
3.388%
Manufacturing
2.383%
Transport
0.149%
Operating
(electroliysis)
94.080%
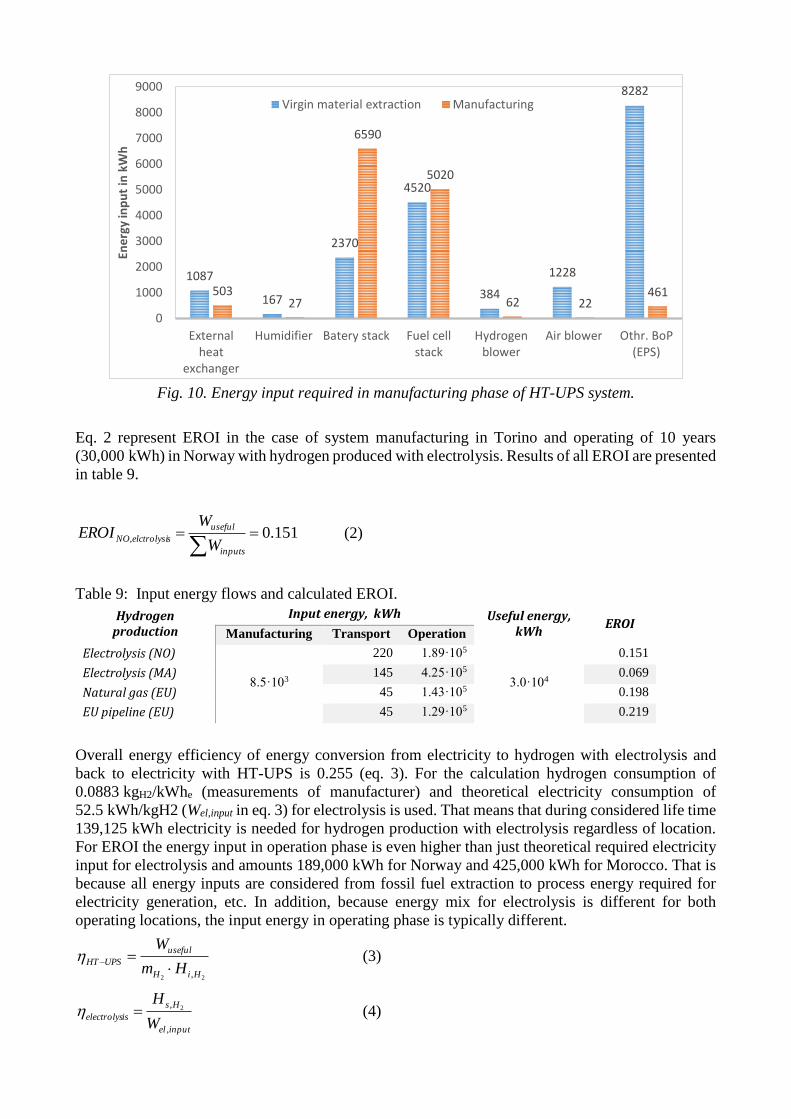
Fig. 10. Energy input required in manufacturing phase of HT-UPS system.
Eq. 2 represent EROI in the case of system manufacturing in Torino and operating of 10 years
(30,000 kWh) in Norway with hydrogen produced with electrolysis. Results of all EROI are presented
in table 9.
151.0, inputs
useful
selctrolysiNOW
WEROI (2)
Table 9: Input energy flows and calculated EROI.
Hydrogen production
Input energy, kWh Useful energy, kWh
EROI Manufacturing Transport Operation
Electrolysis (NO)
8.5·103
220 1.89·105
3.0·104
0.151
Electrolysis (MA) 145 4.25·105 0.069
Natural gas (EU) 45 1.43·105 0.198
EU pipeline (EU) 45 1.29·105 0.219
Overall energy efficiency of energy conversion from electricity to hydrogen with electrolysis and
back to electricity with HT-UPS is 0.255 (eq. 3). For the calculation hydrogen consumption of
0.0883 kgH2/kWhe (measurements of manufacturer) and theoretical electricity consumption of
52.5 kWh/kgH2 (Wel,input in eq. 3) for electrolysis is used. That means that during considered life time
139,125 kWh electricity is needed for hydrogen production with electrolysis regardless of location.
For EROI the energy input in operation phase is even higher than just theoretical required electricity
input for electrolysis and amounts 189,000 kWh for Norway and 425,000 kWh for Morocco. That is
because all energy inputs are considered from fossil fuel extraction to process energy required for
electricity generation, etc. In addition, because energy mix for electrolysis is different for both
operating locations, the input energy in operating phase is typically different.
22 ,HiH
useful
UPSHTHm
W
(3)
inputel
Hs
iselectrolysW
H
,
, 2 (4)
1087
167
2370
4520
384
1228
8282
50327
6590
5020
62 22461
0
1000
2000
3000
4000
5000
6000
7000
8000
9000
Externalheat
exchanger
Humidifier Batery stack Fuel cellstack
Hydrogenblower
Air blower Othr. BoP(EPS)
Ene
rgy
inp
ut
in k
Wh
Virgin material extraction Manufacturing
255.0 UPSHTiselectrolys (5)
Theoretical efficiency of electrolysis, electrolysis, is 75 % and is higher that efficiency of natural gas
steam reforming and steam cracking that amounts from 65 % to 75 %, [32]. Nevertheless EROI of
electrolysis for both locations is lower than in the case of gas steam reforming and EU pipe line
because of lower energy input in operational phase. But there is no energy input considered for
cleaning the hydrogen in the case of gas steam reforming and steam cracking production method that
would lower EROI.
5. Conclusions A hydrogen technology based UPS system’s environmental impacts were analysed with LCA method
in its manufacturing and operational phase. Hydrogen for operational phase was produced with three
different technologies: electrolysis, EU steam reforming, EU pipe line – steam cracking. In the case
of electrolysis for two geographical locations: Norway and Morocco. Study shows that the main
environmental impacts come from operational phase and that hydrogen production method is the key
for making HT-UPS system environmentally acceptable. Results show:
Operational phase has the major environmental impact and in the case of electrolysis in
Morocco that represents more than 90 % of all environmental load.
In manufacturing phase the biggest share of environmental impacts comes from
manufacturing of battery and fuel cell stack.
The production of hydrogen with electrolysis in Norway has the lowest environmental impact
of all four methods due to favourable energy mix that includes 95 % of hydro power.
Energy and mass balances were introduced for all phases for production of 30,000 kWh electricity
with HT-UPS. It was found out that in the case of electrolysis 139,125 kWh is needed for hydrogen
production with electrolysis that represents 94 % of all required energy input in manufacturing and
operational phase. Energy return on investment (EROI) introduced in the study shows that hydrogen
from natural gas and EU pipeline has higher values of EROI because there is less energy conversions
from primary fuel to useful energy (electricity), which are linked with additional energy inputs that
lower EROI.
Regarding the intensive R & D efforts in hydrogen technologies production and operation energy
efficiencies are expected to improve in the future. That will lower environmental impacts of HT-UPS
systems, but as presented in the study the major contributor will be hydrogen production method.
Therefore, awareness is needed in the case of hydrogen technologies implementation in existing
power production systems, so it could play a key role in lowering of overall environmental impacts
in the future.
Acknowledgments The work has been accomplished within EU funded project FluMaBack (abbreviation for Fluid
Management component improvement for Back up fuel cell systems). Grant agreement nº: 301782.
References [1] National Laboratory of the U.S. Department of Energy (2009) Fuel Cells for Backup Power
in Telecommunications Facilities, <https://www.hydrogen.energy.gov/pdfs/44520.pdf>,
[accessed September 2015]
[2] Piper. J. Backup Generators, UPS Systems Provide Power in an Outage
<http://www.facilitiesnet.com/powercommunication/article/Backup-Generators-UPS-
Systems-Provide-Power-in-an-Outage--11858?source=part> , [accessed December 2015]
[3] Texas Instruments, Characteristics of Rechargeable Batteries,
<http://www.ti.com/lit/an/snva533/snva533.pdf>, [accessed June 2015]
[4] Woodbank Communications Ltd, Lithium Battery Failures,
<http://www.mpoweruk.com/lithium_failures.htm#lifetime>, [accessed June 2015]
[5] M. Mori, B. Drobnič, M. Sekavčnik, B. Jurjevčič: LCA study of manufacturing and
operational phase of 3 kW FluMaBack UPS system. Faculty of Mechanical Engineering,
Ljubljana, 2015.
[6] International Energy Agency (IEA) (2011) World Energy Outlook 2011, Paris
[7] Dufour J, Serrano DP, Gálvez JL, Moreno J, Garcia C (2009) Life cycle assessment of
processes for hydrogen production. Environmental feasibility and reduction of greenhouse
gases emissions. Int J Hydrogen Energy, 39:1370-6
[8] Pehnt M (2001) Life-cycle assessment of fuel cell stacks. Int J Hydrog Energy, 10:91-101
[9] Staffel I, Ingram A (2010) Life cycle assessment of an alkaline fuel cell CHP system. Int J
Hydrog Energy, 35:2491-2505
[10] Smitkova M, Janı´cek F, Riccardi J (2011) Life cycle analysis of processes for hydrogen
production. Int J Hydrogen Energy, 36:7844-51
[11] Cetinkaya E, Dincer I, Naterer G (2012) Life cycle assessment of various hydrogen
production methods. Int J Hydrog Energy, 37:2071-2080
[12] Patyk A, Bachmann T A, Brisse A (2013) Life cycle assessment of H2 generation with high
temperature electrolysis, Int J Hydrog Energy, 38:3865 – 3880
[13] EPRIsolutions (2001) Uninterruptible Power Supply Using a PEM Fuel Cell - Design,
Construction and Test, Palo Alto, CA, USA
[14] White P, Driscoll D, Cowan S. Life-cycle impact assessment of a one kW fuel cell system
(2001), <http://www.orb-design.com/fuelcel.pdf>, [accessed June 2014]
[15] Wee J-H (2007) Applications of proton exchange membrane fuel cell systems. Renew
Sustain Energy Rev, 11:1720-1738
[16] Rooijen Jv. (2006) A Life Cycle Assessment of the PureCell Stationary Fuel Cell System:
Providing a Guide for Environmental Improvement. A report of the Center for Sustainable
Systems, Report No. CSS06-09, <http://css.snre.umich.edu/css_doc/CSS06-08.pdf>,
[accessed June 2014]
[17] Vielstich W, Lamm A, Gasteiger HA, editors (2003) Life-cycle analysis of fuel cell system
components, in Handbook of Fuel Cells – Fundamentals, Technology and Applications,
Volume 4, Chapter 13. Chichester: John Wiley & Sons
[18] Anderson D, Leach M (2004) Harvesting and Redistributing Renewable Energy: On the
Role of Gas and Electricity Grids to Overcome Intermittency Through the Generation and
Storage of Hydrogen. Energy Policy, 32:1603-1614
[19] Cicconardi SP, Jannelli E, Spazzafumo G (1997) Hydrogen Energy Storage: Hydrogen and
Oxygen Storage Subsystems. Int J Hydrog Energy, 22(9):897-902
[20] Sherif S, Barbir F, Veziroglu TN (2005) Wind Energy and the Hydrogen Economy - Review
of the Technology. Sol Energy, 78:647-660
[21] M. Mitja, J. Miha, M. Tilen, D. Boštjan: Life-cycle assessment of a hydrogen-based
uninterruptible power supply system using renewable energy. The international journal of
life cycle assessment, ISSN 0948-3349, Nov. 2014, vol. 19, iss. 11, pg. 1810-1822
[22] Hwang J-J et al (2013) Lifecycle performance assessment of fuel cell/battery electric
vehicles. Int J Hydrog Energy, 38:3433-3446

[23] Pereira SR, Coelho MC (2013) Life cycle analysis of hydrogen – A well-to-wheels analysis
for Portugal. Int J Hydrog Energy, 38:2029-2038
[24] International Organisation for Standardisation (2006a) ISO 14040 – Environmental
management – Life cycle assessment – Principle and framework
[25] International Organisation for Standardisation (2006b) ISO 14044 – Environmental
management – Life cycle assessment – Requirements and guidelines
[26] PE International (2012) Gabi Database, <http://www.gabi-software.com/support/gabi/gabi-
lci-documentation/data-sets-by-database-modules/professional-database/>, [accessed
January 2016]
[27] Ecoinvent: Ecoinvent 3.1 database (2014). Dostopno na:
http://www.ecoinvent.org/support/documents-and-files/documents-and-files.html#287,
ogled: 8.6.2015
[28] Heijungs, R (2013) Ten easy lessons for good communication of LCA, Int J Life Cycle
Assess, DOI: 10.1007/s11367-013-0662-5
[29] Guinée JB ed. (2002) Handbook on Life Cycle Assessment. Kluwer Academic Publishers,
Dordrecht
[30] Rostrup-Nielsen JR, Rostrup-Nielsen T (2002) Large-scale hydrogen production. Cattech,
6(4), 150-159
[31] Barnhart CJ, Dale M, Brandt AR, Benson SM (2013) The energetic implications of
curtailing versus storing, solar- and wind-generated electricity. Energy Environ Sci 6:2804–
281
[32] New York State Energy Research and Development Authority: Hydrogen Production -
Steam Methane Reforming (SMR).
https://web.archive.org/web/20060204211916/http://www.getenergysmart.org/Files/Hydrog
enEducation/6HydrogenProductionSteamMethaneReforming.pdf , [accessed 8.7.2015].