proceedings of the 37th australian conference economists papers ace 08
TRANSCRIPT

Proceedingsof the 37th Australian Conference of Economists
30th September to 4th October 2008
Gold Coast Queensland Australia
The Economic Society of Australia Inc.
Papers delivered at ACE 08
ISBN 978-0-9591806-4-0

The Economic Society of Australia warmly welcomes you to the Gold Coast, Queensland, Australia for the 37th Australian Conference of Economists. The Society was formed 83 years ago in 1925. At the time, the Society was opposed to declarations of policy and instead focused on open discussions and encouraging economic debate. Nothing has changed today, with the Society and the conference being at the forefront of encouraging debate.This year we have a large number of papers dealing with Infrastructure, Central Banking and Trade. Matters of the greatest global importance invariably boil down to be economic problems. Recent times have seen an explosion of infrastructure spending, after world-wide population growth has seen demand outpace aging supply. The world has become more globalised than at any time since World War I but the benefits of this (and the impact on our climate) has been questioned by some. At the time of preparing for this conference we could not have known that it would have been held during the largest credit crisis since the Great Depression. The general public and politicians both look to central banks for the answers. We are also very pleased to see a wide selection of papers ranging from applied economics to welfare economics. An A – Z of economics (well, almost).Another feature of this conference is that we have gone out of our way to bring together economists from all walks of life, in particular from academia, government and the private sector. We are grateful to all of our sponsors, who are as diverse as the speakers.
The Organising Committee James DickKhorshed Alam (Programme Chair)Michael Knox Greg Hall Allan Layton Rimu NelsonGudrun Meyer-Boehm Jay Bandaralage Paula Knight
Published November 2008 © Economic Society of Australia (Queensland) Inc GPO Box 1170 Brisbane Queensland Australia [email protected]
Welcome
Keynote Sponsors
Our Gold Sponsors
Special Session Sponsors
Unless we have specifically been requested to do otherwise, all the papers presented at the conference are published in the proceedings in full. A small number of papers will have versions that have also been made available for special editions of Journals, Economic Analysis and Policy, and the Economic Record. Authors will retain the right to seek additional publication for papers presented at the conference so long as it differs in some meaningful way from those published here. The opinions expressed in the papers included in the proceedings are those of the author(s) and no responsibility can be accepted by the Economic Society of Australia Inc, Economic Society of Australia (Queensland) Inc, the publisher for any damages resulting from usage or dissemination of this work.
The Paper following forms part of - Proceedings of the 37th Australian Conference of Economists ISBN 978-0-9591806-4-0
1
Internet Diffusion in Australia
Mei Wen
University of Sydney
First version: April 2006; This version: November 2007
Abstract: In this paper, state-quarterly panel data from the Internet Activity Survey
conducted by the Australian Statistic Bureau are used to investigate the
determinants of regional internet diffusion and the change in penetration rate.
Both logistic function and the Gompertz model of technology diffusion are
applied. It is found that Australian regional internet penetration rate and its
changes are positively affected by per capita gross state product, negatively
affected by the internet access costs, measure by consumer price index of audio-
visual and computing equipment and consumer price index of audio, visual,
computing and media services. Meanwhile the change in penetration rate in
regions with higher initial penetration rate is smaller, ceteris paribus. While
regional population size have a significantly positive effect on regional number of
internet service provides, it does not significantly affect regional internet diffusion
rate.
Key Words: logistic model, technology diffusion, internet access
JEL Classifications: O33, L86, O56, L80, L96
2
1 Introduction
Since the National Science Foundation (NSF) of United States opened up internet for
commercial uses in 1990-1991, internet usage has been increasingly developing.
From email systems for faster communication to online services including internet
banking, airline ticketing, hotel booking, to online consumption of music, games,
newspapers, magazines and other digital products, internet has become one of the
most important platforms in Australians’ daily lives. The number of worldwide
internet users grew rapidly from several thousands in the beginning of 1990s, to more
than 300 million in the end of the decade. By 2004, there were more than 700 million
global internet users. In 2005, Australian broadband subscribers per 100 inhabitants
reached 10.9 per cent with a total number of subscribers of 2,183 thousands, ranking
at 17th among the OECD countries.1
The fast global internet penetration is partly due to its commerce benefits such as cost
savings from e-commerce and partly due to other social factors. While many articles
documented significant reduction in transaction costs through e-commerce2, the
benefits become increasingly apparent to many internet users. The introduction of
ATM and online banking saves customers’ time substantially. When product sellers
provide websites with online catalogues, consumers are able to quickly search for
desired products, compare between close substitutes with information provided by
different sellers and even order products online when electronic sales services are
available. Indeed, with an internet connected computer, we are now able to purchase
all manner of products electronically, ranging from music, books, flowers, airline
tickets, and household electronics, to natural resources and machines. Meanwhile,
online communication makes friends in long distance more closely related. Online
auctions provides new platform of exchange. Emergence of many new types of
professional intermediations reduces firms’ and governments’ procurement costs,
which make B2B e-commerce grow much faster than B2C e-commerce. Meanwhile,
1 See IDC (2005) and ABSa. 2 See Borenstein and Saloner (2001), Lucking-Reiley and Spulber (2001), United Nations (2001, 2004), for example.

3
Australian productivity increase due to use of ICT technology and relevant
innovations are also well documented in OECD (2003) and Productivity Commission
(2004).
Commercially-related internet activities depend on the number of internet providers
and increasingly more internet adoption. According to Internet Activity Survey
conducted by Australian Bureau of Statistics (ABS, Sep. 2000 – Mar 2005), in March
quarter of 2005, there were 689 Internet Service Providers (ISPs), 2.42 million access
lines, and 5.98 million internet subscribers in Australia. Data downloaded reached
14,124 million MBs. While access to internet brings people numerous benefits, home
and office access requires the purchase of computers and linkage to the internet while
travelers and some domestic consumers may use internet in internet bars.
Using American semi-annual data from 1989 to 1997, Madden, Coble-Neal and
Savage (2004) investigates determinants of internet penetration. It finds that US
internet penetration is largely explained by internet costs (measured by index of real
computer and information processing costs), real per capita gross domestic product,
number of computers connected to the internet, and time trend. In their investigation
of cross-country diffusion of the internet, Kiiski and Pohjola (2002) also finds that the
observed growth in computer hosts per capita is best explained by countries’ per
capita GDP and internet access cost. As there is no similar study on the determinants
of Australian regional internet diffusion yet, this paper is to use ABS’s Survey data
on quarterly internet activities to explore the determinants of state and territory
internet penetration.
2 Development of Internet hosts
Since September 2000, ABS conducted 12 quarterly surveys on Australian internet
activities. Most of the surveys were conducted in March and September quarters
while there were also two surveys for the December quarter of 2000 and June quarter
of 2001. The data reports quarterly internet activities including number of ISPs,

4
number of access lines, number of subscribers and data downloaded by state and
territory. The survey data shows that while the number of internet subscribers has
been steadily increasing, the number of internet hosts (ISPs) decreased from 718 in
September 2000 to 689 in March 2005. This is closely related to the break of bubbles
in IT sector in 2000. A simple regression of the log of regional ISPs on estimated
regional population3 reveals that the log of regional ISPs is positively related to the
log value of regional population size as shown in table 1. As basic infrastructure for
internet connection, development of regional ISPs and increasing services provided
by each internet service provider is a prerequisite for rapid development of internet
activity. Although the total number of Australian internet hosts (ISPs) decreased from
718 in September 2000 to 689 in March 2005, regional number of ISPs is still
positively correlated to regional population size with a general increasing population
size. When considering changes of regional ISPs over time, it can be seen that the
regional number of internet service providers tends to decrease since the 3rd quarter
2003, fixing the effect of regional population size as shown in the regression in
Regression 1.
Regression 1 Determinants of Regional ISPs
Dependent Variable: Log Value of Number of Internet Service Providers
Explanatory Variables Coefficient Std. Error t-Statistic Prob.
Constant -5.891919 0.301423 -19.54698 0.0000
Dummy for 2nd quarter of 2005, 1st and 3rd quarter of 2004, and 3rd quarter of 2003
-0.148982 0.055615 -2.678825 0.0087
Log(N) 0.728865 0.021251 34.29824 0.0000
Number of Observations 96 R-squared 0.927044 Adjusted R-squared 0.925475 Log likelihood -4.208394 F-statistic 590.8687 Durbin-Watson statistic 1.641510
3 The population data is drawn from ABSb.
5
3 Regional Internet Penetration Rate
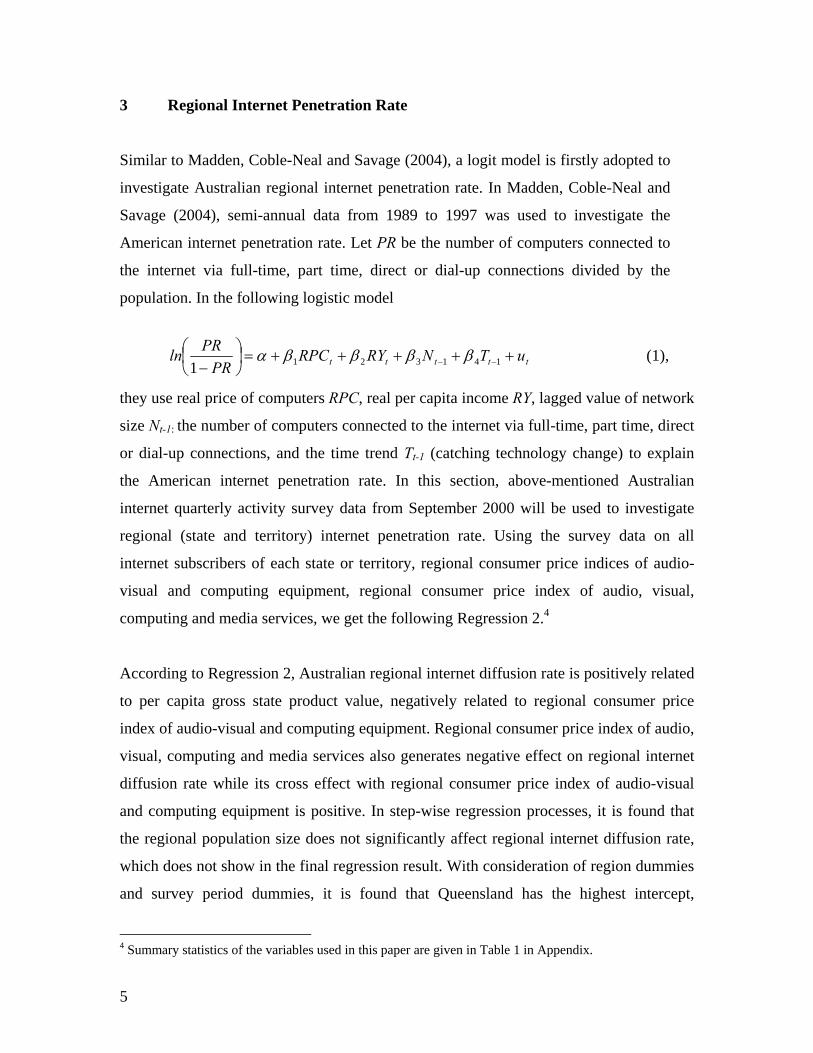
Similar to Madden, Coble-Neal and Savage (2004), a logit model is firstly adopted to
investigate Australian regional internet penetration rate. In Madden, Coble-Neal and
Savage (2004), semi-annual data from 1989 to 1997 was used to investigate the
American internet penetration rate. Let PR be the number of computers connected to
the internet via full-time, part time, direct or dial-up connections divided by the
population. In the following logistic model
ttttt uTNRYRPCPR
PRln +++++=⎟⎠⎞
⎜⎝⎛− −− 1413211
ββββα (1),
they use real price of computers RPC, real per capita income RY, lagged value of network
size Nt-1: the number of computers connected to the internet via full-time, part time, direct
or dial-up connections, and the time trend Tt-1 (catching technology change) to explain
the American internet penetration rate. In this section, above-mentioned Australian
internet quarterly activity survey data from September 2000 will be used to investigate
regional (state and territory) internet penetration rate. Using the survey data on all
internet subscribers of each state or territory, regional consumer price indices of audio-
visual and computing equipment, regional consumer price index of audio, visual,
computing and media services, we get the following Regression 2.4
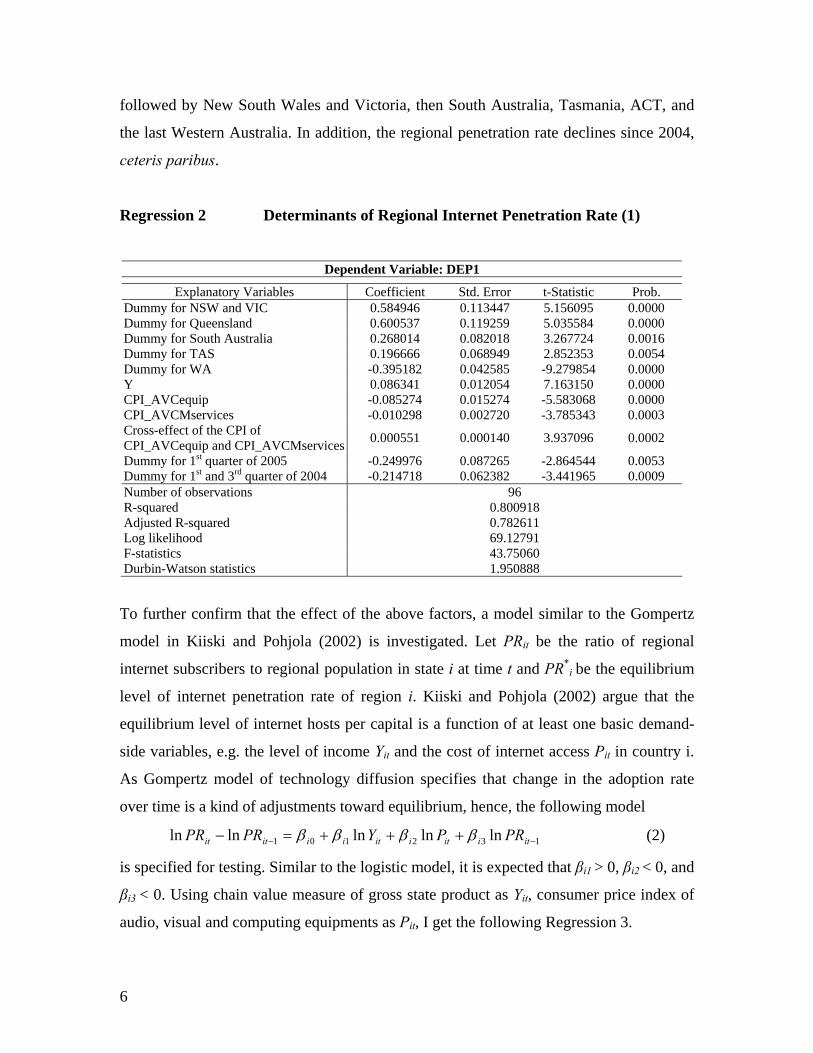
According to Regression 2, Australian regional internet diffusion rate is positively related
to per capita gross state product value, negatively related to regional consumer price
index of audio-visual and computing equipment. Regional consumer price index of audio,
visual, computing and media services also generates negative effect on regional internet
diffusion rate while its cross effect with regional consumer price index of audio-visual
and computing equipment is positive. In step-wise regression processes, it is found that
the regional population size does not significantly affect regional internet diffusion rate,
which does not show in the final regression result. With consideration of region dummies
and survey period dummies, it is found that Queensland has the highest intercept,
4 Summary statistics of the variables used in this paper are given in Table 1 in Appendix.
6
followed by New South Wales and Victoria, then South Australia, Tasmania, ACT, and
the last Western Australia. In addition, the regional penetration rate declines since 2004,
ceteris paribus.
Regression 2 Determinants of Regional Internet Penetration Rate (1)
Dependent Variable: DEP1
Explanatory Variables Coefficient Std. Error t-Statistic Prob. Dummy for NSW and VIC 0.584946 0.113447 5.156095 0.0000 Dummy for Queensland 0.600537 0.119259 5.035584 0.0000 Dummy for South Australia 0.268014 0.082018 3.267724 0.0016 Dummy for TAS 0.196666 0.068949 2.852353 0.0054 Dummy for WA -0.395182 0.042585 -9.279854 0.0000 Y 0.086341 0.012054 7.163150 0.0000 CPI_AVCequip -0.085274 0.015274 -5.583068 0.0000 CPI_AVCMservices -0.010298 0.002720 -3.785343 0.0003 Cross-effect of the CPI of CPI_AVCequip and CPI_AVCMservices 0.000551 0.000140 3.937096 0.0002
Dummy for 1st quarter of 2005 -0.249976 0.087265 -2.864544 0.0053 Dummy for 1st and 3rd quarter of 2004 -0.214718 0.062382 -3.441965 0.0009 Number of observations 96 R-squared 0.800918 Adjusted R-squared 0.782611 Log likelihood 69.12791 F-statistics 43.75060 Durbin-Watson statistics 1.950888
To further confirm that the effect of the above factors, a model similar to the Gompertz
model in Kiiski and Pohjola (2002) is investigated. Let PRit be the ratio of regional
internet subscribers to regional population in state i at time t and PR*i be the equilibrium
level of internet penetration rate of region i. Kiiski and Pohjola (2002) argue that the
equilibrium level of internet hosts per capital is a function of at least one basic demand-
side variables, e.g. the level of income Yit and the cost of internet access Pit in country i.
As Gompertz model of technology diffusion specifies that change in the adoption rate
over time is a kind of adjustments toward equilibrium, hence, the following model
132101 lnlnlnlnln −− +++=− itiitiitiiitit PRPYPRPR ββββ (2)
is specified for testing. Similar to the logistic model, it is expected that βi1 > 0, βi2 < 0, and
βi3 < 0. Using chain value measure of gross state product as Yit, consumer price index of
audio, visual and computing equipments as Pit, I get the following Regression 3.

7
Regression 3 Determinants of Internet Penetration Rate (2)
Dependent Variable: Log(PR) -Log(PR_1)
Explanatory Variable Coefficient Std. Error t-Statistic Prob. log value of PR-1 for consecutive quarterly observations -0.458818 0.073637 -6.230779 0.0000
log value of PR-1 for observations quarterly observations with half a year survey interim
-0.400733 0.048665 -8.234588 0.0000
log value of Y-1 for consecutive quarterly observations 0.026720 0.035339 0.756104 0.4520
log value of Y-1 for observations quarterly observations with half a year survey interim
0.108515 0.026586 4.081639 0.0001
CPI_AVCequip for consecutive quarterly observations -0.198929 0.041338 -4.812265 0.0000
CPI_AVCequip for observations with half a year survey interim -0.226122 0.031283 -7.228353 0.0000
Dummy for 3rd quarter of 2004 0.051894 0.017909 2.897573 0.0050 Dummy for 3rd quarter of 2003 0.035571 0.018290 1.944842 0.0556 Dummy for 1st quarter of 2003 0.101217 0.018429 5.492115 0.0000 Dummy for 3rd quarter of 2002 0.048282 0.018657 2.587804 0.0116 Dummy for NSW 0.040507 0.016117 2.513380 0.0142 Dummy for VIC 0.064395 0.016804 3.832079 0.0003 Dummy for QLD 0.035167 0.016361 2.149450 0.0349 Dummy for NT in 1st and 3rd quarter of 2004, 1st and 3rd quarter of 2003, and 3rd quarter of 2002
-0.234225 0.026791 -8.742525 0.0000
Dummy for ACT in 3rd quarter of 2004, 1st quarter of 2003, and 3rd quarter of 2002 0.199278 0.030621 6.507966 0.0000
Number of observations 88 R-squared 0.766381 Adjusted R-squared 0.721578 Log likelihood 159.1745 F-Statistics 19.83798 D-W Statistics 2.020678 In Regression 3, it can be seen that change in the log-value of penetration rates is
negatively related the lag value of last period penetration rate. The effect is significant at
0.01 level no matter the survey interim is three months or six months. Meanwhile, the log
value of one period lagged regional per capita gross state product generates positive
effect on the dependent variable, this effect is highly significant for consecutive quarterly
observation, but insignificant for observations with half a year survey interim.
Meanwhile, consumer price index of audio, visual, and computing equipment
significantly and negatively affect the change in the log-value of penetration rates. The
8
magnitudes of the effect are different for consecutive quarterly observation and
observations with half a year interim. Observations with a half a year interim show a
stronger negative effect. In addition, there are shifts in constant during survey periods and
over states shown by the effect of survey period dummies, state dummies and some cross
effects. Compared with Regression 2, the structural changes show that Victoria has the
highest constant in changes of the internet penetration rate, follow by New South Wales,
and then Queensland.
4 Concluding Remarks
The above empirical studies show that Australian regional internet penetration rate
and its changes are positively affected by per capita gross state product, negatively
affected by the internet access costs, measure by consumer price index of audio-
visual and computing equipment and consumer price index of audio, visual,
computing and media services. Meanwhile the change in penetration rate in regions
with higher initial penetration rate is smaller, ceteris paribus. While regional
population size have a significantly positive effect on regional number of internet
service provides, it does not significantly affect regional internet diffusion rate.

9
References
Australian Bureau of Statistics (ABSa) (Sep. 2000 – Mar 2005), Internet Activity
(Australia), Canberra: Australia Bureau of Statistics.
_______ (ABSb), Population: Australian States and Territories, www.abs.gov.au.
Borenstein, S., Saloner, G., (2001), “Economics and electronic commerce”, Journal of
Economic Perspective, 15, 3-12.
International Data Corporation (IDC) (2005), 40 Years of IT - Looking Back, Looking
Ahead, an IDC special edition of executive white paper, www.idc.com.
Kiiski, a. and M. Pohjola (2002), “Cross-country diffusion of Internet,” Information
Economics and Policy, 14, 297-310.
Lucking-Reiley, D., Spulber, D. F., 2001. Business-to-business electronic commerce.
Journal of Economic Perspective 15, 55-68.
Madden, G. Coble-Neal, G. and S. J. Savage (2004), “United States Internet Penetration,”
Applied Economic Letters, 11, 529-532.
OCED (2003), ICT and Economic Growth: Evidence from OECD countries, Industries
and Firms, OECD, Paris
Productivity Commission (2004), ICT Use and Productivity: A Synthesis from Studies of
Australian Firms, Canberra: Productivity Commission Research Paper.
United Nations (2001, 2004), E-commerce and Development Report 2001 (2004), United
Nations Conference on Trade and Development, www.unctas.org/ecommerce.

10
Appendix
Table 1 Summary Statistics
Variable Definition Sample Size
Mean Standard Deviation
LnISPs Log value of Internet service providers
96 4.344605 0.940901
s Log value of the number of internet subscribers (’000)
96 -1.487572 0.198755
s-1 Log value of the one-period
lagged number of subscribers (‘000)
88 -1.507291 0.187721
N Regional Population from ABS2
96 2461168 2238943
PR Ratio of the regional number
of internet subscribers including dial-up and non
dial-up to regional population
96 0.230573 0.049406
l Log(PR/(1-PR)) 96 -1.1223275 0.265334
CPI_AVCequip Consumer price index of
audio-visual and computing equipment
96 48.02917 9.160498
CPI_AVCMservices Consumer price index of
audio-visual, computing and media services
96 106.4771 6.233449
cpi_avcequip Log value of CPI_AVCequip 96 3.850962 0.213219
cpi_avcmservices Log value of CPI_AVCMservices
96 4.666227 0.058731
Y Per Capita Gross state
product , chain value measure (dollars)
96 11201 3105