proceedings of the twenty-ninth pump symposium october 1-3
TRANSCRIPT
Copyright 2013 by Turbomachinery Laboratory, Texas A&M Engineering Experiment Station
Proceedings of the Twenty-Ninth Pump Symposium October 1-3, 2013, Houston, Texas
Effect of Component Interference Fit and Fluid Density on the
Lateral and Torsional Natural Frequencies of Pump and Turbomachinery Rotor Systems
William D. Marscher President & Technical Director
Mechanical Solutions, Inc. Whippany NJ 07981
Juan D. Gamarra Project Engineer
Mechanical Solutions, Inc. Whippany NJ 07981
Mr. Marscher performs vibration analysis and testing on pumps, fans, compressors, and turbines throughout the world. Previously, he worked for Honeywell Bendix, Pratt&Whitney, Worthington Dresser, and Concepts NREC. He obtained his BSME and MSME degrees from Cornell University and
a Masters in Engineering Mechanics from RPI. He is a member of the TAMU Pump Advisory Committee, and is past President of the Society of Tribologists & Lube Engineers and of the Machinery Failure Prevention Tech Society of the Vibration Institute. He is member of the ISO TC108/S2 standards committee for machinery vibration, and is Vice Chair of the Vibration Committee of the Hydraulic Institute.
Mr. Gamarra is a user of solid modeling, FEA, and CFD software. His FEA capabilities include modal analysis of rotor natural frequencies. Juan performs specialized field testing to resolve difficult and costly problems such as blade failures of compressors in an air separation plant in Mexico, screw pump seal
failures on an oil platform in the Gulf of Mexico, vertical pump coupling failures at a mining facility in Madagascar, and power plant pump or turbine failures (fossil & nuclear). Mr. Gamarra’s testing capabilities include impact modal, operating deflection shape (ODS), cavitation severity, and in-field flow measurement. Juan has a BE and MS in Mechanical Engineering from Stevens Institute where he graduated with honors. He is fluent in English and Spanish.
Paul A. Boyadjis Structural Analysis Director Mechanical Solutions, Inc.
Whippany NJ 07981
Joseph O. Gruener Project Engineer
Mechanical Solutions, Inc. Whippany NJ 07981
Mr. Boyadjis has 25 years of experience in the analysis and design of rotating equipment. His specialty is 3-D solids modeling of pump and compressor casings for stress and vibration analysis using finite element techniques. He has worked as a lead analytical engineer for Ingersoll-Rand, Ingersoll-
Dresser Pump, and Flowserve Corporation. At MSI, Mr. Boyadjis conducts 3-D FEA of casings and impellers, and performs unique modeling of vertical pumps. He continuously pursues the goal of developing the best vibration and stress prediction capabilities possible. Paul holds BS and MS degrees in Mechanical Engineering from Lehigh University, where he graduated summa cum laude.
Mr. Gruener received his BS in Mechanical Engineering from the New Jersey Institute of Technology. Prior experience included Howmet Castings, where he was involved in the investment casting of turbine components. Joe’s work at MSI has included solid modeling, FEA analysis, and machinery on-site field
testing. Joe’s efforts have been conducted on a range of pumps including horizontal barrel and split case pumps, and vertical turbine pumps, as well as wastewater pumps, for both OEM’s and End Users. His testing efforts have been international, from Canada to the Middle East. In addition to efforts for the commercial pump industry, Joe has been active on various projects for the US Department of Defense.
ABSTRACT In the determination of rotor lateral and torsional natural frequencies of rotating machinery, the mathematical methods are considered mature, and are accurate within the bounds of the properties and assumptions input into them. However, precise calculation of rotordynamic behavior remains challenged by issues such as the effects of stiff components
attached to the shaft, and the effects of dense gases or liquids within and surrounding the rotor system. The authors have performed a careful series of bench tests and installed rotor tests to determine the effect on lateral and torsional natural frequencies of interference fit stiffening and fluid added mass (lateral and torsional), for various bladed disk and centrifugal impeller design styles.

Copyright 2013 by Turbomachinery Laboratory, Texas A&M Engineering Experiment Station
For the fit tests, the component outer-diameter-to-shaft-diameter ratio, length-to-diameter ratio at the fit surface, and degree of interference fit were run for a matrix of cases for components manufactured using common industrial machining practices. Lateral and torsional natural frequency test results were compared to theoretically exact closed-form analysis calculations, and then to high-resolution finite element analysis solutions. Test data was self-consistent, and experimental behavior was able to be modeled with appropriate analytical techniques. A surprise for the interference fits was that, for both lateral and torsional natural frequencies, even the lightest degree of interference (FN-1 light drive fit) resulted in the built-up rotor behaving as if its components were integral regardless of component length, diameter, or class of fit. However, when load was applied statically, rather than at a frequency in the range of the natural frequency (e.g. 20 Hz or more), then slip occurred at the ends of the shrink fit, particularly in the case of lateral vibration. As part of the shaft fit research, the concept of “penetration factor” of a built-up shaft (as recommended by API-684) was evaluated with respect to how well it simulated actual behavior. In the finite element analyses and beam theory manual analysis performed, the predicted torsional natural frequencies agreed much better with test results, when the penetration factor concept was not applied. In the case of lateral analysis, however, penetration factor was required when performing a manual or beam-element-based computer analysis. On the other hand, the shear distortion associated with penetration factor was automatically a part of the solid element FEA results, and no additional compensation was required for penetration in those cases. Similar to interference fit, some added mass results were obtained that were contrary to common analysis assumptions. While the lateral added mass agreed reasonably well with the need to include not only internal volume but also swept volume as recommended by Blevins, the fluid inertia effects of torsional vibration typically were very low, involving only a small fraction of the fluid within the impeller passages. Flow visualization indicated the fluid moved axially in and out of the impeller, and did not take on significant angular momentum. The torsional natural frequency was nearly the same whether or not high density fluid was in and around the rotor. However, this result depended upon blade angle being in a range practical for pumping fluid. For example, for a “paddle wheel” rotor design with blade angle parallel to the shaft axis, nearly all the fluid trapped between the blading needed to be accounted as torsional added mass. The authors anticipate these results will be useful for increasing the accuracy of analysis of practical rotor systems. Stationary room temperature test behavior can be extrapolated with further analysis to actual operating conditions, for example by including dimensional changes due to centripetal forces as well as transient and steady thermal growth.
INTRODUCTION The calculation of turbomachinery rotordynamic behavior is essentially dependent upon determining the effective modal stiffness of an often complex rotor system, and dividing this by the effective modal inertia. The square root of this ratio times a units constant is the mode’s natural frequency. Any error in determining the stiffness or inertia results in an error in the resulting natural frequency estimation. Such errors can lead to unexpected resonances, either with running speed excitations such as residual imbalance, or other potentially strong excitations such as the 2x running speed harmonic or impeller vane passing frequency. In pump and other turbomachinery rotor systems, the present typical rotordynamic analysis approach for rotor components (such as impellers or sleeves) which are interference fit onto the shaft is to include the component inertia, but to take no credit for any stiffening effect from the area moment of inertia of the component cross-section. This rule is usually applied even for cases of heavy interference fit, in spite of warnings from the API 684 Recommended Practice (API, 1994) that the behavior of the rotor in such situations is uncertain, and should be confirmed by test. Corbo (1996) recommends assuming slip over 1/3 of the fit length, regardless of degree of interference fit. However, Smalley (2002) analytically predicted that the full length should be accounted, even for light interference. In the denominator of the natural frequency formula, the inertia also is at risk of incorrect estimation, due to the presence of fluid in and around the rotor, in cases (such as a pump or a high pressure compressor) where the fluid has high density. In such cases, the standard technique presently is to account the fluid mass within the impeller passages as if it were integral with the rotor, in terms of torsional inertia as well as lateral inertia. It has long been known that components vibrating in liquid should have their dynamic properties calculated in a manner that includes added mass effects based on the density and motion of displaced fluid (Patton, 1965). Relative to fluid “added mass” associated with impellers, authoritative work has been performed by Childs (e.g., 1982, 1993) and others for the influence (as the inertia portion of “Lomakin Effect”) within annular seals such as wear rings and labyrinth seals. In terms of non-sealing areas, there is agreement that for lateral rotordynamics the fluid within the rotor flowpath must be included (Thus 1981, Nordmann 1997), but most analysts do not include the fluid mass in the “swept volume” displaced when the rotor moves through the fluid external to it, shown by Blevins (1995) to be required for reasonable analysis based on test correlations. The present authors have noticed when performing field confirmation tests versus analytical predictions that accounting the fluid mass only within impeller passages often leads to insufficient added mass effect in lateral rotordynamic analysis, as predicted by Blevins. Conversely, including the full amount of impeller passage fluid mass for torsional natural frequencies has been observed to result in excessive added inertia, in agreement at least qualitatively with Thus and Nordmann.
Copyright 2013 by Turbomachinery Laboratory, Texas A&M Engineering Experiment Station
Concerning effective fluid inertia or “added mass” in rotordynamic calculations, it is unfortunate that some analysts have included not only the fluid trapped within the impeller for torsional inertia, but also a portion of the fluid downstream of the rotor, in the stationary flowpath, with the logic being that this fluid must move upstream and downstream as the rotor torsionally oscillates (Lees, 1978, and Liu, 1984). With regard to practical published test results relevant to either added mass or interference fit stiffness effects, in the authors experience it is rare to find documentation with sufficient accompanying specifics to make the information useable by designers or field troubleshooters. The authors have performed the tests and analyses presented in this paper in order to make a new contribution concerning the effects on rotor natural frequency of interference fit and effective fluid added mass. METHODS OF DETERMINATION OF STIFFNESS OF ROTORS WITH INTERFERENCE FIT COMPONENTS Several references have recently discussed the effect of component interference fit on rotor dynamic behavior, including the analyses of Smalley (2002). Moore (2009) and Gao (2013) performed careful experimentation applicable to specific rotor configurations. However, the recommendations of API 684 remain the reigning methodology applied in regard to fit-up dynamic effects, in the authors’ experience. API 684 Recommended Practices The current API 684 specification concerning rotordynamic analysis procedures states that sleeves should generally be assumed not to contribute to the lateral stiffness of the shaft. API 684 suggests that the vendor may perform machinery-specific testing to determine the effect of any interference fit for particular cases, and that such results can be assumed only to apply only to units of similar type. API 684 further states that built-up rotor natural frequencies may be determined through impact testing of a vertically suspended rotor modal. However, the measurements are expected to over-emphasize stiffening effects because tight fits may be relieved due to centrifugal loading under normal operating conditions. This conclusion is probably less of an issue for industrial pumps, with the order of magnitude lower impeller tip speeds they operate at (e.g., versus compressors or turbines) in order to avoid cavitation problems. The API 684 recommendation with regard to interference fit contribution to torsional stiffness is ambiguous. It states that the sleeve may or may not contribute to the torsional stiffness of the shaft, depending on amount of the interference, the length over which the interference is imposed, and the size of the pressed or shrunk-on component. If the sleeve is not relieved over a significant length, and manufactured with a shrink fit equal to or greater than l mil/inch (1 micron/mm) of shaft diameter (“heavy interference”), then the effective stiffness diameter of the shaft would be assumed equal to the combined diameter of the shaft plus the sleeve. However, API
684 states that if the interference fit component has a fit length with L/D greater than or equal to one, the shaft is assumed to be unrestrained by the hub over a penetration at each open end of an axial length of one-third of the total length of the interference. Under certain circumstances a more complex diameter change “penetration effect” may be expected. Interference Fit Analysis Methodology A goal of the present study was to span a broad range of practical components and applications. Test specimens were carefully fabricated, and geometrically accurate numerical models were created of the component specimens considered, so that high fidelity analysis versus test comparisons could be performed. Eight different shafts, in combination with varying sleeve diameters, lengths, and interference fits, were designed and analyzed to obtain correlations in terms of component dimensions and degree of the interference fit, relative to lateral and torsional static deflection under known load, as well as with regard to effects on rotor natural frequencies. The steel shaft diameter throughout the study was 1.5 inches (38.1 mm). The degree of interference fit was monitored with micrometers during assembly, and determined to be within +/-0.0002 inch (5 ). The degree of radial expansion of the sleeves after assembly was determined only by FEA prediction, and was not monitored, since its effect on the results was predicted to be less than 0.4% in the worst case. Two different types of numerical models were created. Both used the finite element analysis (FEA) method, but one used classical H-elements (the ANSYS 14.5 computer program), in which fixed-order parabolic (i.e. second order) shape functions were applied with a relatively fine mesh of elements. The other applied an apparent coarse mesh of P-type elements (high order polynomial elements, used by the Mechanica 5 computer program) which automatically select the order of a polynomial for each element’s shape function, in this case with up to third order shape functions (given the simple geometry, rectilinear at diameter changes), in order to maintain good stiffness resolution and calculation accuracy in zones of high strain gradients, such as locations of diameter change along the shaft axis. Note that it is the authors’ organizations practice to keep residual error as predicted for the P-element iterations to <1%. By applying these two types of FEA model, and comparing the results to a closed-form analytical model as well as actual experimental behavior, the intent was to determine whether either or both approaches indicated the need for application of “penetration factor” at shaft diameter step changes, as recommended in API-684. Examples of both shaft models are provided for each approach in Figures 1 and 2. The finite element meshes of the Mechanica modeled components consisted entirely of solid 3D P-type elements, able to capture the details of all the curved surfaces, as well as apply higher order polynomial expressions in areas of rapid geometrical change or strain gradient. In principle, the P-element meshes are able to be much coarser than the H-element meshes typical of classical FEA programs like ANSYS, but

Copyright 2013 by Turbomachinery Laboratory, Texas A&M Engineering Experiment Station
with the accuracy of the result theoretically maintained because of the use of their higher order polynomial shape functions.
Figure 1. ANSYS H-element mesh of rotor 1
(7653 elements)
Figure 2. ProE/Mechanica P-element mesh of rotor 1
(312 elements) Interference Fit Experimental Methodology The shafts and sleeve assemblies that were produced as FEA models were then constructed as actual hardware. The material used for the shafts was case hardened (minimum hardness depth of 0.08”, Rockwell C60) precision low carbon steel shafting of 1-1/2 inch (38.4 mm) outer diameter and a length of 18 inches (457 mm). The shafts were used as-received from a single quality supplier, and were not cleaned with solvents. Case hardened material was used to minimize interface wear during testing, without including high residual stresses which might relieve themselves during testing, causing constantly changing inelastic deformation. This approach was considered representative of industrial practice. The sleeves were fabricated from AISI 1215 low carbon steel rod, annealed. The sleeves were cut to length and precision bored to fit on the shafts, with corners broken, but no edge radii of significance machined. Four of the eight sleeves were fit to 0.001inch (25.4 micron) diametral interference while the other four sleeves were constructed with a 6 mil (152 m) diametral interference. An experimental rig was designed to load and measure the deflection response of the test shaft assemblies, relative to both lateral bending as well as torsion. Proximity probes were mounted in a manner to determine lateral deflection and twist deflection. The apparatus was CAD modeled, and analyzed with 3-D finite element analysis to assure the structure would support the applied weight with adequately stiff behavior. Once the rig effectiveness was analytically confirmed, the test fixtures were fabricated from steel beams and bars, using weldments and bolted joints to secure the test fixture components together.
Table 1 shows the dimensions of the tested sleeves. The reason for having the outer diameters 5 mils (i.e. 0.005 inch or 127 microns) diametral less for the heavy interference fit specimens was to maintain the same post-press outside diameter for the sleeves following all interference fits. In order to implement the interference fits, the sleeves were heated using an oven, and then slip-assembled onto the shafts. Figure 3 pictorially presents the final assembled models.
Table 1. Machined Sleeve Specifications Sleeve Specifications
Shaft OD
L (in)
ID (in)
OD (in)
INT (in)
rotor 1 1.5 1.5 1.499 2.499 0.001 rotor 2 1.5 1.5 1.499 4.499 0.001 rotor 3 1.5 4.5 1.499 2.499 0.001 rotor 4 1.5 4.5 1.499 4.499 0.001 rotor 5 1.5 1.5 1.494 2.494 0.006 rotor 6 1.5 1.5 1.494 4.494 0.006 rotor 7 1.5 4.5 1.494 2.494 0.006 rotor 8 1.5 4.5 1.494 4.494 0.006
Figure 3. Depiction of rotors tested The displacement probes used in the experiment were Bentley Nevada 3300 XL 8mm proximity probes. The probes were calibrated against the shaft material prior to the testing, using shims of specific thicknesses, which allowed gap between the probe head and target material to be correlated to the voltage output produced (the resulting calibration was found to vary little, between 201.8 and 203.9 V/inch, about 7.97 V/mm). For both the bending and torsional flexural testing, loads were applied to the rig with incremented weights. The weights used in the test were off-the-shelf weightlifting twenty-five pound weights. To allow precise documentation of load, the weights were measured with a digital scale to the third decimal place. The fixture was bolted to a stiff table in order to provide stiffness between the load and reaction points of the rig, as well as needed height for the weight/pulley loading. A CAD model of the resulting fixture is shown in Fig. 4a, and the actual constructed fixture is shown in Fig. 4b. The upper two horizontal bars in the actual rig were for probe support only, and in site of any illusion from the perspective angle of the picture did not provide cross-support for the load bar or shaft bearing support frame.
1&5 3&7
2&6 4&8

Copyright 2013 by Turbomachinery Laboratory, Texas A&M Engineering Experiment Station
Load Applied Figure 4a. Lateral bending test setup in ProE
Figure 4b. Test fixture setup for lateral bending.
Torsional Flexure Test of Interference Fit Components The torsional deflection fixture applied torque to the test specimen through a horizontal bar affixed perpendicular to one end of the shaft. One extreme end of the bar was loaded by weights placed on a tray hanging from the bar by a cable, while the other end of the bar was loaded in an upwards direction by looping its cable through a pulley system. This resulted in opposing bi-lateral loading, which applied the load as a pure moment and discouraged bending from occurring while torque was applied. Proximity probes were used to measure the deflections of radial bars mounted perpendicular to the shaft, at the same end as the torsional load was applied to. Tight-fitting keys were used to prevent shaft slippage at either the loaded end of the shaft where it attached to the loading disk, or at the reacting end on the other side. Figure 5a-c shows the test layout for the torsional flexure experiment.
Load Applied
Load Applied
Pulley Location
Prox Probe MeasurementLocations
Figure 5a. Model of torsional flexure test setup
Figure 5b. Torsional flexure test fixture hardware.
Figure 5c. Fixed end showing interference key installed to
prevent rotation slippage under torque load. The torsional flexure test included two beams perpendicular to the shaft, mounted at the front of the shaft. The front beam was used to load the shaft torsionally, and the parallel beam closely behind it was used to provide pick-off points for proximity probe measurements to document angular displacement. The shafts were loaded with 25 pounds at a time on each side which would equate to 750 foot-pounds of torque during each load step. The fixture was gradually loaded up to 250 pounds. Measurements from six proximity probes distributed along the axis of the measurement bars were taken as 25 pounds was added to each side bilaterally until 125 lbm was loaded on each side. The proximity probes were connected through proximitor boxes to calibrated voltmeters, which provided mV readings representing linear deflections which, based on distance from the shaft rotational centerline, could be translated into angular deflections using the calibration factors earlier determined. Any inconsistencies in the angular deflections reported probe-to-probe were investigated and resolved before test results were recorded. These discrepancies generally involved a small degree of lateral bending that was imposed in spite of the bilateral loading system, apparently due to asymmetries such as a small degree of pulley friction. The multiple proximity probes allowed precise angle of twist measurements in spite of such issues. Torsional natural frequency testing was conducted on the same shaft, but disassembled from the rig and laying on bubble wrap to avoid contamination of results by table stiffness or frequency response. Excitation was performed using a PCB Piezotronics 086C05 one pound impact hammer, and response was detected using a PCB Piezotronics 352C22 tear drop (3 gram weight)
Copyright 2013 by Turbomachinery Laboratory, Texas A&M Engineering Experiment Station
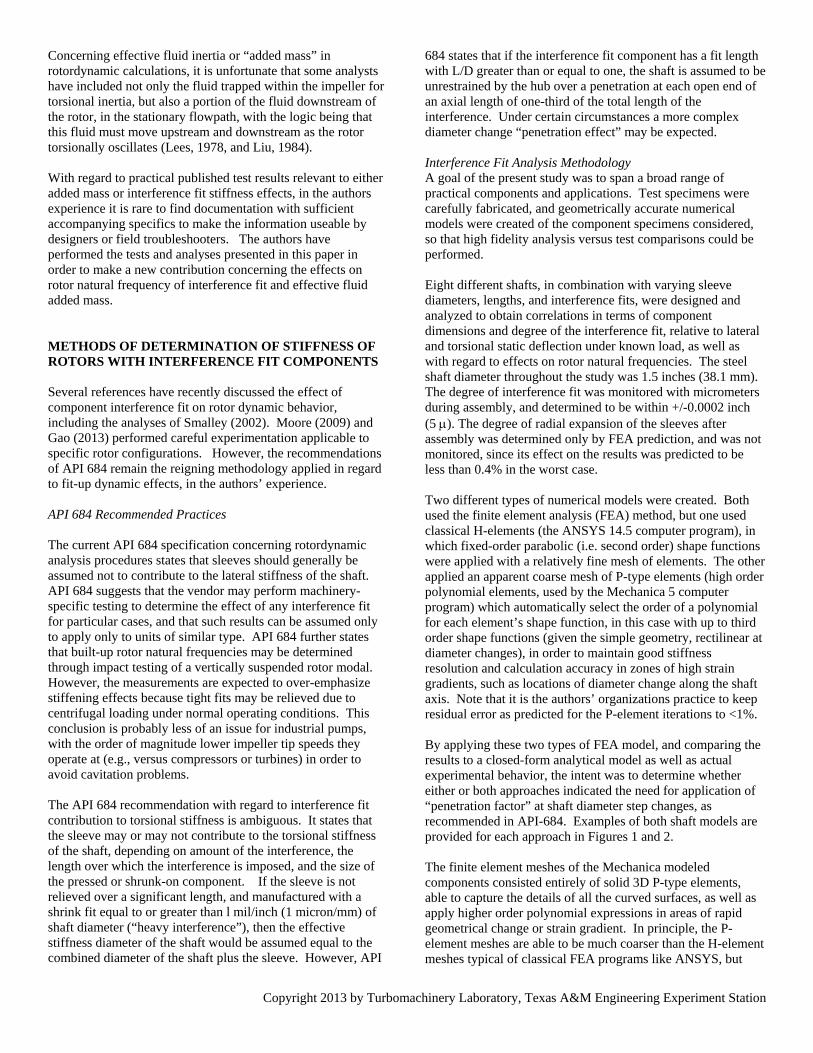
accelerometer. The shaft was struck at one end, on the edge of the keyway, tangential to the shaft surface. The accelerometer was glued to the shaft, such that it detected motion parallel to the shaft surface, and perpendicular to the direction of impact on the keyway. Each shaft was impacted 10 times and the results were frequency-averaged using an ACE Dynamic Signal Analyzer, typical results of which are shown in Fig. 6. Lateral Bending Test of Interference Fit Components The lateral deflection fixture included a v-block shim-mounted on the base to support the shaft during the test, with a “knife edge” type boundary condition. Figure 4a-b shows the test layout for the lateral bending experiment. In Figure 4b, it can be seen that the v-blocks were shimmed to a slight angle. This was done to ensure support at a precisely known location, i.e. along the inside edge of each v-block. Any compliance in the shim zone was accounted for by determining bending deflection of the shaft between the point of shimming and a control point close to the load application, such that only differential deflection within the shaft was accounted. That being said, the shaft was supported at each side in a nominally bilateral, symmetrical fashion (note the bilateral deflection was checked by two separate sets of proximity probes). A cantilever beam loaded the shaft at the symmetrical centerline of the interference fit. The weight was gradually applied as 150, 250, and 300 pounds respectively on the cantilever beam. Four proximity probes were located symmetrically relative to each end of the shaft. Readings were taken each time the weight was incremented. Each shaft was tested with loads gradually applied and then gradually removed, for three complete cycles, in order to ensure accuracy, and to compensate for any hysteresis effects in the rig. The proximity probes were connected to voltmeters which would read the voltage output by the probes. This reading was then translated into lateral deflection based on the calibration factors previously determined.
Torsional
Lateral
Figure 6. Frequency response plots obtained for shaft 1, the combination of which were used to distinguish torsional and lateral natural frequencies for interference fit shaft components. Torsional plot was obtained by hitting shaft tangentially and perpendicular to a tangentially-mounted accelerometer, and resulted in two additional peaks, as shown in the upper plot. The lateral plot was obtained by hitting shaft parallel to accelerometer, in a direction passing through the shaft centerline.
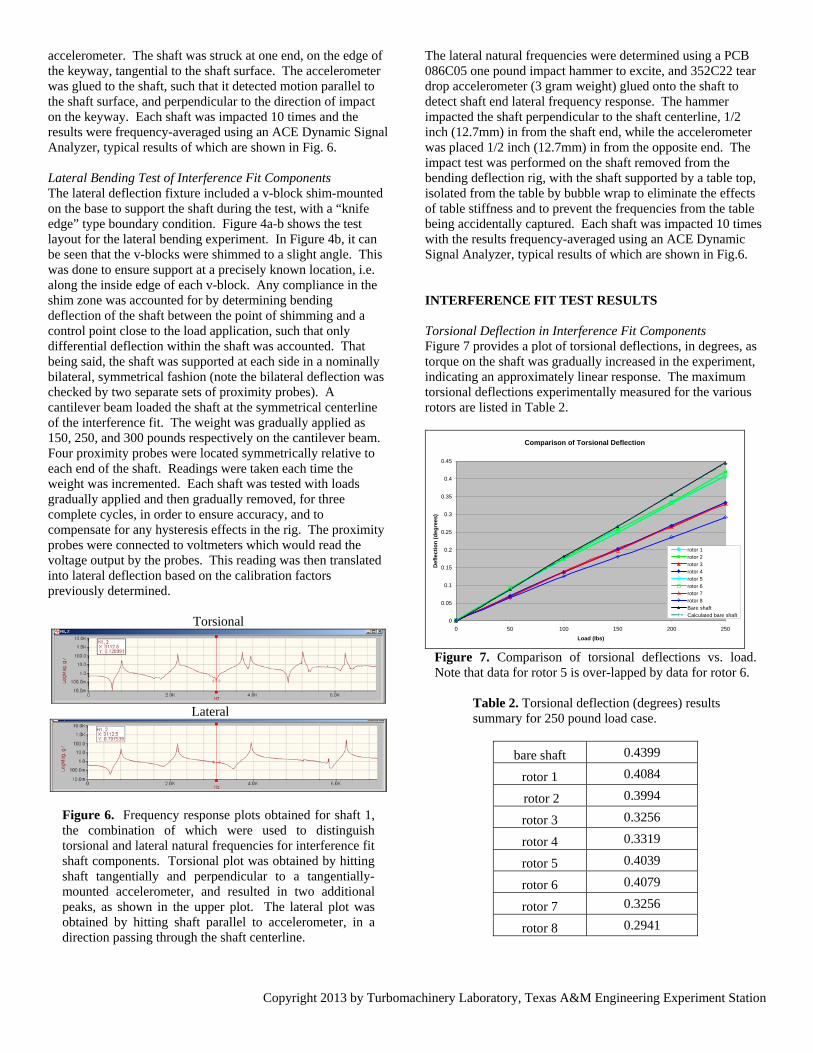
The lateral natural frequencies were determined using a PCB 086C05 one pound impact hammer to excite, and 352C22 tear drop accelerometer (3 gram weight) glued onto the shaft to detect shaft end lateral frequency response. The hammer impacted the shaft perpendicular to the shaft centerline, 1/2 inch (12.7mm) in from the shaft end, while the accelerometer was placed 1/2 inch (12.7mm) in from the opposite end. The impact test was performed on the shaft removed from the bending deflection rig, with the shaft supported by a table top, isolated from the table by bubble wrap to eliminate the effects of table stiffness and to prevent the frequencies from the table being accidentally captured. Each shaft was impacted 10 times with the results frequency-averaged using an ACE Dynamic Signal Analyzer, typical results of which are shown in Fig.6. INTERFERENCE FIT TEST RESULTS Torsional Deflection in Interference Fit Components Figure 7 provides a plot of torsional deflections, in degrees, as torque on the shaft was gradually increased in the experiment, indicating an approximately linear response. The maximum torsional deflections experimentally measured for the various rotors are listed in Table 2.
Comparison of Torsional Deflection
0
0.05
0.1
0.15
0.2
0.25
0.3
0.35
0.4
0.45
0 50 100 150 200 250
Load (lbs)
Def
lect
ion
(d
egre
es)
rotor 1rotor 2
rotor 3rotor 4rotor 5rotor 6rotor 7rotor 8Bare shaftCalculated bare shaft
Figure 7. Comparison of torsional deflections vs. load. Note that data for rotor 5 is over-lapped by data for rotor 6.
Table 2. Torsional deflection (degrees) results summary for 250 pound load case.
bare shaft 0.4399
rotor 1 0.4084
rotor 2 0.3994
rotor 3 0.3256
rotor 4 0.3319
rotor 5 0.4039
rotor 6 0.4079
rotor 7 0.3256
rotor 8 0.2941
Copyright 2013 by Turbomachinery Laboratory, Texas A&M Engineering Experiment Station
Similar to the natural frequency results discussed shortly, the deflection data indicates that the degree of interference fit of the sleeve (for at least a light interference, or any tighter degree of fit) has a relatively modest effect on the torsional stiffness, when a large load is slowly applied. Figure 8 indicates the percent changes in torsional deflection due to the change in diameter and length of sleeve.
Torsional Stiffness Percentage Increase
Rotor 17.71%
Rotor 58.92%
Rotor 210.16% Rotor 6
7.86%
Rotor 335.11%
Rotor 735.11% Rotor 4
32.56%
Rotor 849.57%
0%
10%
20%
30%
40%
50%
60%
Rotors
Sti
ffn
ess
Incr
eas
e (%
)
Figure 8. Torsional stiffness percentage increase due to presence of sleeves.
Torsional Natural Frequencies in Interference Fit Components The torsional natural frequencies experimentally measured for the various interference fit rotors are listed in Table 3. The data indicates that, once a light press fit is achieved, the degree of interference fit of the sleeve for tighter fits does not have a significant effect on the torsional natural frequency. Notably, missing is the modest but consistent stiffening effect of heavier interference effect observed in the torsional deflection test, which involved torsional deflection under slow application of high torque.
Table 3. Torsional natural frequency results summary.
Tors Nat Freq (Hz)
bare shaft 3562.5
rotor 1 3750.0
rotor 2 3762.5
rotor 3 4425.0
rotor 4 4575.0
rotor 5 3750.0
rotor 6 3762.5
rotor 7 4425.0
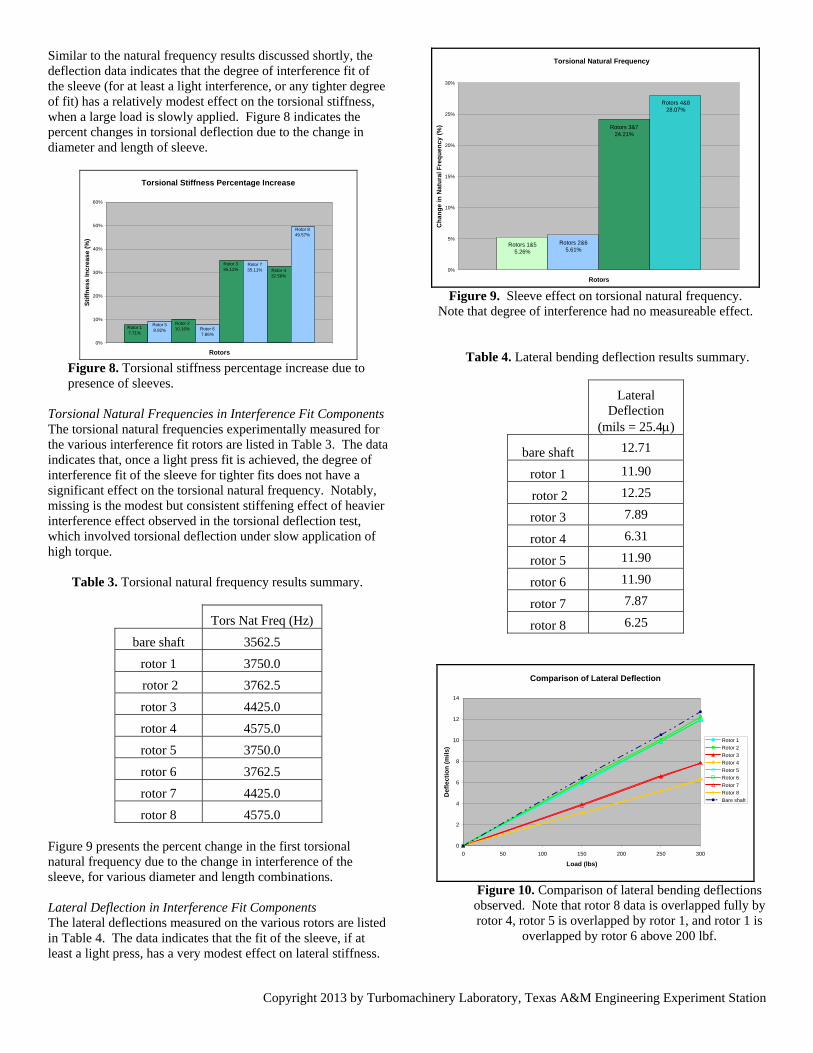
rotor 8 4575.0 Figure 9 presents the percent change in the first torsional natural frequency due to the change in interference of the sleeve, for various diameter and length combinations. Lateral Deflection in Interference Fit Components The lateral deflections measured on the various rotors are listed in Table 4. The data indicates that the fit of the sleeve, if at least a light press, has a very modest effect on lateral stiffness.
Torsional Natural Frequency
Rotors 1&55.26%
Rotors 2&65.61%
Rotors 3&724.21%
Rotors 4&828.07%
0%
5%
10%
15%
20%
25%
30%
Rotors
Ch
ang
e in
Nat
ura
l Fre
qu
en
cy (
%)
Figure 9. Sleeve effect on torsional natural frequency.
Note that degree of interference had no measureable effect.
Table 4. Lateral bending deflection results summary.
Lateral Deflection
(mils = 25.4)
bare shaft 12.71
rotor 1 11.90
rotor 2 12.25
rotor 3 7.89
rotor 4 6.31
rotor 5 11.90
rotor 6 11.90
rotor 7 7.87
rotor 8 6.25
Comparison of Lateral Deflection
0
2
4
6
8
10
12
14
0 50 100 150 200 250 300
Load (lbs)
Def
lect
ion
(m
ils)
Rotor 1
Rotor 2
Rotor 3
Rotor 4
Rotor 5
Rotor 6
Rotor 7
Rotor 8
Bare shaft
Figure 10. Comparison of lateral bending deflections
observed. Note that rotor 8 data is overlapped fully by rotor 4, rotor 5 is overlapped by rotor 1, and rotor 1 is
overlapped by rotor 6 above 200 lbf.
Copyright 2013 by Turbomachinery Laboratory, Texas A&M Engineering Experiment Station
Lateral Stiffness Percentage Increase
Rotor 16.81%
Rotor 56.81%
Rotor 23.76%
Rotor 66.81%
Rotor 361.09%
Rotor 761.50%
Rotor 4101.43%
Rotor 8103.36%
0%
15%
30%
45%
60%
75%
90%
105%
Rotors
Sti
ffn
ess
Inc
rea
se (
%)
Figure 11. Percentage change in lateral bending deflection
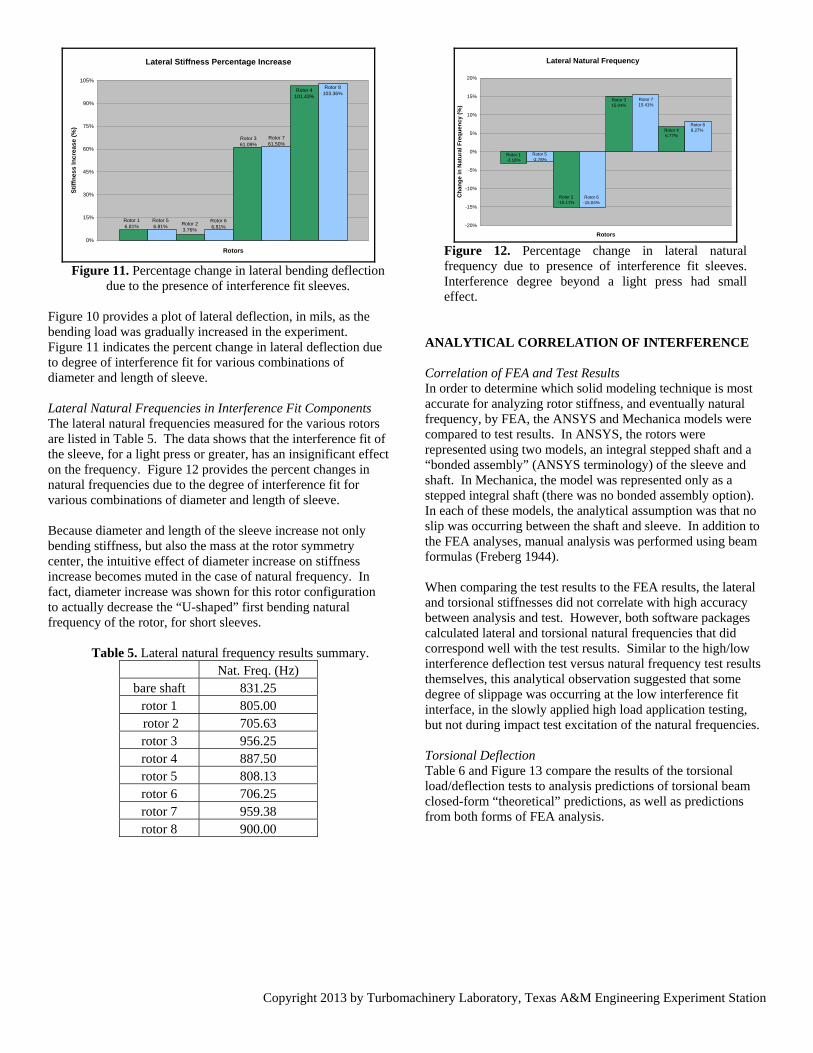
due to the presence of interference fit sleeves. Figure 10 provides a plot of lateral deflection, in mils, as the bending load was gradually increased in the experiment. Figure 11 indicates the percent change in lateral deflection due to degree of interference fit for various combinations of diameter and length of sleeve. Lateral Natural Frequencies in Interference Fit Components The lateral natural frequencies measured for the various rotors are listed in Table 5. The data shows that the interference fit of the sleeve, for a light press or greater, has an insignificant effect on the frequency. Figure 12 provides the percent changes in natural frequencies due to the degree of interference fit for various combinations of diameter and length of sleeve. Because diameter and length of the sleeve increase not only bending stiffness, but also the mass at the rotor symmetry center, the intuitive effect of diameter increase on stiffness increase becomes muted in the case of natural frequency. In fact, diameter increase was shown for this rotor configuration to actually decrease the “U-shaped” first bending natural frequency of the rotor, for short sleeves.
Table 5. Lateral natural frequency results summary. Nat. Freq. (Hz)
bare shaft 831.25 rotor 1 805.00 rotor 2 705.63 rotor 3 956.25 rotor 4 887.50 rotor 5 808.13 rotor 6 706.25 rotor 7 959.38 rotor 8 900.00
Lateral Natural Frequency
Rotor 1-3.16%
Rotor 5-2.78%
Rotor 2-15.11%
Rotor 6-15.04%
Rotor 315.04%
Rotor 715.41%
Rotor 46.77%
Rotor 88.27%
-20%
-15%
-10%
-5%
0%
5%
10%
15%
20%
Rotors
Ch
an
ge
in
Na
tura
l F
req
ue
nc
y (
%)
Figure 12. Percentage change in lateral natural frequency due to presence of interference fit sleeves. Interference degree beyond a light press had small effect.
ANALYTICAL CORRELATION OF INTERFERENCE Correlation of FEA and Test Results In order to determine which solid modeling technique is most accurate for analyzing rotor stiffness, and eventually natural frequency, by FEA, the ANSYS and Mechanica models were compared to test results. In ANSYS, the rotors were represented using two models, an integral stepped shaft and a “bonded assembly” (ANSYS terminology) of the sleeve and shaft. In Mechanica, the model was represented only as a stepped integral shaft (there was no bonded assembly option). In each of these models, the analytical assumption was that no slip was occurring between the shaft and sleeve. In addition to the FEA analyses, manual analysis was performed using beam formulas (Freberg 1944). When comparing the test results to the FEA results, the lateral and torsional stiffnesses did not correlate with high accuracy between analysis and test. However, both software packages calculated lateral and torsional natural frequencies that did correspond well with the test results. Similar to the high/low interference deflection test versus natural frequency test results themselves, this analytical observation suggested that some degree of slippage was occurring at the low interference fit interface, in the slowly applied high load application testing, but not during impact test excitation of the natural frequencies. Torsional Deflection Table 6 and Figure 13 compare the results of the torsional load/deflection tests to analysis predictions of torsional beam closed-form “theoretical” predictions, as well as predictions from both forms of FEA analysis.

Copyright 2013 by Turbomachinery Laboratory, Texas A&M Engineering Experiment Station
Table 6. Comparison of results using different methods to obtain torsional deflection. For manual calculation method, see Appendix. ProE/Mechanica results were obtained solving a stepped integral shaft matching the shaft & sleeve dimensions. ANSYS results assumed a sleeve with “bonded contact”.
Deflection (deg) Observed
Manually Calculated
ProE Mechanica ANSYS
bare shaft 0.4399 0.4488 0.4452 0.4489
rotor 1 0.4084 0.4005 0.4056 0.4115 rotor 2 0.3994 0.3940 0.4026 0.4097 rotor 3 0.3256 0.3038 0.3097 0.3149 rotor 4 0.3319 0.2843 0.2929 0.3004 rotor 5 0.4039 0.4005 0.4067 0.4115 rotor 6 0.4079 0.3940 0.4013 0.4097 rotor 7 0.3256 0.3038 0.3079 0.3149 rotor 8 0.2941 0.2843 0.2881 0.3004
Comparison of Torsional Deflection
0.00
0.05
0.10
0.15
0.20
0.25
0.30
0.35
0.40
0.45
0.50
0 1 2 3 4 5 6 7 8
Rotor #
De
flec
tio
n (
de
gre
es
)
Observed Calculated ANSYS ProE Figure 13. Comparison of the methods used to obtain
torsional deflection, based on data of Table 7.
Table 7. Comparison of results using different methods to obtain torsional natural frequency. For manual calculation method, see Appendix. ProE results were obtained for a stepped integral shaft. ANSYS results assumed a separate fit-up sleeve with “bonded contacts”.
Nat. Freq. (Hz) Observed
Manually Calculated
ProE Mechanica ANSYS
bare shaft 3562.5 3474.4 3491.0 3488.5 rotor 1 3750.0 3745.3 3705.6 3699.4 rotor 2 3762.5 3785.9 3723.6 3710.6 rotor 3 4425.0 4427.8 4369.9 4361.3 rotor 4 4575.0 4613.4 4523.0 4497.4 rotor 5 3750.0 3745.3 3701.7 3700.2 rotor 6 3762.5 3785.9 3719.2 3710.5 rotor 7 4425.0 4427.8 4366.5 4361.9 rotor 8 4575.0 4613.4 4509.2 4497.5
Torsional Natural Frequency Table 7 and Figure 14 compare the results of the torsional natural frequency tests to a torsional beam closed-form solution with no penetration factor applied, as well as to both forms of
FEA analysis. Figure 15 shows a typical torsional mode shape calculated by the FEA programs. Agreement of all methods with test is very close.
Comparison of Torsional Natural Frequency
0
500
1000
1500
2000
2500
3000
3500
4000
4500
5000
0 1 2 3 4 5 6 7 8
Rotor #
Fre
qu
ency
(h
z)
Observed Calculated ANSYS ProE Figure 14. Comparison of the methods used to obtain
torsional natural frequency, per Table 8
Figure 15. First mode torsional mode shape per ANSYS.
Table 8. Comparison to test of lateral deflection predictions. For manual calculation method, see Appendix. ProE results were obtained solving a stepped integral shaft. ANSYS results assumed a fit-up sleeve with “bonded contacts”. The generally larger lateral deflection during test versus analysis is considered due to slip between the sleeve and shaft, under high quasi-static loading. For the base shaft, for which the manual calculation should be precise, good agreement was documented versus both FEA and test, but for all fit-up cases both of the FEA results were stiffer than the test, apparently due to slip at the fit interface, under the gradual loading conditions. The natural frequency data suggests that such slip did not occur under the lower loads and/ or dynamic conditions of the modal impact test. The manual calculation results were stiffer than test or FEA when sleeves were present, suggesting penetration factor.
Deflection
(mils=25.4m) Observed Manually Calculated
ProE Mechanica ANSYS
bare shaft 12.71 12.93 13.11 12.57 rotor 1 11.90 9.62 11.12 11.04 rotor 2 12.25 9.62 11.06 11.06 rotor 3 7.89 4.80 6.68 6.50 rotor 4 6.31 4.80 5.83 5.92 rotor 5 11.90 9.62 11.09 11.04 rotor 6 11.90 9.62 11.0 11.05 rotor 7 7.87 4.80 6.62 6.51 rotor 8 6.25 4.80 5.89 5.91
Copyright 2013 by Turbomachinery Laboratory, Texas A&M Engineering Experiment Station
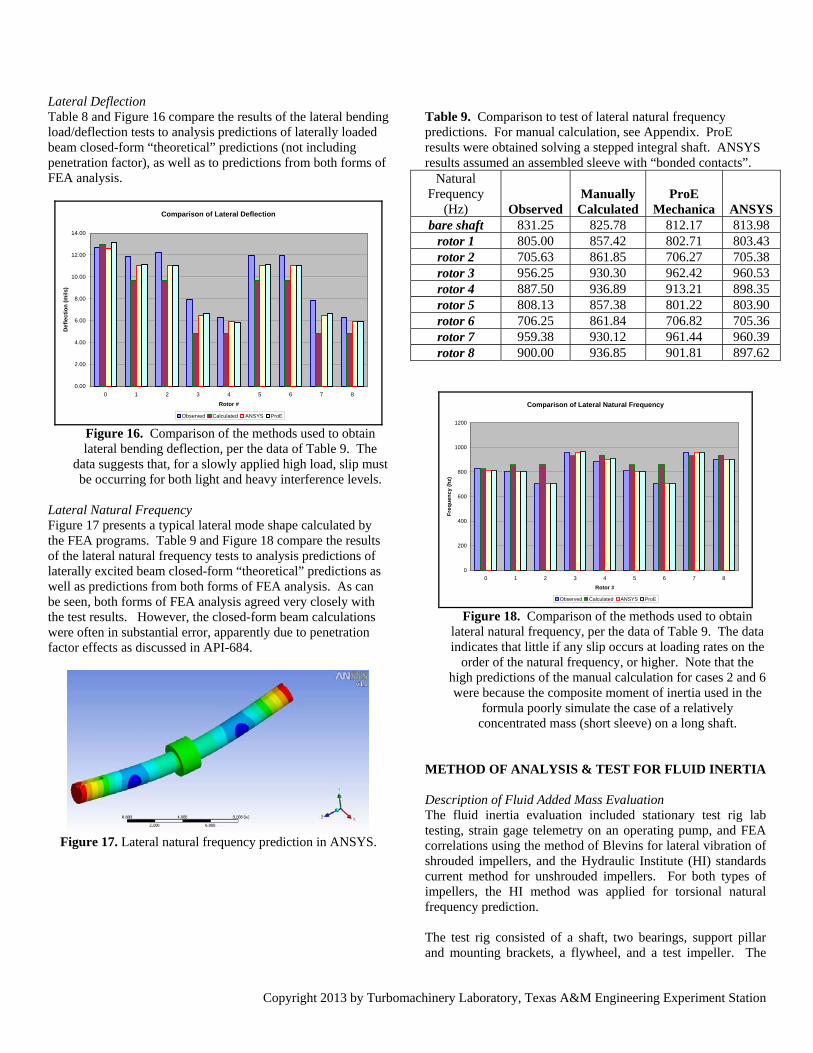
Lateral Deflection Table 8 and Figure 16 compare the results of the lateral bending load/deflection tests to analysis predictions of laterally loaded beam closed-form “theoretical” predictions (not including penetration factor), as well as to predictions from both forms of FEA analysis.
Comparison of Lateral Deflection
0.00
2.00
4.00
6.00
8.00
10.00
12.00
14.00
0 1 2 3 4 5 6 7 8
Rotor #
De
fle
cti
on
(m
ils)
Observed Calculated ANSYS ProE
Figure 16. Comparison of the methods used to obtain lateral bending deflection, per the data of Table 9. The
data suggests that, for a slowly applied high load, slip must be occurring for both light and heavy interference levels.
Lateral Natural Frequency Figure 17 presents a typical lateral mode shape calculated by the FEA programs. Table 9 and Figure 18 compare the results of the lateral natural frequency tests to analysis predictions of laterally excited beam closed-form “theoretical” predictions as well as predictions from both forms of FEA analysis. As can be seen, both forms of FEA analysis agreed very closely with the test results. However, the closed-form beam calculations were often in substantial error, apparently due to penetration factor effects as discussed in API-684.
Figure 17. Lateral natural frequency prediction in ANSYS.
Table 9. Comparison to test of lateral natural frequency predictions. For manual calculation, see Appendix. ProE results were obtained solving a stepped integral shaft. ANSYS results assumed an assembled sleeve with “bonded contacts”.
Natural Frequency
(Hz) Observed Manually
Calculated ProE
Mechanica ANSYS bare shaft 831.25 825.78 812.17 813.98
rotor 1 805.00 857.42 802.71 803.43 rotor 2 705.63 861.85 706.27 705.38 rotor 3 956.25 930.30 962.42 960.53 rotor 4 887.50 936.89 913.21 898.35 rotor 5 808.13 857.38 801.22 803.90 rotor 6 706.25 861.84 706.82 705.36 rotor 7 959.38 930.12 961.44 960.39 rotor 8 900.00 936.85 901.81 897.62
Comparison of Lateral Natural Frequency
0
200
400
600
800
1000
1200
0 1 2 3 4 5 6 7 8
Rotor #
Fre
qu
ency
(h
z)
Observed Calculated ANSYS ProE Figure 18. Comparison of the methods used to obtain
lateral natural frequency, per the data of Table 9. The data indicates that little if any slip occurs at loading rates on the
order of the natural frequency, or higher. Note that the high predictions of the manual calculation for cases 2 and 6 were because the composite moment of inertia used in the
formula poorly simulate the case of a relatively concentrated mass (short sleeve) on a long shaft.
METHOD OF ANALYSIS & TEST FOR FLUID INERTIA Description of Fluid Added Mass Evaluation The fluid inertia evaluation included stationary test rig lab testing, strain gage telemetry on an operating pump, and FEA correlations using the method of Blevins for lateral vibration of shrouded impellers, and the Hydraulic Institute (HI) standards current method for unshrouded impellers. For both types of impellers, the HI method was applied for torsional natural frequency prediction. The test rig consisted of a shaft, two bearings, support pillar and mounting brackets, a flywheel, and a test impeller. The
Copyright 2013 by Turbomachinery Laboratory, Texas A&M Engineering Experiment Station
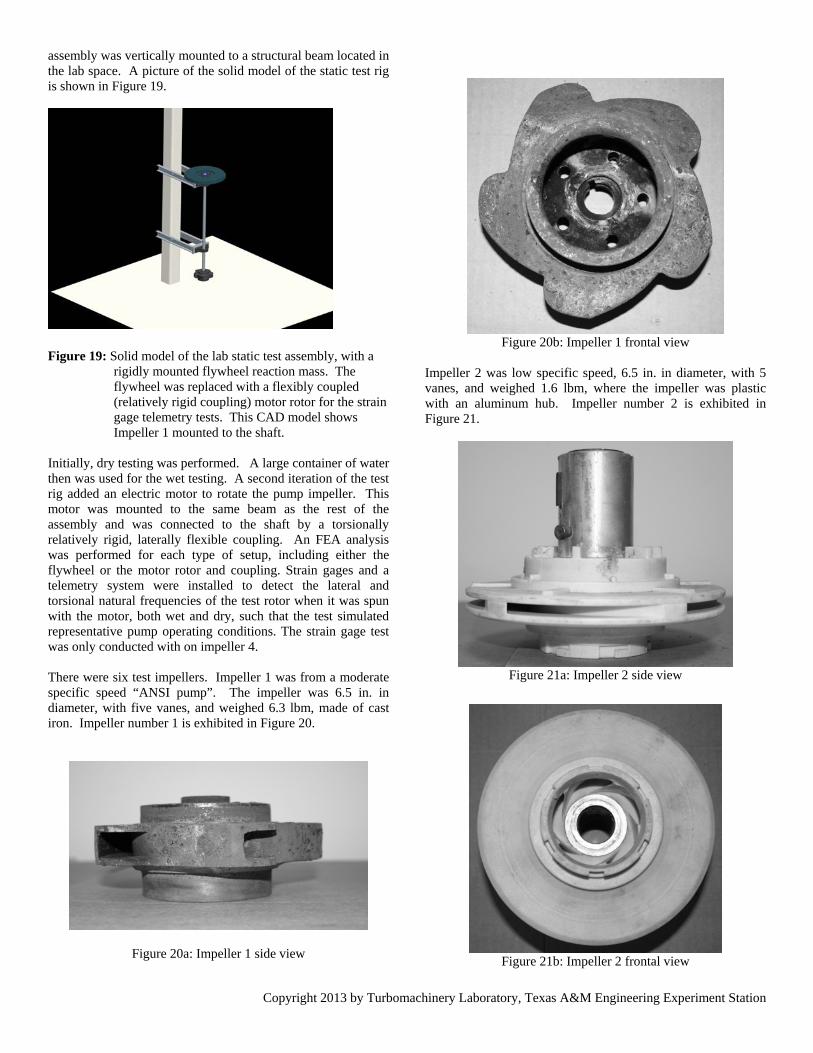
assembly was vertically mounted to a structural beam located in the lab space. A picture of the solid model of the static test rig is shown in Figure 19.
Figure 19: Solid model of the lab static test assembly, with a
rigidly mounted flywheel reaction mass. The flywheel was replaced with a flexibly coupled (relatively rigid coupling) motor rotor for the strain gage telemetry tests. This CAD model shows Impeller 1 mounted to the shaft.
Initially, dry testing was performed. A large container of water then was used for the wet testing. A second iteration of the test rig added an electric motor to rotate the pump impeller. This motor was mounted to the same beam as the rest of the assembly and was connected to the shaft by a torsionally relatively rigid, laterally flexible coupling. An FEA analysis was performed for each type of setup, including either the flywheel or the motor rotor and coupling. Strain gages and a telemetry system were installed to detect the lateral and torsional natural frequencies of the test rotor when it was spun with the motor, both wet and dry, such that the test simulated representative pump operating conditions. The strain gage test was only conducted with on impeller 4. There were six test impellers. Impeller 1 was from a moderate specific speed “ANSI pump”. The impeller was 6.5 in. in diameter, with five vanes, and weighed 6.3 lbm, made of cast iron. Impeller number 1 is exhibited in Figure 20.
Figure 20a: Impeller 1 side view
Figure 20b: Impeller 1 frontal view
Impeller 2 was low specific speed, 6.5 in. in diameter, with 5 vanes, and weighed 1.6 lbm, where the impeller was plastic with an aluminum hub. Impeller number 2 is exhibited in Figure 21.
Figure 21a: Impeller 2 side view
Figure 21b: Impeller 2 frontal view
Copyright 2013 by Turbomachinery Laboratory, Texas A&M Engineering Experiment Station
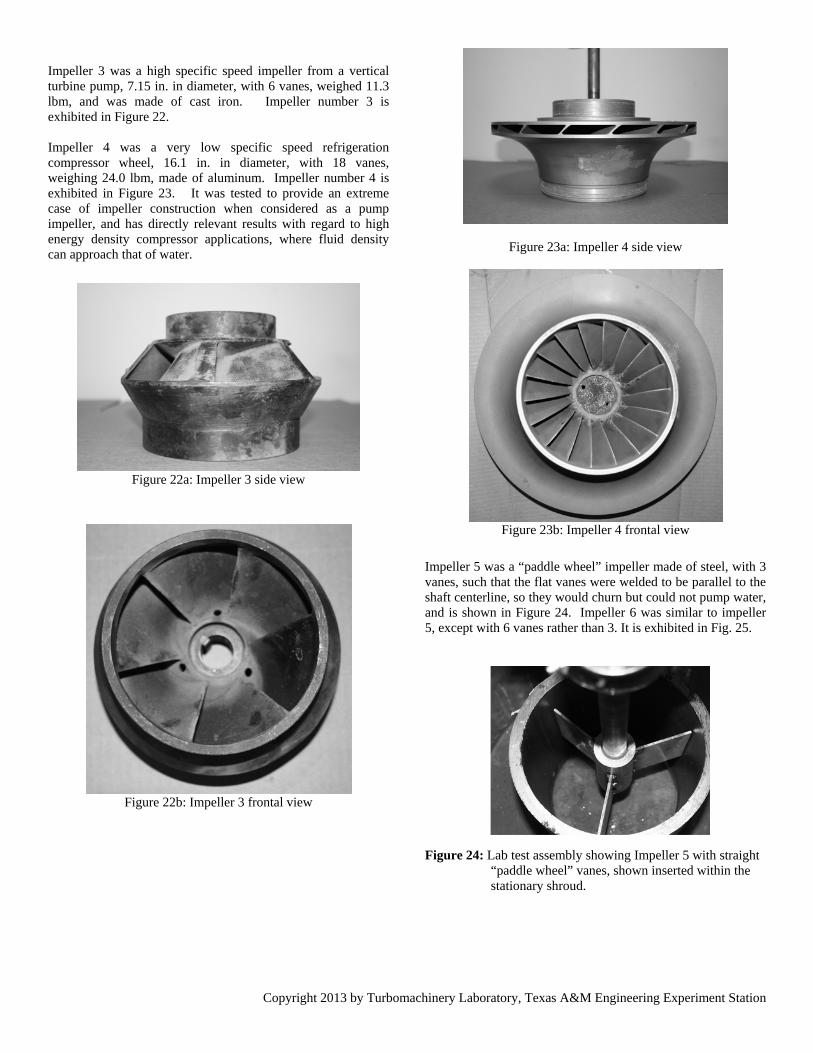
Impeller 3 was a high specific speed impeller from a vertical turbine pump, 7.15 in. in diameter, with 6 vanes, weighed 11.3 lbm, and was made of cast iron. Impeller number 3 is exhibited in Figure 22. Impeller 4 was a very low specific speed refrigeration compressor wheel, 16.1 in. in diameter, with 18 vanes, weighing 24.0 lbm, made of aluminum. Impeller number 4 is exhibited in Figure 23. It was tested to provide an extreme case of impeller construction when considered as a pump impeller, and has directly relevant results with regard to high energy density compressor applications, where fluid density can approach that of water.
Figure 22a: Impeller 3 side view
Figure 22b: Impeller 3 frontal view
Figure 23a: Impeller 4 side view
Figure 23b: Impeller 4 frontal view
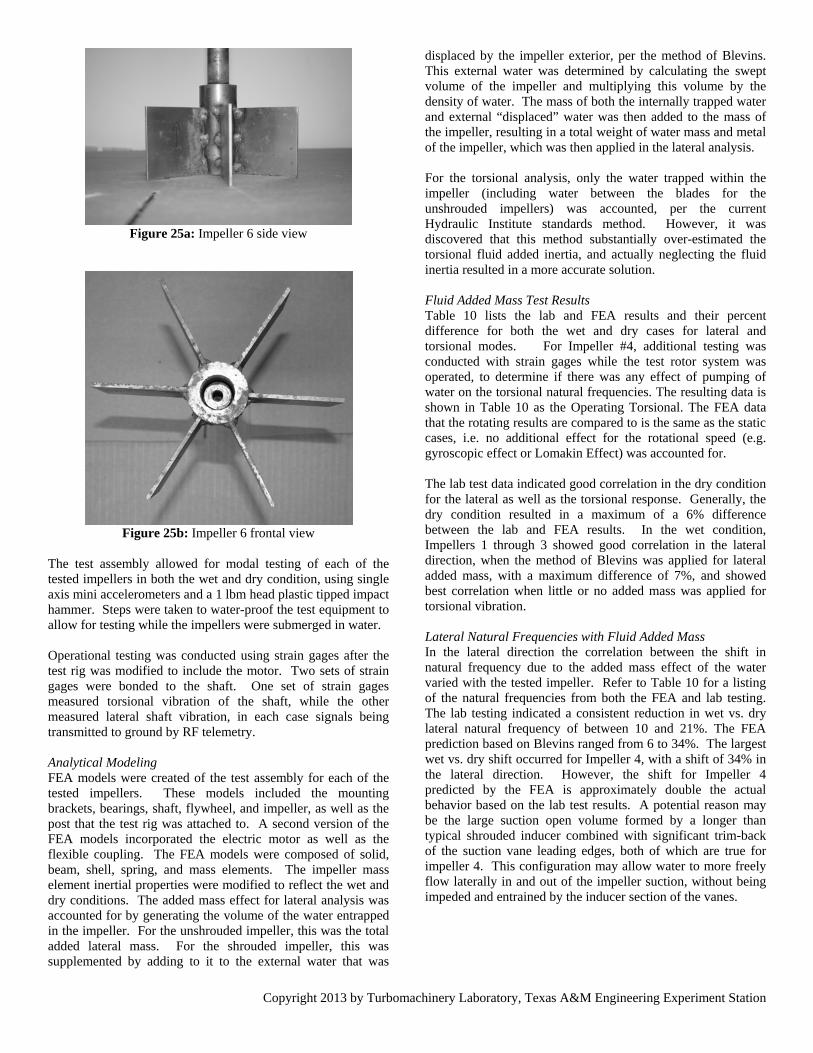
Impeller 5 was a “paddle wheel” impeller made of steel, with 3 vanes, such that the flat vanes were welded to be parallel to the shaft centerline, so they would churn but could not pump water, and is shown in Figure 24. Impeller 6 was similar to impeller 5, except with 6 vanes rather than 3. It is exhibited in Fig. 25.
Figure 24: Lab test assembly showing Impeller 5 with straight
“paddle wheel” vanes, shown inserted within the stationary shroud.
Copyright 2013 by Turbomachinery Laboratory, Texas A&M Engineering Experiment Station
Figure 25a: Impeller 6 side view
Figure 25b: Impeller 6 frontal view
The test assembly allowed for modal testing of each of the tested impellers in both the wet and dry condition, using single axis mini accelerometers and a 1 lbm head plastic tipped impact hammer. Steps were taken to water-proof the test equipment to allow for testing while the impellers were submerged in water. Operational testing was conducted using strain gages after the test rig was modified to include the motor. Two sets of strain gages were bonded to the shaft. One set of strain gages measured torsional vibration of the shaft, while the other measured lateral shaft vibration, in each case signals being transmitted to ground by RF telemetry. Analytical Modeling FEA models were created of the test assembly for each of the tested impellers. These models included the mounting brackets, bearings, shaft, flywheel, and impeller, as well as the post that the test rig was attached to. A second version of the FEA models incorporated the electric motor as well as the flexible coupling. The FEA models were composed of solid, beam, shell, spring, and mass elements. The impeller mass element inertial properties were modified to reflect the wet and dry conditions. The added mass effect for lateral analysis was accounted for by generating the volume of the water entrapped in the impeller. For the unshrouded impeller, this was the total added lateral mass. For the shrouded impeller, this was supplemented by adding to it to the external water that was
displaced by the impeller exterior, per the method of Blevins. This external water was determined by calculating the swept volume of the impeller and multiplying this volume by the density of water. The mass of both the internally trapped water and external “displaced” water was then added to the mass of the impeller, resulting in a total weight of water mass and metal of the impeller, which was then applied in the lateral analysis. For the torsional analysis, only the water trapped within the impeller (including water between the blades for the unshrouded impellers) was accounted, per the current Hydraulic Institute standards method. However, it was discovered that this method substantially over-estimated the torsional fluid added inertia, and actually neglecting the fluid inertia resulted in a more accurate solution. Fluid Added Mass Test Results Table 10 lists the lab and FEA results and their percent difference for both the wet and dry cases for lateral and torsional modes. For Impeller #4, additional testing was conducted with strain gages while the test rotor system was operated, to determine if there was any effect of pumping of water on the torsional natural frequencies. The resulting data is shown in Table 10 as the Operating Torsional. The FEA data that the rotating results are compared to is the same as the static cases, i.e. no additional effect for the rotational speed (e.g. gyroscopic effect or Lomakin Effect) was accounted for. The lab test data indicated good correlation in the dry condition for the lateral as well as the torsional response. Generally, the dry condition resulted in a maximum of a 6% difference between the lab and FEA results. In the wet condition, Impellers 1 through 3 showed good correlation in the lateral direction, when the method of Blevins was applied for lateral added mass, with a maximum difference of 7%, and showed best correlation when little or no added mass was applied for torsional vibration. Lateral Natural Frequencies with Fluid Added Mass In the lateral direction the correlation between the shift in natural frequency due to the added mass effect of the water varied with the tested impeller. Refer to Table 10 for a listing of the natural frequencies from both the FEA and lab testing. The lab testing indicated a consistent reduction in wet vs. dry lateral natural frequency of between 10 and 21%. The FEA prediction based on Blevins ranged from 6 to 34%. The largest wet vs. dry shift occurred for Impeller 4, with a shift of 34% in the lateral direction. However, the shift for Impeller 4 predicted by the FEA is approximately double the actual behavior based on the lab test results. A potential reason may be the large suction open volume formed by a longer than typical shrouded inducer combined with significant trim-back of the suction vane leading edges, both of which are true for impeller 4. This configuration may allow water to more freely flow laterally in and out of the impeller suction, without being impeded and entrained by the inducer section of the vanes.

Copyright 2013 by Turbomachinery Laboratory, Texas A&M Engineering Experiment Station
Table 10: List of lab testing and FEA results showing the shift in natural frequency due to the added mass effect of the water. Impeller 1 Dry(Hz) Wet(Hz) % Diff FEA Lateral 47.8 41.9 12 Torsional 116 107 7.8 Test Lateral 47.0 42.5 10 Torsional 120 118 1.7 Impeller 2 FEA Lateral 77.3 60.7 21 Torsional 256 198 23 Test Lateral 75.5 60.0 21 Torsional 254 240 5.5 Impeller 3 FEA Lateral 40.0 37.7 5.8 Torsional 75.9 69.5 8.4 Test Lateral 39.8 35.0 12 Torsional 80.3 78.5 2.2 Impeller 4 FEA Lateral 21.4 14.1 34 Torsional 31.4 25.7 18 Test Lateral 22.0 18.5 16 Torsional 32.0 29.3 8.4 Operating Torsional 32.3 31.0 4.0 Impeller 5 FEA Lateral 67.5 44.6 34 Torsional 223 142 36 Test w/shroud
Lateral 57.8 48.5 16
Torsional 224 147 34 Test no shroud
Lateral 57.8 49.5 14
Torsional 224 155 31 Impeller 6 FEA Lateral 61.5 42.9 30 Torsional 167 115 31 Test w/shroud
Lateral 50.8 41.0 19
Torsional 171 117 32 Test no shroud
Lateral 50.8 42.0 17
Torsional 171 120 30 Torsional Natural Frequencies with Fluid Added Mass In the FEA modeling method applied, the impeller mass properties due to added mass effect of the water in the evaluation of torsional natural frequencies was the entire “trapped volume” of water within the impeller and between the vanes for both the shrouded and unshrouded impellers, in accordance with the current Hydraulic Institute standards method. However, the test results for the impellers capable of pumping action (rather than simply churning as impellers 5 and 6) did not change very much between the wet and dry cases, and indicated an added mass effect of fluid on the order of only several percent of the torsional natural frequency value. For the true impellers (1 through 4), there was a maximum of an 8% reduction in first torsional natural frequency when the impellers were submerged in water, and more typically 2 to 5%.
It also should be noted that the maximum effect of 8% occurred for Impeller 4, the compressor wheel, which had 18 blades that were more radial in aspect than a typical pump impeller, thereby increasing torsional added mass effect in the manner taken to an extreme by the paddle wheel impellers 5 and 6. Also significant to Impeller 4 was that in the operating condition, Operational Torsional in Table 10, the percent difference drops to 4%, showing much better correlation to an assumption of no torsional fluid added mass, as opposed to the use of the “total entrapped water” method (the current Hydraulic Institute recommended method) when applied in the FEA models. The relatively low torsional added mass is in agreement with the findings of Inagaki (1989) for an actual pump impeller of moderate specific speed. In the “paddle wheel” impellers no. 5 and 6, the HI method for torsional added mass works quite well, unlike the cases for impellers that can truly pump fluid in and out of the impeller because of vane angles designed for good hydraulic performance. If the open impeller is placed inside of a stationary shroud, with close clearance at the vane tips, even closer agreement is obtained. However, in the case of lateral vibration, the impellers without rotating shrouds (i.e. “open”) impellers do not entrain as much added mass as would be credited based on the total fluid between vanes. The assumption of full between-vanes added mass is more closely approached as the impeller possesses more vanes, and/ or as the vanes are placed with close tip clearance within a stationary shroud, but assumption of roughly half the between-vanes would provide results closer to test in either case. Qualitatively, this is similar to the added mass effect on the “bladed disk” vibration of the impeller itself, as discussed recently by Magara (2013). CONCLUSIONS Torsional Natural Frequency The test results show that the degree of interference fit of a sleeve does not have measureable effect on the torsional natural frequencies. In general, once a light press is achieved, the shaft and sleeve behave as an integral unit so far as natural frequencies are concerned. Torsional Stiffness The test results indicate that, concerning sleeve interference, although the torsional natural frequency does not change from light to heavy press fit, the torsional stiffness does slightly increase as interference is increased. This is likely because 1) the torsional natural frequency test involved light impacts inducing small deflections to determine natural frequency, while the deflection tests involved very high torque, and 2) the ability of the sleeve vs. shaft interface to slip is likely frequency dependent. This situation also appears to be occurring in the lateral deflection versus natural frequency results. Both software packages used predict the rotors to be less stiff than their actual slow deflection behavior, based on the test results.

Copyright 2013 by Turbomachinery Laboratory, Texas A&M Engineering Experiment Station
Lateral Natural Frequency The test results indicate that the degree of interference fit of a sleeve, once at least a light press is obtained, has an insignificant effect on lateral natural frequency. The achievement of at least a light interference fit causes the shaft and sleeve to behave as an integral unit with regard to natural frequencies. Lateral Stiffness The test results indicate that the degree of interference fit of a sleeve has an insignificant effect on the lateral stiffness, once at least a light press has been obtained. However, when a flexural load is relatively slowly applied and/ or reaches a relatively large value, the effects of quasi-static slip were observed to occur, and the apparent stiffness of the built-up rotor was observed to decrease somewhat. Penetration Factor According to the API 684 standard for stepped shafting, a penetration factor should be taken into account at each diameter change, when determining the torsional or lateral stiffness of a rotor. However, the test results show the torsional deflections produced by both methods of FEA software used already estimate the rotor as being slightly less stiff than as measured. Taking into account the penetration factor would lead to larger torsional deflection, further deviating from the test results. In terms of manual calculation, lateral stiffness was over-predicted unless penetration factor was accounted, while torsional stiffness was well-predicted without penetration factor. FEA Accuracy in Predicting Interference Effects The data observed was compared to results from FEA software ANSYS and ProE/Mechanica. Using ANSYS to model the rotors, a bonded assembly of both shaft and sleeve yielded the results closest to that experimentally observed. In ProE/Mechanica, a stepped shaft yielded natural frequency results close to that experimentally observed, but failed to predict lateral and torsional deflections accurately. The lateral deflection results produced by both ANSYS and Mechanica estimate the rotors as being slightly stiffer than measured. The torsional deflection results of both software packages calculated the rotors as being less stiff than measured. Lateral Added Fluid Inertia Lab testing indicates a consistent shift in lateral natural frequencies due to the added mass effect of the water, typically averaging about 15%. There was an approximate agreement with the added mass formulas of Blevins, accounting both entrapped fluid as well as external displaced fluid. Torsional Added Fluid Inertia The torsional results show good correlation between the dry FEA and dry as well as wet lab testing. This indicates that the practice of not including any effect of water added mass in the impeller corresponds closest to actual behavior, as opposed to using the full entrapped water as recommended by the current version of the Hydraulic Institute standards. Operating pump strain gage testing indicated that what little torsional added mass was detected in stationary testing was significantly diminished during the pump’s actual operation.
RECOMMENDATIONS FOR FUTURE RESEARCH Interference Fits For future research on interference fits, it is recommended that the effect of shaft surface finish be investigated. Surface finish may increase or decrease interfacial shear strength, thereby affecting stiffness and (for very light interferences) perhaps natural frequency. There may be a similar issue with regard to the degree of lubrication residue remaining on the surface of the shaft after the machining process. For similar reasons, the effect of front and rear interference fit, but with the centered length interference zone relieved as is common practice for many manufacturers, should be explored. Another variable to be further investigated relative to interference fit is the effect of centrifugal loading on the interference and therefore possibly on the stiffness and natural frequencies of the rotor. For lateral vibration, it is unlikely that a clearance-fit keyed rotor component such as an impeller or sleeve will add significant stiffening to the shaft. For torsional vibration, the situation is not so clear-cut, and approaches vary from the 1/3 diameter penetration rule used for many years by the authors (with reasonable agreement with field test data when available) to the 1/3 component fit-up length penetration recommended by API 684. This would be worthy of detailed bench test and FEA investigation similar to what has been performed by the authors for interference fit components. Fluid Inertia In the case of fluid added mass, there are several areas that would benefit from future effort. First, each of the impellers should be tested while operating, as Impeller #4 was, with strain gage telemetry. Second, a greater variety of impellers should be evaluated, in particular a greater range of mixed flow impeller types (impeller 3 in this case). Additional impellers should include functional open impellers, functional impellers with small numbers of vanes (including one or two), a greater variety of high specific speed impellers, and impellers with substantial trim-back from the hub and shroud inlet. Third, some exploration of static enclosure diameter and clearances should be conducted. In the present research, except for non-functional impellers 5 and 6, the water container was large relative to the impeller diameters. Testing should be conducted to evaluate the effect of enclosure diameters that are much closer to the impeller diameter. In-Service Correlation The correlation between the stiffness and inertia lab results and actual in-service characteristics should be investigated, testing the rotor at different speed and flow conditions to see how operation may influence the effect of interference fit and fluid added mass on rotor natural frequencies.
Copyright 2013 by Turbomachinery Laboratory, Texas A&M Engineering Experiment Station
REFERENCES Freberg, Kemler, 1944, Aircraft Vibration & Flutter, Wiley NY Patton, K.T., 1965, Tables of Hydrodynamic Mass Factors for Translational Motion, ASME Paper 65-WA/UNT-2 Lees, A., and Haines, K., Oct. 1978, Torsional Vibrations of a Boiler Feed Pump, Trans. ASME J. of Mech. Des. Thus, W., 1981, the Influence of the Surrounding Medium on Natural Vibrations of Runners, Voith Research and Construction Journal, v. 27a Childs, D.W., 1982, Finite Length Solutions for Rotordynamic Coefficients Turbulent Annular Seals, ASME Paper 82-Lub-42 Liu, K, Belytschko, T., and Mani, A., 1984, Added Mass Computation for Impellers in Nuclear Power Pumps, ASME Paper 84-WA/FM-9 Inagaki, T., Oda, T., Kawakami, T., 1989, Additional Water Mass in Pump Impeller Vibration, Trans. JSME No. 88-0486A/55/511/1989-3, page 651-653 Childs, D.W., 1993, Turbomachinery Rotordynamics, Wiley, NY API 684, 1994, Tutorial on the API Standard Paragraphs Covering Rotor Dynamics and Balancing: An Introduction to Lateral Critical and Train Torsional Analysis and Rotor Balancing, American Petroleum Institute, Washington DC Blevins, R. D. 1995, Formulas for Natural Frequency and Mode Shape, Krieger Publishing, Melbourne, FL Hydraulic Institute, 2009, HI/ANSI Standards, Parsippany NJ Corbo, M., and Malanoski, S., 1996, Practical Design against Torsional Vibration, 15th Turbomachinery Symposium, Texas A&M Turbo Labs Nordmann, R., Weiser, P., Frei, A., Steurchler, P., 1997, Torsional Vibration in Pump/Driver Shaft Trains, Texas A&M 13th International Pump Symposium Smalley, A., Pantermeuhl, P, Hollingsworth, J., and Camatti, M., Sept. 2002, How Interference Fits Stiffen the Flexible Rotors of Centrifugal Compressors, 6th International Conference of Rotordynamics, IFToMM, Sydney Australia Moore, J.J., and Lerche, A.H., June 2009. Rotordynamic Comparison of Built-up Versus Solid Rotor Construction. Proceedings of ASME Turbo Expo: Power for Land, Sea, and Air, Orlando, FL Gao, J., Yuan, Q, Li, P., Feng, Z., et al, Oct. 2012, Effects of Bending Moments and Pretightening on the Flexural Stiffness of Contact Interfaces in Rod-Fastened Rotors, Trans. ASME J. of Engineering for Gas Turbines and Power, v. 134
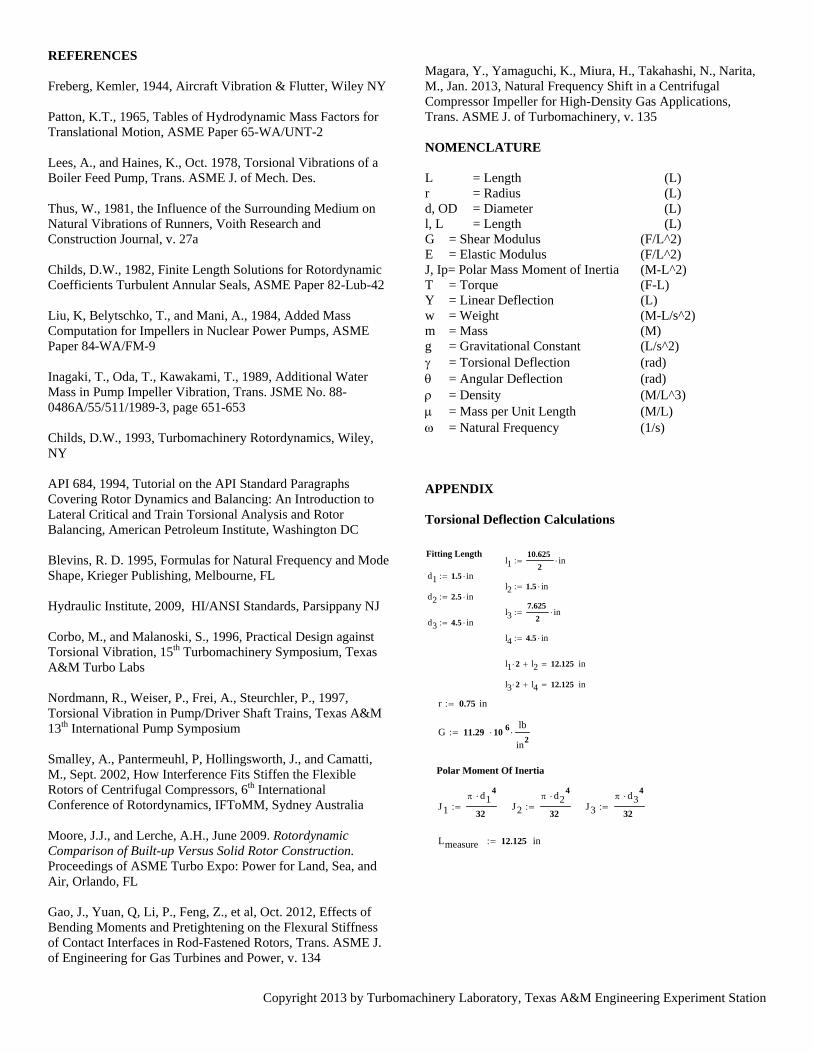
Magara, Y., Yamaguchi, K., Miura, H., Takahashi, N., Narita, M., Jan. 2013, Natural Frequency Shift in a Centrifugal Compressor Impeller for High-Density Gas Applications, Trans. ASME J. of Turbomachinery, v. 135 NOMENCLATURE L = Length (L) r = Radius (L) d, OD = Diameter (L) l, L = Length (L) G = Shear Modulus (F/L^2) E = Elastic Modulus (F/L^2) J, Ip= Polar Mass Moment of Inertia (M-L^2) T = Torque (F-L) Y = Linear Deflection (L) w = Weight (M-L/s^2) m = Mass (M) g = Gravitational Constant (L/s^2) = Torsional Deflection (rad) = Angular Deflection (rad) = Density (M/L^3) = Mass per Unit Length (M/L) = Natural Frequency (1/s) APPENDIX Torsional Deflection Calculations Fitting Length
l110.625
2in
d1 1.5 inl2 1.5 in
d2 2.5 in
l37.625
2in
d3 4.5 in
l4 4.5 in
l1 2 l2 12.125 in
l3 2 l4 12.125 in r 0.75 in
G 11.29 10 6lb
in2
Polar Moment Of Inertia
J1
d14
32 J2
d24
32 J3
d34
32
Lmeasure 12.125 in

Copyright 2013 by Turbomachinery Laboratory, Texas A&M Engineering Experiment Station
T1 250 14.5( ) in lb 3625 in lb
T1 Lmeasure
G J10.4488 deg No fitting
15
T1
G
l1
J1
l2
J2
l1
J1
0.4005 deg 2.5 inch fittings thin
26
T1
G
l1
J1
l2
J3
l1
J1
0.3940 deg 2.5 inch fittings thick
37
T1
G
l3
J1
l4
J2
l3
J1
0.3038 deg 4.5 inch fittings thin
48
T1
G
l3
J1
l4
J3
l3
J1
0.2843 deg 4.5 inch fittings thick
Torsional Natural Frequency Calculations
L 18in r 0.75in OD1 2.5inG 11.29 106
lb
in2
L1 6.75in wi 8.87lb OD2 4.5in
L2 8.25in
IP r
44
0.2485in4 Area MOI
mwi
386.4in
s2
0.02296s2
inlb Mass of Shaft
m
r2
L
2
0.00144lb s
2
in4
Mass Density
J r
4 2
0.49701in4 Torsional Constant for X-Section (Polar MOI
Effective Area Moments
Ishort
L1
r4
4
27.162441
in3
Ibase
L
r4
4
72.433181
in3
Ilong
L2
r4
4
33.198541
in3
base
2
L
J G
L
Ibase
3474.351
s
Llong 4.5in
Lshort 1.5in
I37
Llong
OD1
2
4
4
2.346841
in3
I48
Llong
OD2
2
4
4
0.223561
in3
I15
Lshort
OD1
2
4
4
0.782281
in3
I26
Lshort
OD2
2
4
4
0.074521
in3
Llong 4.5in
Lshort 1.5in
I37
Llong
OD1
2
4
4
2.346841
in3
I48
Llong
OD2
2
4
4
0.223561
in3
I15
Lshort
OD1
2
4
4
0.782281
in3
I26
Lshort
OD2
2
4
4
0.074521
in3
Lateral Deflection Calculations
w 1100 lbf E 2.901 10 7 psi
L 1 5.75 in g 386.08858in
s2
L 2 7.25 in r 0.75 in
L 3 8 inI
r4
40.2485 in
4L measured 16 in
shafts 1&5
y 1
w 2 L 1 3
48 E I0.00483 in shafts 2&6
shafts 3&7
y 2
w 2 L 2 3
48 E I0.00969 in shafts 4&8
y 3
w 2 L 3 3
48 E I0.01302 in plain shaft
Lateral Natural Frequency Calculations (Using modified equation which accounts for sleeve weight)
w 1100 lbf E 2.901107psi r 0.75in w1 10.195 lbf w5 10.215 lbf
L 18in L1 6.75inw2 14.865 lbf w6 14.88 lbf
wi 8.87lbfL2 8.25in
g 386.08858in
s2
w3 12.835 lbf w7 12.865 lbf
I r
4
40.2485 in
4 Area MOI w4 26.805 lbf w8 26.820 lbf
Llong 4.5in OD1
2.499 in OD5
2.494 inr1
1.499 in
20.7495 in
Lshort 1.5in OD2
4.499 in OD6
4.494 in
r21.494 in
20.747 in
I1
Lshort
OD1
2
4
4
0.783531
in3
I5
Lshort
OD5
2
4
4
0.789831
in3
Ilong
L2
r4
4
33.21
in3
shafts 1&5
shafts 2&6

Copyright 2013 by Turbomachinery Laboratory, Texas A&M Engineering Experiment Station
4
I2
Lshort
OD2
2
4
4
0.074591
in3
I6
Lshort
OD6
2
4
4
0.074921
in3
Ishort
L1
r4
4
27.161
in3
shafts 3&7
shafts 4&8
I3
Llong
OD1
2
4
4
2.350591
in3
I7
Llong
OD5
2
4
4
2.36951
in3
shaft
wi
r2
L
0.27886lbf
in3
sleeve
w1 wi
OD
1
2
2
r12
Lshort
0.28131lbf
in3
I4
Llong
OD2
2
4
4
0.223761
in3
I8
Llong
OD6
2
4
4
0.224761
in3
IP1
L
2Ilong I1 0.26793 in4
IP5
L
2Ilong I5 0.26791 in4
IP2
L
2Ilong I2 0.27079 in4
IP6
L
2Ilong I6 0.27079 in4
IP3
L
2Ishort I3 0.3176 in4
IP7
L
2Ishort I7 0.31749 in4
IP4
L
2Ishort I4 0.32998 in4
IP8
L
2Ishort I8 0.32997 in4
n 3.56
g E I
wi L3
825.781
s
1 3.56g E IP1
wi L3
w1 wi Lshort
3
857.421
s 3 3.56
g E IP3
wi L3
w3 wi Llong
3
930.31
s
5 3.56g E IP5
wi L3
w5 wi Lshort
3
857.381
s 7 3.56
g E IP7
wi L3
w7 wi Llong
3
930.121
s
2 3.56g E IP2
wi L3
w2 wi Lshort
3
861.851
s 4 3.56
g E IP4
wi L3
w4 wi Llong
3
936.891
s
6 3.56g E IP6
wi L3
w6 wi Lshort
3
861.841
s 8 3.56
g E IP8
wi L3
w8 wi Llong
3
936.871
s
Lateral Natural Frequency Calculations Method 2 (According to Freberg & Kemler: “Aircraft Vibration and Flutter” Wiley, 1944)
11 3.56g E IP1
w1 L3
799.80
1
s 51 3.56
g E IP5
w5 L3
798.98
1
s
21 3.56g E IP2
w2 L3
665.88
1
s 61 3.56
g E IP6
w6 L3
665.54
1
s
31 3.56g E IP3
w3 L3
776.07
1
s 71 3.56
g E IP7
w7 L3
775.03
1
s
41 3.56g E IP4
w4 L3
547.39
1
s 81 3.56
g E IP8
w8 L3
547.23
1
s
ACKNOWLEDGEMENTS
The authors would like to thank the staff of Mechanical Solutions, Inc. for their efforts in the pursuit of MSI-funded Internal Research & Development that resulted in the information presented in this lecture. Special thanks to Simon Bradshaw of ITT Goulds who provided thorough manuscript review and many comments useful for improving this lecture.