proceedings open access color ... - diagnostic pathology
TRANSCRIPT
PROCEEDINGS Open Access
Color standardization and optimization in WholeSlide ImagingYukako Yagi
From The 10th European Congress on Telepathology and 4th International Congress on Virtual MicroscopyVilnius, Lithuania. 1-3 July 2010
Abstract
Introduction: Standardization and validation of the color displayed by digital slides is an important aspect ofdigital pathology implementation. While the most common reason for color variation is the variance in theprotocols and practices in the histology lab, the color displayed can also be affected by variation in captureparameters (for example, illumination and filters), image processing and display factors in the digital systemsthemselves.
Method: We have been developing techniques for color validation and optimization along two paths. The firstwas based on two standard slides that are scanned and displayed by the imaging system in question. In thisapproach, one slide is embedded with nine filters with colors selected especially for H&E stained slides (looking liketiny Macbeth color chart); the specific color of the nine filters were determined in our previous study and modifiedfor whole slide imaging (WSI). The other slide is an H&E stained mouse embryo. Both of these slides were scannedand the displayed images were compared to a standard. The second approach was based on our previousmultispectral imaging research.
Discussion: As a first step, the two slide method (above) was used to identify inaccurate display of color and itscause, and to understand the importance of accurate color in digital pathology. We have also improved themultispectral-based algorithm for more consistent results in stain standardization. In near future, the results of thetwo slide and multispectral techniques can be combined and will be widely available.We have been conducting a series of researches and developing projects to improve image quality to establishImage Quality Standardization. This paper discusses one of most important aspects of image quality – color.
BackgroundTechnologies in WSI have been improving for the lastdecade [1]. A variety of scanners are now available withfaster scanning speed and higher image quality [2]. Theusages of WSI are varied such as for developing decisionsupport system, image analysis, education, conferenceand remote diagnosis. However, there are still manyissues we must solve before implementation in the clini-cal environment such as the system stability, consistencyof image quality, etc. The issues are becoming evenmore serious as WSI is becoming popular and used as a
part of clinical practice. One of the most importantissues in WSI is the color. Standardization and valida-tion of the color of digital slides on the display is animportant aspect of digital pathology implementation.While the most common reason for color variation isthe variance in the protocols and practices in the histol-ogy lab, the color displayed can also be affected by var-iation in capture parameters (for example, illuminationand filters), image processing and display factors in thedigital systems themselves. All processes are very impor-tant and influence each other. Five major reasons ofcolor variation are thickness of specimen, staining, scan-ner, viewer and display. To realize that the color we arelooking at is not optimized or standardized is the firststep towards standardization. Because no one who is
Correspondence: [email protected] of Pathology, Massachusetts General Hospital and HarvardMedical School 101 Merrimac St. Suite 820, Boston, MA 02114, USAFull list of author information is available at the end of the article
Yagi Diagnostic Pathology 2011, 6(Suppl 1):S15http://www.diagnosticpathology.org/content/6/S1/S15
© 2011 Yagi; licensee BioMed Central Ltd. This is an open access article distributed under the terms of the Creative CommonsAttribution License (http://creativecommons.org/licenses/by/2.0), which permits unrestricted use, distribution, and reproduction inany medium, provided the original work is properly cited.
involved in the process, i.e. between making a slide anddisplaying it, looks at the slide color at each step. Mostof them are only responsible for 1-2 processes. Forexample, a histology technician looks at the physicalstain dyes and a stained slides only; the person scanninga slide checks the stained slide and scanned image, anda reviewer looks at the images on her/his display inremote server. The advantage of WSI is to minimize thephysical distance between the slide and the reviewer andalso among reviewers. It is difficult to know whether theappropriate color of the WSI is displayed at thereviewers’ end, or even at a local display station. It is ahuge challenge to standardize the color in the entireprocess (staining to displaying the scanned slides), foranyone at anywhere.Five major causes of color issues are following.
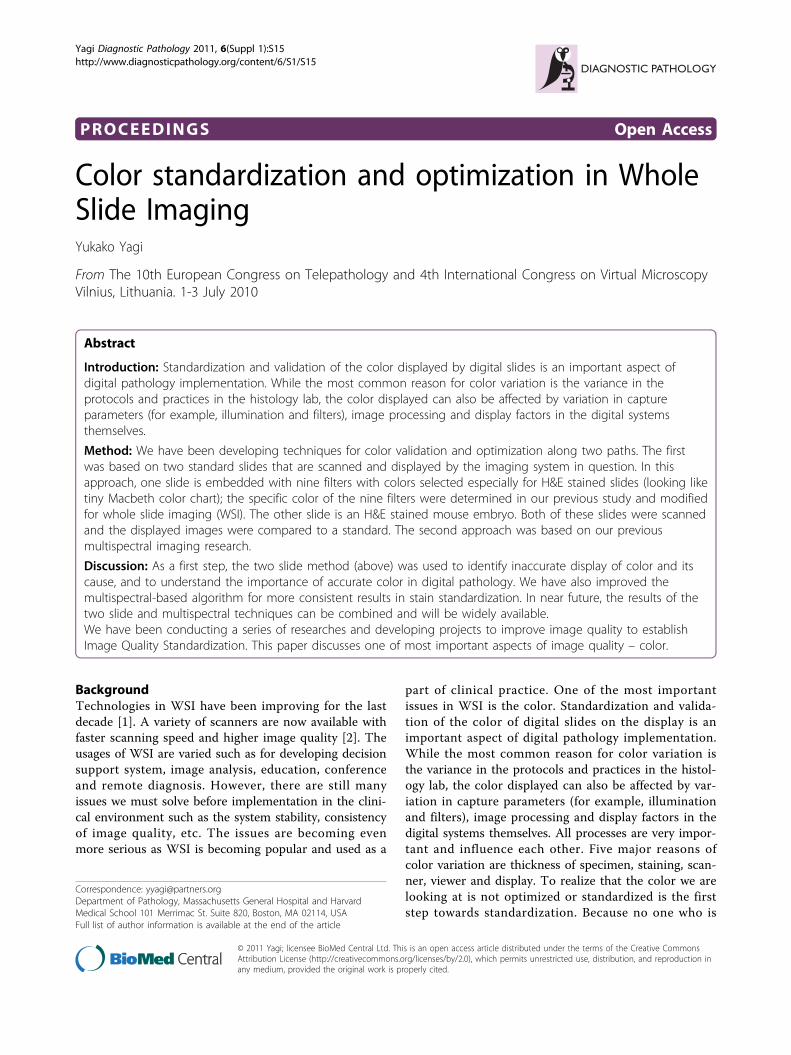
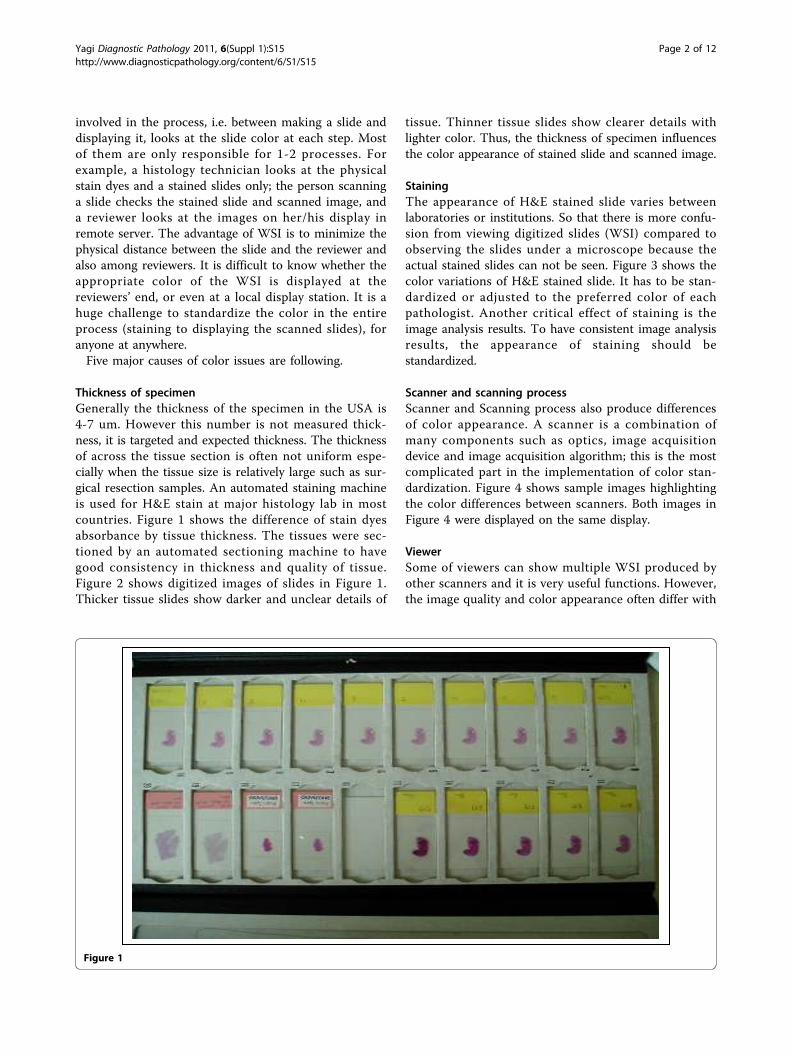
Thickness of specimenGenerally the thickness of the specimen in the USA is4-7 um. However this number is not measured thick-ness, it is targeted and expected thickness. The thicknessof across the tissue section is often not uniform espe-cially when the tissue size is relatively large such as sur-gical resection samples. An automated staining machineis used for H&E stain at major histology lab in mostcountries. Figure 1 shows the difference of stain dyesabsorbance by tissue thickness. The tissues were sec-tioned by an automated sectioning machine to havegood consistency in thickness and quality of tissue.Figure 2 shows digitized images of slides in Figure 1.Thicker tissue slides show darker and unclear details of
tissue. Thinner tissue slides show clearer details withlighter color. Thus, the thickness of specimen influencesthe color appearance of stained slide and scanned image.
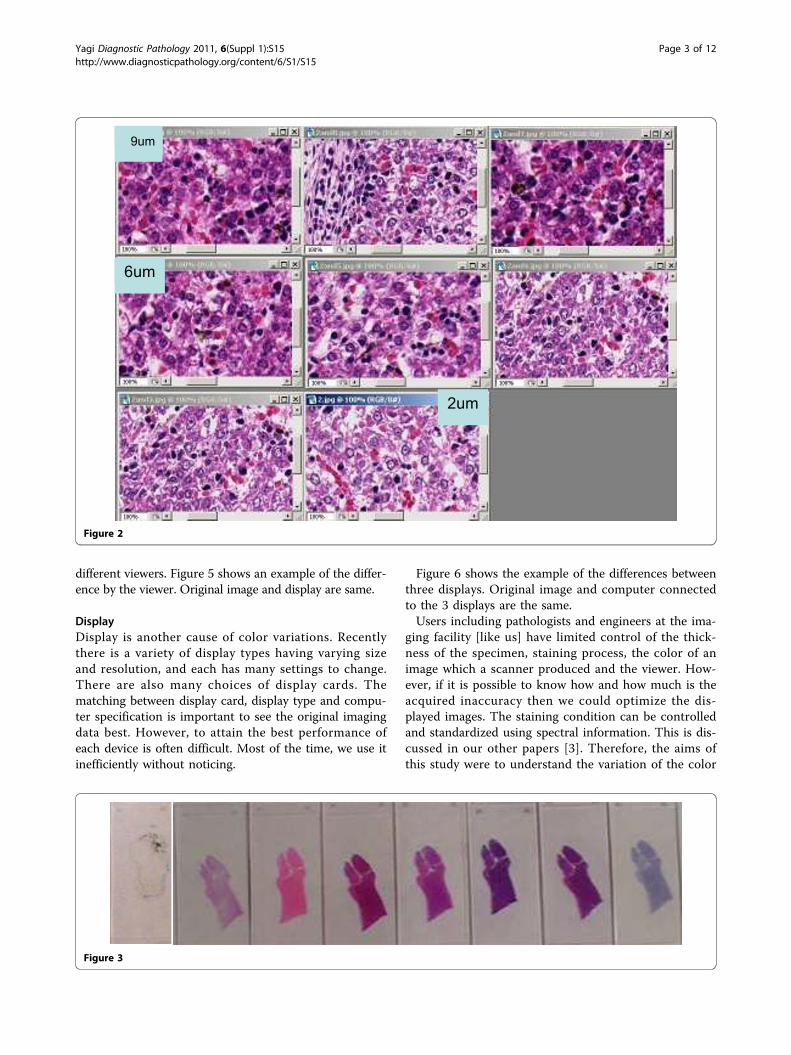
StainingThe appearance of H&E stained slide varies betweenlaboratories or institutions. So that there is more confu-sion from viewing digitized slides (WSI) compared toobserving the slides under a microscope because theactual stained slides can not be seen. Figure 3 shows thecolor variations of H&E stained slide. It has to be stan-dardized or adjusted to the preferred color of eachpathologist. Another critical effect of staining is theimage analysis results. To have consistent image analysisresults, the appearance of staining should bestandardized.
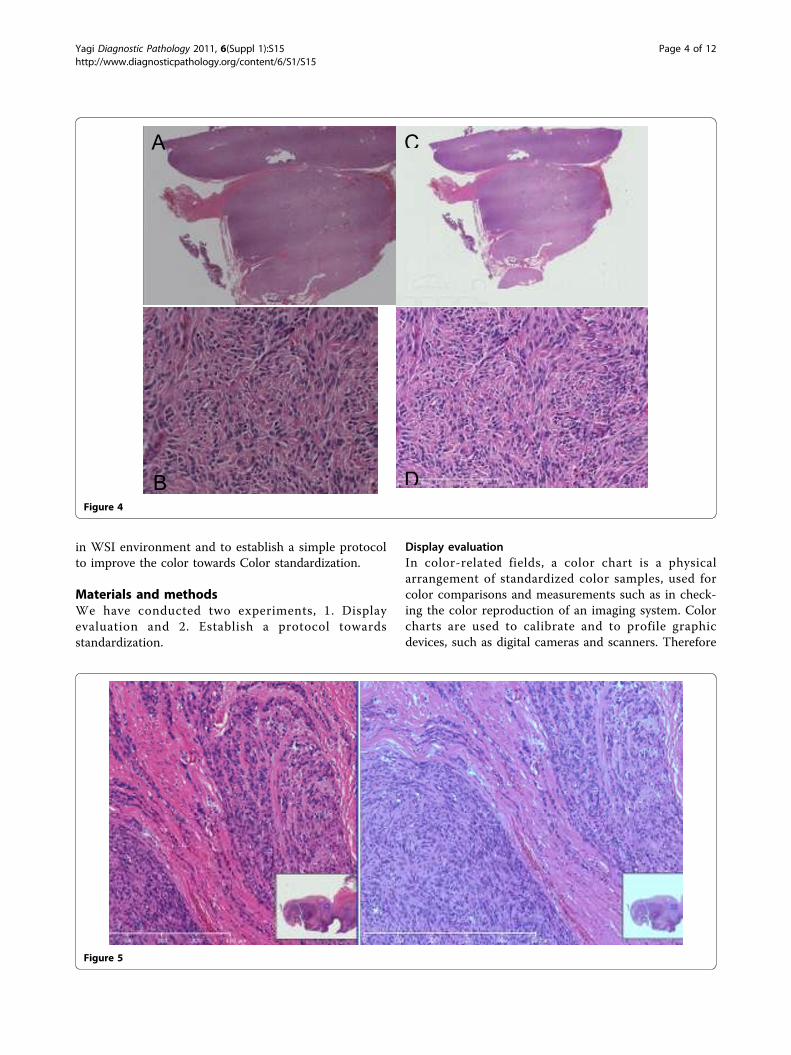
Scanner and scanning processScanner and Scanning process also produce differencesof color appearance. A scanner is a combination ofmany components such as optics, image acquisitiondevice and image acquisition algorithm; this is the mostcomplicated part in the implementation of color stan-dardization. Figure 4 shows sample images highlightingthe color differences between scanners. Both images inFigure 4 were displayed on the same display.
ViewerSome of viewers can show multiple WSI produced byother scanners and it is very useful functions. However,the image quality and color appearance often differ with
Figure 1
Yagi Diagnostic Pathology 2011, 6(Suppl 1):S15http://www.diagnosticpathology.org/content/6/S1/S15
Page 2 of 12
different viewers. Figure 5 shows an example of the differ-ence by the viewer. Original image and display are same.
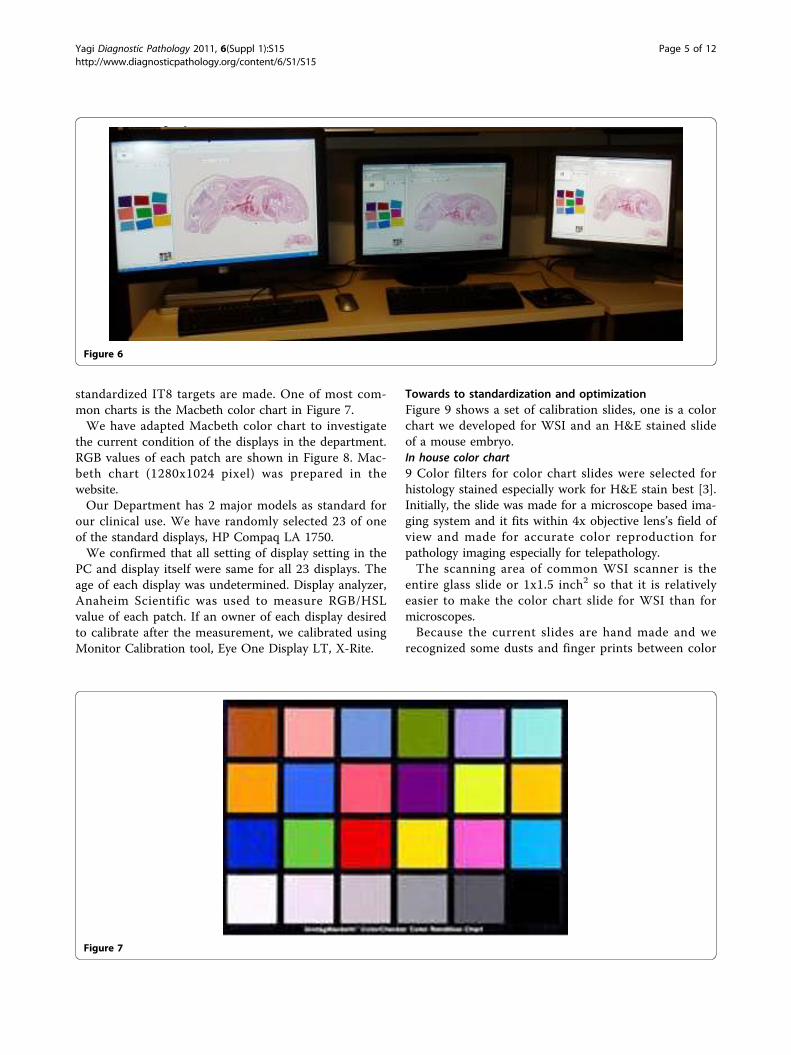
DisplayDisplay is another cause of color variations. Recentlythere is a variety of display types having varying sizeand resolution, and each has many settings to change.There are also many choices of display cards. Thematching between display card, display type and compu-ter specification is important to see the original imagingdata best. However, to attain the best performance ofeach device is often difficult. Most of the time, we use itinefficiently without noticing.
Figure 6 shows the example of the differences betweenthree displays. Original image and computer connectedto the 3 displays are the same.Users including pathologists and engineers at the ima-
ging facility [like us] have limited control of the thick-ness of the specimen, staining process, the color of animage which a scanner produced and the viewer. How-ever, if it is possible to know how and how much is theacquired inaccuracy then we could optimize the dis-played images. The staining condition can be controlledand standardized using spectral information. This is dis-cussed in our other papers [3]. Therefore, the aims ofthis study were to understand the variation of the color
Figure 2
Figure 3
Yagi Diagnostic Pathology 2011, 6(Suppl 1):S15http://www.diagnosticpathology.org/content/6/S1/S15
Page 3 of 12
in WSI environment and to establish a simple protocolto improve the color towards Color standardization.
Materials and methodsWe have conducted two experiments, 1. Displayevaluation and 2. Establish a protocol towardsstandardization.
Display evaluationIn color-related fields, a color chart is a physicalarrangement of standardized color samples, used forcolor comparisons and measurements such as in check-ing the color reproduction of an imaging system. Colorcharts are used to calibrate and to profile graphicdevices, such as digital cameras and scanners. Therefore
Figure 4
Figure 5
Yagi Diagnostic Pathology 2011, 6(Suppl 1):S15http://www.diagnosticpathology.org/content/6/S1/S15
Page 4 of 12
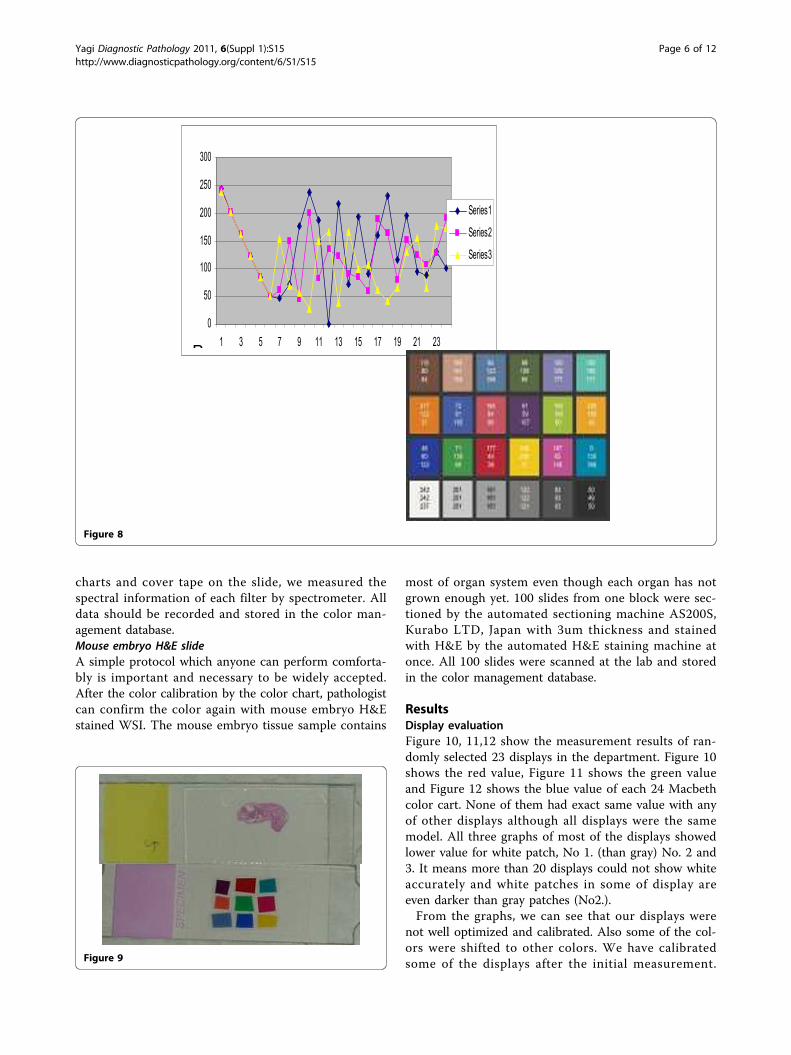
standardized IT8 targets are made. One of most com-mon charts is the Macbeth color chart in Figure 7.We have adapted Macbeth color chart to investigate
the current condition of the displays in the department.RGB values of each patch are shown in Figure 8. Mac-beth chart (1280x1024 pixel) was prepared in thewebsite.Our Department has 2 major models as standard for
our clinical use. We have randomly selected 23 of oneof the standard displays, HP Compaq LA 1750.We confirmed that all setting of display setting in the
PC and display itself were same for all 23 displays. Theage of each display was undetermined. Display analyzer,Anaheim Scientific was used to measure RGB/HSLvalue of each patch. If an owner of each display desiredto calibrate after the measurement, we calibrated usingMonitor Calibration tool, Eye One Display LT, X-Rite.
Towards to standardization and optimizationFigure 9 shows a set of calibration slides, one is a colorchart we developed for WSI and an H&E stained slideof a mouse embryo.In house color chart9 Color filters for color chart slides were selected forhistology stained especially work for H&E stain best [3].Initially, the slide was made for a microscope based ima-ging system and it fits within 4x objective lens’s field ofview and made for accurate color reproduction forpathology imaging especially for telepathology.The scanning area of common WSI scanner is the
entire glass slide or 1x1.5 inch2 so that it is relativelyeasier to make the color chart slide for WSI than formicroscopes.Because the current slides are hand made and we
recognized some dusts and finger prints between color
Figure 6
Figure 7
Yagi Diagnostic Pathology 2011, 6(Suppl 1):S15http://www.diagnosticpathology.org/content/6/S1/S15
Page 5 of 12
charts and cover tape on the slide, we measured thespectral information of each filter by spectrometer. Alldata should be recorded and stored in the color man-agement database.Mouse embryo H&E slideA simple protocol which anyone can perform comforta-bly is important and necessary to be widely accepted.After the color calibration by the color chart, pathologistcan confirm the color again with mouse embryo H&Estained WSI. The mouse embryo tissue sample contains
most of organ system even though each organ has notgrown enough yet. 100 slides from one block were sec-tioned by the automated sectioning machine AS200S,Kurabo LTD, Japan with 3um thickness and stainedwith H&E by the automated H&E staining machine atonce. All 100 slides were scanned at the lab and storedin the color management database.
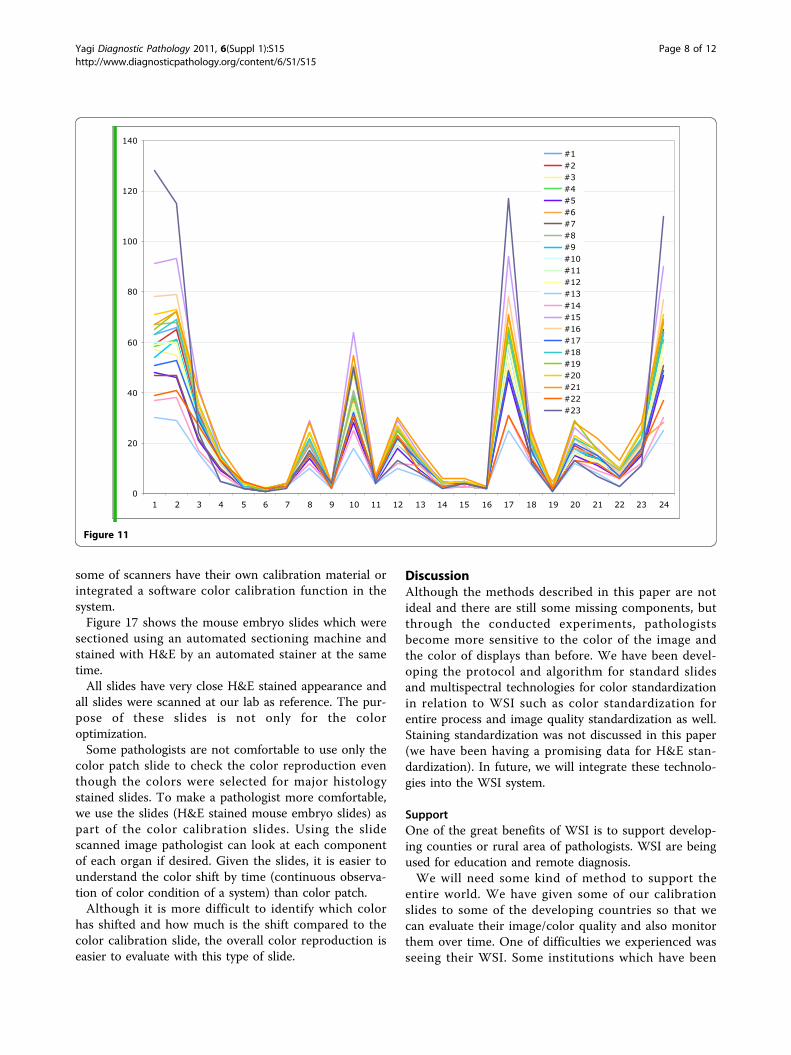
ResultsDisplay evaluationFigure 10, 11,12 show the measurement results of ran-domly selected 23 displays in the department. Figure 10shows the red value, Figure 11 shows the green valueand Figure 12 shows the blue value of each 24 Macbethcolor cart. None of them had exact same value with anyof other displays although all displays were the samemodel. All three graphs of most of the displays showedlower value for white patch, No 1. (than gray) No. 2 and3. It means more than 20 displays could not show whiteaccurately and white patches in some of display areeven darker than gray patches (No2.).From the graphs, we can see that our displays were
not well optimized and calibrated. Also some of the col-ors were shifted to other colors. We have calibratedsome of the displays after the initial measurement.
Figure 8
Figure 9
Yagi Diagnostic Pathology 2011, 6(Suppl 1):S15http://www.diagnosticpathology.org/content/6/S1/S15
Page 6 of 12
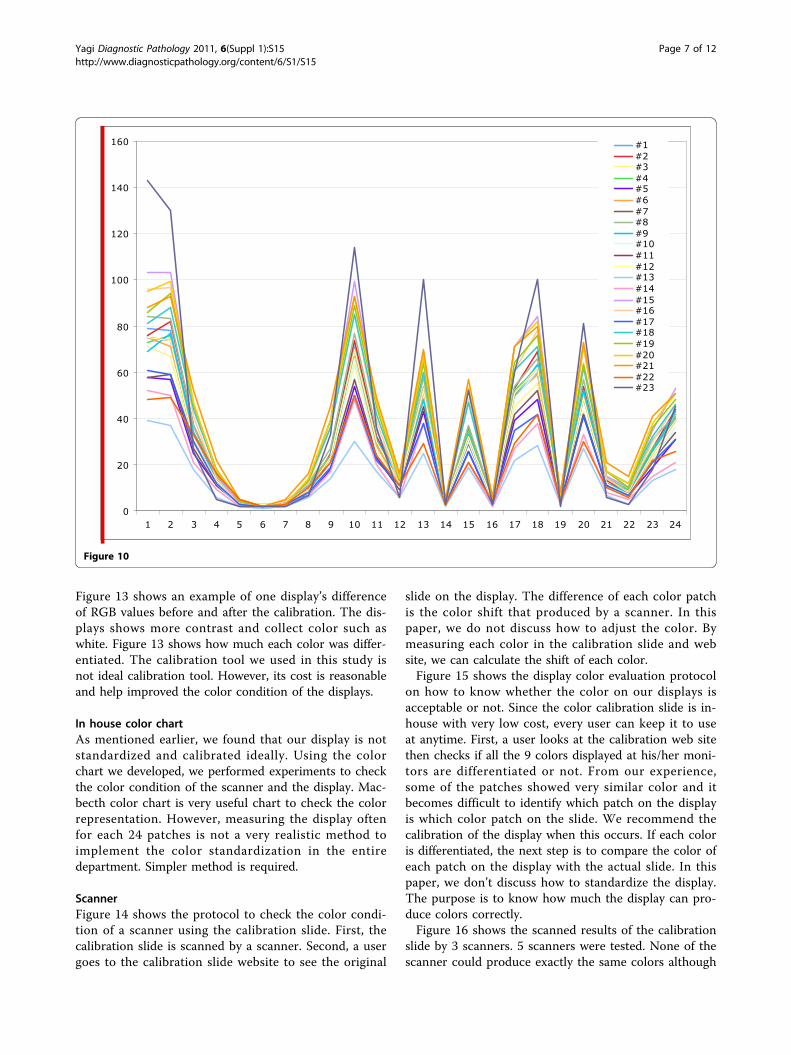
Figure 13 shows an example of one display’s differenceof RGB values before and after the calibration. The dis-plays shows more contrast and collect color such aswhite. Figure 13 shows how much each color was differ-entiated. The calibration tool we used in this study isnot ideal calibration tool. However, its cost is reasonableand help improved the color condition of the displays.
In house color chartAs mentioned earlier, we found that our display is notstandardized and calibrated ideally. Using the colorchart we developed, we performed experiments to checkthe color condition of the scanner and the display. Mac-becth color chart is very useful chart to check the colorrepresentation. However, measuring the display oftenfor each 24 patches is not a very realistic method toimplement the color standardization in the entiredepartment. Simpler method is required.
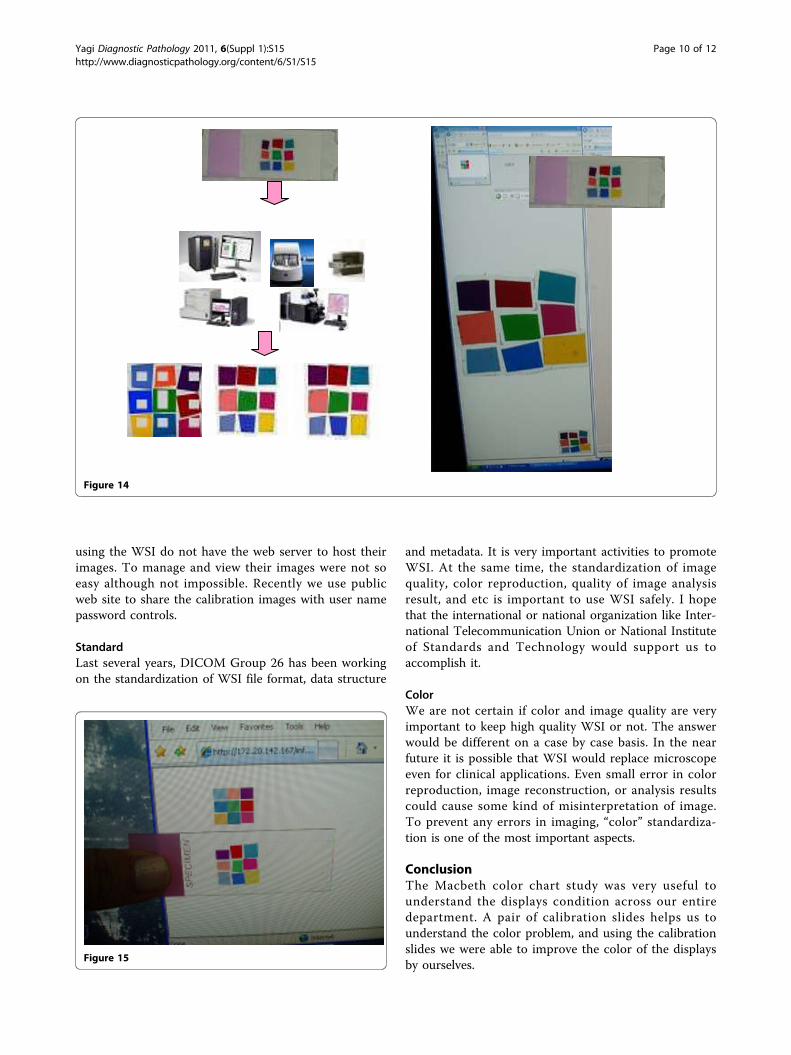
ScannerFigure 14 shows the protocol to check the color condi-tion of a scanner using the calibration slide. First, thecalibration slide is scanned by a scanner. Second, a usergoes to the calibration slide website to see the original
slide on the display. The difference of each color patchis the color shift that produced by a scanner. In thispaper, we do not discuss how to adjust the color. Bymeasuring each color in the calibration slide and website, we can calculate the shift of each color.Figure 15 shows the display color evaluation protocol
on how to know whether the color on our displays isacceptable or not. Since the color calibration slide is in-house with very low cost, every user can keep it to useat anytime. First, a user looks at the calibration web sitethen checks if all the 9 colors displayed at his/her moni-tors are differentiated or not. From our experience,some of the patches showed very similar color and itbecomes difficult to identify which patch on the displayis which color patch on the slide. We recommend thecalibration of the display when this occurs. If each coloris differentiated, the next step is to compare the color ofeach patch on the display with the actual slide. In thispaper, we don’t discuss how to standardize the display.The purpose is to know how much the display can pro-duce colors correctly.Figure 16 shows the scanned results of the calibration
slide by 3 scanners. 5 scanners were tested. None of thescanner could produce exactly the same colors although
Figure 10
Yagi Diagnostic Pathology 2011, 6(Suppl 1):S15http://www.diagnosticpathology.org/content/6/S1/S15
Page 7 of 12
some of scanners have their own calibration material orintegrated a software color calibration function in thesystem.Figure 17 shows the mouse embryo slides which were
sectioned using an automated sectioning machine andstained with H&E by an automated stainer at the sametime.All slides have very close H&E stained appearance and
all slides were scanned at our lab as reference. The pur-pose of these slides is not only for the coloroptimization.Some pathologists are not comfortable to use only the
color patch slide to check the color reproduction eventhough the colors were selected for major histologystained slides. To make a pathologist more comfortable,we use the slides (H&E stained mouse embryo slides) aspart of the color calibration slides. Using the slidescanned image pathologist can look at each componentof each organ if desired. Given the slides, it is easier tounderstand the color shift by time (continuous observa-tion of color condition of a system) than color patch.Although it is more difficult to identify which color
has shifted and how much is the shift compared to thecolor calibration slide, the overall color reproduction iseasier to evaluate with this type of slide.
DiscussionAlthough the methods described in this paper are notideal and there are still some missing components, butthrough the conducted experiments, pathologistsbecome more sensitive to the color of the image andthe color of displays than before. We have been devel-oping the protocol and algorithm for standard slidesand multispectral technologies for color standardizationin relation to WSI such as color standardization forentire process and image quality standardization as well.Staining standardization was not discussed in this paper(we have been having a promising data for H&E stan-dardization). In future, we will integrate these technolo-gies into the WSI system.
SupportOne of the great benefits of WSI is to support develop-ing counties or rural area of pathologists. WSI are beingused for education and remote diagnosis.We will need some kind of method to support the
entire world. We have given some of our calibrationslides to some of the developing countries so that wecan evaluate their image/color quality and also monitorthem over time. One of difficulties we experienced wasseeing their WSI. Some institutions which have been
Figure 11
Yagi Diagnostic Pathology 2011, 6(Suppl 1):S15http://www.diagnosticpathology.org/content/6/S1/S15
Page 8 of 12
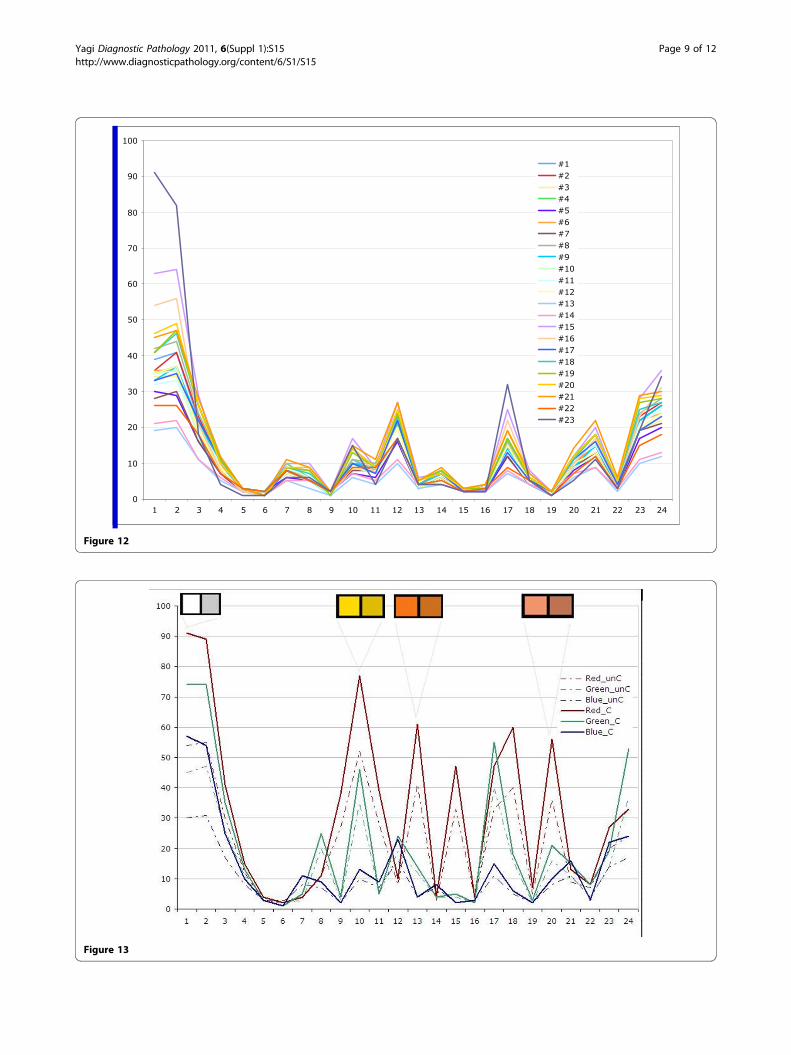
Figure 12
Figure 13
Yagi Diagnostic Pathology 2011, 6(Suppl 1):S15http://www.diagnosticpathology.org/content/6/S1/S15
Page 9 of 12
using the WSI do not have the web server to host theirimages. To manage and view their images were not soeasy although not impossible. Recently we use publicweb site to share the calibration images with user namepassword controls.
StandardLast several years, DICOM Group 26 has been workingon the standardization of WSI file format, data structure
and metadata. It is very important activities to promoteWSI. At the same time, the standardization of imagequality, color reproduction, quality of image analysisresult, and etc is important to use WSI safely. I hopethat the international or national organization like Inter-national Telecommunication Union or National Instituteof Standards and Technology would support us toaccomplish it.
ColorWe are not certain if color and image quality are veryimportant to keep high quality WSI or not. The answerwould be different on a case by case basis. In the nearfuture it is possible that WSI would replace microscopeeven for clinical applications. Even small error in colorreproduction, image reconstruction, or analysis resultscould cause some kind of misinterpretation of image.To prevent any errors in imaging, “color” standardiza-tion is one of the most important aspects.
ConclusionThe Macbeth color chart study was very useful tounderstand the displays condition across our entiredepartment. A pair of calibration slides helps us tounderstand the color problem, and using the calibrationslides we were able to improve the color of the displaysby ourselves.
Figure 14
Figure 15
Yagi Diagnostic Pathology 2011, 6(Suppl 1):S15http://www.diagnosticpathology.org/content/6/S1/S15
Page 10 of 12
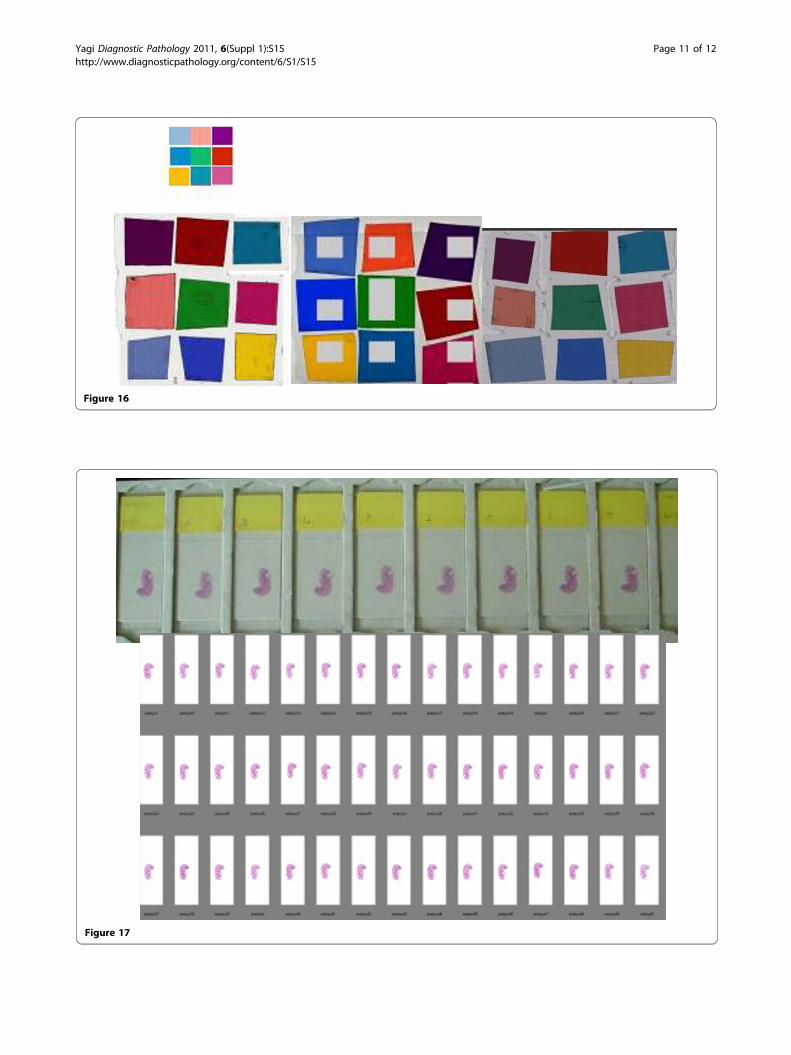
Figure 16
Figure 17
Yagi Diagnostic Pathology 2011, 6(Suppl 1):S15http://www.diagnosticpathology.org/content/6/S1/S15
Page 11 of 12
AcknowledgementsAuthor acknowledge to Ben Baudelet, Pinky A. Bautista, Tokiya Abe, and MarkMerren and Department of Pathology, MGHThis article has been published as part of Diagnostic Pathology Volume 6Supplement 1, 2011: Proceedings of the 10th European Congress onTelepathology and 4th International Congress on Virtual Microscopy. The fullcontents of the supplement are available online at http://www.diagnosticpathology.org/supplements/6/S1
Competing interestsThe authors declare that they have no competing interests.
Published: 30 March 2011
References1. Gilbertson JR, Patel AA, Yagi Y: Clinical slide digitization – whole slide
imaging in clinical practice [chapter]. In Virtual microscopy and virtualslides in teaching, diagnosis and research. Taylor & Francis, Boca Raton;Gu J,Ogilvie RW 2005:.
2. Rojo MG, García GB, Mateos CP, García JG, Vicente MC: Critical comparisonof 31 commercially available digital slide systems in pathology. Int J SurgPathol 2006, 14(4):285-305.
3. Weinstein RS, Graham AR, Richter LC, Barker GP, Krupinski EA, Lopez AM,Erps KA, Bhattacharyya AK, Yagi Y, Gilbertson JR: Overview oftelepathology, virtual microscopy, and whole slide imaging: prospectsfor the future. Hum Pathol 2009, 40(8):1057-69.
4. Tashiro M, Murakami Y, Yamaguchi M, Obi T, Ohyama N, Abe T, Yagi Y:Efficient Implementation of Dye Amount Adjustment in PathologicalImages Using Multispectral Pathological Imaging. Medical ImagingTechnology 2008, 26(4):240-245.
doi:10.1186/1746-1596-6-S1-S15Cite this article as: Yagi: Color standardization and optimization inWhole Slide Imaging. Diagnostic Pathology 2011 6(Suppl 1):S15.
Submit your next manuscript to BioMed Centraland take full advantage of:
• Convenient online submission
• Thorough peer review
• No space constraints or color figure charges
• Immediate publication on acceptance
• Inclusion in PubMed, CAS, Scopus and Google Scholar
• Research which is freely available for redistribution
Submit your manuscript at www.biomedcentral.com/submit
Yagi Diagnostic Pathology 2011, 6(Suppl 1):S15http://www.diagnosticpathology.org/content/6/S1/S15
Page 12 of 12