process capability analysis - sqps ltdsqpsltd.com/wp-content/uploads/2015/05/pca-asq... · process...
TRANSCRIPT
Process Capability Analysis
SQPS, Ltd.
Process Capability AnalysisMustafa Shraim
SQPS, Ltd.
PO Box 218132 . Columbus . Ohio 43221
Tel. 614-208-0815
www.shraimqps.com
April 9, 2013
ASQ-Columbus Section
Purposes of Conducting Capability Analysis
� Quantifying how well customer requirements are met
� Providing R&D the knowledge on how well the current equipment can produce to established tolerances
� Scheduling critical jobs to machines with appropriate capabilities
� Identifying areas requiring improvement

Process Capability Analysis
SQPS, Ltd.
Purposes of Conducting Capability Analysis
- Cont’d
� Monitoring progress over time
� Benchmarking to other processes / industries
� Developing appropriate tolerances based on actual capabilities
� Selecting qualified suppliers
� Deciding on whether or not inspection should be instituted
Focus >>PROCESS
Suppliers Input Process Output Customers
feedbackfeedback
A controlled process results in predictable output

Process Capability Analysis
SQPS, Ltd.
Types of Data
� Process capability can be determined for variable and attribute:� Variable: Data that can be measured on a continuous scale (e.g.
time, length, weight, etc)
� Attribute: Data that can be counted (e.g. defective parts in a lot)� Control Chart Example: p-Chart
Quality Improvement Tools� Commonly-used ones:
� Process Flow Diagram (Flowchart)
� Ishikawa (Cause-and-effect) Diagram
� Checksheet
� Pareto Diagram
� Control Chart
� Scatter Plot
� Histogram
� Design of Experiments
Used in capability analysis

Process Capability Analysis
SQPS, Ltd.
Control Charts
� Identifies variability
� Monitors performance over time
� Allows timely process corrections to prevent defects
� Identifies out-of-control conditions
Histograms
� Display the nature of the distribution
� The central tendency (average) and Spread (variation) can be easily identified
� Spec limits can be used to show capability
Pizza Delivery Times (Oct 2002)
0
2
4
6
8
10
12
14
16
19.5 to
24.5
24.5 to
29.5
29.5 to
34.5
34.5 to
39.5
39.5 to
44.5
44.5 to
49.5
49.5 to
54.5
54.5 to
59.5
59.5 to
64.5
64.5 to
69.5
Delivery Time (Minutes)
Frequency
USL= 50
Cp 0.4
Cpk 0.4
Pp 0.2
Ppk 0.2
Cpm 0.4
Stddev 10.2
Max 65
Min 25
Zbench 0.7
CpkU 0.2
ZTarget 0.5
%Defects 18.0
%PPM 183333.
Expected 256686
Mean 43.3333333
3Median 40
Mode 40

Process Capability Analysis
SQPS, Ltd.
Process Capability for Variable and Attribute
Data
� Variable Data: Process Capability indices were developed for this type of data. Indices show how well the process operate within, or compared, to specifications.
� Attribute Data: This can be viewed as the average proportion or rate of defects or defectives. Also, this can be reported in PPM or DPMO
Capability vs. Performance� Capability analysis is conducted when the process is stable.
The variation measure (standard deviation) is estimated directly from the control chart.
� Performance indices are concerned with the standard deviation of all individual observations.
Process Capability Analysis
SQPS, Ltd.
Current vs. Potential Capability� The process is called “capable” if its spread is smaller than the
tolerance band and it is located within specifications.� If the process spread is within the tolerance but its location is
off target then the process is called “potentially capable.” This means that capability can be realized by only shifting the average so that it is centered.
Selecting Characteristics
� Characteristics for capability analysis should be selected based on importance & relevance.
� Sometimes, important characteristics are labeled “Key”, “Significant”, “Major”, “Special”, etc.
� Goals for capability should be based on:� Past product performance� Current & future customer needs� Current & future competition -through benchmarking-� Other issues include life cycle, RM costs, cost of manufacture, etc..

Process Capability Analysis
SQPS, Ltd.
Is 99% Conformance Good?Based on 99% conformance (source: Measuring Process
Capability, by D. Bothe, McGraw Hill, NY, 1997.). Consider the following numbers based on daily activities:� Unsafe drinking water for 15 minutes � 714 incorrect surgical procedure � 480,000 lost articles of US Mail� 5,280,000 checks deducted from the wrong bank accounts
Process vs. Machine Capability� Machine capability is concerned with the “Machine” or
“equipment” element of the process. When conducting a machine capability study, other elements of the process, including materials, methods, people, and environment, must be held constant throughout the data collection process.
� Information for conducting machine capability analysis can be collected in a relatively short period of time compared to process capability information
Process Capability Analysis
SQPS, Ltd.
Requirements for Conducting
Capability Analysis
� Whether it is process or machine capability, the following are needed:� Stable process –free from assignable causes - (from control charts)� Standard deviation � Average� Specifications
� The standard deviation can be estimated from individual data points or a variable control chart (e.g. X-bar-and-R), depending on the objective of the study
Capability Indices� The most commonly used capability indices are Cp and Cpk.
CR is the inverse of CP or 1/CP� These two measures (Cp and CPk) are used together to give
a full picture about the capability of the process.� Cp compares the tolerance to the process spread while Cpk
determines whether or not the process is centered.� Cpk can never be greater then Cp. When Cp is equal to Cpk,
the process average is exactly on center of specifications.

Process Capability Analysis
SQPS, Ltd.
Capability Indices for 2-Sided Specs
X
σ is the process standard deviation
USL: Upper Specification Limit
LSL: Lower Specification Limit
is the Process Average
CPUSL LSL
=
−
6σ
CPk MinUSL X X LSL
=
− −
3 3σ σ,
2d
R=σ
Table of Constants
Sample Size
A2 D3 D4 d2 E2
2 1.88 0 3.27 1.13 2.66
3 1.02 0 2.57 1.69 1.77
4 0.73 0 2.28 2.06 1.46
5 0.58 0 2.11 2.33 1.29
6 0.48 0 2.00 2.53 1.18
7 0.42 0.08 1.92 2.70 1.11
8 0.37 0.14 1.86 2.85 1.05
9 0.34 0.18 1.82 2.97 1.01
10 0.31 0.22 1.78 3.08 0.98

Process Capability Analysis
SQPS, Ltd.
Capability Indices for One-Sided Specs
CP (Potential) CPk
USL Only
LSL Only
σ3
arg LSLetT −
σ3
argetTUSL −
σ3
LSLX −
σ3
XUSL −
Performance Capability Indices
Pp and Ppk
� Performance capability is normally performed during the development stages
� Pp and Ppk are estimated using the same formula as the Cp and Cpk
� The calculation for the standard deviation in Pp and Ppk is obtained as follows:
1
)(1
2
−
−
=
∑=
n
xxn
i
i
σ

Process Capability Analysis
SQPS, Ltd.
Taguchi Capability Index (Cpm)
� Dr. Genichi Taguchi is well known for his development of Robust Design techniques. His contributions to the field of quality engineering are being used throughout the world
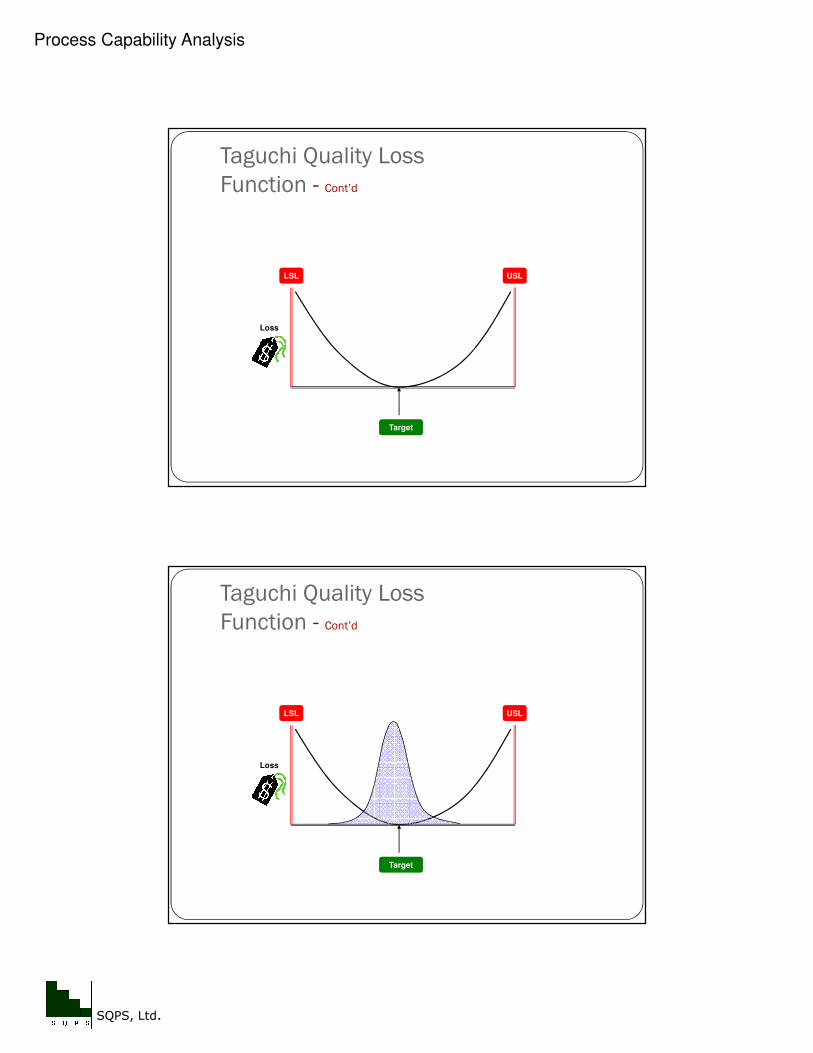
� Taguchi uses the quality loss function to emphasize the importance of being on target
Taguchi Quality Loss
Function - Cont’d
Process Capability Analysis
SQPS, Ltd.
Taguchi Quality Loss
Function - Cont’d
LSL USL
Target
Loss
Taguchi Quality Loss
Function - Cont’d
LSL USL
Target
Loss

Process Capability Analysis
SQPS, Ltd.
Taguchi Quality Loss
Function - Cont’d
LSL USL
Target
Loss ($) B
A
Taguchi Capability Index (Cpm) - Cont’d
� Taguchi’s Quality Loss Function (QLF)
Target
$ Loss
USLLSL
QLF
Process Capability Analysis
SQPS, Ltd.
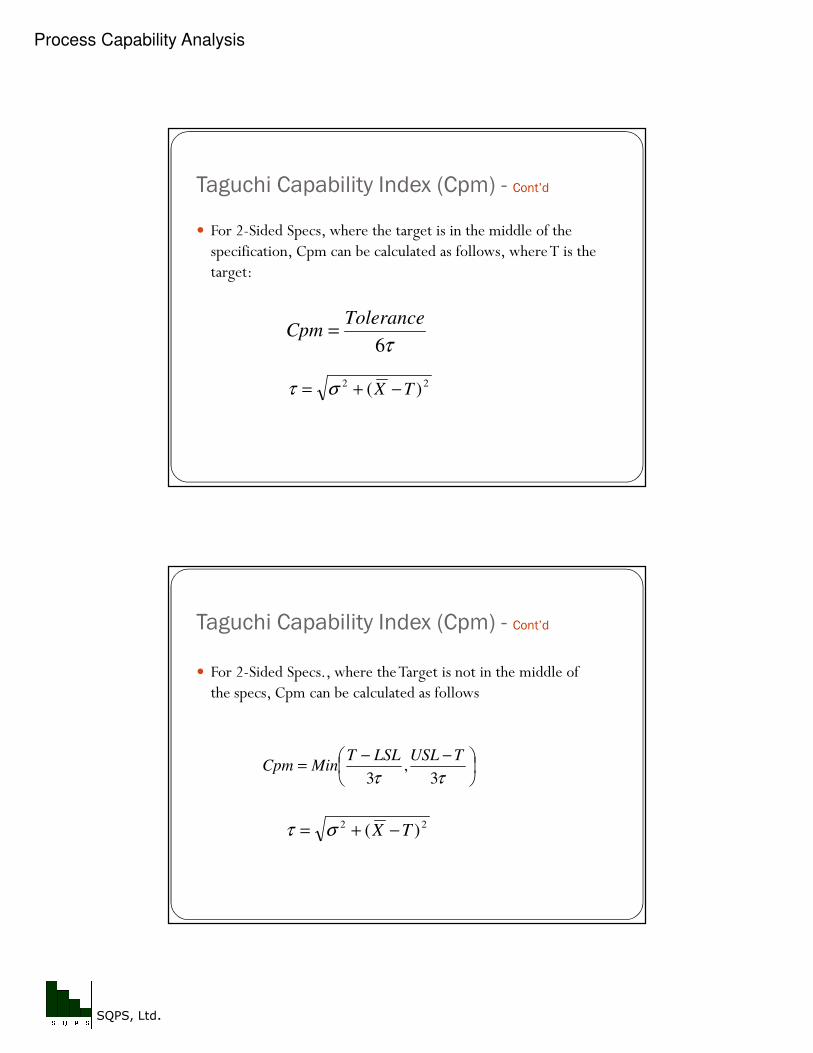
Taguchi Capability Index (Cpm) - Cont’d
� For 2-Sided Specs, where the target is in the middle of the specification, Cpm can be calculated as follows, where T is the target:
τ6
ToleranceCpm =
22)( TX −+= στ
Taguchi Capability Index (Cpm) - Cont’d
� For 2-Sided Specs., where the Target is not in the middle of the specs, Cpm can be calculated as follows
−−=
ττ 3,
3
TUSLLSLTMinCpm
22)( TX −+= στ

Process Capability Analysis
SQPS, Ltd.
Taguchi Capability Index (Cpm) - Cont’d
� For One-Sided Spec., Cpm can be calculated as follows
USL Only
LSL Only
22 )( TX −+= στ
τ3
TUSL −
τ3
LSLT −
Interpretation of Capability Indices
Index Value Interpretation
Less than 1.0 Process is not capable
Between 1.0 and 1.33
Process meets minimum requirements but not acceptable in many industries
Greater than 1.33 Process is capable
Process Capability Analysis
SQPS, Ltd.
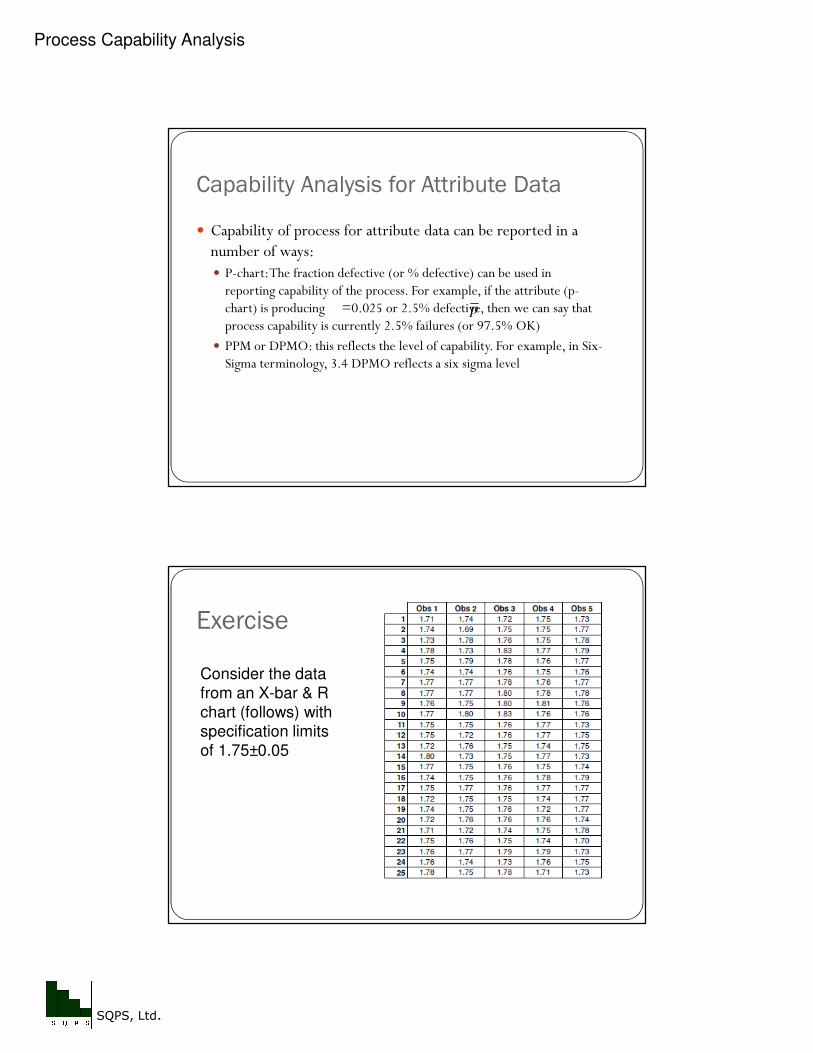
Capability Analysis for Attribute Data
� Capability of process for attribute data can be reported in a number of ways:� P-chart: The fraction defective (or % defective) can be used in
reporting capability of the process. For example, if the attribute (p-chart) is producing =0.025 or 2.5% defective, then we can say that process capability is currently 2.5% failures (or 97.5% OK)
� PPM or DPMO: this reflects the level of capability. For example, in Six-Sigma terminology, 3.4 DPMO reflects a six sigma level
p
Exercise
Consider the data from an X-bar & R chart (follows) with specification limits of 1.75±0.05

Process Capability Analysis
SQPS, Ltd.
Exercise - Cont’d

Process Capability Analysis
SQPS, Ltd.
Catapult Exercise� Use the catapult to simulate a process where the interest is in
the “Distance” in inches. Establish appropriate specs and test the capability of the process.
Capability Analysis and PPM� PPM: Parts Per Million (or defects per million opportunity)
� PPM information can be calculated from capability analysis
� PPM is the sum of proportions falling outside the specification limits
� When the process is normal, predicted PPM figures are close to actual

Process Capability Analysis
SQPS, Ltd.
Where is it used in Six Sigma
projects?
� Define
� Measure
� Analyze
� Improve
� Control
Six Sigma
Target
USLLSL
1.5σ1.5σ
1.5σ Shift Assumed

Process Capability Analysis
SQPS, Ltd.
Six Sigma Overview - Cont’d
� Using the 1.5 standard deviation (σ) shift on either side, the quality levels using Defects Per Million Opportunities (DPMO) or PPM are as follows (one-tail only):
Quality Level DPMO
3-Sigma 66,803
3.5-Sigma 22,800
4-Sigma 6,200
4.5-Sigma 1,350
5-Sigma 233
5.5-Sigma 32
6-Sigma 3.4
CP=2.0
CPk=1.5
SQPS, Ltd.
Tel. 614-245-0503
www.shraimqps.com