process characterization of silver iodide-silver ......process characterization of silver...
TRANSCRIPT
Process Characterization of Silver Iodide-Silver Metaphosphate Ionic Glass Molding for Solid
State Superionic Stamping
by
Gautam Panikkar
A Thesis Presented in Partial Fulfillment of the Requirements for the Degree
Master of Science
Approved June 2015 by the Graduate Supervisory Committee:
Keng Hsu, Chair Hanqing Jiang Candace Chan
ARIZONA STATE UNIVERSITY
August 2015
i
ABSTRACT
In this research work, the process optimization of silver iodide-silver meta phosphate
ionic glass molding for solid state super ionic stamping was performed. Solid state super ionic
stamping is a process of all solid ambient condition electrochemical nano patterning technique. In
solid state super ionic stamping, anodic dissolution on a solid electrolyte –metal interface and
subsequent charge-mass transport in the solid electrolyte is used for obtaining nanometer
features on the metallic surface. The solid electrolyte referred to as the stamp is pre-patterned
with features to be obtained on the metallic surface. This research developed the process for
obtaining stamp with specific dimensions by making use of compression molding. The
compression molding process was optimized by varying the five process parameters-
temperature, pressure, holding time, pressing time and cooling time. The objective of the process
optimization was to obtain best geometrical features for the stamp including flatness and surface
roughness and by optimizing the compression molding process, stamp with minimum flatness
and surface roughness was obtained. After the experimental optimization of the process was
completed, statistical analysis was performed to understand the relative significance of the
process parameters and the interaction of the process parameters on the flatness and surface
roughness values of the molded stamp. Structural characterization was performed to obtain the
variation of average domain size of ionic glass particles within the molded glass disk by varying
the process parameters of holding time, pressing time and cooling time.

ii
ACKNOWLEDGMENTS
I sincerely thank my advisor, Professor Keng Hsu, for providing me an opportunity to
work with him. And also for his incessant support and help in each and every mode of my project
work. I would have never completed this work, without his help. He has not only helped me in my
project, but guided my coursework in the best possible way.
I would also like to thank Professor Hanqing Jiang and Professor Candace Chan for taking some
time from their busy schedule to be a part of my supervisory committee. I would like to thank
National Science Foundation for supporting me financially throughout the project.
I would like to thank the instrument shop supervisor, Mr. Osama Jameel, for his
persistent help in conducting my experiments and allowing me to use the facilities as per my
convenience. I would also like to thank Anagh Deshpande and Varun Subramoniam, for his
continuous efforts in strengthening my knowledge required for my research work.
Finally I would like to thank all my friends and family for all their help and support.
iii
TABLE OF CONTENTS
Page
LIST OF TABLES ............................................................................................................................ vi
LIST OF FIGURES ......................................................................................................................... vii
CHAPTER
1. INTRODUCTION .................................................................................................................... 1
Objective of This Research ......................................................................................................... 2
2. LITERATURE REVIEW .......................................................................................................... 4
Current Techniques of Nano Patterning...................................................................................... 4
Overview of Solid State Super Ionic Stamping (S4) Process ..................................................... 8
3. EXPERIMENTAL SETUP AND DESIGN .............................................................................. 12
Ionic Glass Synthesis Process .................................................................................................. 12
Synthesis of Agpo3 Glass ...................................................................................................... 12
Synthesis of Agi-Agpo3 Glass ................................................................................................ 13
Formation of Stamp ................................................................................................................... 14
Comparison of Injection Molding & Compression Molding .................................................... 14
Feasibility Study Using a Manual Hydraulic Press ................................................................ 15
Dimensions of Ionic Glass Disk ............................................................................................. 16
Determination of Molding Temperature ................................................................................. 17
Determination of Molding Pressure ....................................................................................... 18
Electric Hydraulic Press for Compression Molding................................................................ 20
Stages of Compression Molding For Ionic Glass Disk .......................................................... 21
Grinding of Synthesized Glass ......................................................................................... 22
Selection and Application of Non-Sticking Agent ............................................................. 22
Pre-Heating of the Setup .................................................................................................. 25
Holding Period .................................................................................................................. 25
iv
CHAPTER Page
Application of the Pressure Along With Temperature-Compression Stage ..................... 26
Cooling and Demolding .................................................................................................... 27
Process Parameters for Compression Molding Of Ionic Glass ............................................. 27
Properties of Silver Iodide-Silver Metaphosphate Glass........................................................... 28
Ionic & Electrical Properties ................................................................................................... 28
Mechanical Properties ........................................................................................................... 29
Geometrical Characterization ................................................................................................ 32
Measurement of Flatness ...................................................................................................... 34
Measurement of Surface Roughness .................................................................................... 35
Structural Characterization ........................................................................................................ 37
4. RESULTS.............................................................................................................................. 42
RBS Analysis of Synthesized Glass .......................................................................................... 42
Geometrical Characterization .................................................................................................... 43
Flatness Vs Cooling Time ...................................................................................................... 43
Flatness Vs Pressing Time .................................................................................................... 47
Surface roughness vs cooling time ........................................................................................ 50
Surface Roughness Vs Pressing Time .................................................................................. 52
Statistical Analysis ..................................................................................................................... 54
Flatness ................................................................................................................................. 54
Surface Roughness ............................................................................................................... 59
Structural Characterization ........................................................................................................ 65
5. FUTURE WORK ................................................................................................................... 71
6. SUMMARY ............................................................................................................................ 72
REFERENCES .............................................................................................................................. 74

v
Page
APPENDIX A ................................................................................................................................. 75
STRUCTURAL CHARACTERIZATION .................................................................................... 75

vi
LIST OF TABLES
Table Page 1: Number Of Glass Disk Pieces At Different Molding Temperatures .......................................... 17
2: Number Of Glass Disk Pieces At Different Molding Pressures ................................................ 19
3: Process Parameters With Their Experimental Values ............................................................. 28
4: Process Parameters With Low And High Limits ....................................................................... 37
5: Flatness Values With Cooling Times For Different Holding Times .......................................... 44
6: Flatness Values With Pressing Times For Different Holding Times ......................................... 48
7: Surface Roughness Values With Cooling Times For Different Holding Times ........................ 50
8: Surface Roughness Values With Pressing Times For Different Holding Times ...................... 52
9: Flatness Values For The Full Factorial DOE Experiment ........................................................ 55
10: Parameter Estimates For Flatness ......................................................................................... 56
11: Surface Roughness Values For The Full Factorial DOE Experiment .................................... 59
12: Parameters Estimates For Surface Roughness ..................................................................... 60
13: Optimum Properties For Minimum Flatness And Surface Roughness................................... 64
14: Average Domain Size Of Ionic Glass Particles In Four Directions ......................................... 69
15: DOE Experiment For Average Domain Size .......................................................................... 69
vii
LIST OF FIGURES
Figure Page 1: Steps In Nano Lithography Process (Alongkorn & Werayut, 2012) ........................................... 5
2: Representation Of Thermal Nano-Imprint Lithography Process (Pessa, 2010) ......................... 6
3: Typical Setup Of An Electron Beam Lithography System (Coane) ............................................ 7
4: Schematic Of S4 Process (Hsu, 2009) ..................................................................................... 10
5: Synthesized Clear Agpo3 Glass ............................................................................................... 13
6: Synthesized Agi-Agpo3 Glass .................................................................................................. 14
7: Manual Hydraulic Press With Aluminum Dies .......................................................................... 16
8: Experimental Determination Of Molding Temperature ............................................................. 18
9: Experimental Determination Of Molding Pressure ................................................................... 19
10: 20t Desktop Electric Hydraulic Press With The Heated Dry Pressing Die Set Cylinder ........ 21
11: Powdered Synthesized Agi-Agpo3 Glass ............................................................................... 22
12: Application Of Silver Solution To The Stainless Steel Dies ................................................... 24
13: The Die Setup ......................................................................................................................... 25
14: Stress-Strain Curve For Brittle And Ductile Materials ............................................................ 29
15: Toughness Curve ................................................................................................................... 30
16: Variation Of Stiffness With Temperature ................................................................................ 31
17: Surface Profile Indicating Flatness And Roughness .............................................................. 32
18: The Dial Gauge Pointer In Contact With The Surface Of Glass Disk .................................... 34
19: The Dial Gauge Measuring Flatness Of Glass Disk ............................................................... 34
20: The Glass Disk Placed On Three Stands For Measuring Flatness ........................................ 35
21: Profilometer Measuring Surface Roughness .......................................................................... 36
22: 3-D Surface Plot Of The Grayscale Image Of Light Source ................................................... 40
23: Intensity Distribution Plot Of The Light Source ....................................................................... 40
24: Rbs Results For Agi-Agpo3 .................................................................................................... 42
25: Variation Of Flatness With Cooling Time ............................................................................... 44
viii
Figure Page
26: Variation Of Specific Volume During Cooling Of A Glass-Forming And Non-Glass-Forming
Liquid (Jain And Yi, 2006) ............................................................................................................. 46
27: Variation Of Flatness With Pressing Time .............................................................................. 48
28: Variation Of Surface Roughness With Cooling Time ............................................................. 51
29: Variation Of Surface Roughness With Pressing Time ........................................................... 53
30: Actual Vs Predicted Plot For Flatness .................................................................................... 57
31: Residuals Vs Predicted Plot For Flatness .............................................................................. 57
32: Interaction Plots For The Flatness Doe Experiment .............................................................. 58
33: Predicted Vs Actual Plot For Surface Roughness .................................................................. 61
34: Residuals Vs Predicted Plot For Surface Roughness ............................................................ 61
35: Interaction Plots For The Surface Roughness Doe Experiment ............................................ 62
36: Rgb Image Of Molded Glass Disk .......................................................................................... 65
37: Gray Scale Image Of The Molded Glass Disk ........................................................................ 65
38: 3-D Surface Plot Of The Molded Glass Disk .......................................................................... 66
39: Four Directions For Intensity Measurement ........................................................................... 66
40: Intensity Distribution Plot For Molded Glass Disk Without Filtration ...................................... 67
41: Intensity Distribution Plot With Filtration ................................................................................. 68
42: Gray Scale Image Of Led Light Source .................................................................................. 76
43: Intensity Distribution Plot Without Filteration-2 ....................................................................... 78
44: Intensity Distribution Plot With Filteration-2 ............................................................................ 78
45: Intensity Distribution Plot Without Filteration-3 ....................................................................... 79
46: Intensity Distribution Plot With Filteration-3 ............................................................................ 79
47: Intensity Distribution Image Without Filteration-4 ................................................................... 80
48: Intensity Distribution Image With Filteration-4 ........................................................................ 80
49: Intensity Distribution Plot Without Filtration-Sample2direction1 ............................................. 81
50: Intensity Distribution Plot With Filtration-Sample2direction1 .................................................. 81
51: Intensity Distribution Plot Without Filtration-Sample2direction2 ............................................. 82
ix
Figure Page
52: Intensity Distribution Plot With Filtration-Sample2direction2 ................................................... 82
53: Intensity Distribution Plot Without Filtration-Sample2direction3 ............................................. 83
54: Intensity Distribution Plot With Filtration-Sample2direction3 .................................................. 83
55: Intensity Distribution Plot Without Filtration-Sample2direction4 ............................................. 84
56: Intensity Distribution Plot With Filtration-Sample2direction4 .................................................. 84
57: Intensity Distribution Plot Without Filtration-Sample3direction1 ............................................. 85
58: Intensity Distribution Plot With Filtration-Sample3direction1 .................................................. 85
59: Intensity Distribution Plot Without Filtration-Sample3direction2 ............................................. 86
60: Intensity Distribution Plot With Filtration-Sample3direction2 .................................................. 86
61: Intensity Distribution Plot Without Filtration-Sample3direction3 ............................................. 87
62: Intensity Distribution Plot With Filtration-Sample3direction3 .................................................. 87
63: Intensity Distribution Plot Without Filtration-Sample3direction4 ............................................. 88
64: Intensity Distribution Plot With Filtration-Sample3direction4 .................................................. 88
65: Intensity Distribution Plot Without Filtration-Sample4direction1 ............................................. 89
66: Intensity Distribution Plot With Filtration-Sample4direction1 .................................................. 89
67: Intensity Distribution Plot Without Filtration-Sample4direction2 ............................................. 90
68: Intensity Distribution Plot With Filtration-Sample4direction2 .................................................. 90
69: Intensity Distribution Plot Without Filtration-Sample4direction3 ............................................. 91
70: Intensity Distribution Plot With Filtration-Sample4direction3 .................................................. 91
71: Intensity Distribution Plot Without Filtration-Sample4direction4 ............................................. 92
72: Intensity Distribution Plot With Filtration-Sample4direction4 .................................................. 92
73: Intensity Distribution Plot Without Filtration-Sample5direction1 ............................................. 93
74: Intensity Distribution Plot With Filtration-Sample5direction1 .................................................. 93
75: Intensity Distribution Plot Without Filtration-Sample5direction2 ............................................. 94
76: Intensity Distribution Plot With Filtration-Sample5direction2 .................................................. 94
77: Intensity Distribution Plot Without Filtration-Sample5direction3 ............................................. 95
78: Intensity Distribution Plot With Filtration-Sample5direction3 .................................................. 95
x
Figure Page
79: Intensity Distribution Plot Without Filtration-Sample5direction4 ............................................. 96
80: Intensity Distribution Plot With Filtration-Sample5direction4 .................................................. 96
81: Intensity Distribution Plot Without Filtration-Sample6direction1 ............................................. 97
82: Intensity Distribution Plot With Filtration-Sample6direction1 .................................................. 97
83: Intensity Distribution Plot Without Filtration-Sample6direction2 ............................................. 98
84: Intensity Distribution Plot With Filtration-Sample6direction2 .................................................. 98
85: Intensity Distribution Plot Without Filtration-Sample6direction3 ............................................. 99
86: Intensity Distribution Plot With Filtration-Sample6direction3 .................................................. 99
87: Intensity Distribution Plot Without Filtration-Sample6direction4 ........................................... 100
88: Intensity Distribution Plot With Filtration-Sample6direction4 ................................................ 100
89: Intensity Distribution Plot Without Filtration-Sample7direction1 ........................................... 101
90: Intensity Distribution Plot With Filtration-Sample7direction1 ................................................ 101
91: Intensity Distribution Plot Without Filtration-Sample7direction2 ........................................... 102
92: Intensity Distribution Plot With Filtration-Sample7direction2 ................................................ 102
93: Intensity Distibution Plot Without Filtration-Sample7direction3 ............................................ 103
94: Intensity Distribution Plot With Filtration-Sample7direction3 ................................................ 103
95: Intensity Distribution Plot Without Filtration-Sample7direction4 ........................................... 104
96: Intensity Distribution Plot With Filtration-Sample7direction4 ................................................ 104
97: Intensity Distribution Plot Without Filtration-Sample8direction1 ........................................... 105
98: Intensity Distribution Plot With Filtration-Sample8direction1 ................................................ 105
99: Intensity Distribution Plot Without Filtration-Sample8direction2 ........................................... 106
100: Intensity Distribution Plot With Filtration-Sample8direction2 .............................................. 106
101: Intensity Distribution Plot Without Filtration-Sample8direction3 ......................................... 107
102: Intensity Distribution Plot With Filtration-Sample8direction3 .............................................. 107
103: Intensity Distribution Plot Without Filtration-Sample8direction4 ......................................... 108
104: Intensity distribution plot with filtration-Sample8Direction4 ................................................ 108
1
1. INTRODUCTION
The unique nature of ionic transport is responsible for a large number of physical and chemical
processes and along with the coupled mass-charge transport has a wide range of applications in
manufacturing processes. Traditionally it was the liquid electrolytes which possessed the features
of ionic transport and used in a lot of applications but recent advances have demonstrated this
capability for materials like polymer, ionic glass and crystalline solids.
Similar to liquid electrolytes, solid electrolytes like ionic glass have the capability of dissolving
metal substrates when the solid electrolyte is in contact with the metallic surface and an electric
potential is applied between the two surfaces. This property of controlled dissolution of a metallic
surface in contact with a solid electrolyte and the coupled charge mass-transport in the solid
electrolyte is used in a new type of nano patterning technique called solid state super ionic
stamping process. The advantage of using a solid electrolyte compared to a liquid is that while
using a liquid electrolyte, it can affect the distribution of current and also result in non-uniform
etching whereas the structural integrity of the solid electrolyte results in it being a very good
candidate to be used for the patterning process.
The conventional process of patterning techniques used mainly various lithographic techniques
which are expensive, time consuming, requires difficult setup and hence in order to overcome
these disadvantages, solid state super ionic stamping is an effective method of performing
patterning by controlled dissolution of metal on a solid-electrolyte metal interface and the coupled
charge-mass transport in the solid electrolyte. In performing the solid state super ionic stamping
process, the pre-patterned solid electrolyte is responsible for transferring the patterns to the
metallic surface.
2
Objective of This Research
In this research work, a new process is developed for manufacturing of the solid state electrolyte
stamp by making use of compression molding technique. The solid state electrolyte stamp is
required to have specific dimensional configuration and geometrical features.
The solid state super ionic material used in this research work was a silver iodide-silver meta
phosphate glass which was first synthesized. This synthesized silver iodide-silver meta
phosphate glass was then made into a circular disk with specified dimensions by using the
compression molding process.
The five process parameters were determined for the compression molding process which
included temperature, pressure, holding time, pressing time and cooling time. The two process
parameters, temperature and pressure were determined independently to obtain the molded
glass disk as one single piece and the lowest temperature and pressure at which this was
achieved was used as the molding temperature and pressure. The other three process
parameters were varied to understand the effects of the parameters on the final geometry of the
molded ionic glass disk. The geometrical features that was measured to quantify the molded
glass disk was the flatness and surface roughness of the molded glass disk. The process
parameters of holding time, pressing time and cooling time was varied to obtain a molded glass
disk with minimum flatness and surface roughness.
A set of experiments was then designed according to Taguchi’s Design of Experiments and
performed and statistical analysis was performed to understand the relative significance of the
process parameters and the interaction of parameters on the final geometry of the molded glass
disk. Structural characterization was performed by taking digital transmission images of the
molded glass disk and intensity plots were obtained using which the average domain size of the
particles was calculated.

3
The thesis report proceeds in the following manner:
• The introduction of the project is described in Chapter 1, where the need and significance
of the project is explained.
• The current techniques pertaining to the field of nano patterning is described in detail in
Chapter 2 along with the basics of solid state super ionic stamping process.
• Chapter 3 talks about the experimental setup and work completed.
• The first section explains the process for synthesizing the ionic glass to be used as the
solid electrolyte stamp.
• The second section explains in detail about the compression molding process for the
formation of stamp and the steps involved in the process and also the determination of
process parameters.
• The third section talks about the geometrical characterization and fourth section explains
about the structural characterization.
• The experimental data and results along with discussions are shown in Chapter 4.
• The thesis report is concluded in Chapter 5 with summary.
4
2. LITERATURE REVIEW
Patterning is a process of manufacturing technology in which patterns or structures are created
on the surface of a material referred to as the substrate by different techniques. Traditionally,
patterning is performed by using a fabrication technique known as lithography. Lithography
makes use of light to transfer a geometric pattern from a mask to a light-sensitive resist on the
substrate and lithography has been used for creating extremely small patterns (down to a few
tens of nanometers in size). Lithographic techniques can be performed through either additive or
subtractive technique. In the additive technique, referred to as lift-off the patterns are created on
the substrate by using a photo resist which acts as the sacrificial layer. Lift off can be used for a
range of scale from micrometers to nanometers but it is widely used for micrometer scales. In the
subtractive technique of lithography, patterns are created on the surface of a substrate by
removal of material from the substrate and the regions of the substrate which are not to be
patterned are covered with a mask.
Current Techniques of Nano Patterning
The different types of lithography techniques being used for nano patterning are explained below.
Nano lithography is the process of patterning features by having a resist material which is mostly
a polymeric material and exposing the resist to a quantum of energy like photons or particle
radiation. The resist is exposed to these radiations by a mask which will separate the exposed
and unexposed regions. These resist materials will undergo a structural or chemical change on
exposure to the radiation, as a result of which it will a different solubility as compared to the
unexposed regions. The resists are mainly of two types, those whose solubility increases on
exposure is called positive resist and if the solubility decreases on exposure, they are called
negative resists. There are different techniques for performing nanolithography and prominent
among them is optical nanolithography. In optical nanolithography, a substrate material is coated
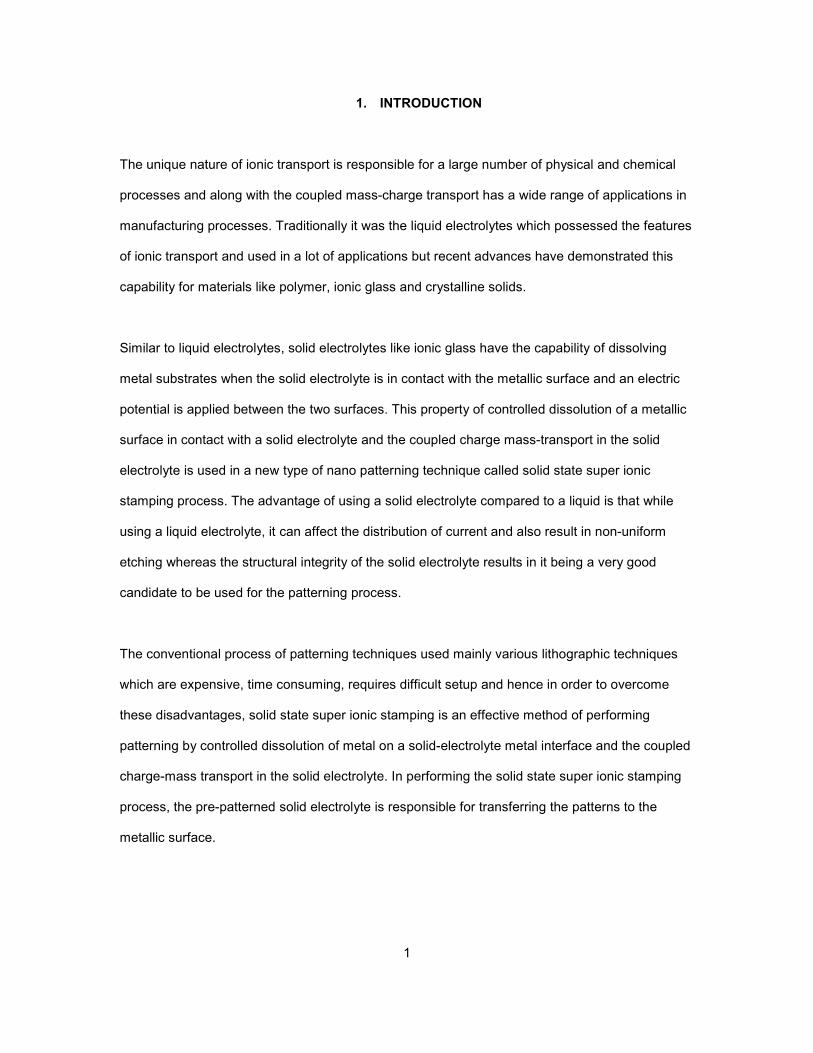
5
with a photosensitive film which acts as the resist. Light is allowed to pass through a photomask
on to the photo resist and the regions on the resist that are exposed will become either soluble or
insoluble depending on the properties of the resist. Light will transfer the pattern on the
photomask to the resist and further steps including metal deposition and etching are used to
transfer the patterns to the substrate (Srituravanich and Pimpin 2012).
Figure 1: Steps in Nano lithography process (Alongkorn & Werayut, 2012)
Other types of lithographic techniques that are being used include nanoimprint lithography,
electron beam lithography and interference lithography.
Nanoimprint lithography is the process of nanolithography in which patterns are first created by
mechanical deformation of imprint resist and then followed by the second step of subsequent
etching process. Nanoimprint lithography is mainly of two types and they are thermoplastic
nanoimprint lithography and photo nanoimprint lithography (Viheriälä, et al. 2010).
In thermoplastic nanoimprinting lithography, a thin layer of thermoplastic polymer is used as the
photoresist and it is coated on to the substrate. The patterned mold is kept in contact with the
substrate under pressure. On application of temperatures above the transition temperature of the
thermoplastic polymer the pattern on the mold is transferred to the thin photoresist. Once the
entire setup is cooled down to room temperature, the mold is removed from the setup and a
subsequent process is used to transfer the pattern on resist to the substrate (Viheriälä, et al.
2010).

6
Figure 2: Representation of Thermal Nano-imprint Lithography Process (Pessa, 2010)
In photo nanoimprint lithography, mold is usually made up of transparent materials and a UV
curable resist is made use of. Similar to the previous process, the mold and the substrate are
kept in contact under pressure and the resist is cured in UV light and as a result of which it
becomes solid. The mold is then separated from the setup and pattern transferring process is
used to transfer the pattern on the resist onto the substrate (Viheriälä, et al. 2010).
In electron beam lithography, a focused beam of electrons is used to create patterns on the
resist. As a result of focusing a beam of electrons onto the resist, the solubility of the resist
changes and hence it enables selective removal of the exposed or unexposed areas of the resist
by further processing. This is a type of mask less lithography and has extremely high resolution
but allows only low-volume production due to low throughput. Some of the disadvantages of this
process is that it is not a very efficient process for industrial purposes, time consuming and takes
several hours to pattern an entire surface, the machines and setup is highly expensive and
comes to millions of dollars (Viheriälä, et al. 2010).
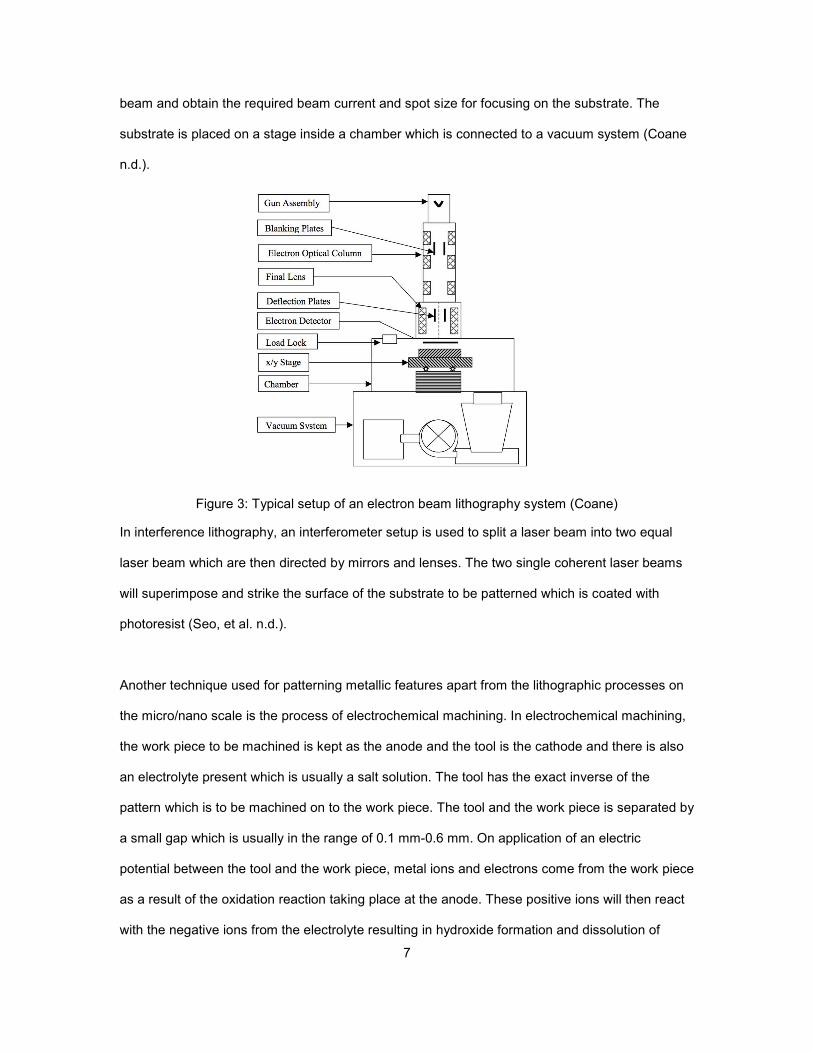
In the setup for electron beam lithography system, the gun assembly is the part which is used for
the electron beam production and it is then passed through the optical column so as to modify the
7
beam and obtain the required beam current and spot size for focusing on the substrate. The
substrate is placed on a stage inside a chamber which is connected to a vacuum system (Coane
n.d.).
Figure 3: Typical setup of an electron beam lithography system (Coane)
In interference lithography, an interferometer setup is used to split a laser beam into two equal
laser beam which are then directed by mirrors and lenses. The two single coherent laser beams
will superimpose and strike the surface of the substrate to be patterned which is coated with
photoresist (Seo, et al. n.d.).
Another technique used for patterning metallic features apart from the lithographic processes on
the micro/nano scale is the process of electrochemical machining. In electrochemical machining,
the work piece to be machined is kept as the anode and the tool is the cathode and there is also
an electrolyte present which is usually a salt solution. The tool has the exact inverse of the
pattern which is to be machined on to the work piece. The tool and the work piece is separated by
a small gap which is usually in the range of 0.1 mm-0.6 mm. On application of an electric
potential between the tool and the work piece, metal ions and electrons come from the work piece
as a result of the oxidation reaction taking place at the anode. These positive ions will then react
with the negative ions from the electrolyte resulting in hydroxide formation and dissolution of
8
metal as precipitate. The unwanted machining products including the metal that is being
dissolved is removed by flushing electrolytes between the tool and work piece so as to avoid any
formation of short circuits between the tool and the work piece. There must be a proper pump
system so that there is constant recycling of electrolyte in the system and the electrolyte also
removes heat and bubbles formed. The gap between the tool and the work piece needs to be
accurately controlled and the tool is fed into the work piece for material removal. There can be
different configurations for electrochemical machining, i.e we could have the tool stationary and
the work piece moving, the work piece stationary and the tool moving or both the work piece and
the tool moving. (Sundarrram 2008).
The process of performing electrochemical machining for fabricating microstructures is known as
Electrochemical micromachining. In electrochemical micromachining, the removal of material
from the work piece takes place atom by atom. There are several advantages of this process
which includes no tool wear as there is no contact between the tool and the work piece, no
generation of heat during the machining process, high material removal rate and also results in a
stress free machined surface. However there are quite a few disadvantages like there needs to
be accurate control of the small distance between the tool and electrolyte, tool structure and
unwanted material removal (Sundarrram 2008).
Overview of Solid State Super Ionic Stamping (S4) Process
In the various lithographic techniques discussed above, all of the processes is completed in two
stages which includes a process of exposure first which is then followed by the development. The
two stages in the process add to a lot of sequential steps for the final completion of the fabrication
and hence it is both a time consuming and expensive process.
In the early days of micro fabrication, the resolution of the process was achieved by using lamp
based lithography tools which had enough resolution and range to meet the industry needs which

9
was about 0.5 micrometer in the 90s. With the rapid advancement in the electronics industry,
laser based lithography techniques were introduced which have been able to develop features
sizes in the range of 50 nm but these required extreme UV radiations which are of high energy.
There are several disadvantages for these extreme UV radiation based lithography which
includes the need for a vacuum atmosphere, more heating and the shorter wavelength also
causes light scattering issues which results in the need for more control with optics so as to
improve the image quality (Viheriälä, et al. 2010).
In order to overcome all the above drawbacks, ionic transport and coupled-charge mass
phenomena in solid electrolyte is developed so as to obtain features with a wide range of
resolution. Ionic transport is responsible for various phenomena and traditionally, ionic transport
was observed mainly in liquid electrolytes but there were drawbacks for liquid electrolytes which
included limited temperature ranges during which it remained stable. In order to overcome this,
ion conducting solids was discovered and the initial materials which were used included alkali and
silver halides. These halides had very low ionic conductivity and hence they could not be used to
replace the liquid aqueous electrolytes which has very high ionic conductivity. Towards the end of
1960s, solid systems which showed high conductivity was discovered. A number of ionic solids
with high conductivity due to the presence of mobile ion species like H+, Li+, Na+, Ag+ and Cu+
have been found out since then. These ionic solids are called super ionic solids or solid
electrolytes (H.Hsu 2009).
Solid state super ionic stamping process is an electrochemical nano patterning process in which
we make use of the property of ionic transport along with coupled-charge mass transport of a
solid electrolyte. The advantage of using a solid electrolyte was that unlike in liquid electrolytes
where the flow of electrolytes affects the current distribution and results in non-uniform etching,
solid electrolytes have a good structural integrity. The entire stamping process is completed in a
single step where the stamp is first patterned and then the stamp is brought into contact with the
substrate to be patterned. The substrate to be patterned is selected as the anode and a metal

10
electrode on the back of the solid electrolyte stamp acts as the cathode. The stamp which is the
solid electrolyte or super ionic conductor is pre-patterned with features which need to be
patterned on the substrate. On application of an electrical bias with the above anode and cathode
materials, an electrochemical reaction takes place at the interface between the super ionic
conductor and the substrate at the point of contact and when the pre-patterned super ionic
conductor is brought into contact with the substrate to be patterned, anode reaction takes place
where by the oxidation of the substrate material takes place resulting in the formation of mobile
cations. These mobile cations will migrate through the solid electrolyte where they combine with
electrons. As a result of this process, patterns are transferred from the pre-patterned conductor
onto the substrate and the process is completed. By controlling the electric potential, the
movement of charge carries can be accurately controlled and it is the movement of charge
carriers that is responsible for the electrochemical reactions and the dissolution of the substrate
resulting in the formation of patterns. Unlike in electrochemical machining processes where due
to current distribution being uneven, there are pattern transfer fidelity issues observed whereas
since in the solid state super ionic stamping process, etch control is by contact and this results in
very good control and resolution for the process and good pattern transfer fidelity (H.Hsu 2009).
Figure 4: Schematic of S4 process (Hsu, 2009)
11
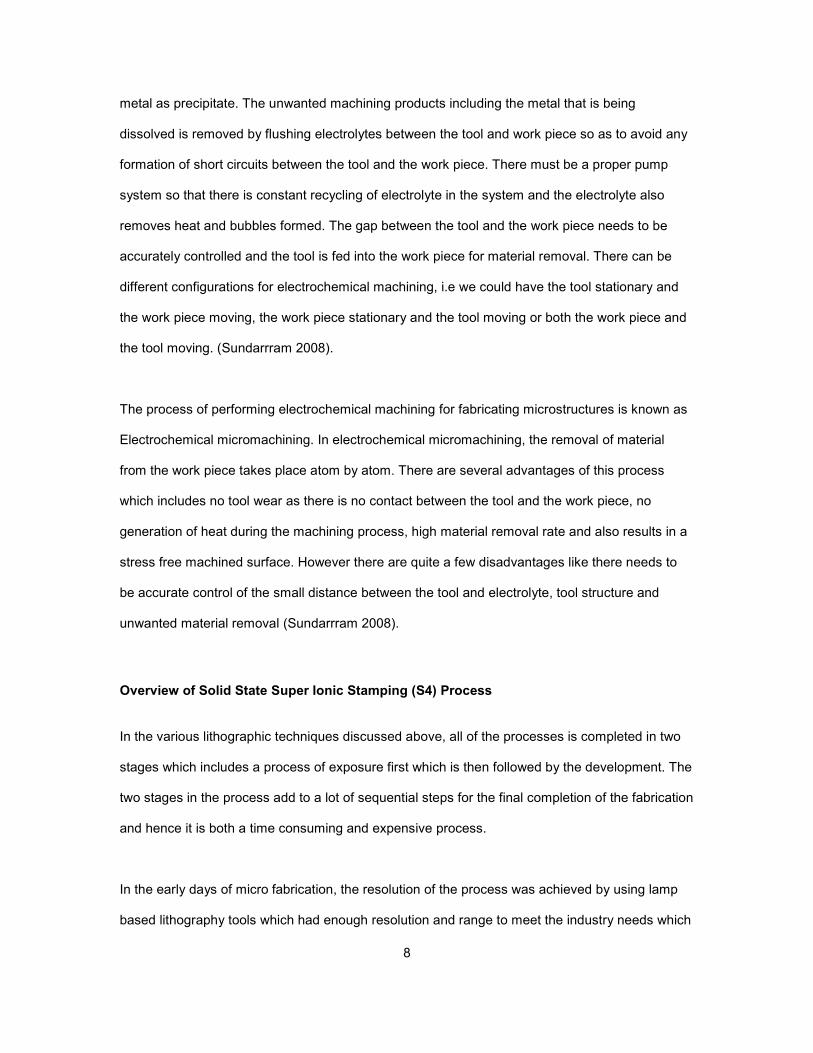
In the figure above, a solid state super ionic conductor made of Ag2S which is pre-patterned is
brought into contact with a silver (Ag) film which is to be patterned. The anode here is the Ag film
on a SiO2 substrate and the cathode is Ag2S.When the Ag2S is brought into contact with the Ag
film by application of a small pressure and when an electrical potential is applied, an
electrochemical reaction takes place at the interface between anode and cathode resulting in the
transfer of patterns from Ag2S onto the Ag film (H.Hsu 2009).
Compared to the lithographic and electrochemical techniques which are multi-step processes,
time consuming, requires expensive instrumentation and the process control to achieve smaller
resolutions is difficult, solid state super ionic stamping process can be completed in a single step,
is a quick process and requires only basic and cheaper setup. Moreover since in the solid state
super ionic stamping process, the etch control in the substrate is by contact of the solid
electrolyte and the substrate and movement of each ions and electrons as a result of
electrochemical reaction can be accurately controlled by the application of electric potential, this
process can achieve extremely high resolutions for patterning.
12
3. EXPERIMENTAL SETUP AND DESIGN
Ionic Glass Synthesis Process
The material used as the stamping material for the solid state superionic stamping process is
superionic silver iodide-silver metaphosphate glass. The synthesis process for silver iodide-silver
metaphosphate glass is completed in a two-step process. The materials needed for the synthesis
include silver iodide, silver nitrate and ammonium dihydrogen phosphate.
Synthesis of Agpo3 Glass
In the first step of this process, powdered silver nitrate and ammonium dihydrogen phosphate is
mixed together in a crucible at a molar ratio of 1:1. This mixture of silver nitrate and ammonium
dihydrogen phosphate is then heated to a high temperature of 700 degree Celsius in an alumina
crucible in a vented furnace for about 6 hours and until the mixture has finished evolving a
mixture of nitrogen dioxide, ammonia and water.
AgNO3 +NH4H2PO4 = AgPO3 + H2O + NH4NO3
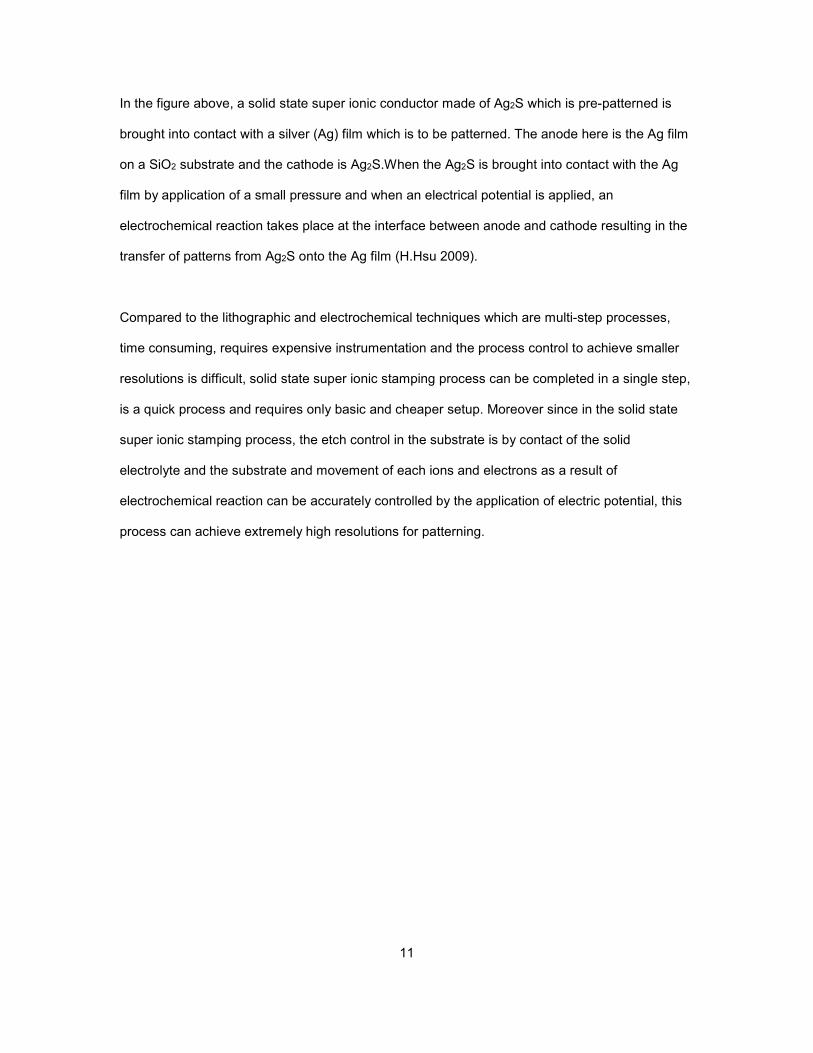
After this first step of the process, the mixture is then taken out from the furnace and poured onto
an aluminum plate to quench it. The resulting AgPO3 glass that is formed in the first step will be a
clear yellow in color as shown below,
13
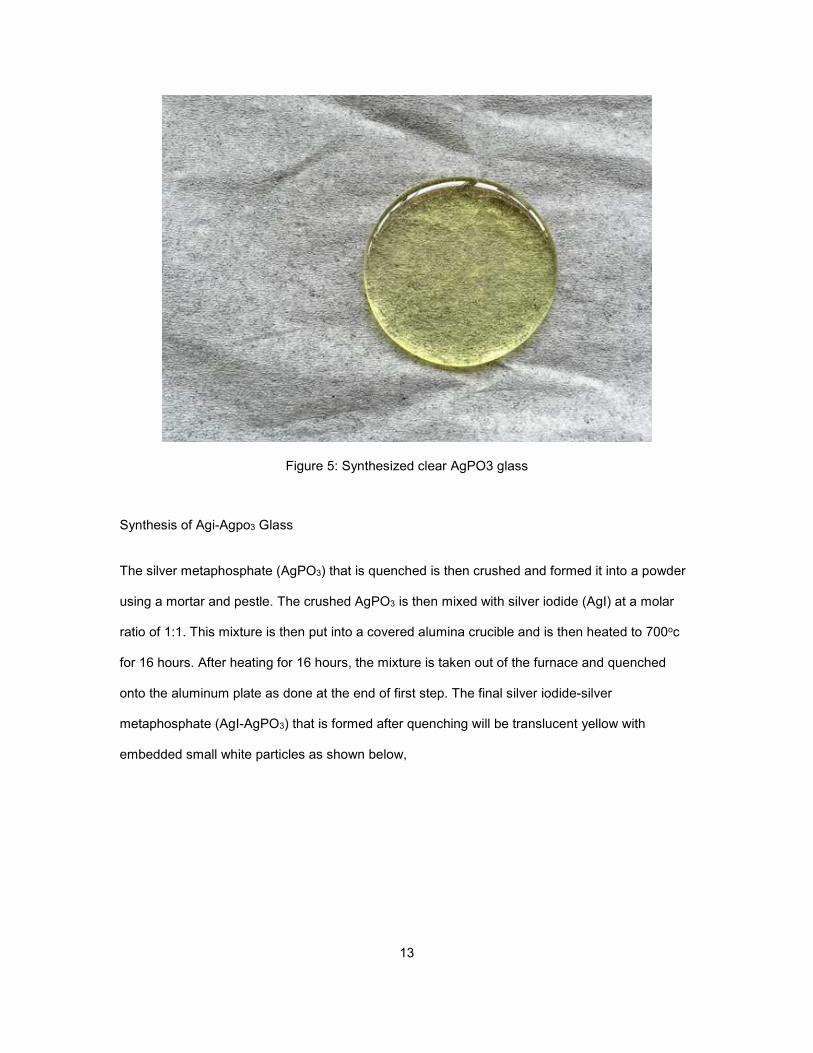
Figure 5: Synthesized clear AgPO3 glass
Synthesis of Agi-Agpo3 Glass
The silver metaphosphate (AgPO3) that is quenched is then crushed and formed it into a powder
using a mortar and pestle. The crushed AgPO3 is then mixed with silver iodide (AgI) at a molar
ratio of 1:1. This mixture is then put into a covered alumina crucible and is then heated to 700oc
for 16 hours. After heating for 16 hours, the mixture is taken out of the furnace and quenched
onto the aluminum plate as done at the end of first step. The final silver iodide-silver
metaphosphate (AgI-AgPO3) that is formed after quenching will be translucent yellow with
embedded small white particles as shown below,

14
Figure 6: Synthesized AgI-AgPO3 glass
Formation of Stamp
The stamp material that is used as the patterned material and cathode for the solid state
superionic stamping (S4) process is to have specific geometry and surface finish along with
structural integrity. In order to accomplish this process of stamp formation, different types of
molding techniques like compression molding and injection molding were considered.
Comparison of Injection Molding & Compression Molding
Injection molding is a type of forming process in which a material is injected into a mold and the
material takes the shape of the mold cavity. In injection molding, the material is forced into a
heated mold cavity where it gets mixed and conforms to the final shape similar to the mold cavity
after the process of cooling and hardening. In this process, the material to be molded is injected
15
at a high pressures between 20-80 MPa and velocities between 50-100 mm/s into the mold cavity
and injection times are extremely small with values less than 5 seconds.
Compression molding is a type of forming process in which the material is placed inside a mold
and the mold is heated up and on application of pressure, the material starts to flow and conforms
to the shape of the mold. The important considerations to be taken into account while doing the
process of compression molding is.
1. Determining the temperature upto which the material and the mold needs to be heated up.
2. Determining the pressure required to ensure that the material conforms to the final shape
inside the mold.
3. Determining the amount of material that needs to go into the mold setup so as to obtain the
final specified geometry.
The advantages of compression molding as compared to injection molding process was that for
compression molding, high pressure and velocity was not required as is the case for injection
molding. Due to the injection process taking place at high speeds, the molds are subjected to
continuous wear and tear resulting in more maintenance of the molds for injection molding
process. Other disadvantages for injection molding include the high initial tooling cost and also
expensive equipment investment. Therefore in our case, compression molding was preferred to
injection molding because the molding is performed at low temperatures and when there is higher
viscosity since the transition temperature for the silver iodide-silver metaphosphate glass being
used in the experiment is 108oc.
Feasibility Study Using a Manual Hydraulic Press
A manual hydraulic press with in-built heaters and temperature controllers was selected to
determine whether it is possible to obtain a uniform cylindrical ionic glass disk with specific
dimensions using the compression molding process.
16
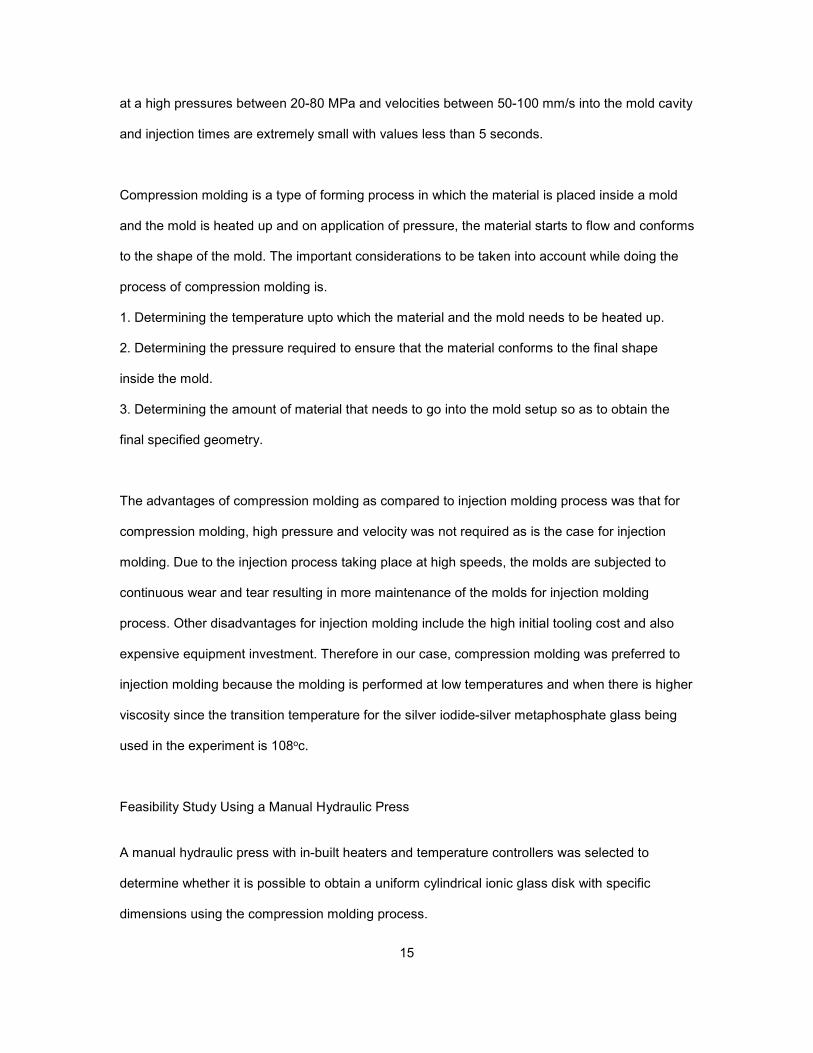
Figure 7: Manual Hydraulic Press with aluminum dies
In the manual hydraulic press, aluminum dies were used and PDMS was used as the non-sticking
agent for preventing adhesion of the ionic glass to the top and bottom aluminum dies during the
process of molding.
Dimensions of Ionic Glass Disk
The ionic glass disk to be obtained is to have dimensions of 1 inch diameter and 0.75 mm
thickness. In order to determine the amount of material that was to be used inside the mold setup
for obtaining this dimensions, there were calculations done which are below,
We know that Mass = Density * Volume,
Since we know that the density of AgI-AgPO3 glass is 5.5 g/cm3 and we can calculate the volume
from the diameter and the thickness, we can determine the mass of the sample directly.

17
Volume of the glass= π * r2 * h where r is the radius of the disk and h is the thickness of the disk
We know, r=1.25 cm and h=0.075 cm and hence the volume=0.368 cm3
Multiplying the density by the volume gives the mass of the ionic glass required for this process
as 2.025 g.
Determination of Molding Temperature
The ionic glass was heated upto different temperatures starting from 50oc all the way upto 150o c
to examine at which temperatures the ionic glass gets molded and comes out as one single disk
after the entire molding process. It was observed that the molded glass disk comes out in
different number of pieces starting from more number of pieces at lower temperatures and finally
comes out as one single piece at 110oc.
Temperature 50 70 80 90 100 105 110 120 150
Number of
glass disk
pieces
31 14 8 5 2 2 1 1 1
Table 1: Number of glass disk pieces at different molding temperatures

18
Figure 8: Experimental determination of molding temperature
From the graph and the table, it is clear that the minimum temperature at which the glass disk
comes out as a single piece after molding is at 110oc and hence it was decided to go ahead with
this temperature as the temperature for the molding process of glass disk. At 110oc, the ionic
glass is in a transition state between glassy and liquid state. In the glassy state, the ionic glass
has the rigidity of a solid but possess liquid like internal structure and in liquid state, the ionic
glass is in a melt state and flows freely.
Determination of Molding Pressure
After the determination of the temperature for the molding process, the next important parameter
to be decided is the pressure to be applied during the process so that the ionic glass material
inside the dies conforms to the final shape required. In order to decide the pressure, different
pressures starting from 1 MPa was applied and observed whether the ionic glass comes out
molded as a single piece.
0
5
10
15
20
25
30
35
0 50 100 150 200
Nu
mb
er
of
Gla
ss d
isk
pie
ce
s
TEMPERATURE
19
Pressure 1 2 3 4 6 8
Number of
Glass disk
pieces
7 4 2 1 1 1
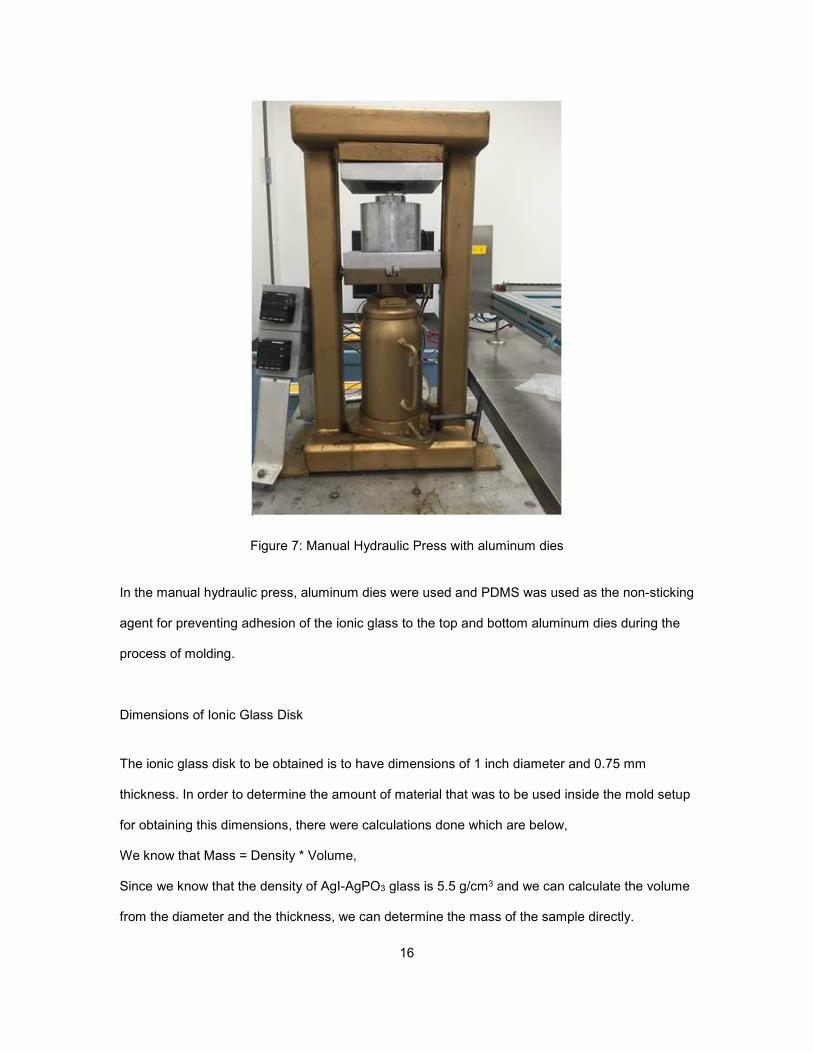
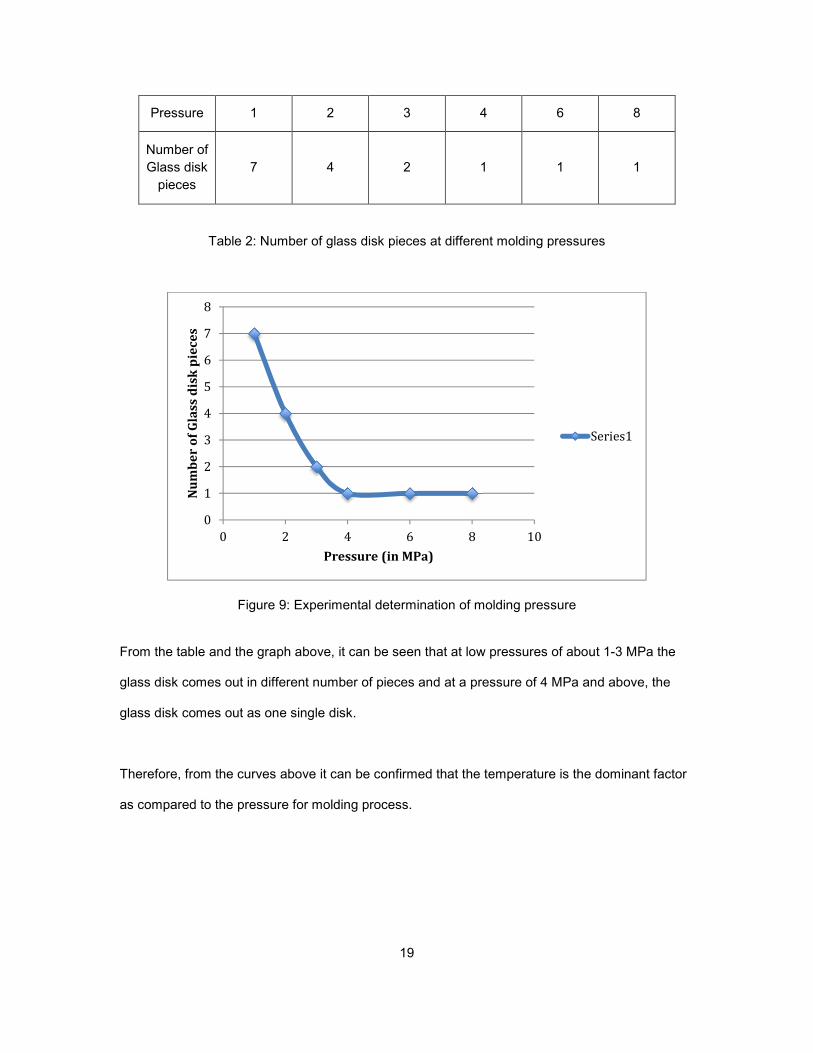
Table 2: Number of glass disk pieces at different molding pressures
Figure 9: Experimental determination of molding pressure
From the table and the graph above, it can be seen that at low pressures of about 1-3 MPa the
glass disk comes out in different number of pieces and at a pressure of 4 MPa and above, the
glass disk comes out as one single disk.
Therefore, from the curves above it can be confirmed that the temperature is the dominant factor
as compared to the pressure for molding process.
0
1
2
3
4
5
6
7
8
0 2 4 6 8 10
Nu
mb
er
of
Gla
ss d
isk
pie
ce
s
Pressure (in MPa)
Series1

20
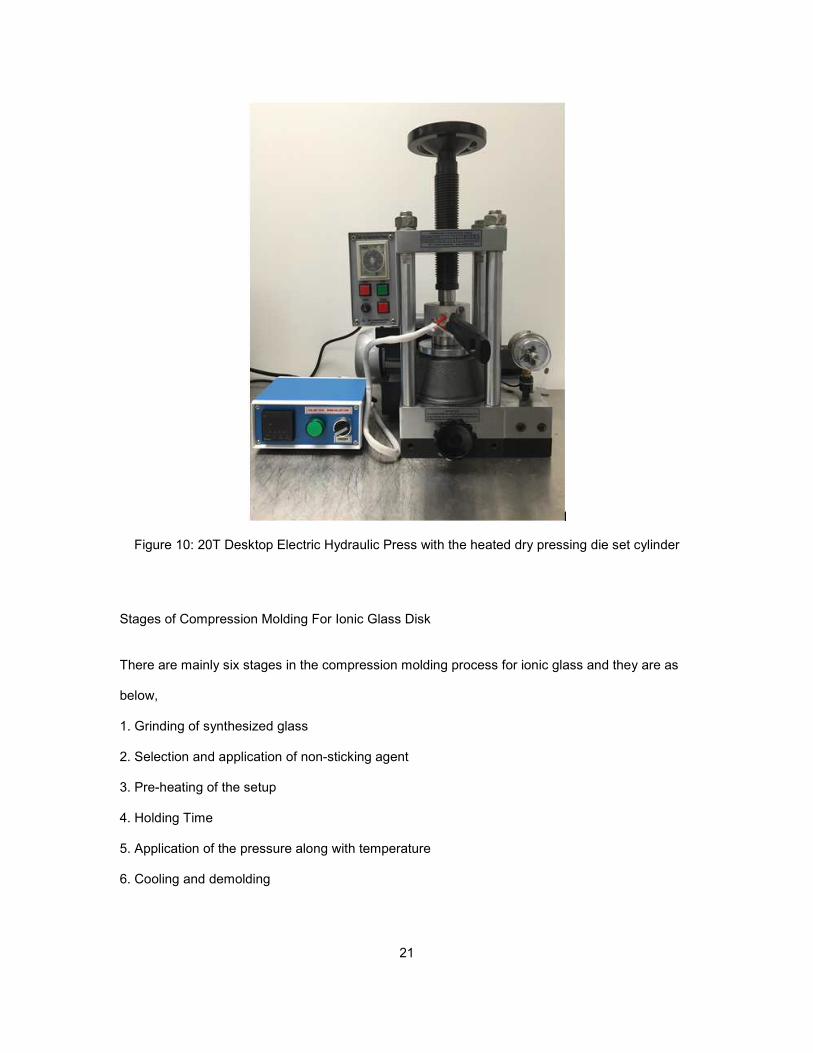
Electric Hydraulic Press for Compression Molding
The electric hydraulic press used for the compression molding of glass disk was purchased from
MTI Corporation with a normal working pressure range from 0-20 metric tons and had an in-built
electric hydraulic pump with a pressure gage and the pressure load would stop on reaching the
pre-setting point and remain at that pressure for the time set which could be up to a maximum of
six minutes.
Heated dry pressing die set cylinder was used along with this electric hydraulic press so that
separate heating need not be provided for a die setup. This set comes with a programmable
temperature controller which lets the temperature to be set specifically and for a maximum of
250oc. In this case, a set of 25 mm (1’’) diameter heated dry pressing die set was used and the
die set was made from hardened steel alloy (Cr12MoV). The specifications of the heater are
below.
Maximum Pressure: 70 tons
Maximum Temperature: 250oc
Rockwell Hardness: Rc 62
Diameter: 25 mm
Sleeve Diameter: 92 mm
Sleeve Height: 45 mm
Total height: 105 (without sample)
Thermal plate diameter: 105 mm
Max. Load Height: 25 mm
Power Supply: 110 V, 60 Hz
Temperature Reading: Every 1/3 second
Temperature Control: digital control within +/-1%
21
Figure 10: 20T Desktop Electric Hydraulic Press with the heated dry pressing die set cylinder
Stages of Compression Molding For Ionic Glass Disk
There are mainly six stages in the compression molding process for ionic glass and they are as
below,
1. Grinding of synthesized glass
2. Selection and application of non-sticking agent
3. Pre-heating of the setup
4. Holding Time
5. Application of the pressure along with temperature
6. Cooling and demolding
22
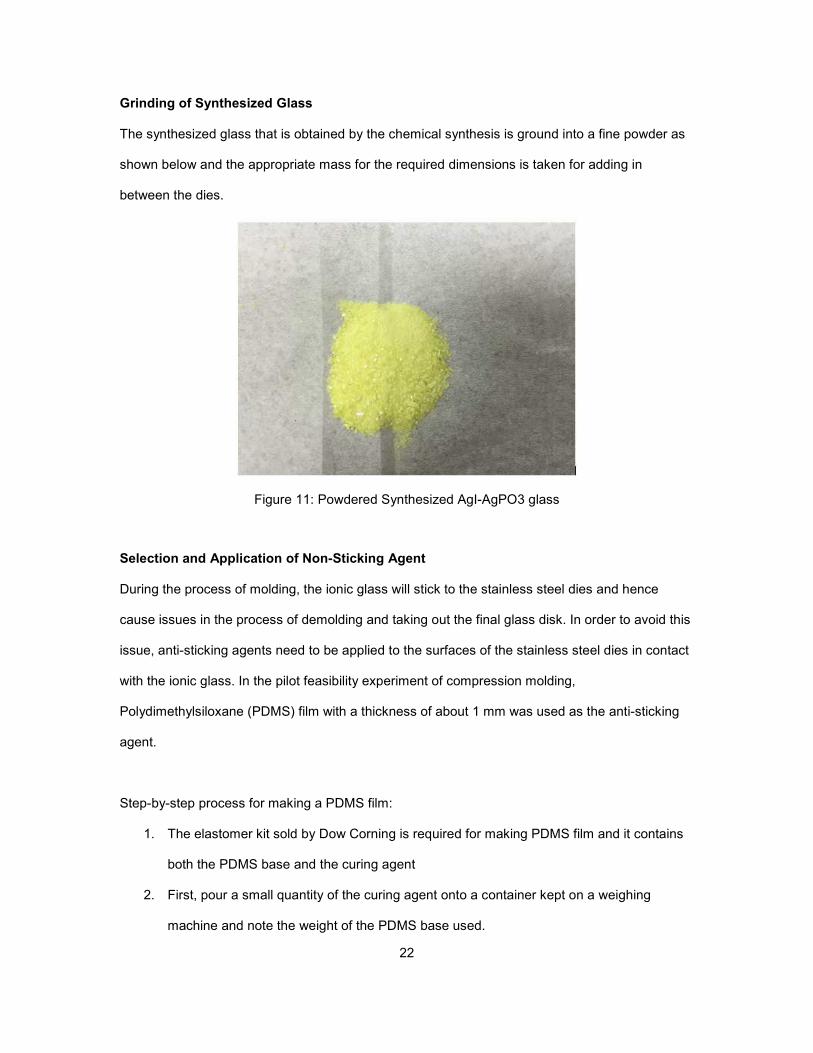
Grinding of Synthesized Glass
The synthesized glass that is obtained by the chemical synthesis is ground into a fine powder as
shown below and the appropriate mass for the required dimensions is taken for adding in
between the dies.
Figure 11: Powdered Synthesized AgI-AgPO3 glass
Selection and Application of Non-Sticking Agent
During the process of molding, the ionic glass will stick to the stainless steel dies and hence
cause issues in the process of demolding and taking out the final glass disk. In order to avoid this
issue, anti-sticking agents need to be applied to the surfaces of the stainless steel dies in contact
with the ionic glass. In the pilot feasibility experiment of compression molding,
Polydimethylsiloxane (PDMS) film with a thickness of about 1 mm was used as the anti-sticking
agent.
Step-by-step process for making a PDMS film:
1. The elastomer kit sold by Dow Corning is required for making PDMS film and it contains
both the PDMS base and the curing agent
2. First, pour a small quantity of the curing agent onto a container kept on a weighing
machine and note the weight of the PDMS base used.
23
3. In the next step, take 10 times the weight of the curing agent of the PDMS base and pour
it into the container with the curing agent
4. Mix the curing agent and the PDMS base thoroughly for about 10 minutes so that the
curing agent is uniformly distributed
5. After this process of mixing, air bubbles will be formed and in order to remove this, keep
the mixture in a desiccator connected to a vacuum pump so that air bubbles are
removed.
6. This mixture is then poured onto a stainless steel disk and it is kept on a spinner for
about 10 seconds so that the mixture evens out on the disk
7. This stainless steel disk with the mixture is then kept on a hotplate at 150oc for about 6-8
minutes for the process of curing.
8. After the cured PDMS is cooled down, application of a small pressure and using a sharp
tool will help get the PDMS film out of the stainless steel disk
9. This PDMS film is cut to the dimensions of the glass disk and is used on the surface of
the top and bottom dies in contact with the ionic glass so that ionic glass does not stick to
the die surfaces and cause issues during demolding.
The process of making PDMS solution is quite time-consuming and for every molding process,
we cannot reuse the PDMS film and need to use a new film of PDMS as the PDMS film used to
be in contact with the final molded glass and the film being quite thin used to tear off while
removing it from the glass disk.
In order to overcome the disadvantages of using PDMS as an anti-sticking agent, it was decided
to go ahead and try a solution of silver. A better anti-sticking agent that works well with the AgI-
AgPO3 glass is a liquid silver solution which is pure 0.999 silver and the silver solution used in
this process for anti-sticking was purchased from the vendor, Medallion Care LLC.
24
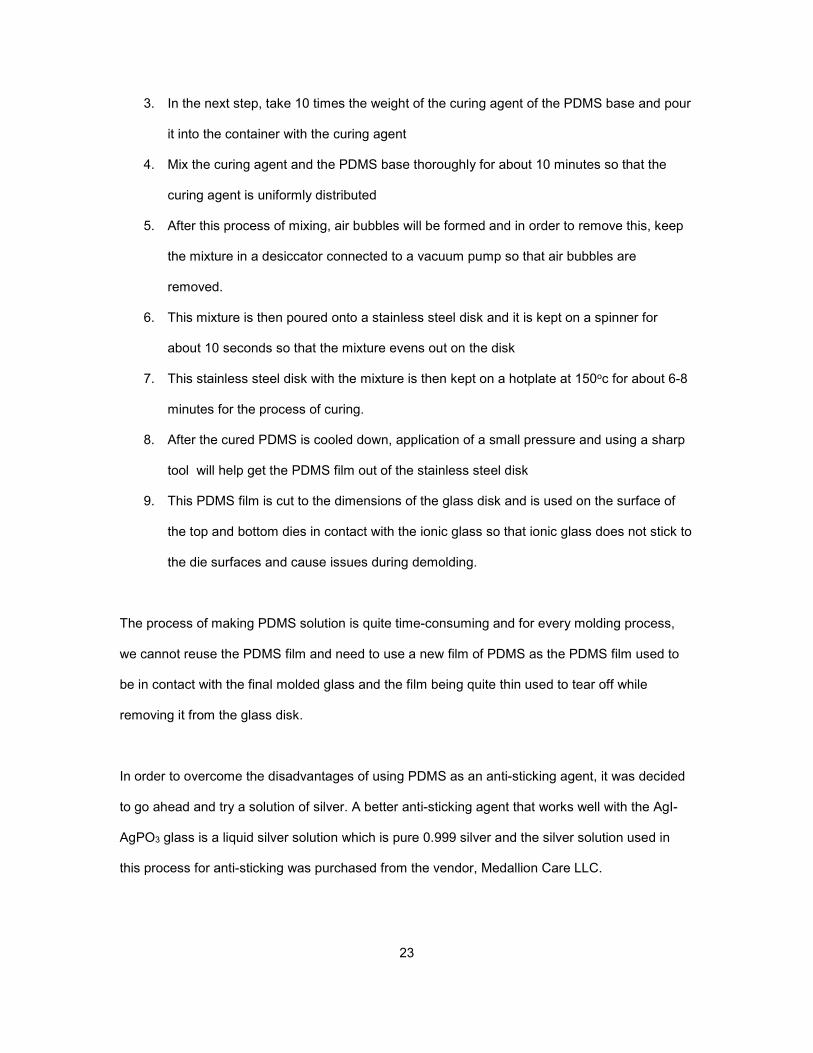
The process of application of the silver solution to the stainless steel die surfaces is quite easy
and a quick process and very effective too as there is no adhesion of silver solution to the molded
glass disk.
Figure 12: Application of silver solution to the stainless steel dies
The stainless steel glass disk on the left in the figure above is the die with silver solution applied
to it which is in contact with the ionic glass inside the hydraulic press and the disk on the right
shows the stainless steel die with silver solution applied to it and kept in the open atmosphere for
about 1 hour and due to the process of oxidation, it turns black confirming the presence of silver.
A small amount of silver solution is first poured onto an application sponge and this is then
applied onto the stainless steel dies and allowed to stay for 30 seconds and a cloth is then used
to wipe off the wet solution after which the dies are inserted onto the die setup with the heater.
25
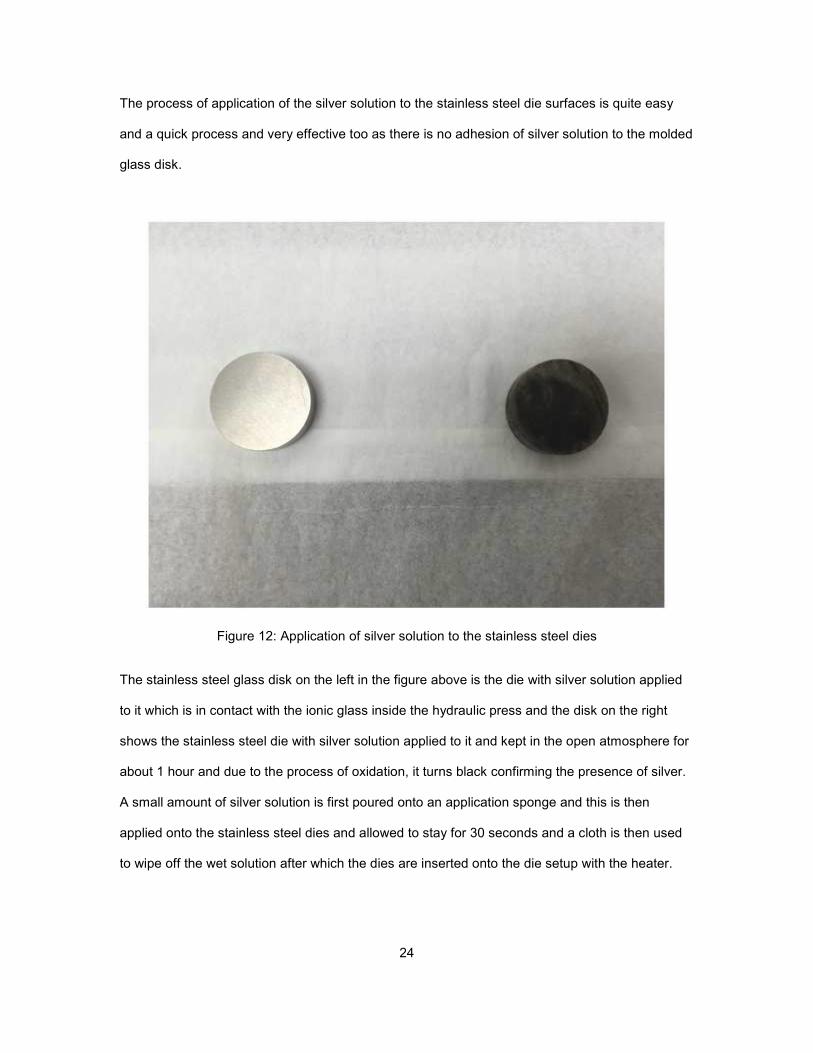
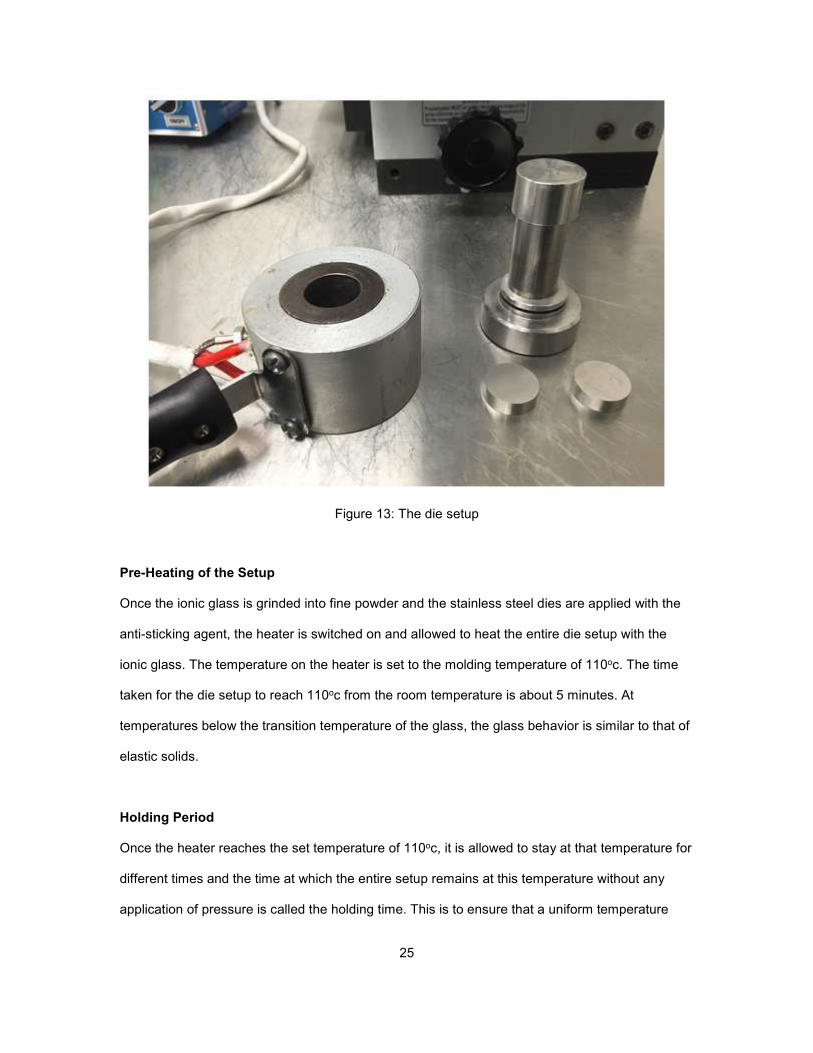
Figure 13: The die setup
Pre-Heating of the Setup
Once the ionic glass is grinded into fine powder and the stainless steel dies are applied with the
anti-sticking agent, the heater is switched on and allowed to heat the entire die setup with the
ionic glass. The temperature on the heater is set to the molding temperature of 110oc. The time
taken for the die setup to reach 110oc from the room temperature is about 5 minutes. At
temperatures below the transition temperature of the glass, the glass behavior is similar to that of
elastic solids.
Holding Period
Once the heater reaches the set temperature of 110oc, it is allowed to stay at that temperature for
different times and the time at which the entire setup remains at this temperature without any
application of pressure is called the holding time. This is to ensure that a uniform temperature
26
profile is achieved for the ionic glass between the top and bottom dies and that the ionic glass
has consistent material properties throughout. In this compression molding experiment of ionic
glass, different holding times were considered starting at a minimum of 40 seconds and going all
the way upto 25 minutes. The holding times considered were 40 seconds, 5 minutes, 15 minutes
and 25 minutes in this compression molding experiment. After reaching the molding temperature
of 110oc and staying at the holding time, the glass becomes moldable.
During this stage of holding in the compression molding process, the ionic glass material is
subjected to a stress equal to the weight of the top section of the dies acting on the entire surface
of the ionic glass and as a result of stress acting for long durations of time, the ionic glass is
subjected to a condition known as creep in which the material gets deformed.
Application of the Pressure Along With Temperature-Compression Stage
During this compression stage, a constant pressure of 4 MPa is allowed to the entire die setup so
that the ionic glass conforms to the final shape of the cavity between the top and bottom stainless
steel dies. The temperature during this stage is the same as the molding temperature of 110oc.
The die setup is allowed to remain at the constant pressure of 4 MPa for a fixed time and that
time is known as the pressing time. The pressing times applied ranged from a minimum of 30
seconds and to a time of 6 minutes as the setting on the electric press allows it to stay at different
pressures only for a maximum time of 6 minutes. The pressing times considered were 30
seconds, 1 minute, 2 minutes and 6 minutes.
During this stage when a high pressure is applied along with the molding temperature, it
undergoes a high amount of viscoelastic creep as at this temperature, the ionic glass has
properties of both solids and fluids and is in a viscoelastic state. The amount of creep undergone
by a material depends upon the ionic glass properties, the temperature at which the material is
subjected to, the time for which the stress is applied and the amount of stress applied.
27
Cooling and Demolding
Once the compression stage is over, the heater is switched off and the pressure is released and
the entire die setup is allowed to cool down. Different cooling times from 2 minutes to about 20
minutes was considered. At 20 minutes, the entire setup was back at the room temperature. The
cooling times considered in this experiment was 2 minutes, 5 minutes, 10 minutes and 20
minutes.
After the process of cooling, the thermal plate section of the die setup was removed and a
nominal pressure of 1 MPa was applied on the die setup so that molded glass disk comes out
along with the bottom die. During this process of cooling of the molded ionic glass disk, residual
stresses result in the final molded glass due to the non-uniform cooling.
Process Parameters for Compression Molding Of Ionic Glass
From the different stages of compression molding explained above, it is evident that there are five
main process parameters that are significant and they are as below,
1. Holding time
2. Pressing time
3. Cooling time
4. Temperature
5. Pressure
The temperature and pressure was kept constant at 110oc and 4 MPa respectively for the
different set of experiments and as determined from the previous set of independent experiments
done, it was the lowest temperature and pressure at which it was able to obtain an ionic glass
disk as single piece. The three parameters that were varied were holding time, pressing time and
cooling time.
28
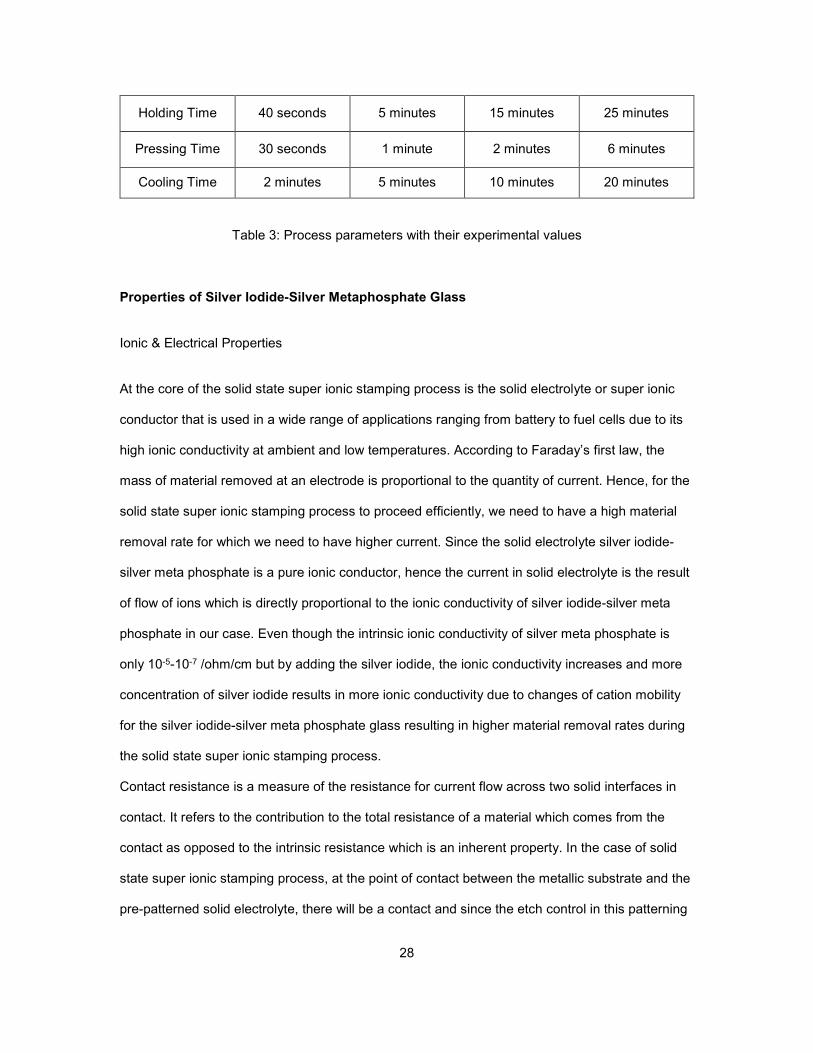
Holding Time 40 seconds 5 minutes 15 minutes 25 minutes
Pressing Time 30 seconds 1 minute 2 minutes 6 minutes
Cooling Time 2 minutes 5 minutes 10 minutes 20 minutes
Table 3: Process parameters with their experimental values
Properties of Silver Iodide-Silver Metaphosphate Glass
Ionic & Electrical Properties
At the core of the solid state super ionic stamping process is the solid electrolyte or super ionic
conductor that is used in a wide range of applications ranging from battery to fuel cells due to its
high ionic conductivity at ambient and low temperatures. According to Faraday’s first law, the
mass of material removed at an electrode is proportional to the quantity of current. Hence, for the
solid state super ionic stamping process to proceed efficiently, we need to have a high material
removal rate for which we need to have higher current. Since the solid electrolyte silver iodide-
silver meta phosphate is a pure ionic conductor, hence the current in solid electrolyte is the result
of flow of ions which is directly proportional to the ionic conductivity of silver iodide-silver meta
phosphate in our case. Even though the intrinsic ionic conductivity of silver meta phosphate is
only 10-5-10-7 /ohm/cm but by adding the silver iodide, the ionic conductivity increases and more
concentration of silver iodide results in more ionic conductivity due to changes of cation mobility
for the silver iodide-silver meta phosphate glass resulting in higher material removal rates during
the solid state super ionic stamping process.
Contact resistance is a measure of the resistance for current flow across two solid interfaces in
contact. It refers to the contribution to the total resistance of a material which comes from the
contact as opposed to the intrinsic resistance which is an inherent property. In the case of solid
state super ionic stamping process, at the point of contact between the metallic substrate and the
pre-patterned solid electrolyte, there will be a contact and since the etch control in this patterning
29
process is by contact, it is important to ensure effective contact between the surfaces and it can
be confirmed by the measurement of contact resistance.
Mechanical Properties
Mechanical properties describe the way that a material responds to forces, loads and impacts.
There are several important properties in mechanical behavior.
1. Elastic modulus which governs the deflection of the ionic glass
2. Hardness measures the surface properties
3. Toughness governs crack propagation in the ionic glass material
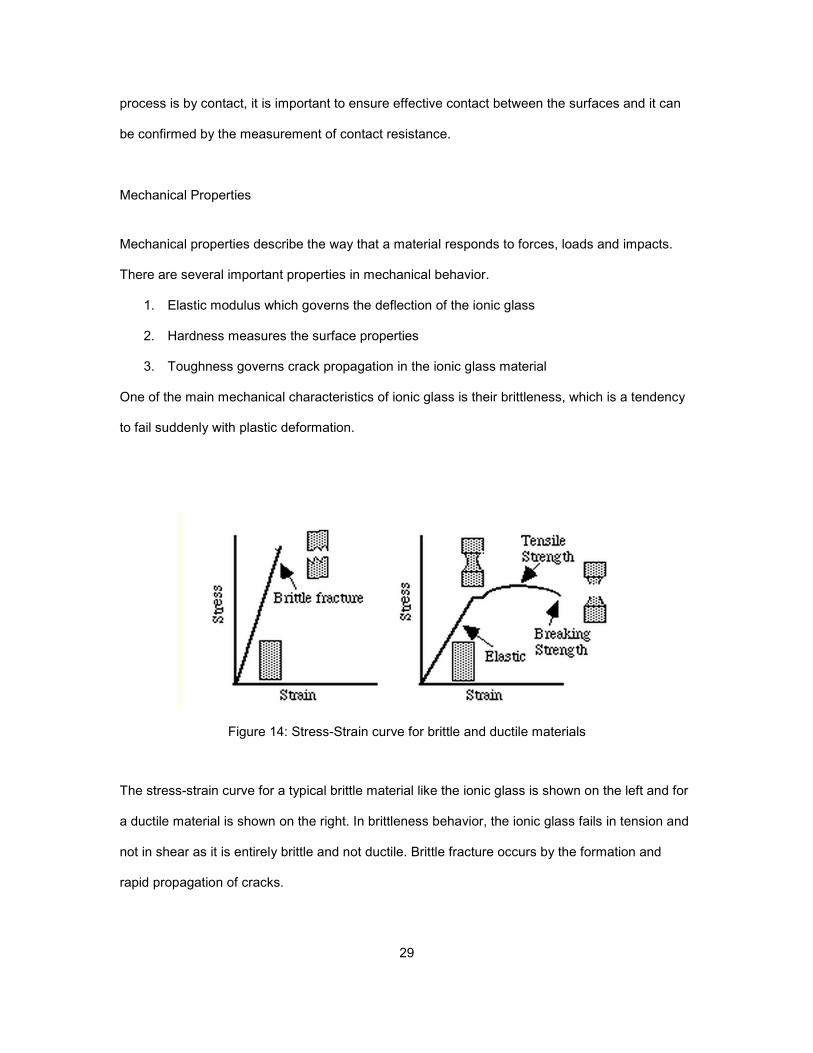
One of the main mechanical characteristics of ionic glass is their brittleness, which is a tendency
to fail suddenly with plastic deformation.
Figure 14: Stress-Strain curve for brittle and ductile materials
The stress-strain curve for a typical brittle material like the ionic glass is shown on the left and for
a ductile material is shown on the right. In brittleness behavior, the ionic glass fails in tension and
not in shear as it is entirely brittle and not ductile. Brittle fracture occurs by the formation and
rapid propagation of cracks.

30
Fracture toughness is the ability of ionic glass containing a crack to resist fracture. Fracture
toughness is a quantitative way of expressing the resistance of the ionic glass to brittle fracture
when a crack is present. Brittle fracture is characteristic of materials with less fracture toughness
indicating that ionic glass has lower fracture toughness. From the curve below, the area under
stress-strain curve will give us the toughness values and for brittle materials including the ionic
glass used in this research, the toughness value is lower.
Figure 15: Toughness curve
Ionic glass possess elastic properties i.e the glass will return to its original shape when the force
causing the deformation is removed. The measure of the elasticity of ionic glass is governed by
the Hooke’s law in which the stress is proportional to the strain and the ability to deform reversibly
is measured by the elastic modulus. The Young’s modulus expresses the tensile force that would
theoretically have to be applied to the glass sample to stretch it by an amount equal to its original
length. The value for Young’s modulus is a measure of the stiffness. When this ionic glass is
stretched under mechanical stress, a decrease in the cross sectional area is observed. Poisson’s

31
ratio is the relation between unit decrease in the direction perpendicular to the axis of the effort
and the unit strain in the direction of the effort. Since the Young’s modulus value of silver iodide-
silver meta phosphate has a high value of 35 GPa, it indicates that the ionic glass is a stiff
material but it is comparatively lesser as compared to normal glasses which have values in the
range of 70-90 GPa.
Figure 16: Variation of stiffness with temperature
The above figure shows the variation of stiffness with temperature. In compression molding of
ionic glass, the ionic glass is heated up to a temperature close to the transition temperature range
and hence, the stiffness values will decrease with increase in temperature and as a result of
which the force required to deform it is lesser at the molding temperature range and the minimum
stiffness is observed at the melting temperature which is not encountered in our compression
molding process.
Hardness is the ability of ionic glass to resist deformation when acted on by another body.
Hardness is a measure of ionic glass’s resistance to localized plastic deformation. Quantitative
techniques have been developed such as observing the penetration of Vickers, Berkovich or

32
sharp-cube corner indenters into the ionic glass sample and the hardness number can be
determined. The softer the material, larger and deeper will be the indentation and lower hardness
number.
Geometrical Characterization
Surface flatness and roughness is an important parameter in the solid state super ionic stamping
process as it is directly related to the contact between the metallic substrate and the pre
patterned solid electrolyte stamp. Surfaces are characterized by two main parameters: roughness
and waviness. Roughness means the irregularities of a surface and these irregularities are
typically submicron in scale. Waviness describes a more widely spaced component on the
surface, with larger dimensions, for instance the deviation from flatness. So, waviness is a kind of
carrier wave and roughness is the modulation over it. The surface characteristics are
schematically shown below.
Figure 17: Surface profile indicating flatness and roughness
The range of thickness values of the metallic substrate for patterning is at the nanoscale levels
and the surface features of flatness and roughness have values in metric units of millimeter. As a
result of this large change in order between the values for the two surfaces, during the process of
patterning when the stamp is brought into contact with the metallic substrate, there is low pattern
33
transfer fidelity as a result of certain regions having higher flatness and roughness values. These
will come in contact with the metallic substrate first and hence we won’t be able to effectively
pattern the entire surface of the metallic substrate with the exact depth and features as the
thickness for the substrate is only in the range of 50-100 nm and as a result of this incomplete
patterning results. Hence, it is important to have minimum flatness and roughness values and a
good finish for the pre-patterned stamp so that all the regions on the metallic substrate are
patterned with the exact features on the stamp by having proper contact and pattern transfer
between the two surfaces.
A set of experiments was done to determine the effects of the three parameters-Holding Time,
Pressing Time and Cooling Time and the interaction of the three parameters.
The response variables are the final flatness and surface roughness of the samples for ensuring
that the geometrical structure of the final molded glass disk is uniform and the response function
is to minimize the flatness and surface roughness and obtain the process parameters for
achieving specific flatness and surface roughness.
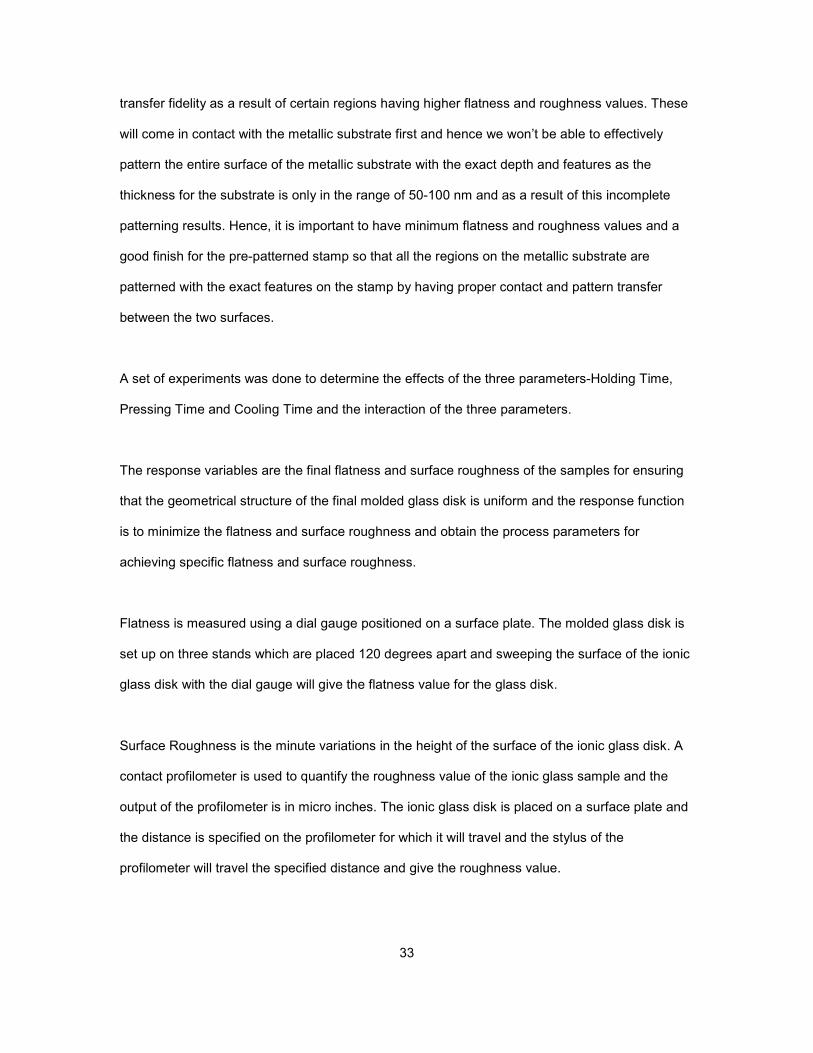
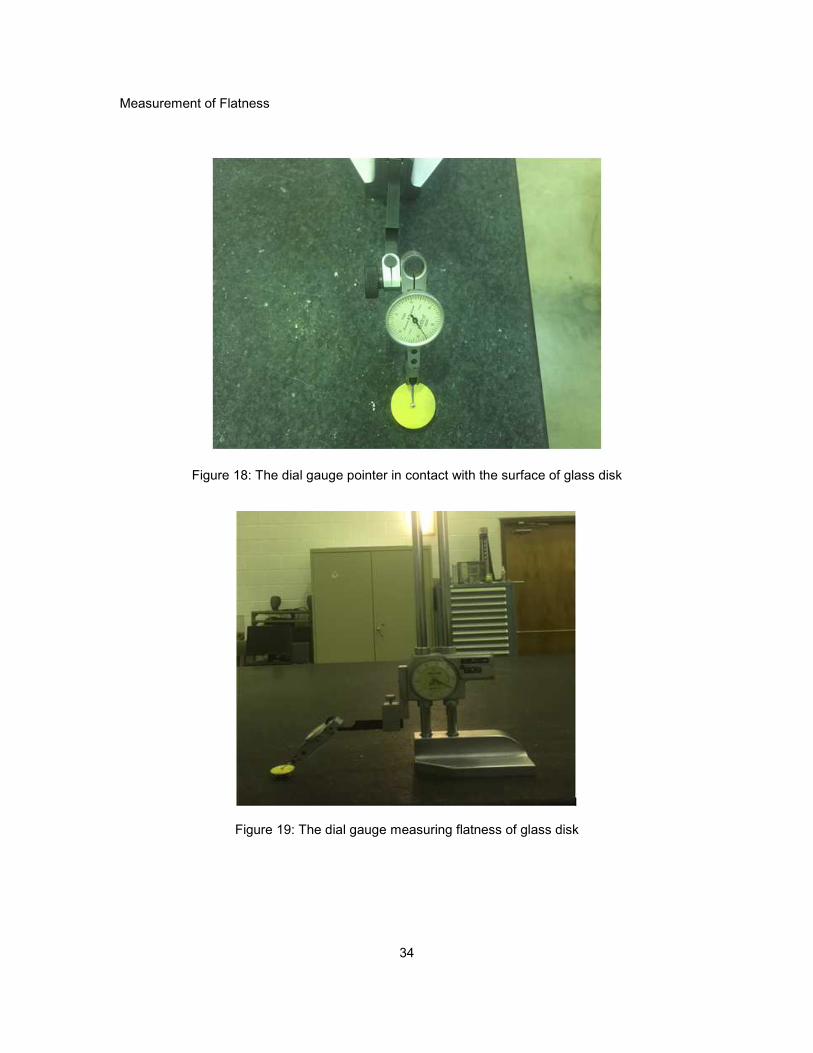
Flatness is measured using a dial gauge positioned on a surface plate. The molded glass disk is
set up on three stands which are placed 120 degrees apart and sweeping the surface of the ionic
glass disk with the dial gauge will give the flatness value for the glass disk.
Surface Roughness is the minute variations in the height of the surface of the ionic glass disk. A
contact profilometer is used to quantify the roughness value of the ionic glass sample and the
output of the profilometer is in micro inches. The ionic glass disk is placed on a surface plate and
the distance is specified on the profilometer for which it will travel and the stylus of the
profilometer will travel the specified distance and give the roughness value.
34
Measurement of Flatness
Figure 18: The dial gauge pointer in contact with the surface of glass disk
Figure 19: The dial gauge measuring flatness of glass disk
35
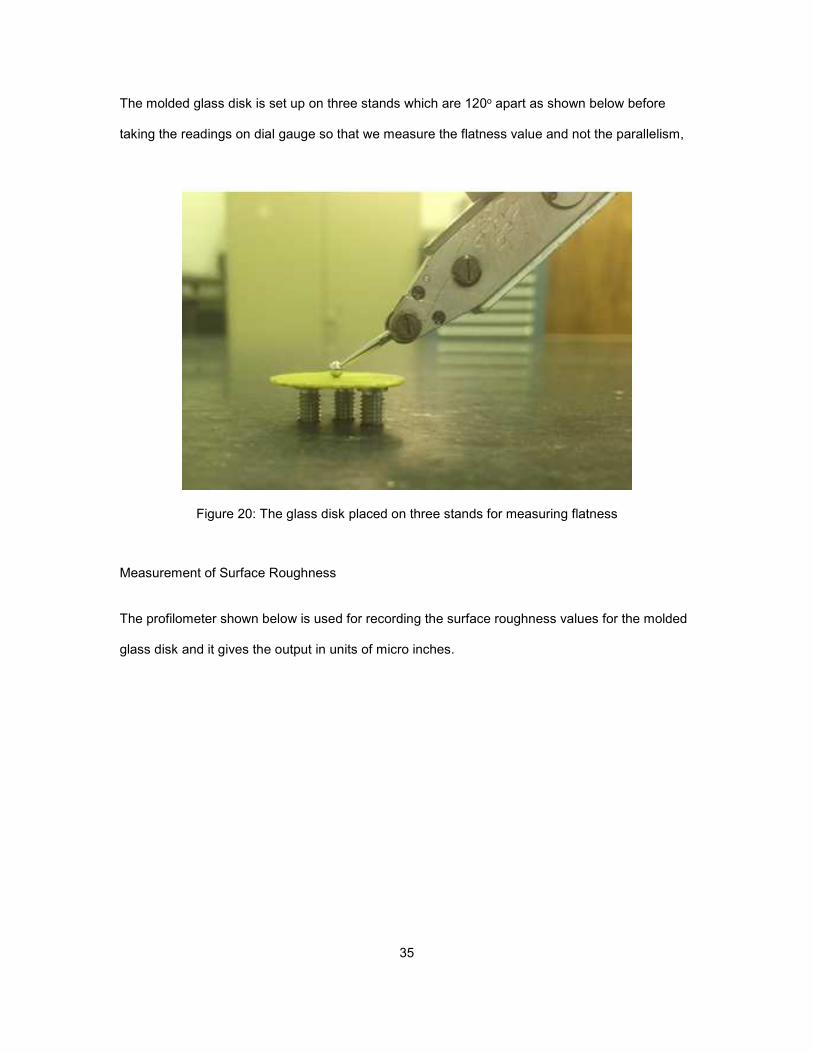
The molded glass disk is set up on three stands which are 120o apart as shown below before
taking the readings on dial gauge so that we measure the flatness value and not the parallelism,
Figure 20: The glass disk placed on three stands for measuring flatness
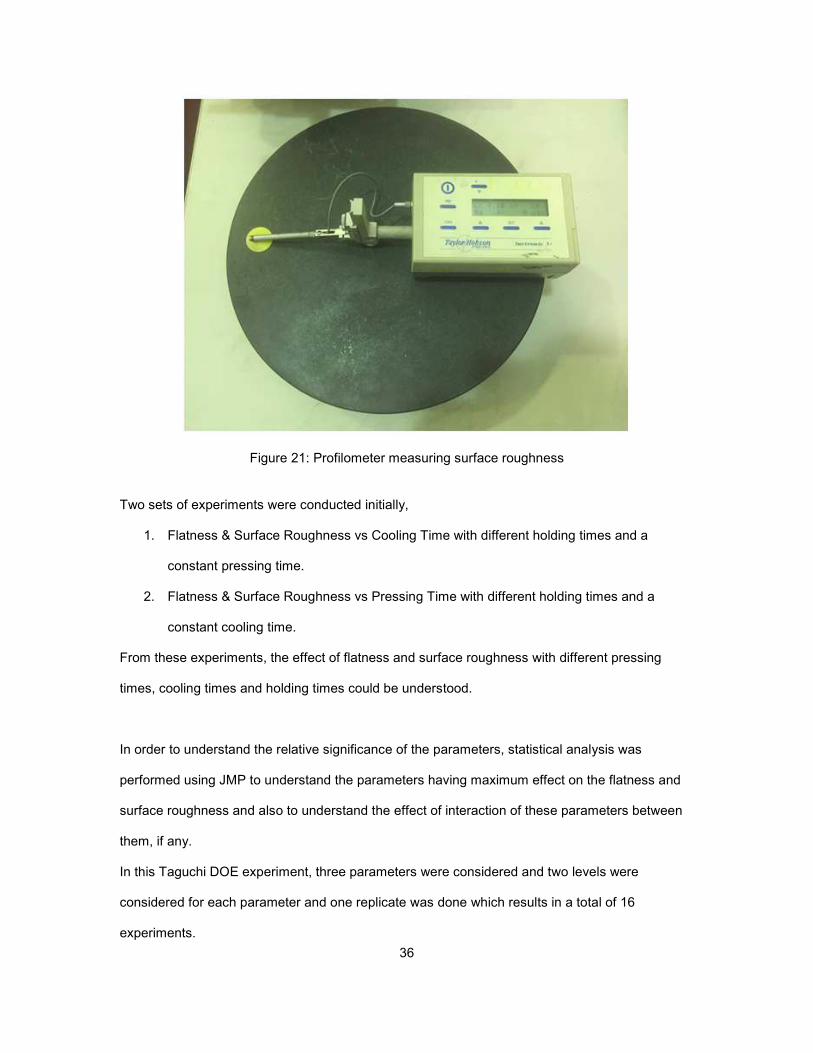
Measurement of Surface Roughness
The profilometer shown below is used for recording the surface roughness values for the molded
glass disk and it gives the output in units of micro inches.
36
Figure 21: Profilometer measuring surface roughness
Two sets of experiments were conducted initially,
1. Flatness & Surface Roughness vs Cooling Time with different holding times and a
constant pressing time.
2. Flatness & Surface Roughness vs Pressing Time with different holding times and a
constant cooling time.
From these experiments, the effect of flatness and surface roughness with different pressing
times, cooling times and holding times could be understood.
In order to understand the relative significance of the parameters, statistical analysis was
performed using JMP to understand the parameters having maximum effect on the flatness and
surface roughness and also to understand the effect of interaction of these parameters between
them, if any.
In this Taguchi DOE experiment, three parameters were considered and two levels were
considered for each parameter and one replicate was done which results in a total of 16
experiments.
37
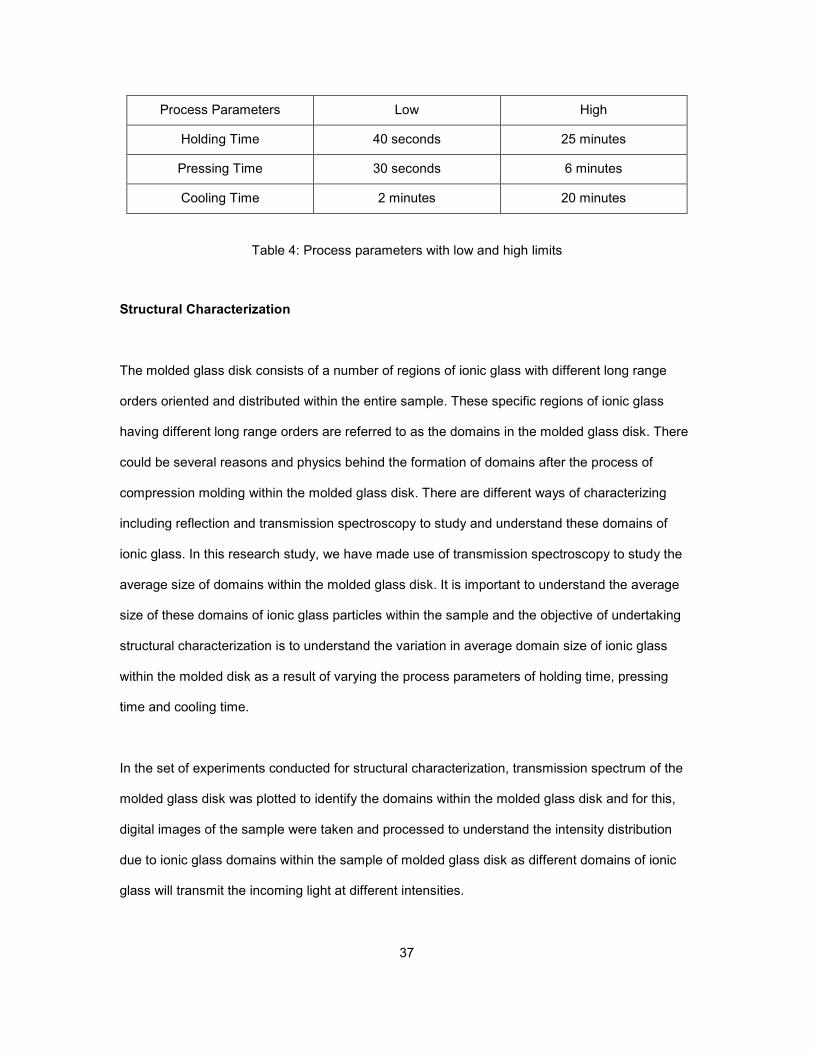
Process Parameters Low High
Holding Time 40 seconds 25 minutes
Pressing Time 30 seconds 6 minutes
Cooling Time 2 minutes 20 minutes
Table 4: Process parameters with low and high limits
Structural Characterization
The molded glass disk consists of a number of regions of ionic glass with different long range
orders oriented and distributed within the entire sample. These specific regions of ionic glass
having different long range orders are referred to as the domains in the molded glass disk. There
could be several reasons and physics behind the formation of domains after the process of
compression molding within the molded glass disk. There are different ways of characterizing
including reflection and transmission spectroscopy to study and understand these domains of
ionic glass. In this research study, we have made use of transmission spectroscopy to study the
average size of domains within the molded glass disk. It is important to understand the average
size of these domains of ionic glass particles within the sample and the objective of undertaking
structural characterization is to understand the variation in average domain size of ionic glass
within the molded disk as a result of varying the process parameters of holding time, pressing
time and cooling time.
In the set of experiments conducted for structural characterization, transmission spectrum of the
molded glass disk was plotted to identify the domains within the molded glass disk and for this,
digital images of the sample were taken and processed to understand the intensity distribution
due to ionic glass domains within the sample of molded glass disk as different domains of ionic
glass will transmit the incoming light at different intensities.
38
Another method of characterizing and understanding the distribution of domains of ionic glass is
through reflection spectroscopy. In reflection spectroscopy, light that has been reflected or
scattered from the molded ionic glass disk is plotted as a function of wavelength and the different
domains of ionic glass will reflect the incoming light at different intensities using which we can
relate it to the average domain size of the particles.
During the process of ionic glass synthesis, the silver iodide-silver meta phosphate glass
undergoes the process of quenching which is a process of rapid cooling in which the temperature
of the synthesized glass drops from 700oC to room temperature of 25OC in a time of about 20
seconds. Since this quenching process is a rapid cooling process, it prevents low-temperature
processes such as phase transformations from occurring by only providing a narrow window of
time in which the reaction is both thermodynamically favorable and kinetically accessible and as a
result of this, the final synthesized glass has only very small crystallinity and more amorphous
behavior. Hence, it lacks the long-range order characteristic of a crystal and hence we have the
average particles sizes for the ionic glass less than 1 mm when it is allowed to quench and is
used for the compression molding process to obtain the stamp.
Once we complete the process of compression molding and allow the molded ionic glass to cool
down, the temperature is allowed to drop from 110Oc, molding temperature with different cooling
times of 2 minutes, 5 minutes, 10 minutes and 20 minutes at which it is at the room temperature
and as a result of this process during which there is different cooling times with the same cooling
rate, there is also different temperature gradients. As a result of this process of slower cooling as
compared to the faster cooling process after synthesis of silver iodide-silver meta phosphate
glass, the molded ionic glass disk has more crystallinity as compared to amorphous behavior and
this crystalline behavior could be one of the reasons behind the formation of domains within the
molded glass disk. By performing X-ray diffraction, it is possible to characterize and confirm the
crystalline behavior of this molded glass as the diffraction from crystalline materials will have well
defined Bragg Peaks as the material has long range order. Since amorphous substances do not

39
possess this long range order, the diffraction analysis will have broad peaks and not show very
sharp Bragg Peaks.
A LED light source was selected as the source of light to pass light through samples of molded
glass disk. The spatial intensity distribution of the light source is first determined by capturing the
image of the light source using a digital SLR camera. To ensure that the intensity of light source
does not saturate the image obtained from the digital SLR camera, a set of four 58 mm neutral
density filters and polarized sunglasses were placed between the light source and the digital SLR
camera so that it was able to obtain the intensity distribution of the light source without any image
saturation.
A digital image is composed of two dimensional array of elements of the picture called pixels
which are arranged as rows and columns. Each pixel will have an intensity value and an address
which is denoted by the row and columns in the image. In this experiment, the intensity values for
each pixel was plotted against the total number of pixels present in the gray scale of the digital
image of the light source so as to obtain the spatial intensity distribution of the light source. The
RGB image of the light source is first converted into gray scale image using Image J and this
grayscale image is then used for obtaining the surface plot in Matlab and ImageJ.
The intensity distribution of the light source obtained in ImageJ is shown below.
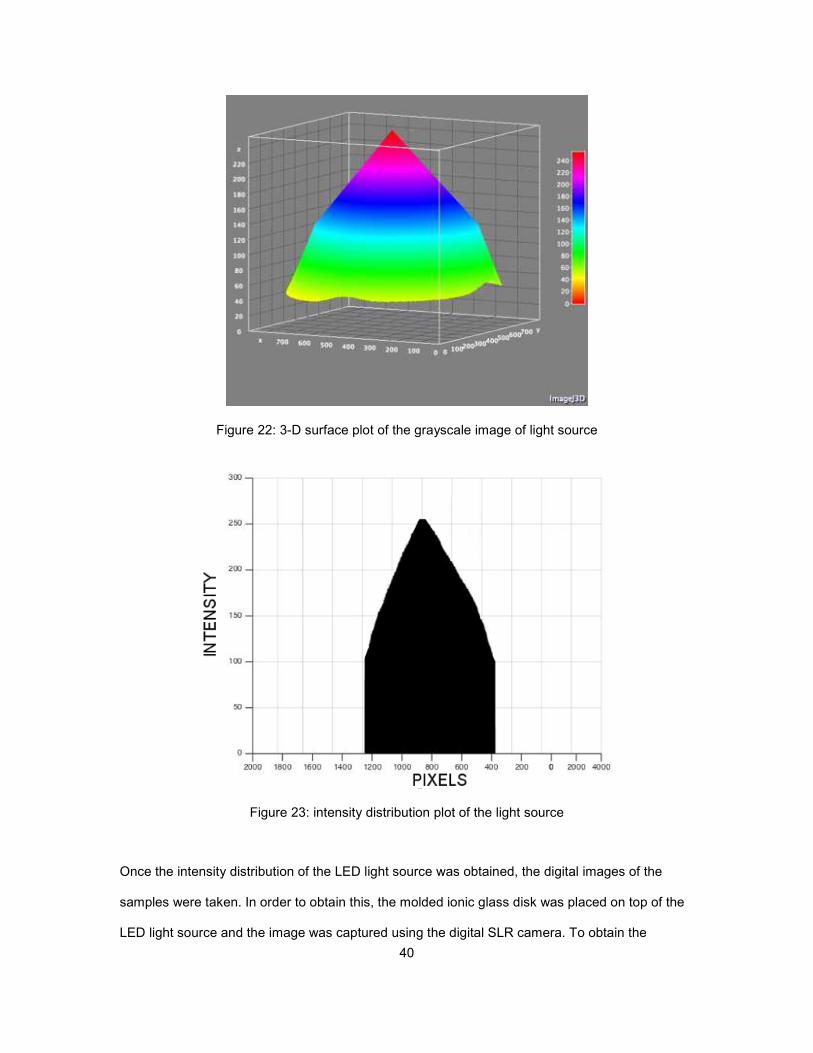
40
Figure 22: 3-D surface plot of the grayscale image of light source
Figure 23: intensity distribution plot of the light source
Once the intensity distribution of the LED light source was obtained, the digital images of the
samples were taken. In order to obtain this, the molded ionic glass disk was placed on top of the
LED light source and the image was captured using the digital SLR camera. To obtain the
41
intensity distribution of the molded glass disk without the effect of the intensity distribution of the
light source, two steps were followed in sequence.
1. Image normalization- Image normalization is the process of changing the range of the
pixel intensity values so that both the images of the light source and the light source with
sample has the same range of intensity values such that their maximum and minimum
pixel intensities will be the same. If an image I with intensity range of (min, max) is to be
normalized to an image In with a new intensity range of (new min, new max) the image
normalization is performed according to the formula,
In = (I-min)*[(new max-new min)/(max-min)] + new min
The image normalization process is performed in Matlab so that the grayscale image of
the sample with the light source has the same range of intensity values as that of the
grayscale image of the light source. This function is coded in Matlab for image
normalization.
2. Image subtraction- Image subtraction is the process of subtracting each of the pixel
intensity values of the grayscale image of the sample with the light source from the pixel
intensity values of the grayscale image of the light source. This is done so as to obtain
the image of the sample without any effect of the light source. Image subtraction is
directly performed using the Process->Image Calculator->Subtract command in ImageJ.
Once this process of image normalization and image subtraction is completed, the grayscale
image of the sample without the effect of light source is obtained and the surface plots can then
be plotted in Image J using Interactive 3D surface plot function and surf function in Matlab which
gives the spatial intensity distribution profile of the molded glass disk.
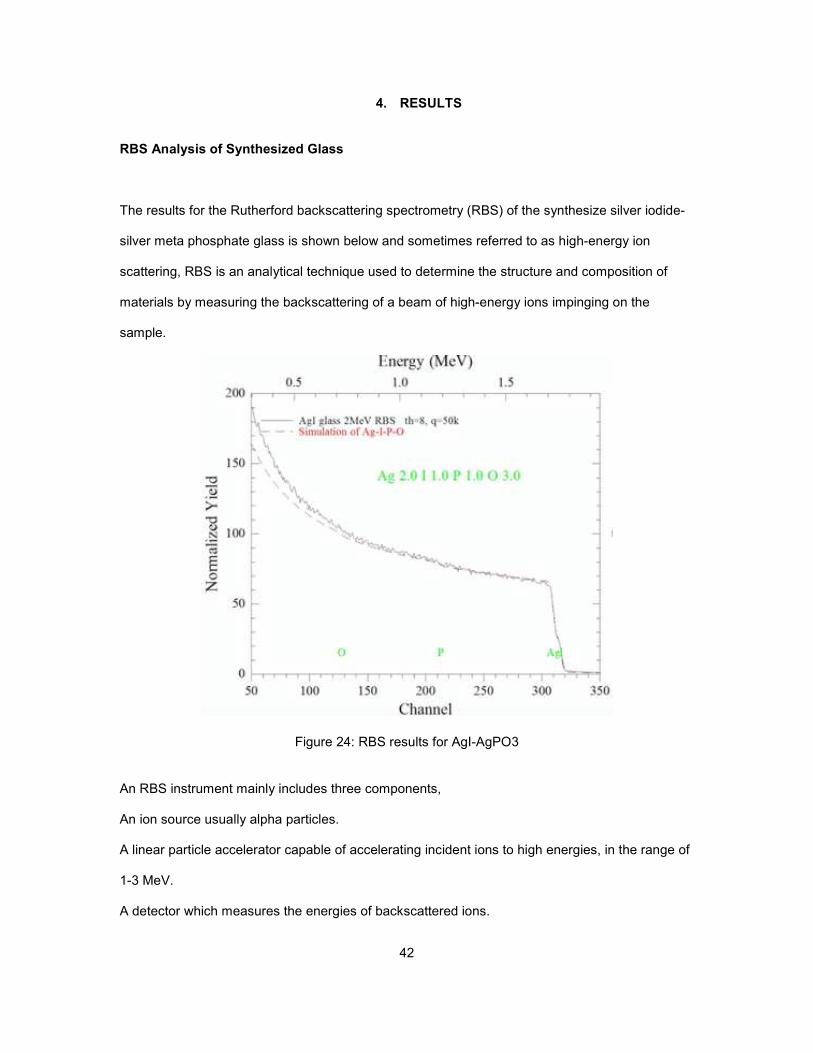
42
4. RESULTS
RBS Analysis of Synthesized Glass
The results for the Rutherford backscattering spectrometry (RBS) of the synthesize silver iodide-
silver meta phosphate glass is shown below and sometimes referred to as high-energy ion
scattering, RBS is an analytical technique used to determine the structure and composition of
materials by measuring the backscattering of a beam of high-energy ions impinging on the
sample.
Figure 24: RBS results for AgI-AgPO3
An RBS instrument mainly includes three components,
An ion source usually alpha particles.
A linear particle accelerator capable of accelerating incident ions to high energies, in the range of
1-3 MeV.
A detector which measures the energies of backscattered ions.
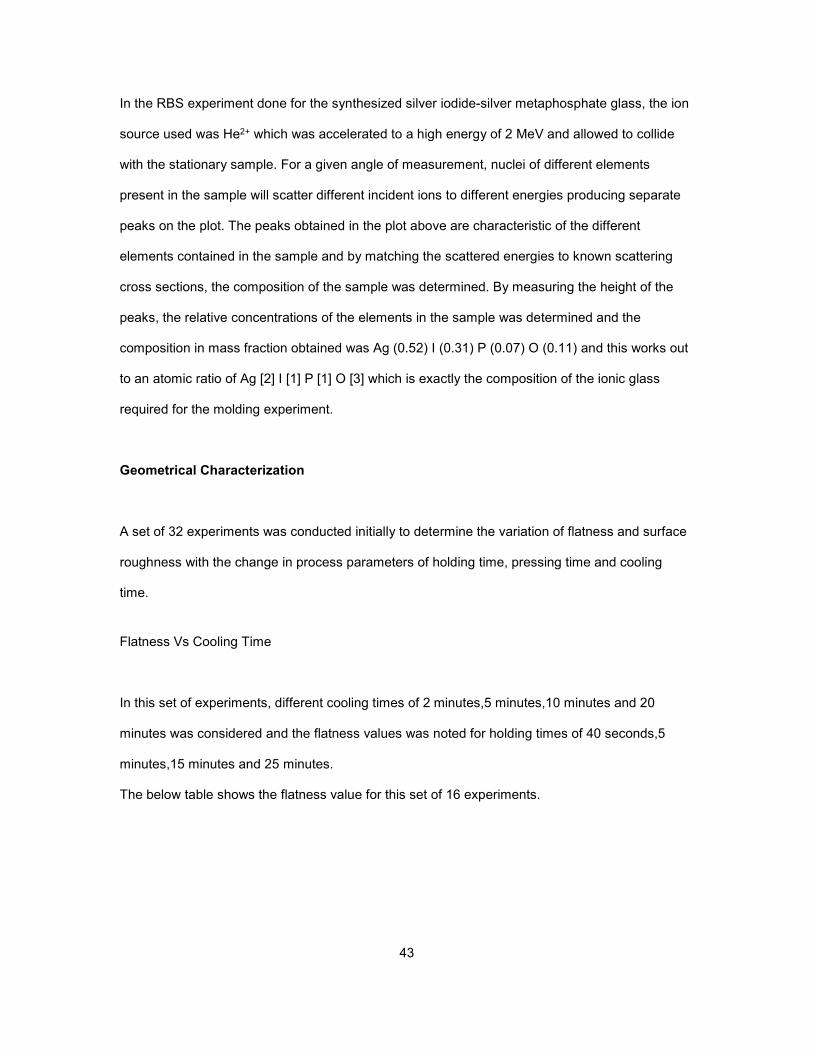
43
In the RBS experiment done for the synthesized silver iodide-silver metaphosphate glass, the ion
source used was He2+ which was accelerated to a high energy of 2 MeV and allowed to collide
with the stationary sample. For a given angle of measurement, nuclei of different elements
present in the sample will scatter different incident ions to different energies producing separate
peaks on the plot. The peaks obtained in the plot above are characteristic of the different
elements contained in the sample and by matching the scattered energies to known scattering
cross sections, the composition of the sample was determined. By measuring the height of the
peaks, the relative concentrations of the elements in the sample was determined and the
composition in mass fraction obtained was Ag (0.52) I (0.31) P (0.07) O (0.11) and this works out
to an atomic ratio of Ag [2] I [1] P [1] O [3] which is exactly the composition of the ionic glass
required for the molding experiment.
Geometrical Characterization
A set of 32 experiments was conducted initially to determine the variation of flatness and surface
roughness with the change in process parameters of holding time, pressing time and cooling
time.
Flatness Vs Cooling Time
In this set of experiments, different cooling times of 2 minutes,5 minutes,10 minutes and 20
minutes was considered and the flatness values was noted for holding times of 40 seconds,5
minutes,15 minutes and 25 minutes.
The below table shows the flatness value for this set of 16 experiments.
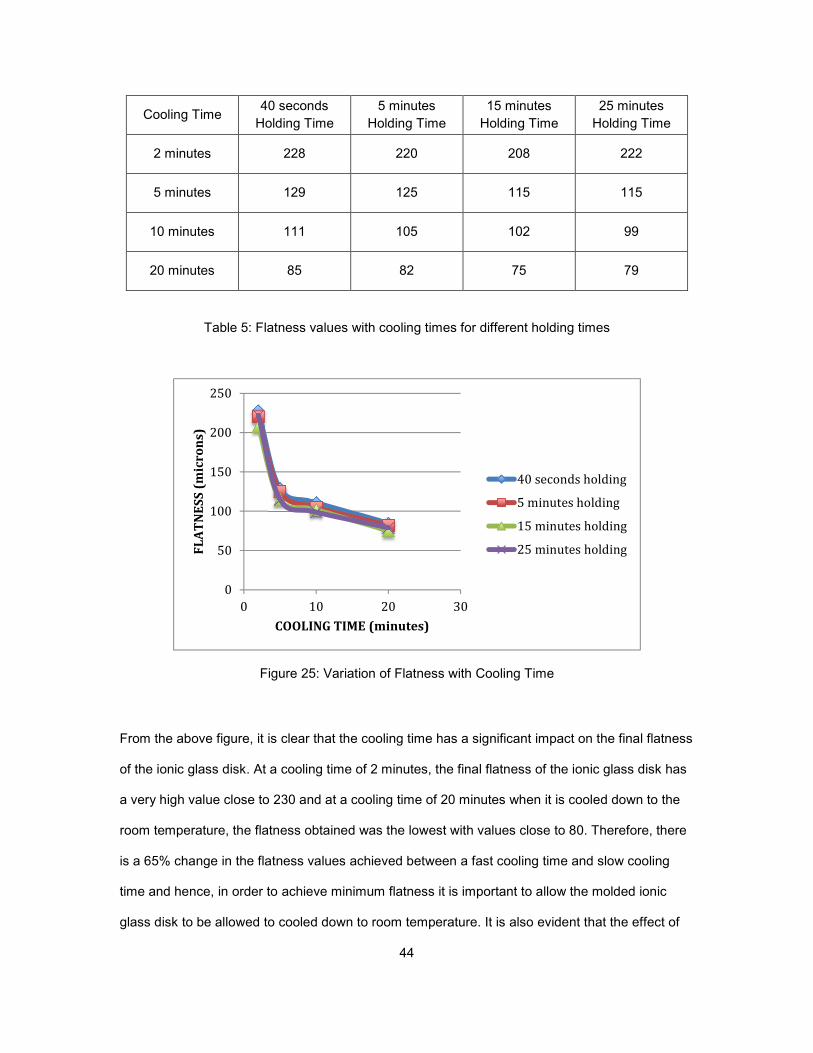
44
Cooling Time 40 seconds
Holding Time
5 minutes
Holding Time
15 minutes
Holding Time
25 minutes
Holding Time
2 minutes 228 220 208 222
5 minutes 129 125 115 115
10 minutes 111 105 102 99
20 minutes 85 82 75 79
Table 5: Flatness values with cooling times for different holding times
Figure 25: Variation of Flatness with Cooling Time
From the above figure, it is clear that the cooling time has a significant impact on the final flatness
of the ionic glass disk. At a cooling time of 2 minutes, the final flatness of the ionic glass disk has
a very high value close to 230 and at a cooling time of 20 minutes when it is cooled down to the
room temperature, the flatness obtained was the lowest with values close to 80. Therefore, there
is a 65% change in the flatness values achieved between a fast cooling time and slow cooling
time and hence, in order to achieve minimum flatness it is important to allow the molded ionic
glass disk to be allowed to cooled down to room temperature. It is also evident that the effect of
0
50
100
150
200
250
0 10 20 30
FL
AT
NE
SS
(m
icro
ns)
COOLING TIME (minutes)
40 seconds holding
5 minutes holding
15 minutes holding
25 minutes holding
45
holding times for the same cooling time on the flatness is less significant and the percentage
change between values is always less than 10% but it can be seen that for the best flatness, it is
best to have a holding time of 15 minutes.
Cooling time relates to the stage of the compression molding process in which the entire molded
setup is allowed to cool down after the removal of application of molding pressure and
temperature. In this experiment, we have varied it between 2 minutes and 20 minutes and from
the experimental results, it can be seen that for obtaining the minimum flatness value, the
optimum cooling time is 20 minutes i.e. when the molded glass disk is at the room temperature.
During the cooling of the molded glass disk, from the molding to room temperature two main
effects result in the final geometry of the molded glass disk being affected which includes thermal
shrinkage generated due to uneven temperature distribution and volume differences due to phase
change of the ionic glass material. Both these effects contribute to the formation of residual
stresses during the cooling process. Residual stress are caused by temperature variations
throughout the molded glass disk and also due to temperature variations (thermal shrinkage) in
combination with a phase transformation. Thermal shrinkage develops non-uniform stress due to
different rates of cooling being experienced by the surface and interior of the molded glass disk.
During cooling from the molding temperature of 110oc, the outer portion of the molded glass disk
will cool first and that portion contracts, compressing the hotter inner portion of the molded glass
disk. As the inner portions of the molded glass disk cools, the molded glass disk tries to contract,
but this will be constrained by the outer portion which has already been cooled. As a result of this,
the inner surface of the molded glass disk will have a residual tensile stress and the outer surface
of the molded glass disk will experience compressive stress.
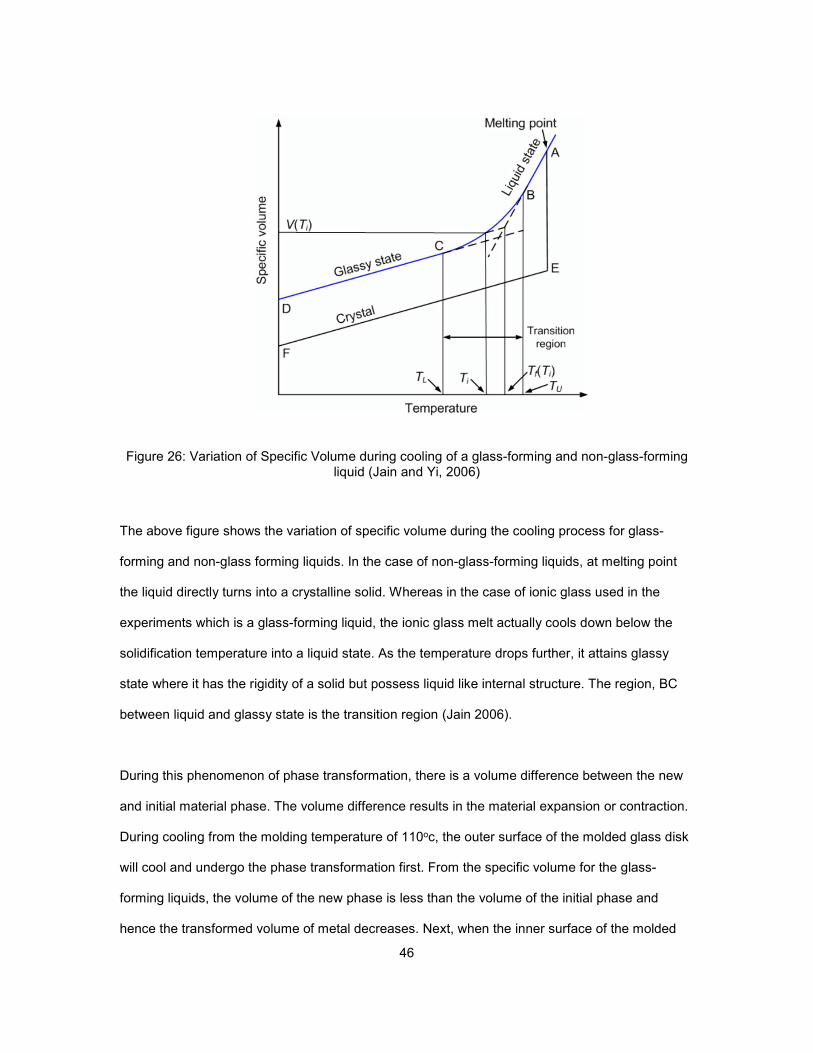
46
Figure 26: Variation of Specific Volume during cooling of a glass-forming and non-glass-forming liquid (Jain and Yi, 2006)
The above figure shows the variation of specific volume during the cooling process for glass-
forming and non-glass forming liquids. In the case of non-glass-forming liquids, at melting point
the liquid directly turns into a crystalline solid. Whereas in the case of ionic glass used in the
experiments which is a glass-forming liquid, the ionic glass melt actually cools down below the
solidification temperature into a liquid state. As the temperature drops further, it attains glassy
state where it has the rigidity of a solid but possess liquid like internal structure. The region, BC
between liquid and glassy state is the transition region (Jain 2006).
During this phenomenon of phase transformation, there is a volume difference between the new
and initial material phase. The volume difference results in the material expansion or contraction.
During cooling from the molding temperature of 110oc, the outer surface of the molded glass disk
will cool and undergo the phase transformation first. From the specific volume for the glass-
forming liquids, the volume of the new phase is less than the volume of the initial phase and
hence the transformed volume of metal decreases. Next, when the inner surface of the molded
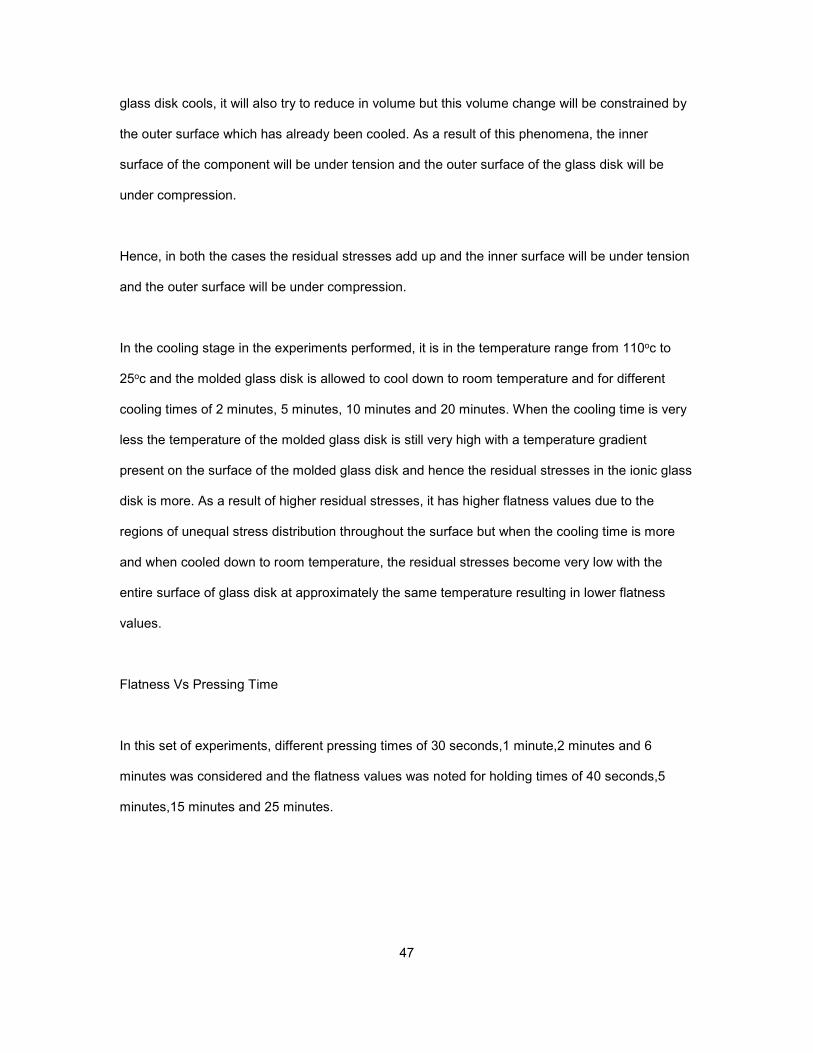
47
glass disk cools, it will also try to reduce in volume but this volume change will be constrained by
the outer surface which has already been cooled. As a result of this phenomena, the inner
surface of the component will be under tension and the outer surface of the glass disk will be
under compression.
Hence, in both the cases the residual stresses add up and the inner surface will be under tension
and the outer surface will be under compression.
In the cooling stage in the experiments performed, it is in the temperature range from 110oc to
25oc and the molded glass disk is allowed to cool down to room temperature and for different
cooling times of 2 minutes, 5 minutes, 10 minutes and 20 minutes. When the cooling time is very
less the temperature of the molded glass disk is still very high with a temperature gradient
present on the surface of the molded glass disk and hence the residual stresses in the ionic glass
disk is more. As a result of higher residual stresses, it has higher flatness values due to the
regions of unequal stress distribution throughout the surface but when the cooling time is more
and when cooled down to room temperature, the residual stresses become very low with the
entire surface of glass disk at approximately the same temperature resulting in lower flatness
values.
Flatness Vs Pressing Time
In this set of experiments, different pressing times of 30 seconds,1 minute,2 minutes and 6
minutes was considered and the flatness values was noted for holding times of 40 seconds,5
minutes,15 minutes and 25 minutes.
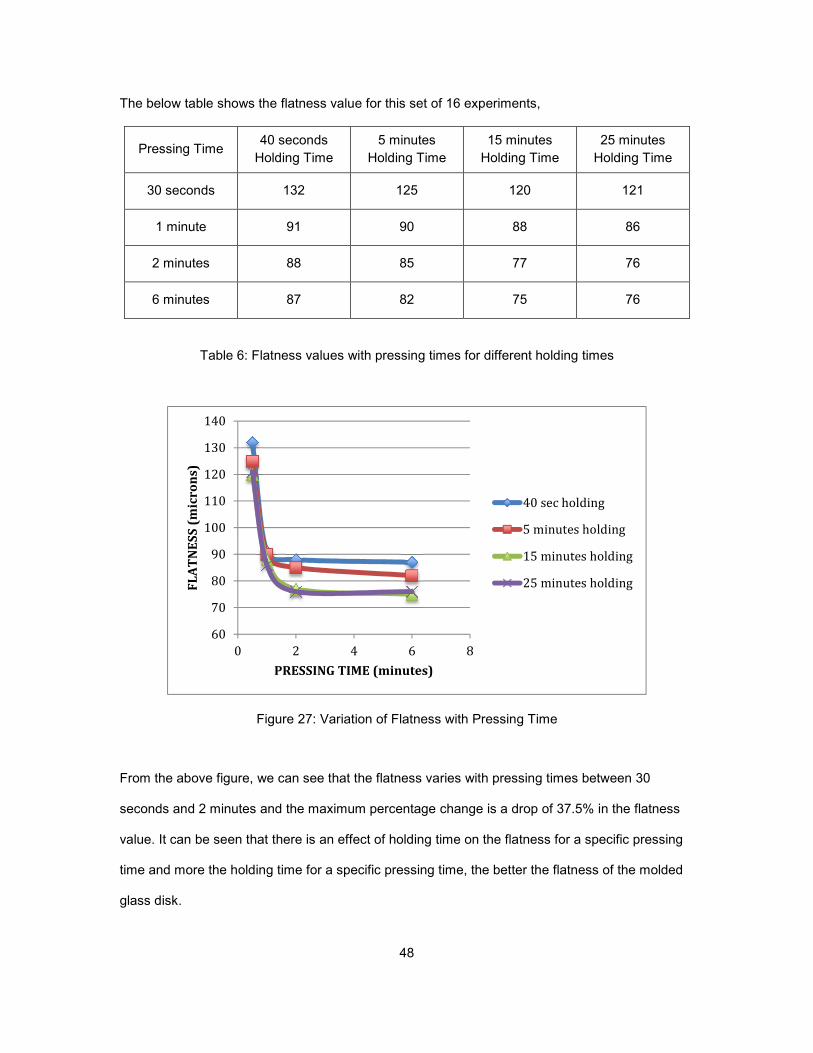
48
The below table shows the flatness value for this set of 16 experiments,
Pressing Time 40 seconds
Holding Time
5 minutes
Holding Time
15 minutes
Holding Time
25 minutes
Holding Time
30 seconds 132 125 120 121
1 minute 91 90 88 86
2 minutes 88 85 77 76
6 minutes 87 82 75 76
Table 6: Flatness values with pressing times for different holding times
Figure 27: Variation of Flatness with Pressing Time
From the above figure, we can see that the flatness varies with pressing times between 30
seconds and 2 minutes and the maximum percentage change is a drop of 37.5% in the flatness
value. It can be seen that there is an effect of holding time on the flatness for a specific pressing
time and more the holding time for a specific pressing time, the better the flatness of the molded
glass disk.
60
70
80
90
100
110
120
130
140
0 2 4 6 8
FL
AT
NE
SS
(m
icro
ns)
PRESSING TIME (minutes)
40 sec holding
5 minutes holding
15 minutes holding
25 minutes holding
49
Beyond a pressing time of 2 minutes, there isn’t any significant effect on the flatness by
increasing the pressing time. At a minimum pressing time of 30 seconds, the flatness value is
very high and has values in the range of about 120-130 microns and at 2 minutes, a minimum
value of 75 microns is achieved. The cooling time used in this set of experiments was constant at
20 minutes as it was determined from the previous set of experiments that the minimum value for
the flatness is achieved by cooling the sample to room temperature after the molding process i.e.
it takes about 20 minutes to go from 110oC to 25oC.
Pressing time relates to the stage of the compression molding process in which a constant
molding pressure is applied after holding the powdered glass at the molding temperature for a
specified holding time and this pressure is applied and held constant for a time known as the
pressing time.
The phenomenon undergone by the ionic glass during this pressing process is viscoelastic creep.
Creep is the tendency of a material to move or deform permanently under the influence of
mechanical stresses and it occurs as a result of exposure to stress levels that are below the yield
strength of the material. The rate of deformation undergone by the ionic glass is a function of the
ionic glass properties, time for which the stress is applied, the temperature at which the stress is
applied and the value of stress acting on the ionic glass. Since the molding is done at
temperature in the transition temperature range, the response of ionic glass to the applied stress
will exhibit both fluid and solid like behavior, and hence it is referred to as viscoelastic creep.
The residual strain experienced by the material due to the applied stress of 4 MPa depends upon
the time for which the stress is applied, referred to as the pressing time in our case. Once the
molding pressure has been applied for a specific pressing time, the ionic glass starts undergoing
time-dependent deformation and conforms to the shape of the die cavity and then the strain starts
reducing resulting in a final residual strain in the ionic glass which is permanent. For low pressing
times, it can be seen that the flatness values are high which signifies there is more residual strain
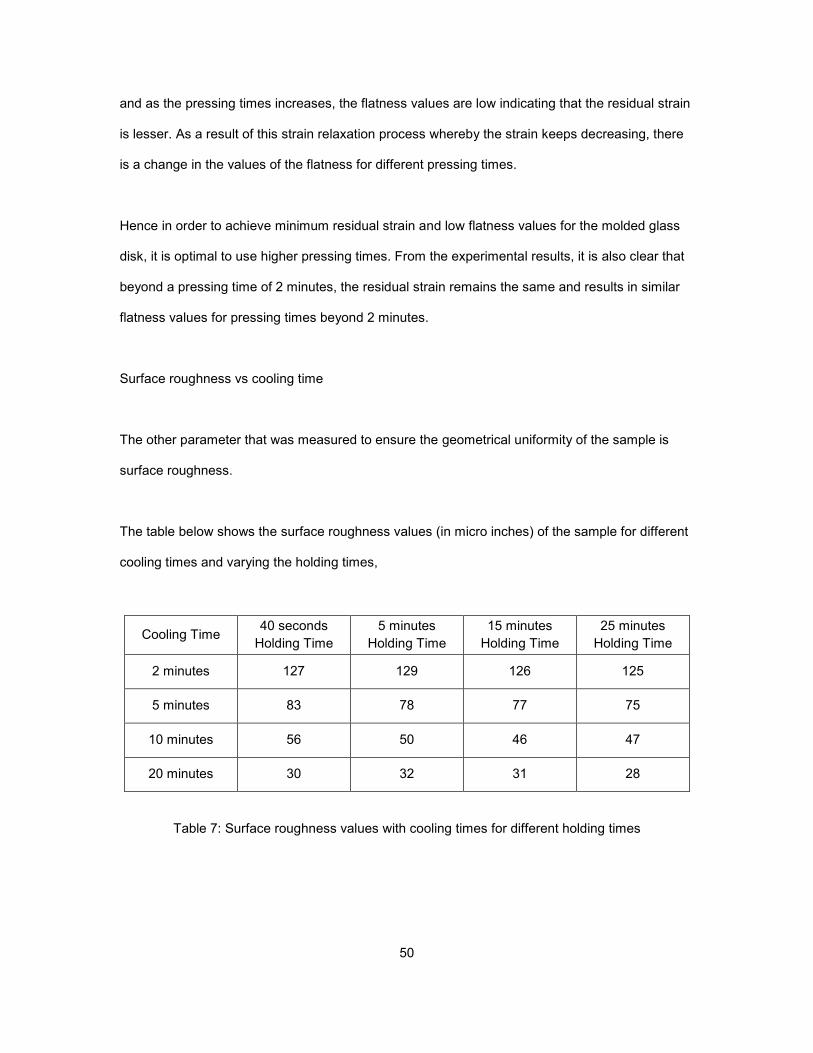
50
and as the pressing times increases, the flatness values are low indicating that the residual strain
is lesser. As a result of this strain relaxation process whereby the strain keeps decreasing, there
is a change in the values of the flatness for different pressing times.
Hence in order to achieve minimum residual strain and low flatness values for the molded glass
disk, it is optimal to use higher pressing times. From the experimental results, it is also clear that
beyond a pressing time of 2 minutes, the residual strain remains the same and results in similar
flatness values for pressing times beyond 2 minutes.
Surface roughness vs cooling time
The other parameter that was measured to ensure the geometrical uniformity of the sample is
surface roughness.
The table below shows the surface roughness values (in micro inches) of the sample for different
cooling times and varying the holding times,
Cooling Time 40 seconds
Holding Time
5 minutes
Holding Time
15 minutes
Holding Time
25 minutes
Holding Time
2 minutes 127 129 126 125
5 minutes 83 78 77 75
10 minutes 56 50 46 47
20 minutes 30 32 31 28
Table 7: Surface roughness values with cooling times for different holding times

51
Figure 28: Variation of surface roughness with cooling time
The surface roughness varies with the cooling time similar to how flatness varies with different
cooling times and it can be seen that the minimum surface roughness is achieved at cooling time
of 20 minutes when the molded glass disk is at the room temperature. The surface roughness
follows a parabolic power curve and it drops from a value of 129 micro inches to 28 micro inches
at 2 minutes of cooling to 20 minutes of cooling time. It can also be seen that the holding time
does not have much of an effect on the surface roughness values for the same pressing time.
As previously explained, during the cooling of the molded glass disk from the molding to room
temperature thermal shrinkage is generated due to uneven temperature distribution and volume
change due to phase change of the ionic glass material affects the final form and geometry of the
molded glass disk. The thermal shrinkage and volume change results in buildup of residual
stresses which cause tensile stresses on the inner surface and compressive stresses on the
outer surface of the molded glass disk. Therefore, at low cooling times there is a temperature
gradient between the inner and outer surfaces of the molded glass disk which results in more
residual stresses and hence the higher surface roughness values. At higher cooling times, the
0
20
40
60
80
100
120
140
0 5 10 15 20 25
SU
RF
AC
E R
OU
GH
NE
SS
(m
icro
inc
he
s)
COOLING TIME (minutes)
40 seconds holding
5 minutes holding
15 minutes holding
25 minutes holding

52
temperature gradient is less and when cooled to room temperature it is almost negligible as the
stresses are relaxed and as a result of this, the residual stresses will be lesser resulting in
uniform geometry and low surface roughness values.
Since it is not possible to cool beyond room temperature and we got the result that the minimum
flatness and surface roughness is achieved by cooling the molded glass disk to room temperature
when there is minimal residual stresses, the optimum cooling time for best flatness and surface
roughness is 20 minutes from experimental results.
Surface Roughness Vs Pressing Time
Experiments were conducted to understand the effect of pressing time on the surface roughness
for different holding times. The same set of holding times considered in previous experiments was
also used here ranging from 40 seconds to 25 minutes.
Pressing Time 40 seconds
Holding Time
5 minutes
Holding Time
15 minutes
Holding Time
25 minutes
Holding Time
30 seconds 107 105 110 106
1 minute 73 76 75 72
2 minutes 42 45 40 43
6 minutes 34 35 30 32
Table 8: Surface roughness values with pressing times for different holding times
From the table above, it can be seen that the surface roughness has high values at low pressing
times and the lowest values at high pressing times.

53
Figure 29: Variation of Surface Roughness with Pressing Time
From the figure above, we can confirm that the surface roughness keeps decreasing with
increase in pressing time and has the lowest value at pressing time of 6 minutes. Unlike flatness,
which remains a constant after 2 minutes of pressing time, it can be seen that the surface
roughness keeps decreasing after 2 minutes for different holding times.
During the pressing stage, the ionic glass is subjected to a constant stress at the molding
temperature. The phenomenon undergone by the ionic glass during this pressing process is
viscoelastic creep. The rate of deformation undergone by the ionic glass is a function of the ionic
glass properties, time for which the stress is applied, the temperature at which the stress is
applied and the value of stress acting on the ionic glass. Since the molding is done at
temperature in the transition temperature range, the response of ionic glass to the applied stress
exhibits both fluid and solid like behavior, and hence it is referred to as viscoelastic creep.
The residual strain undergone by the material due to the applied stress of 4 MPa depends upon
the time for which the stress is applied, referred to as the pressing time in our case. Once the
molding pressure has been applied for a specific pressing time, the ionic glass starts undergoing
0
20
40
60
80
100
120
0 2 4 6 8
SU
RF
AC
E R
OU
GH
NE
SS
(mic
roin
ch
es)
PRESSING TIME (minutes)
40 sec holding
5 minutes holding
15 minutes holding
25 minutes holding
54
a time-dependent deformation and conforms to the final shape of the cavities between the dies
and after that the strain decreases and hence results in a final residual strain in the ionic glass
which is permanent. For low pressing times, it can be seen that the surface roughness values are
high which signifies more residual strain present in the ionic glass and as the pressing times
increases, the surface roughness values are low which shows that the residual strain in the ionic
glass is less. As a result of this strain relaxation process, there is a change in the values of
surface roughness for different pressing times.
Hence in order to achieve minimum residual strain and low surface roughness values for the
molded glass disk, it is optimal to use higher pressing times and from the experimental results the
minimum surface roughness is obtained at a pressing time of 6 minutes.
The limitation of this experiment is that since the surface roughness keeps decreasing for
increasing pressing times, and since the limit with the experimental setup used is 6 minutes it is
not clear if the surface roughness will keep further decreasing for further increase in pressing
times.
Statistical Analysis
Flatness
A full factorial experiment was designed to understand the relative significance of the effects of
holding time, pressing time and cooling time on the final flatness and surface roughness of the
molded ionic glass. Hence, there were three parameters and each parameter had two levels of
low and high values and one replicate was done which results in a total of 16 experiments done in
a completely randomized order. The below table shows the set of random 16 experiments done
for the statistical analysis and the results of flatness values obtained are also shown.
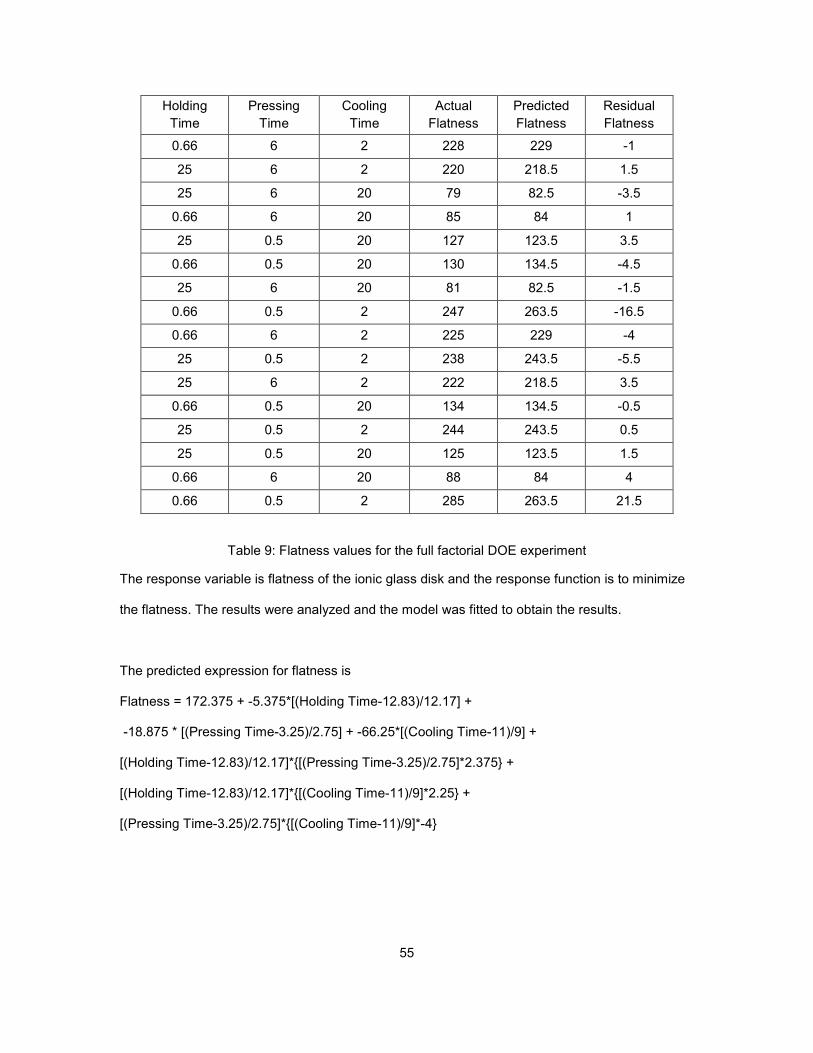
55
Holding
Time
Pressing
Time
Cooling
Time
Actual
Flatness
Predicted
Flatness
Residual
Flatness
0.66 6 2 228 229 -1
25 6 2 220 218.5 1.5
25 6 20 79 82.5 -3.5
0.66 6 20 85 84 1
25 0.5 20 127 123.5 3.5
0.66 0.5 20 130 134.5 -4.5
25 6 20 81 82.5 -1.5
0.66 0.5 2 247 263.5 -16.5
0.66 6 2 225 229 -4
25 0.5 2 238 243.5 -5.5
25 6 2 222 218.5 3.5
0.66 0.5 20 134 134.5 -0.5
25 0.5 2 244 243.5 0.5
25 0.5 20 125 123.5 1.5
0.66 6 20 88 84 4
0.66 0.5 2 285 263.5 21.5
Table 9: Flatness values for the full factorial DOE experiment
The response variable is flatness of the ionic glass disk and the response function is to minimize
the flatness. The results were analyzed and the model was fitted to obtain the results.
The predicted expression for flatness is
Flatness = 172.375 + -5.375*[(Holding Time-12.83)/12.17] +
-18.875 * [(Pressing Time-3.25)/2.75] + -66.25*[(Cooling Time-11)/9] +
[(Holding Time-12.83)/12.17]*{[(Pressing Time-3.25)/2.75]*2.375} +
[(Holding Time-12.83)/12.17]*{[(Cooling Time-11)/9]*2.25} +
[(Pressing Time-3.25)/2.75]*{[(Cooling Time-11)/9]*-4}
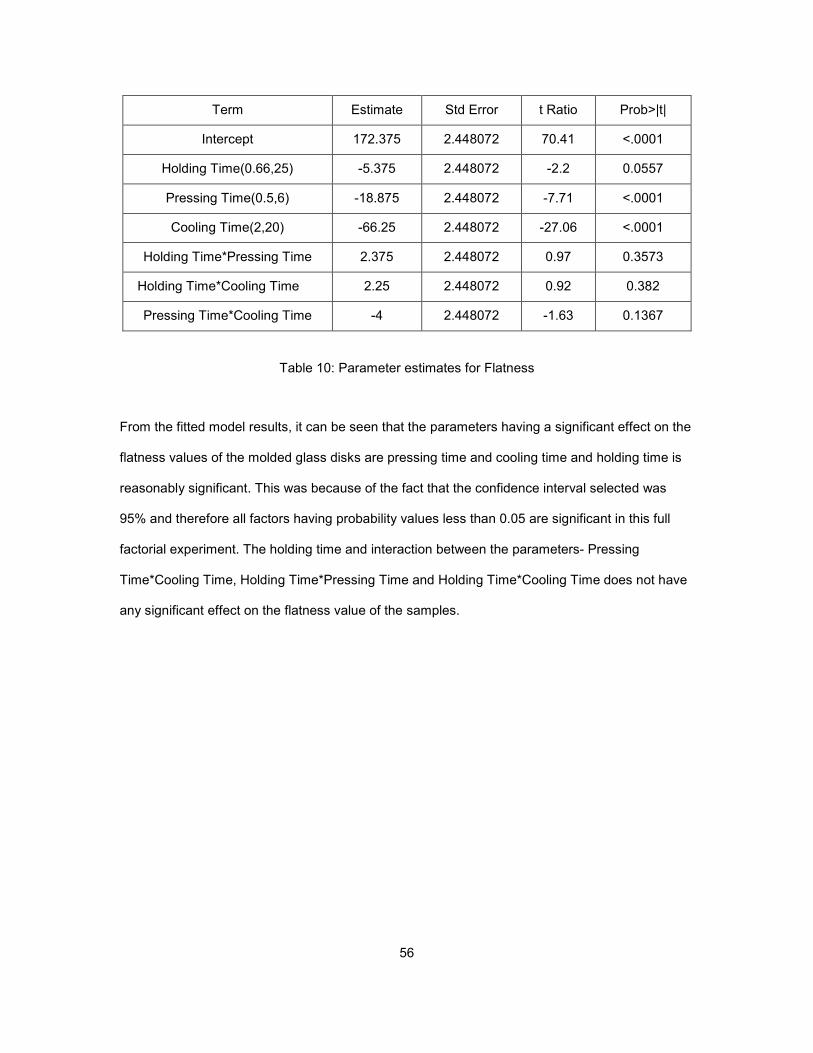
56
Term Estimate Std Error t Ratio Prob>|t|
Intercept 172.375 2.448072 70.41 <.0001
Holding Time(0.66,25) -5.375 2.448072 -2.2 0.0557
Pressing Time(0.5,6) -18.875 2.448072 -7.71 <.0001
Cooling Time(2,20) -66.25 2.448072 -27.06 <.0001
Holding Time*Pressing Time 2.375 2.448072 0.97 0.3573
Holding Time*Cooling Time 2.25 2.448072 0.92 0.382
Pressing Time*Cooling Time -4 2.448072 -1.63 0.1367
Table 10: Parameter estimates for Flatness
From the fitted model results, it can be seen that the parameters having a significant effect on the
flatness values of the molded glass disks are pressing time and cooling time and holding time is
reasonably significant. This was because of the fact that the confidence interval selected was
95% and therefore all factors having probability values less than 0.05 are significant in this full
factorial experiment. The holding time and interaction between the parameters- Pressing
Time*Cooling Time, Holding Time*Pressing Time and Holding Time*Cooling Time does not have
any significant effect on the flatness value of the samples.
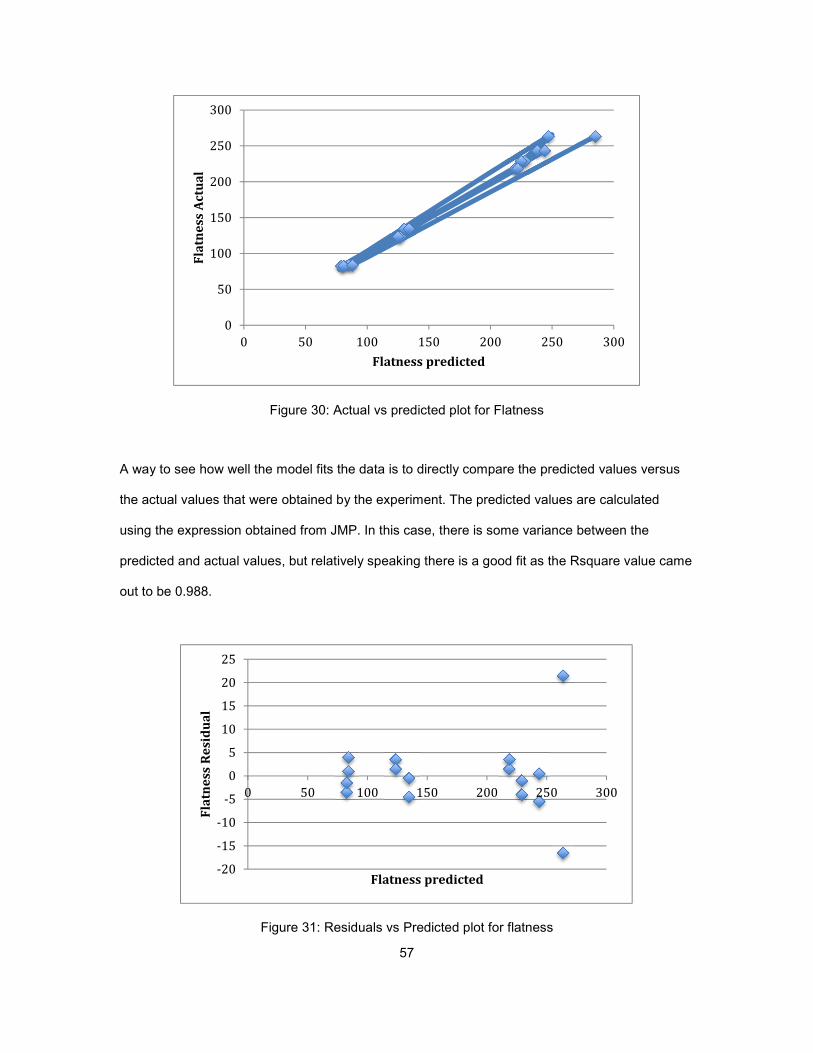
57
Figure 30: Actual vs predicted plot for Flatness
A way to see how well the model fits the data is to directly compare the predicted values versus
the actual values that were obtained by the experiment. The predicted values are calculated
using the expression obtained from JMP. In this case, there is some variance between the
predicted and actual values, but relatively speaking there is a good fit as the Rsquare value came
out to be 0.988.
Figure 31: Residuals vs Predicted plot for flatness
0
50
100
150
200
250
300
0 50 100 150 200 250 300
Fla
tne
ss A
ctu
al
Flatness predicted
-20
-15
-10
-5
0
5
10
15
20
25
0 50 100 150 200 250 300
Fla
tne
ss R
esi
du
al
Flatness predicted
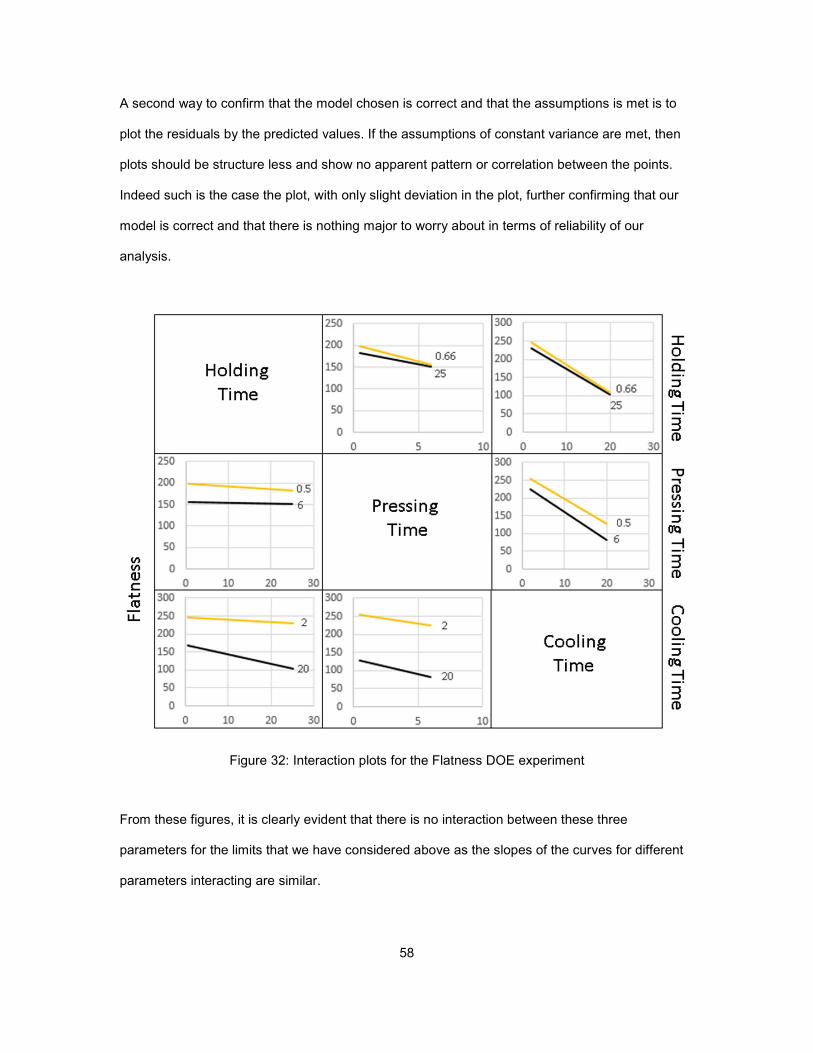
58
A second way to confirm that the model chosen is correct and that the assumptions is met is to
plot the residuals by the predicted values. If the assumptions of constant variance are met, then
plots should be structure less and show no apparent pattern or correlation between the points.
Indeed such is the case the plot, with only slight deviation in the plot, further confirming that our
model is correct and that there is nothing major to worry about in terms of reliability of our
analysis.
Figure 32: Interaction plots for the Flatness DOE experiment
From these figures, it is clearly evident that there is no interaction between these three
parameters for the limits that we have considered above as the slopes of the curves for different
parameters interacting are similar.
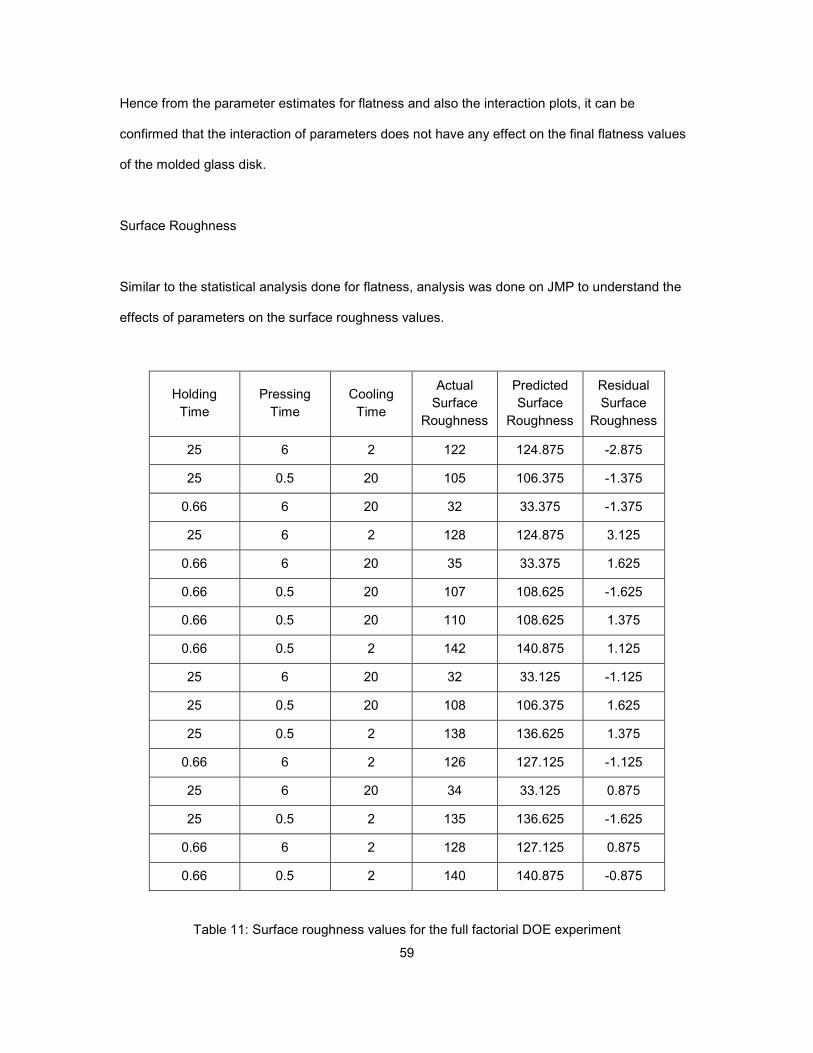
59
Hence from the parameter estimates for flatness and also the interaction plots, it can be
confirmed that the interaction of parameters does not have any effect on the final flatness values
of the molded glass disk.
Surface Roughness
Similar to the statistical analysis done for flatness, analysis was done on JMP to understand the
effects of parameters on the surface roughness values.
Holding
Time
Pressing
Time
Cooling
Time
Actual
Surface
Roughness
Predicted
Surface
Roughness
Residual
Surface
Roughness
25 6 2 122 124.875 -2.875
25 0.5 20 105 106.375 -1.375
0.66 6 20 32 33.375 -1.375
25 6 2 128 124.875 3.125
0.66 6 20 35 33.375 1.625
0.66 0.5 20 107 108.625 -1.625
0.66 0.5 20 110 108.625 1.375
0.66 0.5 2 142 140.875 1.125
25 6 20 32 33.125 -1.125
25 0.5 20 108 106.375 1.625
25 0.5 2 138 136.625 1.375
0.66 6 2 126 127.125 -1.125
25 6 20 34 33.125 0.875
25 0.5 2 135 136.625 -1.625
0.66 6 2 128 127.125 0.875
0.66 0.5 2 140 140.875 -0.875
Table 11: Surface roughness values for the full factorial DOE experiment
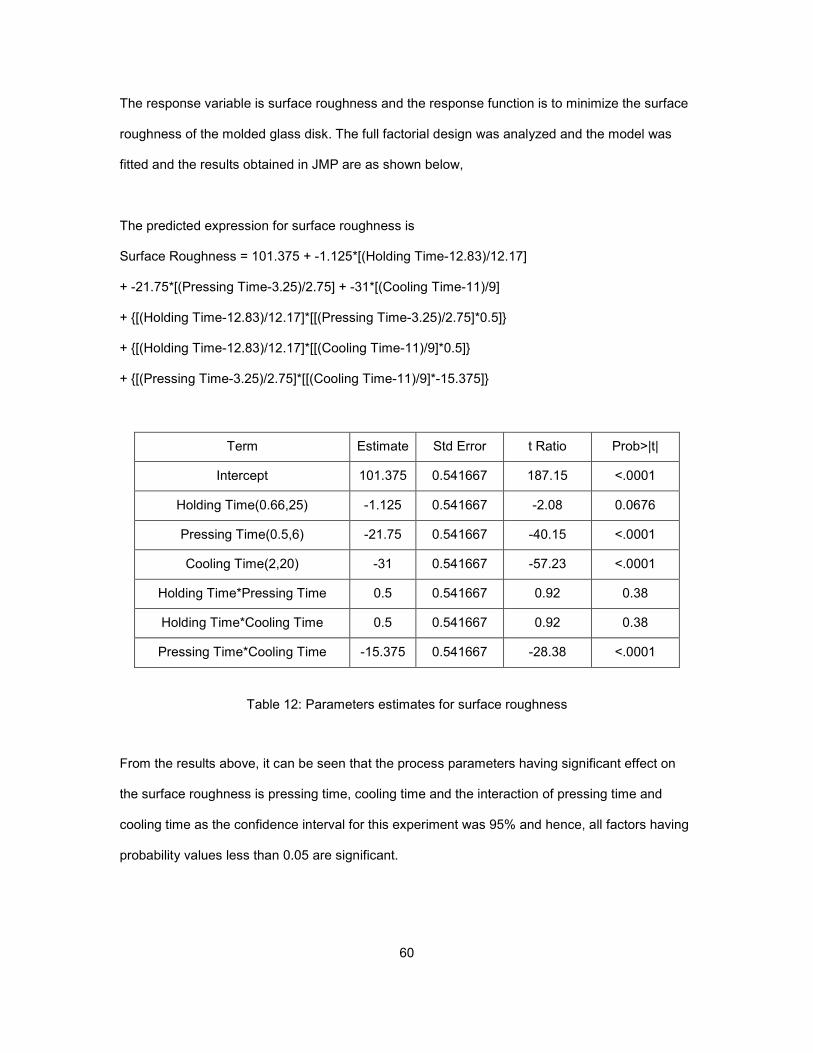
60
The response variable is surface roughness and the response function is to minimize the surface
roughness of the molded glass disk. The full factorial design was analyzed and the model was
fitted and the results obtained in JMP are as shown below,
The predicted expression for surface roughness is
Surface Roughness = 101.375 + -1.125*[(Holding Time-12.83)/12.17]
+ -21.75*[(Pressing Time-3.25)/2.75] + -31*[(Cooling Time-11)/9]
+ {[(Holding Time-12.83)/12.17]*[[(Pressing Time-3.25)/2.75]*0.5]}
+ {[(Holding Time-12.83)/12.17]*[[(Cooling Time-11)/9]*0.5]}
+ {[(Pressing Time-3.25)/2.75]*[[(Cooling Time-11)/9]*-15.375]}
Term Estimate Std Error t Ratio Prob>|t|
Intercept 101.375 0.541667 187.15 <.0001
Holding Time(0.66,25) -1.125 0.541667 -2.08 0.0676
Pressing Time(0.5,6) -21.75 0.541667 -40.15 <.0001
Cooling Time(2,20) -31 0.541667 -57.23 <.0001
Holding Time*Pressing Time 0.5 0.541667 0.92 0.38
Holding Time*Cooling Time 0.5 0.541667 0.92 0.38
Pressing Time*Cooling Time -15.375 0.541667 -28.38 <.0001
Table 12: Parameters estimates for surface roughness
From the results above, it can be seen that the process parameters having significant effect on
the surface roughness is pressing time, cooling time and the interaction of pressing time and
cooling time as the confidence interval for this experiment was 95% and hence, all factors having
probability values less than 0.05 are significant.

61
Figure 33: Predicted vs Actual plot for Surface Roughness
Using the predicted expression obtained above in JMP, the predicted values are calculated and
plotted vs the actual values of surface roughness. The plot of the predicted vs actual is shown
above and the points lie along a straight line indicating that the fit between the predicted model
and the actual data is good because the Rsquare value came out to be 0.998.
Figure 34: Residuals vs Predicted plot for Surface Roughness
0
20
40
60
80
100
120
140
160
0 50 100 150
Su
rfa
ce
Ro
ug
hn
ess
Ac
tua
l
Surface Roughness Predicted
-4
-3
-2
-1
0
1
2
3
4
0 50 100 150
Su
rfa
ce
Ro
ug
hn
ess
Re
sid
ua
l
Surface Roughness Predicted
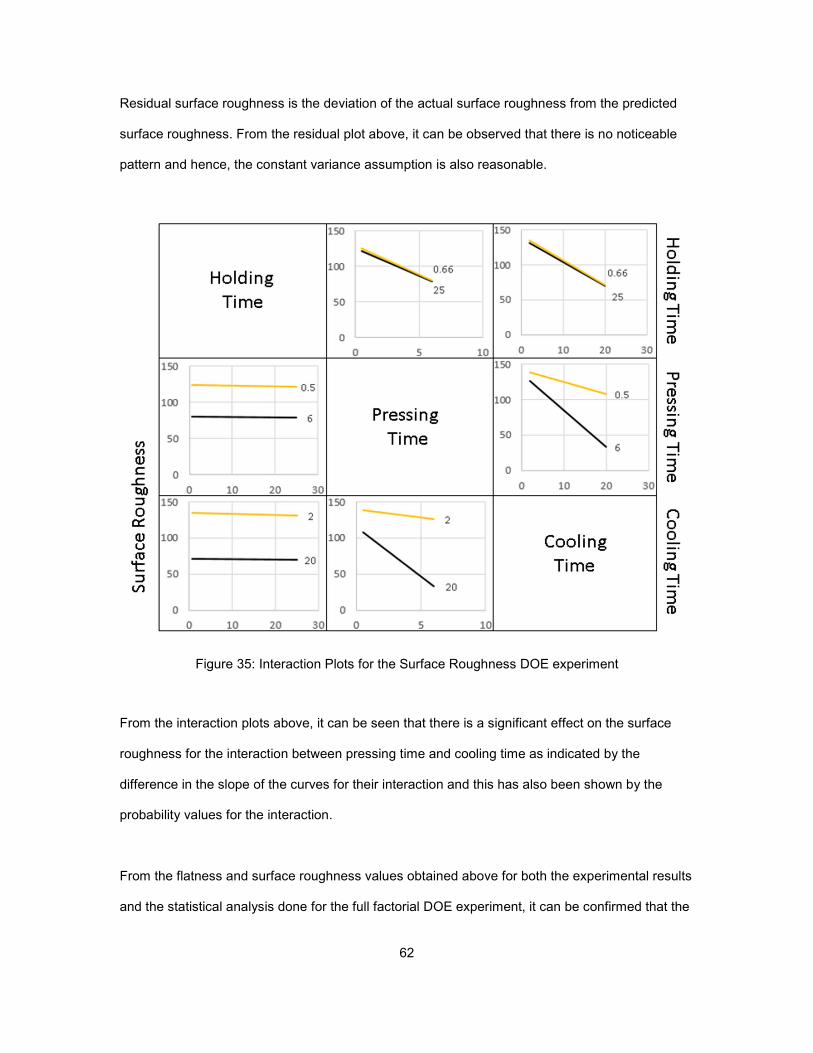
62
Residual surface roughness is the deviation of the actual surface roughness from the predicted
surface roughness. From the residual plot above, it can be observed that there is no noticeable
pattern and hence, the constant variance assumption is also reasonable.
Figure 35: Interaction Plots for the Surface Roughness DOE experiment
From the interaction plots above, it can be seen that there is a significant effect on the surface
roughness for the interaction between pressing time and cooling time as indicated by the
difference in the slope of the curves for their interaction and this has also been shown by the
probability values for the interaction.
From the flatness and surface roughness values obtained above for both the experimental results
and the statistical analysis done for the full factorial DOE experiment, it can be confirmed that the
63
significant parameters affecting the flatness and surface roughness of the molded glass disk is
the pressing time and cooling time.
Holding time does not have a significant effect on the final flatness and surface roughness values
of the molded glass disks as compared to pressing time and cooling time but there is a small
decrease of flatness and surface roughness values with increase in holding time and for all of the
experiments performed, the minimum value of the flatness and surface roughness values is
achieved at 15 minutes and stays relatively constant beyond 15 minutes for different holding
times. During the process of holding time, the powdered ionic glass is subjected to the molding
temperature of 110oc for different holding times and in the experiments conducted, it was allowed
to vary from 40 seconds to 25 minutes. In this period of holding time, the stress acting on the
ionic glass is only due to the weight of the die setup placed on top of it and it comes out to be a
value of 0.006 MPa. This stress is negligible as compared to the molding pressure of 4 MPa
which is acting on the ionic glass during the stage of pressing time. As a result of this small
stress, the effect of viscoelastic creep is minimal and there is only a very small amount of strain
that is experienced by the ionic glass and for lower holding times, the residual strain is slightly
higher than for the ionic glass which is subjected to higher holding times and beyond a holding
time of 15 minutes, there isn’t any effect for the residual strain on the flatness or surface
roughness values.
Pressing time relates to the stage of the compression molding process in which a constant
molding pressure is applied after holding the powdered glass at the molding temperature for a
specified holding time and this pressure is applied and held constant for a time known as the
pressing time. It is during this stage the ionic glass gets deformed and conforms to the final shape
of the cavity between the dies and the ionic glass is experiencing viscoelastic creep during this
stage as a result of which the final geometry of the glass disk is getting affected with the change
in pressing time and for obtaining the best flatness and surface roughness, the optimum pressing
time is 6 minutes. In the case of flatness, the pressing time remains constant after 2 minutes and
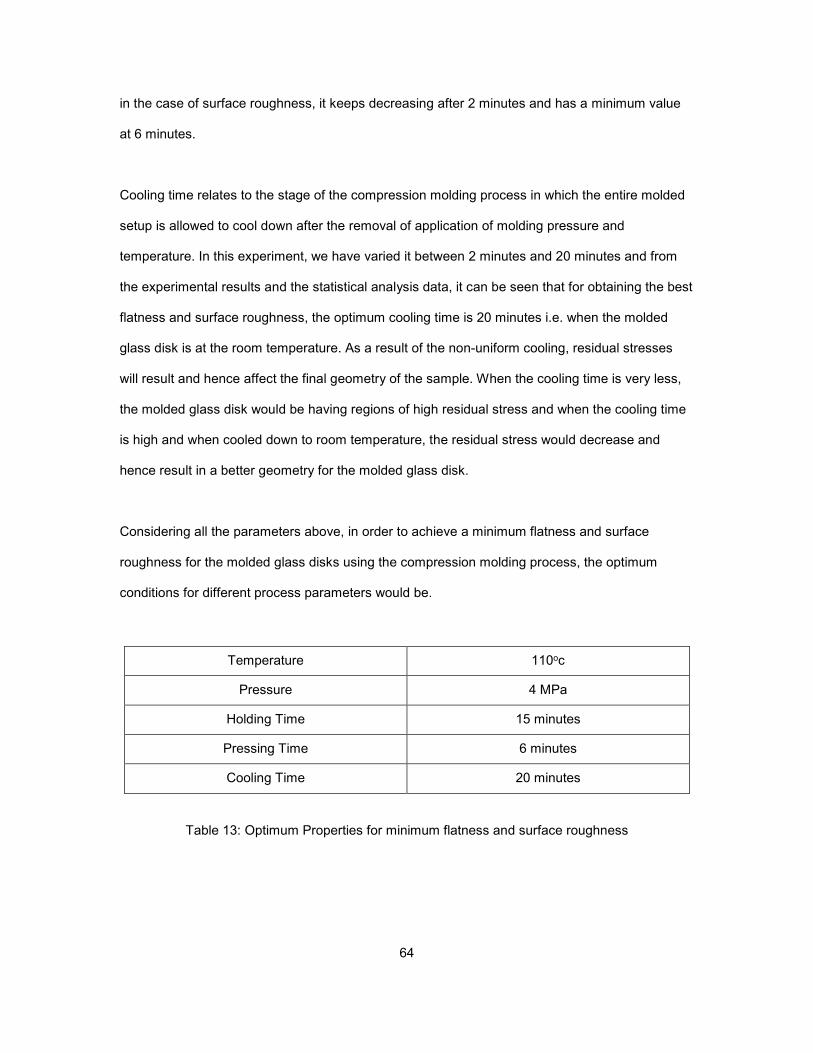
64
in the case of surface roughness, it keeps decreasing after 2 minutes and has a minimum value
at 6 minutes.
Cooling time relates to the stage of the compression molding process in which the entire molded
setup is allowed to cool down after the removal of application of molding pressure and
temperature. In this experiment, we have varied it between 2 minutes and 20 minutes and from
the experimental results and the statistical analysis data, it can be seen that for obtaining the best
flatness and surface roughness, the optimum cooling time is 20 minutes i.e. when the molded
glass disk is at the room temperature. As a result of the non-uniform cooling, residual stresses
will result and hence affect the final geometry of the sample. When the cooling time is very less,
the molded glass disk would be having regions of high residual stress and when the cooling time
is high and when cooled down to room temperature, the residual stress would decrease and
hence result in a better geometry for the molded glass disk.
Considering all the parameters above, in order to achieve a minimum flatness and surface
roughness for the molded glass disks using the compression molding process, the optimum
conditions for different process parameters would be.
Temperature 110oc
Pressure 4 MPa
Holding Time 15 minutes
Pressing Time 6 minutes
Cooling Time 20 minutes
Table 13: Optimum Properties for minimum flatness and surface roughness
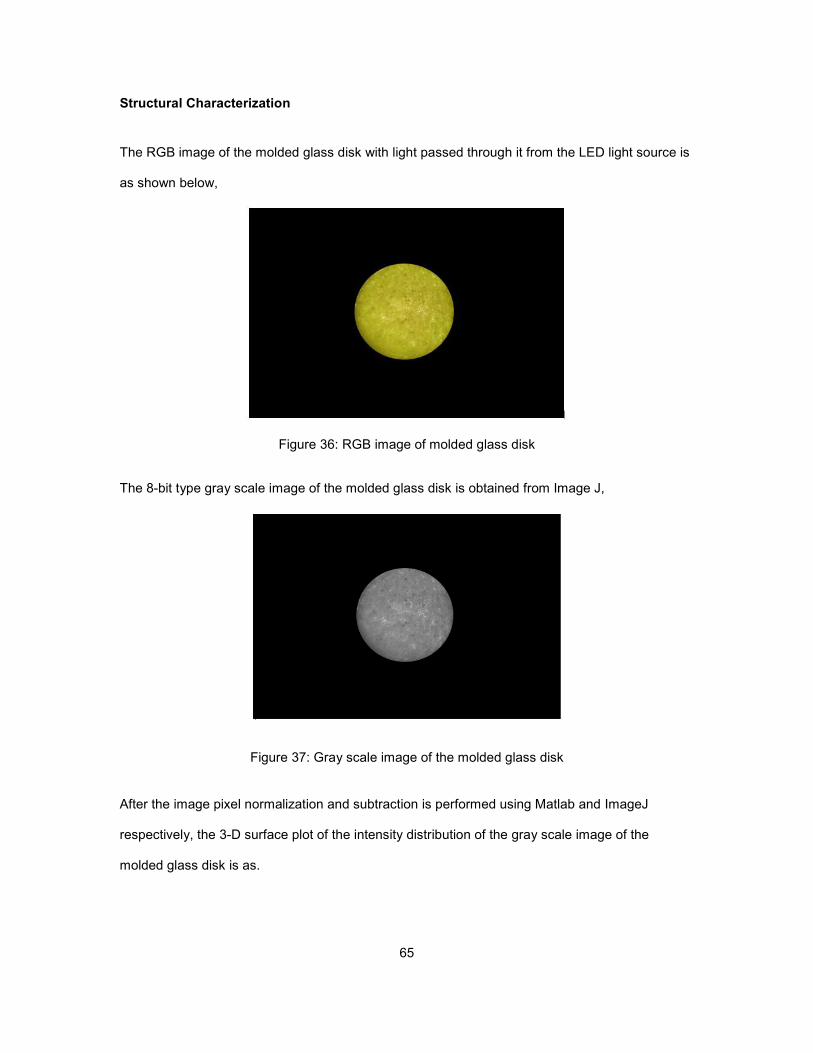
65
Structural Characterization
The RGB image of the molded glass disk with light passed through it from the LED light source is
as shown below,
Figure 36: RGB image of molded glass disk
The 8-bit type gray scale image of the molded glass disk is obtained from Image J,
Figure 37: Gray scale image of the molded glass disk
After the image pixel normalization and subtraction is performed using Matlab and ImageJ
respectively, the 3-D surface plot of the intensity distribution of the gray scale image of the
molded glass disk is as.

66
Figure 38: 3-D surface plot of the molded glass disk
The presence of various peaks throughout the surface of the plot is a measure of the different
intensities corresponding to the various pixels.
Figure 39: Four directions for intensity measurement
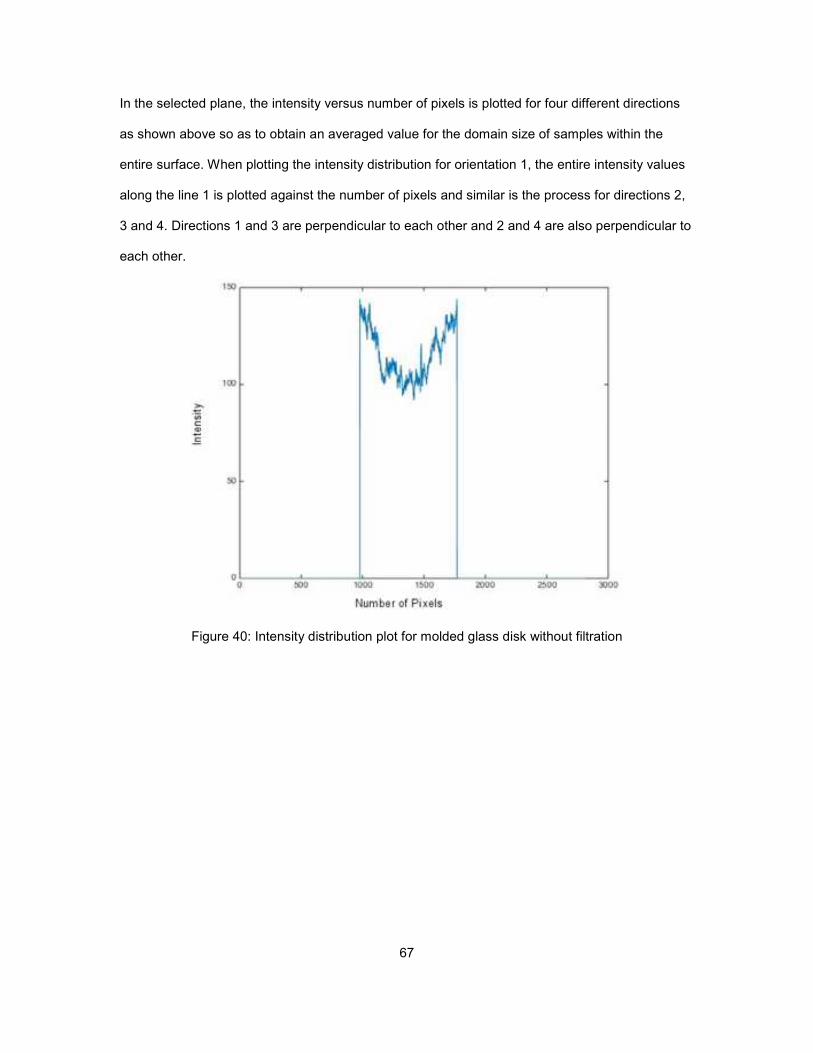
67
In the selected plane, the intensity versus number of pixels is plotted for four different directions
as shown above so as to obtain an averaged value for the domain size of samples within the
entire surface. When plotting the intensity distribution for orientation 1, the entire intensity values
along the line 1 is plotted against the number of pixels and similar is the process for directions 2,
3 and 4. Directions 1 and 3 are perpendicular to each other and 2 and 4 are also perpendicular to
each other.
Figure 40: Intensity distribution plot for molded glass disk without filtration
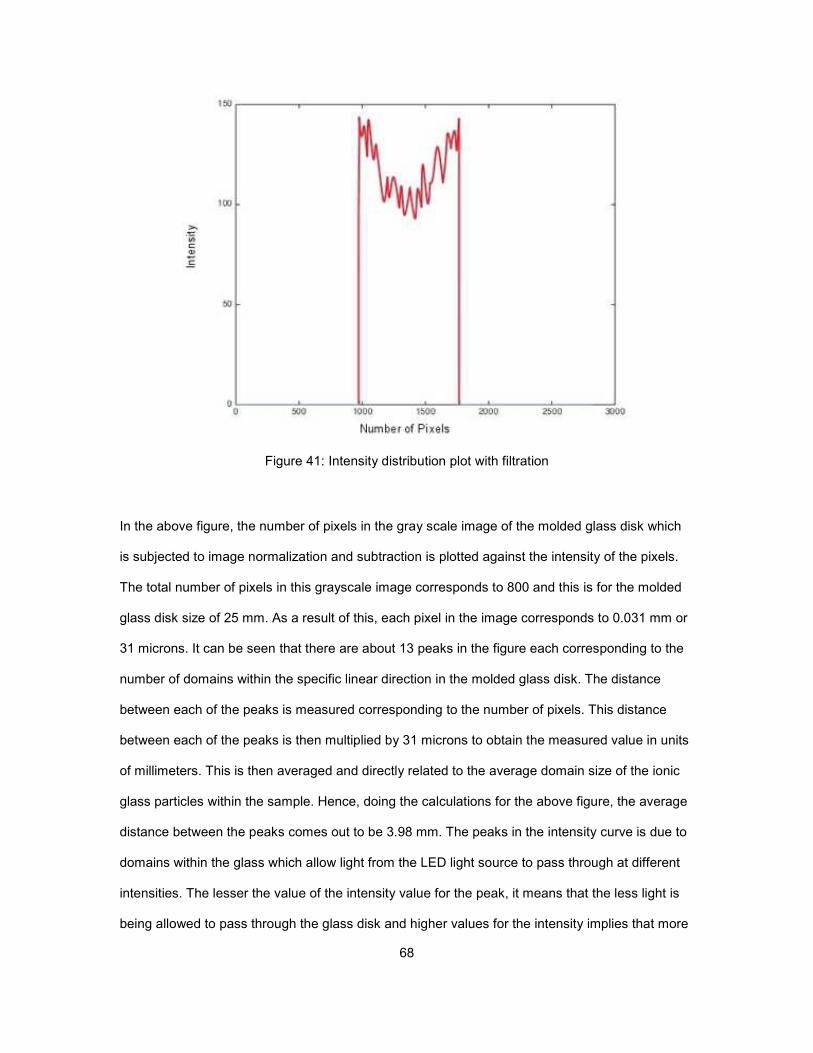
68
Figure 41: Intensity distribution plot with filtration
In the above figure, the number of pixels in the gray scale image of the molded glass disk which
is subjected to image normalization and subtraction is plotted against the intensity of the pixels.
The total number of pixels in this grayscale image corresponds to 800 and this is for the molded
glass disk size of 25 mm. As a result of this, each pixel in the image corresponds to 0.031 mm or
31 microns. It can be seen that there are about 13 peaks in the figure each corresponding to the
number of domains within the specific linear direction in the molded glass disk. The distance
between each of the peaks is measured corresponding to the number of pixels. This distance
between each of the peaks is then multiplied by 31 microns to obtain the measured value in units
of millimeters. This is then averaged and directly related to the average domain size of the ionic
glass particles within the sample. Hence, doing the calculations for the above figure, the average
distance between the peaks comes out to be 3.98 mm. The peaks in the intensity curve is due to
domains within the glass which allow light from the LED light source to pass through at different
intensities. The lesser the value of the intensity value for the peak, it means that the less light is
being allowed to pass through the glass disk and higher values for the intensity implies that more
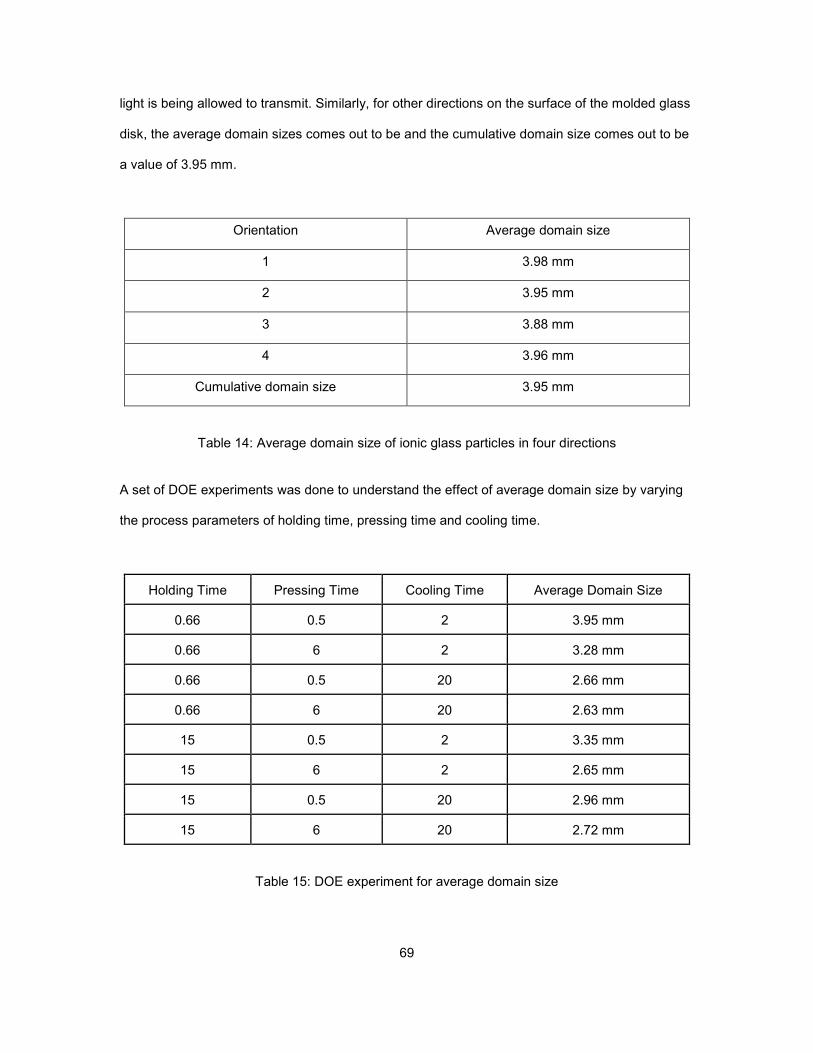
69
light is being allowed to transmit. Similarly, for other directions on the surface of the molded glass
disk, the average domain sizes comes out to be and the cumulative domain size comes out to be
a value of 3.95 mm.
Orientation Average domain size
1 3.98 mm
2 3.95 mm
3 3.88 mm
4 3.96 mm
Cumulative domain size 3.95 mm
Table 14: Average domain size of ionic glass particles in four directions
A set of DOE experiments was done to understand the effect of average domain size by varying
the process parameters of holding time, pressing time and cooling time.
Holding Time Pressing Time Cooling Time Average Domain Size
0.66 0.5 2 3.95 mm
0.66 6 2 3.28 mm
0.66 0.5 20 2.66 mm
0.66 6 20 2.63 mm
15 0.5 2 3.35 mm
15 6 2 2.65 mm
15 0.5 20 2.96 mm
15 6 20 2.72 mm
Table 15: DOE experiment for average domain size

70
It was seen that the average domain size varied between 2 mm and 4 mm. It can be seen that the
maximum variation in domain size is observed for change in cooling time from 2 minutes to 20
minutes. The initial domain size of particles before the molding process is less than 1 mm but at
the end of the compression molding process, the average domain size of particles increases to a
range of 2 mm-4 mm. This shows that the initial domain size of particles does not have an effect
on the final domain size of particles and this phenomenon of increase in domain size could be
attributed to the fact that during the process of cooling, the ionic glass fuses together during
phase transformation from transition to solid state and form domains of different sizes and for a
small cooling time of 2 minutes, the domain size is in the range of about 4 mm and and when the
cooling time is very long, the domain size is about 2 mm.
71
5. FUTURE WORK
In the process parameter of cooling time, the effect of temperature gradient and cooling rate
needs to be taken into account because
1. During the process of demolding, there is a temperature gradient from molding temperature to
the temperature when the molded glass disk is taken out of the die setup
2. There is also the temperature gradient from the time when it is taken out of the die setup to the
time when it is at the temperature when the flatness and surface roughness values are recorded.
So in addition to the cooling time, the effect of both these temperature gradients needs to be
taken into account while doing the measurements for flatness, surface roughness and average
domain size and hence to understand the effect of temperature gradient on the values.
In structural characterization, the actual physics and phenomena behind the variation in average
domain size with change in cooling time and temperature gradient needs to be studied in detail to
effectively characterize the structural information of the molded glass disk.
72
6. SUMMARY
In this research work, a novel method of the solid stamp manufacturing for solid state super ionic
stamping process was developed. The ionic glass material, silver iodide-silver meta phosphate
glass was synthesized and this ionic glass was used as the material for the stamp manufacturing.
Rutherford backscattering spectrometry (RBS) analysis was performed on the synthesized glass
to identify the mass fraction of the elements and the atomic ratio of the elements was verified and
confirmed the absence of any impurities in the sample. The synthesized glass was molded and
developed into a specific geometrical configuration for use in solid state super ionic stamping
process. This was developed by making use of the compression molding process and a circular
disk with dimensions of 1 inch diameter and 0.75 mm thickness was made. The five process
parameters during the compression molding process was identified which were temperature,
pressure, holding time, pressing time and cooling time. It was verified that it was able to obtain
the exact dimensional configuration of the stamp using the compression molding process. Once
the dimensional configuration was confirmed, geometrical characterization of the molded glass
disks was done by measuring the flatness and the surface roughness. The process parameters of
holding time, pressing time and cooling time were varied keeping the temperature and pressure
constant to understand the effect of parameters on the geometry of the molded glass disk. The
parameters which had a significant effect on the geometry of the molded glass disk was pressing
time and cooling time as during this process the ionic glass undergoes the process of strain and
stress relaxation respectively. Statistical analysis was performed on a full factorial DOE
experiment to verify the significance of the process parameters and on analyzing the model,
pressing time and cooling time were significant but there weren’t any significant interaction effects
observed except for pressing time interacting with cooling time and affecting the surface
roughness. Finally, the optimum process parameters for obtaining a solid stamp with lowest
flatness and surface roughness was identified using the experimental and statistical results.
Structural characterization was performed by studying the intensity distribution of the molded
glass disk and it was related to the domain size of particles within the molded disk. The

73
measurement of average domain size was carried out by performing a DOE experiment and
varying the process parameters of holding time, pressing time and cooling time and it was seen
that the parameter having an effect on the average domain size after molding is the cooling time.

74
REFERENCES
Coane, Philip. n.d. "Introduction to electron beam lithography ." Institute for Micromanufacturing, Louisiana Tech University .
Dambon, Olaf, Fei Wang, Fritz Klocke, Guido Pongs, Bernd Bresseler, Yang Chen, and Allen Y.
Yi. 2009. "Efficient mold manufacturing for precision glass molding." Jorunal of Vaccum Science and Technology B 27 (3): 1445.
H.Hsu, Keng. 2009. "Harnessing Solid-State Ionic Transport for Nanomanufacturing and
Nanodevices." Mechanical Engineering, University of Illinois at Urbana-Champaign. Hsu, Keng H., Peter L. Schultz, Placid M. Ferreira, and Nicholas X. Fang. 2007. "Electrochemical
Nanoimprinting with Solid-State Superionic Stamps." Nano Letters 7 (2): 446-451. Iqbal, Waqas. 2009. Identifying the optimum process parameters of precision glass molding for
aspherical lenses. TigerPrints. Jacobs, K E, K H Hsu, X Han, A Kumar, B P Azeredo, N X Fang, and P M Ferreira. 2011. "Solid-
State superionic stamping with silver iodide-silver metaphosphate glass." IOP Science Nanotechnology 22 (42).
Jain, Anurag. 2006. "Experimental Study and numerrical analysis of compression molding
process for manufacturing precision aspherical glass lenses." Ohio State University. Palanthandalam, Shriram, and Nam-Ho Kim. 2008. Predictive Molding of Precision Glass Optics.
University of Florida, Optical society of America. Seo, Jung-Hun, Jung Ho Park, Zhenqiang Ma, Jinnil Choi, and Byeong-Kwon Ju. n.d.
"Nanopatterning by Laser Interference Lithography: Applications to Optical Devices." Display and Nanosystem Laboratory, School of Engineering, Korea University. doi:10.1166/jnn.2014.9199.
Srituravanich, Werayut, and Alongkorn Pimpin. 2012. "Review on Micro and Nanolithography
Techniques and their Applications." Engineering Journal 16 (1). doi:10.4186/ej.2012.16.1.37.
Sundarrram, Sriharsha Srinivas. 2008. "Development of Electrochemical micro machining." Texas
A&M University, USA, College Station. Symmons, Alan, and Bryan Auz. 2012. "Design Considerations and Manufacturing Limitations of
Insert Precision Glass Molding (IPGM)." LightPath Technologies. doi:10.1117/12.932253. Takahata, Kenichi. 2013. Advances in Micro/Nano Electrochemical Systems and Fabrication
Technologies. Intech. Viheriälä, Jukka, Tapio Niemi, Juha Kontio, and Markus Pessa. 2010. Nanoimprint Lithography -
Next Generation Nanopatterning Methods for Nanophotonics Fabrication. Intech.

75
APPENDIX A
STRUCTURAL CHARACTERIZATION
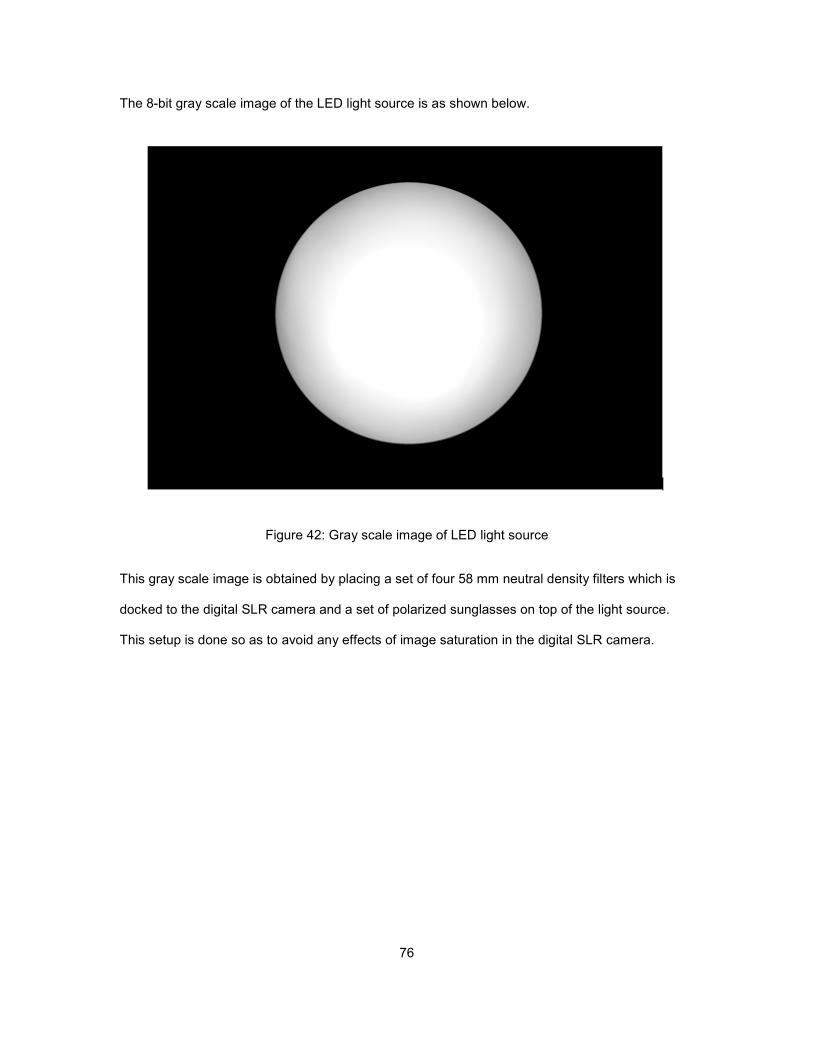
76
The 8-bit gray scale image of the LED light source is as shown below.
Figure 42: Gray scale image of LED light source
This gray scale image is obtained by placing a set of four 58 mm neutral density filters which is
docked to the digital SLR camera and a set of polarized sunglasses on top of the light source.
This setup is done so as to avoid any effects of image saturation in the digital SLR camera.

77
The Matlab code for image normalization is as shown below,
clear all; imread(‘image1.tif’); % image to normalize imread(‘image2.tif’); % base image newMax = uint8(max(max(image2))) newMin = uint8(min(min(image2))) cMax = uint8(max(max(image1))) cMin = uint8(min(min(image1))) for i = 1:1880 for j = 1:2816 %image1(i,j) image(i,j) = uint8(image1(i,j)*(newMax/cMax)+ newMin); %image1(i,j) end end imwrite(image,'/Users/GP/Desktop/normalizedimage.tif')
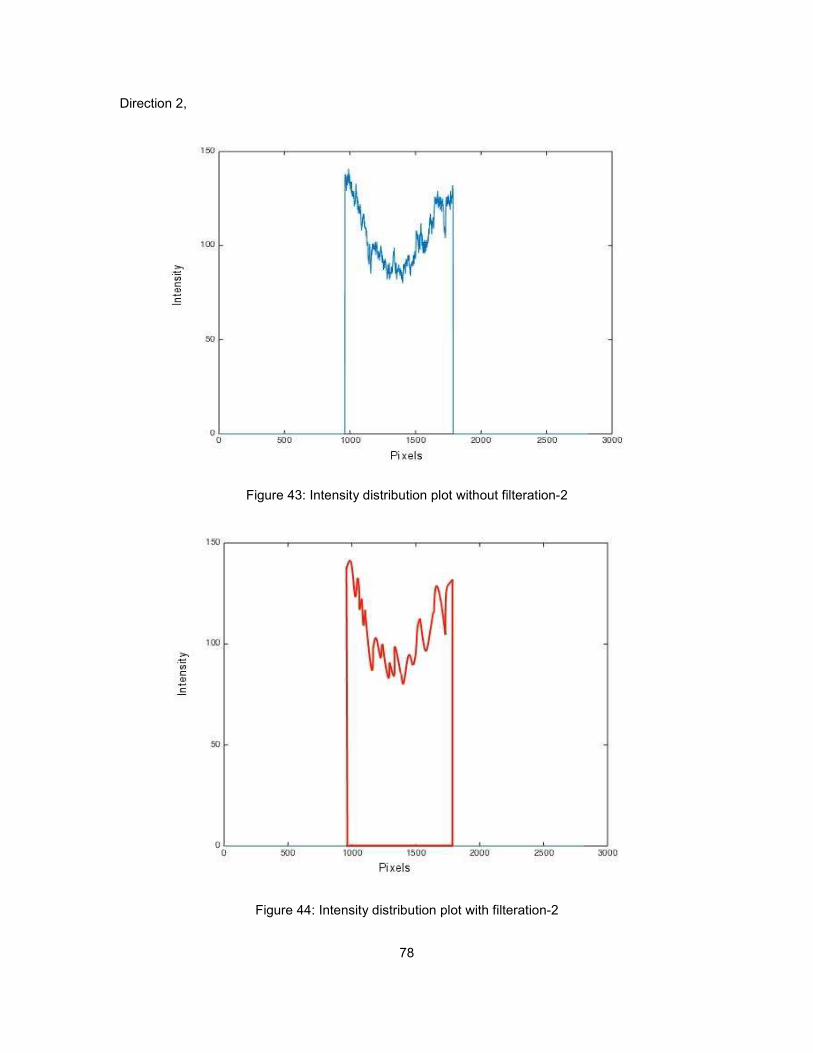
78
Direction 2,
Figure 43: Intensity distribution plot without filteration-2
Figure 44: Intensity distribution plot with filteration-2
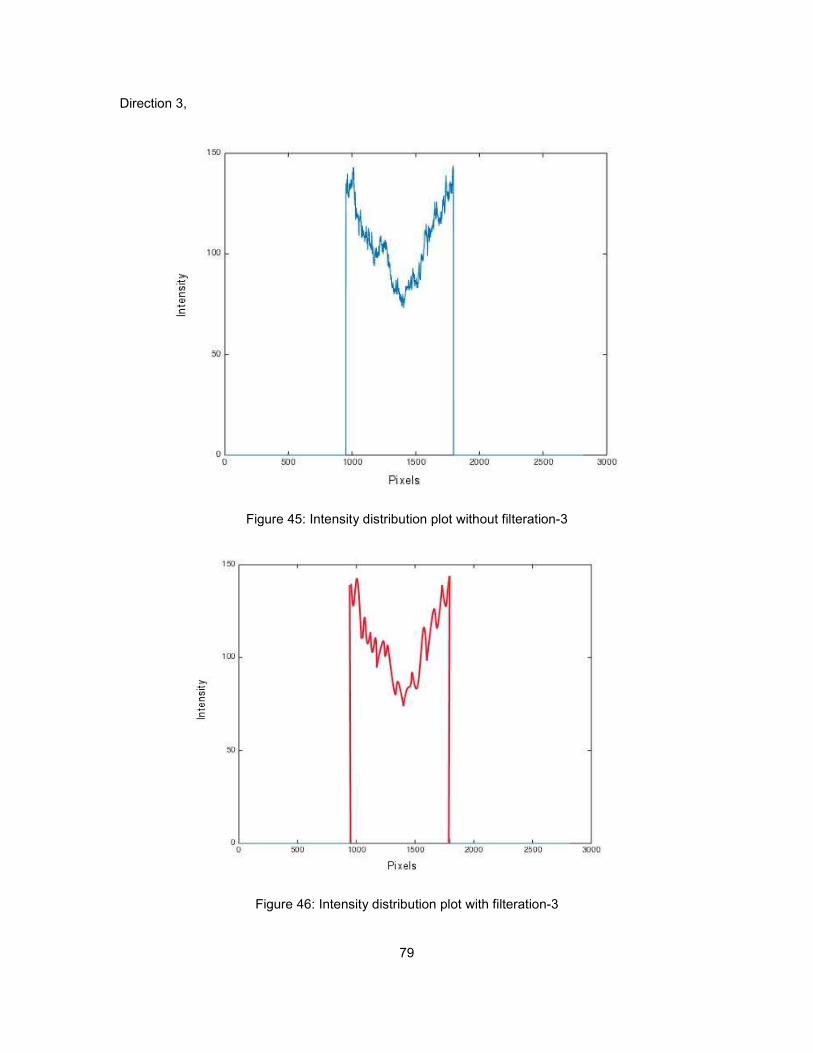
79
Direction 3,
Figure 45: Intensity distribution plot without filteration-3
Figure 46: Intensity distribution plot with filteration-3
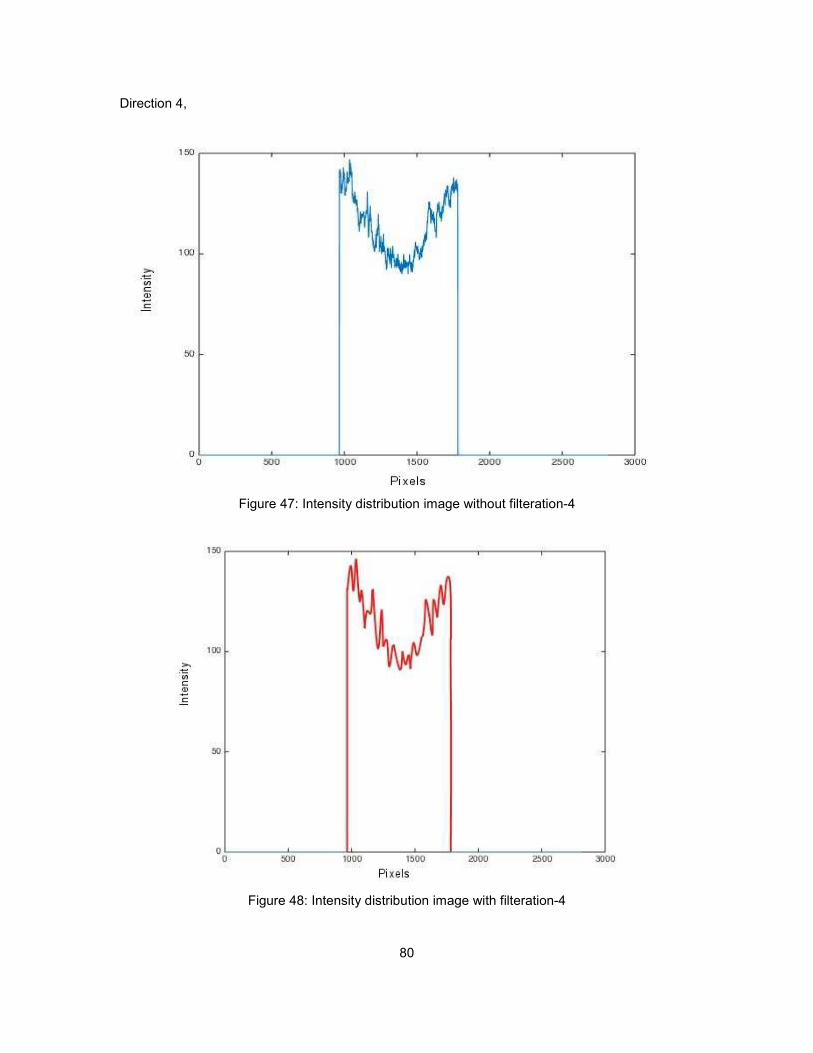
80
Direction 4,
Figure 47: Intensity distribution image without filteration-4
Figure 48: Intensity distribution image with filteration-4
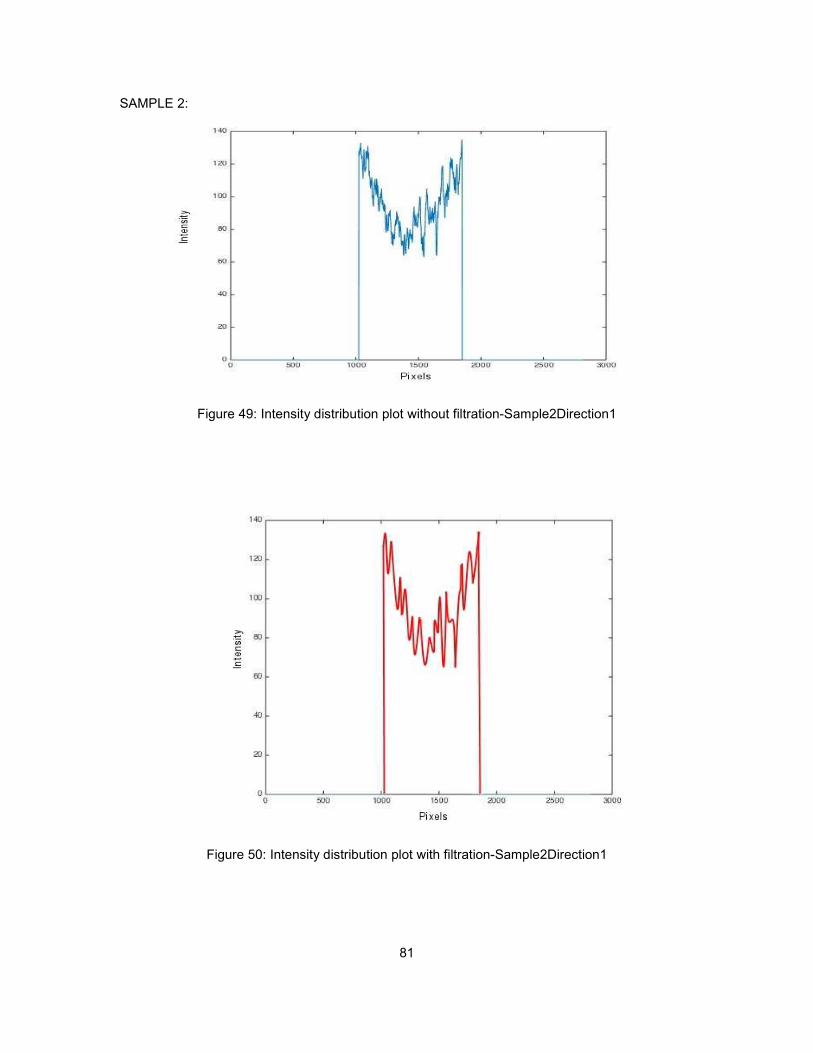
81
SAMPLE 2:
Figure 49: Intensity distribution plot without filtration-Sample2Direction1
Figure 50: Intensity distribution plot with filtration-Sample2Direction1
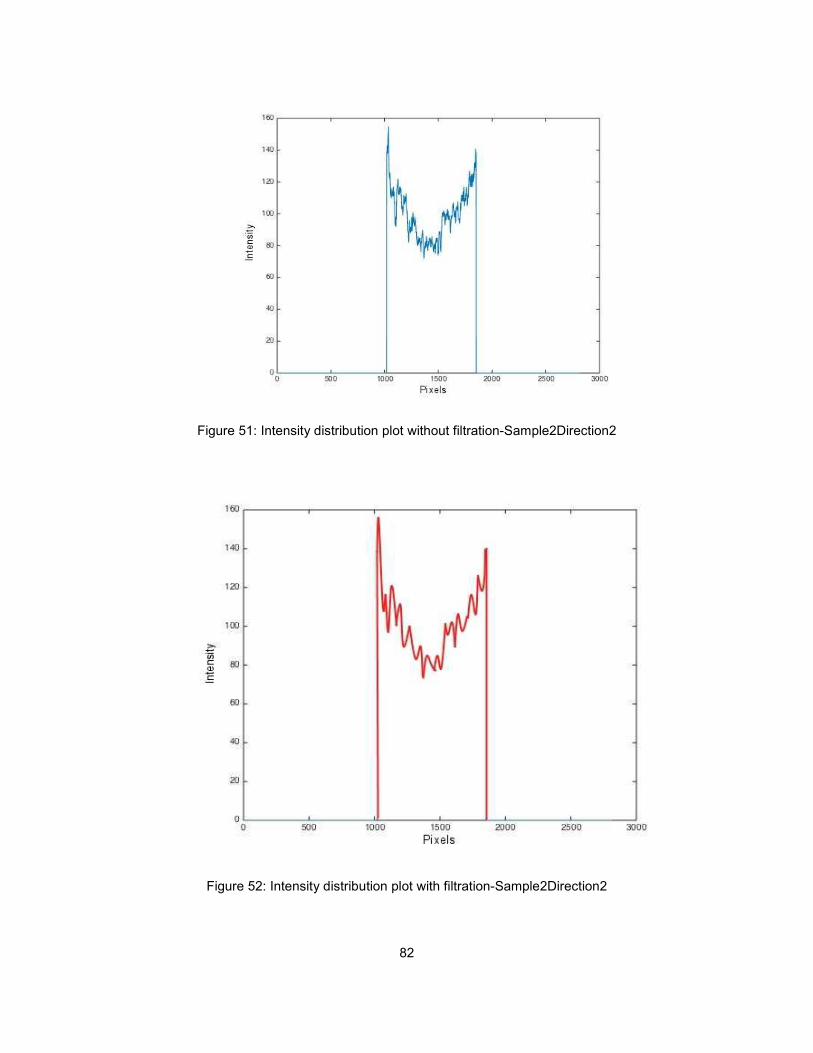
82
Figure 51: Intensity distribution plot without filtration-Sample2Direction2
Figure 52: Intensity distribution plot with filtration-Sample2Direction2
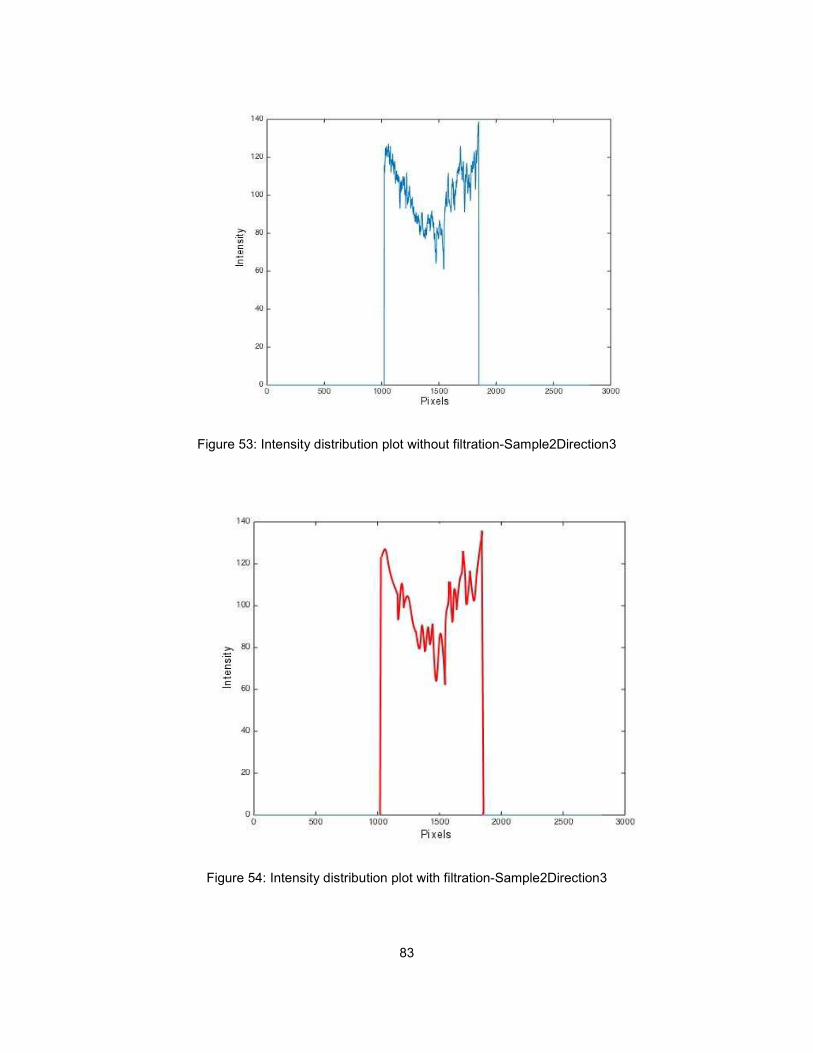
83
Figure 53: Intensity distribution plot without filtration-Sample2Direction3
Figure 54: Intensity distribution plot with filtration-Sample2Direction3
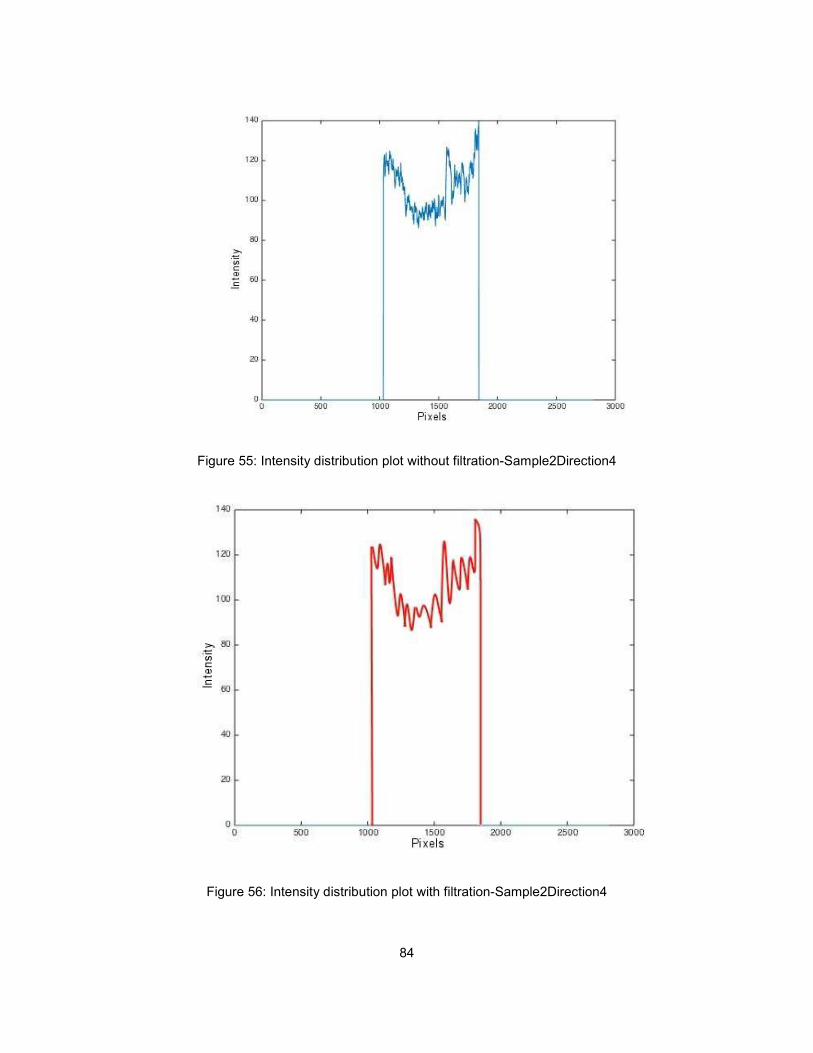
84
Figure 55: Intensity distribution plot without filtration-Sample2Direction4
Figure 56: Intensity distribution plot with filtration-Sample2Direction4
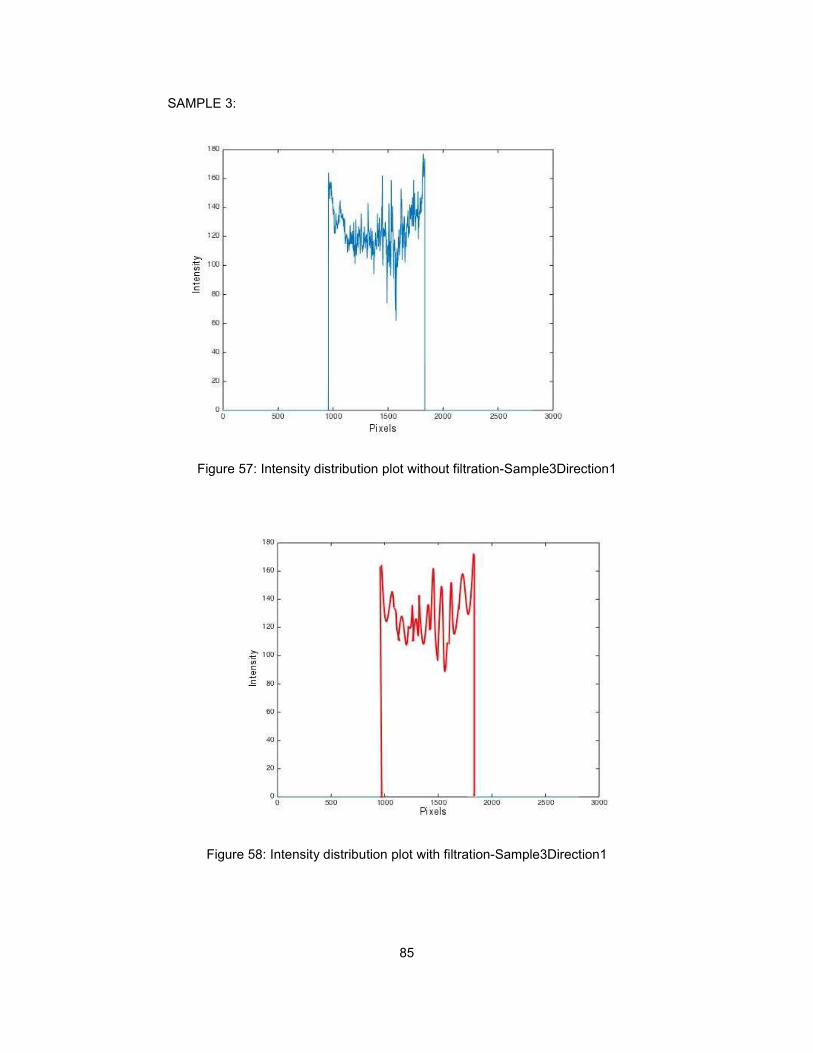
85
SAMPLE 3:
Figure 57: Intensity distribution plot without filtration-Sample3Direction1
Figure 58: Intensity distribution plot with filtration-Sample3Direction1

86
Figure 59: Intensity distribution plot without filtration-Sample3Direction2
Figure 60: Intensity distribution plot with filtration-Sample3Direction2
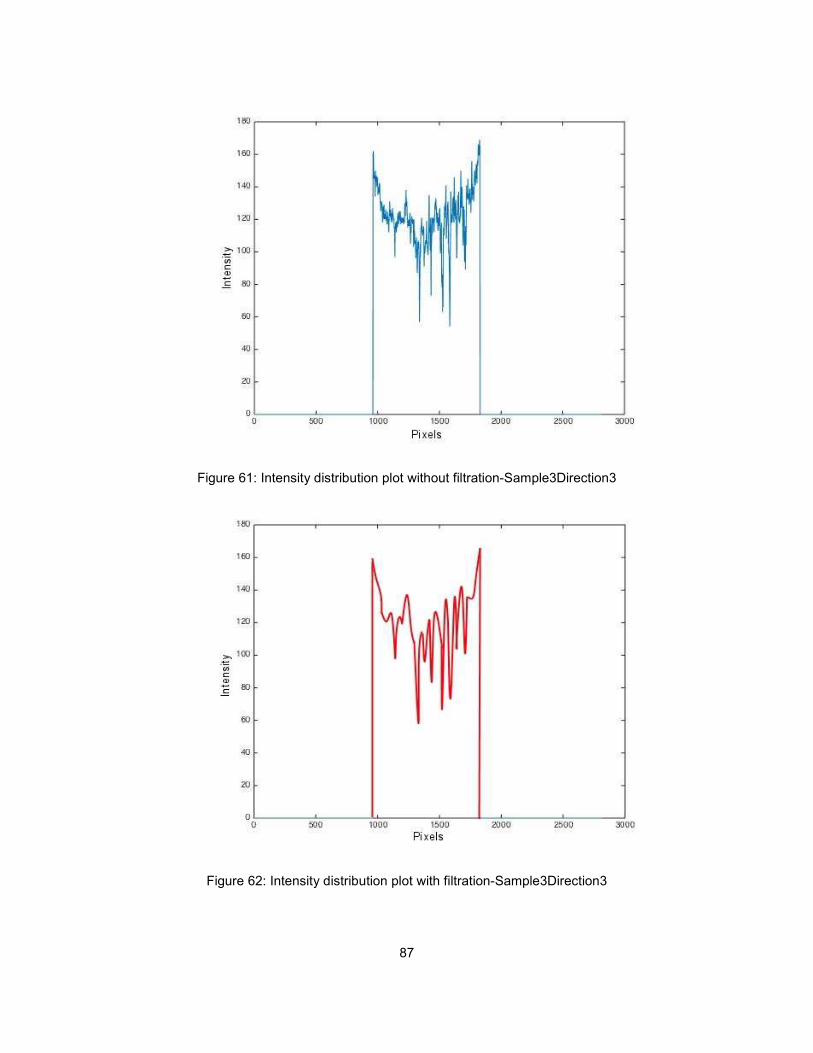
87
Figure 61: Intensity distribution plot without filtration-Sample3Direction3
Figure 62: Intensity distribution plot with filtration-Sample3Direction3
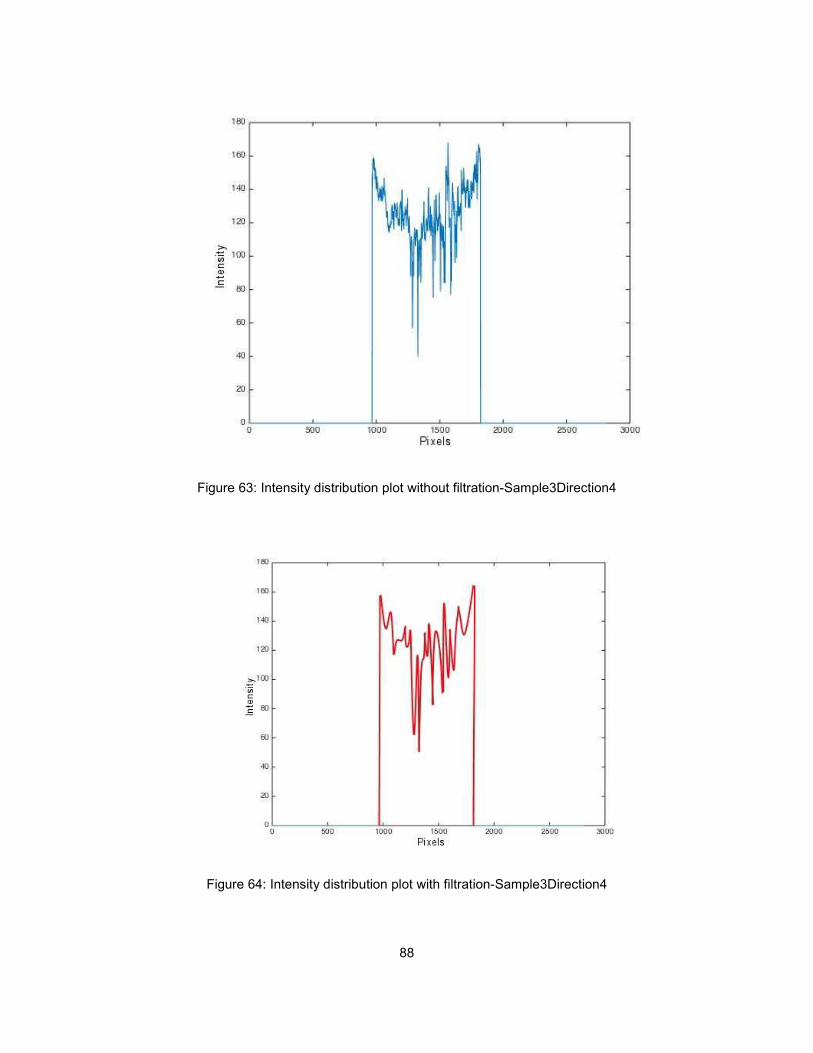
88
Figure 63: Intensity distribution plot without filtration-Sample3Direction4
Figure 64: Intensity distribution plot with filtration-Sample3Direction4
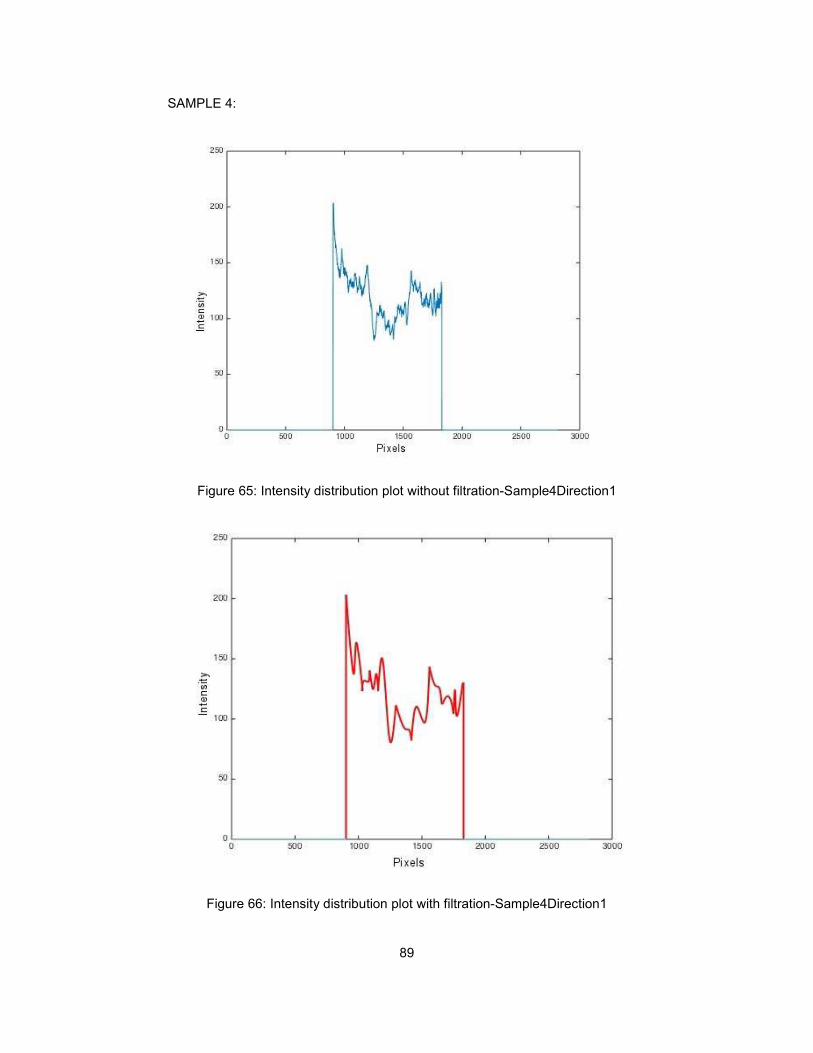
89
SAMPLE 4:
Figure 65: Intensity distribution plot without filtration-Sample4Direction1
Figure 66: Intensity distribution plot with filtration-Sample4Direction1
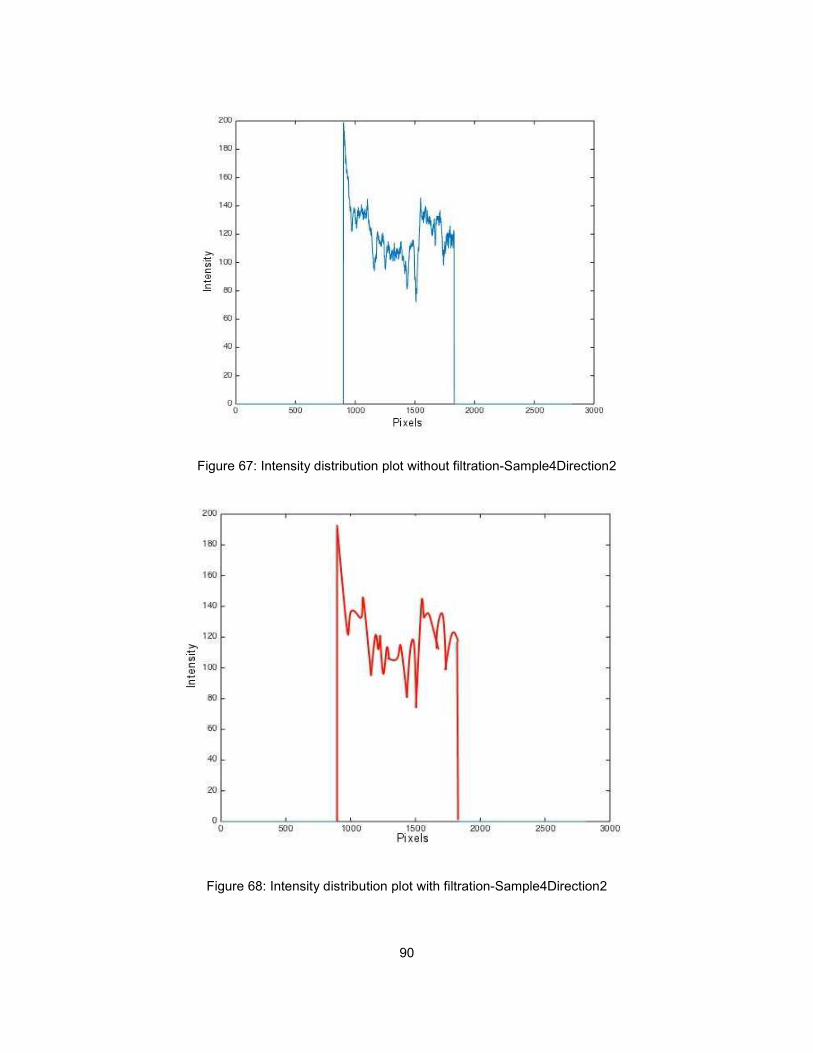
90
Figure 67: Intensity distribution plot without filtration-Sample4Direction2
Figure 68: Intensity distribution plot with filtration-Sample4Direction2

91
Figure 69: Intensity distribution plot without filtration-Sample4Direction3
Figure 70: Intensity distribution plot with filtration-Sample4Direction3
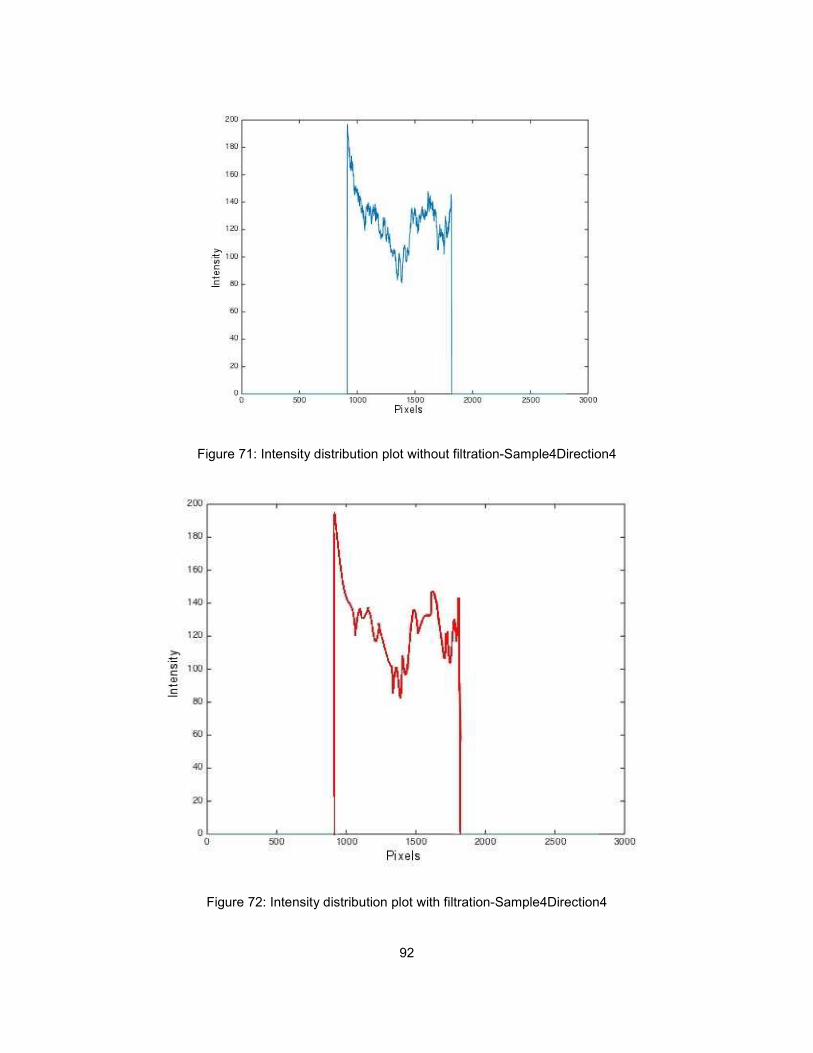
92
Figure 71: Intensity distribution plot without filtration-Sample4Direction4
Figure 72: Intensity distribution plot with filtration-Sample4Direction4
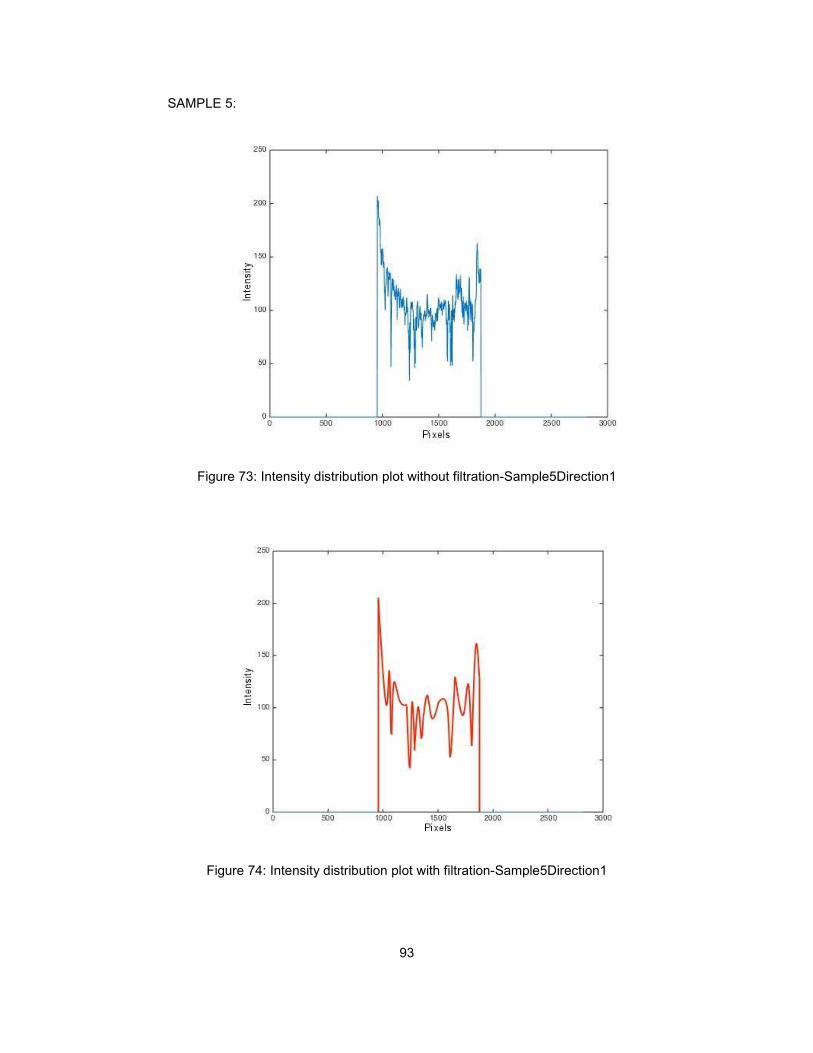
93
SAMPLE 5:
Figure 73: Intensity distribution plot without filtration-Sample5Direction1
Figure 74: Intensity distribution plot with filtration-Sample5Direction1
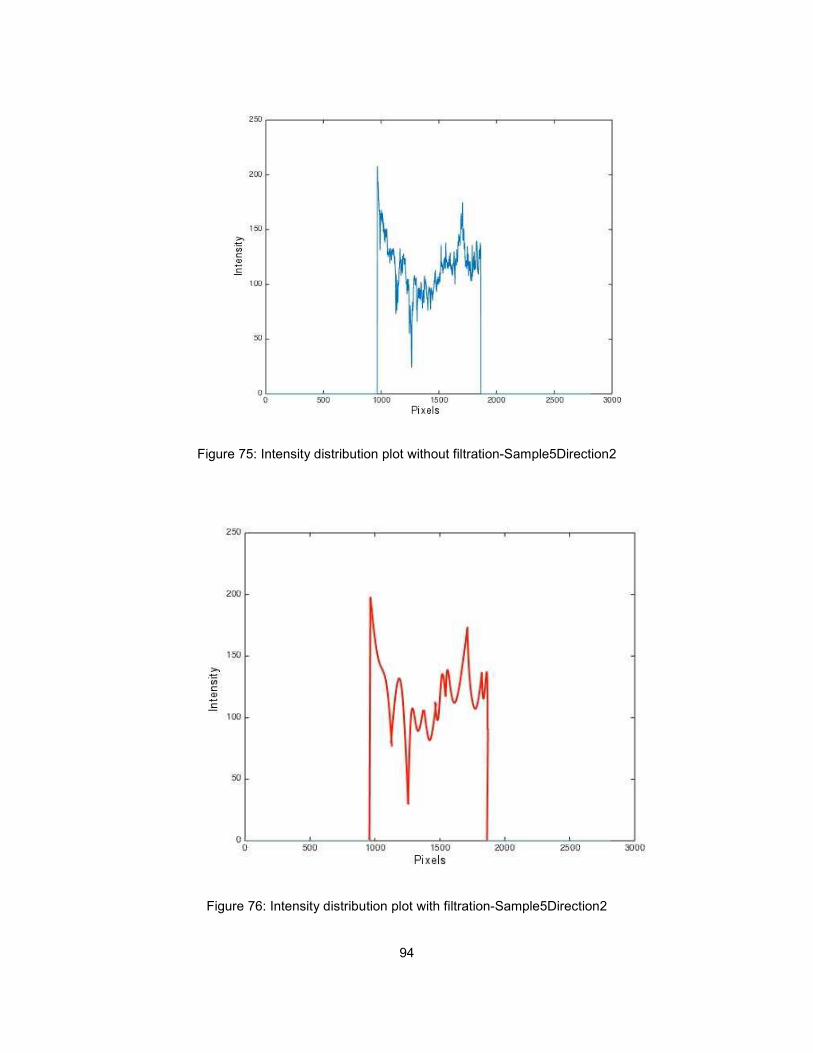
94
Figure 75: Intensity distribution plot without filtration-Sample5Direction2
Figure 76: Intensity distribution plot with filtration-Sample5Direction2
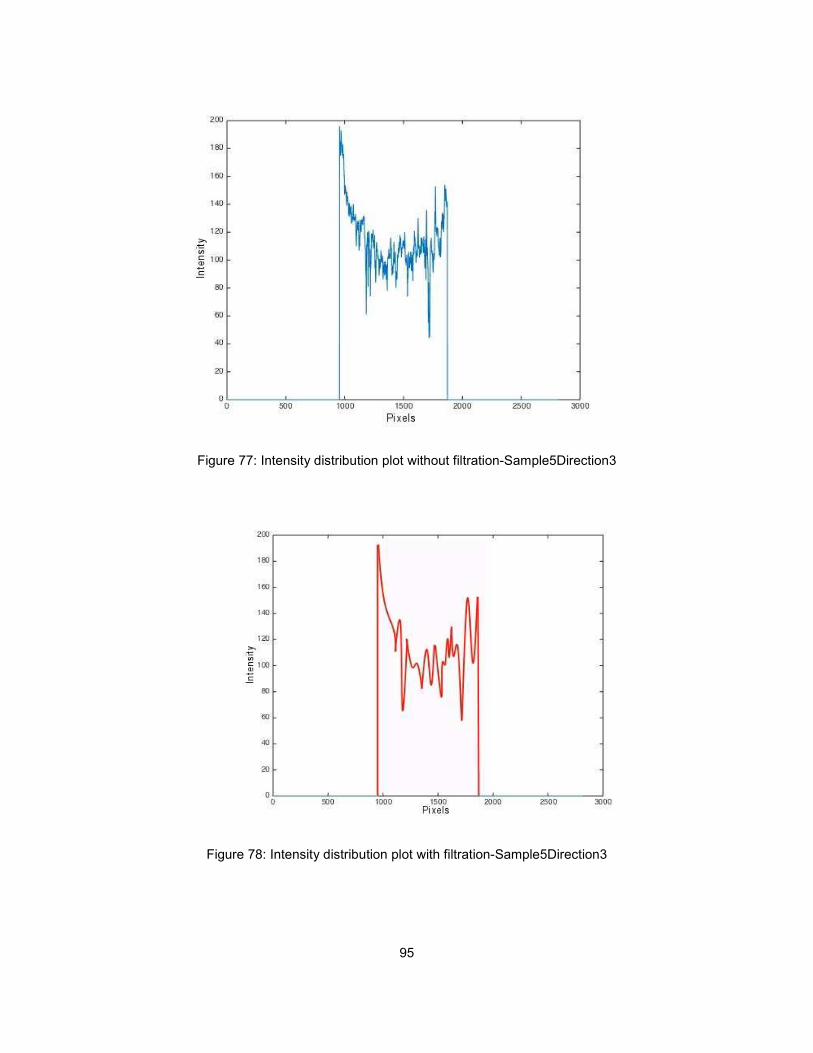
95
Figure 77: Intensity distribution plot without filtration-Sample5Direction3
Figure 78: Intensity distribution plot with filtration-Sample5Direction3
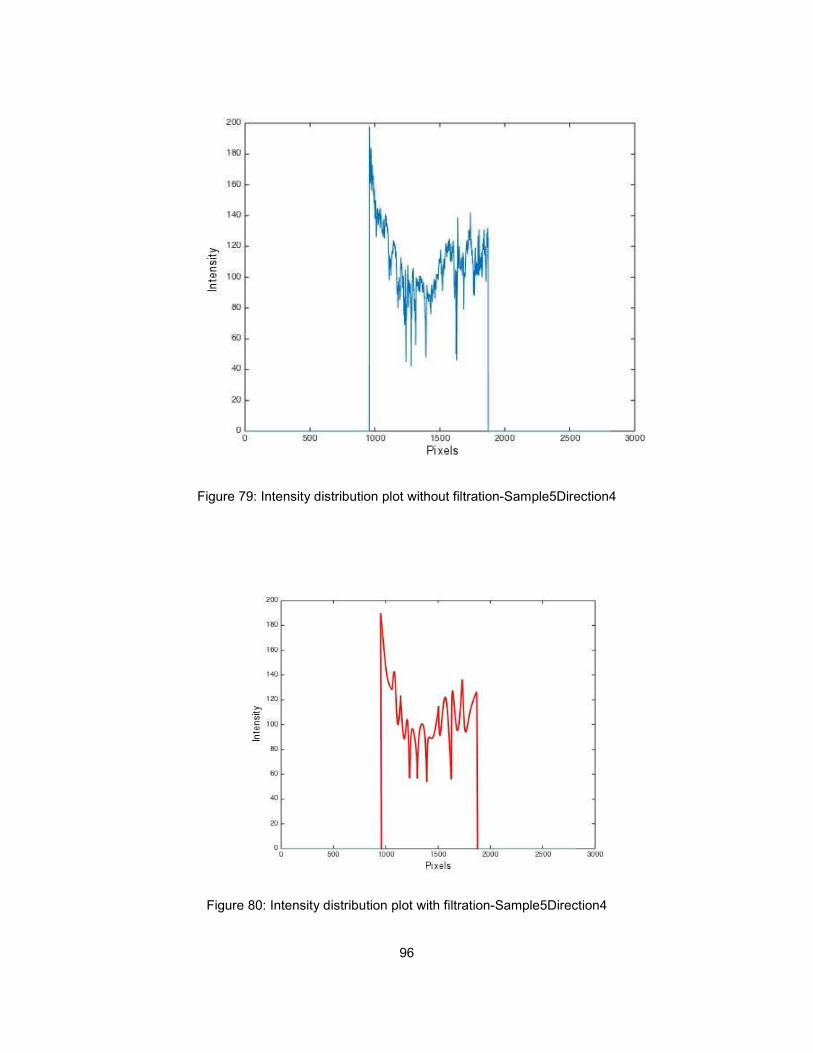
96
Figure 79: Intensity distribution plot without filtration-Sample5Direction4
Figure 80: Intensity distribution plot with filtration-Sample5Direction4
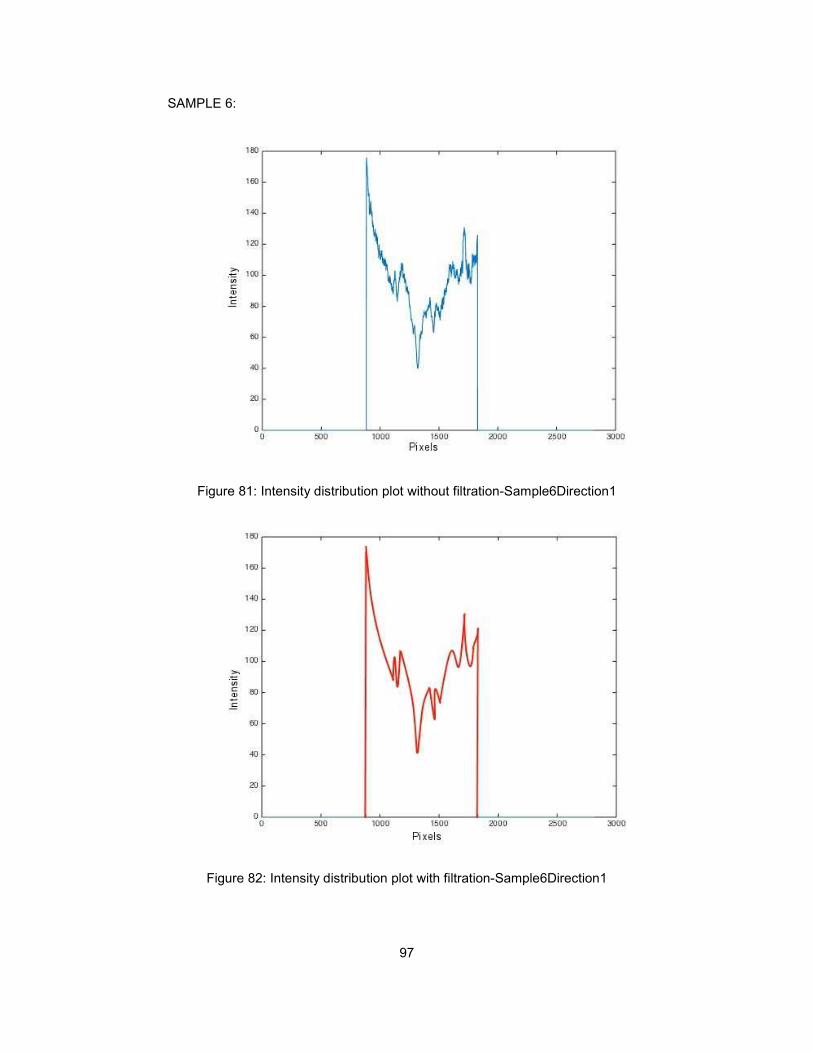
97
SAMPLE 6:
Figure 81: Intensity distribution plot without filtration-Sample6Direction1
Figure 82: Intensity distribution plot with filtration-Sample6Direction1
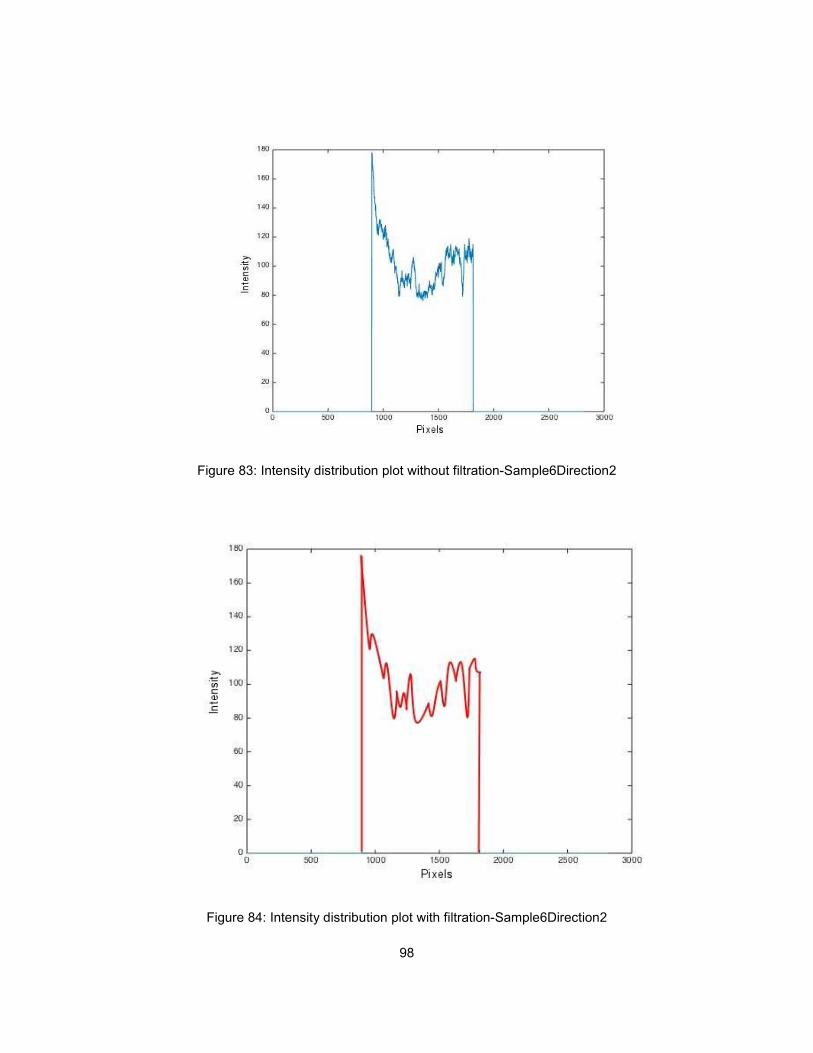
98
Figure 83: Intensity distribution plot without filtration-Sample6Direction2
Figure 84: Intensity distribution plot with filtration-Sample6Direction2

99
Figure 85: Intensity distribution plot without filtration-Sample6Direction3
Figure 86: Intensity distribution plot with filtration-Sample6Direction3
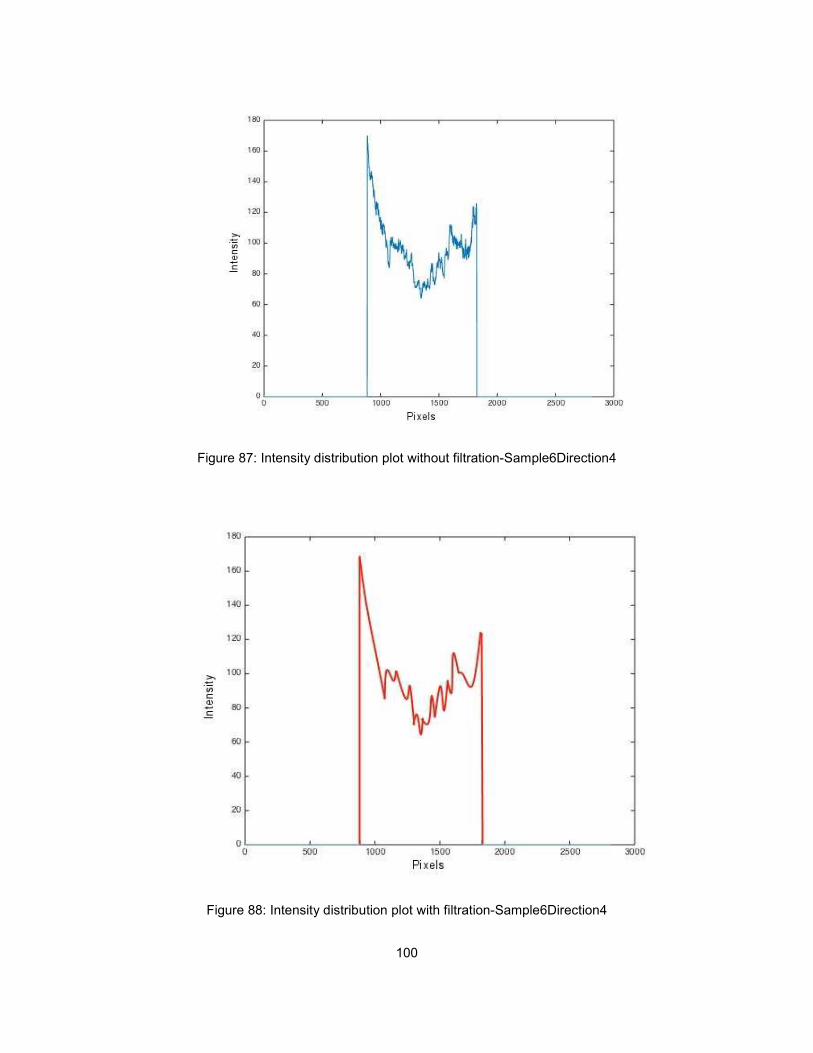
100
Figure 87: Intensity distribution plot without filtration-Sample6Direction4
Figure 88: Intensity distribution plot with filtration-Sample6Direction4
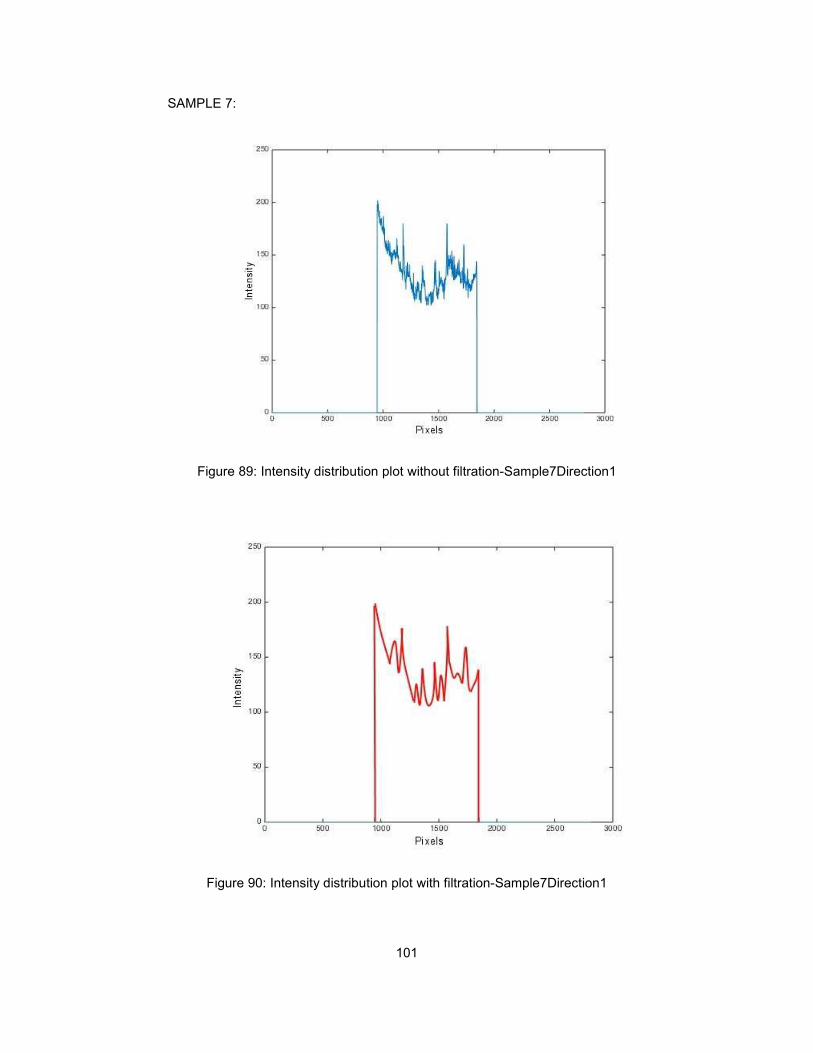
101
SAMPLE 7:
Figure 89: Intensity distribution plot without filtration-Sample7Direction1
Figure 90: Intensity distribution plot with filtration-Sample7Direction1
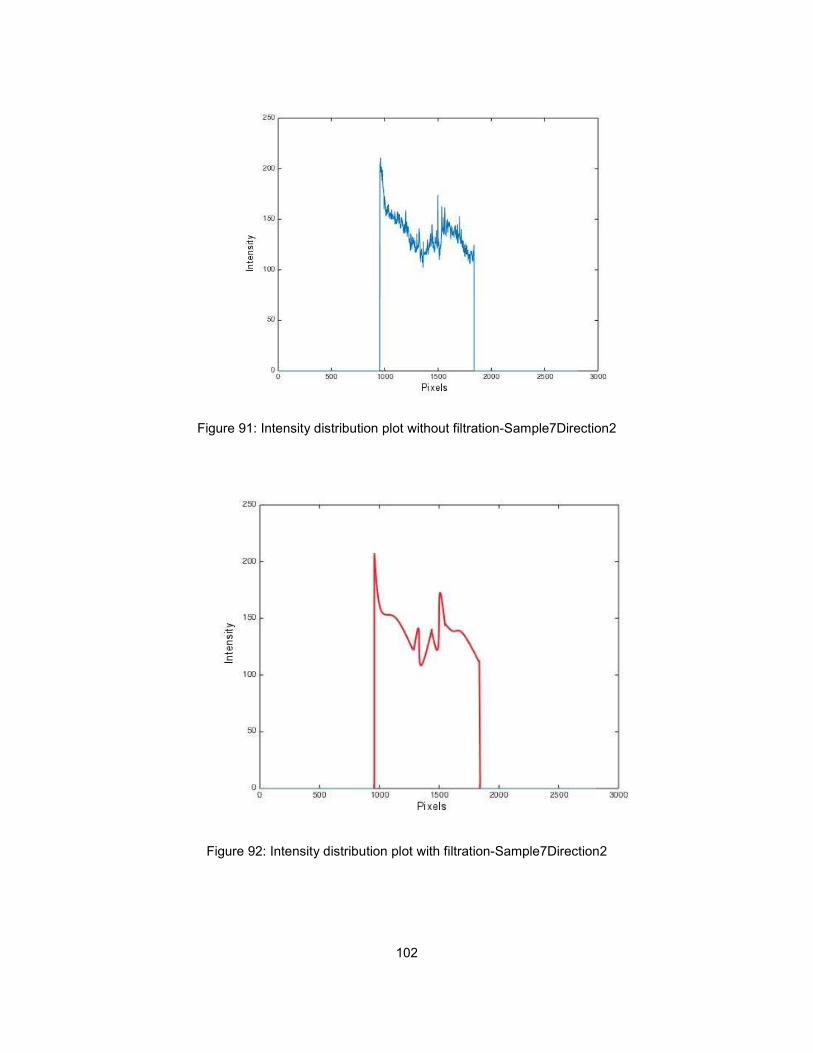
102
Figure 91: Intensity distribution plot without filtration-Sample7Direction2
Figure 92: Intensity distribution plot with filtration-Sample7Direction2
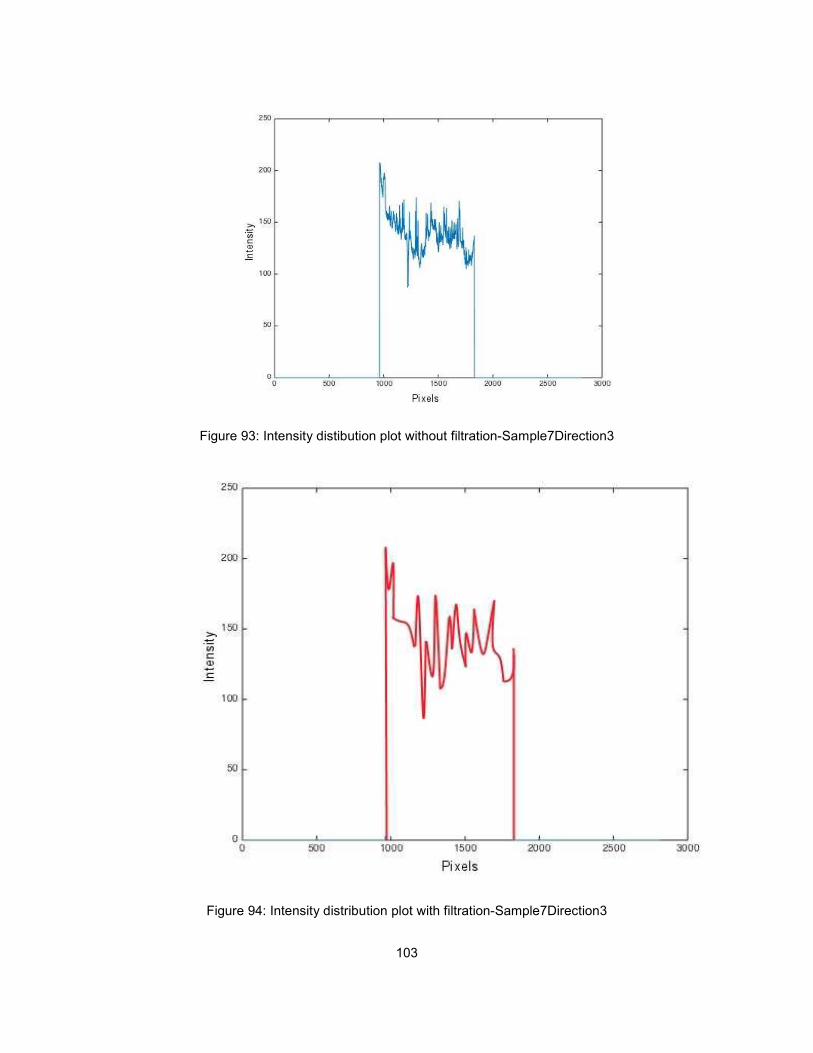
103
Figure 93: Intensity distibution plot without filtration-Sample7Direction3
Figure 94: Intensity distribution plot with filtration-Sample7Direction3
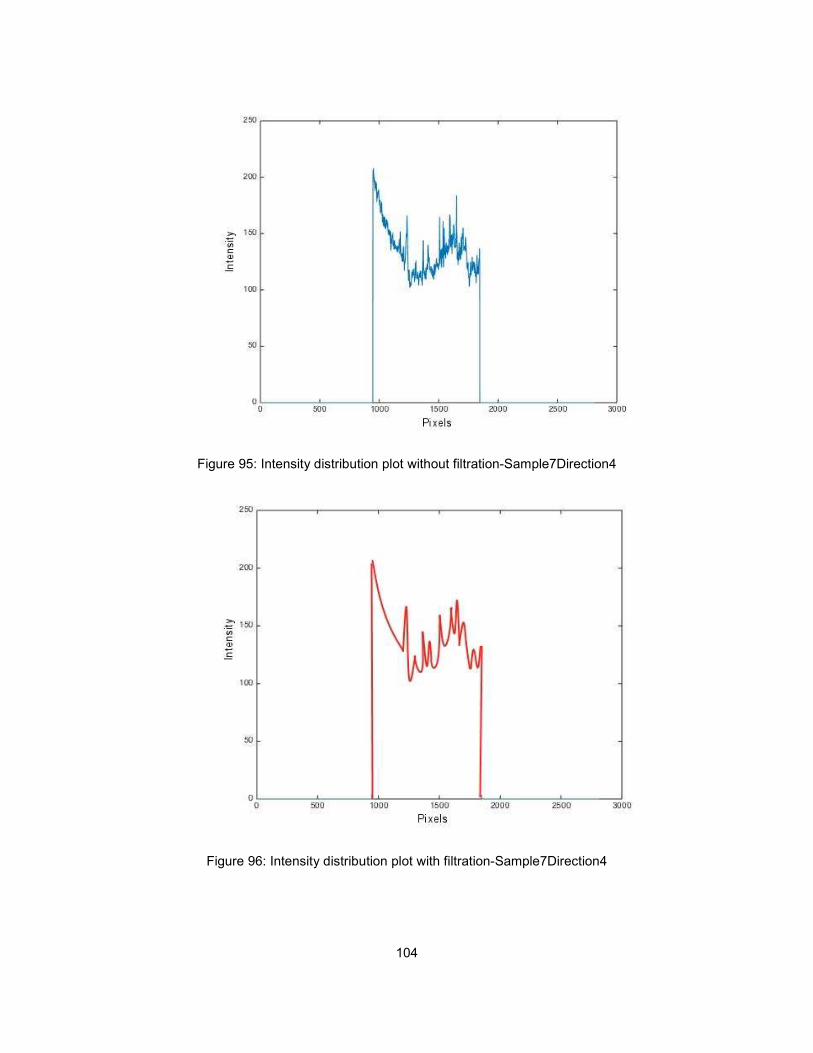
104
Figure 95: Intensity distribution plot without filtration-Sample7Direction4
Figure 96: Intensity distribution plot with filtration-Sample7Direction4
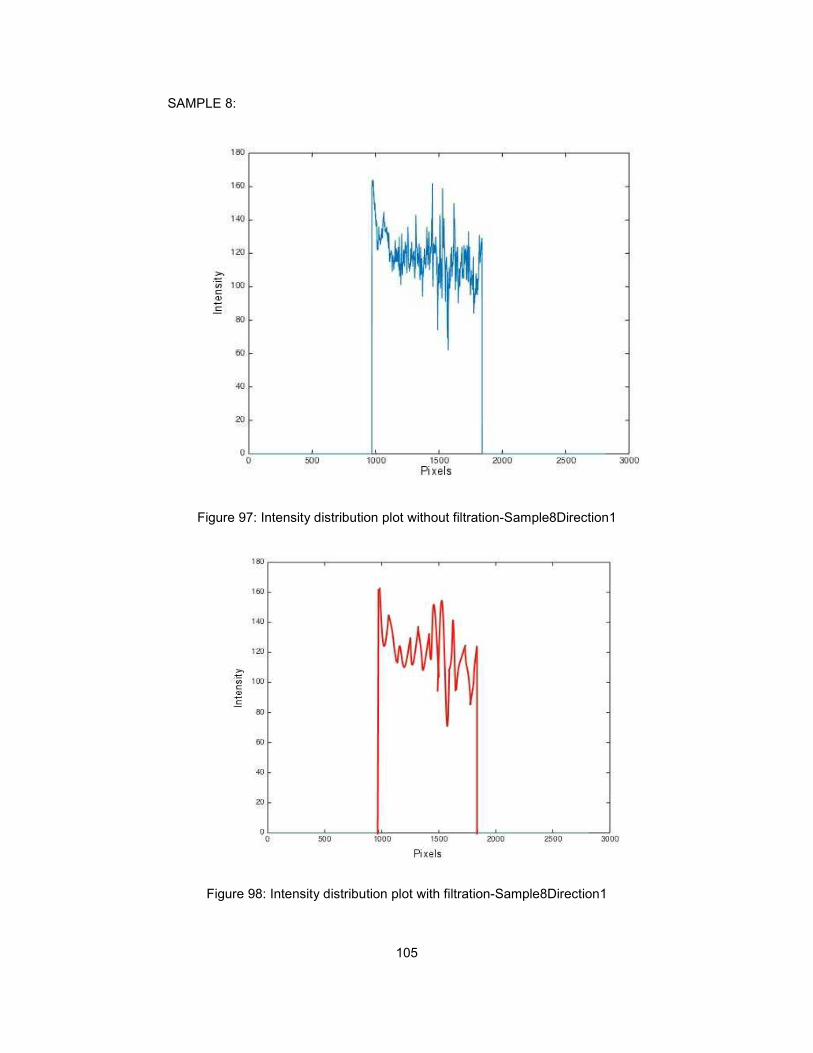
105
SAMPLE 8:
Figure 97: Intensity distribution plot without filtration-Sample8Direction1
Figure 98: Intensity distribution plot with filtration-Sample8Direction1

106
Figure 99: Intensity distribution plot without filtration-Sample8Direction2
Figure 100: Intensity distribution plot with filtration-Sample8Direction2
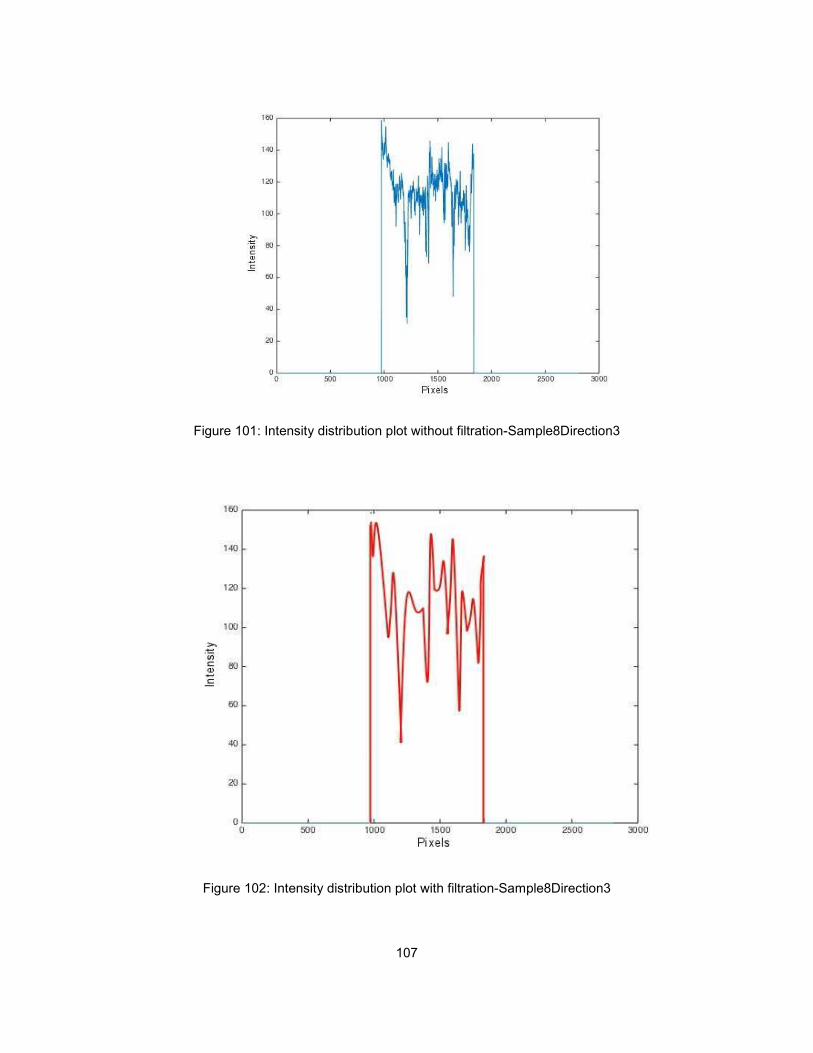
107
Figure 101: Intensity distribution plot without filtration-Sample8Direction3
Figure 102: Intensity distribution plot with filtration-Sample8Direction3
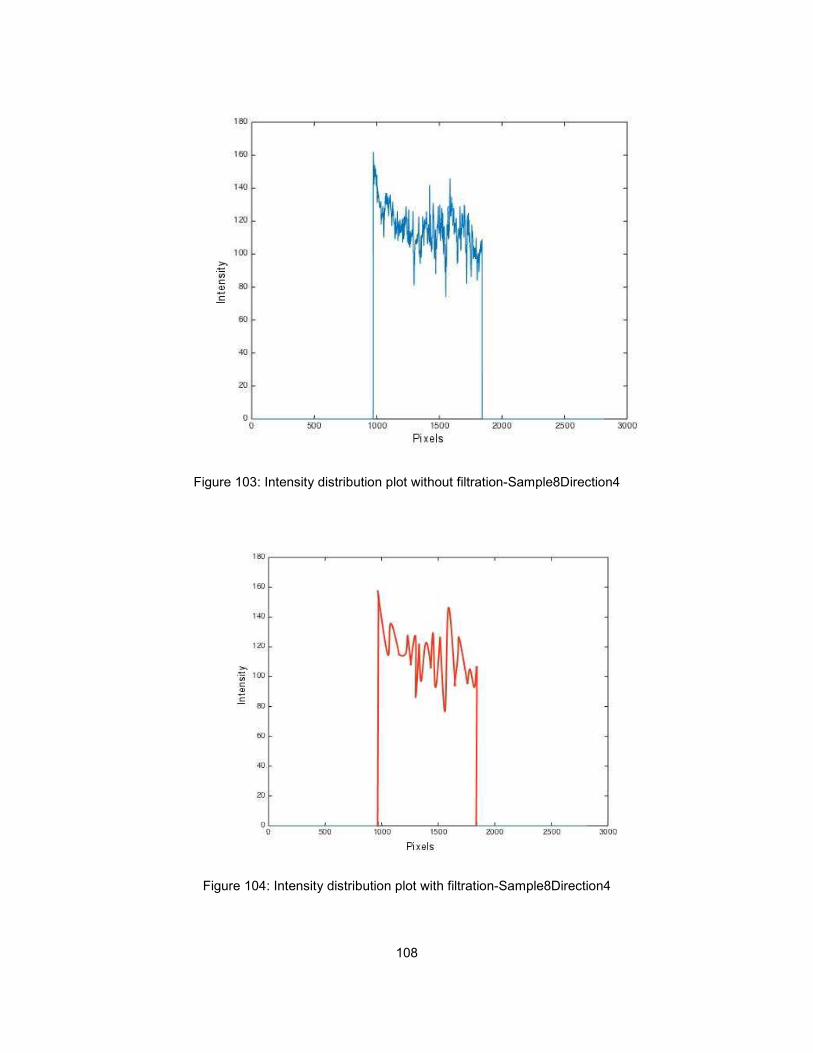
108
Figure 103: Intensity distribution plot without filtration-Sample8Direction4
Figure 104: Intensity distribution plot with filtration-Sample8Direction4