process development for permanganate addition during oxidative
TRANSCRIPT
PNNL-16794 WTP-RPT-164, Rev 0
Process Development for Permanganate
Addition During Oxidative Leaching of
Hanford Tank Sludge Simulants
B. M. Rapko
G. J. Lumetta
J. R. Deschane
R. A. Peterson
October 2007
Prepared for the U.S. Department of Energy
under Contract DE-AC05-76RL01830
DISCLAIMER This report was prepared as an account of work sponsored by an agency of the United States Government. Neither the United States Government nor any agency thereof, nor Battelle Memorial Institute, nor any of their employees, makes any warranty, express or implied, or assumes any legal liability or responsibility for the accuracy, completeness, or usefulness of any information, apparatus, product, or process disclosed, or represents that its use would not infringe privately owned rights. Reference herein to any specific commercial product, process, or service by trade name, trademark, manufacturer, or otherwise does not necessarily constitute or imply its endorsement, recommendation, or favoring by the United States Government or any agency thereof, or Battelle Memorial Institute. The views and opinions of authors expressed herein do not necessarily state or reflect those of the United States Government or any agency thereof. PACIFIC NORTHWEST NATIONAL LABORATORY operated by BATTELLE for the UNITED STATES DEPARTMENT OF ENERGY under Contract DE-ACO5-76RL01830
PNNL-16794 WTP-RPT-164, Rev 0
Process Development for Permanganate Addition During
Oxidative Leaching of Hanford Tank Sludge Simulants
B. M. Rapko
G. J. Lumetta
J. R. Deschane
R. A. Peterson
October 2007
Test specification: 24590-PTF-TSP-RT-06-002, Rev. 0
Test Plan: TP-RPP-WTP-453, Rev. 0, and ICN-TP-RPP-WTP-453.1
Test exceptions: 24590-WTP-TEF-RT-07-00002
R&T focus area: Pretreatment
Test scoping statement(s): None
Pacific Northwest National Laboratory
Richland, Washington 99352
iii
Contents
Acronyms..................................................................................................................................................... xi
References..................................................................................................................................................xiii
Testing Summary ........................................................................................................................................ xv Objectives .......................................................................................................................................... xv Test Exceptions................................................................................................................................. xvi Results and Performance Against Success Criteria .........................................................................xvii Quality Requirements .....................................................................................................................xviii R&T Test Conditions........................................................................................................................ xix Simulant Use..................................................................................................................................... xix Discrepancies and Follow-on Tests .................................................................................................. xix
Acknowledgements.................................................................................................................................... xxi
1.0 Introduction....................................................................................................................................... 1.1
2.0 Experimental Section........................................................................................................................ 2.1 2.1 General Experimental Information .......................................................................................... 2.1 2.2 Preparation of Cr(III) Solids.................................................................................................... 2.3
2.2.1 Preparation of Cr-Containing Simulants ....................................................................... 2.6 2.3 Preparation of Manganese Solids by Reduction of Permanganate by Cr(III) Solids in
Alkaline Solution ................................................................................................................... 2.12 2.4 Wet Chemical Titration of the Mn Oxidation State in Mn-Containing Solids ...................... 2.12 2.5 Quality Assurance.................................................................................................................. 2.12
3.0 Results and Discussion ..................................................................................................................... 3.1 3.1 Tested Chromium Compounds ................................................................................................ 3.1 3.2 Characterization of the Manganese Solids Generated During Oxidative Alkaline
Leaching of Cr(OH)3 ............................................................................................................... 3.1 3.3 Oxidative Alkaline Leaching of Cr Compounds at 0.1 M Initial Hydroxide........................... 3.3
3.3.1 Use of Redox Potential to Monitor Oxidative Alkaline Leaching of Cr(III) Solids with Permanganate ........................................................................................................ 3.3
3.3.2 Examination of the Dissolution of Cr(III) Solids by Visible Spectroscopy with Destruction of Excess Oxidant .................................................................................... 3.10
3.3.3 Oxidative Alkaline Leaching Testing by Visible Spectroscopy with Excess Permanganate Destruction by Hydrogen Peroxide ..................................................... 3.13
3.3.4 Oxidation of Cr-Containing, Non-Radioactive Simulants with Permanganate/ Hydrogen Peroxide in 0.1 M NaOH............................................................................ 3.20
3.4 Oxidation of Cr-Containing, Non-Radioactive Simulants with Permanganate in 0.25 M or Greater NaOH ................................................................................................................... 3.23
iv
3.4.1 Non-Radioactive Simulant Testing with Cr2O3 – Mixing Conditions ........................ 3.24 3.4.2 Non-Radioactive Simulant Testing with Cr2O3—Impact of Hydroxide
Concentration .............................................................................................................. 3.24 3.4.3 Non-Radioactive Simulant Testing with Cr2O3—Impact of Temperature .................. 3.26 3.4.4 Non-Radioactive Simulant Testing with Cr2O3—Impact of Initial [MnO4
-]/[Cr] Ratio ............................................................................................................................ 3.26
3.4.5 Non-Radioactive Simulant Testing with Cr(O)(OH) – H2O—Mixing Conditions ..... 3.27 3.4.6 Non-Radioactive Simulant Testing with Cr(O)(OH) – H2O—Reproducibility .......... 3.28 3.4.7 Non-Radioactive Simulant Testing with Cr(O)(OH) – H2O—Impact of Changing
Hydroxide Concentration ............................................................................................ 3.29 3.4.8 Non-Radioactive Simulant Testing with Cr(O)(OH) – H2O—Impact of Varying
Temperature from 25°C to 45°C ................................................................................. 3.31 3.4.9 Non-Radioactive Simulant Testing with Cr(O)(OH) – H2O—Impact of Varying
Initial [Mn]:[Cr] at 25°C ............................................................................................. 3.32 3.4.10 Non-Radioactive Simulant Testing with Cr(O)(OH) – H2O—Impact of Varying
Initial [Mn]:[Cr] at 45°C ............................................................................................. 3.33 3.5 Oxidative Alkaline Leaching with Radioactive Simulant ..................................................... 3.35
3.5.1 Experimental Design ................................................................................................... 3.35 3.5.2 Experimental Results................................................................................................... 3.37 3.5.3 Rate of Chromate Formation....................................................................................... 3.38 3.5.4 Major Radioactive and Non-Radioactive Component Dissolution ............................. 3.39
4.0 Summary and Conclusions ............................................................................................................... 4.1
Appendix A: QA Procedures .................................................................................................................... A.1
Appendix B: ORP and pH data for Radioactive Simulant Testing ............................................................B.1
Appendix C: Approach for Preparing Oxidative Leaching Simulant ........................................................C.1
Appendix D: BNI’s Acceptance of Full Simulant Composition............................................................... D.1
Appendix E: Details Related to Radioactive Simulant Leaching Testing ................................................E.1
v
Figures
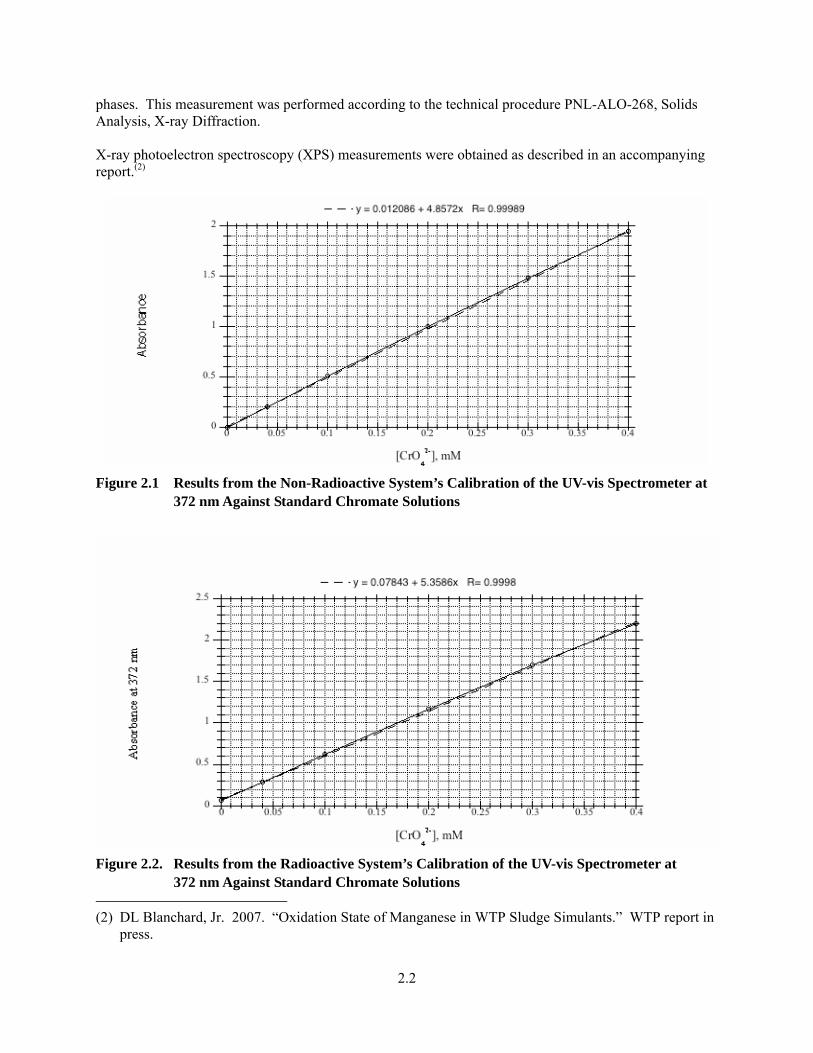
2.1 Results from the Non-Radioactive System’s Calibration of the UV-vis Spectrometer at 372 nm Against Standard Chromate Solutions ................................................................................. 2.2
2.2. Results from the Radioactive System’s Calibration of the UV-vis Spectrometer at 372 nm Against Standard Chromate Solutions .............................................................................................. 2.2
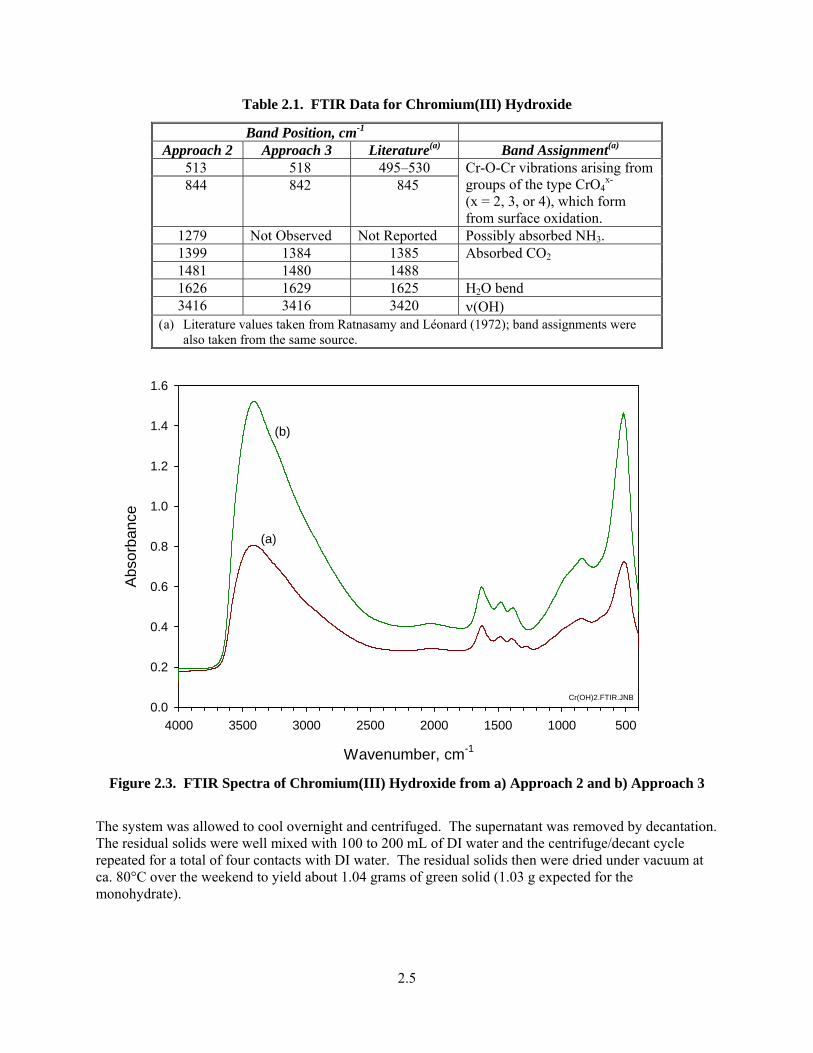
2.3. FTIR Spectra of Chromium(III) Hydroxide from a) Approach 2 and b) Approach 3 ....................... 2.5
2.4. XRD pattern of UO2 ......................................................................................................................... 2.7
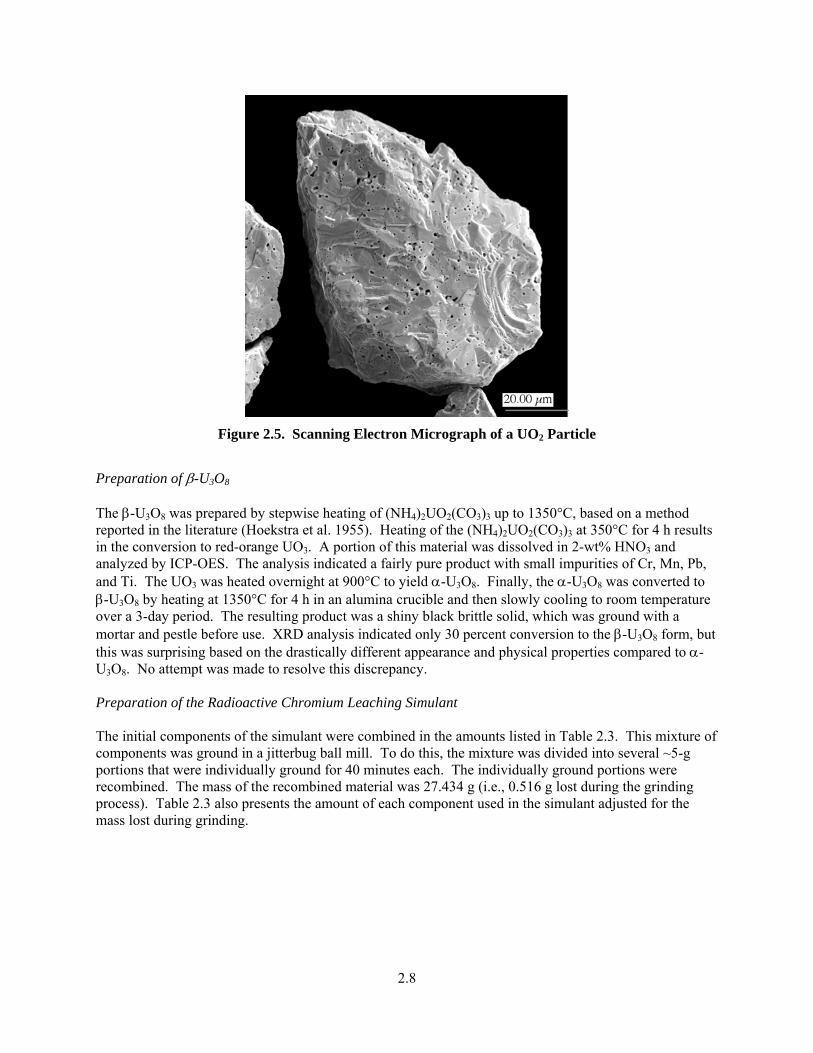
2.5. Scanning Electron Micrograph of a UO2 Particle .............................................................................. 2.8
3.1. Solution Potential Changes as a Function of Added 0.904 M Sodium Permanganate to 40 mL of 0.1 M NaOH at Room Temperature ............................................................................................. 3.3
3.2. Solution Potential Changes as a Function of Added 0.904 M Sodium Permanganate to 40 mL 0.1 M NaOH at 80°C ........................................................................................................................ 3.4
3.3. Solution Titration of 1 mmol Cr(NO3)3 in 0.1 M NaOH with 0.97 M NaMnO4 at 22°C ................. 3.4
3.4. Plot of Solution Potential for 0.5 mmole of Cr2O3 with 0.9 M NaMnO4 in 0.1 M NaOH at 80°C ..3.5
3.5. Plot of Visible Spectra for 0.5 mmole of Cr2O3 with 0.9 M NaMnO4 in 0.1 M NaOH at 80°C—Undetermined Stirring Speed ............................................................................................... 3.6
3.6. Repeat of the Conditions of 3.4. Plot of Solution Potential for 0.5 mmole of Cr2O3 with 0.9 M NaMnO4 in 0.1 M NaOH at 80°C .......................................................................................... 3.6
3.7. Repeat of the Conditions of 3.5. Plot of Visible Spectra for 0.5 mmole of Cr2O3 with 0.9 M NaMnO4 in 0.1 M NaOH at 80°C..................................................................................................... 3.7
3.8. Plot of Solution Potential for 0.503 mmole of Cr(OH)3—5.1H2O with 0.9 M NaMnO4 in 0.1 M NaOH at 80°C ........................................................................................................................ 3.7
3.9. Plot of Visible Spectra for the Reaction of 0.503 mmole of Cr(OH)3—5.1H2O with 0.9 M NaMnO4 in 0.1 M NaOH at ca. 23°C ............................................................................................... 3.8
3.10. Visible Spectrum of Permanganate. 0.45 mM NaMnO4 in 0.033 M NaOH.................................... 3.9
3.11. Visible Spectrum of Manganate, Diluted 1:10 in 0.1 M NaOH ....................................................... 3.9
3.12. Titration of 17.7 mM Permanganate in 51 mL 0.1 M NaOH with Hydrogen Peroxide as Monitored by Solution Potential..................................................................................................... 3.10
3.13. Titration of 17.7 mM Permanganate With Hydrogen Peroxide in 51 mL 0.1 M NaOH as Monitored by UV-vis Spectroscopy ............................................................................................... 3.11
3.14. Redox Titration of Sodium Permanganate in 0.1 M NaOH with Hydroxylammonium Nitrate ..... 3.11
3.15. Titration of Sodium Permanganate in 0.1 M NaOH with Hydroxylammonium Nitrate as Monitored by Visible Spectroscopy ................................................................................................................. 3.12
vi
3.16. Stability of Chromate to Excess Hydroxylamine in 0.1 M NaOH as Monitored by Visible Spectroscopy................................................................................................................................... 3.13
3.17. Visible Spectra of the Reaction of 0.67 Equivalents of Permanganate with Cr(OH)3·5.1H2O in 0.1 M NaOH at 23°C .................................................................................................................. 3.14
3.18. Visible Spectra of the Reaction of 0.75 Equivalents of Permanganate with Cr(OH)3·5.1H2O in 0.1 M NaOH at 23°C .................................................................................................................. 3.14
3.19. Visible Spectra of the Reaction of 1.0 Equivalent of Permanganate with Cr(OH)3·5.1H2O in 0.1 M NaOH at 23°C ...................................................................................................................... 3.15
3.20. Visible Spectra of the Reaction of 1.25 Equivalents of Permanganate with Cr(OH)3·5.1H2O in 0.1 M NaOH at 23°C .................................................................................................................. 3.15
3.21. Solution Potentials as a Function of Time at 23°C, 0.1 M NaOH .................................................. 3.16
3.22. Fraction Cr(OH)3·5.1H2O Dissolution as Function of Permanganate:Cr........................................ 3.16
3.23. Visible Spectra of the Reaction of 0.67 Equivalents of Permanganate in 0.1 M NaOH at 23°C ... 3.17
3.24. Visible Spectra of the Reaction of Cr(O)(OH) – H2O with 1.0 Equivalent of Sodium Permanganate at 22°C..................................................................................................................... 3.18
3.25. Solution Potential of the Reaction of Cr(O)(OH) – H2O with 1.0 Equivalent of Sodium Permanganate at 22°C..................................................................................................................... 3.19
3.26. Visible Spectra of the Reaction of Cr(O)(OH) – H2O with 1.0 Equivalent of Sodium Permanganate at 80°C..................................................................................................................... 3.19
3.27. Solution Potential of the Reaction of Cr(O)(OH) – H2O with 1.0 Equivalent of Sodium Permanganate at 80°C..................................................................................................................... 3.20
3.28. Percent Cr Dissolved as Chromate from Simulant #1; Cr as Cr(OH)3·2.2H2O Only ..................... 3.21
3.29. Percent Cr Dissolved as Chromate from Simulant #2; Cr as Cr(OH)3·2.2H2O and Cr2O3 ............. 3.21
3.30. Percent Cr Dissolved as Chromate from Simulant #2 Assuming Only Reaction of Cr(OH)3·2.2H2O.............................................................................................................................. 3.22
3.31. Influence of Agitation Type of Percent Cr Dissolved as Chromate for Cr(OH)3-2.2 H2O............. 3.23
3.32. Impact of Mixing Conditions on Chromate Formation for a Cr2O3-Based Simulant at 0.25 M NaOH, 25°C, 1 Equivalent Permanganate ......................................................................... 3.24
3.33. Impact of Hydroxide Concentration on Chromate Formation for a Cr2O3-Based Simulant at 500-rpm Stirring, 25°C, 1 Equivalent Permanganate ..................................................................... 3.25
3.34. Impact of Temperature on Chromate Formation for a Cr2O3-Based Simulant at 500-rpm Stirring, 0.25 M NaOH, 1 Equivalent Permanganate ..................................................................... 3.26
3.35. Impact of Varying Initial Permanganate:Cr on Chromate Formation for a Cr2O3-Based Simulant at 500-rpm Stirring, 0.25 M NaOH, 45°C ....................................................................... 3.27
vii
3.36. Impact of Varying Mixing Conditions on Chromate Formation for a Cr(O)(OH) – H2O-Based Simulant at 0.25 M NaOH, 25°C, Initial [Mn]/[Cr] = 1 .............................................. 3.28
3.37. Replicate Measurements of Chromate Formation for a Cr(O)(OH) – H2O-Based Simulant at 0.25 M NaOH, 25°C, Initial [Mn]/[Cr] = 1................................................................................. 3.29
3.38. Impact of Hydroxide on Chromate Formation for a Cr(O)(OH) – H2O-Based Simulant at 500-rpm Stirring, 25°C, 1 Equivalent Permanganate, surface area 3.34 m2/g Cr(O)(OH) – H2O ........................................................................................................................... 3.30
3.39. Impact of Varying Temperature on Chromate Formation for a Cr(O)(OH) – H2O-Based Simulant at 0.25 M NaOH, 500-rpm stirring, Initial [Mn]/[Cr] = 1 ............................................... 3.31
3.40. Impact of Varying Initial [Mn]:[Cr] on Chromate Formation for a Cr(O)(OH) – H2O-Based Simulant at 0.25 M NaOH, 500-rpm Stirring, 25°C, with a Surface Area 3.34 m2/g Cr(O)(OH) – H2O-Containing Simulant ......................................................................................... 3.32
3.41. Impact of Varying Initial [Mn]:[Cr] on Chromate Formation for a Cr(O)(OH) – H2O-Based Simulant at 0.25 M NaOH, 500-rpm Stirring, 45°C, with a Surface Area of 3.34 m2/g Cr(O)(OH) – H2O-Containing Simulant ......................................................................................... 3.33
3.42. The Extent of Total Cr as Chromate as a Function of Time During Oxidative Alkaline Leaching of the Radioactive Simulant at 25°C............................................................................... 3.38
3.43. The Extent of Total Cr as Chromate as a Function of Time During Oxidative Alkaline Leaching of the Radioactive Simulant at 45°C............................................................................... 3.39
3.44. Visible Spectra for Test 9b as a Function of Time ......................................................................... 3.40
viii
Tables
S.1. Description of Test Objectives .......................................................................................................... xv
S.2. Description of Test Exception .......................................................................................................... xvi
S.3. Success Criterion .............................................................................................................................xvii
S.4. List of R&T Test Conditions and Whether they Were Followed ..................................................... xix 2.1. FTIR Data for Chromium(III) Hydroxide......................................................................................... 2.5
2.2. Commercially Procured Phases Used in the Simulant...................................................................... 2.6
2.3. Initial Components Combined for the Radioactive Simulant ........................................................... 2.9
2.4. Composition of the Radioactive Simulant ........................................................................................ 2.9
2.5. Measured Concentrations of Key Components in the Radioactive Simulant ................................. 2.10
2.6. Preparation of Non-Chromium Components for Simulant #1 ........................................................ 2.11
2.7. Initial Components Combined for the Non-Radioactive Simulant ................................................. 2.11
3.1. Elemental Analysis for Solids Generated by Permanganate Contact with Cr(OH)3 in Either (0.1 M) or 3 M NaOH....................................................................................................................... 3.2
3.2. Oxidation State Determination of Mn Solids According to the Method of Murray ......................... 3.2
3.3. Fraction Cr(OH)3·5.1H2O Dissolution as Function of Permanganate:Cr........................................ 3.17
3.4. Variations on Permanganate Additions to Cr(OH)3·5.1H2O at 23°C in 0.1 M NaOH on Chromate Formation After 6 hours of Reaction Time.................................................................... 3.17
3.5. Fraction Chromium(III) Oxide Dissolution as Function of Permanganate:Cr at 23°C .................. 3.18
3.6. Fraction Cr(O)(OH) – H2O Dissolution as Function of Permanganate:Cr ..................................... 3.20
3.7. Particle Sizes for Cr Sources Used in Cold Simulant Testing ........................................................ 3.23
3.8. Impact of Mixing Conditions on Chromate Formation for a Cr2O3-Based Simulant at 0.25 M NaOH, 25°C, 1 Equivalent Permanganate...................................................................................... 3.25
3.9. Impact of Hydroxide on Chromate Formation for a Cr2O3-Based Simulant at 500-rpm Stirring, 25°C, 1 Equivalent Permanganate .................................................................................... 3.25
3.10. Impact of Temperature on Chromate Formation for a Cr2O3-Based Simulant at 500-rpm Stirring, 0.25 M NaOH, 1 Equivalent Permanganate ..................................................................... 3.26
3.11. Impact of Varying Initial Permanganate:Cr on Chromate Formation for a Cr2O3-Based Simulant at 500-rpm Stirring, 0.25 M NaOH, 45°C ....................................................................... 3.27
3.12. Impact of Varying Mixing Conditions on Chromate Formation for a Cr(O)(OH) – H2O- Based Simulant at 0.25 M NaOH, 25°C, Initial [Mn]/[Cr] = 1 ...................................................... 3.28
ix
3.13. Replicate Measurements of Chromate Formation for a Cr(O)(OH) – H2O-Based Simulant at 0.25 M NaOH, 25°C, Initial [Mn]/[Cr] = 1................................................................................. 3.29
3.14. Impact of Hydroxide on Chromate Formation for a Cr(O)(OH) – H2O-Based Simulant at 500-rpm Stirring, 25°C, 1 Equivalent Permanganate, surface area 3.34 m2/g Cr(O)(OH) – H2O..3.30
3.15. Impact of Varying Temperature on Chromate Formation for a Cr(O)(OH) – H2O-Based Simulant at 0.25 M NaOH, 500-rpm stirring, Initial [Mn]/[Cr] = 1 ............................................... 3.31
3.16. Impact of Varying Initial [Mn]:[Cr] on Chromate Formation for a Cr(O)(OH) – H2O-Based Simulant at 0.25 M NaOH, 500-rpm Stirring, 25°C, with a Surface Area 3.34 m2/g Cr(O)(OH) – H2O-Containing Simulant ......................................................................................... 3.32
3.17. Impact of Varying Initial [Mn]:[Cr] on Chromate Formation for a Cr(O)(OH) – H2O-Based Simulant at 0.25 M NaOH, 500-rpm Stirring, 45°C, with a Surface Area 3.34 m2/g Cr(O)(OH) – H2O-Containing Simulant ......................................................................................... 3.33
3.18. Targeted and Found Hydroxide Concentration for Caustic Leaching ............................................ 3.35
3.19. Selected Targeted and Measured Conditions for Oxidative Leaching with Radioactive Simulant .......................................................................................................................................... 3.36
3.20. Comparison of Targeted versus Delivered Volumes of.................................................................. 3.36
3.21 Targeted and Actual [Mn]:[Cr] for each Radioactive Simulant Test.............................................. 3.37
3.22. The Extent of Total Cr as Chromate as a Function of Time During Oxidative Alkaline Leaching of the Radioactive Simulant at 25°C............................................................................... 3.38
3.23. The Extent of Total Cr as Chromate as a Function of Time During Oxidative Alkaline Leaching of the Radioactive Simulant at 45°C............................................................................... 3.39
3.24. Key Component Distribution for Test 9a (0.25 M NaOH, 25 °C).................................................. 3.40
3.25. Key Component Distribution for Test 9b (1.25 M NaOH, 25 °C).................................................. 3.40
3.26. Key Component Distribution for Test 9c (3 M NaOH, 25 °C)....................................................... 3.41
3.27. Key Component Distribution for Test 10a (0.25 M NaOH, 45 °C)................................................ 3.41
3.28. Key Component Distribution for Test 10b (1.25 M NaOH, 45 °C)................................................ 3.41
3.29. Key Component Distribution for Test 10c (3 M NaOH, 45 °C)..................................................... 3.42
3.30. Key Component Distributions for Each Test.................................................................................. 3.42
3.31. Mass Balance Ratio for Key Components for Each Test................................................................ 3.43
3.32. Mass Balance Ratio for Key Components, Normalized to Fe, for Each Test................................. 3.43

xi
Acronyms
AEA alpha energy analysis
ASO Analytical Service Operations
BNI Bechtel National Incorporated
CCD charged-coupled device
DI deionized (water)
DOE U.S. Department of Energy
Eh solution potential
FTIR Fourier Transform Infrared
ICDD International Centre for Diffraction Data
ICP inductively coupled plasma
KPA kinetic phosphorescence analysis
MS metaschoepite
M&TE measuring and test equipment
NHE normal hydrogen electrode
NIST National Institute for Standards and Technology
OES optical emission spectroscopy
ORP oxidation-reduction potential
PES polyethylene sulfone
PFP Plutonium Finishing Plant
PNNL Pacific Northwest National Laboratory
PNWD Battelle—Pacific Northwest Division
QA quality assurance
QAP Quality Assurance Program
QARD Quality Assurance Requirements and Descriptions
QC quality control
RPL Radiochemical Processing Laboratory
RPP River Protection Project
SBMS Standards-Based Management System
SEM scanning electron microscopy
SOW statement of work
SP Support Project
TGA thermal gravimetric analysis
xii
TP test plan
UK United Kingdom
UV-vis ultraviolet visible
WTP Waste Treatment Plant
WTPSP Waste Treatment Plant Support Project
XPS X-ray photoelectron spectroscopy
XRD X-ray diffraction
xiii
References
Gmelin Handbuch der Anorganischen Chemie. 1975. “Mangan.” Part C2, System Number 56, Springer-Verlag. Gordon AJ, and RA Ford. 1972. The Chemist’s Companion. John Wiley and Sons, Inc., NY. Hoekstra HR, S Siegel, LH Fuchs, and JJ Katz. 1955. “The Uranium–Oxygen System: UO2.5 to U3O8.” J. Phys. Chem. 59(2):136-138. Jeffery GH, J Bassett, J Mendham, and RC Denny. 1989. Vogel’s Textbook of Quantitative Inorganic Chemistry, 5th Edition. Longman Group UK Limited, Essex, England. Lumetta GJ and JL Swanson. 1993. Pretreatment of Plutonium Finishing Plant (PFP) Sludge: Report for the Period October 1990 – March 1992. PNL-8601, Pacific Northwest Laboratory, Richland, WA. Lumetta GJ, IE Burgeson, MJ Wagner, J Liu, and YL Chen. 1997. Washing and Caustic Leaching of Hanford Tank Sludge: Results of FY 1997 Studies. PNNL-11636, Pacific Northwest National Laboratory, Richland, WA. Murray JW, and JG Dillard. 1979. “The oxidation of cobalt(II) absorbed on manganese dioxide.” Geochimica et Cosmochimica Acta 43:781-787. Murray JW, LS Balistrieri, and B Paul. 1984. “The oxidation state of manganese in marine segments and ferromanganese nodules.” Geochimica et Cosmochimica Acta 48:1237-1247. Peretrukhin VF, VI Silin, AV Kareta, AV Gelis, VP Shilov, KE German, EV Firsova, AG Maslennikov, and VE Trushina. 1998. Purification of Alkaline Solutions and Wastes from Actinides and Technetium by Coprecipitation with Some Carriers Using the Method of Appearing Regents: Final Report. PNNL-11988, Pacific Northwest National Laboratory, Richland, WA. Pourbaix M. 1966. Atlas of Electrochemical Equilibria in Aqueous Solutions. Pergamon Press, New York, NY. Rai, D, NJ Hess, LF Rao, ZC Zhang, AR Felmy, DA Moore, SB Clark, and GJ Lumetta. 2002. “Thermodynamic model for the solubility of Cr(OH)3(am) in concentrated NaOH and NaOH-NaNO3 solutions.” J. Solution Chem. 31(5):343-367. Rapko BM, JGH Geeting, SI Sinkov, and JD Vienna. 2004. Oxidative-Alkaline Leaching of Washed 241-SY-102 and 241-SX-101 Tank Sludges. PNWD-3512, WTP-RPT-117, Rev.0, Battelle—Pacific Northwest Division, Richland, WA. Rapko BM, GJ Lumetta, JD Vienna, and SK Fiskum. 2005. Oxidative Alkaline Leaching of SX-101 and SY-102 and Its Impact on Immobilized High-Level Waste. PNWD-3600, WTP-RPT-137, Rev.0, Battelle—Pacific Northwest Division, Richland, WA. Ratnasamy P, and AJ Léonard. 1972. “Structural Evolution of Chromia.” J. Phys. Chem. 76:1838-1843.
xiv
Sundar PS. 2006. Process Development for Design of Oxidative Leaching of Hanford Wastes. 24590-PTF-TSP-RT-06-002, Rev. 0, Bechtel National, Incorporated, Richland, WA. Xu H, T Lou, and Y Li. 2004. “Synthesis and characterize of trivalent chromium Cr(OH)3 and Cr2O3 microspheres.” Inorg. Chem. Comm. 7:666-668.
xv
Testing Summary
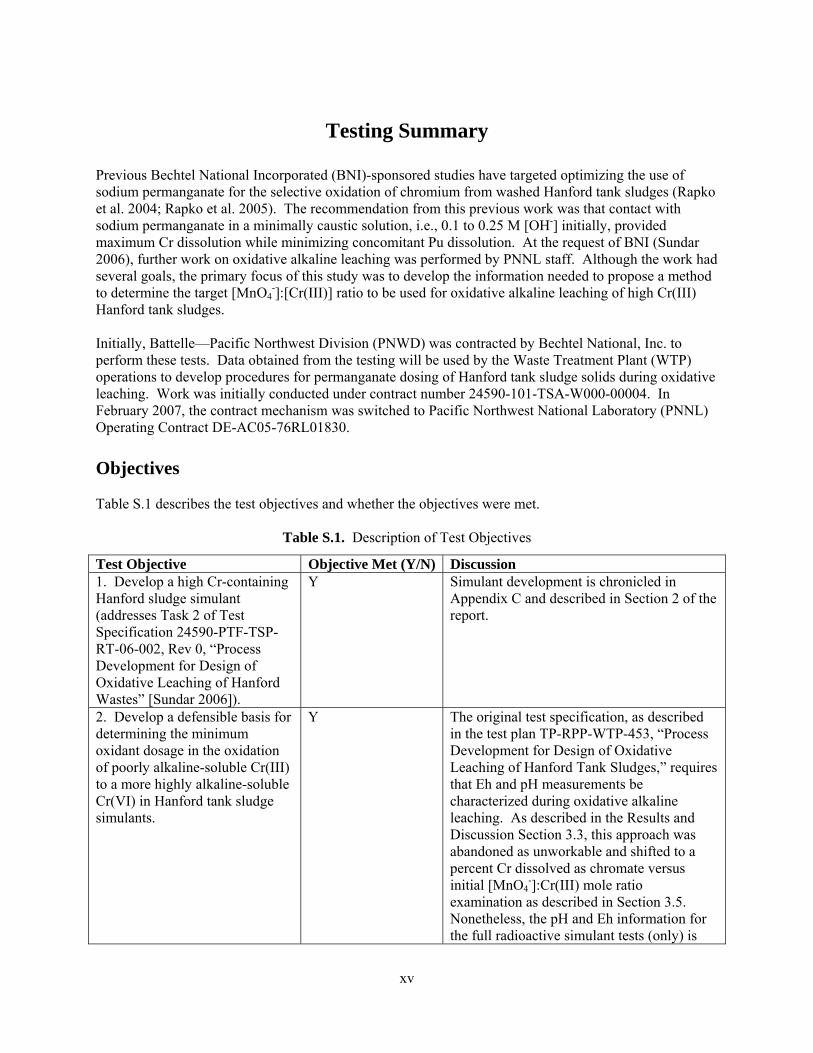
Previous Bechtel National Incorporated (BNI)-sponsored studies have targeted optimizing the use of sodium permanganate for the selective oxidation of chromium from washed Hanford tank sludges (Rapko et al. 2004; Rapko et al. 2005). The recommendation from this previous work was that contact with sodium permanganate in a minimally caustic solution, i.e., 0.1 to 0.25 M [OH-] initially, provided maximum Cr dissolution while minimizing concomitant Pu dissolution. At the request of BNI (Sundar 2006), further work on oxidative alkaline leaching was performed by PNNL staff. Although the work had several goals, the primary focus of this study was to develop the information needed to propose a method to determine the target [MnO4
-]:[Cr(III)] ratio to be used for oxidative alkaline leaching of high Cr(III) Hanford tank sludges. Initially, Battelle—Pacific Northwest Division (PNWD) was contracted by Bechtel National, Inc. to perform these tests. Data obtained from the testing will be used by the Waste Treatment Plant (WTP) operations to develop procedures for permanganate dosing of Hanford tank sludge solids during oxidative leaching. Work was initially conducted under contract number 24590-101-TSA-W000-00004. In February 2007, the contract mechanism was switched to Pacific Northwest National Laboratory (PNNL) Operating Contract DE-AC05-76RL01830. Objectives Table S.1 describes the test objectives and whether the objectives were met.
Table S.1. Description of Test Objectives
Test Objective Objective Met (Y/N) Discussion 1. Develop a high Cr-containing Hanford sludge simulant (addresses Task 2 of Test Specification 24590-PTF-TSP-RT-06-002, Rev 0, “Process Development for Design of Oxidative Leaching of Hanford Wastes” [Sundar 2006]).
Y Simulant development is chronicled in Appendix C and described in Section 2 of the report.
2. Develop a defensible basis for determining the minimum oxidant dosage in the oxidation of poorly alkaline-soluble Cr(III) to a more highly alkaline-soluble Cr(VI) in Hanford tank sludge simulants.
Y The original test specification, as described in the test plan TP-RPP-WTP-453, “Process Development for Design of Oxidative Leaching of Hanford Tank Sludges,” requires that Eh and pH measurements be characterized during oxidative alkaline leaching. As described in the Results and Discussion Section 3.3, this approach was abandoned as unworkable and shifted to a percent Cr dissolved as chromate versus initial [MnO4
-]:Cr(III) mole ratio examination as described in Section 3.5. Nonetheless, the pH and Eh information for the full radioactive simulant tests (only) is
xvi
Test Objective Objective Met (Y/N) Discussion included in Appendix B.
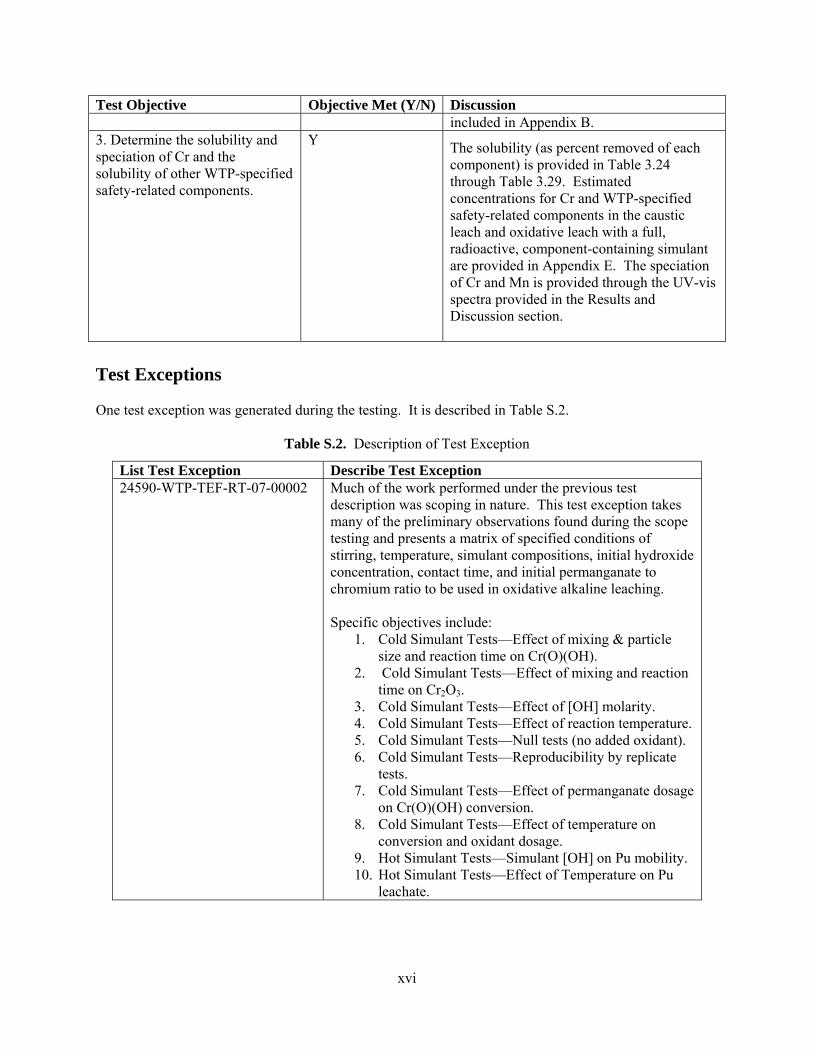
3. Determine the solubility and speciation of Cr and the solubility of other WTP-specified safety-related components.
Y The solubility (as percent removed of each component) is provided in Table 3.24 through Table 3.29. Estimated concentrations for Cr and WTP-specified safety-related components in the caustic leach and oxidative leach with a full, radioactive, component-containing simulant are provided in Appendix E. The speciation of Cr and Mn is provided through the UV-vis spectra provided in the Results and Discussion section.
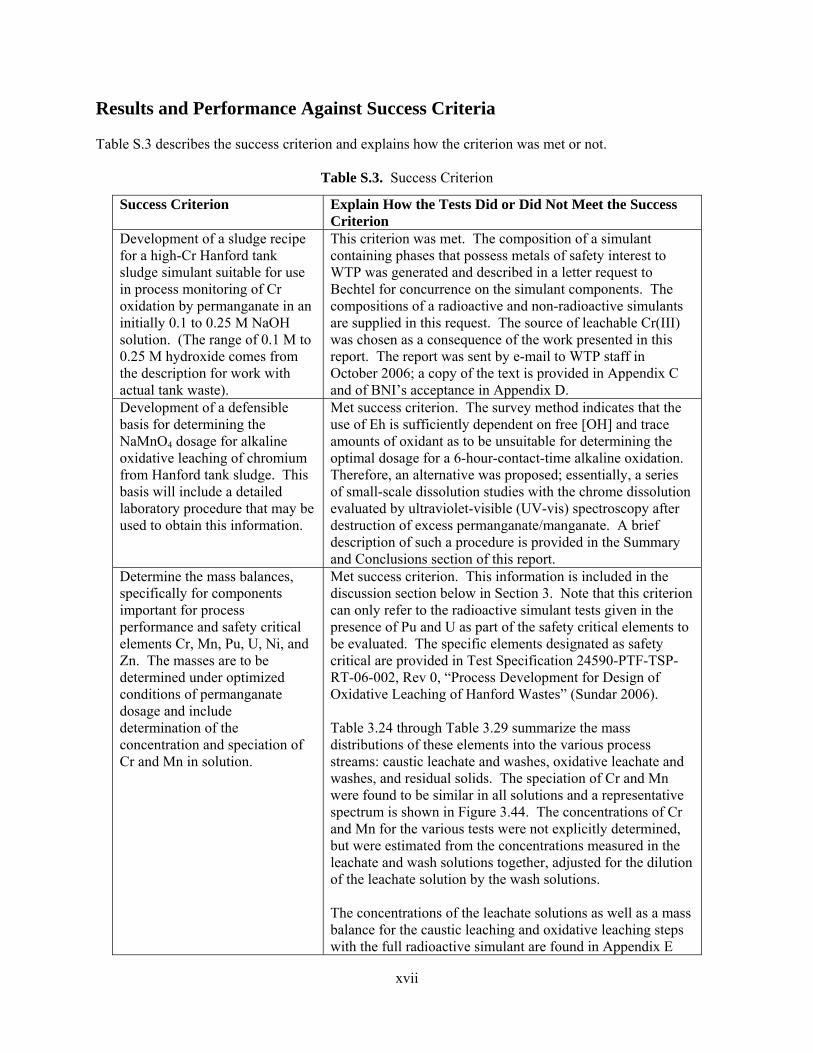
Test Exceptions One test exception was generated during the testing. It is described in Table S.2.
Table S.2. Description of Test Exception
List Test Exception Describe Test Exception 24590-WTP-TEF-RT-07-00002 Much of the work performed under the previous test
description was scoping in nature. This test exception takes many of the preliminary observations found during the scope testing and presents a matrix of specified conditions of stirring, temperature, simulant compositions, initial hydroxide concentration, contact time, and initial permanganate to chromium ratio to be used in oxidative alkaline leaching. Specific objectives include:
1. Cold Simulant Tests—Effect of mixing & particle size and reaction time on Cr(O)(OH).
2. Cold Simulant Tests—Effect of mixing and reaction time on Cr2O3.
3. Cold Simulant Tests—Effect of [OH] molarity. 4. Cold Simulant Tests—Effect of reaction temperature. 5. Cold Simulant Tests—Null tests (no added oxidant). 6. Cold Simulant Tests—Reproducibility by replicate
tests. 7. Cold Simulant Tests—Effect of permanganate dosage
on Cr(O)(OH) conversion. 8. Cold Simulant Tests—Effect of temperature on
conversion and oxidant dosage. 9. Hot Simulant Tests—Simulant [OH] on Pu mobility. 10. Hot Simulant Tests—Effect of Temperature on Pu
leachate.
xvii
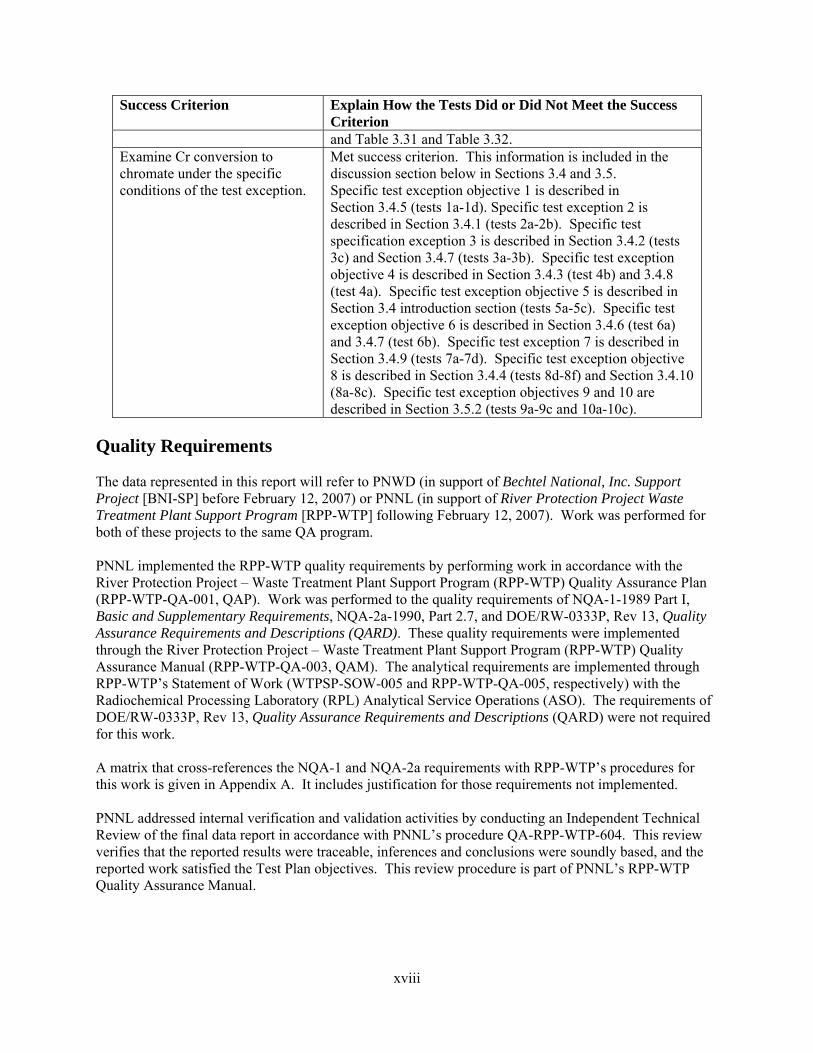
Results and Performance Against Success Criteria Table S.3 describes the success criterion and explains how the criterion was met or not.
Table S.3. Success Criterion
Success Criterion Explain How the Tests Did or Did Not Meet the Success Criterion
Development of a sludge recipe for a high-Cr Hanford tank sludge simulant suitable for use in process monitoring of Cr oxidation by permanganate in an initially 0.1 to 0.25 M NaOH solution. (The range of 0.1 M to 0.25 M hydroxide comes from the description for work with actual tank waste).
This criterion was met. The composition of a simulant containing phases that possess metals of safety interest to WTP was generated and described in a letter request to Bechtel for concurrence on the simulant components. The compositions of a radioactive and non-radioactive simulants are supplied in this request. The source of leachable Cr(III) was chosen as a consequence of the work presented in this report. The report was sent by e-mail to WTP staff in October 2006; a copy of the text is provided in Appendix C and of BNI’s acceptance in Appendix D.
Development of a defensible basis for determining the NaMnO4 dosage for alkaline oxidative leaching of chromium from Hanford tank sludge. This basis will include a detailed laboratory procedure that may be used to obtain this information.
Met success criterion. The survey method indicates that the use of Eh is sufficiently dependent on free [OH] and trace amounts of oxidant as to be unsuitable for determining the optimal dosage for a 6-hour-contact-time alkaline oxidation. Therefore, an alternative was proposed; essentially, a series of small-scale dissolution studies with the chrome dissolution evaluated by ultraviolet-visible (UV-vis) spectroscopy after destruction of excess permanganate/manganate. A brief description of such a procedure is provided in the Summary and Conclusions section of this report.
Determine the mass balances, specifically for components important for process performance and safety critical elements Cr, Mn, Pu, U, Ni, and Zn. The masses are to be determined under optimized conditions of permanganate dosage and include determination of the concentration and speciation of Cr and Mn in solution.
Met success criterion. This information is included in the discussion section below in Section 3. Note that this criterion can only refer to the radioactive simulant tests given in the presence of Pu and U as part of the safety critical elements to be evaluated. The specific elements designated as safety critical are provided in Test Specification 24590-PTF-TSP-RT-06-002, Rev 0, “Process Development for Design of Oxidative Leaching of Hanford Wastes” (Sundar 2006). Table 3.24 through Table 3.29 summarize the mass distributions of these elements into the various process streams: caustic leachate and washes, oxidative leachate and washes, and residual solids. The speciation of Cr and Mn were found to be similar in all solutions and a representative spectrum is shown in Figure 3.44. The concentrations of Cr and Mn for the various tests were not explicitly determined, but were estimated from the concentrations measured in the leachate and wash solutions together, adjusted for the dilution of the leachate solution by the wash solutions. The concentrations of the leachate solutions as well as a mass balance for the caustic leaching and oxidative leaching steps with the full radioactive simulant are found in Appendix E
xviii
Success Criterion Explain How the Tests Did or Did Not Meet the Success Criterion and Table 3.31 and Table 3.32.
Examine Cr conversion to chromate under the specific conditions of the test exception.
Met success criterion. This information is included in the discussion section below in Sections 3.4 and 3.5. Specific test exception objective 1 is described in Section 3.4.5 (tests 1a-1d). Specific test exception 2 is described in Section 3.4.1 (tests 2a-2b). Specific test specification exception 3 is described in Section 3.4.2 (tests 3c) and Section 3.4.7 (tests 3a-3b). Specific test exception objective 4 is described in Section 3.4.3 (test 4b) and 3.4.8 (test 4a). Specific test exception objective 5 is described in Section 3.4 introduction section (tests 5a-5c). Specific test exception objective 6 is described in Section 3.4.6 (test 6a) and 3.4.7 (test 6b). Specific test exception 7 is described in Section 3.4.9 (tests 7a-7d). Specific test exception objective 8 is described in Section 3.4.4 (tests 8d-8f) and Section 3.4.10 (8a-8c). Specific test exception objectives 9 and 10 are described in Section 3.5.2 (tests 9a-9c and 10a-10c).
Quality Requirements The data represented in this report will refer to PNWD (in support of Bechtel National, Inc. Support Project [BNI-SP] before February 12, 2007) or PNNL (in support of River Protection Project Waste Treatment Plant Support Program [RPP-WTP] following February 12, 2007). Work was performed for both of these projects to the same QA program. PNNL implemented the RPP-WTP quality requirements by performing work in accordance with the River Protection Project – Waste Treatment Plant Support Program (RPP-WTP) Quality Assurance Plan (RPP-WTP-QA-001, QAP). Work was performed to the quality requirements of NQA-1-1989 Part I, Basic and Supplementary Requirements, NQA-2a-1990, Part 2.7, and DOE/RW-0333P, Rev 13, Quality Assurance Requirements and Descriptions (QARD). These quality requirements were implemented through the River Protection Project – Waste Treatment Plant Support Program (RPP-WTP) Quality Assurance Manual (RPP-WTP-QA-003, QAM). The analytical requirements are implemented through RPP-WTP’s Statement of Work (WTPSP-SOW-005 and RPP-WTP-QA-005, respectively) with the Radiochemical Processing Laboratory (RPL) Analytical Service Operations (ASO). The requirements of DOE/RW-0333P, Rev 13, Quality Assurance Requirements and Descriptions (QARD) were not required for this work. A matrix that cross-references the NQA-1 and NQA-2a requirements with RPP-WTP’s procedures for this work is given in Appendix A. It includes justification for those requirements not implemented. PNNL addressed internal verification and validation activities by conducting an Independent Technical Review of the final data report in accordance with PNNL’s procedure QA-RPP-WTP-604. This review verifies that the reported results were traceable, inferences and conclusions were soundly based, and the reported work satisfied the Test Plan objectives. This review procedure is part of PNNL’s RPP-WTP Quality Assurance Manual.
xix
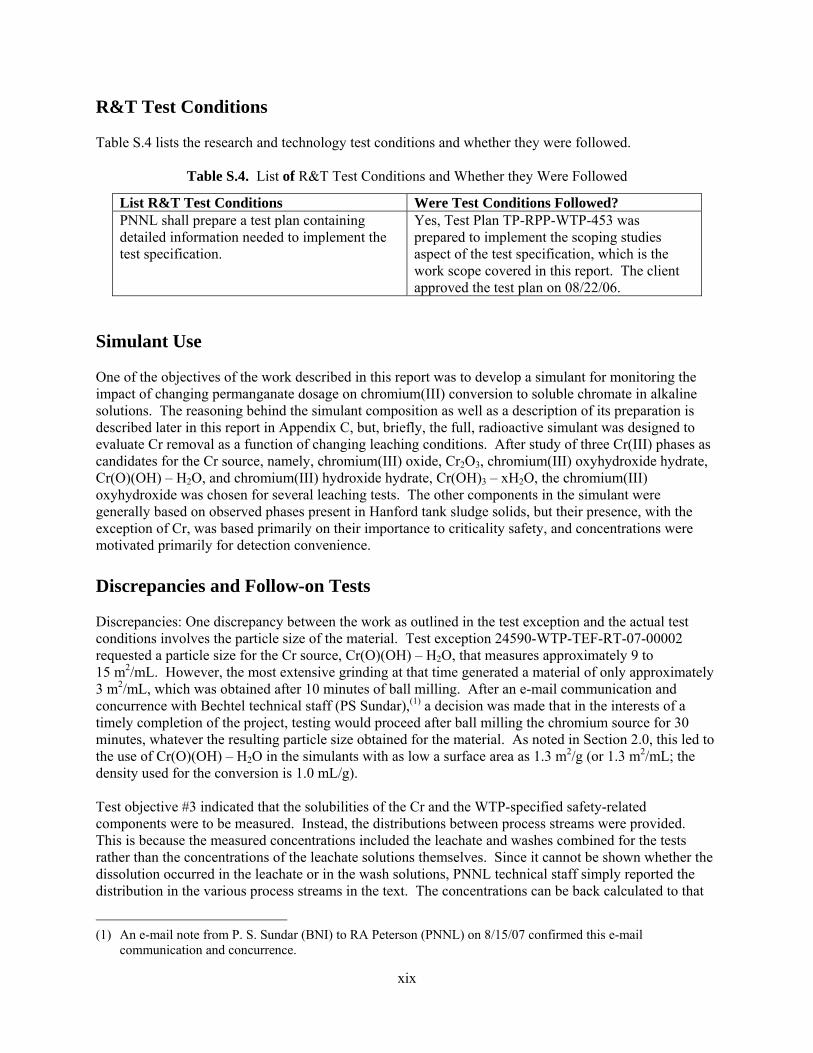
R&T Test Conditions Table S.4 lists the research and technology test conditions and whether they were followed.
Table S.4. List of R&T Test Conditions and Whether they Were Followed
List R&T Test Conditions Were Test Conditions Followed? PNNL shall prepare a test plan containing detailed information needed to implement the test specification.
Yes, Test Plan TP-RPP-WTP-453 was prepared to implement the scoping studies aspect of the test specification, which is the work scope covered in this report. The client approved the test plan on 08/22/06.
Simulant Use One of the objectives of the work described in this report was to develop a simulant for monitoring the impact of changing permanganate dosage on chromium(III) conversion to soluble chromate in alkaline solutions. The reasoning behind the simulant composition as well as a description of its preparation is described later in this report in Appendix C, but, briefly, the full, radioactive simulant was designed to evaluate Cr removal as a function of changing leaching conditions. After study of three Cr(III) phases as candidates for the Cr source, namely, chromium(III) oxide, Cr2O3, chromium(III) oxyhydroxide hydrate, Cr(O)(OH) – H2O, and chromium(III) hydroxide hydrate, Cr(OH)3 – xH2O, the chromium(III) oxyhydroxide was chosen for several leaching tests. The other components in the simulant were generally based on observed phases present in Hanford tank sludge solids, but their presence, with the exception of Cr, was based primarily on their importance to criticality safety, and concentrations were motivated primarily for detection convenience. Discrepancies and Follow-on Tests Discrepancies: One discrepancy between the work as outlined in the test exception and the actual test conditions involves the particle size of the material. Test exception 24590-WTP-TEF-RT-07-00002 requested a particle size for the Cr source, Cr(O)(OH) – H2O, that measures approximately 9 to 15 m2/mL. However, the most extensive grinding at that time generated a material of only approximately 3 m2/mL, which was obtained after 10 minutes of ball milling. After an e-mail communication and concurrence with Bechtel technical staff (PS Sundar),(1) a decision was made that in the interests of a timely completion of the project, testing would proceed after ball milling the chromium source for 30 minutes, whatever the resulting particle size obtained for the material. As noted in Section 2.0, this led to the use of Cr(O)(OH) – H2O in the simulants with as low a surface area as 1.3 m2/g (or 1.3 m2/mL; the density used for the conversion is 1.0 mL/g). Test objective #3 indicated that the solubilities of the Cr and the WTP-specified safety-related components were to be measured. Instead, the distributions between process streams were provided. This is because the measured concentrations included the leachate and washes combined for the tests rather than the concentrations of the leachate solutions themselves. Since it cannot be shown whether the dissolution occurred in the leachate or in the wash solutions, PNNL technical staff simply reported the distribution in the various process streams in the text. The concentrations can be back calculated to that
(1) An e-mail note from P. S. Sundar (BNI) to RA Peterson (PNNL) on 8/15/07 confirmed this e-mail
communication and concurrence.
xx
present in the various process streams, assuming no function for the washes except to collect dissolved material in the interstitial solution of the initial leachate; this was done and is reported as Appendix E. The results of the testing described in this report suggest further work that might be productive with respect to optimizing the conditions of alkaline oxidative leaching for Hanford tank sludges. Perhaps the most important area worth follow-on investigation comes from the observation that little change in the extent of Pu dissolution during oxidative alkaline leaching is found for contacts with solutions between 0.25 and 1.25 M, but that significant enhancement is found between 1.25 and 3 M NaOH (Table 3.24 through Table 3.29). Further experimentation should be performed to verify this result and, perhaps more importantly, precisely determine the NaOH concentration at which enhanced Pu dissolution begins. Such information may reduce the need for extensive washing after caustic leaching in the WTP to get the hydroxide down to a point where oxidative leaching can be performed successfully without a concomitant enhancement in Pu oxidative dissolution. A second area for follow-on work is to identify a laboratory-scale method of agitation that can be correlated to the in-plant method of agitation. This will be required to identify the reaction conditions needed for the permanganate dosage in laboratory measurements that are proposed in this report and probably should be done as part of the pilot-scale work. A third area worth follow-on investigation comes from similar observations about the change in Cr dissolution as a function of hydroxide concentration, where simulant work indicates an enhancement between 0.25 and 1.25 M NaOH, but little enhancement between 1.25 and 3 M (Figure 3.38 and Table 3.14). The hydroxide concentration where this enhancement occurs is worth identifying more precisely, as again, this will allow a setting for a more optimum hydroxide condition that likely will translate into less washing in the WTP plant being required before optimal oxidative leaching can be performed. A fourth area worth additional investigation comes from the observation of a strong dependence on particle size on the rate and extent of Cr dissolution. The extent that this occurs is worth mapping out more precisely using sieving to narrow the particle-size range actually tested and either particle-size measurements or direct surface-area measurements to determine the surface area for each particle-size range. Such information may allow for setting a particle size/surface area criterion for a Cr source to be used in a pilot-plant simulant. Some of the conclusions are based solely on the non-radioactive simulant and were not verified in the full radioactive simulant testing. Confirmation of the non-simulant conclusions with a full radioactive simulant test would be useful. Finally, as documented in the discussion below, the high Cr loadings in the simulant, together with the low leachate-to-solids ratio, led to such a large consumption of hydroxide by the oxidative leaching of chromium to chromate by permanganate that the initial free hydroxide concentrations were, especially for the lower hydroxide leachings, substantially lower than their initial targets. Repeating these tests with Cr-containing simulants sufficiently lower in Cr such that the consumption of hydroxide is only a minor perturbation of the system might supply information more relevant to plant operations.

xxi
Acknowledgements
The authors would like to thank Pacific Northwest National Laboratory staff members Wayne Cosby for his editorial support, Bruce McNamara for obtaining the uranium compounds used in this report, Richard Daniel for his assistance in obtaining particle size analyses, Anne Kozelisky for her assistance in obtaining X-ray diffraction and thermal gravimetric analysis data, and Bryan Cook for technical help. The authors also would like to thank Parameshwaran S. Sundar and Frederick W. Damerow of Bechtel National, Inc. for their technical insights and much helpful discussion and support.
1.1
1.0 Introduction
Previous Bechtel National, Incorporated (BNI)-sponsored studies have targeted optimizing sodium permanganate for the selective oxidation of chromium from washed Hanford tank sludges (Rapko et al. 2004; Rapko et al. 2005). The recommendation from previous work was that contact with sodium permanganate in a minimally caustic solution, i.e., 0.1 to 0.25 M [OH-] initially, provided maximum Cr dissolution while minimizing concomitant Pu dissolution. Most of those previous studies involved the use of an initial 1.0 to 1.1 [permanganate]:[Cr] ratio. This ratio was chosen to verify sufficient permanganate for complete reaction of Cr(III) based on the following stoichiometry:
Cr(OH)3 + MnO4- + 5 OH- CrO4
2- + MnO2 + 2 H2O (1.1) Other stoichiometries are plausible, involving, for example, a one-electron Mn(VII) to Mn(VI) reduction or a four-electron Mn(VII) to Mn(III) reduction. However, the high conversions observed with Hanford tank sludges (often 80 to 95+ percent) together with the observation of the formation of insoluble Mn solids led to the hypothesis that the reaction described in Equation 1.1 is predominant during the oxidative alkaline dissolution of chromium Hanford tank solids. However, further experimental support for this hypothesis is desirable and is one focus for the work described in this report. The work described in this report is a scoping study that proceeded in several steps. These steps include:
1) To develop a high Cr-containing Hanford sludge simulant (addresses Task 2 of Test Specification 24590-PTF-TSP-RT-06-002, Rev 0, “Process Development for Design of Oxidative Leaching of Hanford Wastes” (Sundar 2006). This step includes evaluating multiple chromium(III) phases for their facility for converting to chromate upon contact with permanganate in alkaline solutions. The three chromium(III) species chosen for evaluation were “hydrous chromium(III) hydroxide,” Cr(OH)3-xH2O, prepared from room-temperature alkaline precipitation of simple Cr(III) salts; “chromium oxyhydroxide-hydrate,” Cr(O)(OH)-xH2O, a material prepared from heating solutions of soluble, alkaline, Cr(III) solution; and commercial chromium(III) oxide, Cr2O3. The protocols for making these simulants are described in Section 2.2.
This step also includes developing a simulant for further testing of the response of chromium(III) oxidation by permanganate under changing experimental conditions. This simulant development is provided in Section 2.2 and in Appendix C.
2) To develop a defensible basis for determining the minimum oxidant dosage in the oxidation of poorly alkaline soluble Cr(III) to a more highly alkaline soluble Cr(VI) using these Hanford tank sludge simulants.
The first approach described in this report used the monitoring of solution potential (Eh) to evaluate the amount of permanganate needed for chromium(III) conversion to chromate. The results of this development effort are described in Section 3.3.1.
The second approach described in this report was to use a method based on varying the [MnO4-]/
[Cr(III)] ratio to determine the required amount of permanganate. The extent of dissolved chromium was generally determined by visible spectroscopy using the 372-nm maximum for

1.2
chromate absorption. The results of this development effort are described in Section 3.3.3 and used to obtain the results reported in Section 3.4.
3) To determine the solubility and speciation of Cr and the solubility of other Waste Treatment
Plant (WTP)-specified safety related components. This was done primarily by metals determination by inductively coupled plasma-optical emission spectroscopy (ICP-OES), alpha energy analysis (AEA) for Pu, kinetic phosphorescence (KPA) for U, and visible spectroscopy for chromate and to determine the speciation of soluble Mn.
Using the results from steps 1 and 2 above, the fate of Cr and specified safety-related components is assessed. The results of this development effort are described in Section 3.5
Initially, Battelle—Pacific Northwest Division (PNWD) was contracted by Bechtel National, Inc. to perform these further scoping studies on oxidative alkaline leaching. The data obtained from the testing will be used by the WTP operations to develop procedures for permanganate dosing of Hanford tank sludge solids during oxidative leaching. Work was initially conducted under contract number 24590-101-TSA-W000-00004. In February 2007, the contract mechanism was switched to Pacific Northwest National Laboratory (PNNL) Operating Contract DE-AC05-76RL01830.
In summary, to achieve the goals of this scoping study, this report describes work focused on improving methods to monitor chromium oxidation by permanganate with Hanford sludge simulants and to further identify the Cr and Mn materials formed during said oxidative leaching.
2.1
2.0 Experimental Section
In this section, the experimental details relevant to the work described in this report are provided. The section begins with general equipment and analytical information. It then proceeds to the details of producing and characterizing the Cr(III) solids to be used in this work. As this work expanded in scope, certain Cr(III) solids that needed to be prepared were repeated, and slight differences in preparation led to differences in the solids compositions; these are included in this section as well. The preparation and characterization of mixes of compounds are described that were used to develop, first, simple simulants and then, a full, radioactive simulant used for the most extensive analyses during testing. Finally, the procedures are presented that were used to prepare and analyze a Mn solid obtained by reaction of Cr(III) solids, specifically, Cr(O)(OH)-H2O, with permanganate in various alkaline solutions.
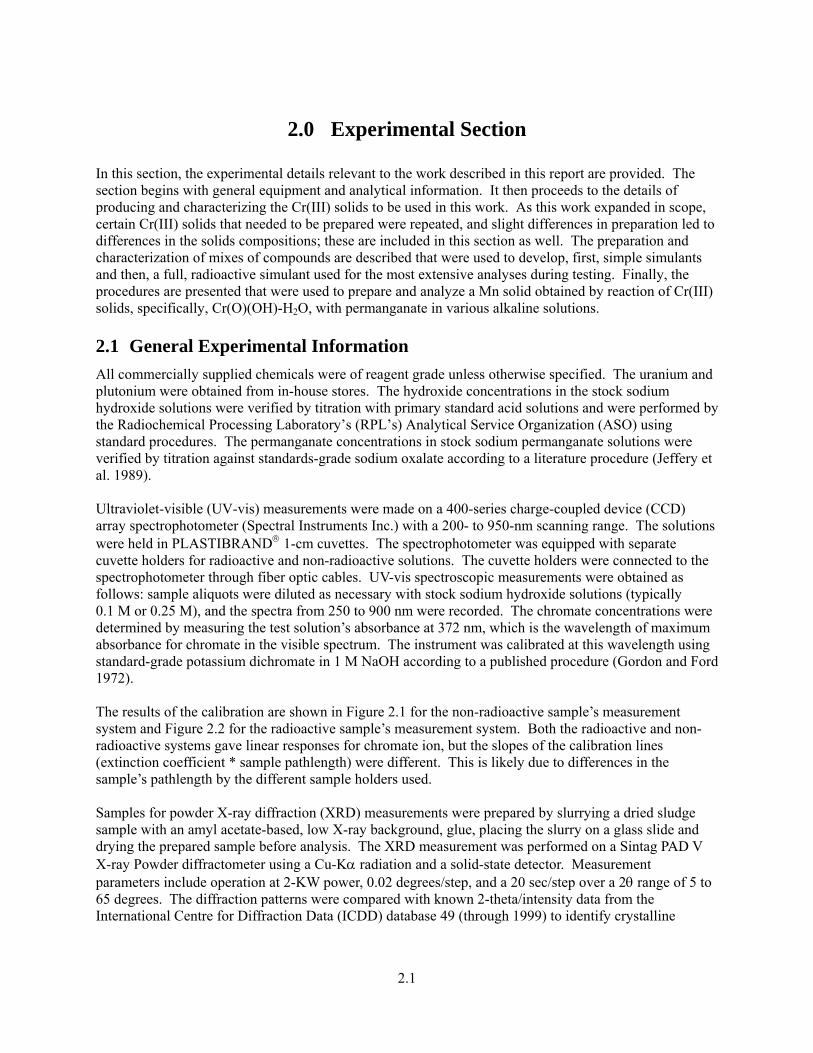
2.1 General Experimental Information All commercially supplied chemicals were of reagent grade unless otherwise specified. The uranium and plutonium were obtained from in-house stores. The hydroxide concentrations in the stock sodium hydroxide solutions were verified by titration with primary standard acid solutions and were performed by the Radiochemical Processing Laboratory’s (RPL’s) Analytical Service Organization (ASO) using standard procedures. The permanganate concentrations in stock sodium permanganate solutions were verified by titration against standards-grade sodium oxalate according to a literature procedure (Jeffery et al. 1989). Ultraviolet-visible (UV-vis) measurements were made on a 400-series charge-coupled device (CCD) array spectrophotometer (Spectral Instruments Inc.) with a 200- to 950-nm scanning range. The solutions were held in PLASTIBRAND® 1-cm cuvettes. The spectrophotometer was equipped with separate cuvette holders for radioactive and non-radioactive solutions. The cuvette holders were connected to the spectrophotometer through fiber optic cables. UV-vis spectroscopic measurements were obtained as follows: sample aliquots were diluted as necessary with stock sodium hydroxide solutions (typically 0.1 M or 0.25 M), and the spectra from 250 to 900 nm were recorded. The chromate concentrations were determined by measuring the test solution’s absorbance at 372 nm, which is the wavelength of maximum absorbance for chromate in the visible spectrum. The instrument was calibrated at this wavelength using standard-grade potassium dichromate in 1 M NaOH according to a published procedure (Gordon and Ford 1972). The results of the calibration are shown in Figure 2.1 for the non-radioactive sample’s measurement system and Figure 2.2 for the radioactive sample’s measurement system. Both the radioactive and non-radioactive systems gave linear responses for chromate ion, but the slopes of the calibration lines (extinction coefficient * sample pathlength) were different. This is likely due to differences in the sample’s pathlength by the different sample holders used. Samples for powder X-ray diffraction (XRD) measurements were prepared by slurrying a dried sludge sample with an amyl acetate-based, low X-ray background, glue, placing the slurry on a glass slide and drying the prepared sample before analysis. The XRD measurement was performed on a Sintag PAD V X-ray Powder diffractometer using a Cu-Kα radiation and a solid-state detector. Measurement parameters include operation at 2-KW power, 0.02 degrees/step, and a 20 sec/step over a 2θ range of 5 to 65 degrees. The diffraction patterns were compared with known 2-theta/intensity data from the International Centre for Diffraction Data (ICDD) database 49 (through 1999) to identify crystalline
2.2
phases. This measurement was performed according to the technical procedure PNL-ALO-268, Solids Analysis, X-ray Diffraction. X-ray photoelectron spectroscopy (XPS) measurements were obtained as described in an accompanying report.(2)
Figure 2.1 Results from the Non-Radioactive System’s Calibration of the UV-vis Spectrometer at
372 nm Against Standard Chromate Solutions
Figure 2.2. Results from the Radioactive System’s Calibration of the UV-vis Spectrometer at
372 nm Against Standard Chromate Solutions (2) DL Blanchard, Jr. 2007. “Oxidation State of Manganese in WTP Sludge Simulants.” WTP report in
press.

2.3
Eh measurements were performed using an Orion Epoxy Combination/Oxidation-Reduction Potential (ORP) electrode coupled to an Orion 5 Star multi-parameter meter. This probe uses a platinum-band working electrode redox and a silver/silver chloride reference electrode. The system performance was checked at the start of each day against an Orion ORP standard, and agreement to ± 3 mV of the solution’s reported potential at room temperature was required before further use. Solution potentials are reported in mV relative to the normal hydrogen electrode (NHE). Any ORP measurements taken at elevated temperatures are uncorrected. pH measurements were obtained using a glass combination semi micro pH electrode coupled to an Orion 5 Star multi-parameter meter. The system was calibrated against pH 7 and 10 or pH 10 and 13 standard buffer solutions and required a slope of 97 ± 5, as recommended by the instruction manual, before use. Any pH measurements taken at elevated temperatures are uncorrected. The Analytical Services Organization at PNNL performed all hydroxide concentration determinations, uranium concentrations by kinetic phosphorescence, AEA, and ICP-OES measurements using standard procedures under SOW-RPP-WTP-QA-005.
2.2 Preparation of Cr(III) Solids This section describes the three phases of chromium used in this study: chromium(III) hydroxide hydrous, chromium(III) oxyhydroxide hydrate, and chromium(III) oxide. The first two materials were prepared as described below; the chromium(III) oxide was obtained from commercial sources and was characterized as described below. “Chromium(III) Hydroxide,” Cr(OH)3-xH2O. 1st approach. This approach was examined in an attempt to generate size controlled Cr(OH)3 and/or Cr2O3 microspheres by the method described by Xu et al. (Xu 2004). Briefly, 0.152 g of acrylamide (2 mmol), 0.28 grams of potassium dichromate (1 mmol), and 80 mL of deionized (DI) water were combined and placed in a 125-mL Parr, high pressure, reaction vessel. The system then was heated to 180°C in an oven overnight. The vessel then was removed from the oven and allowed to cool to room temperature. The resulting suspension next was centrifuged and the supernatant decanted away. The solids were resuspended in DI water and the centrifuge/decantation repeated. Three washes were performed in this manner and the isolated solids allowed to air dry, yielding 0.175 g of green solid. The particle size of the solid was measured in DI water. Generally, the particles were sonicated before or during particle-size measurement in this sample and for the other measurements reported in this document. For this sample, the following volume percent information obtained: d(0.1) [lowest 10 percent of the particle size range] = 0.33 microns, d(0.5) [50 percent of the particle size range] = 0.96 microns, d(0.9) [lowest 90 percent of the particle size range] = 5.95 microns, surface area = 8.15 m2/g. Because of the time-consuming nature of this preparation and because of difficulties in scaling this method up to prepare the multi-gram quantities of materials needed for this study, alternative approaches were explored. These methods are described below. 2nd approach. In this approach, the hydrous chromium(III) hydroxide was precipitated from ammonia solution in an adaptation of the approach used by Ratnasamy and Léonard (1972). CrCl3·6H2O (35.636 g; 0.134 mole) was dissolved in 75 mL of DI water. The resulting solution was filtered through a 0.45-µm nylon membrane and then slowly added (over a period of ~10 min) to 150 mL of 4.9 M NH4OH (prepared by mixing 50 mL of concentrated NH4OH solution with 100 mL DI water) with stirring. After stirring for ~0.5 h, the chromium(III) hydroxide precipitate was filtered using a 0.45-µm PES (polyethersulfone)
2.4
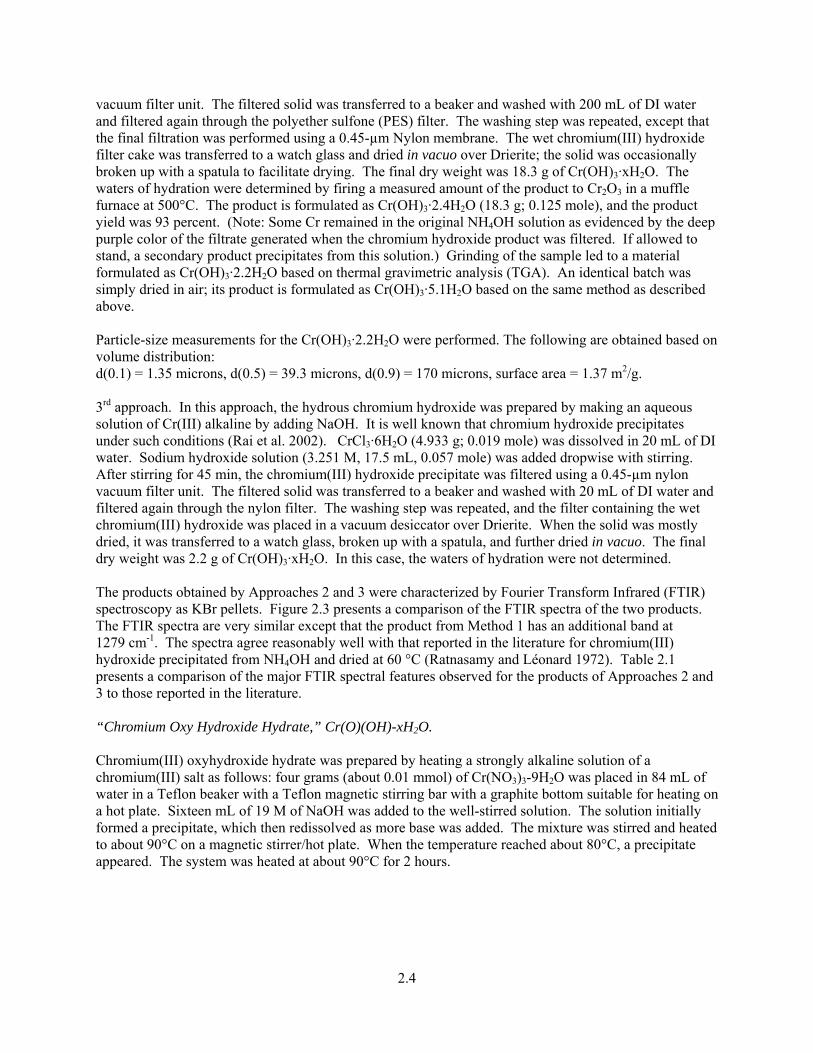
vacuum filter unit. The filtered solid was transferred to a beaker and washed with 200 mL of DI water and filtered again through the polyether sulfone (PES) filter. The washing step was repeated, except that the final filtration was performed using a 0.45-µm Nylon membrane. The wet chromium(III) hydroxide filter cake was transferred to a watch glass and dried in vacuo over Drierite; the solid was occasionally broken up with a spatula to facilitate drying. The final dry weight was 18.3 g of Cr(OH)3·xH2O. The waters of hydration were determined by firing a measured amount of the product to Cr2O3 in a muffle furnace at 500°C. The product is formulated as Cr(OH)3·2.4H2O (18.3 g; 0.125 mole), and the product yield was 93 percent. (Note: Some Cr remained in the original NH4OH solution as evidenced by the deep purple color of the filtrate generated when the chromium hydroxide product was filtered. If allowed to stand, a secondary product precipitates from this solution.) Grinding of the sample led to a material formulated as Cr(OH)3·2.2H2O based on thermal gravimetric analysis (TGA). An identical batch was simply dried in air; its product is formulated as Cr(OH)3·5.1H2O based on the same method as described above. Particle-size measurements for the Cr(OH)3·2.2H2O were performed. The following are obtained based on volume distribution: d(0.1) = 1.35 microns, d(0.5) = 39.3 microns, d(0.9) = 170 microns, surface area = 1.37 m2/g. 3rd approach. In this approach, the hydrous chromium hydroxide was prepared by making an aqueous solution of Cr(III) alkaline by adding NaOH. It is well known that chromium hydroxide precipitates under such conditions (Rai et al. 2002). CrCl3·6H2O (4.933 g; 0.019 mole) was dissolved in 20 mL of DI water. Sodium hydroxide solution (3.251 M, 17.5 mL, 0.057 mole) was added dropwise with stirring. After stirring for 45 min, the chromium(III) hydroxide precipitate was filtered using a 0.45-µm nylon vacuum filter unit. The filtered solid was transferred to a beaker and washed with 20 mL of DI water and filtered again through the nylon filter. The washing step was repeated, and the filter containing the wet chromium(III) hydroxide was placed in a vacuum desiccator over Drierite. When the solid was mostly dried, it was transferred to a watch glass, broken up with a spatula, and further dried in vacuo. The final dry weight was 2.2 g of Cr(OH)3·xH2O. In this case, the waters of hydration were not determined. The products obtained by Approaches 2 and 3 were characterized by Fourier Transform Infrared (FTIR) spectroscopy as KBr pellets. Figure 2.3 presents a comparison of the FTIR spectra of the two products. The FTIR spectra are very similar except that the product from Method 1 has an additional band at 1279 cm-1. The spectra agree reasonably well with that reported in the literature for chromium(III) hydroxide precipitated from NH4OH and dried at 60 °C (Ratnasamy and Léonard 1972). Table 2.1 presents a comparison of the major FTIR spectral features observed for the products of Approaches 2 and 3 to those reported in the literature. “Chromium Oxy Hydroxide Hydrate,” Cr(O)(OH)-xH2O. Chromium(III) oxyhydroxide hydrate was prepared by heating a strongly alkaline solution of a chromium(III) salt as follows: four grams (about 0.01 mmol) of Cr(NO3)3-9H2O was placed in 84 mL of water in a Teflon beaker with a Teflon magnetic stirring bar with a graphite bottom suitable for heating on a hot plate. Sixteen mL of 19 M of NaOH was added to the well-stirred solution. The solution initially formed a precipitate, which then redissolved as more base was added. The mixture was stirred and heated to about 90°C on a magnetic stirrer/hot plate. When the temperature reached about 80°C, a precipitate appeared. The system was heated at about 90°C for 2 hours.
2.5
Table 2.1. FTIR Data for Chromium(III) Hydroxide
Band Position, cm-1 Approach 2 Approach 3 Literature(a) Band Assignment(a)
513 518 495–530 844 842 845
Cr-O-Cr vibrations arising from groups of the type CrO4
x- (x = 2, 3, or 4), which form from surface oxidation.
1279 Not Observed Not Reported Possibly absorbed NH3. 1399 1384 1385 1481 1480 1488
Absorbed CO2
1626 1629 1625 H2O bend 3416 3416 3420 ν(OH)
(a) Literature values taken from Ratnasamy and Léonard (1972); band assignments were also taken from the same source.
Wavenumber, cm-1
5001000150020002500300035004000
Abs
orba
nce
0.0
0.2
0.4
0.6
0.8
1.0
1.2
1.4
1.6
Cr(OH)2.FTIR.JNB
(a)
(b)
Figure 2.3. FTIR Spectra of Chromium(III) Hydroxide from a) Approach 2 and b) Approach 3
The system was allowed to cool overnight and centrifuged. The supernatant was removed by decantation. The residual solids were well mixed with 100 to 200 mL of DI water and the centrifuge/decant cycle repeated for a total of four contacts with DI water. The residual solids then were dried under vacuum at ca. 80°C over the weekend to yield about 1.04 grams of green solid (1.03 g expected for the monohydrate).
2.6
The green solid was then ground initially with a mortar and pestle followed by up to 30 minutes in a ball mill “jitterbug” apparatus. XRD measurement of the isolated solids indicated that these solids were completely amorphous. IR(KBr pellet) cm-1: 3200 (s, vbr), 2004 (br), 1680, 1480, 1370. This reaction was repeated several times with [Cr] initially ranging from 0.1 to 0.25 M at various total reaction volumes. The number of waters (typically 1.0), but with a higher number found for the largest scale preparation, was determined by thermal gravimetric analysis in air to 600°C assuming the following conversion: 2Cr(O)(OH)-xH2O goes to Cr2O3 + (1+2x)H2O. Chromium(III) Oxide, Cr2O3. Chromium(III) oxide was obtained from commercial sources (Baker and Adamson, lot # X303). XRD analysis showed an excellent match for crystalline Eskolaite (Cr2O3). The particle size of the solid was measured in DI water and the following volume percent information obtained: d(0.1) = 1.06 microns, d(0.5) = 2.43 microns, d(0.9) = 6.13 microns, surface area = 3.55 m2/mL.
2.2.1 Preparation of Cr-Containing Simulants Table 2.2 provides information regarding the commercially procured chemicals used in preparing the non-radioactive and radioactive chromium leaching simulants. A copy of a letter request to explain the choice of these simulant components to constitute the non-radioactive components (excluding the leachable form of Cr) of a Cr-containing simulant is provided as Appendix C.
Table 2.2. Commercially Procured Phases Used in the Simulant
Chemical Phase Chemical Formula Manufacturer Lot. No. Hematite Fe2O3 Strem B8702094 Magnetite Fe3O4 Strem B7399086 Goethite FeO(OH) Alfa Aesar® G06R015 Zinc Hydroxide Zn(OH)2 Wintersun Chemical 051201 Nickel Hydroxide Ni(OH)2 Alfa Aesar® C24R009 Iron Chromite FeCr2O4 Ceramic Supply (a)
Nickel Chromite NiCr2O4 Alfa Aesar® L04M58 (a) No lot number or certificate of analysis was provided with the iron chromite material. XRD
analysis of this material indicated the presence of a spinel phase and hematite. The diffraction pattern for the spinel phase matched that of nickel chromite rather than iron chromite. So the exact nature of this material is somewhat uncertain.
In addition to the phases listed in Table 2.1, ferric hydroxide, chromium(III) oxy/hydroxide, UO2, and β-U3O8 were used to prepare the radioactive chromium leaching simulant. The latter compounds were prepared at PNNL as described below. Preparation of Ferric Hydroxide FeCl3·6H2O (35.388 g; 0.131 mole) was dissolved in 75 mL of DI water. The resulting solution was filtered through a 0.45-µm Nylon membrane, and then it was slowly added (over a period of ~10 min) to
2.7
150 mL of 4.9 M NH4OH (prepared by mixing 50 mL of concentrated NH4OH solution with 100 mL DI water) with stirring. After stirring for 0.5 h, the slurry containing the precipitated ferric hydroxide was split between two centrifuge bottles and centrifuged for 10 min at ~1200 G. The liquid was decanted from the centrifuge bottles, and 100 mL of deionized water was added to each bottle. The ferric hydroxide was washed by shaking vigorously in DI water. The mixtures were centrifuged and decanted as described above. The washing process was repeated three times (total of four washes).
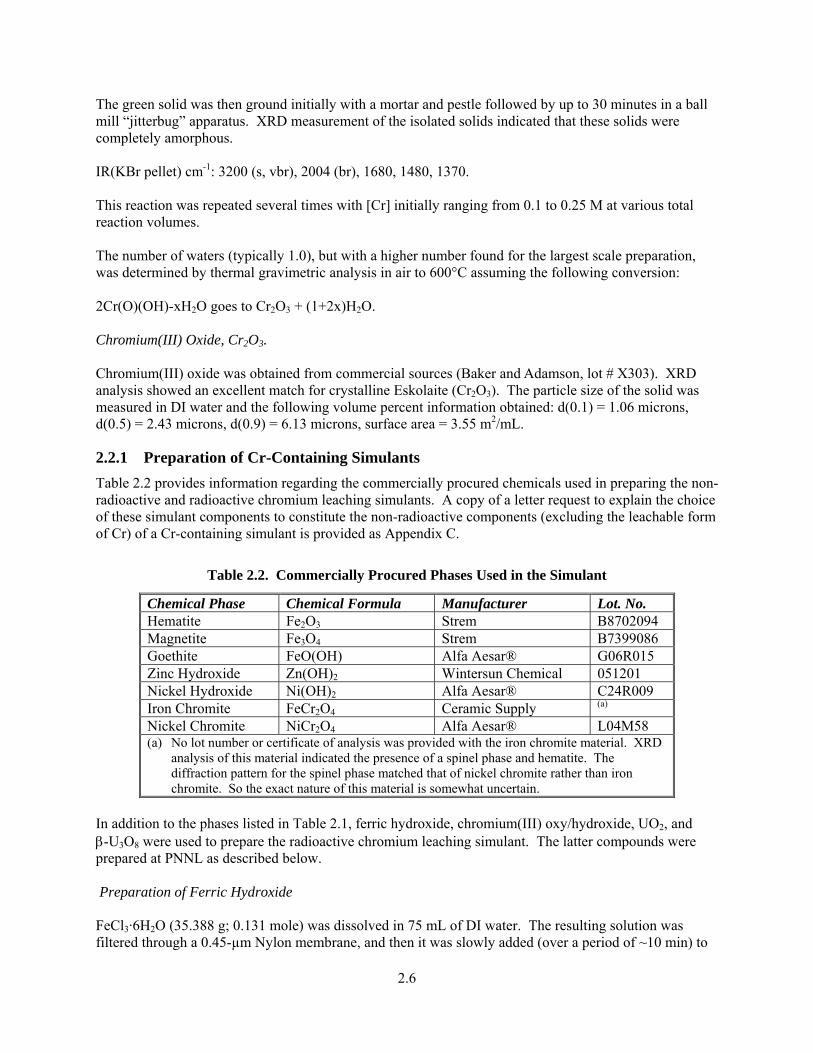
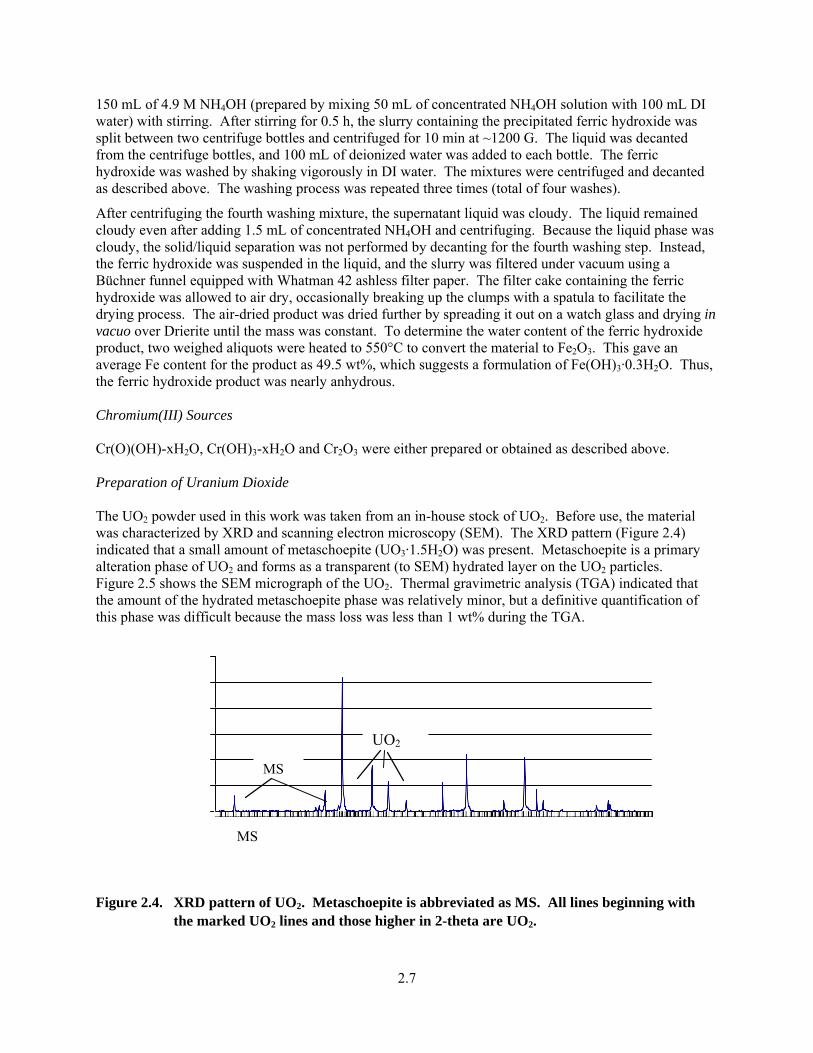
After centrifuging the fourth washing mixture, the supernatant liquid was cloudy. The liquid remained cloudy even after adding 1.5 mL of concentrated NH4OH and centrifuging. Because the liquid phase was cloudy, the solid/liquid separation was not performed by decanting for the fourth washing step. Instead, the ferric hydroxide was suspended in the liquid, and the slurry was filtered under vacuum using a Büchner funnel equipped with Whatman 42 ashless filter paper. The filter cake containing the ferric hydroxide was allowed to air dry, occasionally breaking up the clumps with a spatula to facilitate the drying process. The air-dried product was dried further by spreading it out on a watch glass and drying in vacuo over Drierite until the mass was constant. To determine the water content of the ferric hydroxide product, two weighed aliquots were heated to 550°C to convert the material to Fe2O3. This gave an average Fe content for the product as 49.5 wt%, which suggests a formulation of Fe(OH)3·0.3H2O. Thus, the ferric hydroxide product was nearly anhydrous. Chromium(III) Sources Cr(O)(OH)-xH2O, Cr(OH)3-xH2O and Cr2O3 were either prepared or obtained as described above. Preparation of Uranium Dioxide The UO2 powder used in this work was taken from an in-house stock of UO2. Before use, the material was characterized by XRD and scanning electron microscopy (SEM). The XRD pattern (Figure 2.4) indicated that a small amount of metaschoepite (UO3·1.5H2O) was present. Metaschoepite is a primary alteration phase of UO2 and forms as a transparent (to SEM) hydrated layer on the UO2 particles. Figure 2.5 shows the SEM micrograph of the UO2. Thermal gravimetric analysis (TGA) indicated that the amount of the hydrated metaschoepite phase was relatively minor, but a definitive quantification of this phase was difficult because the mass loss was less than 1 wt% during the TGA.
MS
UO2
Figure 2.4. XRD pattern of UO2. Metaschoepite is abbreviated as MS. All lines beginning with
the marked UO2 lines and those higher in 2-theta are UO2.
MS
2.8
Figure 2.5. Scanning Electron Micrograph of a UO2 Particle
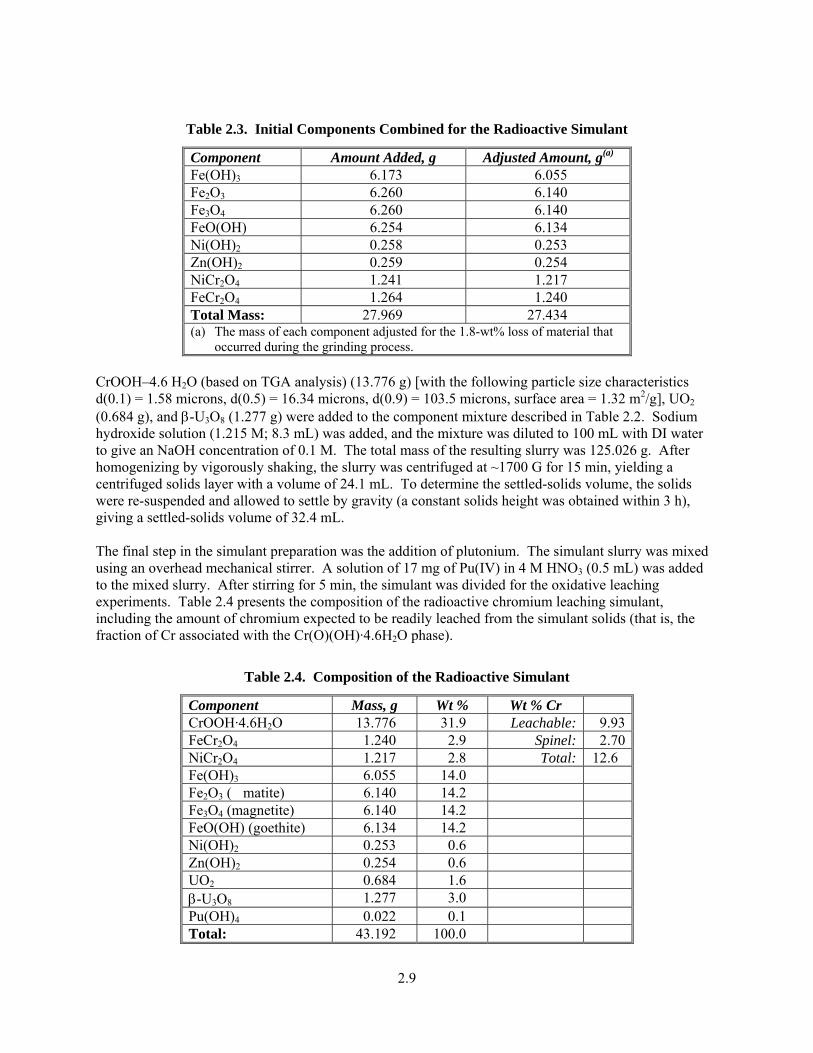
Preparation of β-U3O8 The β-U3O8 was prepared by stepwise heating of (NH4)2UO2(CO3)3 up to 1350°C, based on a method reported in the literature (Hoekstra et al. 1955). Heating of the (NH4)2UO2(CO3)3 at 350°C for 4 h results in the conversion to red-orange UO3. A portion of this material was dissolved in 2-wt% HNO3 and analyzed by ICP-OES. The analysis indicated a fairly pure product with small impurities of Cr, Mn, Pb, and Ti. The UO3 was heated overnight at 900°C to yield α-U3O8. Finally, the α-U3O8 was converted to β-U3O8 by heating at 1350°C for 4 h in an alumina crucible and then slowly cooling to room temperature over a 3-day period. The resulting product was a shiny black brittle solid, which was ground with a mortar and pestle before use. XRD analysis indicated only 30 percent conversion to the β-U3O8 form, but this was surprising based on the drastically different appearance and physical properties compared to α-U3O8. No attempt was made to resolve this discrepancy. Preparation of the Radioactive Chromium Leaching Simulant The initial components of the simulant were combined in the amounts listed in Table 2.3. This mixture of components was ground in a jitterbug ball mill. To do this, the mixture was divided into several ~5-g portions that were individually ground for 40 minutes each. The individually ground portions were recombined. The mass of the recombined material was 27.434 g (i.e., 0.516 g lost during the grinding process). Table 2.3 also presents the amount of each component used in the simulant adjusted for the mass lost during grinding.
2.9
Table 2.3. Initial Components Combined for the Radioactive Simulant
Component Amount Added, g Adjusted Amount, g(a)
Fe(OH)3 6.173 6.055 Fe2O3 6.260 6.140 Fe3O4 6.260 6.140 FeO(OH) 6.254 6.134 Ni(OH)2 0.258 0.253 Zn(OH)2 0.259 0.254 NiCr2O4 1.241 1.217 FeCr2O4 1.264 1.240 Total Mass: 27.969 27.434 (a) The mass of each component adjusted for the 1.8-wt% loss of material that
occurred during the grinding process. CrOOH–4.6 H2O (based on TGA analysis) (13.776 g) [with the following particle size characteristics d(0.1) = 1.58 microns, d(0.5) = 16.34 microns, d(0.9) = 103.5 microns, surface area = 1.32 m2/g], UO2 (0.684 g), and β-U3O8 (1.277 g) were added to the component mixture described in Table 2.2. Sodium hydroxide solution (1.215 M; 8.3 mL) was added, and the mixture was diluted to 100 mL with DI water to give an NaOH concentration of 0.1 M. The total mass of the resulting slurry was 125.026 g. After homogenizing by vigorously shaking, the slurry was centrifuged at ~1700 G for 15 min, yielding a centrifuged solids layer with a volume of 24.1 mL. To determine the settled-solids volume, the solids were re-suspended and allowed to settle by gravity (a constant solids height was obtained within 3 h), giving a settled-solids volume of 32.4 mL. The final step in the simulant preparation was the addition of plutonium. The simulant slurry was mixed using an overhead mechanical stirrer. A solution of 17 mg of Pu(IV) in 4 M HNO3 (0.5 mL) was added to the mixed slurry. After stirring for 5 min, the simulant was divided for the oxidative leaching experiments. Table 2.4 presents the composition of the radioactive chromium leaching simulant, including the amount of chromium expected to be readily leached from the simulant solids (that is, the fraction of Cr associated with the Cr(O)(OH)·4.6H2O phase).
Table 2.4. Composition of the Radioactive Simulant
Component Mass, g Wt % Wt % Cr CrOOH·4.6H2O 13.776 31.9 Leachable: 9.93 FeCr2O4 1.240 2.9 Spinel: 2.70 NiCr2O4 1.217 2.8 Total: 12.6 Fe(OH)3 6.055 14.0 Fe2O3 (�matite) 6.140 14.2 Fe3O4 (magnetite) 6.140 14.2 FeO(OH) (goethite) 6.134 14.2 Ni(OH)2 0.253 0.6 Zn(OH)2 0.254 0.6 UO2 0.684 1.6 β-U3O8 1.277 3.0 Pu(OH)4 0.022 0.1 Total: 43.192 100.0
2.10
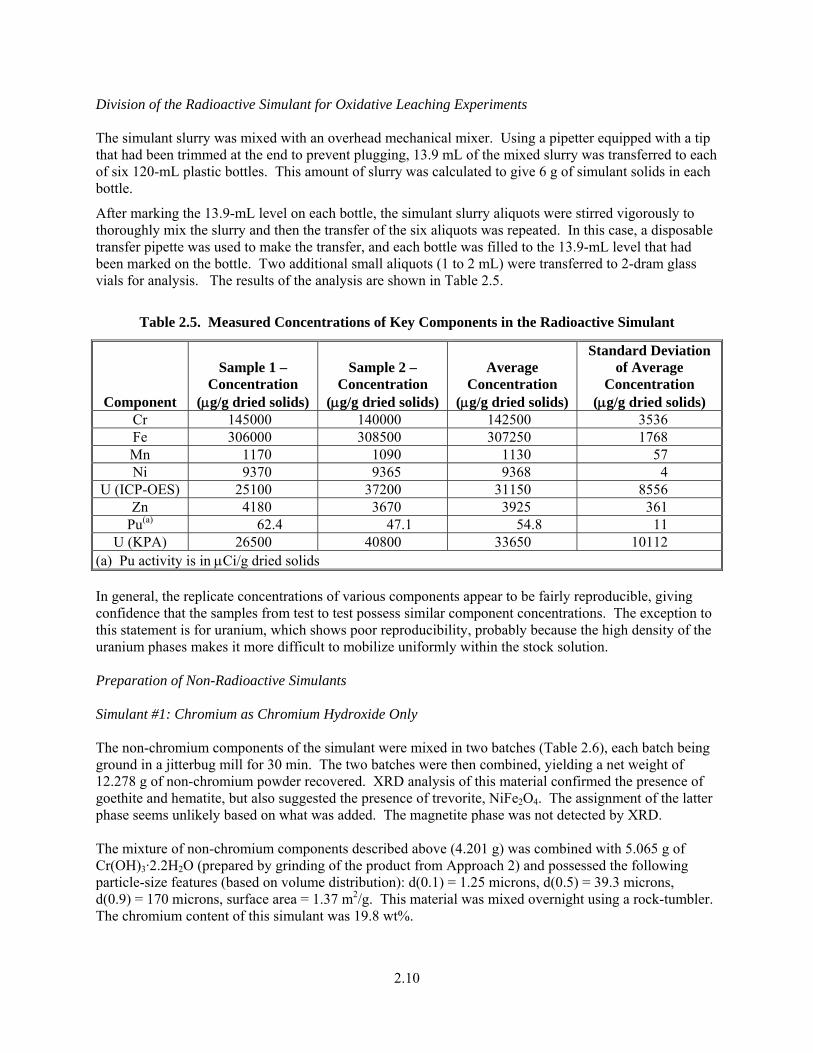
Division of the Radioactive Simulant for Oxidative Leaching Experiments The simulant slurry was mixed with an overhead mechanical mixer. Using a pipetter equipped with a tip that had been trimmed at the end to prevent plugging, 13.9 mL of the mixed slurry was transferred to each of six 120-mL plastic bottles. This amount of slurry was calculated to give 6 g of simulant solids in each bottle.
After marking the 13.9-mL level on each bottle, the simulant slurry aliquots were stirred vigorously to thoroughly mix the slurry and then the transfer of the six aliquots was repeated. In this case, a disposable transfer pipette was used to make the transfer, and each bottle was filled to the 13.9-mL level that had been marked on the bottle. Two additional small aliquots (1 to 2 mL) were transferred to 2-dram glass vials for analysis. The results of the analysis are shown in Table 2.5.
Table 2.5. Measured Concentrations of Key Components in the Radioactive Simulant
Component
Sample 1 – Concentration
(μg/g dried solids)
Sample 2 – Concentration
(μg/g dried solids)
Average Concentration
(μg/g dried solids)
Standard Deviation of Average
Concentration (μg/g dried solids)
Cr 145000 140000 142500 3536 Fe 306000 308500 307250 1768 Mn 1170 1090 1130 57 Ni 9370 9365 9368 4
U (ICP-OES) 25100 37200 31150 8556 Zn 4180 3670 3925 361
Pu(a) 62.4 47.1 54.8 11 U (KPA) 26500 40800 33650 10112
(a) Pu activity is in μCi/g dried solids In general, the replicate concentrations of various components appear to be fairly reproducible, giving confidence that the samples from test to test possess similar component concentrations. The exception to this statement is for uranium, which shows poor reproducibility, probably because the high density of the uranium phases makes it more difficult to mobilize uniformly within the stock solution. Preparation of Non-Radioactive Simulants Simulant #1: Chromium as Chromium Hydroxide Only The non-chromium components of the simulant were mixed in two batches (Table 2.6), each batch being ground in a jitterbug mill for 30 min. The two batches were then combined, yielding a net weight of 12.278 g of non-chromium powder recovered. XRD analysis of this material confirmed the presence of goethite and hematite, but also suggested the presence of trevorite, NiFe2O4. The assignment of the latter phase seems unlikely based on what was added. The magnetite phase was not detected by XRD. The mixture of non-chromium components described above (4.201 g) was combined with 5.065 g of Cr(OH)3·2.2H2O (prepared by grinding of the product from Approach 2) and possessed the following particle-size features (based on volume distribution): d(0.1) = 1.25 microns, d(0.5) = 39.3 microns, d(0.9) = 170 microns, surface area = 1.37 m2/g. This material was mixed overnight using a rock-tumbler. The chromium content of this simulant was 19.8 wt%.
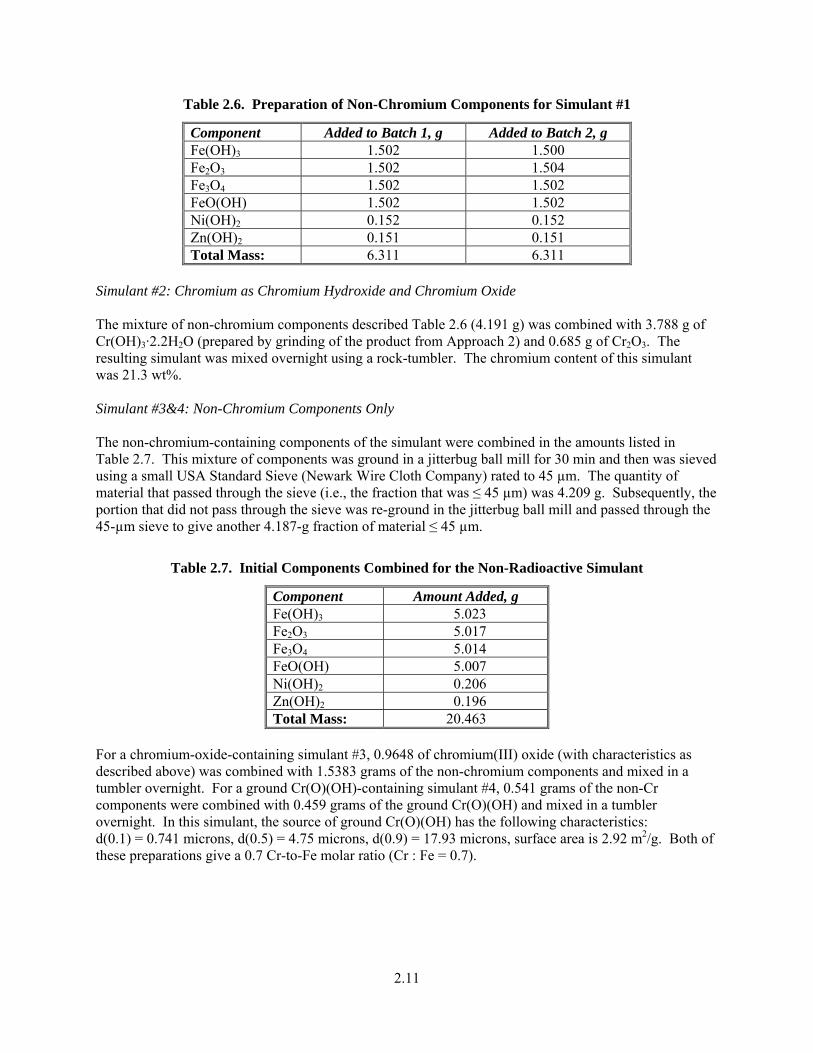
2.11
Table 2.6. Preparation of Non-Chromium Components for Simulant #1
Component Added to Batch 1, g Added to Batch 2, g Fe(OH)3 1.502 1.500 Fe2O3 1.502 1.504 Fe3O4 1.502 1.502 FeO(OH) 1.502 1.502 Ni(OH)2 0.152 0.152 Zn(OH)2 0.151 0.151 Total Mass: 6.311 6.311
Simulant #2: Chromium as Chromium Hydroxide and Chromium Oxide The mixture of non-chromium components described Table 2.6 (4.191 g) was combined with 3.788 g of Cr(OH)3·2.2H2O (prepared by grinding of the product from Approach 2) and 0.685 g of Cr2O3. The resulting simulant was mixed overnight using a rock-tumbler. The chromium content of this simulant was 21.3 wt%. Simulant #3&4: Non-Chromium Components Only
The non-chromium-containing components of the simulant were combined in the amounts listed in Table 2.7. This mixture of components was ground in a jitterbug ball mill for 30 min and then was sieved using a small USA Standard Sieve (Newark Wire Cloth Company) rated to 45 µm. The quantity of material that passed through the sieve (i.e., the fraction that was ≤ 45 µm) was 4.209 g. Subsequently, the portion that did not pass through the sieve was re-ground in the jitterbug ball mill and passed through the 45-µm sieve to give another 4.187-g fraction of material ≤ 45 µm.
Table 2.7. Initial Components Combined for the Non-Radioactive Simulant
Component Amount Added, g Fe(OH)3 5.023 Fe2O3 5.017 Fe3O4 5.014 FeO(OH) 5.007 Ni(OH)2 0.206 Zn(OH)2 0.196 Total Mass: 20.463
For a chromium-oxide-containing simulant #3, 0.9648 of chromium(III) oxide (with characteristics as described above) was combined with 1.5383 grams of the non-chromium components and mixed in a tumbler overnight. For a ground Cr(O)(OH)-containing simulant #4, 0.541 grams of the non-Cr components were combined with 0.459 grams of the ground Cr(O)(OH) and mixed in a tumbler overnight. In this simulant, the source of ground Cr(O)(OH) has the following characteristics: d(0.1) = 0.741 microns, d(0.5) = 4.75 microns, d(0.9) = 17.93 microns, surface area is 2.92 m2/g. Both of these preparations give a 0.7 Cr-to-Fe molar ratio (Cr : Fe = 0.7).
2.12
2.3 Preparation of Manganese Solids by Reduction of Permanganate by Cr(III) Solids in Alkaline Solution
Three-quarters of a gram of Cr(O)(OH)-H2O (7.3 mmol Cr) was placed in approximately 40 mL of 0.1 M NaOH at ambient temperature. A total of 8.5 mL of 0.94 M NaMnO4 (8 mmol permanganate) in H2O was added in 0.5-mL portions over the course of 2.5 hours. A purple solution resulted. The suspension was stirred at room temperature for a total of 6 hours after the first addition. The final pH of the suspension was measured as 11.3, and the final Eh as 655 mV. The suspension was then filtered through a 0.45-micron nylon filter assembly and washed five times with 0.1 mL NaOH. Air was passed through the filter assembly until no visible liquid passed through, yielding 0.683 grams of dark-brown solids. This procedure was repeated only with a 3 M NaOH suspension and gave a suspension after 6 hours of permanganate contact time with a pH of 13.1 and an Eh of 487 mV. Washing of the solids with 0.1 M NaOH followed by the solid’s air drying as described above led to the isolation of 0.588 grams of rust-brown solid. The solids generated from both the 0.1 and 3 M hydroxide reactions were submitted to the ASO for Mn and Cr content by ICP-OES analysis. XRD analysis indicated that both solids were amorphous. An XPS analysis was performed and will be described in an accompanying report.
2.4 Wet Chemical Titration of the Mn Oxidation State in Mn-Containing Solids
The following procedure was adapted from the reports of Murray (Murray 1979 and Murray 1984) and references therein. Approximately 10 mg of the solid generated as described in Section 2.3 was placed in 50 mL of DI water and stirred. A total of 0.5 mL of a stock 8 M NaOH/4 M NaI solution (32 g NaOH and 60 grams NaI in 100 mL DI water) was added, followed by 0.5 mL of a 3 M H2SO4 solution. The mixture was stirred until a yellow-orange color developed (after about 10 minutes of stirring). The solution was then titrated with a standard 0.0058 M sodium thiosulfate solution in water until the yellow-orange color almost disappeared, leaving a pale yellow solution. A total of 0.5 mL of a 0.1 percent starch solution was added and the titration continued until the purple color disappeared, which marked the end point of the titration. It should be noted that upon standing in air for 5 to 10 minutes, the purple color in the solution will be regenerated; titrating with thiosulfate until this phenomenon disappears will result in overshooting the endpoint.
2.5 Quality Assurance Quality Assurance and Quality Control The following sections describe the quality assurance (QA) program and quality control (QC) measures applied to the conduct of work. The data represented in this report will refer to PNWD (in support of Bechtel National, Inc. Support Project [BNI-SP] before February 12, 2007) or PNNL (in support of River Protection Project Waste Treatment Plant Support Program [RPP-WTP] following February 12, 2007). Work was performed for both of these projects to the same QA program.
2.13
Application of RPP-WTP Quality Assurance Requirements As of February 2007, the QA program is described as follows: PNNL’s QA program is based on requirements defined in DOE Order 414.1C, Quality Assurance and 10 CFR 830, Energy/Nuclear Safety Management, Subpart A–Quality Assurance Requirements (a.k.a., the Quality Rule). PNNL has chosen to implement the requirements of DOE Order 414.1C and 10 CFR 830, Subpart A by integrating them into the laboratory’s management systems and daily operating processes. The procedures necessary to implement the requirements are documented through PNNL’s Standards-Based Management System. PNNL implemented the RPP-WTP quality requirements by performing work in accordance with the River Protection Project – Waste Treatment Plant Support Program (RPP-WTP) Quality Assurance Plan (RPP-WTP-QA-001, QAP). Work was performed to the quality requirements of NQA-1-1989 Part I, Basic and Supplementary Requirements, NQA-2a-1990, Part 2.7, and DOE/RW-0333P, Rev 13, Quality Assurance Requirements and Descriptions (QARD). These quality requirements are implemented through the River Protection Project – Waste Treatment Plant Support Program (RPP-WTP) Quality Assurance Manual (RPP-WTP-QA-003, QAM). The analytical requirements are implemented through RPP-WTP’s Statement of Work (RPP-WTP-QA-005) with the Radiochemical Processing Laboratory (RPL) Analytical Service Operations (ASO). A matrix that cross-references the NQA-1, NQA-2a, and QARD requirements with PNNL’s procedures for this work is provided in Appendix A. It includes justification for those requirements not implemented. The quality assurance requirements of DOE/RW-0333P, Rev 13, Quality Assurance Requirements and Descriptions (QARD) and DOE Order 414.1C were not identified as a requirement for this work in the test specification. Conduct of Experimental and Analytical Work Experiments that were not method-specific were performed in accordance with PNNL’s procedures QA-RPP-WTP-1101 “Scientific Investigations” and QA-RPP-WTP-1201 “Calibration Control System,” verifying that sufficient data were taken with properly calibrated measuring and test equipment (M&TE) to obtain quality results. The UV-visible spectroscopy was calibrated for both the radioactive and non-radioactive sample systems as described in Section 2.1 by preparing solutions of known chromate concentrations from reagent-grade potassium dichromate in hydroxide solution according to published literature methods. Because the solids used to prepare these standards were not National Institute for Standards and Technology (NIST)-traceable, quantitative conclusions based on visible spectroscopy must be regarded as for “indication-only.” Reported hydroxide analyses were performed by RPL-ASO according to procedure RPG-CMC-228, Rev 1. No QC issues were associated with this data. Solution metals concentrations were determined by ICP-OES according to procedure RPG-CMC-211. One QC failure was noted. For the sample associated with the oxidative leachate for test 9a, the analytical spike was recovered at a value of 126 percent, which is 1 percent beyond the acceptance criterion of 75 percent to 125 percent. This additional 1 percent is not believed to impact the reported results.
2.14
The Mn content for the Mn oxide precipitated by reaction of Cr(O)(OH) – H2O with sodium permanganate (Section 2.3) was dissolved according to PNL-ALO-129 and analyzed by ICP-OES according to RPG-CMC-211. No QC issues were associated with this data. Reported metals content for the solids from oxidative leaching of the radioactive simulant was dissolved according to PNL-ALO-114 and PNL-ALO-115 and analyzed by ICP-OES according to RPG-CMC-211. No QC issues were associated with this data. Radionuclides were obtained for solids and prepared solutions. Solids were prepared according to PNL-ALO-114. Uranium (by KPA) and plutonium were measured according to RPG-CMC-455, Rev 0, RPG-CMC-4014, Rev 1, RPG-CMC-496, Rev 0, and RPG-CMC-422, Rev 1. No QC issues were associated with this data. Additional M&TE that were used included clocks, programmable heater/stirrers, tachometers, thermocouple-meters, and balances. The clocks, tachometers, and programmable heater-stirrers were standard laboratory equipment for use as indicators only. The thermocouple-meter combination was calibrated by the PNNL Instrument Calibration Facility. The thermometers were calibrated January 20, 2006. Balances are calibrated annually by a certified contractor, QC Services, Portland, Oregon. A balance performance check was conducted each day the balance was used. Internal Data Verification and Validation PNNL addressed internal verification and validation activities by conducting an independent technical review of the final data report in accordance with PNNL’s procedure QA-RPP-WTP-604. This review verified that the reported results were traceable, that inferences and conclusions were soundly based, and the reported work satisfied the Test Plan objectives. This review procedure is part of PNNL’s RPP-WTP Quality Assurance Manual.
3.1
3.0 Results and Discussion
3.1 Tested Chromium Compounds Three compounds were prepared for testing: chromium hydroxide hydrate (Cr(OH)3–xH2O), chromium oxide (Cr2O3), and chromium oxyhydroxide hydrate, (Cr(O)(OH) – xH2O). Two different batches of hydrated chromium(III) hydroxide were prepared by adding a Cr3+ solution to aqueous NH4OH at room temperature. Because of the different techniques used to dry these two batches, different hydration numbers were obtained. For the first batch, which was simply air-dried under ambient conditions, the hydrous chromium(III) hydroxide contained approximately 5.1 waters of hydration. On the other hand, the second batch was dried under more rigorous conditions (in a vacuum oven at ~50°C over Drierite), which resulted in a material with fewer waters of hydration. After the material in the second batch had been ground in a jitterbug mill for 30 min, the number of water molecules per Cr atom was found to be 2.2. The infrared spectra for these chromium(III) hydroxide solids agree well with reported literature values (Table 2.1 and Figure 2.3). XRD analysis indicates that the Cr(OH)3·2.2H2O was amorphous. Chromium(III) oxide was obtained from commercial suppliers, and XRD analysis confirmed this material to be crystalline Eskolaite (Cr2O3). Particle-size analysis of the commercial Cr2O3 product indicated that it consisted of relatively fine particles. According to the particle volume distribution, 90 percent of the Cr2O3 particles were less than 6.15 µm in diameter. Chromium(III) oxyhydroxide hydrate was prepared by heating a soluble, alkaline Cr(III) solution to near boiling, which results in the product precipitation. TGA studies provided the hydration number for the above empirical formula. However, previous microscopic studies report a O:Cr ratio of two, which results in a tentative identification as Cr(O)(OH) (Lumetta et al. 1997), or for these materials, Cr(O)(OH)–xH2O. Pourbaix (Pourbaix 1966) reports the speciation diagrams for three oxo chromium(III) solids: hydrated Cr(III) hydroxide, anhydrous chromium(III) hydroxide, and chromium(III) oxide. Their chemical potentials are given as follows: Cr(OH)3-xH2O = -240.9 kcal; Cr2O3 = -250.2 kcal; and Cr(OH)3 = -260.5 kcal. This would indicate that the extent of oxidative dissolution might be Cr(OH)3-xH2O ∼ Cr2O3 > Cr(OH)3. However, these potentials likely refer to crystalline compounds, and, as noted above, only Cr2O3 is present as a crystalline phase in the chromium materials used in this report.
3.2 Characterization of the Manganese Solids Generated During Oxidative Alkaline Leaching of Cr(OH)3
A sample of anhydrous chromium(III) oxide was reacted with 1.05 equivalents of permanganate at an initial free hydroxide concentration of either 0.1 or 3 M. The permanganate was added at room temperature in portions, each portion containing about 6 percent of the total added Mn, over the course of 2.5 hours and then stirred until a total contact time of about 6 hours had been reached. The final Eh of the solution was 655 mV for the 0.1 M NaOH contact and 487 mV for the 3 M NaOH contact. Elemental analysis for Mn and Cr was performed by a KOH fusion of the solids followed by analysis by ICP-OES. The results are shown in Table 3.1.
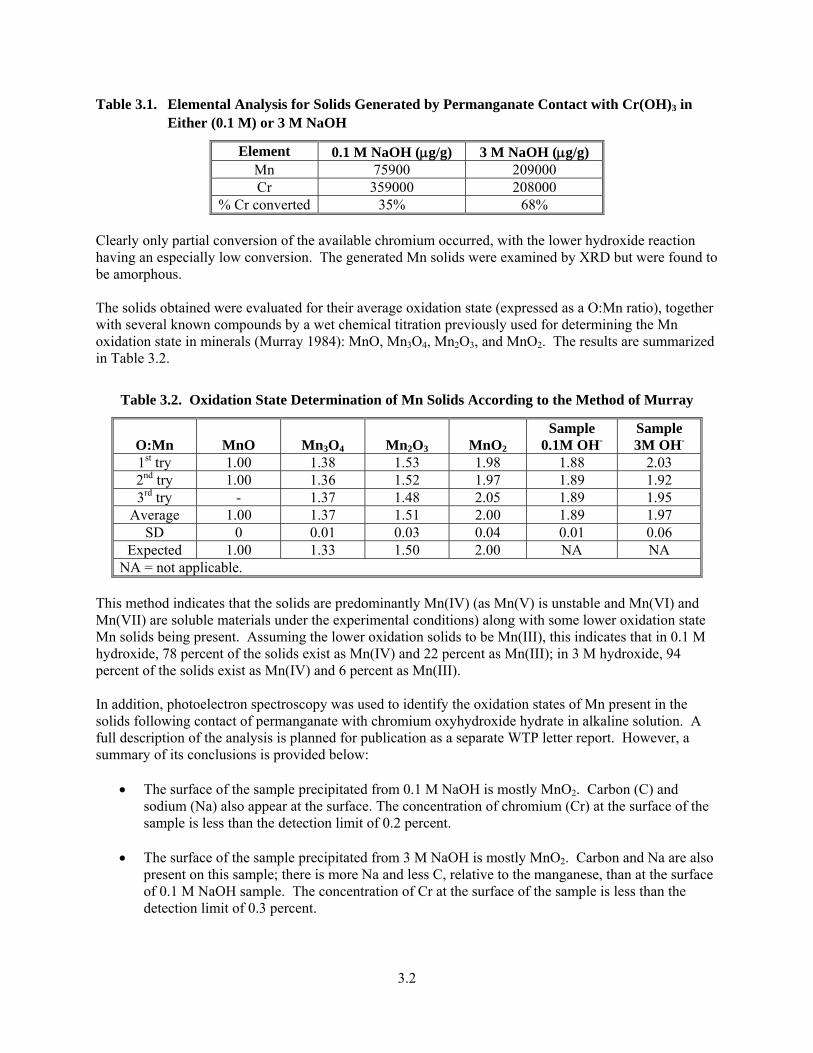
3.2
Table 3.1. Elemental Analysis for Solids Generated by Permanganate Contact with Cr(OH)3 in Either (0.1 M) or 3 M NaOH
Element 0.1 M NaOH (μg/g) 3 M NaOH (μg/g) Mn 75900 209000 Cr 359000 208000
% Cr converted 35% 68% Clearly only partial conversion of the available chromium occurred, with the lower hydroxide reaction having an especially low conversion. The generated Mn solids were examined by XRD but were found to be amorphous. The solids obtained were evaluated for their average oxidation state (expressed as a O:Mn ratio), together with several known compounds by a wet chemical titration previously used for determining the Mn oxidation state in minerals (Murray 1984): MnO, Mn3O4, Mn2O3, and MnO2. The results are summarized in Table 3.2.
Table 3.2. Oxidation State Determination of Mn Solids According to the Method of Murray
O:Mn MnO Mn3O4 Mn2O3 MnO2 Sample
0.1M OH- Sample 3M OH-
1st try 1.00 1.38 1.53 1.98 1.88 2.03 2nd try 1.00 1.36 1.52 1.97 1.89 1.92 3rd try - 1.37 1.48 2.05 1.89 1.95
Average 1.00 1.37 1.51 2.00 1.89 1.97 SD 0 0.01 0.03 0.04 0.01 0.06
Expected 1.00 1.33 1.50 2.00 NA NA NA = not applicable.
This method indicates that the solids are predominantly Mn(IV) (as Mn(V) is unstable and Mn(VI) and Mn(VII) are soluble materials under the experimental conditions) along with some lower oxidation state Mn solids being present. Assuming the lower oxidation solids to be Mn(III), this indicates that in 0.1 M hydroxide, 78 percent of the solids exist as Mn(IV) and 22 percent as Mn(III); in 3 M hydroxide, 94 percent of the solids exist as Mn(IV) and 6 percent as Mn(III). In addition, photoelectron spectroscopy was used to identify the oxidation states of Mn present in the solids following contact of permanganate with chromium oxyhydroxide hydrate in alkaline solution. A full description of the analysis is planned for publication as a separate WTP letter report. However, a summary of its conclusions is provided below:
• The surface of the sample precipitated from 0.1 M NaOH is mostly MnO2. Carbon (C) and sodium (Na) also appear at the surface. The concentration of chromium (Cr) at the surface of the sample is less than the detection limit of 0.2 percent.
• The surface of the sample precipitated from 3 M NaOH is mostly MnO2. Carbon and Na are also
present on this sample; there is more Na and less C, relative to the manganese, than at the surface of 0.1 M NaOH sample. The concentration of Cr at the surface of the sample is less than the detection limit of 0.3 percent.
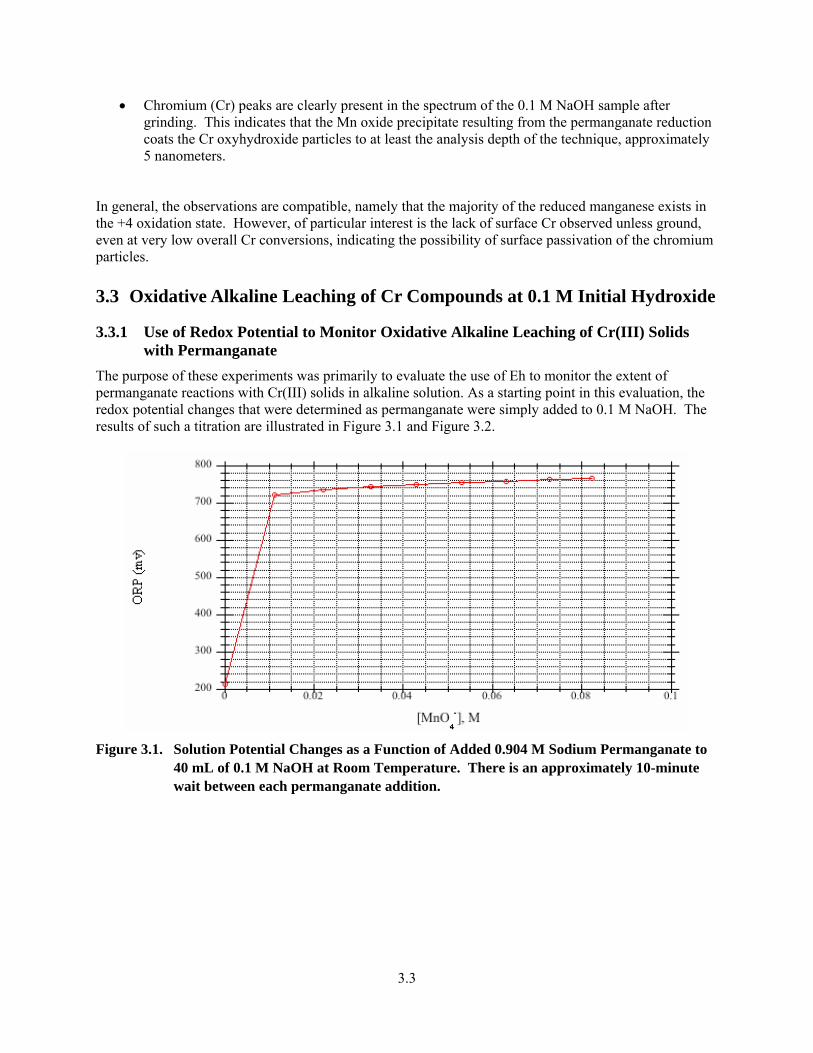
3.3
• Chromium (Cr) peaks are clearly present in the spectrum of the 0.1 M NaOH sample after grinding. This indicates that the Mn oxide precipitate resulting from the permanganate reduction coats the Cr oxyhydroxide particles to at least the analysis depth of the technique, approximately 5 nanometers.
In general, the observations are compatible, namely that the majority of the reduced manganese exists in the +4 oxidation state. However, of particular interest is the lack of surface Cr observed unless ground, even at very low overall Cr conversions, indicating the possibility of surface passivation of the chromium particles.
3.3 Oxidative Alkaline Leaching of Cr Compounds at 0.1 M Initial Hydroxide
3.3.1 Use of Redox Potential to Monitor Oxidative Alkaline Leaching of Cr(III) Solids with Permanganate
The purpose of these experiments was primarily to evaluate the use of Eh to monitor the extent of permanganate reactions with Cr(III) solids in alkaline solution. As a starting point in this evaluation, the redox potential changes that were determined as permanganate were simply added to 0.1 M NaOH. The results of such a titration are illustrated in Figure 3.1 and Figure 3.2.
Figure 3.1. Solution Potential Changes as a Function of Added 0.904 M Sodium Permanganate to
40 mL of 0.1 M NaOH at Room Temperature. There is an approximately 10-minute wait between each permanganate addition.
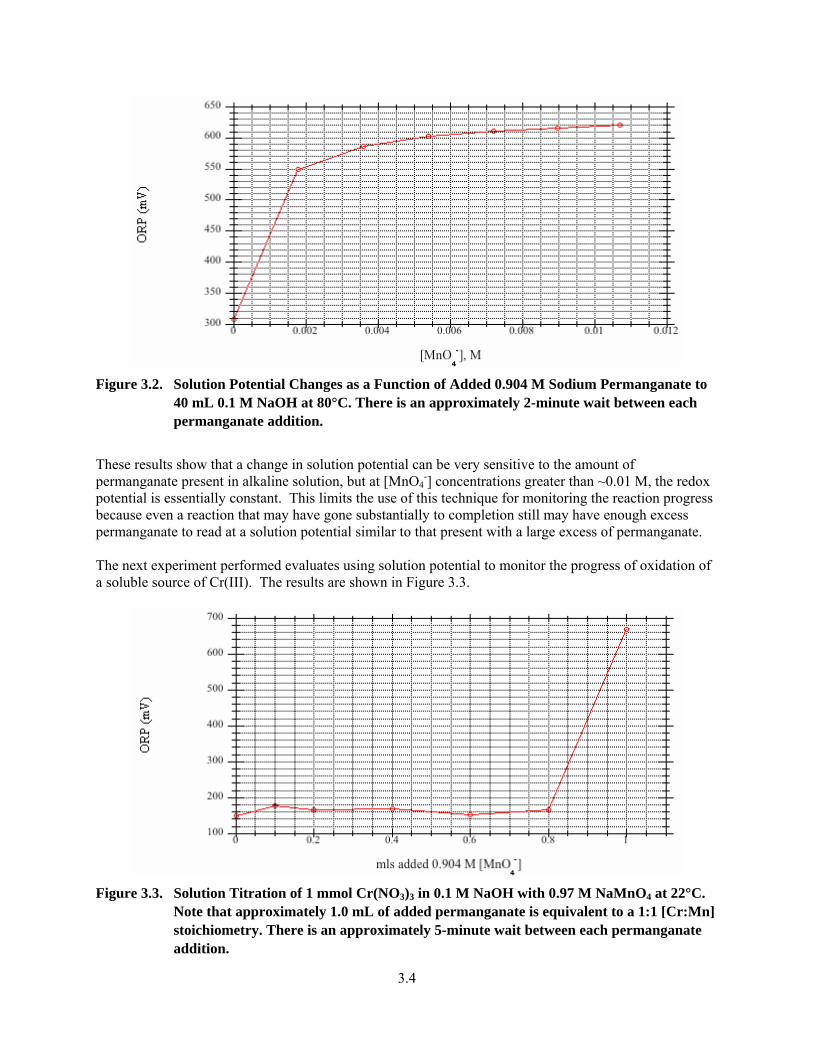
3.4
Figure 3.2. Solution Potential Changes as a Function of Added 0.904 M Sodium Permanganate to
40 mL 0.1 M NaOH at 80°C. There is an approximately 2-minute wait between each permanganate addition.
These results show that a change in solution potential can be very sensitive to the amount of permanganate present in alkaline solution, but at [MnO4
-] concentrations greater than ~0.01 M, the redox potential is essentially constant. This limits the use of this technique for monitoring the reaction progress because even a reaction that may have gone substantially to completion still may have enough excess permanganate to read at a solution potential similar to that present with a large excess of permanganate. The next experiment performed evaluates using solution potential to monitor the progress of oxidation of a soluble source of Cr(III). The results are shown in Figure 3.3.
Figure 3.3. Solution Titration of 1 mmol Cr(NO3)3 in 0.1 M NaOH with 0.97 M NaMnO4 at 22°C.
Note that approximately 1.0 mL of added permanganate is equivalent to a 1:1 [Cr:Mn] stoichiometry. There is an approximately 5-minute wait between each permanganate addition.
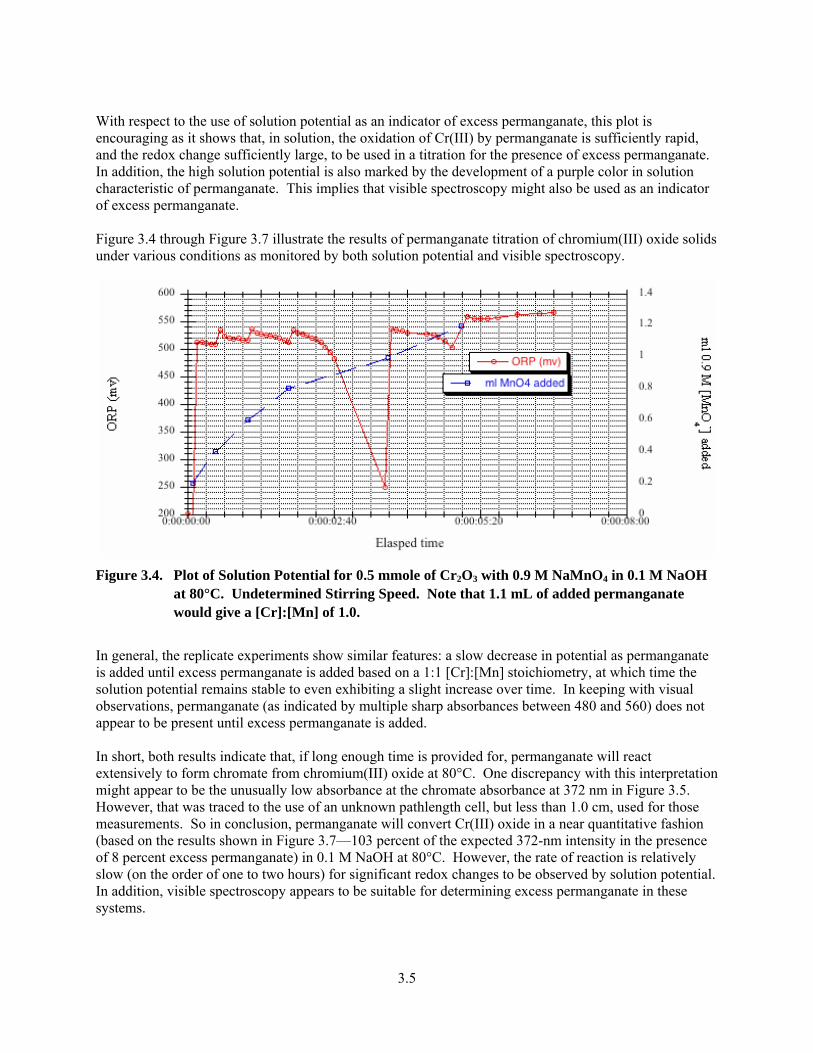
3.5
With respect to the use of solution potential as an indicator of excess permanganate, this plot is encouraging as it shows that, in solution, the oxidation of Cr(III) by permanganate is sufficiently rapid, and the redox change sufficiently large, to be used in a titration for the presence of excess permanganate. In addition, the high solution potential is also marked by the development of a purple color in solution characteristic of permanganate. This implies that visible spectroscopy might also be used as an indicator of excess permanganate. Figure 3.4 through Figure 3.7 illustrate the results of permanganate titration of chromium(III) oxide solids under various conditions as monitored by both solution potential and visible spectroscopy.
Figure 3.4. Plot of Solution Potential for 0.5 mmole of Cr2O3 with 0.9 M NaMnO4 in 0.1 M NaOH
at 80°C. Undetermined Stirring Speed. Note that 1.1 mL of added permanganate would give a [Cr]:[Mn] of 1.0.
In general, the replicate experiments show similar features: a slow decrease in potential as permanganate is added until excess permanganate is added based on a 1:1 [Cr]:[Mn] stoichiometry, at which time the solution potential remains stable to even exhibiting a slight increase over time. In keeping with visual observations, permanganate (as indicated by multiple sharp absorbances between 480 and 560) does not appear to be present until excess permanganate is added. In short, both results indicate that, if long enough time is provided for, permanganate will react extensively to form chromate from chromium(III) oxide at 80°C. One discrepancy with this interpretation might appear to be the unusually low absorbance at the chromate absorbance at 372 nm in Figure 3.5. However, that was traced to the use of an unknown pathlength cell, but less than 1.0 cm, used for those measurements. So in conclusion, permanganate will convert Cr(III) oxide in a near quantitative fashion (based on the results shown in Figure 3.7—103 percent of the expected 372-nm intensity in the presence of 8 percent excess permanganate) in 0.1 M NaOH at 80°C. However, the rate of reaction is relatively slow (on the order of one to two hours) for significant redox changes to be observed by solution potential. In addition, visible spectroscopy appears to be suitable for determining excess permanganate in these systems.
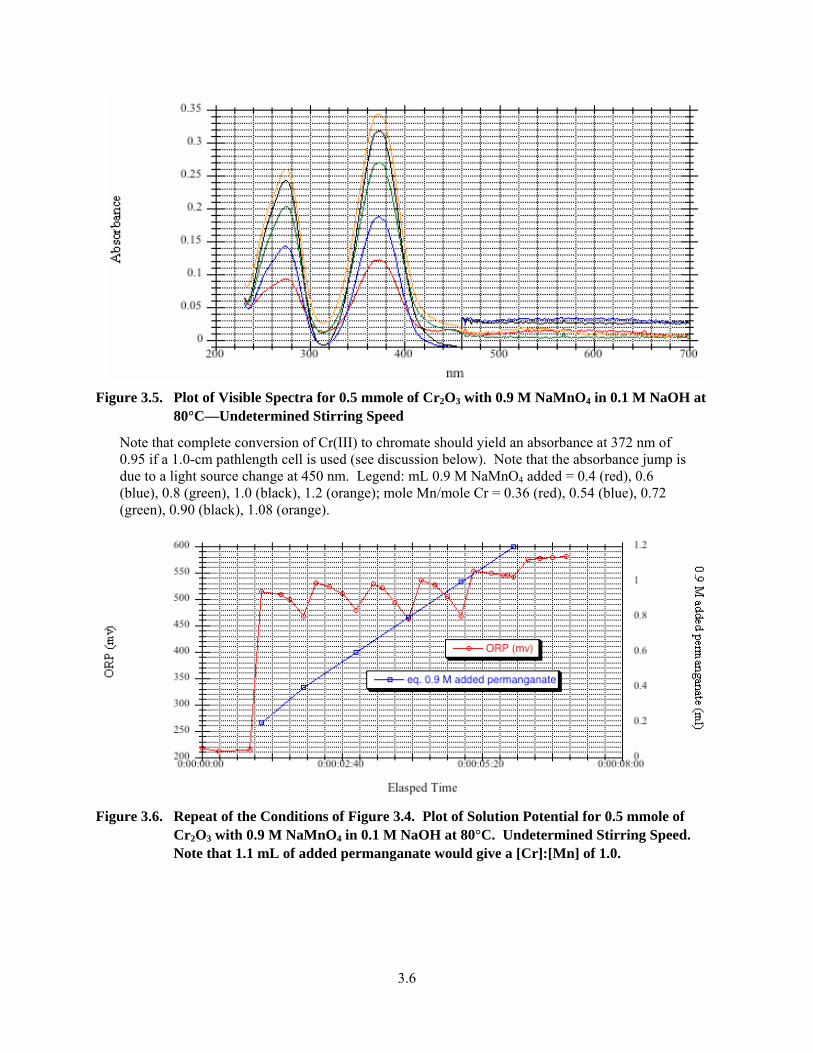
3.6
Figure 3.5. Plot of Visible Spectra for 0.5 mmole of Cr2O3 with 0.9 M NaMnO4 in 0.1 M NaOH at
80°C—Undetermined Stirring Speed
Note that complete conversion of Cr(III) to chromate should yield an absorbance at 372 nm of 0.95 if a 1.0-cm pathlength cell is used (see discussion below). Note that the absorbance jump is due to a light source change at 450 nm. Legend: mL 0.9 M NaMnO4 added = 0.4 (red), 0.6 (blue), 0.8 (green), 1.0 (black), 1.2 (orange); mole Mn/mole Cr = 0.36 (red), 0.54 (blue), 0.72 (green), 0.90 (black), 1.08 (orange).
Figure 3.6. Repeat of the Conditions of Figure 3.4. Plot of Solution Potential for 0.5 mmole of
Cr2O3 with 0.9 M NaMnO4 in 0.1 M NaOH at 80°C. Undetermined Stirring Speed. Note that 1.1 mL of added permanganate would give a [Cr]:[Mn] of 1.0.
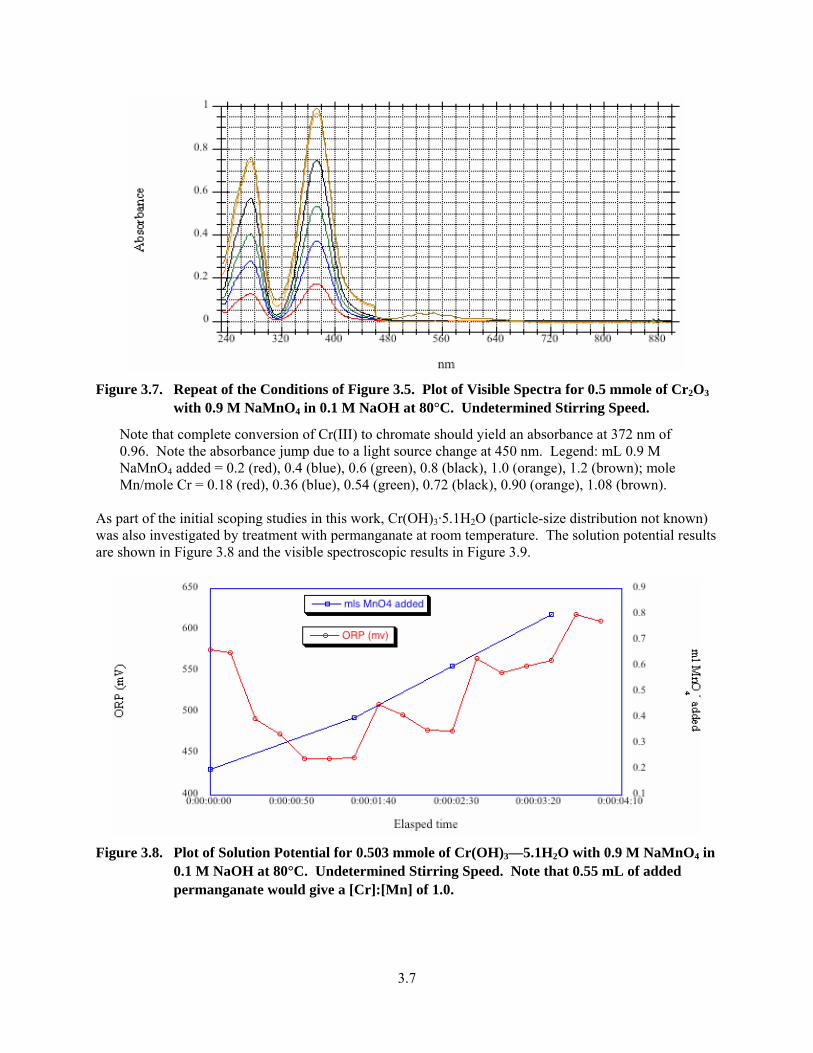
3.7
Figure 3.7. Repeat of the Conditions of Figure 3.5. Plot of Visible Spectra for 0.5 mmole of Cr2O3
with 0.9 M NaMnO4 in 0.1 M NaOH at 80°C. Undetermined Stirring Speed.
Note that complete conversion of Cr(III) to chromate should yield an absorbance at 372 nm of 0.96. Note the absorbance jump due to a light source change at 450 nm. Legend: mL 0.9 M NaMnO4 added = 0.2 (red), 0.4 (blue), 0.6 (green), 0.8 (black), 1.0 (orange), 1.2 (brown); mole Mn/mole Cr = 0.18 (red), 0.36 (blue), 0.54 (green), 0.72 (black), 0.90 (orange), 1.08 (brown).
As part of the initial scoping studies in this work, Cr(OH)3·5.1H2O (particle-size distribution not known) was also investigated by treatment with permanganate at room temperature. The solution potential results are shown in Figure 3.8 and the visible spectroscopic results in Figure 3.9.
Figure 3.8. Plot of Solution Potential for 0.503 mmole of Cr(OH)3—5.1H2O with 0.9 M NaMnO4 in
0.1 M NaOH at 80°C. Undetermined Stirring Speed. Note that 0.55 mL of added permanganate would give a [Cr]:[Mn] of 1.0.
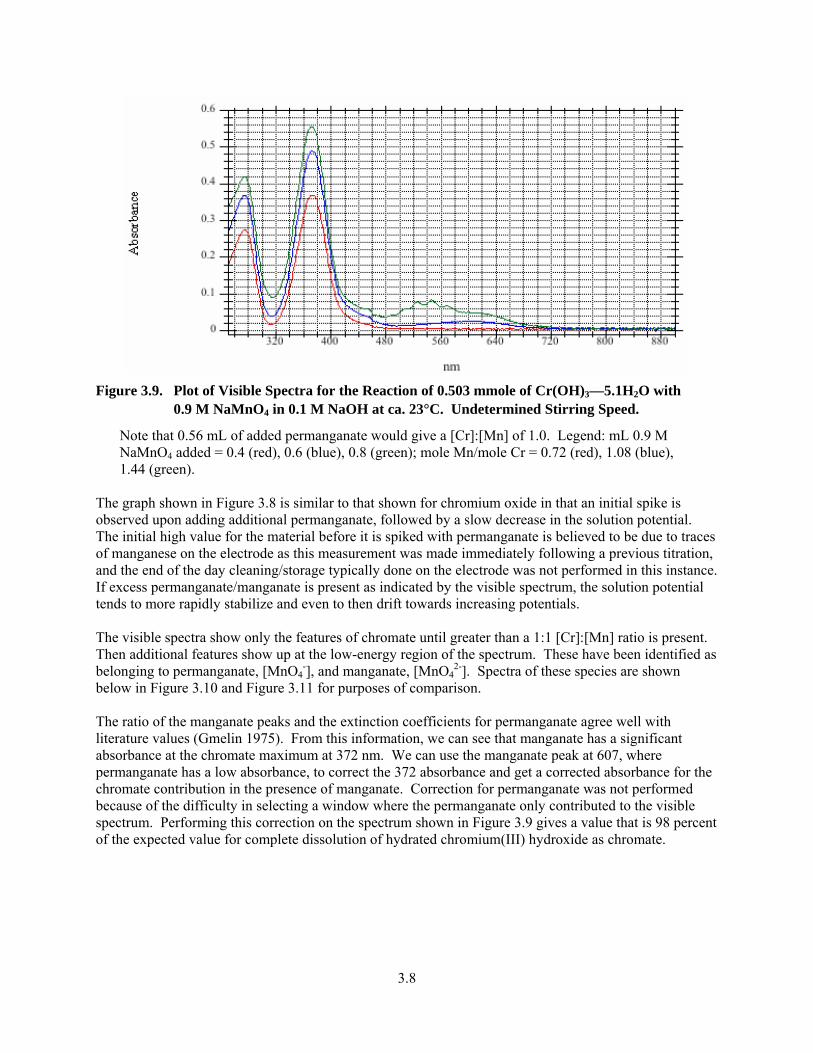
3.8
Figure 3.9. Plot of Visible Spectra for the Reaction of 0.503 mmole of Cr(OH)3—5.1H2O with
0.9 M NaMnO4 in 0.1 M NaOH at ca. 23°C. Undetermined Stirring Speed.
Note that 0.56 mL of added permanganate would give a [Cr]:[Mn] of 1.0. Legend: mL 0.9 M NaMnO4 added = 0.4 (red), 0.6 (blue), 0.8 (green); mole Mn/mole Cr = 0.72 (red), 1.08 (blue), 1.44 (green).
The graph shown in Figure 3.8 is similar to that shown for chromium oxide in that an initial spike is observed upon adding additional permanganate, followed by a slow decrease in the solution potential. The initial high value for the material before it is spiked with permanganate is believed to be due to traces of manganese on the electrode as this measurement was made immediately following a previous titration, and the end of the day cleaning/storage typically done on the electrode was not performed in this instance. If excess permanganate/manganate is present as indicated by the visible spectrum, the solution potential tends to more rapidly stabilize and even to then drift towards increasing potentials. The visible spectra show only the features of chromate until greater than a 1:1 [Cr]:[Mn] ratio is present. Then additional features show up at the low-energy region of the spectrum. These have been identified as belonging to permanganate, [MnO4
-], and manganate, [MnO42-]. Spectra of these species are shown
below in Figure 3.10 and Figure 3.11 for purposes of comparison. The ratio of the manganate peaks and the extinction coefficients for permanganate agree well with literature values (Gmelin 1975). From this information, we can see that manganate has a significant absorbance at the chromate maximum at 372 nm. We can use the manganate peak at 607, where permanganate has a low absorbance, to correct the 372 absorbance and get a corrected absorbance for the chromate contribution in the presence of manganate. Correction for permanganate was not performed because of the difficulty in selecting a window where the permanganate only contributed to the visible spectrum. Performing this correction on the spectrum shown in Figure 3.9 gives a value that is 98 percent of the expected value for complete dissolution of hydrated chromium(III) hydroxide as chromate.

3.9
Figure 3.10. Visible Spectrum of Permanganate. 0.45 mM NaMnO4 in 0.033 M NaOH.
Figure 3.11. Visible Spectrum of Manganate, Diluted 1:10 in 0.1 M NaOH
In summary, although ORP appears to be useful in determining the amount of permanganate needed to convert soluble Cr(III) to Cr(VI) in alkaline solution at room temperature, the reaction rates often are very slow to reach complete conversion of permanganate in the presence of Cr(III) solids. ORP only shows marked changes illustrative of consumption of permanganate after the reaction with Cr solids is complete, a process that can take hours for every added portion of added permanganate. These slow reaction rates led to abandoning this approach and replacing with another approach, one that performs multiple experiments with a given Cr(III)-containing material and then uses visible spectroscopy to evaluate the amount of generated chromate as a function of that initial [MnO4
-] / [Cr(III)] ratio.
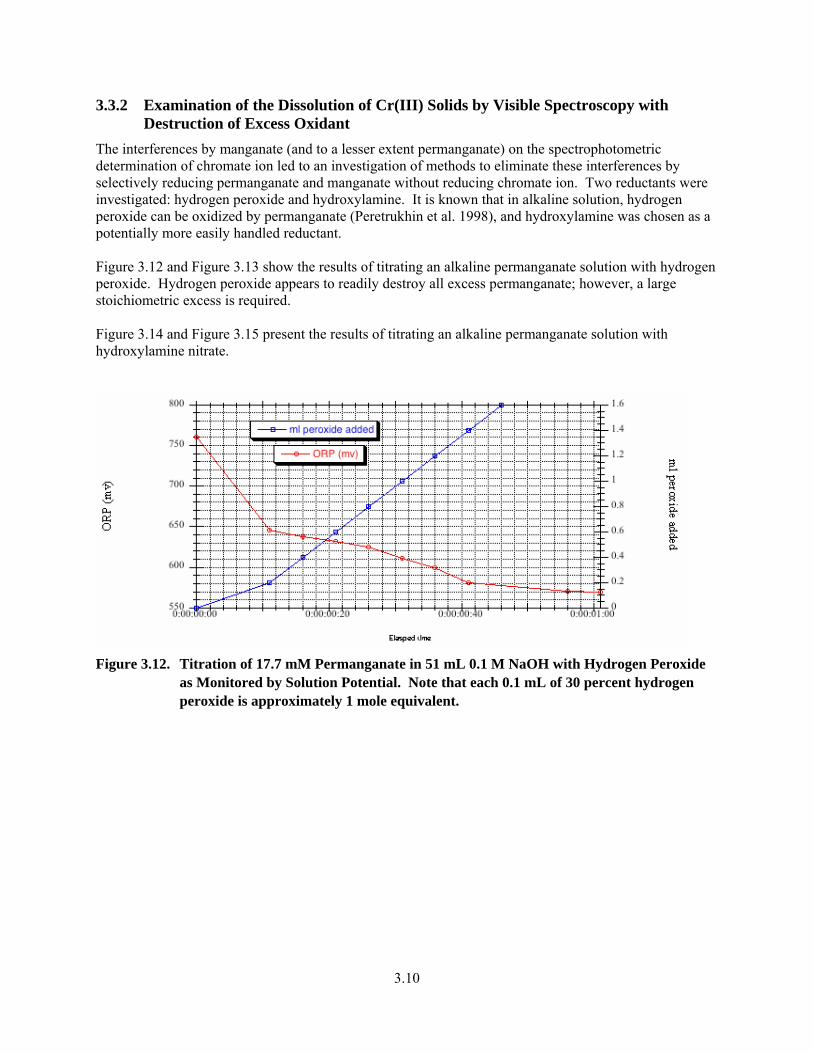
3.10
3.3.2 Examination of the Dissolution of Cr(III) Solids by Visible Spectroscopy with Destruction of Excess Oxidant
The interferences by manganate (and to a lesser extent permanganate) on the spectrophotometric determination of chromate ion led to an investigation of methods to eliminate these interferences by selectively reducing permanganate and manganate without reducing chromate ion. Two reductants were investigated: hydrogen peroxide and hydroxylamine. It is known that in alkaline solution, hydrogen peroxide can be oxidized by permanganate (Peretrukhin et al. 1998), and hydroxylamine was chosen as a potentially more easily handled reductant. Figure 3.12 and Figure 3.13 show the results of titrating an alkaline permanganate solution with hydrogen peroxide. Hydrogen peroxide appears to readily destroy all excess permanganate; however, a large stoichiometric excess is required. Figure 3.14 and Figure 3.15 present the results of titrating an alkaline permanganate solution with hydroxylamine nitrate.
Figure 3.12. Titration of 17.7 mM Permanganate in 51 mL 0.1 M NaOH with Hydrogen Peroxide
as Monitored by Solution Potential. Note that each 0.1 mL of 30 percent hydrogen peroxide is approximately 1 mole equivalent.

3.11
Figure 3.13. Titration of 17.7 mM Permanganate With Hydrogen Peroxide in 51 mL 0.1 M NaOH
as Monitored by UV-vis Spectroscopy
Note that each 0.1 mL of 30 percent hydrogen peroxide is approximately 1 mole equivalent. Legend: mL 30 percent H2O2 added = 0.4 (red), 0.6 (blue), 0.8 (green), 1.0 (black), 1.2 (pink), 1.4 (light blue), 1.6 (brown). Note: The reaction stoichiometry for reduction of MnO4
- to Mn2+ is 5 moles H2O2 per 2 moles of MnO4
-.
Figure 3.14. Redox Titration of Sodium Permanganate in 0.1 M NaOH with Hydroxylammonium
Nitrate. There is an approximately 5-minute wait between each hydroxylammonium nitrate addition.
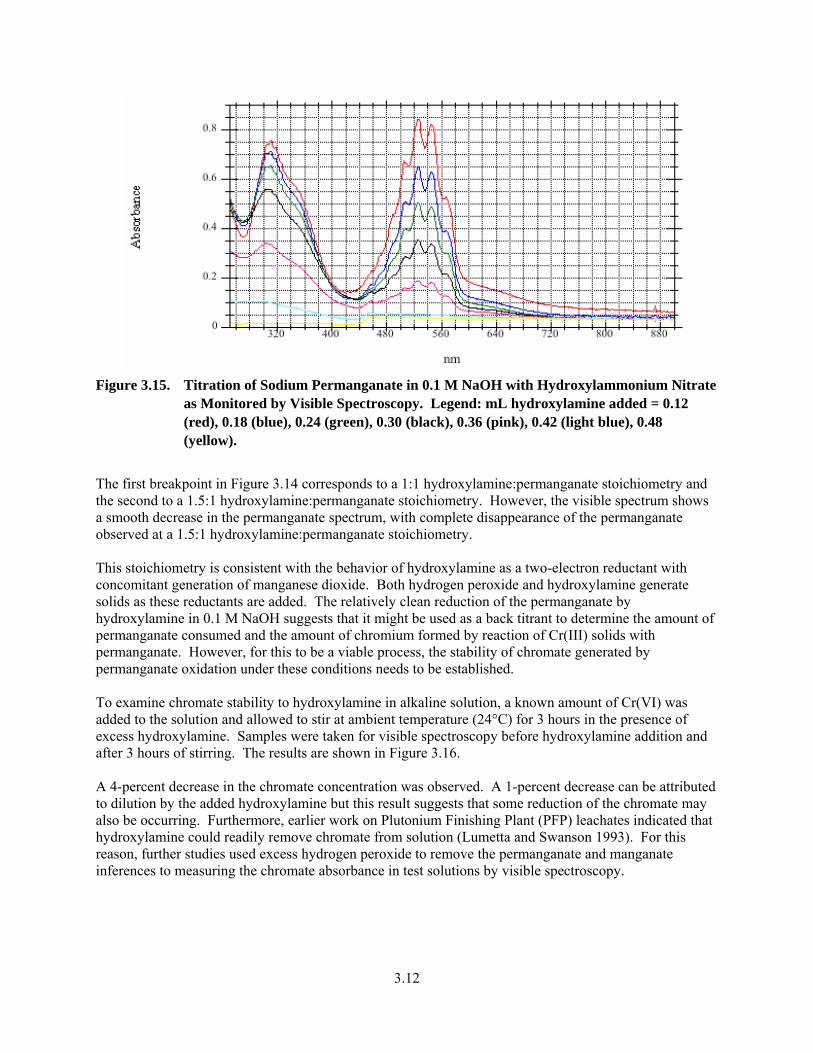
3.12
Figure 3.15. Titration of Sodium Permanganate in 0.1 M NaOH with Hydroxylammonium Nitrate
as Monitored by Visible Spectroscopy. Legend: mL hydroxylamine added = 0.12 (red), 0.18 (blue), 0.24 (green), 0.30 (black), 0.36 (pink), 0.42 (light blue), 0.48 (yellow).
The first breakpoint in Figure 3.14 corresponds to a 1:1 hydroxylamine:permanganate stoichiometry and the second to a 1.5:1 hydroxylamine:permanganate stoichiometry. However, the visible spectrum shows a smooth decrease in the permanganate spectrum, with complete disappearance of the permanganate observed at a 1.5:1 hydroxylamine:permanganate stoichiometry. This stoichiometry is consistent with the behavior of hydroxylamine as a two-electron reductant with concomitant generation of manganese dioxide. Both hydrogen peroxide and hydroxylamine generate solids as these reductants are added. The relatively clean reduction of the permanganate by hydroxylamine in 0.1 M NaOH suggests that it might be used as a back titrant to determine the amount of permanganate consumed and the amount of chromium formed by reaction of Cr(III) solids with permanganate. However, for this to be a viable process, the stability of chromate generated by permanganate oxidation under these conditions needs to be established. To examine chromate stability to hydroxylamine in alkaline solution, a known amount of Cr(VI) was added to the solution and allowed to stir at ambient temperature (24°C) for 3 hours in the presence of excess hydroxylamine. Samples were taken for visible spectroscopy before hydroxylamine addition and after 3 hours of stirring. The results are shown in Figure 3.16. A 4-percent decrease in the chromate concentration was observed. A 1-percent decrease can be attributed to dilution by the added hydroxylamine but this result suggests that some reduction of the chromate may also be occurring. Furthermore, earlier work on Plutonium Finishing Plant (PFP) leachates indicated that hydroxylamine could readily remove chromate from solution (Lumetta and Swanson 1993). For this reason, further studies used excess hydrogen peroxide to remove the permanganate and manganate inferences to measuring the chromate absorbance in test solutions by visible spectroscopy.
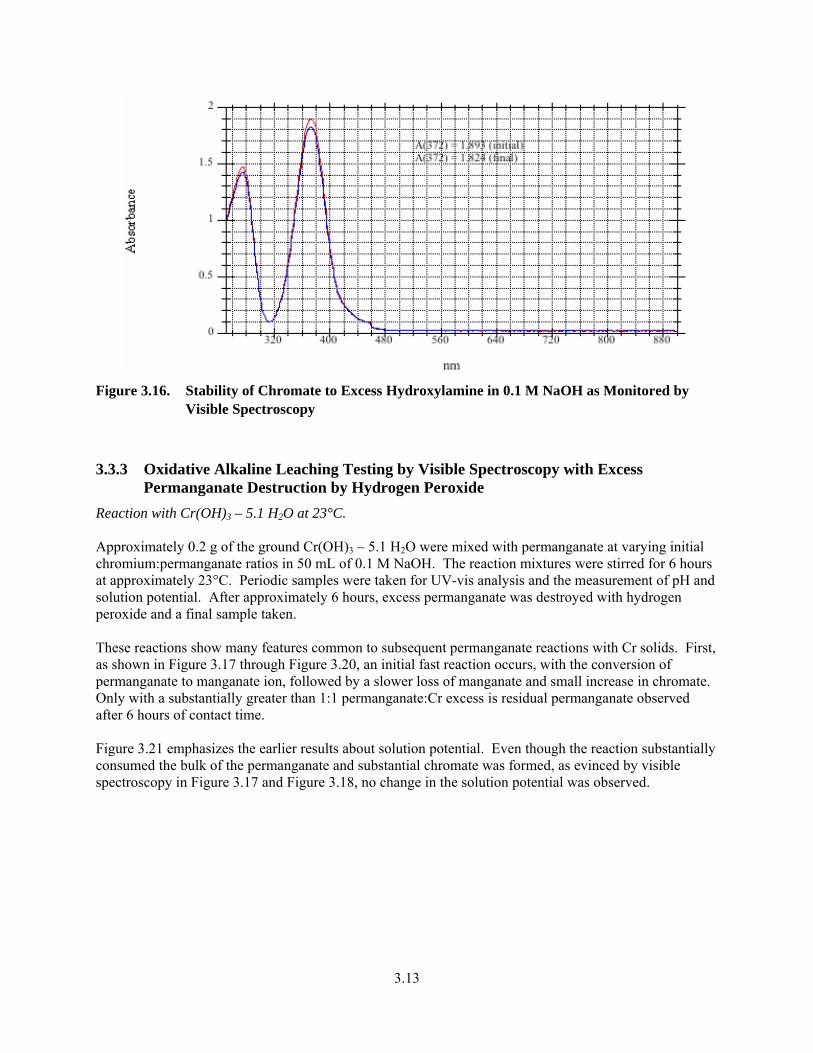
3.13
Figure 3.16. Stability of Chromate to Excess Hydroxylamine in 0.1 M NaOH as Monitored by
Visible Spectroscopy
3.3.3 Oxidative Alkaline Leaching Testing by Visible Spectroscopy with Excess Permanganate Destruction by Hydrogen Peroxide
Reaction with Cr(OH)3 – 5.1 H2O at 23°C. Approximately 0.2 g of the ground Cr(OH)3 – 5.1 H2O were mixed with permanganate at varying initial chromium:permanganate ratios in 50 mL of 0.1 M NaOH. The reaction mixtures were stirred for 6 hours at approximately 23°C. Periodic samples were taken for UV-vis analysis and the measurement of pH and solution potential. After approximately 6 hours, excess permanganate was destroyed with hydrogen peroxide and a final sample taken. These reactions show many features common to subsequent permanganate reactions with Cr solids. First, as shown in Figure 3.17 through Figure 3.20, an initial fast reaction occurs, with the conversion of permanganate to manganate ion, followed by a slower loss of manganate and small increase in chromate. Only with a substantially greater than 1:1 permanganate:Cr excess is residual permanganate observed after 6 hours of contact time. Figure 3.21 emphasizes the earlier results about solution potential. Even though the reaction substantially consumed the bulk of the permanganate and substantial chromate was formed, as evinced by visible spectroscopy in Figure 3.17 and Figure 3.18, no change in the solution potential was observed.
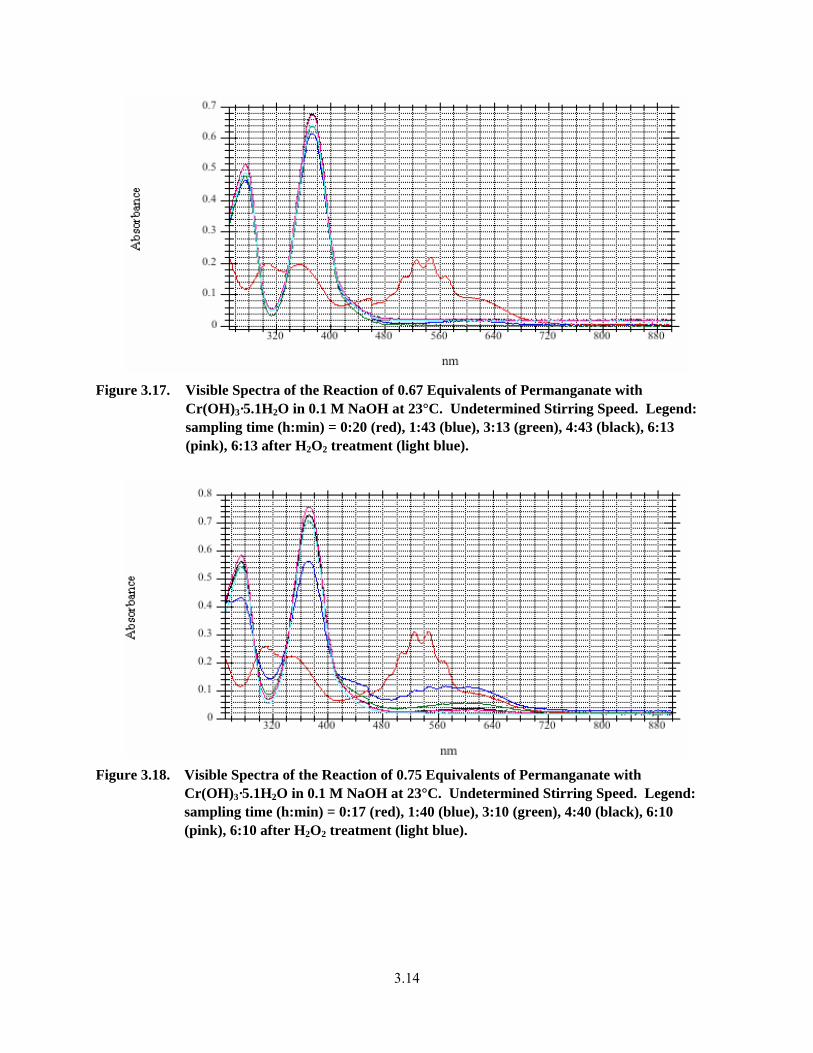
3.14
Figure 3.17. Visible Spectra of the Reaction of 0.67 Equivalents of Permanganate with
Cr(OH)3·5.1H2O in 0.1 M NaOH at 23°C. Undetermined Stirring Speed. Legend: sampling time (h:min) = 0:20 (red), 1:43 (blue), 3:13 (green), 4:43 (black), 6:13 (pink), 6:13 after H2O2 treatment (light blue).
Figure 3.18. Visible Spectra of the Reaction of 0.75 Equivalents of Permanganate with
Cr(OH)3·5.1H2O in 0.1 M NaOH at 23°C. Undetermined Stirring Speed. Legend: sampling time (h:min) = 0:17 (red), 1:40 (blue), 3:10 (green), 4:40 (black), 6:10 (pink), 6:10 after H2O2 treatment (light blue).
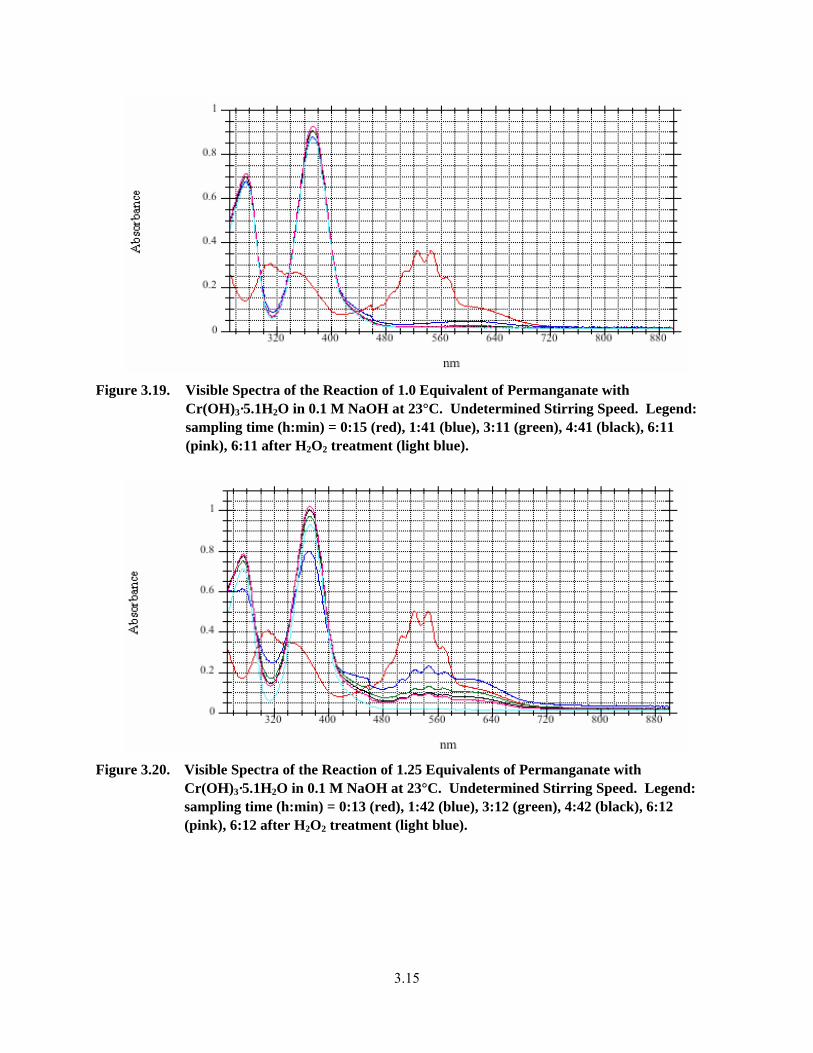
3.15
Figure 3.19. Visible Spectra of the Reaction of 1.0 Equivalent of Permanganate with
Cr(OH)3·5.1H2O in 0.1 M NaOH at 23°C. Undetermined Stirring Speed. Legend: sampling time (h:min) = 0:15 (red), 1:41 (blue), 3:11 (green), 4:41 (black), 6:11 (pink), 6:11 after H2O2 treatment (light blue).
Figure 3.20. Visible Spectra of the Reaction of 1.25 Equivalents of Permanganate with
Cr(OH)3·5.1H2O in 0.1 M NaOH at 23°C. Undetermined Stirring Speed. Legend: sampling time (h:min) = 0:13 (red), 1:42 (blue), 3:12 (green), 4:42 (black), 6:12 (pink), 6:12 after H2O2 treatment (light blue).
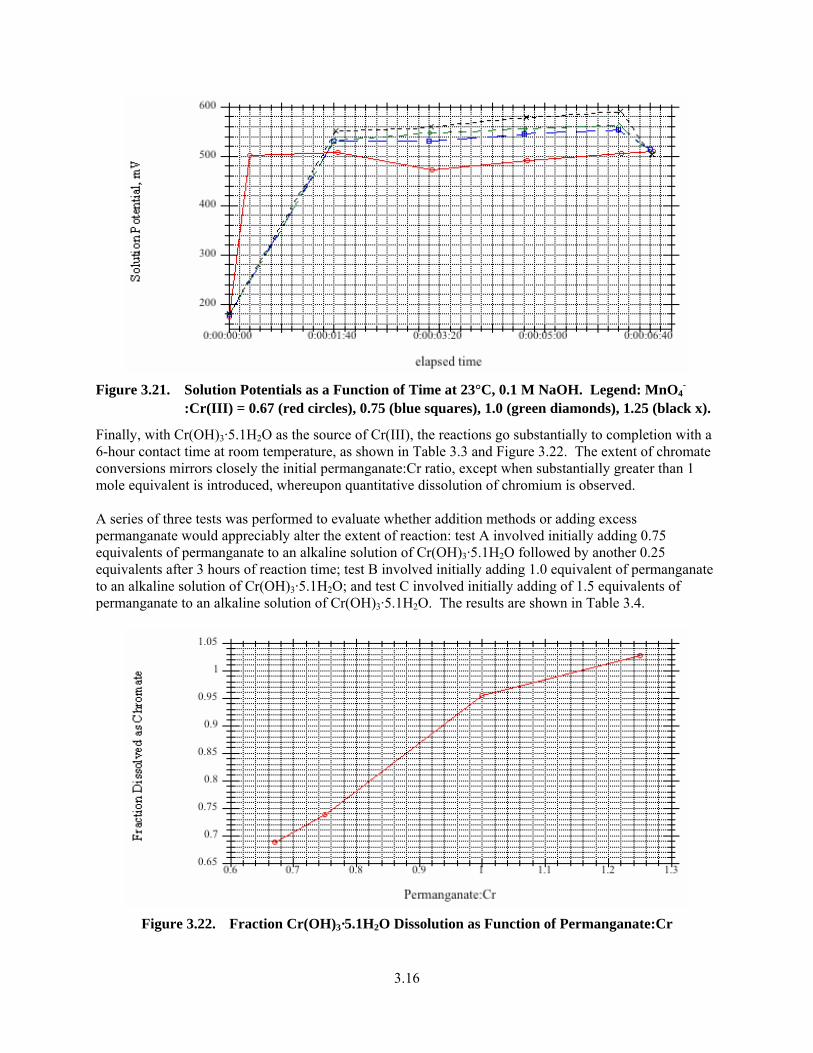
3.16
Figure 3.21. Solution Potentials as a Function of Time at 23°C, 0.1 M NaOH. Legend: MnO4
-
:Cr(III) = 0.67 (red circles), 0.75 (blue squares), 1.0 (green diamonds), 1.25 (black x).
Finally, with Cr(OH)3·5.1H2O as the source of Cr(III), the reactions go substantially to completion with a 6-hour contact time at room temperature, as shown in Table 3.3 and Figure 3.22. The extent of chromate conversions mirrors closely the initial permanganate:Cr ratio, except when substantially greater than 1 mole equivalent is introduced, whereupon quantitative dissolution of chromium is observed. A series of three tests was performed to evaluate whether addition methods or adding excess permanganate would appreciably alter the extent of reaction: test A involved initially adding 0.75 equivalents of permanganate to an alkaline solution of Cr(OH)3·5.1H2O followed by another 0.25 equivalents after 3 hours of reaction time; test B involved initially adding 1.0 equivalent of permanganate to an alkaline solution of Cr(OH)3·5.1H2O; and test C involved initially adding of 1.5 equivalents of permanganate to an alkaline solution of Cr(OH)3·5.1H2O. The results are shown in Table 3.4.
Figure 3.22. Fraction Cr(OH)3·5.1H2O Dissolution as Function of Permanganate:Cr
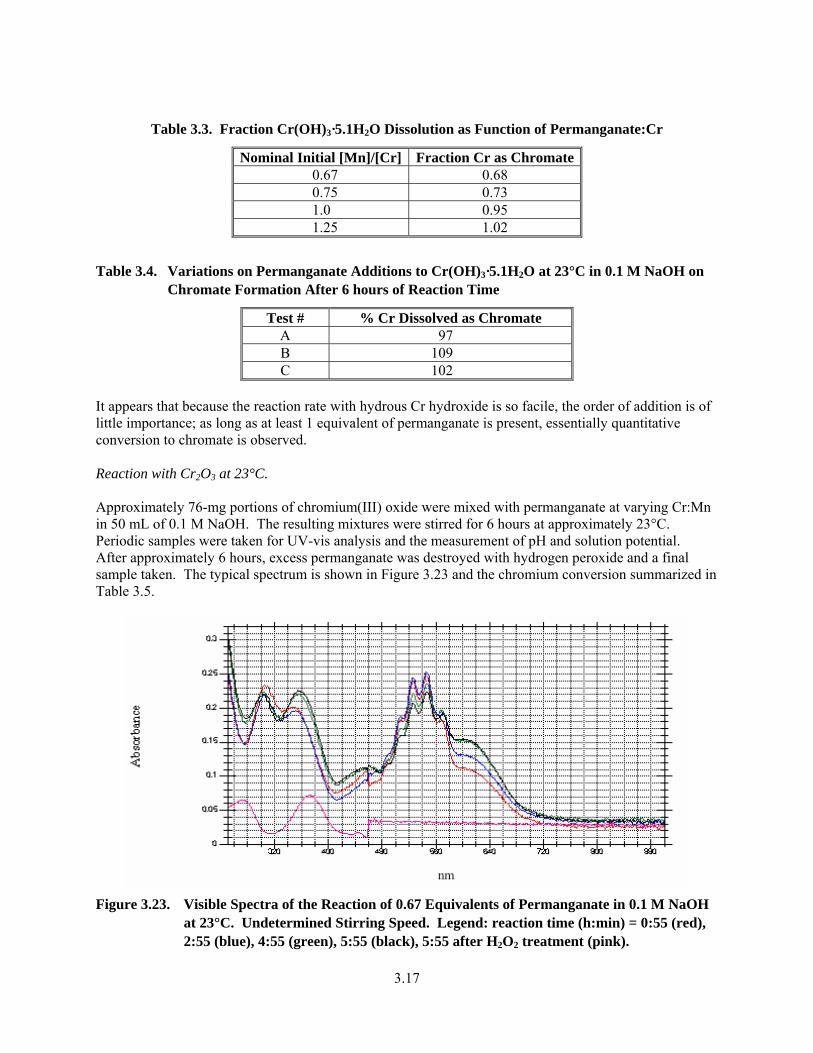
3.17
Table 3.3. Fraction Cr(OH)3·5.1H2O Dissolution as Function of Permanganate:Cr
Nominal Initial [Mn]/[Cr] Fraction Cr as Chromate 0.67 0.68 0.75 0.73 1.0 0.95 1.25 1.02
Table 3.4. Variations on Permanganate Additions to Cr(OH)3·5.1H2O at 23°C in 0.1 M NaOH on Chromate Formation After 6 hours of Reaction Time
Test # % Cr Dissolved as Chromate A 97 B 109 C 102
It appears that because the reaction rate with hydrous Cr hydroxide is so facile, the order of addition is of little importance; as long as at least 1 equivalent of permanganate is present, essentially quantitative conversion to chromate is observed. Reaction with Cr2O3 at 23°C. Approximately 76-mg portions of chromium(III) oxide were mixed with permanganate at varying Cr:Mn in 50 mL of 0.1 M NaOH. The resulting mixtures were stirred for 6 hours at approximately 23°C. Periodic samples were taken for UV-vis analysis and the measurement of pH and solution potential. After approximately 6 hours, excess permanganate was destroyed with hydrogen peroxide and a final sample taken. The typical spectrum is shown in Figure 3.23 and the chromium conversion summarized in Table 3.5.
Figure 3.23. Visible Spectra of the Reaction of 0.67 Equivalents of Permanganate in 0.1 M NaOH
at 23°C. Undetermined Stirring Speed. Legend: reaction time (h:min) = 0:55 (red), 2:55 (blue), 4:55 (green), 5:55 (black), 5:55 after H2O2 treatment (pink).
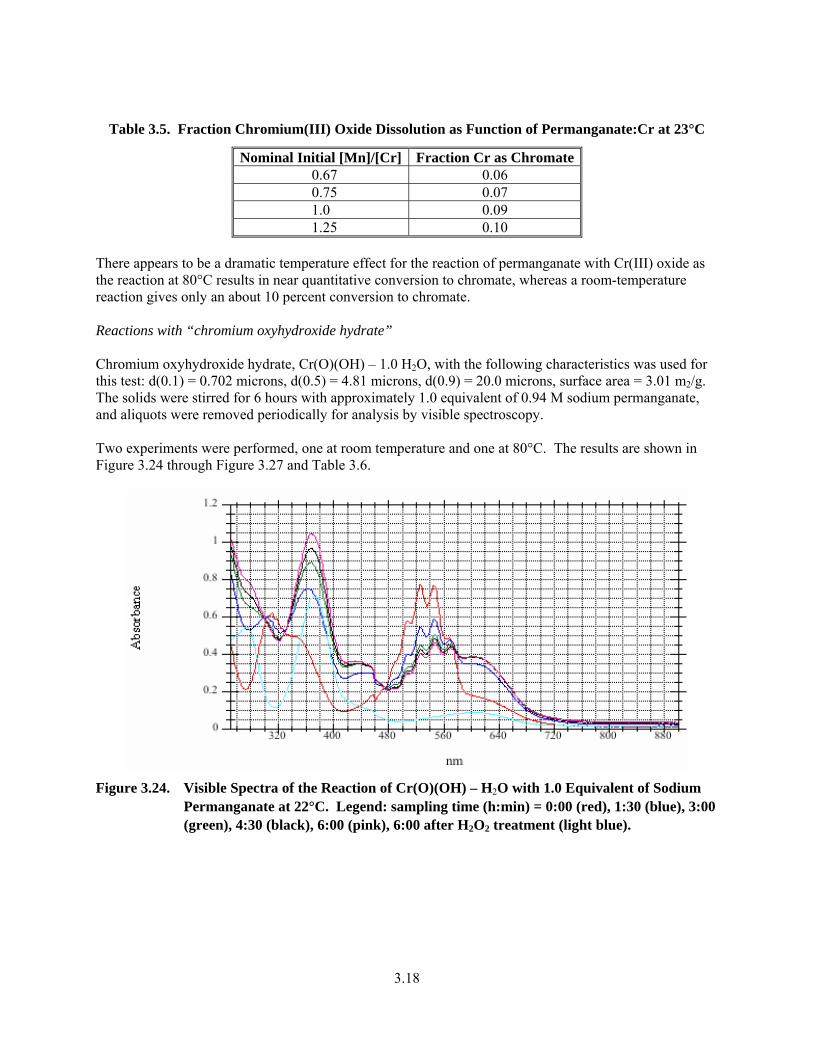
3.18
Table 3.5. Fraction Chromium(III) Oxide Dissolution as Function of Permanganate:Cr at 23°C
Nominal Initial [Mn]/[Cr] Fraction Cr as Chromate 0.67 0.06 0.75 0.07 1.0 0.09 1.25 0.10
There appears to be a dramatic temperature effect for the reaction of permanganate with Cr(III) oxide as the reaction at 80°C results in near quantitative conversion to chromate, whereas a room-temperature reaction gives only an about 10 percent conversion to chromate. Reactions with “chromium oxyhydroxide hydrate” Chromium oxyhydroxide hydrate, Cr(O)(OH) – 1.0 H2O, with the following characteristics was used for this test: d(0.1) = 0.702 microns, d(0.5) = 4.81 microns, d(0.9) = 20.0 microns, surface area = 3.01 m2/g. The solids were stirred for 6 hours with approximately 1.0 equivalent of 0.94 M sodium permanganate, and aliquots were removed periodically for analysis by visible spectroscopy. Two experiments were performed, one at room temperature and one at 80°C. The results are shown in Figure 3.24 through Figure 3.27 and Table 3.6.
Figure 3.24. Visible Spectra of the Reaction of Cr(O)(OH) – H2O with 1.0 Equivalent of Sodium
Permanganate at 22°C. Legend: sampling time (h:min) = 0:00 (red), 1:30 (blue), 3:00 (green), 4:30 (black), 6:00 (pink), 6:00 after H2O2 treatment (light blue).
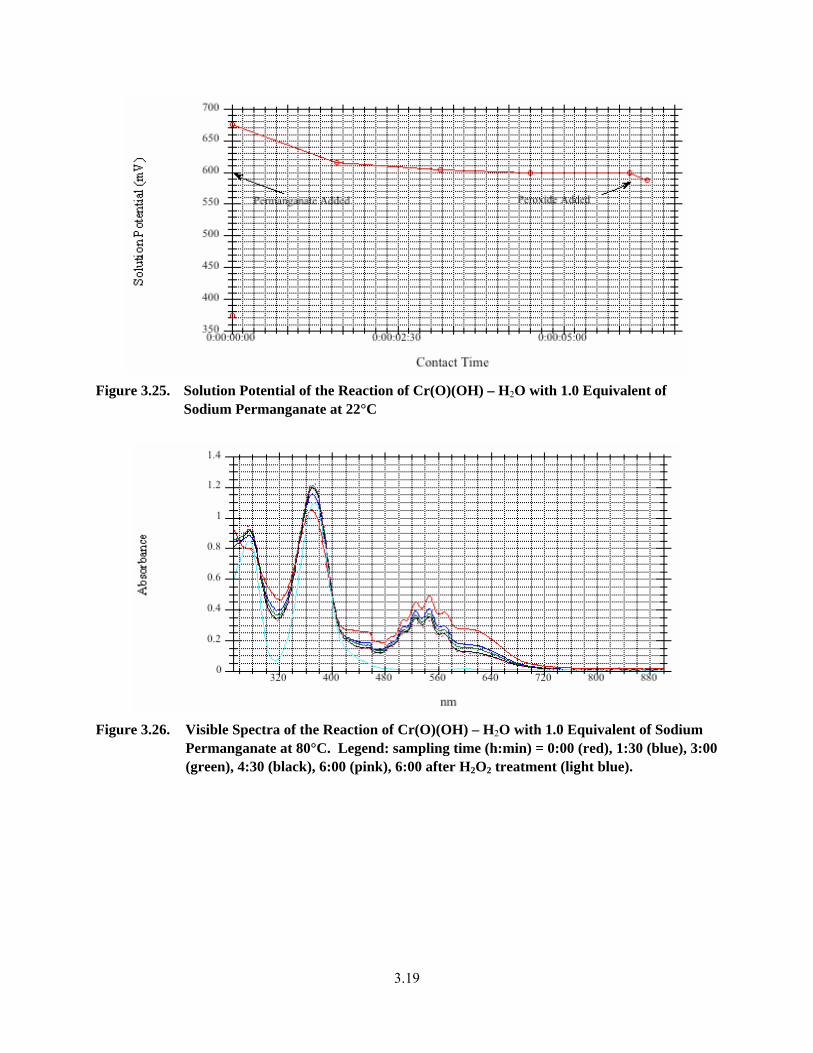
3.19
Figure 3.25. Solution Potential of the Reaction of Cr(O)(OH) – H2O with 1.0 Equivalent of
Sodium Permanganate at 22°C
Figure 3.26. Visible Spectra of the Reaction of Cr(O)(OH) – H2O with 1.0 Equivalent of Sodium
Permanganate at 80°C. Legend: sampling time (h:min) = 0:00 (red), 1:30 (blue), 3:00 (green), 4:30 (black), 6:00 (pink), 6:00 after H2O2 treatment (light blue).
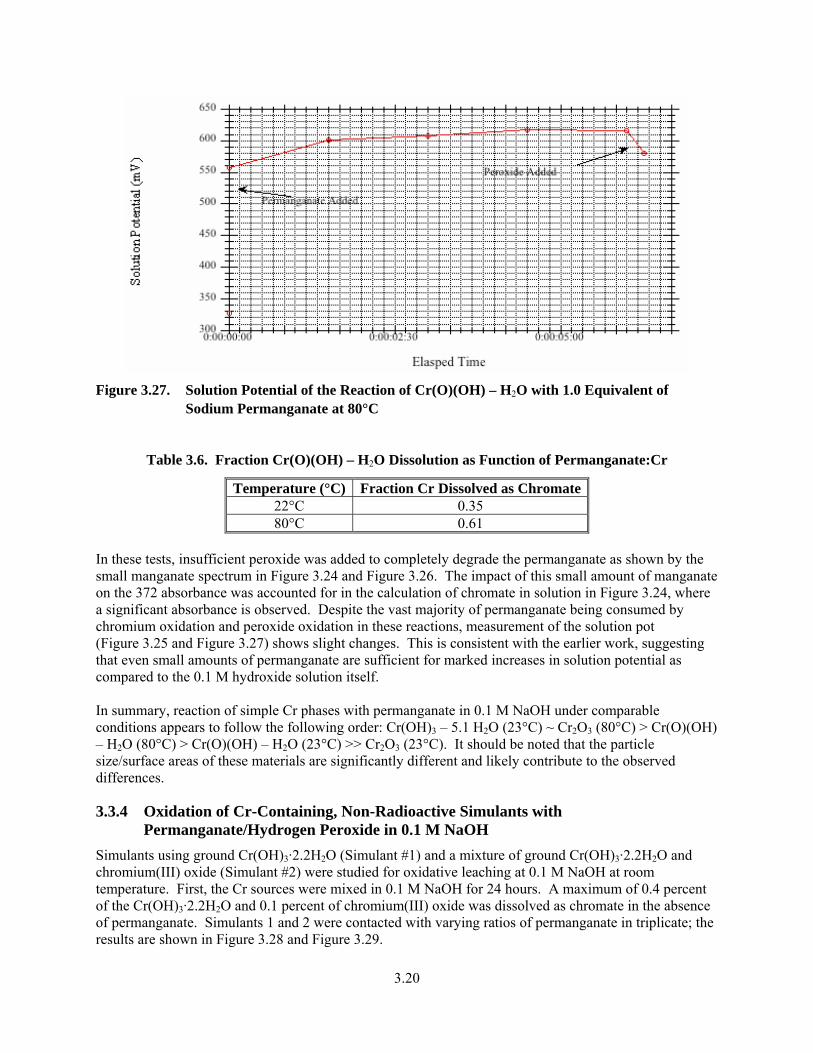
3.20
Figure 3.27. Solution Potential of the Reaction of Cr(O)(OH) – H2O with 1.0 Equivalent of
Sodium Permanganate at 80°C
Table 3.6. Fraction Cr(O)(OH) – H2O Dissolution as Function of Permanganate:Cr
Temperature (°C) Fraction Cr Dissolved as Chromate 22°C 0.35 80°C 0.61
In these tests, insufficient peroxide was added to completely degrade the permanganate as shown by the small manganate spectrum in Figure 3.24 and Figure 3.26. The impact of this small amount of manganate on the 372 absorbance was accounted for in the calculation of chromate in solution in Figure 3.24, where a significant absorbance is observed. Despite the vast majority of permanganate being consumed by chromium oxidation and peroxide oxidation in these reactions, measurement of the solution pot (Figure 3.25 and Figure 3.27) shows slight changes. This is consistent with the earlier work, suggesting that even small amounts of permanganate are sufficient for marked increases in solution potential as compared to the 0.1 M hydroxide solution itself. In summary, reaction of simple Cr phases with permanganate in 0.1 M NaOH under comparable conditions appears to follow the following order: Cr(OH)3 – 5.1 H2O (23°C) ~ Cr2O3 (80°C) > Cr(O)(OH) – H2O (80°C) > Cr(O)(OH) – H2O (23°C) >> Cr2O3 (23°C). It should be noted that the particle size/surface areas of these materials are significantly different and likely contribute to the observed differences.
3.3.4 Oxidation of Cr-Containing, Non-Radioactive Simulants with Permanganate/Hydrogen Peroxide in 0.1 M NaOH
Simulants using ground Cr(OH)3·2.2H2O (Simulant #1) and a mixture of ground Cr(OH)3·2.2H2O and chromium(III) oxide (Simulant #2) were studied for oxidative leaching at 0.1 M NaOH at room temperature. First, the Cr sources were mixed in 0.1 M NaOH for 24 hours. A maximum of 0.4 percent of the Cr(OH)3·2.2H2O and 0.1 percent of chromium(III) oxide was dissolved as chromate in the absence of permanganate. Simulants 1 and 2 were contacted with varying ratios of permanganate in triplicate; the results are shown in Figure 3.28 and Figure 3.29.
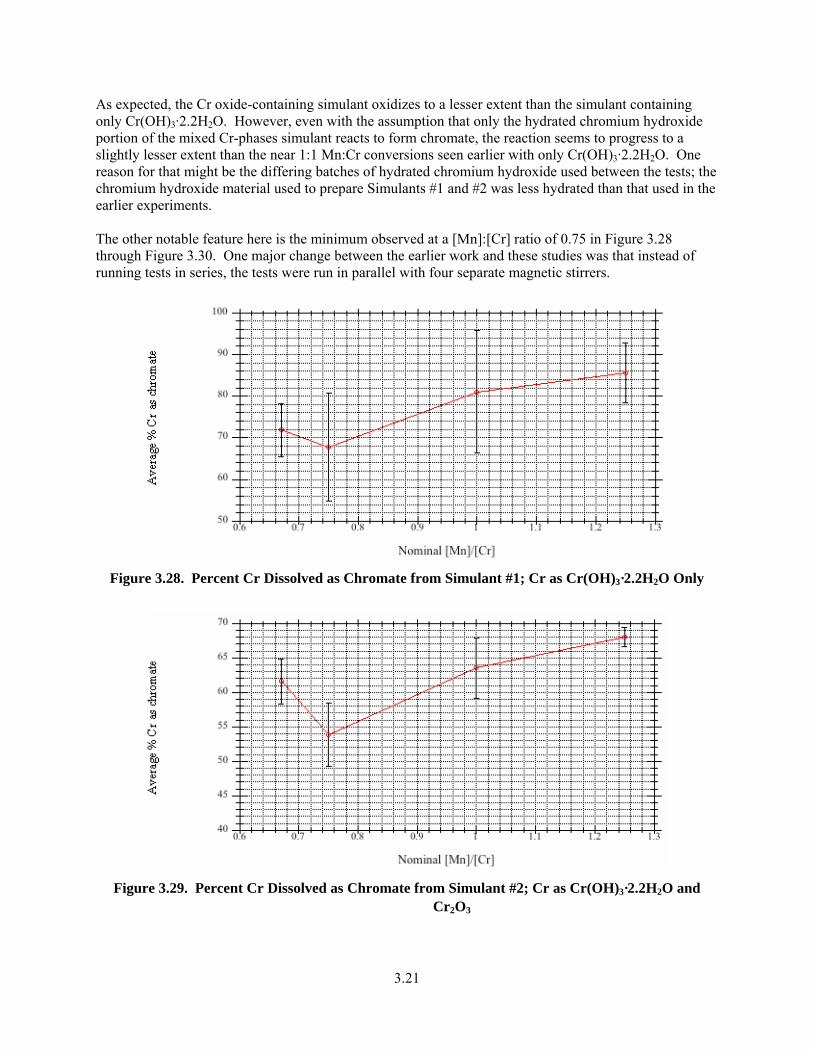
3.21
As expected, the Cr oxide-containing simulant oxidizes to a lesser extent than the simulant containing only Cr(OH)3·2.2H2O. However, even with the assumption that only the hydrated chromium hydroxide portion of the mixed Cr-phases simulant reacts to form chromate, the reaction seems to progress to a slightly lesser extent than the near 1:1 Mn:Cr conversions seen earlier with only Cr(OH)3·2.2H2O. One reason for that might be the differing batches of hydrated chromium hydroxide used between the tests; the chromium hydroxide material used to prepare Simulants #1 and #2 was less hydrated than that used in the earlier experiments. The other notable feature here is the minimum observed at a [Mn]:[Cr] ratio of 0.75 in Figure 3.28 through Figure 3.30. One major change between the earlier work and these studies was that instead of running tests in series, the tests were run in parallel with four separate magnetic stirrers.
Figure 3.28. Percent Cr Dissolved as Chromate from Simulant #1; Cr as Cr(OH)3·2.2H2O Only
Figure 3.29. Percent Cr Dissolved as Chromate from Simulant #2; Cr as Cr(OH)3·2.2H2O and
Cr2O3
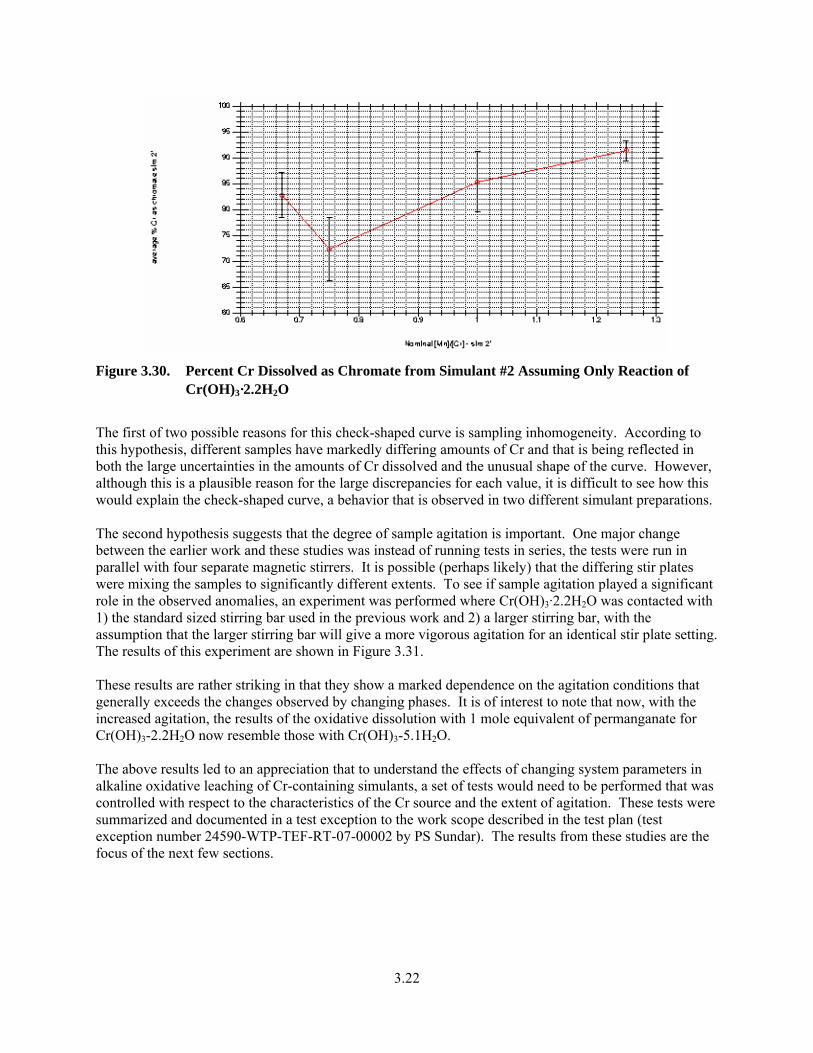
3.22
Figure 3.30. Percent Cr Dissolved as Chromate from Simulant #2 Assuming Only Reaction of
Cr(OH)3·2.2H2O
The first of two possible reasons for this check-shaped curve is sampling inhomogeneity. According to this hypothesis, different samples have markedly differing amounts of Cr and that is being reflected in both the large uncertainties in the amounts of Cr dissolved and the unusual shape of the curve. However, although this is a plausible reason for the large discrepancies for each value, it is difficult to see how this would explain the check-shaped curve, a behavior that is observed in two different simulant preparations. The second hypothesis suggests that the degree of sample agitation is important. One major change between the earlier work and these studies was instead of running tests in series, the tests were run in parallel with four separate magnetic stirrers. It is possible (perhaps likely) that the differing stir plates were mixing the samples to significantly different extents. To see if sample agitation played a significant role in the observed anomalies, an experiment was performed where Cr(OH)3·2.2H2O was contacted with 1) the standard sized stirring bar used in the previous work and 2) a larger stirring bar, with the assumption that the larger stirring bar will give a more vigorous agitation for an identical stir plate setting. The results of this experiment are shown in Figure 3.31. These results are rather striking in that they show a marked dependence on the agitation conditions that generally exceeds the changes observed by changing phases. It is of interest to note that now, with the increased agitation, the results of the oxidative dissolution with 1 mole equivalent of permanganate for Cr(OH)3-2.2H2O now resemble those with Cr(OH)3-5.1H2O. The above results led to an appreciation that to understand the effects of changing system parameters in alkaline oxidative leaching of Cr-containing simulants, a set of tests would need to be performed that was controlled with respect to the characteristics of the Cr source and the extent of agitation. These tests were summarized and documented in a test exception to the work scope described in the test plan (test exception number 24590-WTP-TEF-RT-07-00002 by PS Sundar). The results from these studies are the focus of the next few sections.
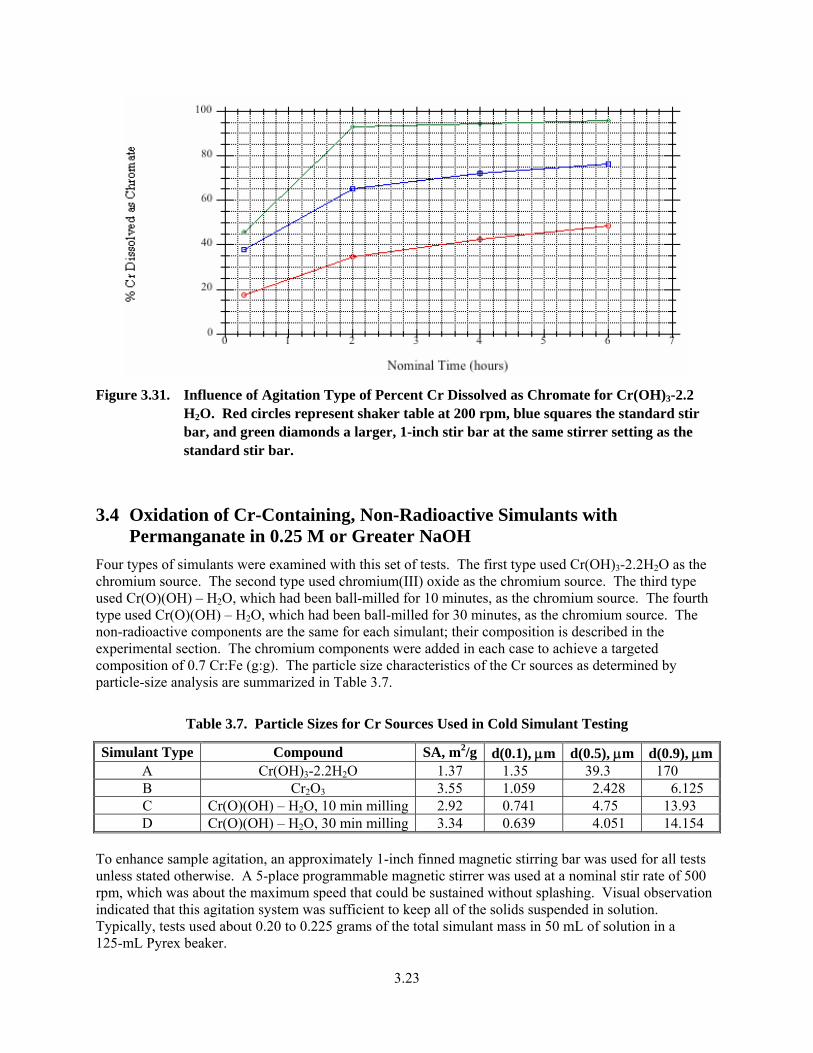
3.23
Figure 3.31. Influence of Agitation Type of Percent Cr Dissolved as Chromate for Cr(OH)3-2.2
H2O. Red circles represent shaker table at 200 rpm, blue squares the standard stir bar, and green diamonds a larger, 1-inch stir bar at the same stirrer setting as the standard stir bar.
3.4 Oxidation of Cr-Containing, Non-Radioactive Simulants with Permanganate in 0.25 M or Greater NaOH
Four types of simulants were examined with this set of tests. The first type used Cr(OH)3-2.2H2O as the chromium source. The second type used chromium(III) oxide as the chromium source. The third type used Cr(O)(OH) – H2O, which had been ball-milled for 10 minutes, as the chromium source. The fourth type used Cr(O)(OH) – H2O, which had been ball-milled for 30 minutes, as the chromium source. The non-radioactive components are the same for each simulant; their composition is described in the experimental section. The chromium components were added in each case to achieve a targeted composition of 0.7 Cr:Fe (g:g). The particle size characteristics of the Cr sources as determined by particle-size analysis are summarized in Table 3.7.
Table 3.7. Particle Sizes for Cr Sources Used in Cold Simulant Testing
Simulant Type Compound SA, m2/g d(0.1), μm d(0.5), μm d(0.9), μmA Cr(OH)3-2.2H2O 1.37 1.35 39.3 170 B Cr2O3 3.55 1.059 2.428 6.125 C Cr(O)(OH) – H2O, 10 min milling 2.92 0.741 4.75 13.93 D Cr(O)(OH) – H2O, 30 min milling 3.34 0.639 4.051 14.154
To enhance sample agitation, an approximately 1-inch finned magnetic stirring bar was used for all tests unless stated otherwise. A 5-place programmable magnetic stirrer was used at a nominal stir rate of 500 rpm, which was about the maximum speed that could be sustained without splashing. Visual observation indicated that this agitation system was sufficient to keep all of the solids suspended in solution. Typically, tests used about 0.20 to 0.225 grams of the total simulant mass in 50 mL of solution in a 125-mL Pyrex beaker.
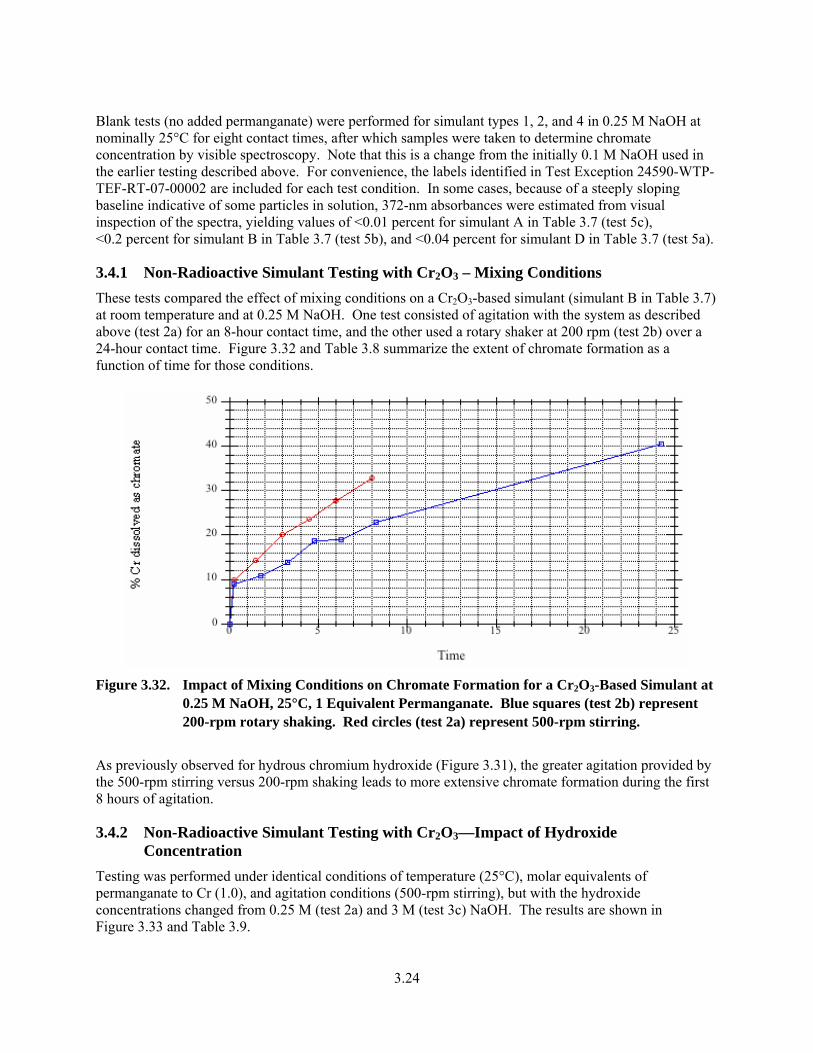
3.24
Blank tests (no added permanganate) were performed for simulant types 1, 2, and 4 in 0.25 M NaOH at nominally 25°C for eight contact times, after which samples were taken to determine chromate concentration by visible spectroscopy. Note that this is a change from the initially 0.1 M NaOH used in the earlier testing described above. For convenience, the labels identified in Test Exception 24590-WTP-TEF-RT-07-00002 are included for each test condition. In some cases, because of a steeply sloping baseline indicative of some particles in solution, 372-nm absorbances were estimated from visual inspection of the spectra, yielding values of <0.01 percent for simulant A in Table 3.7 (test 5c), <0.2 percent for simulant B in Table 3.7 (test 5b), and <0.04 percent for simulant D in Table 3.7 (test 5a).
3.4.1 Non-Radioactive Simulant Testing with Cr2O3 – Mixing Conditions These tests compared the effect of mixing conditions on a Cr2O3-based simulant (simulant B in Table 3.7) at room temperature and at 0.25 M NaOH. One test consisted of agitation with the system as described above (test 2a) for an 8-hour contact time, and the other used a rotary shaker at 200 rpm (test 2b) over a 24-hour contact time. Figure 3.32 and Table 3.8 summarize the extent of chromate formation as a function of time for those conditions.
Figure 3.32. Impact of Mixing Conditions on Chromate Formation for a Cr2O3-Based Simulant at
0.25 M NaOH, 25°C, 1 Equivalent Permanganate. Blue squares (test 2b) represent 200-rpm rotary shaking. Red circles (test 2a) represent 500-rpm stirring.
As previously observed for hydrous chromium hydroxide (Figure 3.31), the greater agitation provided by the 500-rpm stirring versus 200-rpm shaking leads to more extensive chromate formation during the first 8 hours of agitation.
3.4.2 Non-Radioactive Simulant Testing with Cr2O3—Impact of Hydroxide Concentration
Testing was performed under identical conditions of temperature (25°C), molar equivalents of permanganate to Cr (1.0), and agitation conditions (500-rpm stirring), but with the hydroxide concentrations changed from 0.25 M (test 2a) and 3 M (test 3c) NaOH. The results are shown in Figure 3.33 and Table 3.9.
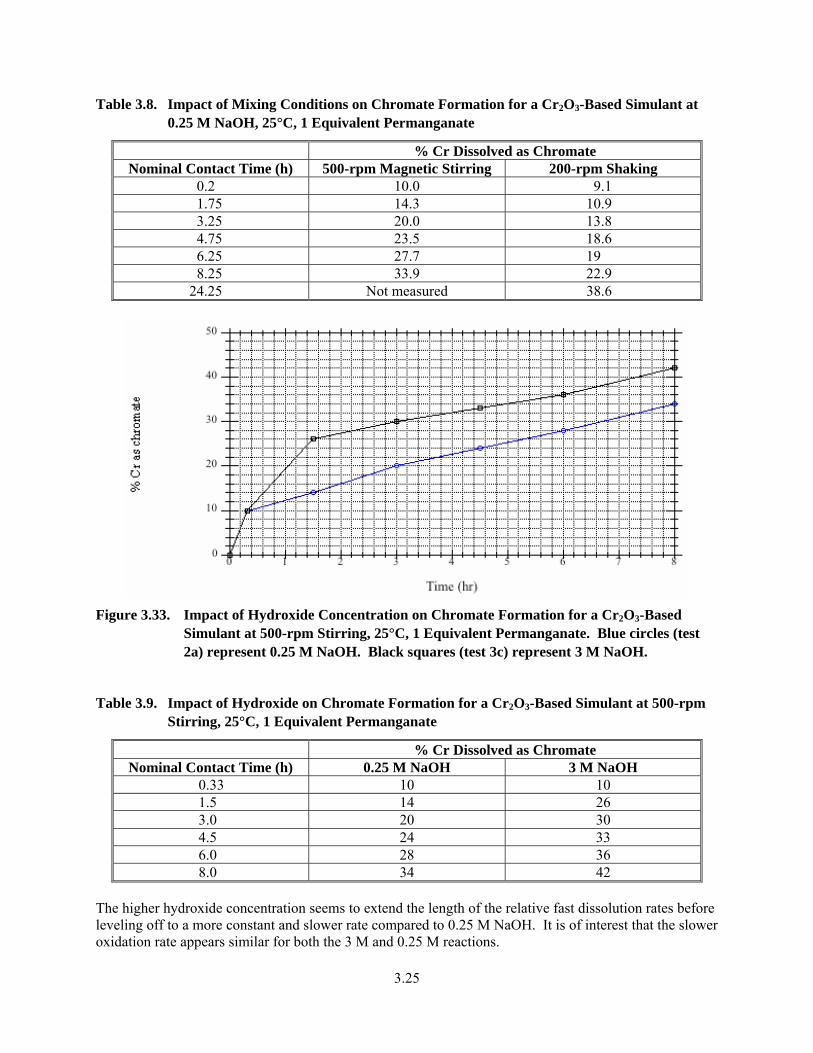
3.25
Table 3.8. Impact of Mixing Conditions on Chromate Formation for a Cr2O3-Based Simulant at 0.25 M NaOH, 25°C, 1 Equivalent Permanganate
% Cr Dissolved as Chromate Nominal Contact Time (h) 500-rpm Magnetic Stirring 200-rpm Shaking
0.2 10.0 9.1 1.75 14.3 10.9 3.25 20.0 13.8 4.75 23.5 18.6 6.25 27.7 19 8.25 33.9 22.9
24.25 Not measured 38.6
Figure 3.33. Impact of Hydroxide Concentration on Chromate Formation for a Cr2O3-Based
Simulant at 500-rpm Stirring, 25°C, 1 Equivalent Permanganate. Blue circles (test 2a) represent 0.25 M NaOH. Black squares (test 3c) represent 3 M NaOH.
Table 3.9. Impact of Hydroxide on Chromate Formation for a Cr2O3-Based Simulant at 500-rpm Stirring, 25°C, 1 Equivalent Permanganate
% Cr Dissolved as Chromate Nominal Contact Time (h) 0.25 M NaOH 3 M NaOH
0.33 10 10 1.5 14 26 3.0 20 30 4.5 24 33 6.0 28 36 8.0 34 42
The higher hydroxide concentration seems to extend the length of the relative fast dissolution rates before leveling off to a more constant and slower rate compared to 0.25 M NaOH. It is of interest that the slower oxidation rate appears similar for both the 3 M and 0.25 M reactions.
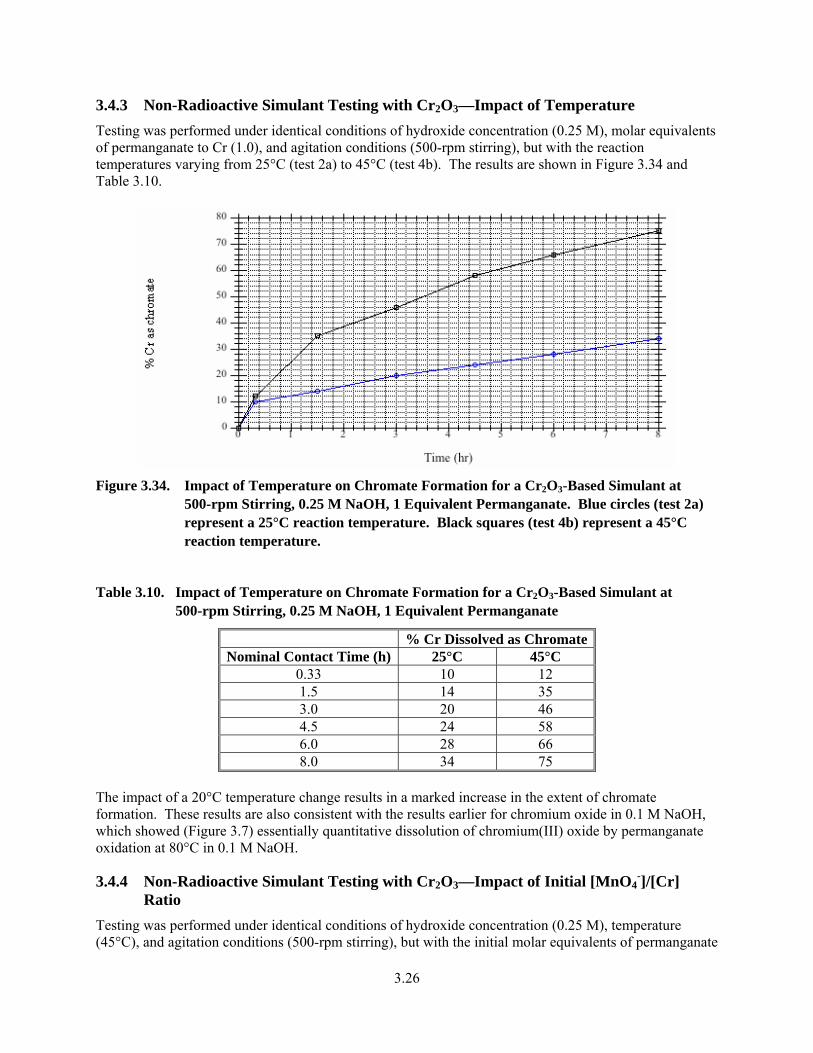
3.26
3.4.3 Non-Radioactive Simulant Testing with Cr2O3—Impact of Temperature Testing was performed under identical conditions of hydroxide concentration (0.25 M), molar equivalents of permanganate to Cr (1.0), and agitation conditions (500-rpm stirring), but with the reaction temperatures varying from 25°C (test 2a) to 45°C (test 4b). The results are shown in Figure 3.34 and Table 3.10.
Figure 3.34. Impact of Temperature on Chromate Formation for a Cr2O3-Based Simulant at
500-rpm Stirring, 0.25 M NaOH, 1 Equivalent Permanganate. Blue circles (test 2a) represent a 25°C reaction temperature. Black squares (test 4b) represent a 45°C reaction temperature.
Table 3.10. Impact of Temperature on Chromate Formation for a Cr2O3-Based Simulant at 500-rpm Stirring, 0.25 M NaOH, 1 Equivalent Permanganate
% Cr Dissolved as Chromate Nominal Contact Time (h) 25°C 45°C
0.33 10 12 1.5 14 35 3.0 20 46 4.5 24 58 6.0 28 66 8.0 34 75
The impact of a 20°C temperature change results in a marked increase in the extent of chromate formation. These results are also consistent with the results earlier for chromium oxide in 0.1 M NaOH, which showed (Figure 3.7) essentially quantitative dissolution of chromium(III) oxide by permanganate oxidation at 80°C in 0.1 M NaOH.
3.4.4 Non-Radioactive Simulant Testing with Cr2O3—Impact of Initial [MnO4-]/[Cr]
Ratio Testing was performed under identical conditions of hydroxide concentration (0.25 M), temperature (45°C), and agitation conditions (500-rpm stirring), but with the initial molar equivalents of permanganate
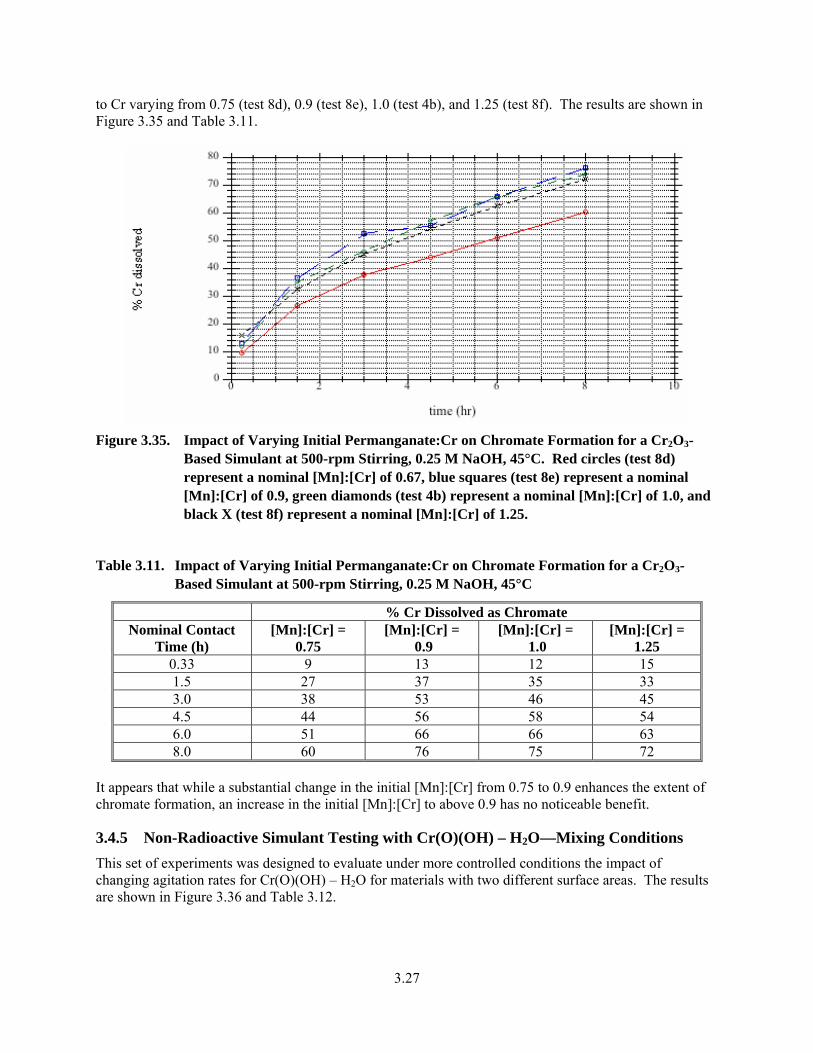
3.27
to Cr varying from 0.75 (test 8d), 0.9 (test 8e), 1.0 (test 4b), and 1.25 (test 8f). The results are shown in Figure 3.35 and Table 3.11.
Figure 3.35. Impact of Varying Initial Permanganate:Cr on Chromate Formation for a Cr2O3-
Based Simulant at 500-rpm Stirring, 0.25 M NaOH, 45°C. Red circles (test 8d) represent a nominal [Mn]:[Cr] of 0.67, blue squares (test 8e) represent a nominal [Mn]:[Cr] of 0.9, green diamonds (test 4b) represent a nominal [Mn]:[Cr] of 1.0, and black X (test 8f) represent a nominal [Mn]:[Cr] of 1.25.
Table 3.11. Impact of Varying Initial Permanganate:Cr on Chromate Formation for a Cr2O3-Based Simulant at 500-rpm Stirring, 0.25 M NaOH, 45°C
% Cr Dissolved as Chromate Nominal Contact
Time (h) [Mn]:[Cr] =
0.75 [Mn]:[Cr] =
0.9 [Mn]:[Cr] =
1.0 [Mn]:[Cr] =
1.25 0.33 9 13 12 15 1.5 27 37 35 33 3.0 38 53 46 45 4.5 44 56 58 54 6.0 51 66 66 63 8.0 60 76 75 72
It appears that while a substantial change in the initial [Mn]:[Cr] from 0.75 to 0.9 enhances the extent of chromate formation, an increase in the initial [Mn]:[Cr] to above 0.9 has no noticeable benefit.
3.4.5 Non-Radioactive Simulant Testing with Cr(O)(OH) – H2O—Mixing Conditions This set of experiments was designed to evaluate under more controlled conditions the impact of changing agitation rates for Cr(O)(OH) – H2O for materials with two different surface areas. The results are shown in Figure 3.36 and Table 3.12.
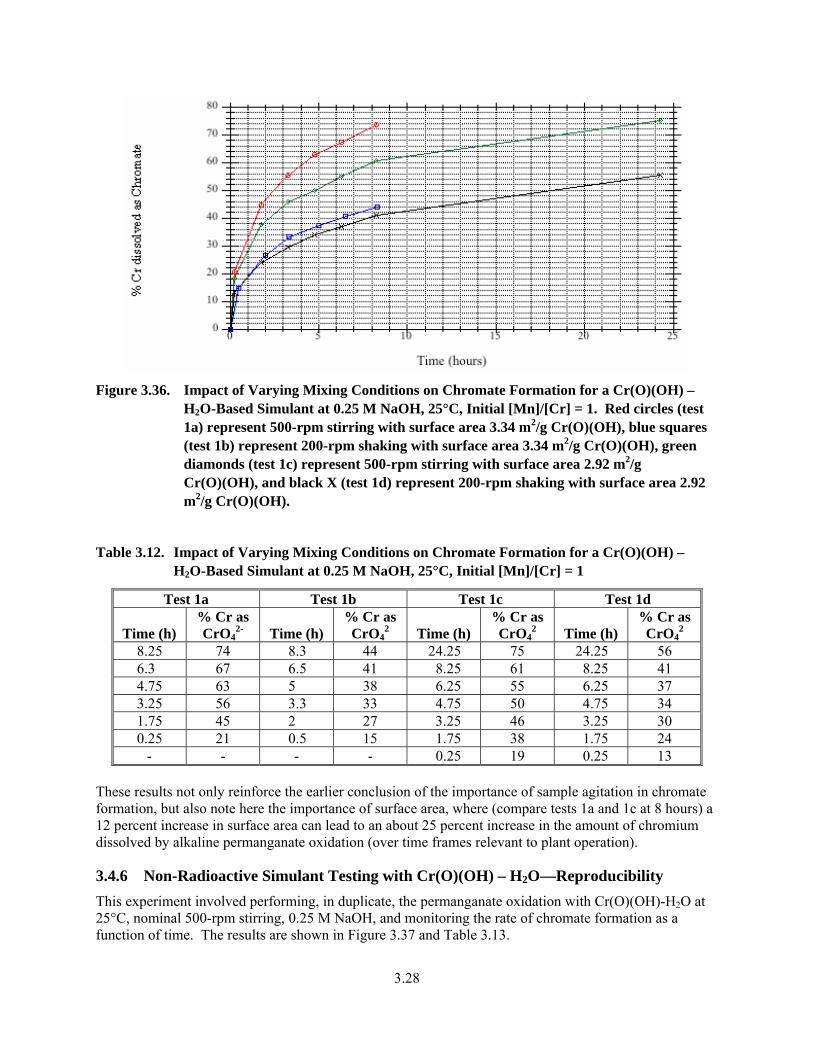
3.28
Figure 3.36. Impact of Varying Mixing Conditions on Chromate Formation for a Cr(O)(OH) –
H2O-Based Simulant at 0.25 M NaOH, 25°C, Initial [Mn]/[Cr] = 1. Red circles (test 1a) represent 500-rpm stirring with surface area 3.34 m2/g Cr(O)(OH), blue squares (test 1b) represent 200-rpm shaking with surface area 3.34 m2/g Cr(O)(OH), green diamonds (test 1c) represent 500-rpm stirring with surface area 2.92 m2/g Cr(O)(OH), and black X (test 1d) represent 200-rpm shaking with surface area 2.92 m2/g Cr(O)(OH).
Table 3.12. Impact of Varying Mixing Conditions on Chromate Formation for a Cr(O)(OH) – H2O-Based Simulant at 0.25 M NaOH, 25°C, Initial [Mn]/[Cr] = 1
Test 1a Test 1b Test 1c Test 1d
Time (h) % Cr as CrO4
2- Time (h) % Cr as CrO4
2 Time (h) % Cr as CrO4
2 Time (h) % Cr as CrO4
2 8.25 74 8.3 44 24.25 75 24.25 56 6.3 67 6.5 41 8.25 61 8.25 41 4.75 63 5 38 6.25 55 6.25 37 3.25 56 3.3 33 4.75 50 4.75 34 1.75 45 2 27 3.25 46 3.25 30 0.25 21 0.5 15 1.75 38 1.75 24
- - - - 0.25 19 0.25 13 These results not only reinforce the earlier conclusion of the importance of sample agitation in chromate formation, but also note here the importance of surface area, where (compare tests 1a and 1c at 8 hours) a 12 percent increase in surface area can lead to an about 25 percent increase in the amount of chromium dissolved by alkaline permanganate oxidation (over time frames relevant to plant operation).
3.4.6 Non-Radioactive Simulant Testing with Cr(O)(OH) – H2O—Reproducibility This experiment involved performing, in duplicate, the permanganate oxidation with Cr(O)(OH)-H2O at 25°C, nominal 500-rpm stirring, 0.25 M NaOH, and monitoring the rate of chromate formation as a function of time. The results are shown in Figure 3.37 and Table 3.13.
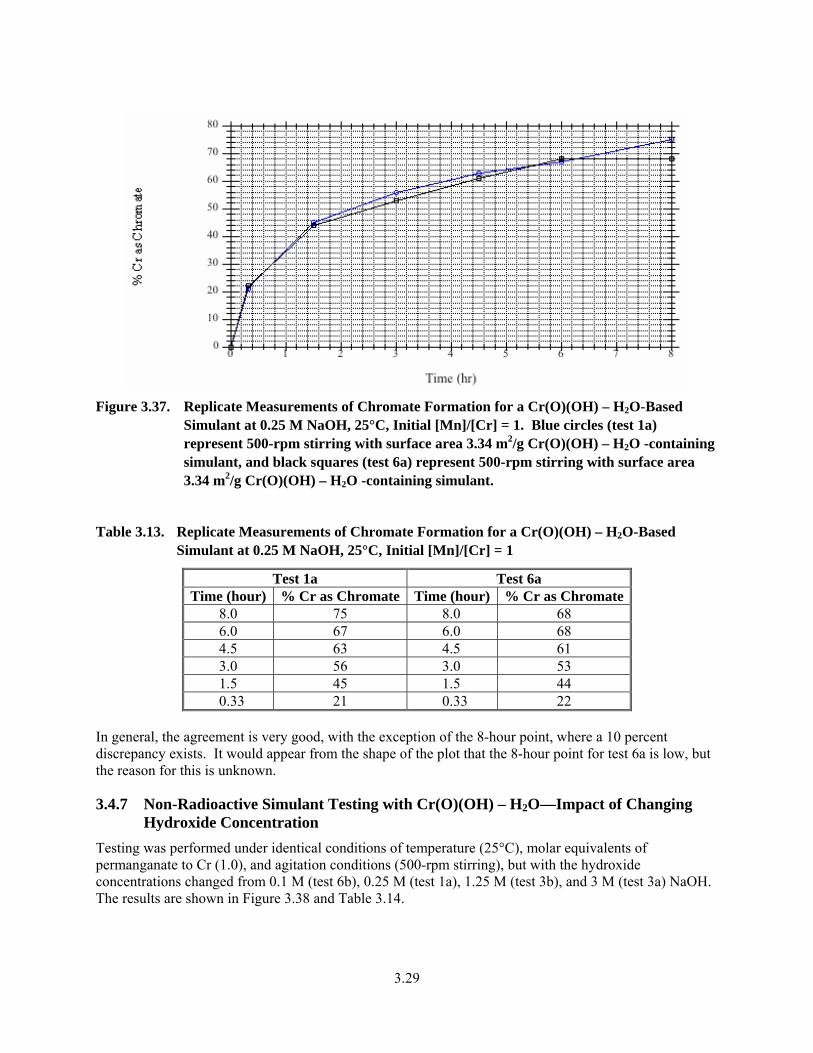
3.29
Figure 3.37. Replicate Measurements of Chromate Formation for a Cr(O)(OH) – H2O-Based
Simulant at 0.25 M NaOH, 25°C, Initial [Mn]/[Cr] = 1. Blue circles (test 1a) represent 500-rpm stirring with surface area 3.34 m2/g Cr(O)(OH) – H2O -containing simulant, and black squares (test 6a) represent 500-rpm stirring with surface area 3.34 m2/g Cr(O)(OH) – H2O -containing simulant.
Table 3.13. Replicate Measurements of Chromate Formation for a Cr(O)(OH) – H2O-Based Simulant at 0.25 M NaOH, 25°C, Initial [Mn]/[Cr] = 1
Test 1a Test 6a Time (hour) % Cr as Chromate Time (hour) % Cr as Chromate
8.0 75 8.0 68 6.0 67 6.0 68 4.5 63 4.5 61 3.0 56 3.0 53 1.5 45 1.5 44 0.33 21 0.33 22
In general, the agreement is very good, with the exception of the 8-hour point, where a 10 percent discrepancy exists. It would appear from the shape of the plot that the 8-hour point for test 6a is low, but the reason for this is unknown.
3.4.7 Non-Radioactive Simulant Testing with Cr(O)(OH) – H2O—Impact of Changing Hydroxide Concentration
Testing was performed under identical conditions of temperature (25°C), molar equivalents of permanganate to Cr (1.0), and agitation conditions (500-rpm stirring), but with the hydroxide concentrations changed from 0.1 M (test 6b), 0.25 M (test 1a), 1.25 M (test 3b), and 3 M (test 3a) NaOH. The results are shown in Figure 3.38 and Table 3.14.
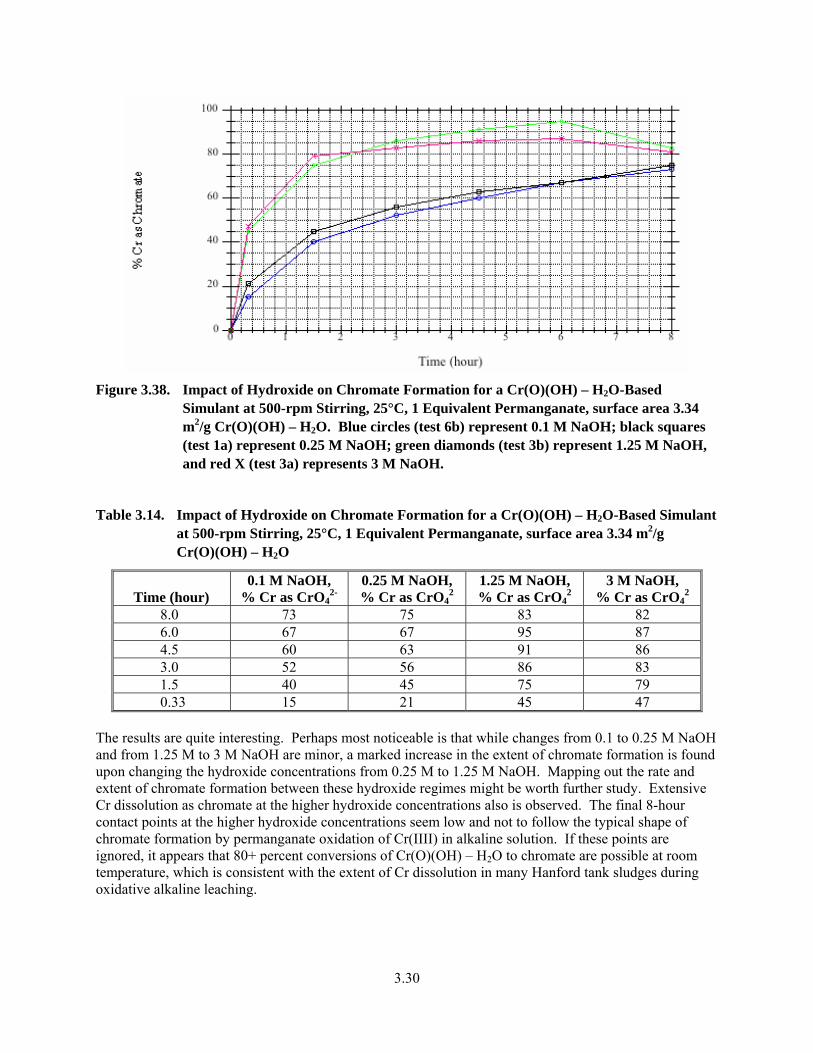
3.30
Figure 3.38. Impact of Hydroxide on Chromate Formation for a Cr(O)(OH) – H2O-Based
Simulant at 500-rpm Stirring, 25°C, 1 Equivalent Permanganate, surface area 3.34 m2/g Cr(O)(OH) – H2O. Blue circles (test 6b) represent 0.1 M NaOH; black squares (test 1a) represent 0.25 M NaOH; green diamonds (test 3b) represent 1.25 M NaOH, and red X (test 3a) represents 3 M NaOH.
Table 3.14. Impact of Hydroxide on Chromate Formation for a Cr(O)(OH) – H2O-Based Simulant at 500-rpm Stirring, 25°C, 1 Equivalent Permanganate, surface area 3.34 m2/g Cr(O)(OH) – H2O
Time (hour) 0.1 M NaOH,
% Cr as CrO42-
0.25 M NaOH, % Cr as CrO4
2 1.25 M NaOH, % Cr as CrO4
2 3 M NaOH,
% Cr as CrO42
8.0 73 75 83 82 6.0 67 67 95 87 4.5 60 63 91 86 3.0 52 56 86 83 1.5 40 45 75 79 0.33 15 21 45 47
The results are quite interesting. Perhaps most noticeable is that while changes from 0.1 to 0.25 M NaOH and from 1.25 M to 3 M NaOH are minor, a marked increase in the extent of chromate formation is found upon changing the hydroxide concentrations from 0.25 M to 1.25 M NaOH. Mapping out the rate and extent of chromate formation between these hydroxide regimes might be worth further study. Extensive Cr dissolution as chromate at the higher hydroxide concentrations also is observed. The final 8-hour contact points at the higher hydroxide concentrations seem low and not to follow the typical shape of chromate formation by permanganate oxidation of Cr(IIII) in alkaline solution. If these points are ignored, it appears that 80+ percent conversions of Cr(O)(OH) – H2O to chromate are possible at room temperature, which is consistent with the extent of Cr dissolution in many Hanford tank sludges during oxidative alkaline leaching.
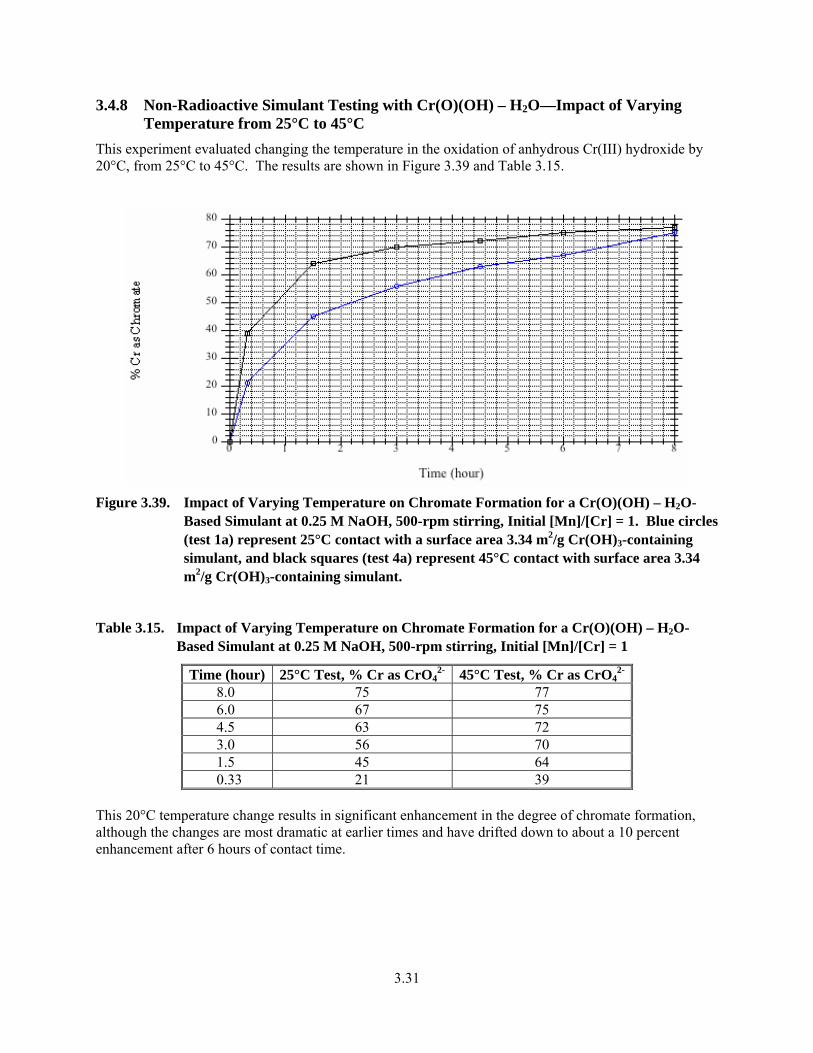
3.31
3.4.8 Non-Radioactive Simulant Testing with Cr(O)(OH) – H2O—Impact of Varying Temperature from 25°C to 45°C
This experiment evaluated changing the temperature in the oxidation of anhydrous Cr(III) hydroxide by 20°C, from 25°C to 45°C. The results are shown in Figure 3.39 and Table 3.15.
Figure 3.39. Impact of Varying Temperature on Chromate Formation for a Cr(O)(OH) – H2O-
Based Simulant at 0.25 M NaOH, 500-rpm stirring, Initial [Mn]/[Cr] = 1. Blue circles (test 1a) represent 25°C contact with a surface area 3.34 m2/g Cr(OH)3-containing simulant, and black squares (test 4a) represent 45°C contact with surface area 3.34 m2/g Cr(OH)3-containing simulant.
Table 3.15. Impact of Varying Temperature on Chromate Formation for a Cr(O)(OH) – H2O-Based Simulant at 0.25 M NaOH, 500-rpm stirring, Initial [Mn]/[Cr] = 1
Time (hour) 25°C Test, % Cr as CrO42- 45°C Test, % Cr as CrO4
2- 8.0 75 77 6.0 67 75 4.5 63 72 3.0 56 70 1.5 45 64 0.33 21 39
This 20°C temperature change results in significant enhancement in the degree of chromate formation, although the changes are most dramatic at earlier times and have drifted down to about a 10 percent enhancement after 6 hours of contact time.
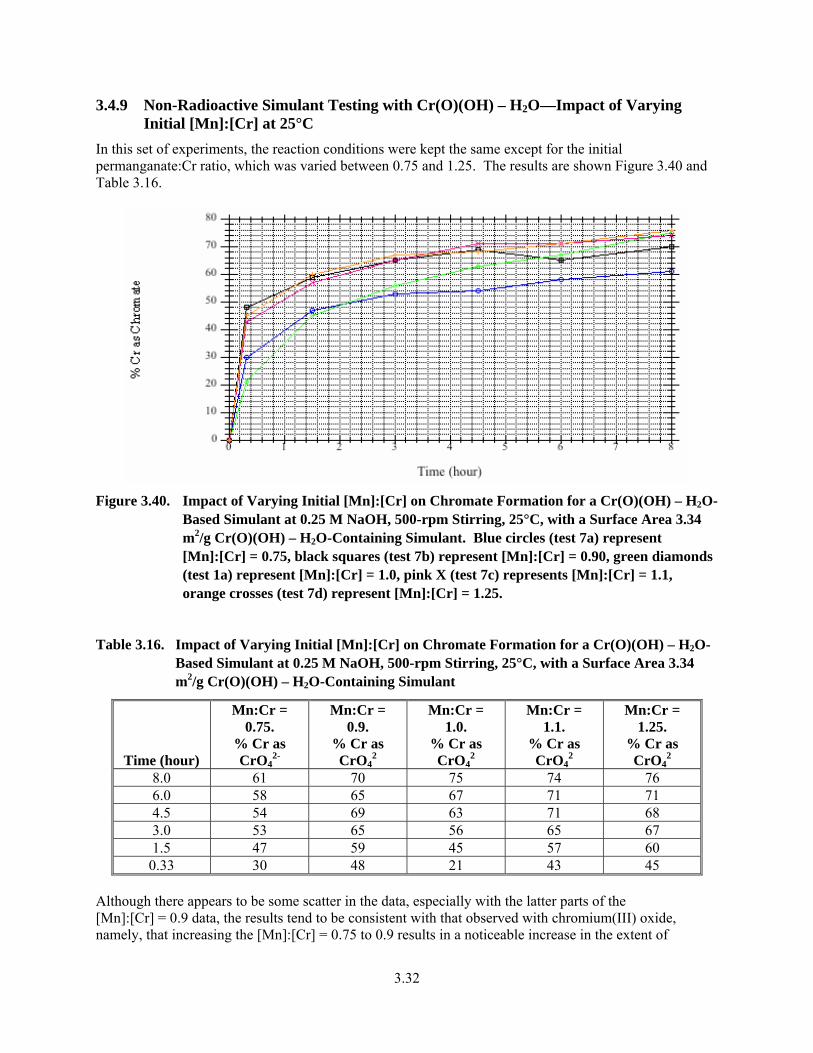
3.32
3.4.9 Non-Radioactive Simulant Testing with Cr(O)(OH) – H2O—Impact of Varying Initial [Mn]:[Cr] at 25°C
In this set of experiments, the reaction conditions were kept the same except for the initial permanganate:Cr ratio, which was varied between 0.75 and 1.25. The results are shown Figure 3.40 and Table 3.16.
Figure 3.40. Impact of Varying Initial [Mn]:[Cr] on Chromate Formation for a Cr(O)(OH) – H2O-
Based Simulant at 0.25 M NaOH, 500-rpm Stirring, 25°C, with a Surface Area 3.34 m2/g Cr(O)(OH) – H2O-Containing Simulant. Blue circles (test 7a) represent [Mn]:[Cr] = 0.75, black squares (test 7b) represent [Mn]:[Cr] = 0.90, green diamonds (test 1a) represent [Mn]:[Cr] = 1.0, pink X (test 7c) represents [Mn]:[Cr] = 1.1, orange crosses (test 7d) represent [Mn]:[Cr] = 1.25.
Table 3.16. Impact of Varying Initial [Mn]:[Cr] on Chromate Formation for a Cr(O)(OH) – H2O-Based Simulant at 0.25 M NaOH, 500-rpm Stirring, 25°C, with a Surface Area 3.34 m2/g Cr(O)(OH) – H2O-Containing Simulant
Time (hour)
Mn:Cr = 0.75.
% Cr as CrO4
2-
Mn:Cr = 0.9.
% Cr as CrO4
2
Mn:Cr = 1.0.
% Cr as CrO4
2
Mn:Cr = 1.1.
% Cr as CrO4
2
Mn:Cr = 1.25.
% Cr as CrO4
2 8.0 61 70 75 74 76 6.0 58 65 67 71 71 4.5 54 69 63 71 68 3.0 53 65 56 65 67 1.5 47 59 45 57 60
0.33 30 48 21 43 45 Although there appears to be some scatter in the data, especially with the latter parts of the [Mn]:[Cr] = 0.9 data, the results tend to be consistent with that observed with chromium(III) oxide, namely, that increasing the [Mn]:[Cr] = 0.75 to 0.9 results in a noticeable increase in the extent of
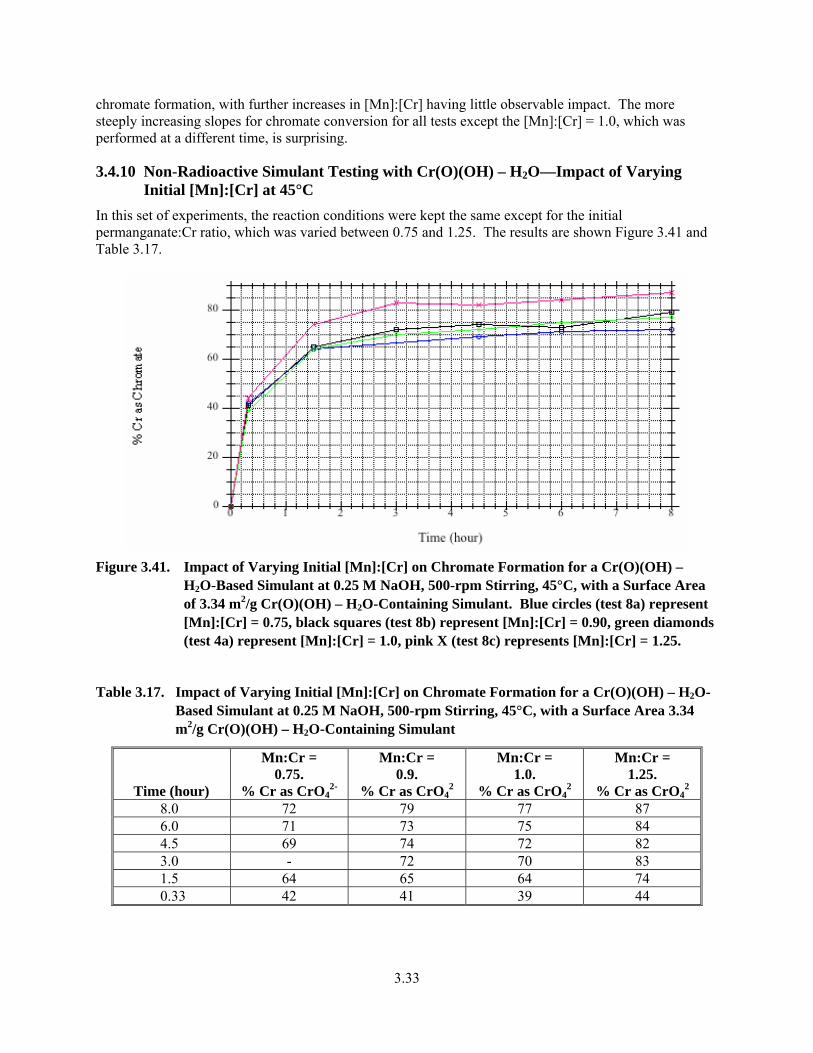
3.33
chromate formation, with further increases in [Mn]:[Cr] having little observable impact. The more steeply increasing slopes for chromate conversion for all tests except the [Mn]:[Cr] = 1.0, which was performed at a different time, is surprising.
3.4.10 Non-Radioactive Simulant Testing with Cr(O)(OH) – H2O—Impact of Varying Initial [Mn]:[Cr] at 45°C
In this set of experiments, the reaction conditions were kept the same except for the initial permanganate:Cr ratio, which was varied between 0.75 and 1.25. The results are shown Figure 3.41 and Table 3.17.
Figure 3.41. Impact of Varying Initial [Mn]:[Cr] on Chromate Formation for a Cr(O)(OH) –
H2O-Based Simulant at 0.25 M NaOH, 500-rpm Stirring, 45°C, with a Surface Area of 3.34 m2/g Cr(O)(OH) – H2O-Containing Simulant. Blue circles (test 8a) represent [Mn]:[Cr] = 0.75, black squares (test 8b) represent [Mn]:[Cr] = 0.90, green diamonds (test 4a) represent [Mn]:[Cr] = 1.0, pink X (test 8c) represents [Mn]:[Cr] = 1.25.
Table 3.17. Impact of Varying Initial [Mn]:[Cr] on Chromate Formation for a Cr(O)(OH) – H2O-Based Simulant at 0.25 M NaOH, 500-rpm Stirring, 45°C, with a Surface Area 3.34 m2/g Cr(O)(OH) – H2O-Containing Simulant
Time (hour)
Mn:Cr = 0.75.
% Cr as CrO42-
Mn:Cr = 0.9.
% Cr as CrO42
Mn:Cr = 1.0.
% Cr as CrO42
Mn:Cr = 1.25.
% Cr as CrO42
8.0 72 79 77 87 6.0 71 73 75 84 4.5 69 74 72 82 3.0 - 72 70 83 1.5 64 65 64 74 0.33 42 41 39 44
3.34
Here, a finding similar to the other [Mn]:[Cr] studies is observed in that one set of conditions has a marked difference than the others, but for these experiments, it is the highest, [Mn]:[Cr] = 1.25, that is different and markedly higher than the other [Mn]:[Cr] ratios. The reason for this differing behavior is unknown. The work with the cold simulant reveals several important design features to incorporate and/or verify with the full radioactive simulant. One striking feature was how, with both Cr(III) oxide at 80°C or Cr(O)(OH) – H2O at 23°C, the manner of agitation affected the oxidation of Cr. Over an 8-hr contact time, an approximately 60 percent enhancement in the extent of Cr(O)(OH) – H2O dissolution and an approximately 40 percent enhancement in the extent Cr(III) oxide dissolution was observed as a function of the type of sample agitation employed. The influence of temperature (45 vs. 25°C) depended strikingly on the material examined, with a 120-percent increase in chromate formation over an 8-hr time frame observed for chromium(III) oxide, but with almost no change for the Cr(O)(OH) – H2O. It should be noted that larger differences were observed for Cr(O)(OH) – H2O over shorter reaction times. Hydroxide concentration also has an impact, with about a 20-percent enhancement being observed over 8 hours from 0.25 versus 3 M NaOH. Cr(O)(OH) – H2O is rather interesting, with, like temperature, only a small, about 10-percent increase being observed from 0.1 to 3 M NaOH over an 8-hr time frame but with much greater changes being observed over shorter time frames. The changes with respect to hydroxide concentration appear non-linear, with little change being observed from 0.1 to 0.25 M or from 1.25 to 3 M NaOH, with a much larger change being observed from 0.25 to 1.25 M. As might be expected, the initial [Mn]:[Cr] ratio appears important up to near the stoichiometric ratio of 1:1. Above about a ratio of 0.9 and with either chromium(III) oxide or Cr(O)(OH) – H2O, little further increase in chromate oxidation was observed over the entire 8-hr time frame. The exception to this statement appears to be Cr(O)(OH) – H2O contacted at 45°Ç, where excess permanganate does appear to somewhat enhance Cr oxidation. Although we have limited information, the surface area of the material does impact the extent and rate of chromium oxidation. Over an 8-hr time frame, a 12-percent enhancement in the surface area of Cr(O)(OH) – H2O led to a 25-percent increase in chromium oxidation. In short, the features that might be expected to impact a solid-liquid reaction, the solid’s surface area, the manner of agitation, the temperature, and the hydroxide concentration, all participate, albeit to varying extents, in the degree of chromium oxidation by permanganate in alkaline solutions over a given time frame. Information was collected in these tests concerning three phases of Cr, Cr(OH)3-xH2O, Cr(O)(OH)-H2O, and Cr2O3 and influenced the choice of the Cr source used for the radioactive simulant testing described below. The rate of the chromium(III) oxide was judged to be too slow at lower temperatures, and the Cr(OH)3-xH2O (Figure 3.31) was judged to be too rapid. Cr(O)(OH)-xH2O seemed to provide good intermediate performance and so was selected as the source of leachable Cr for the radioactive simulant testing described below.
3.35
3.5 Oxidative Alkaline Leaching with Radioactive Simulant With most of the variables explored with respect to Cr dissolution with the non-radioactive simulants, it was time to examine a full, radioactive simulant, not only for Cr dissolution, but for potential dissolution of a variety of radioactive and non-radioactive components of importance to criticality-safety. Such a study is the focus of the following section. The radioactive simulant composition is provided above in Table 2.4.
3.5.1 Experimental Design These tests were meant to approximate the steps proposed for sludge leaching at the WTP plant. The reaction steps involved were first, an eight hour contact at 85°C with a target hydroxide concentration of 3 M with a leaching ratio of 3 parts by volume leachate to 1 part by volume settled sludge. Because of the radioactive nature of these tests, these tests were performed in closed 60-mL polyethylene bottles to which the required amounts of approximately 10 M NaOH and water were added. These slurries were agitated in a heated rotary shaker set at 200 rpm. At the conclusion of the reaction time (8 h), the slurries were allowed to cool; they were then centrifuged and the liquids separated by decantation. The decanted liquid was then sampled for determination of its free hydroxide content; the hydroxide concentrations that were found are summarized in Table 3.18.
Table 3.18. Targeted and Found Hydroxide Concentration for Caustic Leaching
Test # Targeted [OH], M Measured [OH], M9a 3 2.32 9b 3 2.14 9c 3 2.12
10a 3 2.22 10b 3 2.19 10c 3 2.12
The measured free [OH-] concentrations after caustic leaching were consistent for all test samples but were about 25 percent less than the initial target concentrations of 3 M. Given the absence of leachable materials (e.g., aluminum phases) that would be expected to consume hydroxide ion, the reason for the low free OH- concentrations is puzzling, and no satisfactory explanation is apparent at present. An alternative method for estimating the hydroxide concentration therefore was undertaken. This method involves taking the measured Na concentrations and removing the amount of Na added by the 0.1-M hydroxide wash steps. This calculation can be done by taking the known measured Na concentrations of the wash and leach solutions and calculating the total mass of sodium present in the test. The initial targeted reaction volume (assuming no contribution by the suspended solids) is then subtracted from the volume of the leachate and washes to get the Na mass in the leachate itself. Converting the mass of sodium present in the leachate to moles of sodium and dividing by the leachate volume yields the calculated hydroxide concentration in the leachate. The result of these calculations indicated that the caustic leach concentrations of all the solutions were around 2.7 M NaOH, somewhat closer to the expected targeted NaOH concentration. The target for the amount of insoluble sludge solids was 6 grams/test. The oxidative leach targeted a total volume of 30 mL, for a concentration of 20 percent insoluble solids. Water, 9.55 M NaOH and approximately 1 M NaMnO4 in water were added in the quantities required to give the targeted test conditions listed in Table 3.19.
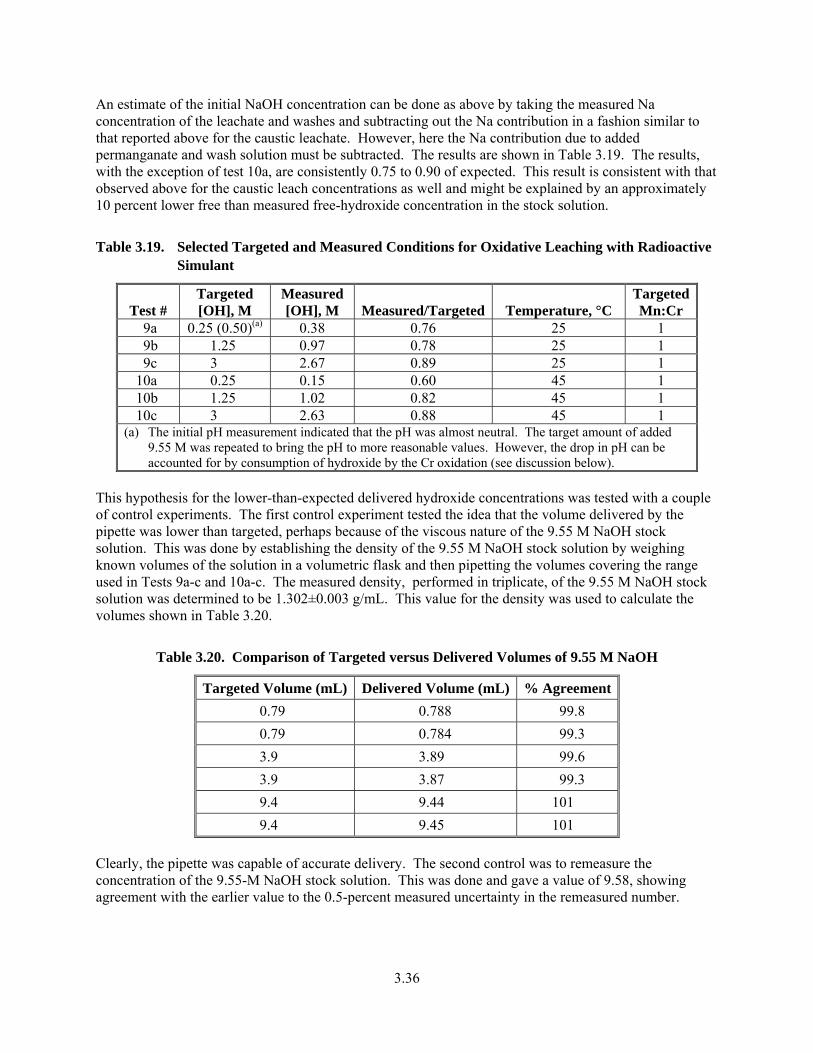
3.36
An estimate of the initial NaOH concentration can be done as above by taking the measured Na concentration of the leachate and washes and subtracting out the Na contribution in a fashion similar to that reported above for the caustic leachate. However, here the Na contribution due to added permanganate and wash solution must be subtracted. The results are shown in Table 3.19. The results, with the exception of test 10a, are consistently 0.75 to 0.90 of expected. This result is consistent with that observed above for the caustic leach concentrations as well and might be explained by an approximately 10 percent lower free than measured free-hydroxide concentration in the stock solution.
Table 3.19. Selected Targeted and Measured Conditions for Oxidative Leaching with Radioactive Simulant
Test # Targeted [OH], M
Measured [OH], M Measured/Targeted Temperature, °C
Targeted Mn:Cr
9a 0.25 (0.50)(a) 0.38 0.76 25 1 9b 1.25 0.97 0.78 25 1 9c 3 2.67 0.89 25 1
10a 0.25 0.15 0.60 45 1 10b 1.25 1.02 0.82 45 1 10c 3 2.63 0.88 45 1
(a) The initial pH measurement indicated that the pH was almost neutral. The target amount of added 9.55 M was repeated to bring the pH to more reasonable values. However, the drop in pH can be accounted for by consumption of hydroxide by the Cr oxidation (see discussion below).
This hypothesis for the lower-than-expected delivered hydroxide concentrations was tested with a couple of control experiments. The first control experiment tested the idea that the volume delivered by the pipette was lower than targeted, perhaps because of the viscous nature of the 9.55 M NaOH stock solution. This was done by establishing the density of the 9.55 M NaOH stock solution by weighing known volumes of the solution in a volumetric flask and then pipetting the volumes covering the range used in Tests 9a-c and 10a-c. The measured density, performed in triplicate, of the 9.55 M NaOH stock solution was determined to be 1.302±0.003 g/mL. This value for the density was used to calculate the volumes shown in Table 3.20.
Table 3.20. Comparison of Targeted versus Delivered Volumes of 9.55 M NaOH
Targeted Volume (mL) Delivered Volume (mL) % Agreement 0.79 0.788 99.8 0.79 0.784 99.3 3.9 3.89 99.6 3.9 3.87 99.3 9.4 9.44 101 9.4 9.45 101
Clearly, the pipette was capable of accurate delivery. The second control was to remeasure the concentration of the 9.55-M NaOH stock solution. This was done and gave a value of 9.58, showing agreement with the earlier value to the 0.5-percent measured uncertainty in the remeasured number.
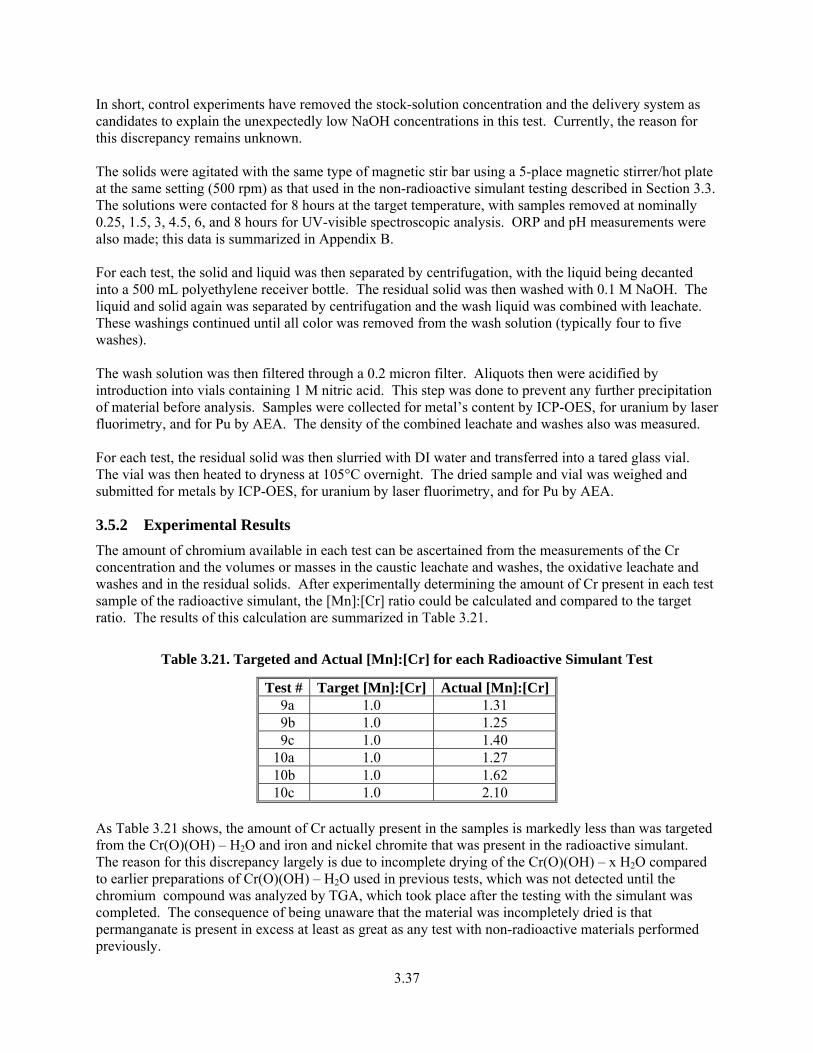
3.37
In short, control experiments have removed the stock-solution concentration and the delivery system as candidates to explain the unexpectedly low NaOH concentrations in this test. Currently, the reason for this discrepancy remains unknown. The solids were agitated with the same type of magnetic stir bar using a 5-place magnetic stirrer/hot plate at the same setting (500 rpm) as that used in the non-radioactive simulant testing described in Section 3.3. The solutions were contacted for 8 hours at the target temperature, with samples removed at nominally 0.25, 1.5, 3, 4.5, 6, and 8 hours for UV-visible spectroscopic analysis. ORP and pH measurements were also made; this data is summarized in Appendix B. For each test, the solid and liquid was then separated by centrifugation, with the liquid being decanted into a 500 mL polyethylene receiver bottle. The residual solid was then washed with 0.1 M NaOH. The liquid and solid again was separated by centrifugation and the wash liquid was combined with leachate. These washings continued until all color was removed from the wash solution (typically four to five washes). The wash solution was then filtered through a 0.2 micron filter. Aliquots then were acidified by introduction into vials containing 1 M nitric acid. This step was done to prevent any further precipitation of material before analysis. Samples were collected for metal’s content by ICP-OES, for uranium by laser fluorimetry, and for Pu by AEA. The density of the combined leachate and washes also was measured. For each test, the residual solid was then slurried with DI water and transferred into a tared glass vial. The vial was then heated to dryness at 105°C overnight. The dried sample and vial was weighed and submitted for metals by ICP-OES, for uranium by laser fluorimetry, and for Pu by AEA.
3.5.2 Experimental Results The amount of chromium available in each test can be ascertained from the measurements of the Cr concentration and the volumes or masses in the caustic leachate and washes, the oxidative leachate and washes and in the residual solids. After experimentally determining the amount of Cr present in each test sample of the radioactive simulant, the [Mn]:[Cr] ratio could be calculated and compared to the target ratio. The results of this calculation are summarized in Table 3.21.
Table 3.21. Targeted and Actual [Mn]:[Cr] for each Radioactive Simulant Test
Test # Target [Mn]:[Cr] Actual [Mn]:[Cr]9a 1.0 1.31 9b 1.0 1.25 9c 1.0 1.40
10a 1.0 1.27 10b 1.0 1.62 10c 1.0 2.10
As Table 3.21 shows, the amount of Cr actually present in the samples is markedly less than was targeted from the Cr(O)(OH) – H2O and iron and nickel chromite that was present in the radioactive simulant. The reason for this discrepancy largely is due to incomplete drying of the Cr(O)(OH) – x H2O compared to earlier preparations of Cr(O)(OH) – H2O used in previous tests, which was not detected until the chromium compound was analyzed by TGA, which took place after the testing with the simulant was completed. The consequence of being unaware that the material was incompletely dried is that permanganate is present in excess at least as great as any test with non-radioactive materials performed previously.
3.38
The tests were designed to examine hydroxide variability at two temperatures (25°C and 45°C). However, the tests targeted to be initially 0.25 M did differ in the amount of added base. The pH of the solutions as reported in Appendix B was remarkably low for test 9a, which was performed first. To increase the measured pH to closer to the value expected for a 0.25-M initial solution, additional concentrated NaOH was added. However, later calculation indicates that approximately 0.37 M hydroxide would be consumed if the all of the leachable Cr were oxidized with the consumption of 1 equivalent of hydroxide. A rapid consumption of hydroxide explains the low pH values found for the 0.25-M initial hydroxide solution even for the earliest measurement and why the pH values differ so for the 9a and 10a tests. For the remaining experiments, sufficient hydroxide is present so that a pH measurement could not detect any similar consumption of hydroxide.
3.5.3 Rate of Chromate Formation For all tests involving the radioactive simulant, aliquots were taken at approximately 0.25-, 1.5-, 3-, 4.5-, 6-, and 8-hour intervals and analyzed by visible spectroscopy. The results are plotted in Figure 3.42 and Figure 3.43 as the percent of the Cr in the test sample that was found in solution as chromate ion. Table 3.23 and Table 3.24 summarize the data in tabular form.
Figure 3.42. The Extent of Total Cr as Chromate as a Function of Time During Oxidative Alkaline
Leaching of the Radioactive Simulant at 25°C. Legend: [NaOH] = 0.25 M (red circles –Test 9a), 1.25 M (blue squares –Test 9b) and 3 M (green diamonds –Test 9c).
Table 3.22. The Extent of Total Cr as Chromate as a Function of Time During Oxidative Alkaline Leaching of the Radioactive Simulant at 25°C
Nominal Time (h) Test 9a Test 9b Test 9c 8 65 73 77 6 71 75 73 4.5 72 77 76 3 67 74 74 1.5 69 73 74 0.25 74 68 68
3.39
Figure 3.43. The Extent of Total Cr as Chromate as a Function of Time During Oxidative
Alkaline Leaching of the Radioactive Simulant at 45°C. Legend [NaOH] = 0.25 M (red circles – Test 10a), 1.25 M (blue squares – Test 10b), and 3 M (green diamonds – Test 10c).
Table 3.23. The Extent of Total Cr as Chromate as a Function of Time During Oxidative Alkaline Leaching of the Radioactive Simulant at 45°C
Nominal Time (h) Test 10a Test 10b Test 10c8 64 65 86 6 64 77 82 4.5 66 78 86 3 66 79 82 1.5 62 79 83 0.25 54 70 74
The observed absorbance at 372 nm required correction for the presence of the large excess of manganate because of the higher-than-targeted [Mn]:[Cr] ratios used in these tests. The presence of manganate ion is clearly indicated by the 607 absorbance in the visual spectra: a typical set of spectra is shown in Figure 3.44.
3.5.4 Major Radioactive and Non-Radioactive Component Dissolution From the ICP-OES, AEA, and KPA data, the extent to which the key components reported to the caustic leachate, the oxidative leachate, and the residual solids can be ascertained. These results are summarized in Table 3.24 through Table 3.29.
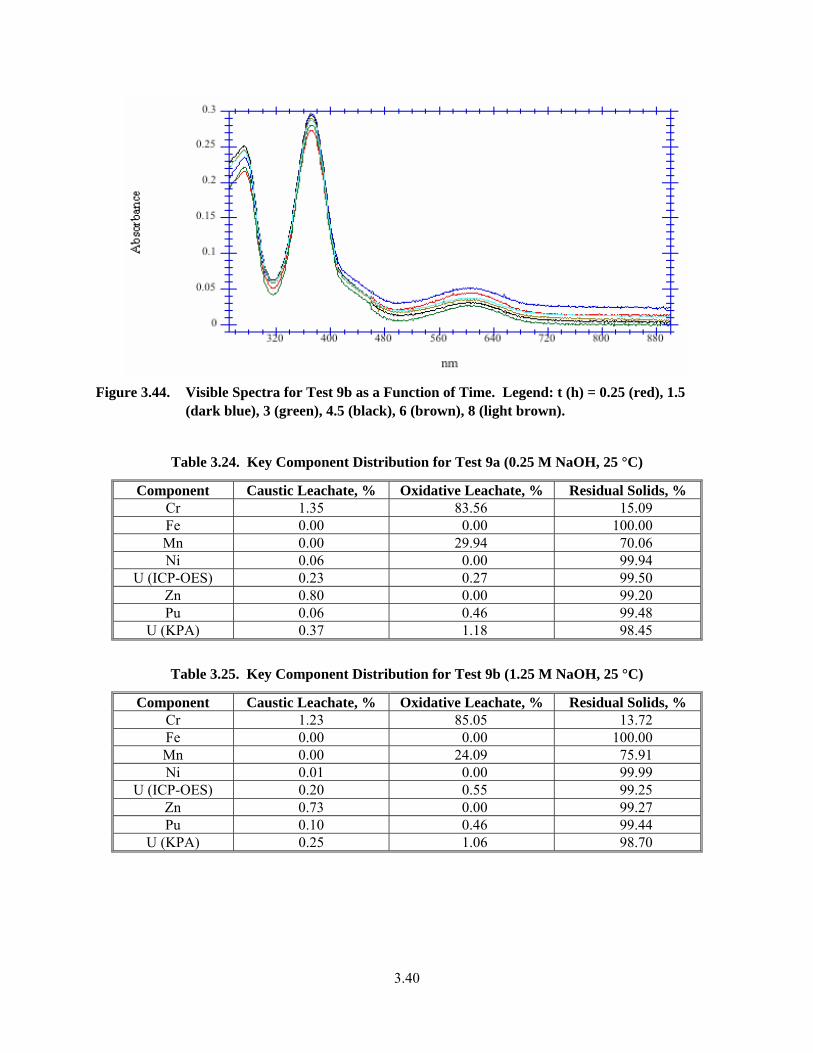
3.40
Figure 3.44. Visible Spectra for Test 9b as a Function of Time. Legend: t (h) = 0.25 (red), 1.5
(dark blue), 3 (green), 4.5 (black), 6 (brown), 8 (light brown).
Table 3.24. Key Component Distribution for Test 9a (0.25 M NaOH, 25 °C)
Component Caustic Leachate, % Oxidative Leachate, % Residual Solids, % Cr 1.35 83.56 15.09 Fe 0.00 0.00 100.00 Mn 0.00 29.94 70.06 Ni 0.06 0.00 99.94
U (ICP-OES) 0.23 0.27 99.50 Zn 0.80 0.00 99.20 Pu 0.06 0.46 99.48
U (KPA) 0.37 1.18 98.45
Table 3.25. Key Component Distribution for Test 9b (1.25 M NaOH, 25 °C)
Component Caustic Leachate, % Oxidative Leachate, % Residual Solids, % Cr 1.23 85.05 13.72 Fe 0.00 0.00 100.00 Mn 0.00 24.09 75.91 Ni 0.01 0.00 99.99
U (ICP-OES) 0.20 0.55 99.25 Zn 0.73 0.00 99.27 Pu 0.10 0.46 99.44
U (KPA) 0.25 1.06 98.70
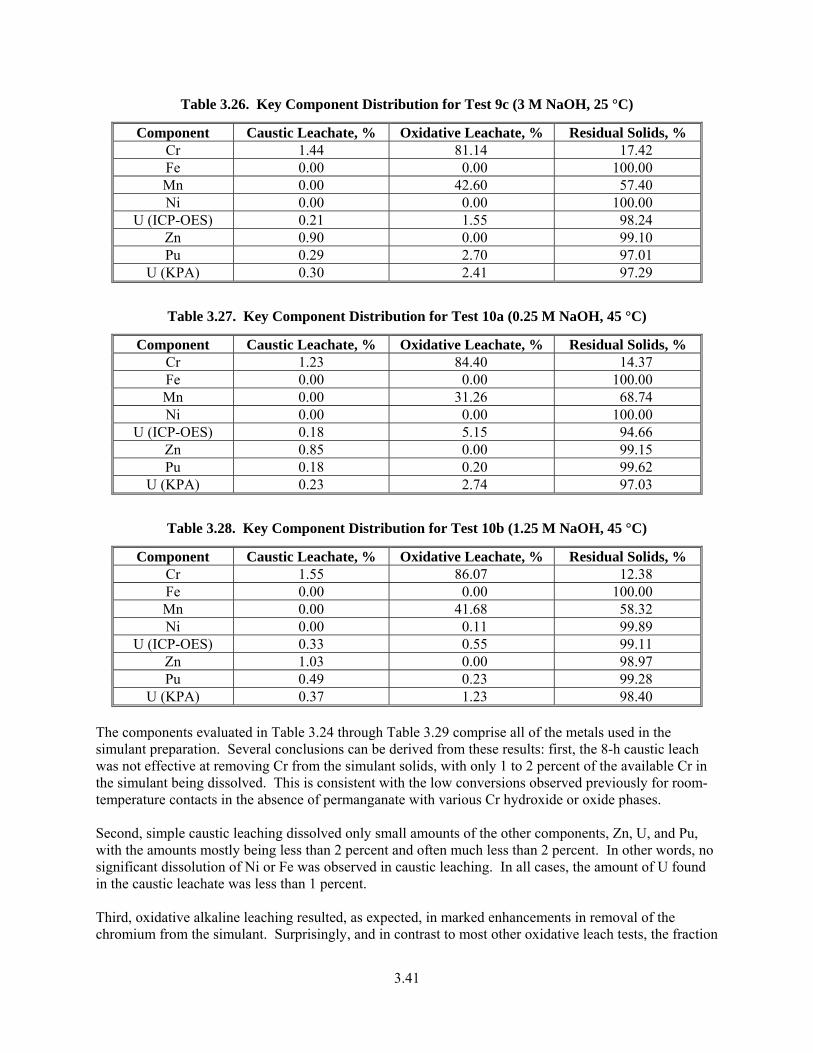
3.41
Table 3.26. Key Component Distribution for Test 9c (3 M NaOH, 25 °C)
Component Caustic Leachate, % Oxidative Leachate, % Residual Solids, % Cr 1.44 81.14 17.42 Fe 0.00 0.00 100.00 Mn 0.00 42.60 57.40 Ni 0.00 0.00 100.00
U (ICP-OES) 0.21 1.55 98.24 Zn 0.90 0.00 99.10 Pu 0.29 2.70 97.01
U (KPA) 0.30 2.41 97.29
Table 3.27. Key Component Distribution for Test 10a (0.25 M NaOH, 45 °C)
Component Caustic Leachate, % Oxidative Leachate, % Residual Solids, % Cr 1.23 84.40 14.37 Fe 0.00 0.00 100.00 Mn 0.00 31.26 68.74 Ni 0.00 0.00 100.00
U (ICP-OES) 0.18 5.15 94.66 Zn 0.85 0.00 99.15 Pu 0.18 0.20 99.62
U (KPA) 0.23 2.74 97.03
Table 3.28. Key Component Distribution for Test 10b (1.25 M NaOH, 45 °C)
Component Caustic Leachate, % Oxidative Leachate, % Residual Solids, % Cr 1.55 86.07 12.38 Fe 0.00 0.00 100.00 Mn 0.00 41.68 58.32 Ni 0.00 0.11 99.89
U (ICP-OES) 0.33 0.55 99.11 Zn 1.03 0.00 98.97 Pu 0.49 0.23 99.28
U (KPA) 0.37 1.23 98.40 The components evaluated in Table 3.24 through Table 3.29 comprise all of the metals used in the simulant preparation. Several conclusions can be derived from these results: first, the 8-h caustic leach was not effective at removing Cr from the simulant solids, with only 1 to 2 percent of the available Cr in the simulant being dissolved. This is consistent with the low conversions observed previously for room-temperature contacts in the absence of permanganate with various Cr hydroxide or oxide phases. Second, simple caustic leaching dissolved only small amounts of the other components, Zn, U, and Pu, with the amounts mostly being less than 2 percent and often much less than 2 percent. In other words, no significant dissolution of Ni or Fe was observed in caustic leaching. In all cases, the amount of U found in the caustic leachate was less than 1 percent. Third, oxidative alkaline leaching resulted, as expected, in marked enhancements in removal of the chromium from the simulant. Surprisingly, and in contrast to most other oxidative leach tests, the fraction
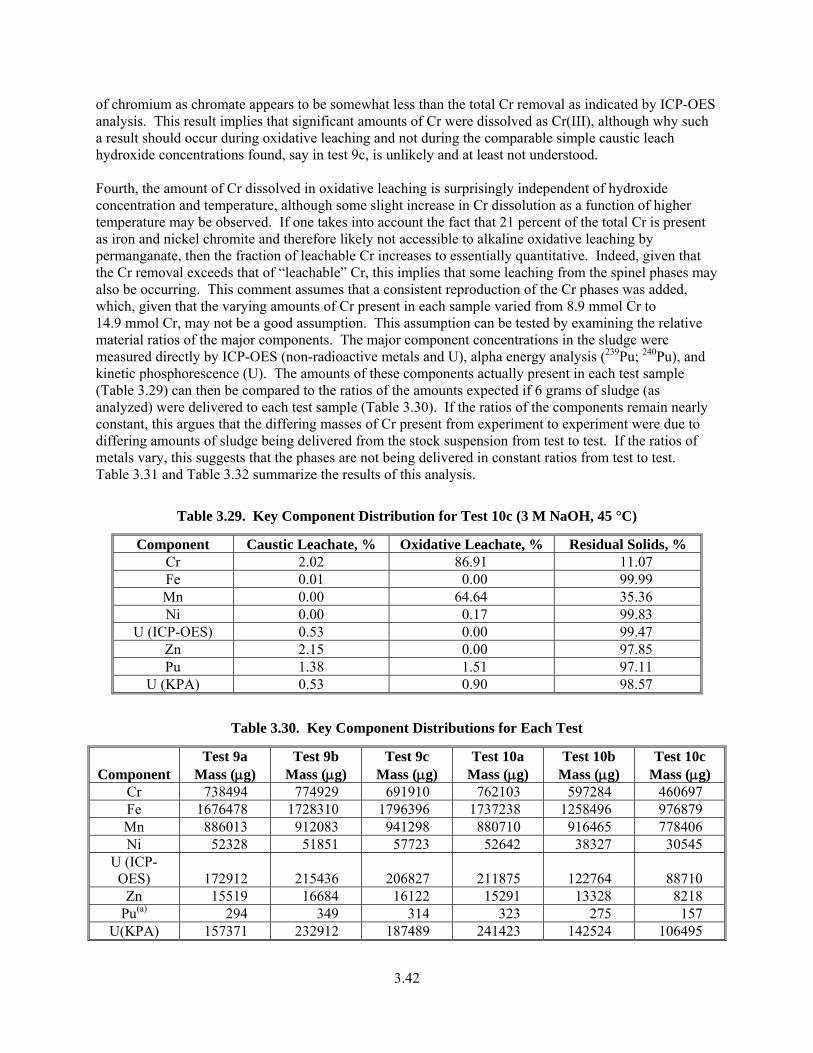
3.42
of chromium as chromate appears to be somewhat less than the total Cr removal as indicated by ICP-OES analysis. This result implies that significant amounts of Cr were dissolved as Cr(III), although why such a result should occur during oxidative leaching and not during the comparable simple caustic leach hydroxide concentrations found, say in test 9c, is unlikely and at least not understood. Fourth, the amount of Cr dissolved in oxidative leaching is surprisingly independent of hydroxide concentration and temperature, although some slight increase in Cr dissolution as a function of higher temperature may be observed. If one takes into account the fact that 21 percent of the total Cr is present as iron and nickel chromite and therefore likely not accessible to alkaline oxidative leaching by permanganate, then the fraction of leachable Cr increases to essentially quantitative. Indeed, given that the Cr removal exceeds that of “leachable” Cr, this implies that some leaching from the spinel phases may also be occurring. This comment assumes that a consistent reproduction of the Cr phases was added, which, given that the varying amounts of Cr present in each sample varied from 8.9 mmol Cr to 14.9 mmol Cr, may not be a good assumption. This assumption can be tested by examining the relative material ratios of the major components. The major component concentrations in the sludge were measured directly by ICP-OES (non-radioactive metals and U), alpha energy analysis (239Pu; 240Pu), and kinetic phosphorescence (U). The amounts of these components actually present in each test sample (Table 3.29) can then be compared to the ratios of the amounts expected if 6 grams of sludge (as analyzed) were delivered to each test sample (Table 3.30). If the ratios of the components remain nearly constant, this argues that the differing masses of Cr present from experiment to experiment were due to differing amounts of sludge being delivered from the stock suspension from test to test. If the ratios of metals vary, this suggests that the phases are not being delivered in constant ratios from test to test. Table 3.31 and Table 3.32 summarize the results of this analysis.
Table 3.29. Key Component Distribution for Test 10c (3 M NaOH, 45 °C)
Component Caustic Leachate, % Oxidative Leachate, % Residual Solids, % Cr 2.02 86.91 11.07 Fe 0.01 0.00 99.99 Mn 0.00 64.64 35.36 Ni 0.00 0.17 99.83
U (ICP-OES) 0.53 0.00 99.47 Zn 2.15 0.00 97.85 Pu 1.38 1.51 97.11
U (KPA) 0.53 0.90 98.57
Table 3.30. Key Component Distributions for Each Test
Component Test 9a
Mass (μg) Test 9b
Mass (μg) Test 9c
Mass (μg) Test 10a
Mass (μg) Test 10b
Mass (μg) Test 10c
Mass (μg) Cr 738494 774929 691910 762103 597284 460697 Fe 1676478 1728310 1796396 1737238 1258496 976879 Mn 886013 912083 941298 880710 916465 778406 Ni 52328 51851 57723 52642 38327 30545
U (ICP-OES) 172912 215436 206827 211875 122764 88710
Zn 15519 16684 16122 15291 13328 8218 Pu(a) 294 349 314 323 275 157
U(KPA) 157371 232912 187489 241423 142524 106495
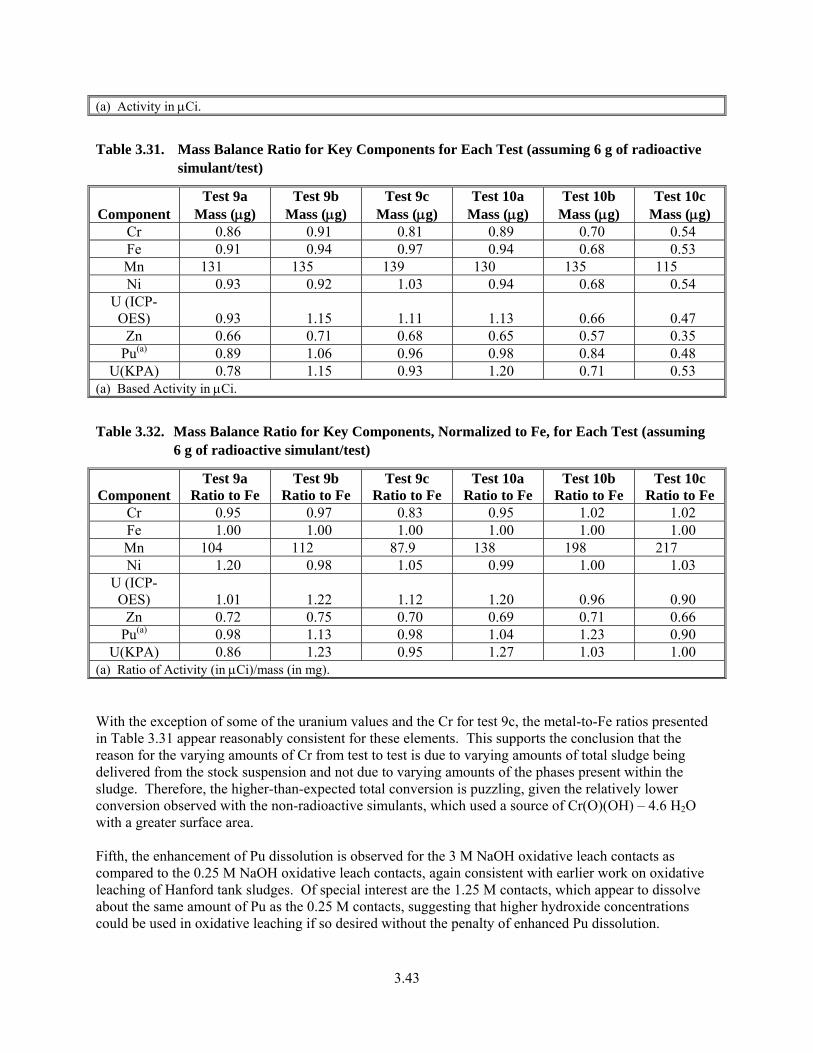
3.43
(a) Activity in μCi.
Table 3.31. Mass Balance Ratio for Key Components for Each Test (assuming 6 g of radioactive simulant/test)
Component Test 9a
Mass (μg) Test 9b
Mass (μg) Test 9c
Mass (μg) Test 10a
Mass (μg) Test 10b
Mass (μg) Test 10c
Mass (μg) Cr 0.86 0.91 0.81 0.89 0.70 0.54 Fe 0.91 0.94 0.97 0.94 0.68 0.53 Mn 131 135 139 130 135 115 Ni 0.93 0.92 1.03 0.94 0.68 0.54
U (ICP-OES) 0.93 1.15 1.11 1.13 0.66 0.47
Zn 0.66 0.71 0.68 0.65 0.57 0.35 Pu(a) 0.89 1.06 0.96 0.98 0.84 0.48
U(KPA) 0.78 1.15 0.93 1.20 0.71 0.53 (a) Based Activity in μCi.
Table 3.32. Mass Balance Ratio for Key Components, Normalized to Fe, for Each Test (assuming 6 g of radioactive simulant/test)
Component Test 9a
Ratio to Fe Test 9b
Ratio to Fe Test 9c
Ratio to Fe Test 10a
Ratio to Fe Test 10b
Ratio to Fe Test 10c
Ratio to Fe Cr 0.95 0.97 0.83 0.95 1.02 1.02 Fe 1.00 1.00 1.00 1.00 1.00 1.00 Mn 104 112 87.9 138 198 217 Ni 1.20 0.98 1.05 0.99 1.00 1.03
U (ICP-OES) 1.01 1.22 1.12 1.20 0.96 0.90
Zn 0.72 0.75 0.70 0.69 0.71 0.66 Pu(a) 0.98 1.13 0.98 1.04 1.23 0.90
U(KPA) 0.86 1.23 0.95 1.27 1.03 1.00 (a) Ratio of Activity (in μCi)/mass (in mg). With the exception of some of the uranium values and the Cr for test 9c, the metal-to-Fe ratios presented in Table 3.31 appear reasonably consistent for these elements. This supports the conclusion that the reason for the varying amounts of Cr from test to test is due to varying amounts of total sludge being delivered from the stock suspension and not due to varying amounts of the phases present within the sludge. Therefore, the higher-than-expected total conversion is puzzling, given the relatively lower conversion observed with the non-radioactive simulants, which used a source of Cr(O)(OH) – 4.6 H2O with a greater surface area. Fifth, the enhancement of Pu dissolution is observed for the 3 M NaOH oxidative leach contacts as compared to the 0.25 M NaOH oxidative leach contacts, again consistent with earlier work on oxidative leaching of Hanford tank sludges. Of special interest are the 1.25 M contacts, which appear to dissolve about the same amount of Pu as the 0.25 M contacts, suggesting that higher hydroxide concentrations could be used in oxidative leaching if so desired without the penalty of enhanced Pu dissolution.
4.1
4.0 Summary and Conclusions
The work described in this report involved testing both simple Cr phases and simulants containing a variety of Cr phases for their capability to undergo conversion from Cr(III) to Cr(VI) by contact with alkaline solutions containing permanganate. The ultimate goal of this work was to develop a method for determining the amount of permanganate that needs to be added to a solid containing permanganate-oxidizable Cr. The initial approach investigated was to explore monitoring the redox potential as a method for determining whether the presence of additional permanganate would be beneficial for Cr oxidation. Initial tests involving soluble Cr(III) proved promising with a rapid reaction so that the solution potential would remain low until all of the Cr(III) was consumed, whereupon an increase of several hundred millivolts in the solution potential was observed. However, when testing was done with various Cr(III) solids in the presence of sub-stoichiometric amounts of permanganate , the time for a sufficient consumption of permanganate to return to initial lower solution potential was prohibitive, with reaction times as much a 2 hours per sub-stoichiometric addition being observed. At this point, an alternative approach was explored. This approach involved testing a selected Cr-containing solid with various ratios of permanganate:Cr(III) to ascertain the response of the solid under the time and temperatures of actual WTP leaching. This would essentially provide a percent dissolved, oxidized Cr versus added permanganate from which a decision could be made. Multiple experiments were performed to evaluate different sources of Cr, changes in hydroxide concentration, changes in temperature, and any differences as a result of the presence of key, safety-related metals. To accomplish this work, two methods were investigated to remove excess permanganate from solution before analyzing the amount of dissolved, oxidized chromium as chromate by visible spectroscopy. Removing permanganate and especially manganate is desirable because of their contribution to the maximum chromium absorbance at 372 nm, which was used to monitor the chromate concentration. The two reductants tested were hydrogen peroxide and hydroxylamine. Both were shown to readily reduce permanganate to a Mn precipitate. The reaction with hydrogen peroxide appeared to require a large excess of peroxide to completely remove permanganate and manganate. Hydroxylamine appeared to react with permanganate in a stoichiometric fashion, acting as a 2-electron reductant. However, excess hydrogen peroxide was the preferred approach due to remaining uncertainties regarding reduction of Cr(VI) by hydroxylamine in more complex systems. Multiple experimental parameters were investigated. Initial studies were done in solutions of 0.1 M hydroxide, primarily using only single Cr solids themselves. From these measurements, the relative extent of oxidative dissolution upon contact with permanganate was evaluated. It was found that
• the order for the extent of oxidative dissolution for Cr(III) solids over a 6-hour time frame was hydrated Cr(OH)3 (23°C) ~ Cr2O3 (80°C) > Cr(O)(OH) – H2O (80°C) > Cr(O)(OH) – H2O (23°C) >> Cr2O3 (23°C)
• the type of agitation has a dramatic effect on the extent of oxidative dissolution of Cr(III) solids. With these results in hand, a set of experiments was performed to evaluate various variables that were deemed likely to have an impact on oxidative dissolution of chromate. An agitation condition of 500 rpm
4.2
using a large finned magnetic stirring bar was used for all experiments except those designed explicitly to examine alternative agitation methods. Conclusions from these experiments include:
• The pattern of chromate formation from Cr(III) solids as a function of time generally shows a rapid initial oxidative dissolution over the first 1.5 hours, followed by a much slower but less variable oxidative dissolution over the remaining 4.5 hours typically examined.
• The type of agitation (500-rpm stirring versus 200-rpm shaking) has a marked effect on the extent of oxidative dissolution of Cr(III) solids, with the stirring method exhibiting the greatest extent of oxidative dissolution.
• For a given type of Cr(III) solids, the surface area impacts the extent of oxidative dissolution with the higher surface-area solids showing the greater dissolution over the timeframes examined.
• Hydroxide changes from 0.25 to 1.25 M have a marked impact, with greater oxidative dissolution of chromium occurring at higher hydroxide. Further increases to 3 M have little additional impact.
• A relatively modest increase in temperature from 25°C to 45°C has an impact on the extent of oxidative dissolution of Cr(III) solids, with the higher temperature showing the greater dissolution, although the enhancement appears to decrease as contact times increase, ranging from almost a factor of two at the earliest times to an effectively equivalent extent after 8 hours of contact time.
• Changing the initial permanganate:Cr(III) molar ratio from 0.75 to 0.90 increases the amount of oxidatively dissolved Cr. Further increases from 0.90 to 1.25 appear to have little additional impact.
A limited number of experiments involving a radioactive simulant were also performed, with the primary purpose of evaluating criticality safety components as a function of changing hydroxide and temperature. Added radioactive components were Pu(IV) and two compositions of uranium, U3O8 and UO2. Here the agitation rate was fixed. The initial permanganate:Cr(III) ratio was meant to be fixed, but subsequent ICP-OES analysis indicated that this feature varied from 1.25 to 2.10, indicating that super-stoichiometric amounts of Mn were present in all experiments. The major controlled variables were hydroxide concentration and temperature. Conclusions from these experiments include:
• The pattern of chromate formation from Cr(III) solids as a function of time generally shows a rapid initial oxidative dissolution over the first 1.5 hours, followed by a minor increase in oxidative dissolution over the remaining 6.5 hours typically examined. It should be noted that here a much larger extent of chromate formation was observed in the first 0.25 hours than was observed previously. The reason for this is not known, but one possibility might be the change in agitation conditions. While the work with non-radioactive simulants was performed in an open beaker using a lesser solution:solids ratio than was the done with the radioactive simulant, the work with the radioactive simulant, due to radiological considerations, was done in a smaller closed bottle. The change in the solution:solids ratio and the use of a smaller container meant that there is much less free space in the radioactive tests than in the non-radioactive tests. This may translate to increased agitation during the radioactive tests, which is known, at least for lesser degrees of agitation, to impact the rate and extent of oxidative dissolution of Cr(III).
4.3
• Monitoring of chromate formation at 25°C indicates that changing the free hydroxide concentration has little impact on the results, whereas at 45°C, an increase in the extent of chromate formation occurs with increasing hydroxide concentration. Why this was found for the 45°C and not for the 25°C work mentioned previously is unknown. However, monitoring the final amounts of dissolved Cr by metals analysis of the process solutions and the residual solids indicates that for all tests, an almost constant amount of Cr was removed from the solids, with values ranging from 83 to 89 percent. Given that approximately 14 percent of the Cr present was in the form of unleachable iron and nickel chromite, it appears that near-quantitative conversion of the available, leachable Cr(III) resulted.
• With regards to uranium, relatively little appeared to dissolve (typically about 1 percent or less), but to the extent it does dissolve, it appears to be somewhat greater at lower hydroxide concentrations than at higher hydroxide concentrations.
• With regards to Pu dissolution, contact with solutions at either 0.25M or 1.25 M NaOH gave only a slightly greater extent of dissolved Pu than was observed during simple caustic leaching. Changing from 1.25 M to 3 M NaOH, however, gave a several-fold increase in the extent of dissolved Pu. One caveat here is that at 3 M NaOH, 45°C, the amount of Pu dissolved during simple caustic leaching was also enhanced and roughly equivalent to that dissolved during oxidative leaching. The comparison from 0.25 M to 3 M follows trends observed previously during oxidative alkaline leaching of Hanford tank sludges (Rapko et al. 2004).
• Of the non-radioactive components, little (generally a fraction of a percent or less) dissolution was noted. Zn showed the greatest dissolution and even in this case, less Zn reported to solution during oxidative than during simple caustic leaching.
The nature of Mn solids formed by permanganate reduction was evaluated. Two methods were employed, surface analysis by XPS and a wet chemical method used for Mn minerals to determine the average Mn oxidation state in the solids. Both methods generally agree in concluding that the bulk of the Mn is present in the +4 oxidation state. The wet chemical method, being a bulk phase method as opposed to a surface method, allows quantitation of the Mn oxidation state for the sample. This method, assuming that the Mn present as Mn+4 is present as Mn+3, indicates that 80 to 95 percent of the Mn is in the +4 oxidation state. One of the specific objectives of this work (#2) was to develop a method for determining permanganate dosage for optimum oxidative leaching of Hanford Tank sludge with permanganate. As of now, the recommended method of choice is to take samples of sludge and perform oxidative leaching under tank conditions of time, temperature, plant agitation conditions (which remains to be determined) and hydroxide concentration. The excess permanganate, if any, is then destroyed by peroxide addition and the extent of chromate formation monitored by visible spectroscopy at 372 nm. From this information, the extent of Cr oxidatively dissolved can be evaluated and the optimum conditions of permanganate dosage selected. A proposed sequence might be as follows:
1) Determine the amount of insoluble Cr present in the sample by ICP-OES analysis of washed sludge.
2) Determine the amount of water-insoluble material in the sludge.
3) Aliquot out several samples of sludge. Guidelines to consider for the aliquot size include: 1) the Cr concentration of the sludge and 2) a convenient sizing of equipment for manipulation of a 30 weight percent leach slurry. With standard size spectroscopy cells (about 1 mL sample volume), this leads to a recommendation that 0.5 grams or greater of insoluble sludge solids be used.
4.4
4) Calculate the amounts of targeted permanganate to achieve the desired [Mn]:[Cr]. Based on the earlier work performed above, a [Mn]:[Cr] of 0.75 appears to yield consistently lower concentrations of chromate and a [Mn]:[Cr] of 0.9 or greater gives variable results. Therefore, a plausible sequence of ratios might be from a [Mn]:[Cr] of 0.9 to 1.30 or 1.35 by 0.1 to 0.15 intervals, with the exact amounts being decided by the dosing precision desired.
5) Contact the sample under target conditions of hydroxide, time, temperature, and sample agitation. As the work described in this report suggests that these variables will affect the rate and extent of chromate formation, conditions that mimic the plant operation are desirable. Therefore, the current baseline conditions of 6 hours contact time, 25°C and (initially) 0.25 M free hydroxide are recommended. The agitation method at least should provide sufficiently vigorous agitation for all particles to be well suspended during the leach. As noted elsewhere in this report, correlation of lab scale leach agitation rates with those at plant scale still needs to be performed.
6) Destroy excess permanganate with excess hydrogen peroxide. Based on the work described in this report, at least a 20 fold stoichiometric molar excess of peroxide to the initial permanganate concentration is recommended. A larger excess of peroxide is acceptable.
There are several experimental details to be considered in performing this peroxide addition. First, the reaction of 30 percent hydrogen peroxide, the concentration used for the work described in this document, with permanganate in alkaline solution is quite vigorous, with a several degree rise in temperature and considerable gas evolution; therefore, the use of more concentrated peroxide solutions is not recommended. Little experience exists to date on whether or not more dilute solutions of hydrogen peroxide are acceptable but they should work. Further work in this area should prove fruitful.
Another experimental detail concerns the length of reaction time. From the work described in this report, at least 15 minutes of contact time should be allowed.
7) Measure the sample’s solution absorbance at 372 nm. Note that either a pathlength that is different than the standard 1-cm sample chamber or sample dilution may be required to remain in the linear response region of the spectrometer.
8) Calculate the amount of chromate present in solution. Note that if comparable solution volumes, volumes of peroxide addition, and sample sizes are used, the 372-nm absorbance is directly proportional to the amount of dissolved chromium as chromate. The visible spectrum can also be used to identify incomplete reduction of permanganate/manganate. Incomplete reduction can be identified by monitoring the 500 to 700 nm region of the spectrum. Observation of a series of absorbances between 500 to 570 nm is indicative of permanganate; a single broad absorbance between about 550 to 700 nm, centered at about 610 nm, is indicative of the presence of manganate. If manganate is present, which was typically observed in the cases of incomplete reduction occasionally observed in this work, then a correction to the 372 nm absorbance of minus 0.89 times the absorbance at 607 nm can be made to get the chromate contribution to the signal. Alternatively additional peroxide can be added, allowed to consume the soluble Mn species, and the spectrum remeasured.
There are two features that remain to be established before this method can be applied. First, there is the reproducibility of sample composition. If samples have differing concentrations of Cr than assumed, then the Mn:Cr ratios will be off, and erroneous conclusions obtained. It should be noted that this was a problem even on the laboratory scale with the simulant work presented in this paper. Second, the agitation conditions on the laboratory scale that reproduce those in a tank must still be determined because that has been shown to be a key variable in determining the extent of oxidative Cr(III) dissolution under otherwise identical conditions.

4.5
Finally, one caveat needs to be made. Decisions about work performed with the radioactive simulant, like the manner of Pu introduction and the source of leachable Cr, were not made with regards to consideration towards reproduction of the conditions present for those species in actual Hanford Tank Wastes. Therefore, aspects such as that should be compared to actual Hanford tank wastes. Such testing with high Cr-containing sludge composites is planned (as described in Test Specification 24590-PTF-TSP-RT-06-002, Rev. 0, Tasks 5 and 6) and is needed to validate any simulant-based conclusions; once available, such a comparison of the actual tank-waste results to these simulant results under comparable conditions would be of interest.

Appendix A
QA Procedures
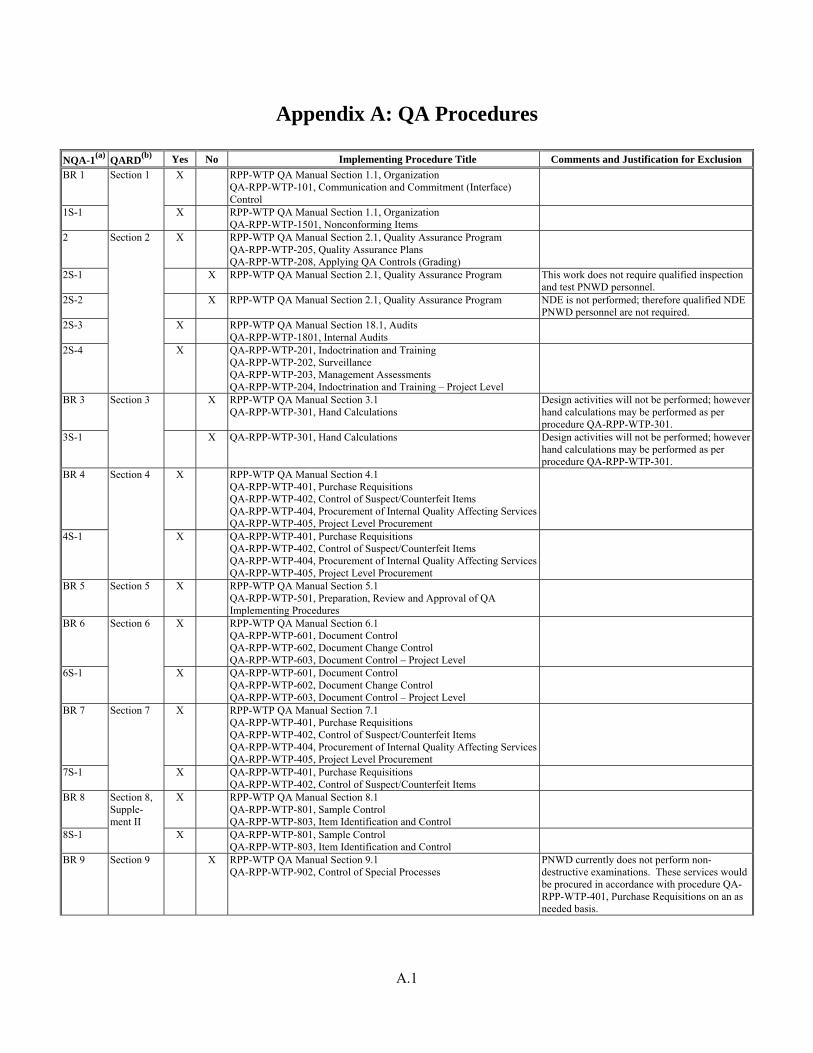
A.1
Appendix A: QA Procedures
NQA-1(a) QARD(b) Yes No Implementing Procedure Title Comments and Justification for Exclusion BR 1 X RPP-WTP QA Manual Section 1.1, Organization
QA-RPP-WTP-101, Communication and Commitment (Interface) Control
1S-1
Section 1
X RPP-WTP QA Manual Section 1.1, Organization QA-RPP-WTP-1501, Nonconforming Items
2 X RPP-WTP QA Manual Section 2.1, Quality Assurance Program QA-RPP-WTP-205, Quality Assurance Plans QA-RPP-WTP-208, Applying QA Controls (Grading)
2S-1 X RPP-WTP QA Manual Section 2.1, Quality Assurance Program This work does not require qualified inspection and test PNWD personnel.
2S-2 X RPP-WTP QA Manual Section 2.1, Quality Assurance Program NDE is not performed; therefore qualified NDE PNWD personnel are not required.
2S-3 X RPP-WTP QA Manual Section 18.1, Audits QA-RPP-WTP-1801, Internal Audits
2S-4
Section 2
X QA-RPP-WTP-201, Indoctrination and Training QA-RPP-WTP-202, Surveillance QA-RPP-WTP-203, Management Assessments QA-RPP-WTP-204, Indoctrination and Training – Project Level
BR 3 X RPP-WTP QA Manual Section 3.1 QA-RPP-WTP-301, Hand Calculations
Design activities will not be performed; however hand calculations may be performed as per procedure QA-RPP-WTP-301.
3S-1
Section 3
X QA-RPP-WTP-301, Hand Calculations
Design activities will not be performed; however hand calculations may be performed as per procedure QA-RPP-WTP-301.
BR 4 X RPP-WTP QA Manual Section 4.1 QA-RPP-WTP-401, Purchase Requisitions QA-RPP-WTP-402, Control of Suspect/Counterfeit Items QA-RPP-WTP-404, Procurement of Internal Quality Affecting ServicesQA-RPP-WTP-405, Project Level Procurement
4S-1
Section 4
X QA-RPP-WTP-401, Purchase Requisitions QA-RPP-WTP-402, Control of Suspect/Counterfeit Items QA-RPP-WTP-404, Procurement of Internal Quality Affecting ServicesQA-RPP-WTP-405, Project Level Procurement
BR 5 Section 5 X RPP-WTP QA Manual Section 5.1 QA-RPP-WTP-501, Preparation, Review and Approval of QA Implementing Procedures
BR 6 X RPP-WTP QA Manual Section 6.1 QA-RPP-WTP-601, Document Control QA-RPP-WTP-602, Document Change Control QA-RPP-WTP-603, Document Control – Project Level
6S-1
Section 6
X QA-RPP-WTP-601, Document Control QA-RPP-WTP-602, Document Change Control QA-RPP-WTP-603, Document Control – Project Level
BR 7 X RPP-WTP QA Manual Section 7.1 QA-RPP-WTP-401, Purchase Requisitions QA-RPP-WTP-402, Control of Suspect/Counterfeit Items QA-RPP-WTP-404, Procurement of Internal Quality Affecting ServicesQA-RPP-WTP-405, Project Level Procurement
7S-1
Section 7
X QA-RPP-WTP-401, Purchase Requisitions QA-RPP-WTP-402, Control of Suspect/Counterfeit Items
BR 8 X RPP-WTP QA Manual Section 8.1 QA-RPP-WTP-801, Sample Control QA-RPP-WTP-803, Item Identification and Control
8S-1
Section 8, Supple-ment II
X QA-RPP-WTP-801, Sample Control QA-RPP-WTP-803, Item Identification and Control
BR 9 Section 9 X RPP-WTP QA Manual Section 9.1 QA-RPP-WTP-902, Control of Special Processes
PNWD currently does not perform non-destructive examinations. These services would be procured in accordance with procedure QA-RPP-WTP-401, Purchase Requisitions on an as needed basis.
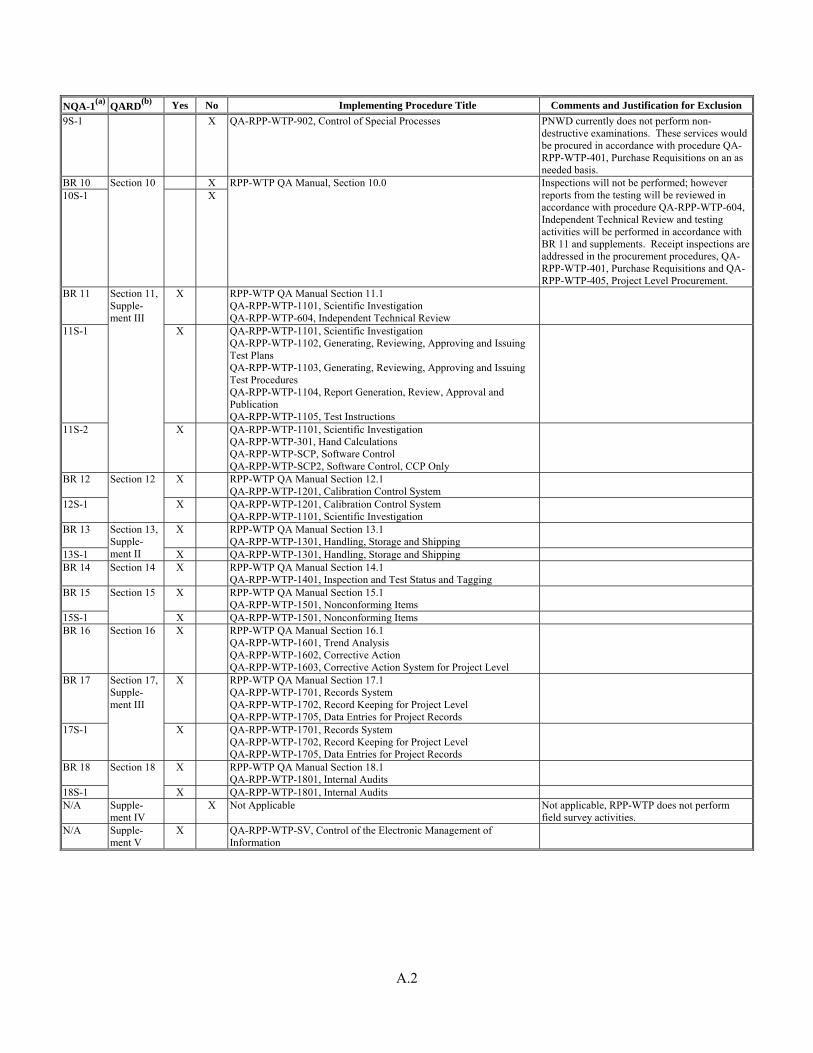
A.2
NQA-1(a) QARD(b) Yes No Implementing Procedure Title Comments and Justification for Exclusion 9S-1 X QA-RPP-WTP-902, Control of Special Processes PNWD currently does not perform non-
destructive examinations. These services would be procured in accordance with procedure QA-RPP-WTP-401, Purchase Requisitions on an as needed basis.
BR 10 X 10S-1
Section 10 X
RPP-WTP QA Manual, Section 10.0 Inspections will not be performed; however reports from the testing will be reviewed in accordance with procedure QA-RPP-WTP-604, Independent Technical Review and testing activities will be performed in accordance with BR 11 and supplements. Receipt inspections are addressed in the procurement procedures, QA-RPP-WTP-401, Purchase Requisitions and QA-RPP-WTP-405, Project Level Procurement.
BR 11 X RPP-WTP QA Manual Section 11.1 QA-RPP-WTP-1101, Scientific Investigation QA-RPP-WTP-604, Independent Technical Review
11S-1 X QA-RPP-WTP-1101, Scientific Investigation QA-RPP-WTP-1102, Generating, Reviewing, Approving and Issuing Test Plans QA-RPP-WTP-1103, Generating, Reviewing, Approving and Issuing Test Procedures QA-RPP-WTP-1104, Report Generation, Review, Approval and Publication QA-RPP-WTP-1105, Test Instructions
11S-2
Section 11, Supple-ment III
X QA-RPP-WTP-1101, Scientific Investigation QA-RPP-WTP-301, Hand Calculations QA-RPP-WTP-SCP, Software Control QA-RPP-WTP-SCP2, Software Control, CCP Only
BR 12 X RPP-WTP QA Manual Section 12.1 QA-RPP-WTP-1201, Calibration Control System
12S-1
Section 12
X QA-RPP-WTP-1201, Calibration Control System QA-RPP-WTP-1101, Scientific Investigation
BR 13 X RPP-WTP QA Manual Section 13.1 QA-RPP-WTP-1301, Handling, Storage and Shipping
13S-1
Section 13, Supple-ment II X QA-RPP-WTP-1301, Handling, Storage and Shipping
BR 14 Section 14 X RPP-WTP QA Manual Section 14.1 QA-RPP-WTP-1401, Inspection and Test Status and Tagging
BR 15 X RPP-WTP QA Manual Section 15.1 QA-RPP-WTP-1501, Nonconforming Items
15S-1
Section 15
X QA-RPP-WTP-1501, Nonconforming Items BR 16 Section 16 X RPP-WTP QA Manual Section 16.1
QA-RPP-WTP-1601, Trend Analysis QA-RPP-WTP-1602, Corrective Action QA-RPP-WTP-1603, Corrective Action System for Project Level
BR 17 X RPP-WTP QA Manual Section 17.1 QA-RPP-WTP-1701, Records System QA-RPP-WTP-1702, Record Keeping for Project Level QA-RPP-WTP-1705, Data Entries for Project Records
17S-1
Section 17, Supple-ment III
X QA-RPP-WTP-1701, Records System QA-RPP-WTP-1702, Record Keeping for Project Level QA-RPP-WTP-1705, Data Entries for Project Records
BR 18 X RPP-WTP QA Manual Section 18.1 QA-RPP-WTP-1801, Internal Audits
18S-1
Section 18
X QA-RPP-WTP-1801, Internal Audits N/A Supple-
ment IV X Not Applicable Not applicable, RPP-WTP does not perform
field survey activities. N/A Supple-
ment V X QA-RPP-WTP-SV, Control of the Electronic Management of
Information
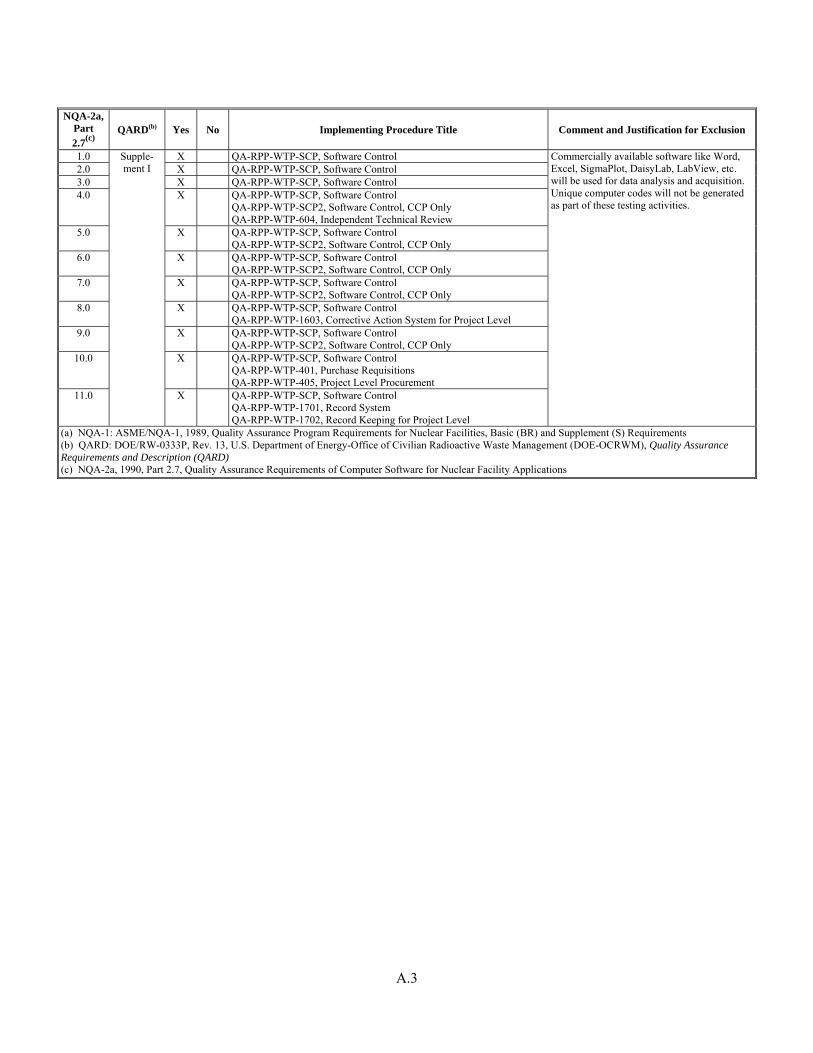
A.3
NQA-2a,
Part 2.7(c)
QARD(b) Yes No Implementing Procedure Title Comment and Justification for Exclusion
1.0 X QA-RPP-WTP-SCP, Software Control 2.0 X QA-RPP-WTP-SCP, Software Control 3.0 X QA-RPP-WTP-SCP, Software Control 4.0 X QA-RPP-WTP-SCP, Software Control
QA-RPP-WTP-SCP2, Software Control, CCP Only QA-RPP-WTP-604, Independent Technical Review
5.0 X QA-RPP-WTP-SCP, Software Control QA-RPP-WTP-SCP2, Software Control, CCP Only
6.0 X QA-RPP-WTP-SCP, Software Control QA-RPP-WTP-SCP2, Software Control, CCP Only
7.0 X QA-RPP-WTP-SCP, Software Control QA-RPP-WTP-SCP2, Software Control, CCP Only
8.0 X QA-RPP-WTP-SCP, Software Control QA-RPP-WTP-1603, Corrective Action System for Project Level
9.0 X QA-RPP-WTP-SCP, Software Control QA-RPP-WTP-SCP2, Software Control, CCP Only
10.0 X QA-RPP-WTP-SCP, Software Control QA-RPP-WTP-401, Purchase Requisitions QA-RPP-WTP-405, Project Level Procurement
11.0
Supple-ment I
X QA-RPP-WTP-SCP, Software Control QA-RPP-WTP-1701, Record System QA-RPP-WTP-1702, Record Keeping for Project Level
Commercially available software like Word, Excel, SigmaPlot, DaisyLab, LabView, etc. will be used for data analysis and acquisition. Unique computer codes will not be generated as part of these testing activities.
(a) NQA-1: ASME/NQA-1, 1989, Quality Assurance Program Requirements for Nuclear Facilities, Basic (BR) and Supplement (S) Requirements (b) QARD: DOE/RW-0333P, Rev. 13, U.S. Department of Energy-Office of Civilian Radioactive Waste Management (DOE-OCRWM), Quality Assurance Requirements and Description (QARD) (c) NQA-2a, 1990, Part 2.7, Quality Assurance Requirements of Computer Software for Nuclear Facility Applications


Appendix B
ORP and pH data for Radioactive Simulant Testing
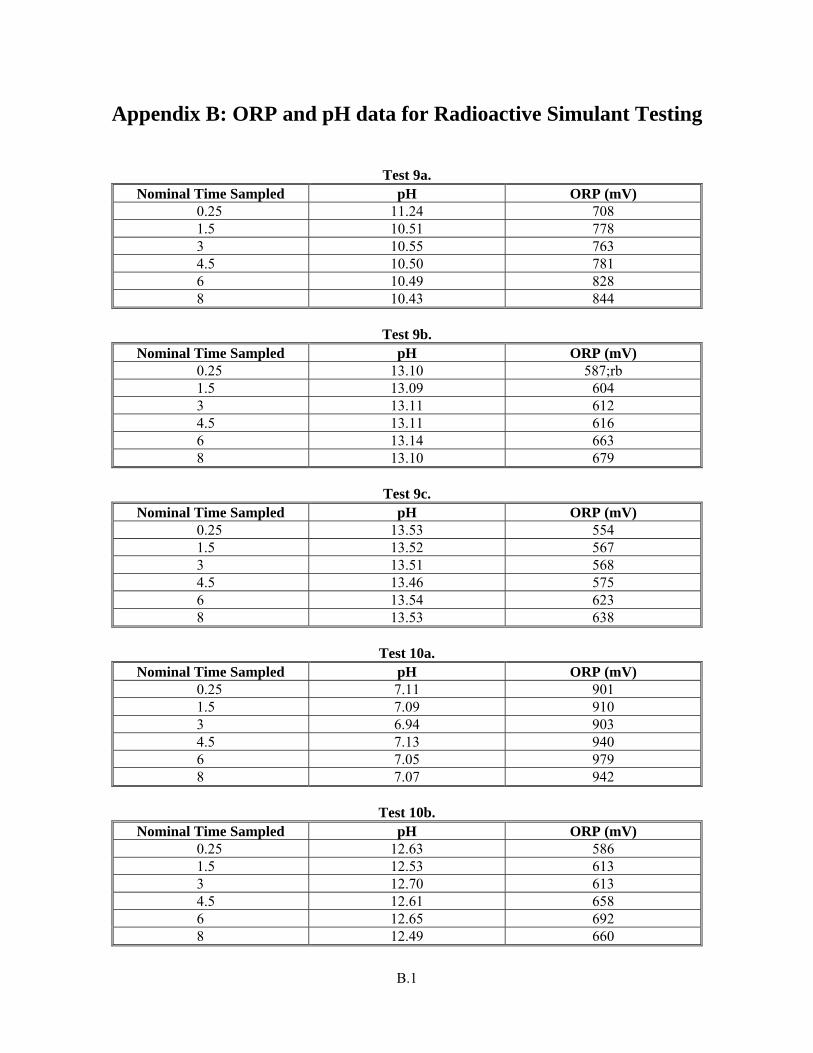
B.1
Appendix B: ORP and pH data for Radioactive Simulant Testing
Test 9a.
Nominal Time Sampled pH ORP (mV) 0.25 11.24 708 1.5 10.51 778 3 10.55 763 4.5 10.50 781 6 10.49 828 8 10.43 844
Test 9b.
Nominal Time Sampled pH ORP (mV) 0.25 13.10 587;rb 1.5 13.09 604 3 13.11 612 4.5 13.11 616 6 13.14 663 8 13.10 679
Test 9c.
Nominal Time Sampled pH ORP (mV) 0.25 13.53 554 1.5 13.52 567 3 13.51 568 4.5 13.46 575 6 13.54 623 8 13.53 638
Test 10a.
Nominal Time Sampled pH ORP (mV) 0.25 7.11 901 1.5 7.09 910 3 6.94 903 4.5 7.13 940 6 7.05 979 8 7.07 942
Test 10b.
Nominal Time Sampled pH ORP (mV) 0.25 12.63 586 1.5 12.53 613 3 12.70 613 4.5 12.61 658 6 12.65 692 8 12.49 660
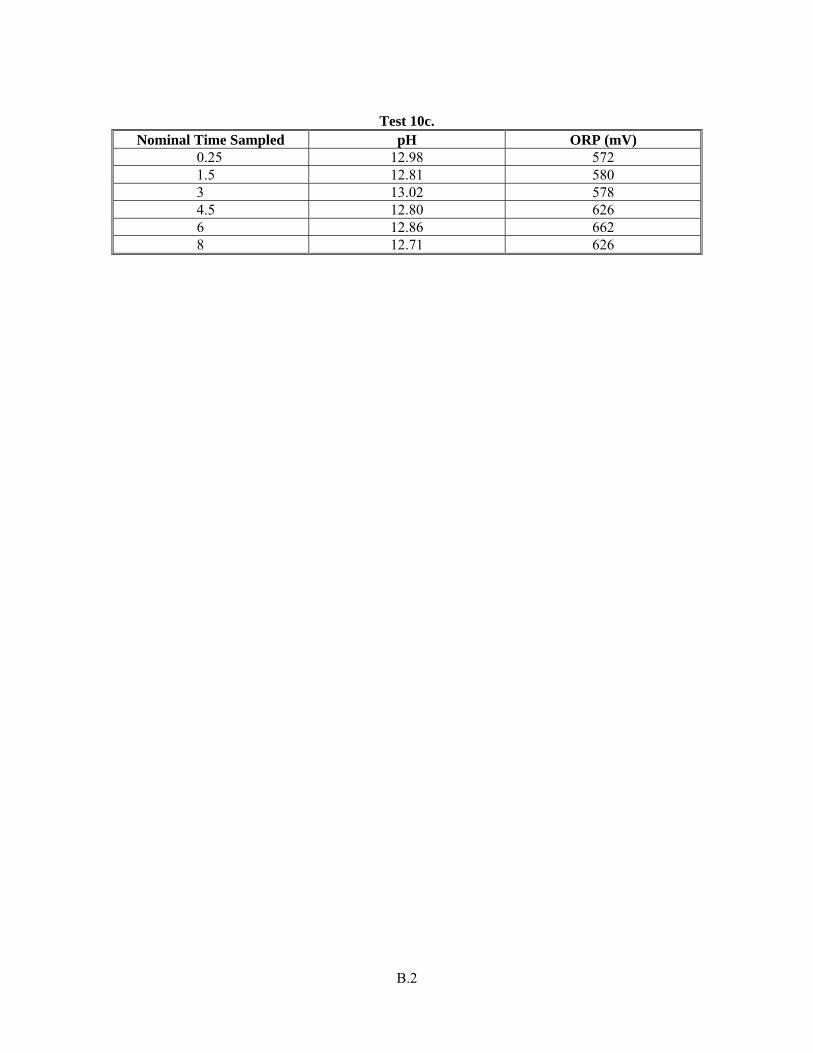
B.2
Test 10c.
Nominal Time Sampled pH ORP (mV) 0.25 12.98 572 1.5 12.81 580 3 13.02 578 4.5 12.80 626 6 12.86 662 8 12.71 626
Appendix C
Approach for Preparing Oxidative Leaching Simulant
C.1
Appendix C: Approach for Preparing Oxidative Leaching Simulant
There have been a number of simulants prepared for screening of potential chromium leaching methods. References for these simulants include: Kim J, TA Kaurich, P Sylvester, and A Gonzalez-Martin. 2006. “Enhanced Selective Leaching of Chromium from Radioactive Sludges,” Sepn. Sci. Technol. 41:179-196. Nash KL, M Borkowski, M Hancock, and I Laszak. 2005. “Oxidative Leaching of Plutonium from Simulated Hanford Tank-Waste Sludges.” Sepn. Sci. Technol. 40:1497-1512. Sylvester P, LA Rutherford, Jr, A Gonzalez-Martin, J Kim, BM Rapko, and GJ Lumetta. 2001. “Ferrate Treatment for Removing Chromium from High-Level Radioactive Tank Waste.” Environmental Science and Technology 35:216-221. In addition, Elmore, Colton, and Jones described a general tank sludge simulant for pretreatment testing which is detailed in: Golcar GR, NG Colton, JG Darab, and HD Smith. 2000. Hanford Tank Waste Simulants Specification and Their Applicability for the Retrieval, Pretreatment, and Vitrification Processes. PNWD-2455, Pacific Northwest National Laboratory, Richland, Washington. However, as discussed by Rapko et al. (2005), the usefulness of these previously described simulants is questionable because they do not take into account the specific chemical and mineral forms present in the tank sludge solids. For this reason, a fundamentally different approach will be taken to prepare the simulant for oxidative leaching experiments. This approach will rely on adding specific chemical phases to the simulant. These phases will be based on phases identified in actual Hanford tank sludge samples. In addition to Cr, the non-radioactive simulant will contain the safety-related components Fe, Mn, Ni, and Zn. A radioactive simulant will also be prepared that contains U and Pu. The absolute concentration of these various elements in the simulant is not a critical parameter. Rather, it is important to verify that they are present in sufficient quantity to easily determine their behavior during the permanganate leaching experiments.
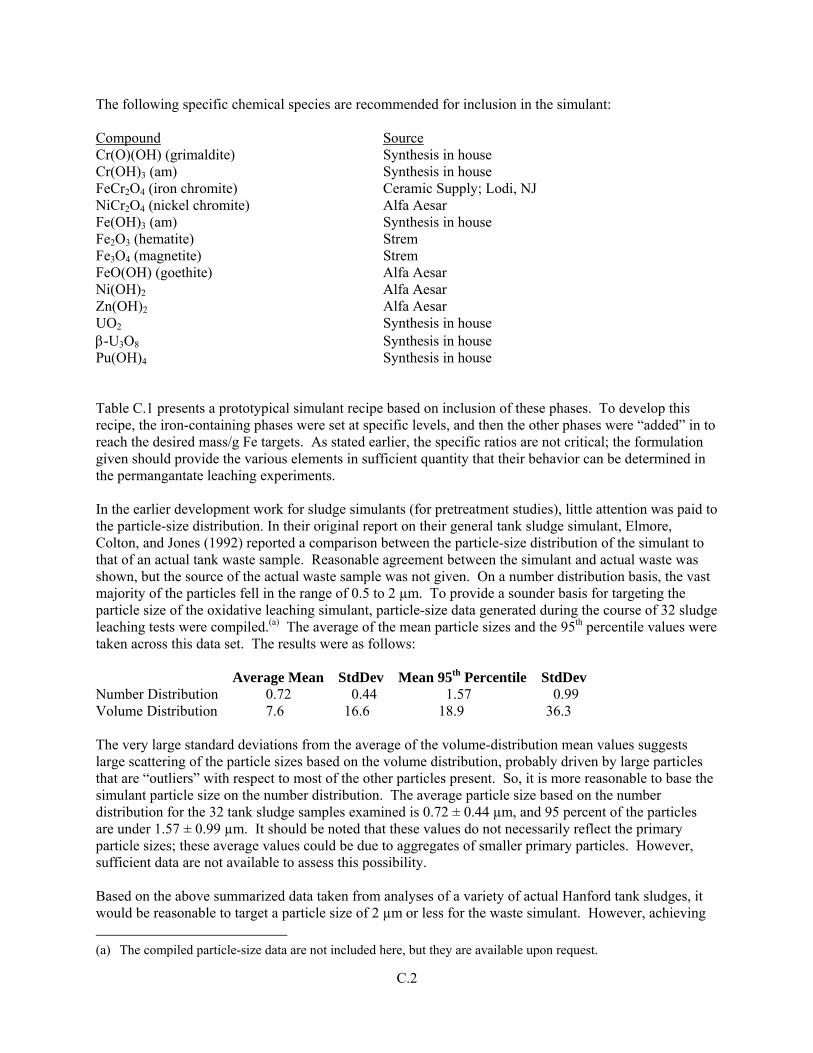
C.2
The following specific chemical species are recommended for inclusion in the simulant: Compound Source Cr(O)(OH) (grimaldite) Synthesis in house Cr(OH)3 (am) Synthesis in house FeCr2O4 (iron chromite) Ceramic Supply; Lodi, NJ NiCr2O4 (nickel chromite) Alfa Aesar Fe(OH)3 (am) Synthesis in house Fe2O3 (hematite) Strem Fe3O4 (magnetite) Strem FeO(OH) (goethite) Alfa Aesar Ni(OH)2 Alfa Aesar Zn(OH)2 Alfa Aesar UO2 Synthesis in house β-U3O8 Synthesis in house Pu(OH)4 Synthesis in house Table C.1 presents a prototypical simulant recipe based on inclusion of these phases. To develop this recipe, the iron-containing phases were set at specific levels, and then the other phases were “added” in to reach the desired mass/g Fe targets. As stated earlier, the specific ratios are not critical; the formulation given should provide the various elements in sufficient quantity that their behavior can be determined in the permangantate leaching experiments. In the earlier development work for sludge simulants (for pretreatment studies), little attention was paid to the particle-size distribution. In their original report on their general tank sludge simulant, Elmore, Colton, and Jones (1992) reported a comparison between the particle-size distribution of the simulant to that of an actual tank waste sample. Reasonable agreement between the simulant and actual waste was shown, but the source of the actual waste sample was not given. On a number distribution basis, the vast majority of the particles fell in the range of 0.5 to 2 µm. To provide a sounder basis for targeting the particle size of the oxidative leaching simulant, particle-size data generated during the course of 32 sludge leaching tests were compiled.(a) The average of the mean particle sizes and the 95th percentile values were taken across this data set. The results were as follows: Average Mean StdDev Mean 95th Percentile StdDev Number Distribution 0.72 0.44 1.57 0.99 Volume Distribution 7.6 16.6 18.9 36.3 The very large standard deviations from the average of the volume-distribution mean values suggests large scattering of the particle sizes based on the volume distribution, probably driven by large particles that are “outliers” with respect to most of the other particles present. So, it is more reasonable to base the simulant particle size on the number distribution. The average particle size based on the number distribution for the 32 tank sludge samples examined is 0.72 ± 0.44 µm, and 95 percent of the particles are under 1.57 ± 0.99 µm. It should be noted that these values do not necessarily reflect the primary particle sizes; these average values could be due to aggregates of smaller primary particles. However, sufficient data are not available to assess this possibility. Based on the above summarized data taken from analyses of a variety of actual Hanford tank sludges, it would be reasonable to target a particle size of 2 µm or less for the waste simulant. However, achieving (a) The compiled particle-size data are not included here, but they are available upon request.

C.3
such small particles by sieving may be difficult. As an alternative, it is recommended that the individual sludge phases be ground under a prescribed condition in a ball mill or rock tumbler. The particle-size distribution would be determined for the resulting solid phases. The target would be to have 95 percent of the particles below 20 µm. If this target is not reached, the grinding would be repeated until the limits of the grinding method are reached. This would allow reaction rates to be determined for particles of known size; the results could then be extrapolated to the smaller particles seen in actual tank wastes. References Elmore MR, NG Colton, and EO Jones. 1992. “Development of Simulated Tank Wastes for the U. S. Department of Energy’s Underground Storage Tank Integrated Demonstration.” Spectrum ’92 International Topical Meeting, Nuclear & Hazardous Waste Management, August 23-27, 1992, Boise, Idaho. Rapko BM, GJ Lumetta, JD Vienna, and SK Fiskum. 2005. Oxidative Alkaline Leaching of SX-101 and SY-102 and Its Impact on Immobilized High-Level Waste. PNWD-3600, Pacific Northwest National Laboratory, Richland, Washington.

C.4
Table C.1. Recipe for Permanganate Leaching Simulant
Phase mol wt Element Target Projected Amount
M1 M2 g/g Fe g/g Fe Used, g g Fe M1 M2CrO(OH) (grimaldite) 85.002 51.996 Cr 0.7 0.70 4.95 3.03Cr(OH)3 (am) 103.017 51.996 5 2.52FeCr2O4 223.833 55.845 51.996 1 0.25 0.25 1.86NiCr2O4 226.681 58.693 51.996 Ni 0.05 0.05 1 0.26 1.77Fe(OH)3 106.866 55.845 5 2.61 2.61Fe2O3 (hematite) 159.687 55.845 5 3.50 3.50Fe3O4 (magnetite) 231.531 55.845 5 3.62 3.62
FeO(OH) (goethite) 88.851 55.845 5 3.14 3.14Ni(OH)2 92.707 58.693 0.7 0.44Zn(OH)2 99.404 65.39 Zn 0.01 0.03 0.5 0.33UO2 270.028 238.03 U 0.1 0.10 0.53 0.46beta-U3O8 842.082 238.03 1 0.85Pu(OH)4 307.028 239 Pu 0.005 0.0050 0.084 0.07
Total Fe, g 13.12
Total Mass Simulant, g 34.76
Element a.w. Metal Mass, g
Appendix D
BNI’s Acceptance of Full Simulant Composition
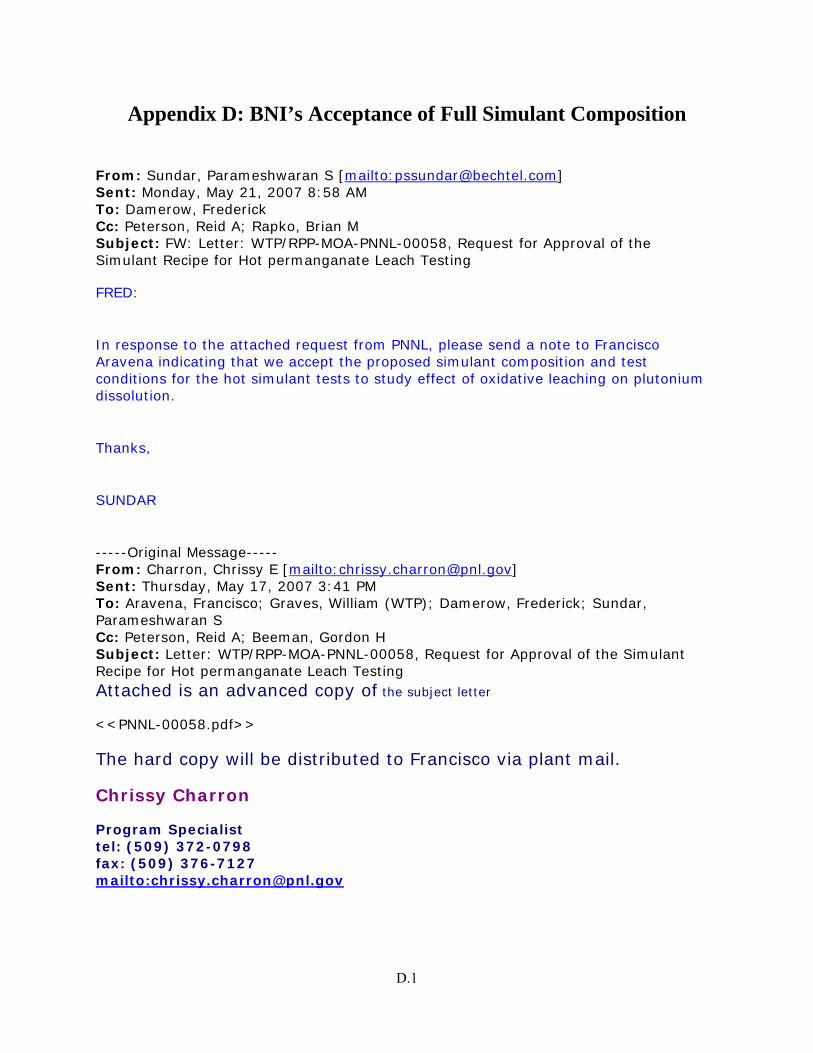
D.1
Appendix D: BNI’s Acceptance of Full Simulant Composition
From: Sundar, Parameshwaran S [mailto:[email protected]] Sent: Monday, May 21, 2007 8:58 AM To: Damerow, Frederick Cc: Peterson, Reid A; Rapko, Brian M Subject: FW: Letter: WTP/RPP-MOA-PNNL-00058, Request for Approval of the Simulant Recipe for Hot permanganate Leach Testing FRED: In response to the attached request from PNNL, please send a note to Francisco Aravena indicating that we accept the proposed simulant composition and test conditions for the hot simulant tests to study effect of oxidative leaching on plutonium dissolution. Thanks, SUNDAR -----Original Message----- From: Charron, Chrissy E [mailto:[email protected]] Sent: Thursday, May 17, 2007 3:41 PM To: Aravena, Francisco; Graves, William (WTP); Damerow, Frederick; Sundar, Parameshwaran S Cc: Peterson, Reid A; Beeman, Gordon H Subject: Letter: WTP/RPP-MOA-PNNL-00058, Request for Approval of the Simulant Recipe for Hot permanganate Leach Testing Attached is an advanced copy of the subject letter <<PNNL-00058.pdf>>
The hard copy will be distributed to Francisco via plant mail.
Chrissy Charron Program Specialist tel: (509) 372-0798 fax: (509) 376-7127 mailto:[email protected]

Appendix E
Details Related to Radioactive Simulant Leaching Testing
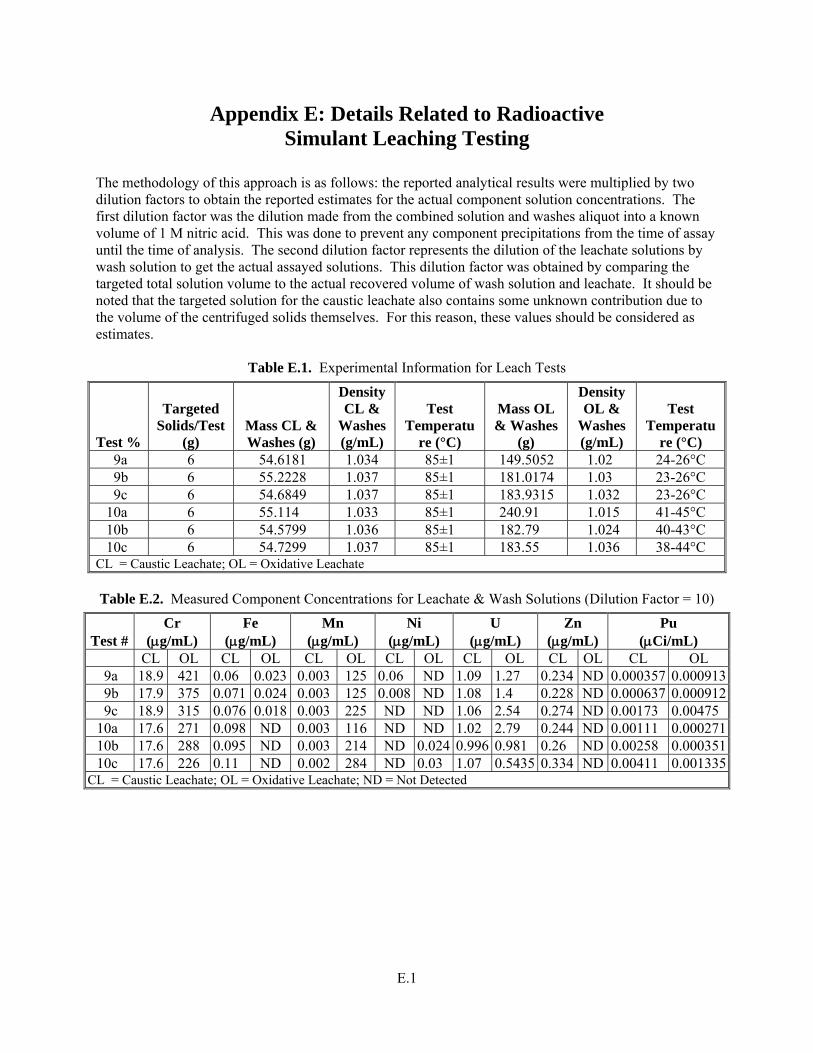
E.1
Appendix E: Details Related to Radioactive Simulant Leaching Testing
The methodology of this approach is as follows: the reported analytical results were multiplied by two dilution factors to obtain the reported estimates for the actual component solution concentrations. The first dilution factor was the dilution made from the combined solution and washes aliquot into a known volume of 1 M nitric acid. This was done to prevent any component precipitations from the time of assay until the time of analysis. The second dilution factor represents the dilution of the leachate solutions by wash solution to get the actual assayed solutions. This dilution factor was obtained by comparing the targeted total solution volume to the actual recovered volume of wash solution and leachate. It should be noted that the targeted solution for the caustic leachate also contains some unknown contribution due to the volume of the centrifuged solids themselves. For this reason, these values should be considered as estimates.
Table E.1. Experimental Information for Leach Tests
Test %
Targeted Solids/Test
(g) Mass CL & Washes (g)
Density CL &
Washes (g/mL)
Test Temperatu
re (°C)
Mass OL & Washes
(g)
Density OL &
Washes (g/mL)
Test Temperatu
re (°C) 9a 6 54.6181 1.034 85±1 149.5052 1.02 24-26°C 9b 6 55.2228 1.037 85±1 181.0174 1.03 23-26°C 9c 6 54.6849 1.037 85±1 183.9315 1.032 23-26°C
10a 6 55.114 1.033 85±1 240.91 1.015 41-45°C 10b 6 54.5799 1.036 85±1 182.79 1.024 40-43°C 10c 6 54.7299 1.037 85±1 183.55 1.036 38-44°C
CL = Caustic Leachate; OL = Oxidative Leachate Table E.2. Measured Component Concentrations for Leachate & Wash Solutions (Dilution Factor = 10)
Test # Cr
(μg/mL) Fe
(μg/mL) Mn
(μg/mL) Ni
(μg/mL) U
(μg/mL) Zn
(μg/mL) Pu
(μCi/mL) CL OL CL OL CL OL CL OL CL OL CL OL CL OL
9a 18.9 421 0.06 0.023 0.003 125 0.06 ND 1.09 1.27 0.234 ND 0.000357 0.0009139b 17.9 375 0.071 0.024 0.003 125 0.008 ND 1.08 1.4 0.228 ND 0.000637 0.0009129c 18.9 315 0.076 0.018 0.003 225 ND ND 1.06 2.54 0.274 ND 0.00173 0.00475
10a 17.6 271 0.098 ND 0.003 116 ND ND 1.02 2.79 0.244 ND 0.00111 0.00027110b 17.6 288 0.095 ND 0.003 214 ND 0.024 0.996 0.981 0.26 ND 0.00258 0.00035110c 17.6 226 0.11 ND 0.002 284 ND 0.03 1.07 0.5435 0.334 ND 0.00411 0.001335
CL = Caustic Leachate; OL = Oxidative Leachate; ND = Not Detected
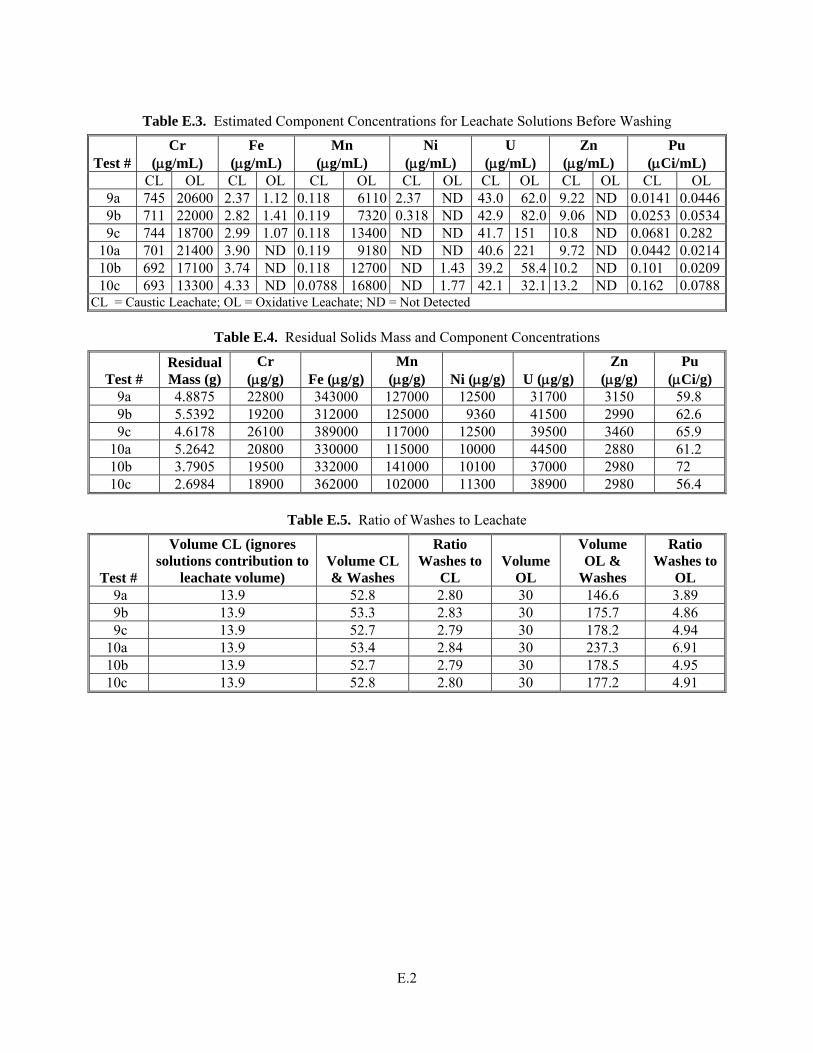
E.2
Table E.3. Estimated Component Concentrations for Leachate Solutions Before Washing
Test # Cr
(μg/mL) Fe
(μg/mL) Mn
(μg/mL) Ni
(μg/mL) U
(μg/mL) Zn
(μg/mL) Pu
(μCi/mL) CL OL CL OL CL OL CL OL CL OL CL OL CL OL
9a 745 20600 2.37 1.12 0.118 6110 2.37 ND 43.0 62.0 9.22 ND 0.0141 0.04469b 711 22000 2.82 1.41 0.119 7320 0.318 ND 42.9 82.0 9.06 ND 0.0253 0.05349c 744 18700 2.99 1.07 0.118 13400 ND ND 41.7 151 10.8 ND 0.0681 0.282
10a 701 21400 3.90 ND 0.119 9180 ND ND 40.6 221 9.72 ND 0.0442 0.021410b 692 17100 3.74 ND 0.118 12700 ND 1.43 39.2 58.4 10.2 ND 0.101 0.020910c 693 13300 4.33 ND 0.0788 16800 ND 1.77 42.1 32.1 13.2 ND 0.162 0.0788
CL = Caustic Leachate; OL = Oxidative Leachate; ND = Not Detected
Table E.4. Residual Solids Mass and Component Concentrations
Test # Residual Mass (g)
Cr (μg/g) Fe (μg/g)
Mn (μg/g) Ni (μg/g) U (μg/g)
Zn (μg/g)
Pu (μCi/g)
9a 4.8875 22800 343000 127000 12500 31700 3150 59.8 9b 5.5392 19200 312000 125000 9360 41500 2990 62.6 9c 4.6178 26100 389000 117000 12500 39500 3460 65.9
10a 5.2642 20800 330000 115000 10000 44500 2880 61.2 10b 3.7905 19500 332000 141000 10100 37000 2980 72 10c 2.6984 18900 362000 102000 11300 38900 2980 56.4
Table E.5. Ratio of Washes to Leachate
Test #
Volume CL (ignores solutions contribution to
leachate volume) Volume CL & Washes
Ratio Washes to
CL Volume
OL
Volume OL &
Washes
Ratio Washes to
OL 9a 13.9 52.8 2.80 30 146.6 3.89 9b 13.9 53.3 2.83 30 175.7 4.86 9c 13.9 52.7 2.79 30 178.2 4.94
10a 13.9 53.4 2.84 30 237.3 6.91 10b 13.9 52.7 2.79 30 178.5 4.95 10c 13.9 52.8 2.80 30 177.2 4.91
PNNL-16794 WTP-RPT-164, Rev 0
Distr. 1
Distribution
No. of Copies OFFSITE
No. of Copies ONSITE
1 Savannah River National Laboratory Richard Edwards Savannah River National Laboratory Westinghouse SA Aiken, SC 29808-0001
15 Pacific Northwest National Laboratory D. L. Blanchard, Jr. P7-25 J. R. Deschane P7-25 S. K. Fiskum P7-22 R. T. Hallen K2-12 J. G. H. Geeting P7-28 D. E. Kurath P7-28 G. J. Lumetta P7-22 R. A. Peterson P7-22 B. M. Rapko (3) P7-25 R. L. Russell K6-24 R. W. Shimskey P7-27 S. I. Sinkov P7-25 L. A. Snow P7-22
2 Bechtel National, Inc. D. Alford (2) H4-02