process management and design layout of high …
TRANSCRIPT

PROCESS MANAGEMENT AND DESIGN LAYOUT OF HIGH THROUGHPUT SCREENING
A Senior Project submitted to
the Faculty of California Polytechnic State University,
San Luis Obispo
In Partial Fulfillment
of the Requirements for the Degree of
Bachelor of Science in Industrial Engineering
by
Kyle Dupuy and A.J. Vasquez

ABSTRACT
PROCESS MANAGEMENT AND DESIGN LAYOUT OF HIGH THROUGHPUT SCREENING
Kyle Dupuy and AJ Vasquez
Calibr is a pharmaceutical company in San Diego and growing very quickly rate and need help redesigning their lab layout and in doing so reducing their cycle times and down times in machines. In addition to this, they do not currently have an accurate measurement of how long their processes take in an overall cycle. The objective of this project is to provide Calibr with a redesigned layout to accommodate new equipment as well as a software tool that can output gantt charts for their planning of their testing. Our approach to this project first included mapping out the facilities at Calibr and creating a current state model to help make improvements off of. To help measure whether or not our designs for our new lab layout would help Calibr, we created a simulation model. The alternative layouts would be determined by the distance traveled for the product and would be evaluated based on cycle time. Our software tool was created using ASP.NET in the C# programming language with the goal of making it customizable for Calibr. One of the conclusions from this project is that there is a high variability in their processes, so the simulation can only be accurate up to a point. However, an optimal location was chosen for the new equipment.
1
TABLE OF CONTENTS
I. Introduction 4 II. Background (includes Literature Review) 5
2.1 Gantt Chart Research: 5 2.2 High Throughput Screening Research: 8
III. Design 11 3.1 Proposed Layouts 11 3.2 Software Tool 13
IV. Methods 14 4.1 Software Tool Testing 14 4.2 Layout Testing 15
V. Results and Discussion 15 5.1 Software Tool Results 15
5.1.1 Limitations of the software tool 16 5.2 Layout Results 17
5.2.1 Limitations of Layout 17 VI. Summary and Conclusions 18
REFERENCES 20
APPENDIX 23
2

TABLE OF FIGURES
Figure 1: Current Layout of the Lab 11 Figure 2: Alternative Layout 1 12 Figure 3: Alternative Layout 2 12 Figure 4: Manual Input Window 14 Figure 5: Gantt Chart Testing Example 14 Figure 6: Gantt Chart Testing Example With Precedence 15 Figure 7: Simulation with new washer at Dispenser 5 17
3

I. Introduction
This subject of this report is about high throughput screening, how scheduling and layout of the lab plays a critical role in increasing the throughput of testing. Calibr is a fairly new company and is emerging in the pharmaceutical market fairly quickly. One major issue with this rapid growth lies in the inexperience of the company when it comes to their processing times. They currently do not have a tally on how long each run can take for each type of compound/solution that they are testing. Knowing these times would lead to possible optimization of the processes as well as an increase in capacity overall. The idea of this project originated through connections that developed at Calibr’s facility with the Director of Medicinal Chemistry. He had noticed that their high throughput screening lab is always looking for ways to improve their efficiency. The lab is continuously growing and is always getting new machines to help increase throughput. The new machines will have to be placed strategically around the lab to make sure that they are being used as efficiently as possible. Problems that need to be solved are solidifying clear processing times of the high throughput screening and the future layout of the lab for the new equipment that they will be receiving. For the layout of the new machines, software will need to be utilized to create a current state model of the laboratory as well as recommend placement of machines to output an efficient workflow. An efficient workflow will include reducing the testing times and the distances the compound plates will travel. In order to solve the issue of uncertain process times and random scheduling, gantt charts will need to be created through some sort of software tool to map all of the times.
The goals of this project are as follows:
● Learn about high throughput screening ● Design layouts to improve throughput ● Decrease the process times and distance traveled by compound plates ● Implement the software tool to create gantt charts
In order to fully accomplish these goals, extensive research on the topic of high throughput screening as well as execution of the requested tasks are highly recommended. For this project, it’s necessary to create a software tool that can output gantt charts in order to accurately display process times and create a basis to work from to improve them. In addition, it will be critical to use software to create a lab layout that will require only the most efficient placements of new machines. As a result of the work, a gantt chart output system using the .NET interface of
4

Microsoft Visual Studio will be produced. Along with this will be a user manual that can be used as a set of directions as well as a troubleshooting guide. Additionally, a physical representation in the form of a computer output will be created to show the best placement for the new equipment.
In order to reach the posted objectives, there are several tasks that need to be completed along the way. To begin with, a detailed mapping of the facilities needs to take place in order to get a feel for how the lab is currently laid out. This will involve travelling to San Diego, meeting with the sponsors, taking pictures of the lab, drawing out paths and obstacles, and recording information that is vital to the layout of the lab. Furthermore, coding work needs to be done to complete the gantt chart creation portion of this project. All of the information that is used to create the project will be presented in future sections in order to get a feel for the progression of the project as well as give the reader the proper information needed to determine how the project was created.
II. Background (includes Literature Review)
The company that this study will be working with for the senior project is a pharmaceutical company named Calibr. Basics of their operation include a high throughput screening where different compounds for upcoming drugs are tested. Some of the topics that are to be included in the literature review were gantt charts, software, and high throughput screening. The gantt chart articles will give insight on what certain companies expect in terms of design. Software articles will help determine how to best to go about creating the software program for Calibr. High throughput screening articles will give background information on the whole operation.
2.1 Gantt Chart Research:
One article that was researched spoke of project management and how gantt charts played into the role. It explained the basics of project management and gantt charts such as how to set up goals and deadlines, and identifying tasks and target dates. Using gantt charts, a process can be planned and scheduled easily and eliminated the non-organized state that exists before this is done. This article is very helpful for the project because it gives a background on what project management is and how gantt charts can help to organize a process’s times and keep a company on track [15].
5

Of course, in addition to the function of gantt charts, the importance of gantt charts in a project management system must be known in order to determine validity of the system. In August 2013, Clément Guerin from the University of Nantes-Angers-Le Mans wrote an article in the International Journal of Industrial Economics, where she described the benefits and drawbacks to using Gantt Charts for scheduling manufacturing orders. The article claims that gantt charts have a significant effect on reducing the waiting times and the total duration of the schedule. Additionally, gantt charts can help with anticipating errors and facilitating rescheduling. This study will help a great deal in determining the correlation between gantt charts and maximization of machine utilization. However, ergonomics is not taken into account in this article, which is something that our software will have to address. Users must feel that the software is easy to use if the software is going to be implemented [6].
To address the need for knowledge in the field of ergonomics for information about the interaction between software and a user, more research was done specifically on this topic. In February 2012, researchers from the Beijing Institute of Technology School of Mechanical Engineering, analyzed the effect of human-computer cooperation with manual scheduling technology. The article claims that automatic scheduling is not suitable for manufacturing in most cases. Additionally, Gantt Charts should be used in conjunction with the model of machine calendar, mouse selected mechanism, and auxiliary function for manual scheduling. This project will rely on the advice of this article with respect to how well humans interact with computers [20]. Determining that automatic scheduling is not usually ideal for manufacturing, more research was put into better forms of manual interaction scheduling between the human user and the computer [12].
Since manual scheduling is the preferred method from a manufacturing point of view, more information was researched and gained on possible improvements to the manual inputs.In May 2016, researches from Youngstown State and Ohio University analyzed the effects of 3D visuals and gantt charts. The study determined that 3D visuals were significantly more effective in helping the employees understand how best to schedule tasks while being as efficient as possible. An effective visual can be much better for helping people interact and understand the data because gantt charts do not show historical information and trends. The study used over 40 different academics and industry professionals [7]. This study will help for this project because
6
3D visuals can be eventually implemented into the software tool for Calibr to make use of it easier to understand for the human user.
Focusing more on the actual scheduling portion of this project, research was completed to learn more about scheduling with constraints, which is heavily involved in this project. In February 2017, researchers from Wuhan University in China performed a study on job shop scheduling with extended technical precedence constraints. The study focused on minimizing total tardiness and the percentage tardy. The study proposed either lowing the amount of technical precedence constraints or reducing the due date tightness, pushing the due dates back allowing for more leniency. The study created a simulation model applying operation research principles with regard to job shop operations. The model made sure not to allow overlapping process time on the same machine. It helps to have a flexible job shop schedule. This article will help with the project by providing a more technical approach to scheduling job shop problems and making way around constraints [19].
To go more in depth on scheduling in the shop and understanding what goes into a dynamic manufacturing system, a case study was examined when, in March 2016, researchers from India’s National Institute of Technology reviewed scheduling rules for job shop problems with sequence-dependent setup times. The study created a discrete event simulation model of the stochastic dynamic job shop manufacturing system. The simulation experiments are conducted under shop utilization percentage of 90% and setup time less than processing time. This article will help us in understanding how the setup times in a high throughput screening lab can affect our simulation models and our gantt chart software. Because the high throughput screening of chemical compounds is dependent on how quickly the biologists are able to provide the assays our project will have to treat this operation as a job shop type problem [8].
Possibly one of the most valuable pieces of research was regarding gantt chart creation given certain constraints, which is basically what this project involves.This article of interest was “Automatic Conversion of Software Specification into a Gantt-Chart subject to Organization's Constraints,” which talked about the process of creating a gantt chart software based on the given conditions by an employer. In the article, they talk about a prototype model that was created originally as their gantt chart tool. This may be helpful when completing the project to make sure that the tool is tested before we actually release it to our company [11]. Obviously, this is important since the tool will need to be fully-functional when presented to Calibr.
7

To gain additional knowledge on the premise of gantt charts, another researched article called “Optimization of Time Structures in Manufacturing Management by using Scheduling Software Lekin” was another good source of information towards the overall project. This journal explained the backbones of what gantt charts are and what they are used for. Additionally, there were sections within that had information regarding gantt charts using software tools. The information from this article will be critical toward understanding how to best distribute and analyze the different process times of the operations [18].
2.2 High Throughput Screening Research:
To gain knowledge of what is actually going on in the high throughput screening process, the article “Rapid and accurate detection of Escherichia coli growth by fluorescent pH-sensitive organic nanoparticles for high-throughput screening applications” presents itself as a valid and viable source of information. This article gives an inside look at the high throughput screening, similar to the way Calibr runs. Through processes like fluorescence spectroscopy, different compounds can be classified into different categories such as failed and not failed [17].
In addition, a study was done through GloxoSmithKline (GSK) to determine the validity of high throughput screening in a large-scale setting. Their efforts spanned over two main ideas: optimization of high throughput screening and how it worked in terms of being a quality process as well as the statistical implementations of it, including things such as evaluation and reproducibility. Reasoning behind this study include the rise of high throughput screening in today’s biomedical market and how it has been used as a useful and major tool in many different types of activities in the field [14].
In April 2016, a group of researchers at Stanford University did a study on Lyme disease and possible cures using the high throughput screening process. Lyme disease is one of the most common diseases in our country in terms of bacterial diseases, so it was appropriate to research the topic. It was estimated that over 4000 compounds were available to test, however, only around 150 were appropriate to test for this particular condition. Even then, only 101 of the compounds tested were valid and FDA approved. Additionally, the compounds were filtered even more to the top 20. The most important aspect of this study was the safety found through the FDA in the samples. The FDA sets certain regulations when it comes to concentrations of
8
bacteria, which helps to determine a valid and safe result. Calibr must do a similar type of screening for their own compounds to avoid testing an unnecessary amount [13].
Also, a study was done by a team of researchers to help determine the feasibility of the high throughput screening process in protein formulations. This was done by studying the proteins in salmon calcitonin. Over 100 solutions were formulated and tested. After only the first day, around 27 solutions were still valid and stable. However, by the end there were only around 12 solutions that proved to be stable. The stability of the compounds was tested through a variety of assays including protein concentration, volume control, turbidity, and other fluorescence measures. These pathways are very similar to the ones testing in the lab at Calibr [3].
Another a study was done by a team in the UK on a disease called schistosoma mansoni, which affects around 600 million people. The disease is brought on by parasites that are carriers. It is a very “fragile” disease in the sense that it can be harmful if not caught in the preliminary stages. For this study, around 300,000 compounds were tested through high throughput screening. This process was used to discover active compounds in the solutions from the worms that would assess cytotoxicity and a large number of compounds were considered to be a success in determining more information about the disease and what can be used to cure or relieve it [10]. Although Calibr does not test for the same disease this study helped clarify the role high throughput screening plays in stopping diseases in the preliminary stages.
Furthermore, a team of researchers with Nature Medicine conducted a study regarding cancer treatment using the process of high throughput screening. To do this, they received xenograft models of the tumors on existing cancer patients and determined the solutions to create from there. In this experiment, a total of 62 treatments were tested. Reproducibility and clinical translatability were the biggest determining factors as the research aimed to help all cancer patients in the country. Resulting data showed that the PCT approach was more accurate than a PDX approach because it gave a better potential of therapeutic modalities. The response is that hopefully this information will help clinics determine cancer faster and treat the patients in the early stages. Catching diseases early can be done through high throughput screening [5].
Similarly, researchers with the Food and Drug Administration (FDA) in the United States looked into the premise of failed drug development programs and why they were happening. A major issue that needed to be investigated was hospital acquired diseases such as pneumonia or ventilator associated pneumonia. The second major issue was that there was little organization at
9

first to the process, which led to the failures. Fortunately, using gantt charts, the process times were able to be mapped out more accurately. In response, risk was reduced and the failures were alleviated. [1] These are some of the KPIs this report will attempt to address at Calibr.
Moreover, in April of 2016, researchers from University of Twente in the Netherlands looked at the effect the types of assays had on high throughput screening of chemical compounds. The study had concluded that although there are many different types of assays that will be suitable for screening, microfluids will provide the best results in simulating a how the chemical compound will act in the human body. Microfluids are often times on a submillimeter level and are a close representation of what the physiological conditions are with humans. This article helped give a better understanding of how the high throughput screening tests should be scheduled [2].
Additionally, researchers from Harvard, MIT, and Brown University, studied microengineering methods for cell-based microarrays and high-throughput drug-screening applications. The article compares and contrasts the following methods: Drug Patterning, Stamping Method, Microfluidic Drug Loading, and Aerosol Spray. One of the issues this article also addresses is cross-contamination for loading drugs into microarrays. This will be very helpful for giving a better understanding the processes Calibr uses and some of the challenges they might be facing. Hopefully, this study will lead to improving any bottlenecks or defects that might be occurring in their current screening process at Calibr [16].
To conclude, the literature reviews proved to be extremely helpful to gain knowledge on all of the aspects of the project. Breaking down the research into different categories helped to alleviate the complexity of the subject itself. Although the research helps give a better understanding of the high throughput screening overall and how gantt charts can help increase efficiency, Calibr will still need a unique software tool tailored to the specific needs and capacity of their lab. In addition, proposed layouts for their lab with minimized moving distances of the compounds will be needed to help increase efficiency.
III. Design
Moving into the design phase, this section will mainly focus on the specifications and constraints of the proposed layouts and software tool. To begin, it was important to understand
10
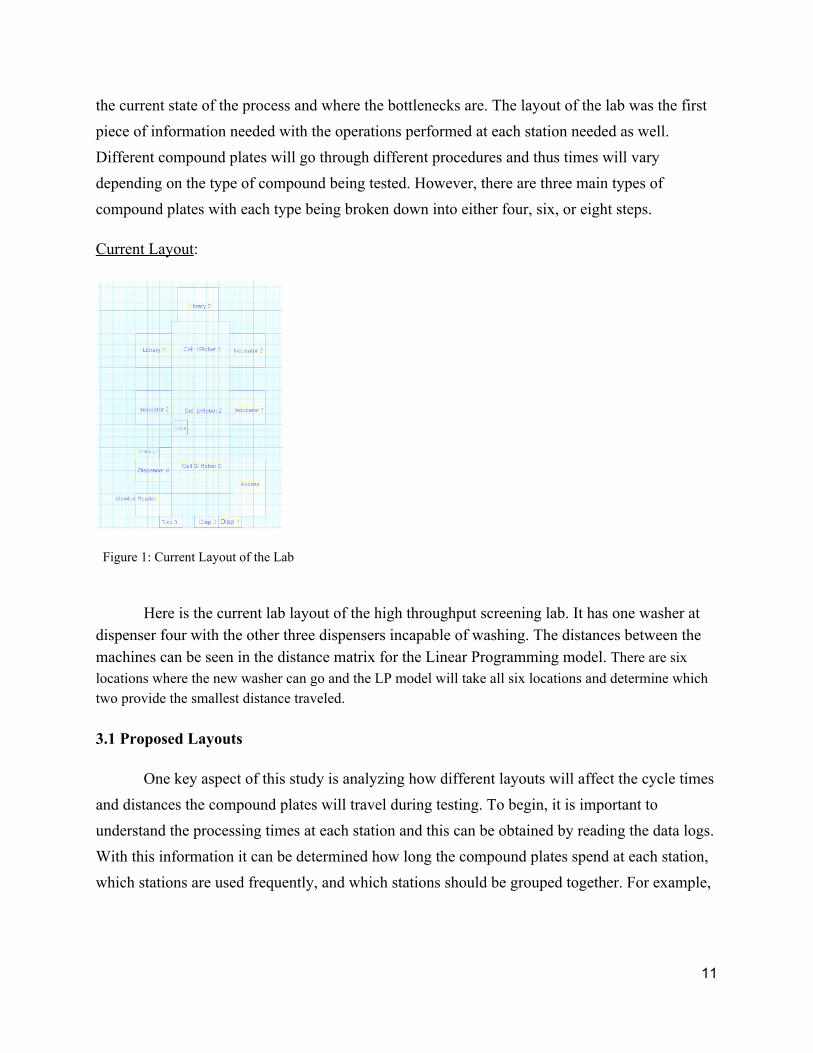
the current state of the process and where the bottlenecks are. The layout of the lab was the first piece of information needed with the operations performed at each station needed as well. Different compound plates will go through different procedures and thus times will vary depending on the type of compound being tested. However, there are three main types of compound plates with each type being broken down into either four, six, or eight steps.
Current Layout:
Figure 1: Current Layout of the Lab
Here is the current lab layout of the high throughput screening lab. It has one washer at dispenser four with the other three dispensers incapable of washing. The distances between the machines can be seen in the distance matrix for the Linear Programming model. There are six locations where the new washer can go and the LP model will take all six locations and determine which two provide the smallest distance traveled.
3.1 Proposed Layouts
One key aspect of this study is analyzing how different layouts will affect the cycle times and distances the compound plates will travel during testing. To begin, it is important to understand the processing times at each station and this can be obtained by reading the data logs. With this information it can be determined how long the compound plates spend at each station, which stations are used frequently, and which stations should be grouped together. For example,
11

the station storing the compound plates should be placed next to the barcode reader so the distance the robotic arms need to transfer the plate is minimized.
Proposed Layout 1: Proposed Layout 2:
Figure 2: Alternative Layout 1 Figure 3: Alternative Layout 2
These are the alternative layouts that are recommended for the lab. The layouts are based on an LP model where the objective function is to minimize distance traveled by the compound plates between the locations preceding and proceeding the new washer. Theoretically this should reduce the cycle time because another server is being added and the new washers make it so the compound plates travel as minimal distance as possible. The first layout should have the lowest cycle time because it has the shortest distance but this will need to be verified through the simulation study.
To account for new machines it will be important to establish a flow for the compound plates to follow. If a clear flow is created it will be easy to see where the bottlenecks in the process are occurring and where the new machines can be added to alleviate the bottlenecks. Simulation models will need to be created to make sure that the proposed layouts are actually solving the issue of compound plates building up at particular stations. For example, the plate washing station is a bottleneck where compound plates will build up waiting to be cleaned and used again. Multiple simulation models will need to be created to see if simply moving the
12

washing station to different locations can help solve this issue or if adding a second washing machine will greatly reduce the build up. To determine if adding a second washing machine is warranted it will be necessary to perform an economic analysis as well.
3.2 Software Tool
In order to create the software tool for use in this project, Microsoft Visual Studio and Azure must be utilized to code the tool and host it on a web server, respectively. The most important aspect of the software tool is that the input is user-friendly. In order to do this, simple data entry spaces will be available to input data points as well as easy-to-read buttons that carry out the function to create gantt charts using the information that is entered. The user interface will be followed up with a user-manual or set of instructions showing how to use the software with sets of data. Shown below is the manual input function of the software tool, which includes a space to give a brief description of the specific process that is going to be mapped as well as the time period that it will be starting.
Figure 4: Manual Input Window
In addition to this, the user has the option to specify how long the task will take. For error-proofing, there is a cancel option and a delete option. Once the task is saved, it will be automatically uploaded onto the gantt chart window.
13

Figure 5: Gantt Chart Testing Example
Functions were written in VBA code that can transform the data that is entered into information that can be pieced into a gantt chart. For the tool to run smoothly, there is a large amount of coding behind the interface. The plan for the code is to create three separate functions that create gantt charts using different types of scheduling rules. These rules include the critical ratio rule, the most work remaining rule, and the least work remaining rule. The critical ratio relates the time remaining to work on a job and the time remaining to process, determining if the job is too early, late, or a JIT (Just In Time) project. The most work remaining rule involves scheduling the project to work on tasks that have the most amount of processing first before the less time-intensive ones. The least work remaining rule is quite simply the exact opposite of the most work remaining rule in that the process goes on while completing the tasks that have the least amount of processing time first before working on anything else. Interpreting different types of scheduling rules will make the project applicable in different practices.
IV. Methods
4.1 Software Tool Testing
When it came to conducting testing of our project, there were several aspects that needed to be tested, which included the following:
● Functionality of the software tool ● Visual clarity and ease of use of the software tool ● Layout distance travelled ● Layout cycle time reduction
With all of this in mind, there needed to be a way to test all of this. The software tool was difficult to receive detailed feedback on since the company that we are working with is far away. In order to receive meaningful feedback on it, we really needed to be there in person to show the people at Calibr how it works and how certain things can be further customized. However, we did run several tests on the tool with data that we were given from the company. In doing this, we discovered that there were a few bugs in our program that needed to be resolved, including issues with our time scales and the autoscaled functions of the gantt chart outputs. After fixing these issues, we had a much better product that more easily conforms to our company’s needs. Shown below is the result of our final testing with our software tool.
14

Figure 6: Gantt Chart Testing Example With Precedence
As one can see, the output is scaled to the screen and each task can be easily seen in the gantt chart itself as well as in the task box on the left. There is precedence that can be assigned with the use of arrows, which are easily created by clicking and dragging arrows in between the specified tasks. Our final tests gave us the best resulting product which is the one shown above. 4.2 Layout Testing
When it came to simulating the system, the main question the simulation addresses is whether or not the new washer will reduce cycle time. The system has a large amount of variability in the methods the compounds plates are tested with. However, 70% of the tests that are conducted have a consistent testing method while the other 30% have random test times that vary greatly in the amount of steps and their cycle times. For this reason the model will focus on the tests that have a consistent method. The arrival rate of the compound plates can vary greatly as well but this can be taken into account by having the arrival rate of the entity, compound plates, be a uniform distribution. The minimum is the lowest amount of compound plates that have arrived on a single day while the maximum is the most amount of compound plates that have arrived on a single day. In addition the layout of the simulation does not match the actual layout of the lab because it would make it difficult for Calibr to visualize where the bottlenecks are occurring and how much of an impact the washer will make. V. Results and Discussion
5.1 Software Tool Results
In conclusion of our testing of the software tool for this project, we found that it was very helpful way for Calibr to plan out their processes and to manage their projects. We were able to hit on all of the points that were requested from us in the manual input, ease of use, server hosting, precedence options, and scalable display. Although we used a coding package, the customizations had to be researched in terms of how to do them since the package had its own specific functions and statements. Our project can be easily accessed through any computer that has internet as it runs through localhost. The file information will be sent to Calibr as well as a how-to guide on using the tool and how to troubleshoot any problems that may arise in using it (although, it is fairly immune to any troubles). In addition to this, our goal was to save money for
15

our company, which shows in all of the man hours put into the coding of the tool as well as the absence of the cost of the programs themselves.
Based on these results, we can confidently say that the tool will help the growing company in keeping on track and planning their tasks to stay up to date with the demand for drug testing. This will hopefully lead to more productivity in the lab which means that more tests will be conducted. Any problems that may arise when using the product could be in the time scale. It is currently set in minutes to accommodate for small tests that the data showed us, however Calibr may need to set it to hours or even days in the future to accommodate for more diverse types of tests or processes. Information on how to fix this scale will be included in the how-to guide that will be sent to the company.
Although we believe that this tool will help Calibr greatly, it will definitely need to be updated in the future if the company continues to grow. With an extremely productive drug testing environment, there may need to be some sort of automated upload of tasks to gantt charts, which will involve more coding to sync the machines to the software. In addition to this, the company may want to consider running the tool on a cloud server, such as Microsoft Azure to ensure a more secure and reliable way to host the program. 5.1.1 Limitations of the software tool
In terms of the software tool, there are some limitations that may apply when Calibr tries to use it. As of right now, there is no way on the tool to save any processes to a local file or on a cloud server. Therefore, in order for the company to see their gantt charts at any point in time, the program will need to be open. We believed that this was not a huge issue since the lab is set to run for 24 hours per day, meaning that the data is always being updated anyways and is constantly running. Another form of limitation that our company can face when using our software tool is the auto scaling feature at a point, meaning that the autoscale only works up to a certain point. If there are hundreds of different tasks that are inputted, the screen can only scale all of the tasks in an appropriate way. This may lead to the user having to sideways scroll over to view all of the tasks. Again, this is only meant to be a preliminary planning tool that will conform to their current operation and may be modified in the future to better fit their growth. Although, there are no questions that have been left unanswered or any points of interest that have not been touched on according to the requirements from Calibr, so we believe that the tool, despite some of its limitations, will work well for the company going forward. 5.2 Layout Results
The simulation study reveals that the first alternative layout is the most effective at reducing the cycle time of the compound plates. Here is what the simulation looks like when the second washer has been added:
16

Figure 7: Simulation with new washer at Dispenser 5 The cycle time of this alternative is 26.31 hours which is over a half an hour less than the current layout’s cycle time of 26.83 hours. 24 hours of this time is spent incubating which makes up most of the cycle time. This makes sense that the cycle time is reduced because as queuing theory states adding an additional server will reduce the time in system (cycle time).
In addition, the simulation study shows that the second alternative layout is not as efficient as the first alternative. The second layout has a slightly higher cycle time of 26.40 hours and a larger distance traveled as shown in the LP model. Even though the second alternative layout is not as efficient as the first, it is still better than the current state and reduces the cycle time by 0.43 hours or 25.8 minutes. Again queuing theory confirms that our simulation study makes sense theoretically because adding an additional server reduces the time in system. The larger cycle time for the second layout can be attributed to the longer distance that the compound plates have to travel. 5.2.1 Limitations of Layout
One of the limitations of the simulation study is that the study only focuses on one specific type of testing method. This is because this one specific testing method makes up over 70% of all tests run in the high throughput screening lab. The other tests are too variable to accurately measure in a simulation study. However, the main goal of the model is to ensure that the cycle time is reduced by adding another washer and this is accomplished with this model. In addition, the simulation does not look exactly like the lab layout. This is due to the fact that if the lab layout was modeled exactly it would be difficult for Calibr to see where the compound plates are building up. Also, if the lab layout was modeled exactly the paths would be too close
17

together and it would be impossible to understand how the compound plates flow and how each station is connected to one another.
VI. Summary and Conclusions
Calibr, a growing pharmaceutical company does not currently have an accurate tab on their process times and overall lengths and has conflict in planning them without a proper software tool. Additionally, they are receiving a new washer machine and are unsure of where it needs to be placed in order to reduce their cycle times and to minimize the total distance travelled of the samples.
Our objectives for this project were quite simply to create a basis to improve the problems that were stated in our project statement. Also, we wanted to go through research to learn more about high throughput screening and how other companies are utilizing this to create a more efficient way of testing drugs. We knew that we wanted to create a software tool that could output gantt charts with user inputted information as well as a new layout to accommodate their new machinery.
In order to approach a solution, there needed to be several areas of work done in each requirement to best fit the company. In the area of the software tool, customized code was needed to ensure that the program would tailor to the needs of Calibr. This was eventually tested through practice runs of adding processes from our data set and fixing any issues that arose during that time. In terms of our layout, we needed to create one that would minimize the total cycle time of a drug being tested as well as the distance that it travelled throughout the process. To test out different layouts, we utilized Simio (a simulation software) to figure out the best placement for the new washer. The following is a list of conclusions to take away from the project:
● The software tool is user-friendly and accurately projects process onto an easy-to-read medium.
● Our best location to place the new washer is in between Incubator 2 and Dispenser 4 ● There are some limitations to each aspect of the project
Some of the most important results that were found after completing the project were in
the layout area. Simulation software was key to test each alternative to create the most efficient one. Since there are functions in this software to determine these exact parameters, we felt that Simio was an extremely appropriate software. This is why it seems to be fairly accurate in the readings of the cycle times and distances travelled.
Based on the results of the simulation study it can be said that by adding an additional server to a process that is a bottleneck the cycle time can be reduced. The additional washer
18

helps reduce the cycle time by over half an hour. This study helps verify the notion proposed by queuing theory that adding additional servers helps reduce the time in system spent by an entity. Because queuing theory is meant for a very specific situation a simulation study is necessary. This project uses the simulation study to more accurately measure the system and help quantify how much the cycle time is reduced.
In terms of accomplishing the objectives of the project as listed in the introduction, this project was able to accomplish each goal. The first goal is to learn about high throughput screening. Through literature reviews, viewing the process, and talking to Calibr our group was able to learn a great deal about high throughput screening and how it can be used in the drug development process. The second goal is to design layouts to improve throughput and this was accomplished by modeling the current layout and using a linear programming model to determine where the best possible location for an addition washer would be. To accomplish the third goal a combination of simulation study and a linear programming model was used to decrease the process times and distance traveled by the compound plates. Finally, the last goal of implementing a software tool to create gantt charts was also accomplished through the use of Microsoft Visual Studio and many hours spent coding.
Our group learned a great deal about how to manage a project when there is a great distance between a group and the company. This taught our group to make the most out of each meeting with the company and to make sure to be as efficient as possible. In terms of what we would do differently, our group would certainly try to pick one specific area of study instead of having multiple areas. Although this helped us get a much better idea of the process as a whole, we were unable to delve as deep as we wanted into one specific topic.
19

REFERENCES [1] Ambrose, Paul G., et al. "Pharmacokinetic-Pharmacodynamic Considerations in the Design
of Hospital-Acquired or Ventilator-Associated Bacterial Pneumonia Studies: Look
Before You Leap!." Clinical Infectious Diseases, vol. 51, 8/1/2010 Supplement 1, pp.
S103-S110. EBSCOhost, doi:10.1086/653057.
[2] Barata, David, Clemens van Blitterswijk, and Pamela Habibovic. "High-throughput
Screening Approaches and Combinatorial Development of Biomaterials Using
Microfluidics." Acta Biomaterialia, 34 (2016): 1-20.
[3] Capelle, Martinus A.H., Robert Gurney, and Tudor Arvinte. "A High Throughput Protein
Formulation Platform: Case Study of Salmon Calcitonin." SpringerLink. Pharm Res,
2009. Web. 7 Mar. 2017.
[4] Chiang, Tsung-Che, and Li-Chen Fu. "Using a Family of Critical Ratio-based
Approaches to Minimize the Number of Tardy Jobs in the Job Shop with
Sequence Dependent Setup Times." European Journal of Operational Research,
196.1 (2009): 78-92.
[5] Gao, Hui, et al. "High-Throughput Screening Using Patient-Derived Tumor Xenografts to
Predict Clinical Trial Drug Response." Nature Medicine, vol. 21, no. 11, Nov. 2015, pp.
1318-1325. EBSCOhost, doi:10.1038/nm.3954.
[6] Guerin, Clement, Jean-Michel Hoc, and Nasser Mebarki. “The nature of expertise in
industrial scheduling: Strategic and tactical processes, constraint and object
management.” International Journal of Industrial Ergonomics 42 (2012): 457-468. Web.
04 Feb. 2017.
20
[7] Jaber, Khaled, Bonita Sharif, and Chang Liu. "An Empirical Study on the Effect of 3D
Visualization for Project Tasks and Resources." The Journal of Systems & Software, 115
(2016): 1-17.
[8] Jing-sheng, LI, WANG Ai-min, TANG Cheng-tong, and LU Zhi-bing. "Research on Manual
Scheduling Technology Using the Pattern of Human-computer Cooperation." Advanced
Materials Research 472-475 (2012): 3228-235. Advanced Materials Research. Web. 4
Feb. 2017.
[9] Lu, M.-S, and R Romanowski. "Multicontextual Dispatching Rules for Job Shops
with Dynamic Job Arrival." The International Journal of Advanced
Manufacturing Technology, 67.1 (2013): 19-33.
[10] Mansour, Nuha R., et al. "High Throughput Screening Identifies Novel Lead Compounds
with Activity against Larval, Juvenile and Adult Schistosoma Mansoni." Plos Neglected
Tropical Diseases, vol. 10, no. 4, 29 Apr. 2016, pp. 1-12. EBSCOhost,
doi:10.1371/journal.pntd.0004659.
[11] M, Dayani, and Gelbard R. "Automatic Conversion of Software Specification into a
Gantt-Chart Subject to Organization's Constraints." ScienceDirect. N.p., 2015. Web. 02
Feb. 2017.
[12] Nakagiri, Daiju, and Sennosuke Kuriyama. "A Study of Production Management
System with MRP." International Journal of Production Economics, 44.1 (1996):
27-33.
[13] Pothineni, Venkata Raveendra, Dhananjay Wagh, Mustafeez Mujtaba Babar, Mohammed
Inayathullah, David Solow-Cordero, Kwang-Min Kim, Aneesh V. Samineni, Mansi B.
Parekh, Lobat Tayebi, and Jayakumar Rajadas. "Identification of New Drug Candidates
21
against Borrelia Burgdorferi Using High-throughput Screening." Drug Design,
Development and Therapy. Dove Medical Press, 2016. Web. 08 Mar. 2017.
[14] "Process Validation and Screen Reproducibility in High-Throughput Screening." Society for
Biomolecular Sciences, 2009. Web. 7 Mar. 2017.
[15] "Project Management." Pharmaceutical Representative, vol. 40, no. 5, May 2010, pp. 26-29.
EBSCOhost,
search.ebscohost.com/login.aspx?direct=true&db=aph&AN=50287136&site=ehost-live.
[16] Sharma, Pankaj, and Ajai Jain. "New Setup-oriented Dispatching Rules for a Stochastic
Dynamic Job Shop Manufacturing System with Sequence-dependent Setup Times."
Concurrent Engineering, 24.1 (2016): 58-68.
[17] Si, Yang, Chloe Grazon, Gilles Clavier, and Jutta Rieger. "Rapid and Accurate Detection of
Escherichia Coli Growth by Fluorescent PH-sensitive Organic Nanoparticles for
High-throughput Screening Applications." ScienceDirect. N.p., 15 Aug. 2015. Web. 02
Feb. 4.
[18] Tem Journal. Volume 5, Issue 3, Pages 319-323, Issn 2217-8309, Doi: 10.18421/tem53-11,
August 2016. Optimization of Time Structures in Manufacturing Management by
UsingScheduling Software Lekin (n.d.): n. pag. Web. Feb.2017.
[19] Xiong, Hegen, Huali Fan, Guozhang Jiang, and Gongfa Li. "A Simulation-based Study of
Dispatching Rules in a Dynamic Job Shop Scheduling Problem with Batch Release and
Extended Technical Precedence Constraints." European Journal of Operational Research,
257.1 (2017): 13-24.
[20] Xu, Feng, JingHui Wu, ShuQi Wang, and Naside Gozde Durmus. "Research on Manual
Scheduling Technology Using the Pattern of Human-computer Cooperation."
Biofabrication3 (2011): n. pag. Inspec [EBSCO]. Web. 4 Feb. 2017.
22

APPENDIX
Tests run per day
Day T N C
1 2232 0 359
2 2520 0 162
3 630 3069 125
4 748 114 0
5 2130 1413 0
6 2492 122 0
7 1300 0 0
8 1540 0 10
Average 1699 589.75 82
Percent of total 0.716650849 0.248760941 0.03458821
Different Testing Methods
23

Pareto chart of testing method to focus on
LP Model to determine first location
24

LP Model to determine second location
25