process planning and technology decisions · batch production is characterized by fluctuating...
TRANSCRIPT
Process Planning and Technology Decisions
Types of Processes
We introduced the product-process matrix and four types of processes in Chapter 2--projects, batch production, mass production, and continuous production. Let us look at them more closely here and explore the implications of process choice for a firm.
Projects
Projects represent one-of-a-kind production for an individual customer. They tend to involve large sums of money and last a considerable length of time. For those reasons, customers are few and customer involvement intense. Customers are heavily involved in the design of the product and may also specify how certain processes are to be carried out. In some cases, the customer will have representatives on site to observe the production process, or send in inspectors to certify quality at critical stages of project development.
Most companies do not have the resources (or time) to complete all the work on a project themselves, so subcontracting is common. The production process, as well as the final product, are basically designed anew for each customer order. Thus, the process is very flexible. And given the lengthy duration of a project, changes in customer preferences, technology, and costs cause frequent adjustments in product and process design. Managing these engineering change orders (ECO) is a major concern in project management. Another concern is keeping track of all the activities that are taking place and making sure they are completed correctly and on time, so as not to delay other activities.
Cutting-edge technology, project teams, and close customer contact make project work exciting. But projects can also be risky with their large investment in resources, huge swings in resource requirements (as new projects begin and old ones end), limited learning curve, and dependence on a small customer base.
Examples of projects include constructing a building, airplane, or ship; planning a rock concert; and developing a new product. Projects are managed very differently from other types of processes. We discuss project management in detail in Chapter 17.
Batch Production
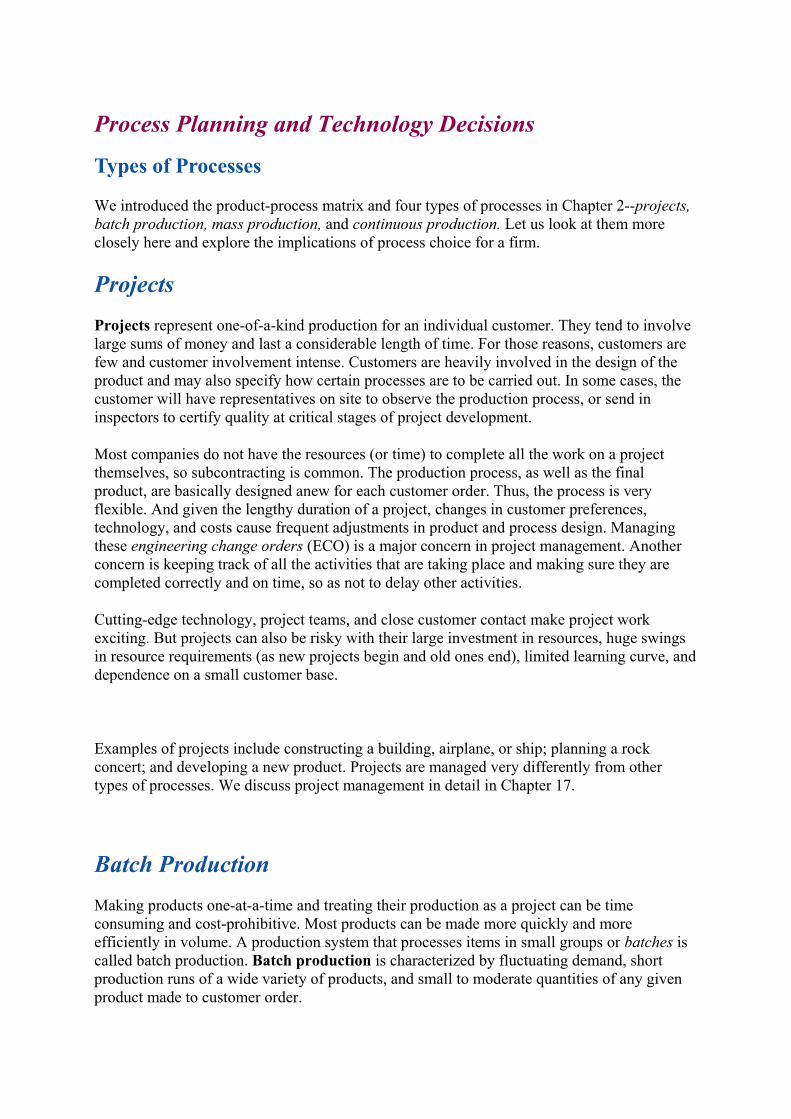
Making products one-at-a-time and treating their production as a project can be time consuming and cost-prohibitive. Most products can be made more quickly and more efficiently in volume. A production system that processes items in small groups or batches is called batch production. Batch production is characterized by fluctuating demand, short production runs of a wide variety of products, and small to moderate quantities of any given product made to customer order.
Most of the operations in batch production involve fabrication (e.g., machining) rather than assembly. Jobs are sent through the system based on their processing requirements, so that those jobs requiring lathe work are sent to one location, those requiring painting to another, and so forth. A job may be routed through many different machine centers before it is completed. If you were to track the flow of a particular customer order through the system, you would see a lot of stopping and starting as jobs queue at different machines, waiting to be processed. Work on a particular product is not continuous; it is intermittent.
Batch production systems are also known as job shops. Examples include machine shops, printers, bakeries, education, and furniture making. Advantages of this type of system are its flexibility, the customization of output, and the reputation for quality that customization implies. Disadvantages include high per-unit costs, frequent changes in product mix, complex scheduling problems, variations in capacity requirements, and lengthy job completion times.
Mass Production
Mass production is used by producers who need to create more standardized products in larger quantities than batch production can economically handle. Products are made-to-stock for a mass market, demand is stable, and volume is high. Because of the stability and size of demand, the production system can afford to dedicate equipment to the production of a particular product. Thus, this type of system tends to be capital-intensive and highly repetitive, with specialized equipment and limited labor skills.
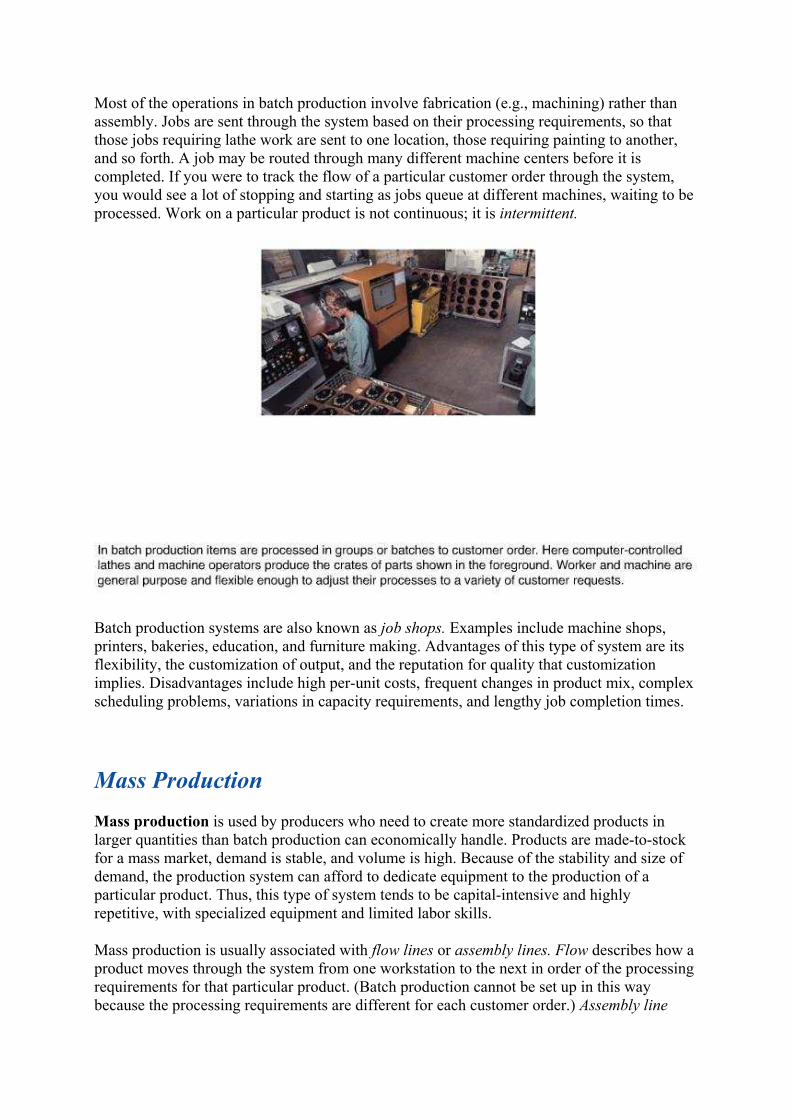
Mass production is usually associated with flow lines or assembly lines. Flow describes how a product moves through the system from one workstation to the next in order of the processing requirements for that particular product. (Batch production cannot be set up in this way because the processing requirements are different for each customer order.) Assembly line
describes the way mass production is typically arranged--most of the operations are assembly-oriented and are performed in a line. Goods that are mass-produced include automobiles, televisions, personal computers, fast food, and most consumer goods.
Advantages of mass production are its efficiency, low per-unit cost, ease of manufacture and control, and speed. Disadvantages include the high cost of equipment, underutilization of human capabilities, the difficulties of adapting to changes in demand, technology, or product design, and the lack of responsiveness to individual customer requests.
Continuous Production
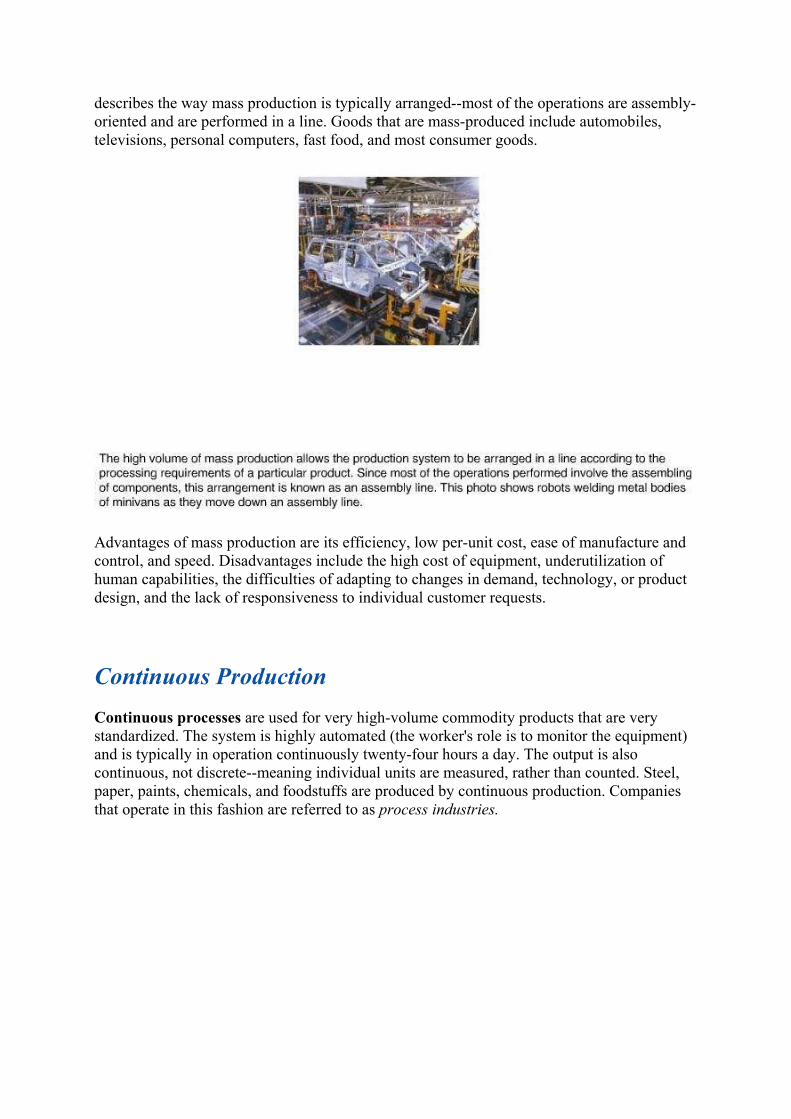
Continuous processes are used for very high-volume commodity products that are very standardized. The system is highly automated (the worker's role is to monitor the equipment) and is typically in operation continuously twenty-four hours a day. The output is also continuous, not discrete--meaning individual units are measured, rather than counted. Steel, paper, paints, chemicals, and foodstuffs are produced by continuous production. Companies that operate in this fashion are referred to as process industries.
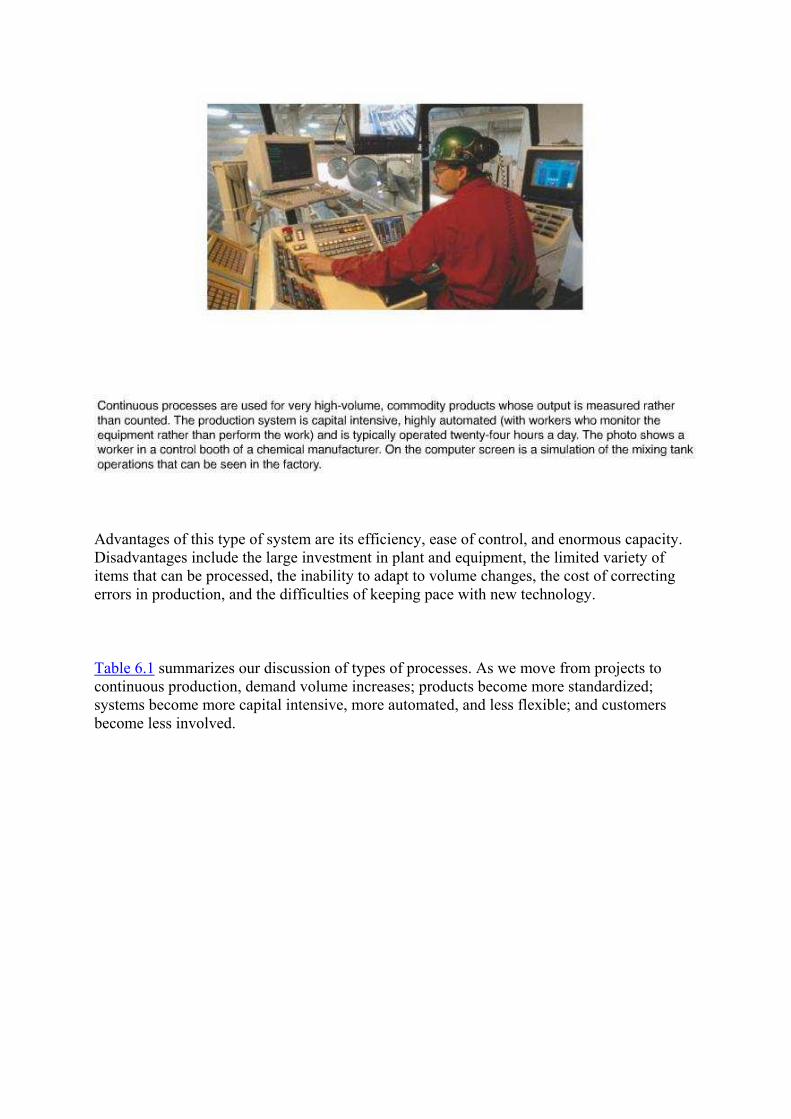
Advantages of this type of system are its efficiency, ease of control, and enormous capacity. Disadvantages include the large investment in plant and equipment, the limited variety of items that can be processed, the inability to adapt to volume changes, the cost of correcting errors in production, and the difficulties of keeping pace with new technology.
Table 6.1 summarizes our discussion of types of processes. As we move from projects to continuous production, demand volume increases; products become more standardized; systems become more capital intensive, more automated, and less flexible; and customers become less involved.

Process choice depends on a firm's strategy, the type of products, type of customers, volume of demand, and organizational capabilities. The degree of automation is one aspect of process choice that can be quantified based on cost factors and demand volume. Break-even analysis, presented in the next section, is a commonly used quantitative technique.
Process Selection with Break-Even Analysis
There are several quantitative techniques available for selecting a process. One that bases its decision on the cost trade-offs associated with demand volume is break-even analysis. The components of break-even analysis are volume, cost, revenue, and profit.
Volume is the level of production, usually expressed as the number of units produced and sold. We assume that the number of units produced can be sold.
Cost is divided into two categories, fixed and variable. Fixed costs remain constant regardless of the number of units produced, such as plant and equipment and other elements of overhead. Variable costs vary with the volume of units produced, such as labor and material. The total cost of a process is the sum of its fixed cost and its total variable cost (defined as volume times per unit variable cost).
Revenue on a per-unit basis is simply the price at which an item is sold. Total revenue is price times volume sold. Profit is the difference between total revenue and total cost. These components can be expressed mathematically as follows:

In selecting a process, it is useful to know at what volume of sales and production we can expect to earn a profit. We want to make sure that the cost of producing a product does not exceed the revenue we will receive from the sale of the product. By equating total revenue with total cost and solving for v, we can find the volume at which profit is zero. This is called the break-even point. At any volume above the break-even point, we will make a profit. A mathematical formula for the break-even point can be determined as follows:
EXAMPLE
6.1 Break-Even Analysis
Several graduate students at Whitewater University formed a company called the New River Rafting Company to produce rubber rafts. The initial investment in plant and equipment is estimated to be $2,000. Labor and material cost is approximately $5 per raft. If the rafts can be sold at a price of $10 each, what volume of demand would be necessary to break even?
SOLUTION:
Given the following:
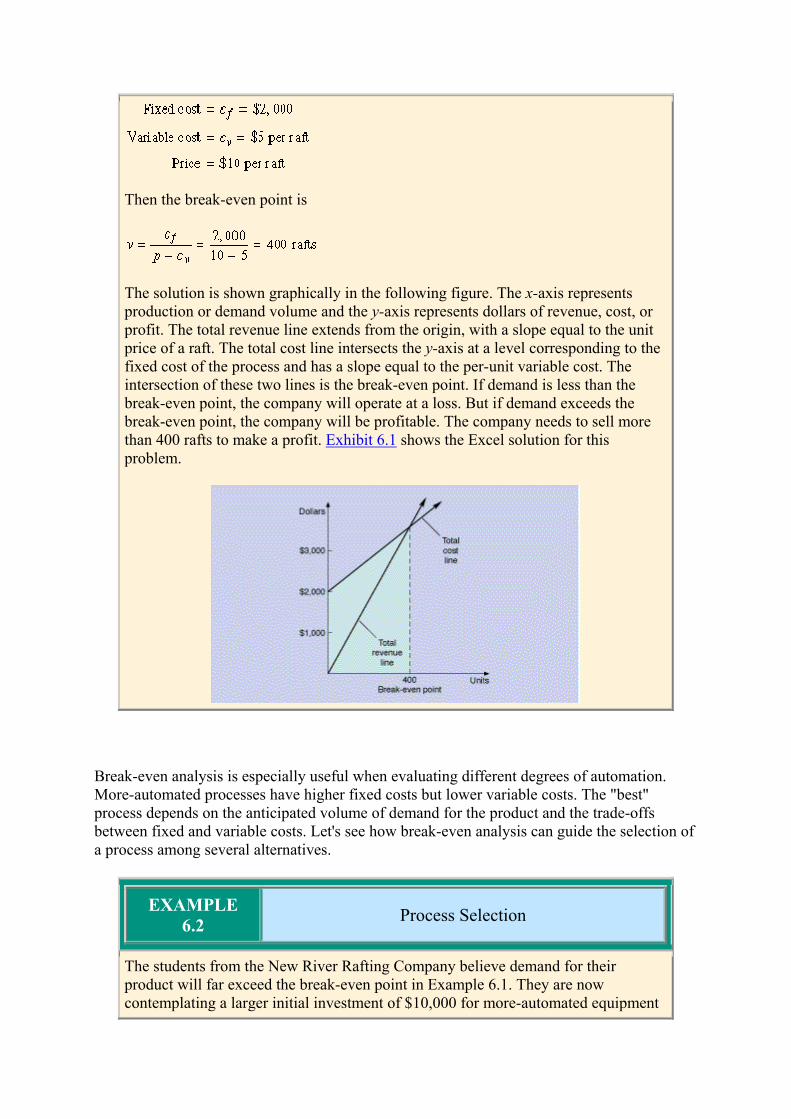
Then the break-even point is
The solution is shown graphically in the following figure. The x-axis represents production or demand volume and the y-axis represents dollars of revenue, cost, or profit. The total revenue line extends from the origin, with a slope equal to the unit price of a raft. The total cost line intersects the y-axis at a level corresponding to the fixed cost of the process and has a slope equal to the per-unit variable cost. The intersection of these two lines is the break-even point. If demand is less than the break-even point, the company will operate at a loss. But if demand exceeds the break-even point, the company will be profitable. The company needs to sell more than 400 rafts to make a profit. Exhibit 6.1 shows the Excel solution for this problem.
Break-even analysis is especially useful when evaluating different degrees of automation. More-automated processes have higher fixed costs but lower variable costs. The "best" process depends on the anticipated volume of demand for the product and the trade-offs between fixed and variable costs. Let's see how break-even analysis can guide the selection of a process among several alternatives.
EXAMPLE
6.2 Process Selection
The students from the New River Rafting Company believe demand for their product will far exceed the break-even point in Example 6.1. They are now contemplating a larger initial investment of $10,000 for more-automated equipment
that would reduce the variable cost of manufacture to $2 per raft.
a. What is the break-even point for this new process? b. Compare the process described in Example 6.1 with the process proposed
here. For what volume of demand should each process be chosen?
SOLUTION:
a. The break-even point for the new process is
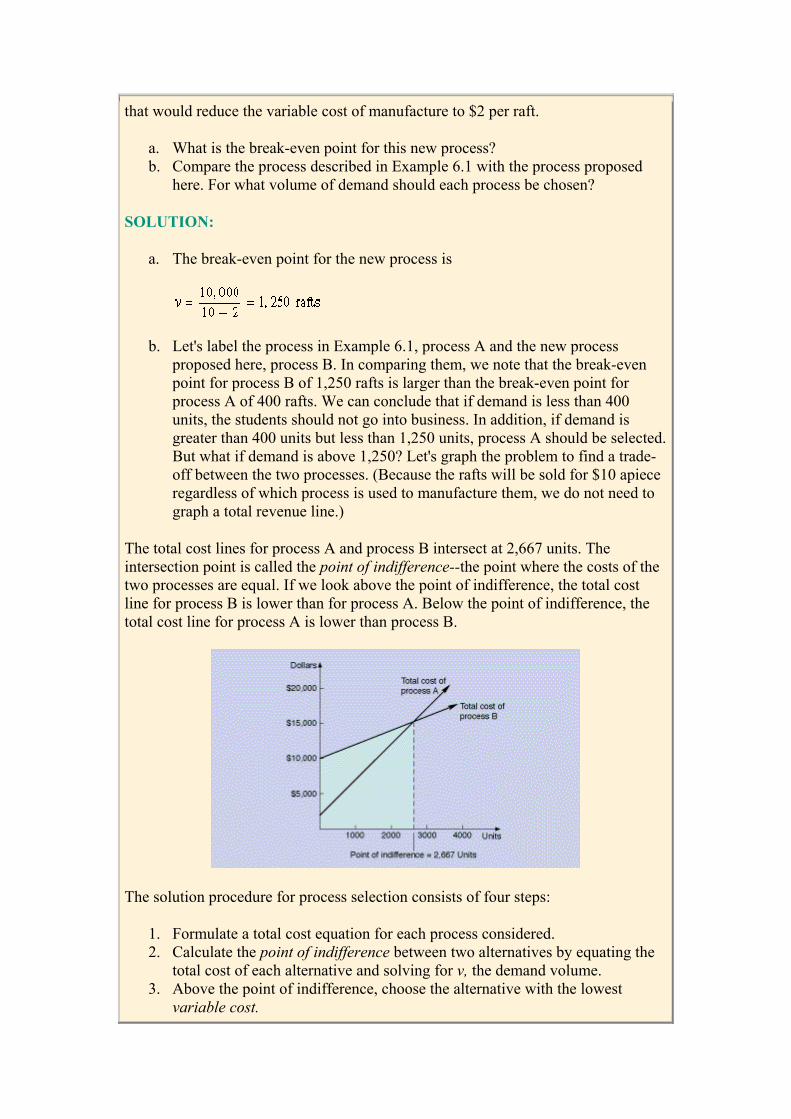
b. Let's label the process in Example 6.1, process A and the new process proposed here, process B. In comparing them, we note that the break-even point for process B of 1,250 rafts is larger than the break-even point for process A of 400 rafts. We can conclude that if demand is less than 400 units, the students should not go into business. In addition, if demand is greater than 400 units but less than 1,250 units, process A should be selected. But what if demand is above 1,250? Let's graph the problem to find a trade-off between the two processes. (Because the rafts will be sold for $10 apiece regardless of which process is used to manufacture them, we do not need to graph a total revenue line.)
The total cost lines for process A and process B intersect at 2,667 units. The intersection point is called the point of indifference--the point where the costs of the two processes are equal. If we look above the point of indifference, the total cost line for process B is lower than for process A. Below the point of indifference, the total cost line for process A is lower than process B.
The solution procedure for process selection consists of four steps:
1. Formulate a total cost equation for each process considered. 2. Calculate the point of indifference between two alternatives by equating the
total cost of each alternative and solving for v, the demand volume. 3. Above the point of indifference, choose the alternative with the lowest
variable cost.
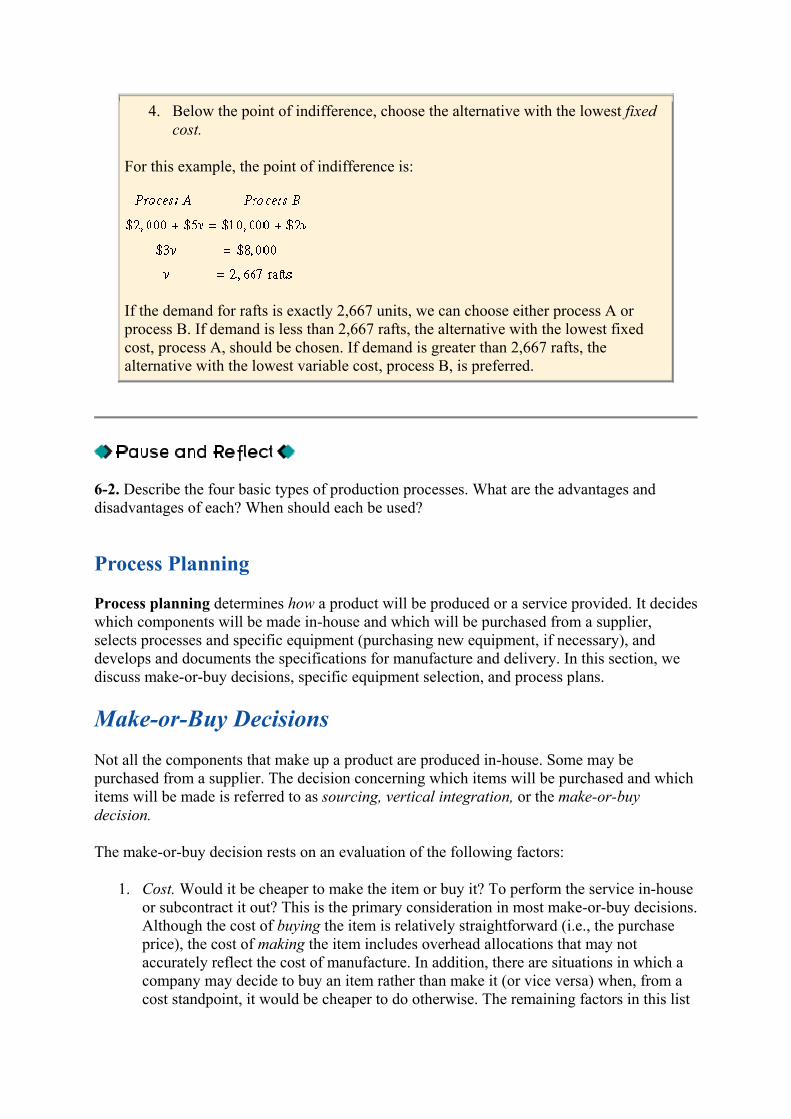
4. Below the point of indifference, choose the alternative with the lowest fixed cost.
For this example, the point of indifference is:
If the demand for rafts is exactly 2,667 units, we can choose either process A or process B. If demand is less than 2,667 rafts, the alternative with the lowest fixed cost, process A, should be chosen. If demand is greater than 2,667 rafts, the alternative with the lowest variable cost, process B, is preferred.
6-2. Describe the four basic types of production processes. What are the advantages and disadvantages of each? When should each be used?
Process Planning
Process planning determines how a product will be produced or a service provided. It decides which components will be made in-house and which will be purchased from a supplier, selects processes and specific equipment (purchasing new equipment, if necessary), and develops and documents the specifications for manufacture and delivery. In this section, we discuss make-or-buy decisions, specific equipment selection, and process plans.
Make-or-Buy Decisions
Not all the components that make up a product are produced in-house. Some may be purchased from a supplier. The decision concerning which items will be purchased and which items will be made is referred to as sourcing, vertical integration, or the make-or-buy decision.
The make-or-buy decision rests on an evaluation of the following factors:
1. Cost. Would it be cheaper to make the item or buy it? To perform the service in-house or subcontract it out? This is the primary consideration in most make-or-buy decisions. Although the cost of buying the item is relatively straightforward (i.e., the purchase price), the cost of making the item includes overhead allocations that may not accurately reflect the cost of manufacture. In addition, there are situations in which a company may decide to buy an item rather than make it (or vice versa) when, from a cost standpoint, it would be cheaper to do otherwise. The remaining factors in this list
represent noneconomic factors that can influence or dominate the economic considerations.
2. Capacity. Companies that are operating at less than full capacity usually make components rather than buy them, especially if maintaining a level work force is important. Sometimes the available capacity is not sufficient to make all the components, so choices have to be made. The stability of demand is also important. Typically, it is better to produce in-house those parts or products with steady demand that consume a set capacity, whereas those whose demand patterns are uncertain or volatile are usually subcontracted.
3. Quality. The capability to provide quality parts consistently is an important consideration in the make-or-buy decision. In general, it is easier to control the quality of items produced in your own factory. However, standardization of parts, supplier certification, and supplier involvement in design can improve the quality of supplied parts. Poor manufacturing practices in the 1970s forced many U.S. companies in the 1980s to purchase major components from foreign competitors to meet customer quality expectations. This led to the creation of "hollow" corporations that farmed out every task except putting the final label on.
4. Speed. Sometimes components are purchased because a supplier can provide goods sooner than the manufacturer. The smaller supplier is often more flexible, too, and can adapt quickly to design and technology changes. Of course, speed is useful only if it is reliable.
5. Reliability. Suppliers need to be reliable in both the quality and the timing of what they supply. Unexpected delays in shipments or partially filled orders because of quality rejects can wreak havoc with the manufacturing system. Many companies today are requiring their suppliers to meet certain quality and delivery standards to be certified as an approved supplier. ISO 9000 is the European Community's quality certification program. Those foreign companies that are not certified simply may not trade in Europe. Other companies assess huge penalties for unreliable supply. DaimlerChrysler, for example, fines its suppliers $30,000 for each hour an order is late.
6. Expertise. Companies that are especially good at making or designing certain items may want to keep control over their production. Cocoa-Cola would not want to release its formula to a supplier, even if there were guarantees of secrecy. Although automakers might outsource many of their component parts, they need proprietary control over major components such as engines, transmissions, and electronic guidance systems. Japanese, Taiwanese, and Korean firms are currently learning American expertise in aircraft design and manufacture by serving as suppliers of component parts. The decision of whether to share your expertise with a supplier for economic gains is a difficult one.
Companies that control the production of virtually all of their component parts, including the source of raw materials, are said to be vertically integrated. This strategy was popular for many years when companies did not want to be dependent on others for their livelihood. Today, buying components and raw materials from vendors is more common, but relationships with vendors have been strengthened. Supplier partnerships are valuable assets in gaining a competitive edge. Chapter 9, "Supply Chain Management," discusses the importance of supplier relationships from a global perspective.
Specific Equipment Selection
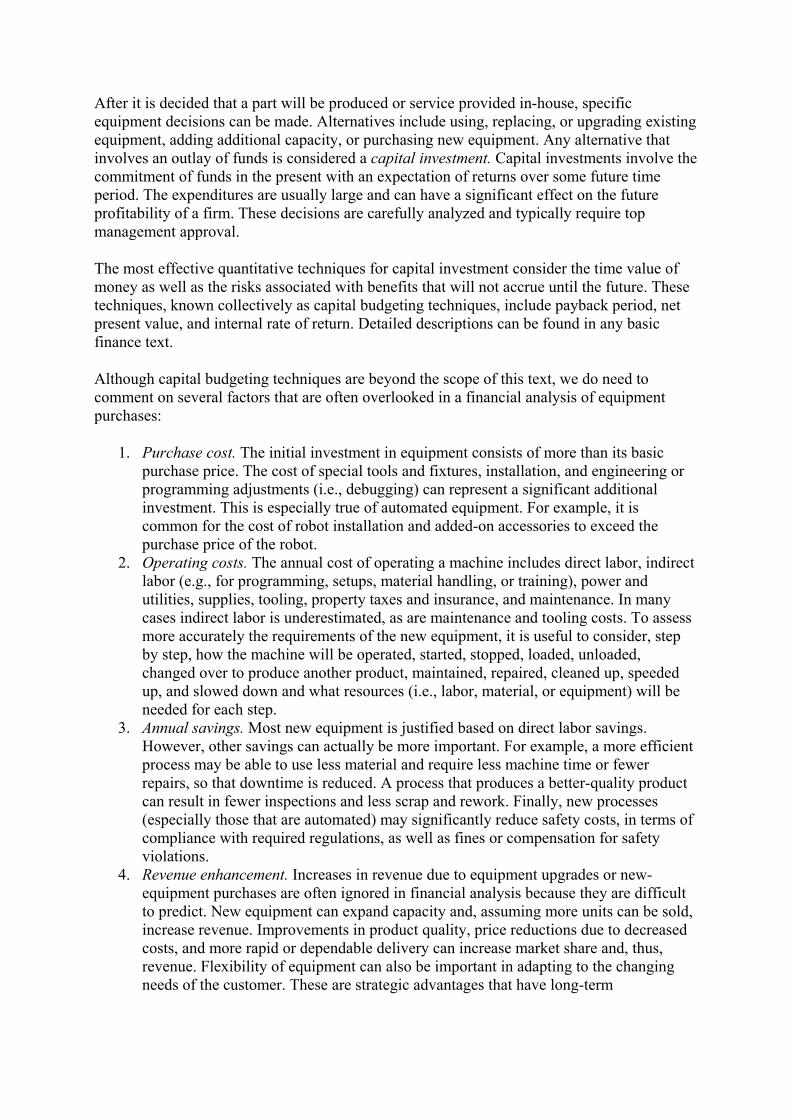
After it is decided that a part will be produced or service provided in-house, specific equipment decisions can be made. Alternatives include using, replacing, or upgrading existing equipment, adding additional capacity, or purchasing new equipment. Any alternative that involves an outlay of funds is considered a capital investment. Capital investments involve the commitment of funds in the present with an expectation of returns over some future time period. The expenditures are usually large and can have a significant effect on the future profitability of a firm. These decisions are carefully analyzed and typically require top management approval.
The most effective quantitative techniques for capital investment consider the time value of money as well as the risks associated with benefits that will not accrue until the future. These techniques, known collectively as capital budgeting techniques, include payback period, net present value, and internal rate of return. Detailed descriptions can be found in any basic finance text.
Although capital budgeting techniques are beyond the scope of this text, we do need to comment on several factors that are often overlooked in a financial analysis of equipment purchases:
1. Purchase cost. The initial investment in equipment consists of more than its basic purchase price. The cost of special tools and fixtures, installation, and engineering or programming adjustments (i.e., debugging) can represent a significant additional investment. This is especially true of automated equipment. For example, it is common for the cost of robot installation and added-on accessories to exceed the purchase price of the robot.
2. Operating costs. The annual cost of operating a machine includes direct labor, indirect labor (e.g., for programming, setups, material handling, or training), power and utilities, supplies, tooling, property taxes and insurance, and maintenance. In many cases indirect labor is underestimated, as are maintenance and tooling costs. To assess more accurately the requirements of the new equipment, it is useful to consider, step by step, how the machine will be operated, started, stopped, loaded, unloaded, changed over to produce another product, maintained, repaired, cleaned up, speeded up, and slowed down and what resources (i.e., labor, material, or equipment) will be needed for each step.
3. Annual savings. Most new equipment is justified based on direct labor savings. However, other savings can actually be more important. For example, a more efficient process may be able to use less material and require less machine time or fewer repairs, so that downtime is reduced. A process that produces a better-quality product can result in fewer inspections and less scrap and rework. Finally, new processes (especially those that are automated) may significantly reduce safety costs, in terms of compliance with required regulations, as well as fines or compensation for safety violations.
4. Revenue enhancement. Increases in revenue due to equipment upgrades or new-equipment purchases are often ignored in financial analysis because they are difficult to predict. New equipment can expand capacity and, assuming more units can be sold, increase revenue. Improvements in product quality, price reductions due to decreased costs, and more rapid or dependable delivery can increase market share and, thus, revenue. Flexibility of equipment can also be important in adapting to the changing needs of the customer. These are strategic advantages that have long-term
implications. Unfortunately, most quantitative analyses are oriented toward short-term measures of performance.
5. Replacement analysis. As existing equipment ages, it may become slower, less reliable, and obsolete. The decision to replace old equipment with state-of-the-art equipment depends in large measure on the competitive environment. If a major competitor upgrades to a newer technology that improves quality, cost, or flexibility and you do not, your ability to compete will be severely damaged. Deciding when to invest in new equipment can be tricky.
A hidden cost in replacement analysis is the opportunity cost of not investing in new equipment when upcoming technology will make the equipment obsolete. Part of the analysis should include estimates of salvage value reductions, operating cost inferiority, quality inferiority, and flexibility inferiority as compared with state-of-the-art technology. Salvage value, similar to the trade-in value of an automobile, decreases every year a company waits to replace equipment. In some industries, technology changes so rapidly that a replacement decision also involves determining whether this generation of equipment should be purchased or if it would be better to wait for the next generation. Replacement analysis maps out different schedules for equipment purchases over a five- to ten-year period and selects a replacement cycle that will minimize cost.
6. Risk and uncertainty. Investment in new equipment, especially if it represents an untested technology, can be risky. Estimates of equipment capabilities, length of life, and operating cost may be uncertain. Because of the risk involved, financial analysts tend to assign higher hurdle rates (i.e., required rates of return) to technology investments, making it difficult to gain approval for them. Management's general lack of understanding of new technology and its potential impact does not help the situation.
7. Piecemeal analysis. Investment in equipment and new technology is expensive. Rarely can a company afford to automate an entire facility all at once. This has led to the proposal and evaluation of equipment purchases in a piecemeal fashion resulting in pieces of technology that don't fit into the existing system and fail to deliver the expected returns. At one point, General Motors had 40,000 pieces of automated equipment, only 15 percent of which could communicate or use the same database. There is a synergistic benefit to a well-designed technology plan that is too often ignored.
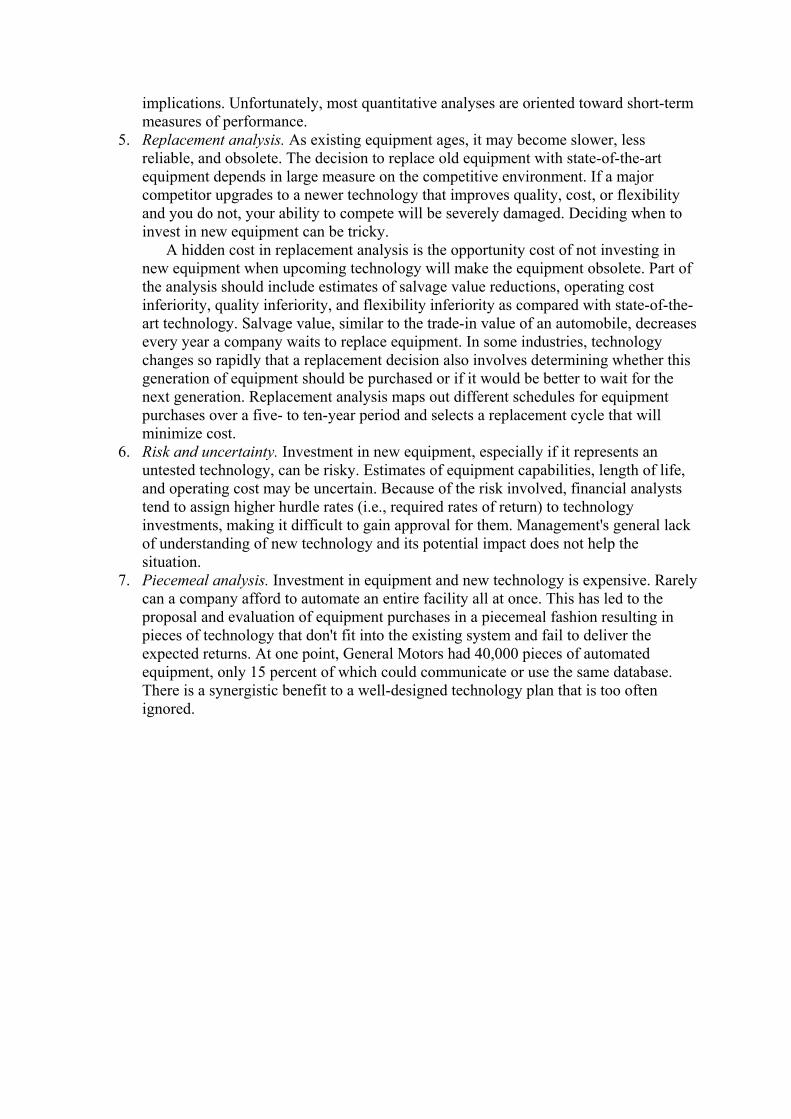
Process Plans
The set of documents that details manufacturing and delivery specifications is called a process plan. Process plans may include:
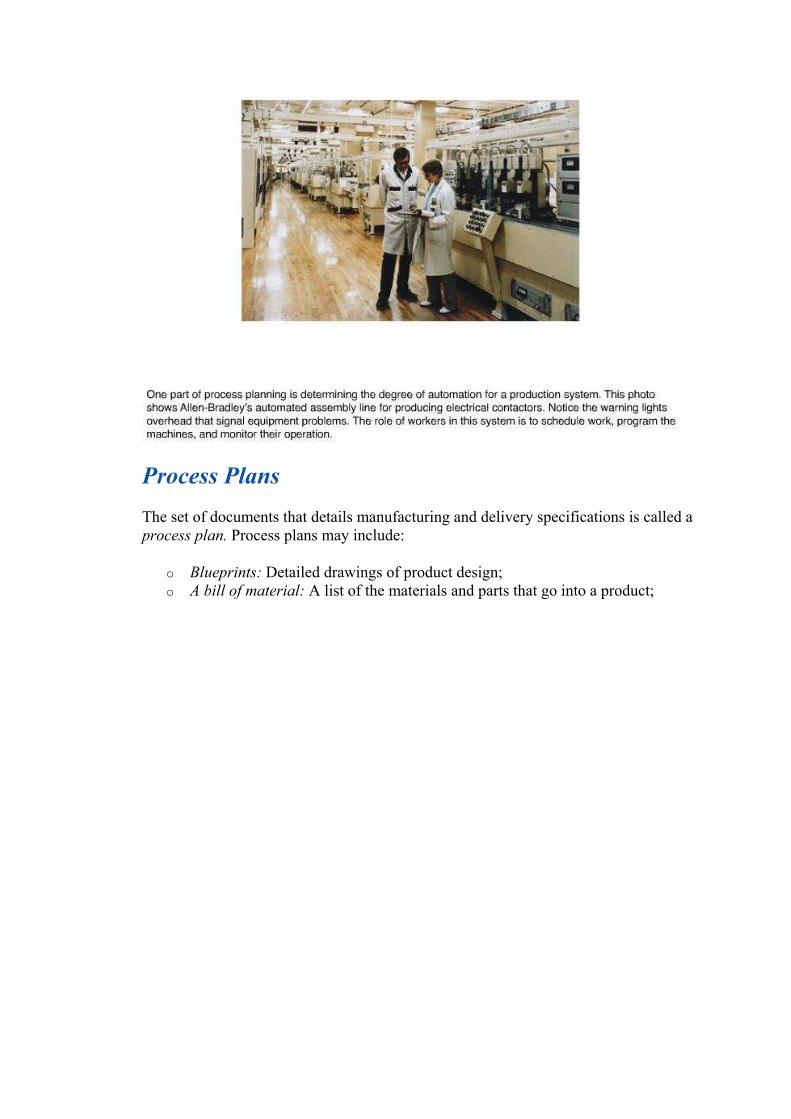
o Blueprints: Detailed drawings of product design; o A bill of material: A list of the materials and parts that go into a product;
o An assembly diagram: An illustration showing how various parts combine to form the final product, as given in Figure 6.1;
o An assembly chart or product structure diagram: A schematic diagram that
shows the relationship of each component part to its parent assembly, the grouping of parts that make up a subassembly, and the overall sequence of

assembly, as given in Figure 6.2;
8. An operations process chart: A list of operations to be performed in fabricating a part, along with the time required to complete each operation, special tools, fixtures, and gauges
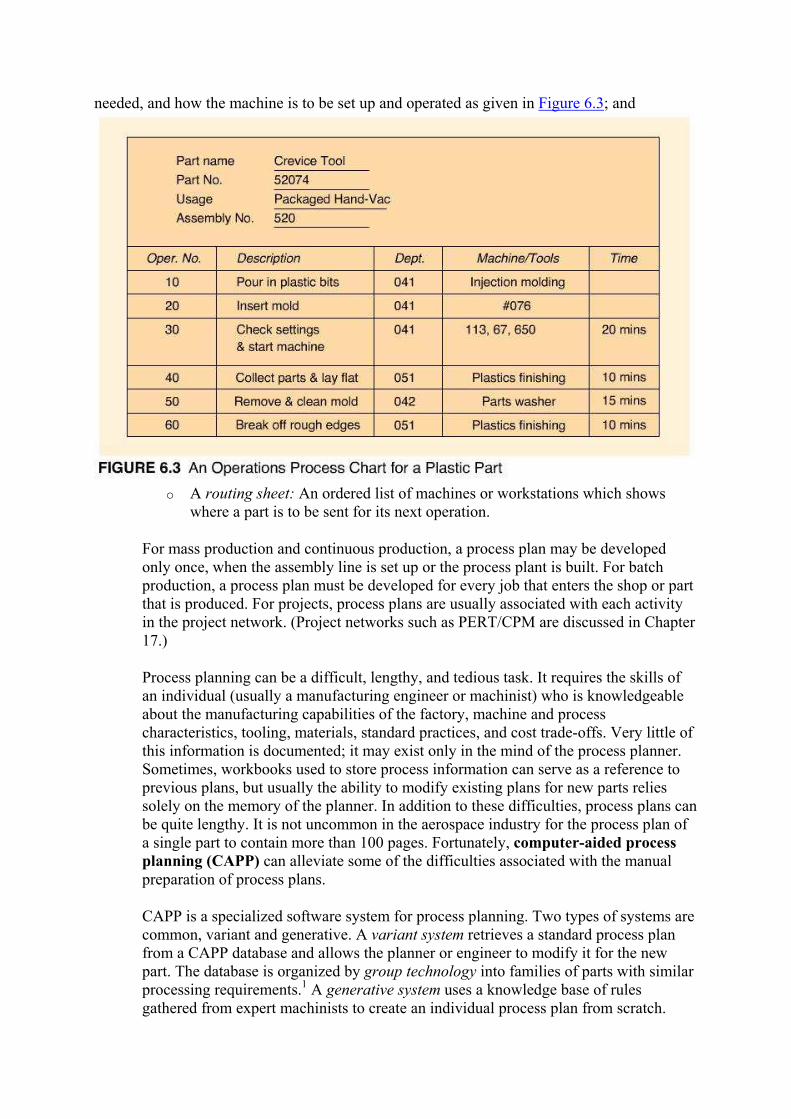
needed, and how the machine is to be set up and operated as given in Figure 6.3; and
o A routing sheet: An ordered list of machines or workstations which shows
where a part is to be sent for its next operation.
For mass production and continuous production, a process plan may be developed only once, when the assembly line is set up or the process plant is built. For batch production, a process plan must be developed for every job that enters the shop or part that is produced. For projects, process plans are usually associated with each activity in the project network. (Project networks such as PERT/CPM are discussed in Chapter 17.)
Process planning can be a difficult, lengthy, and tedious task. It requires the skills of an individual (usually a manufacturing engineer or machinist) who is knowledgeable about the manufacturing capabilities of the factory, machine and process characteristics, tooling, materials, standard practices, and cost trade-offs. Very little of this information is documented; it may exist only in the mind of the process planner. Sometimes, workbooks used to store process information can serve as a reference to previous plans, but usually the ability to modify existing plans for new parts relies solely on the memory of the planner. In addition to these difficulties, process plans can be quite lengthy. It is not uncommon in the aerospace industry for the process plan of a single part to contain more than 100 pages. Fortunately, computer-aided process planning (CAPP) can alleviate some of the difficulties associated with the manual preparation of process plans.
CAPP is a specialized software system for process planning. Two types of systems are common, variant and generative. A variant system retrieves a standard process plan from a CAPP database and allows the planner or engineer to modify it for the new part. The database is organized by group technology into families of parts with similar processing requirements.1 A generative system uses a knowledge base of rules gathered from expert machinists to create an individual process plan from scratch.
6-3. List and explain six factors that affect the make-or-buy decision.
1 Group technology can also be used to organize CAD databases into families of parts based on shape and other physical features related to design, but CAD and CAPP part families are not necessarily the same.
Process Analysis
Process analysis is the systematic examination of all aspects of a process to improve its operation--make it faster, more efficient, less costly, or more responsive to the customer. The basic tools of process analysis are process flowcharts, process diagrams, and process maps.
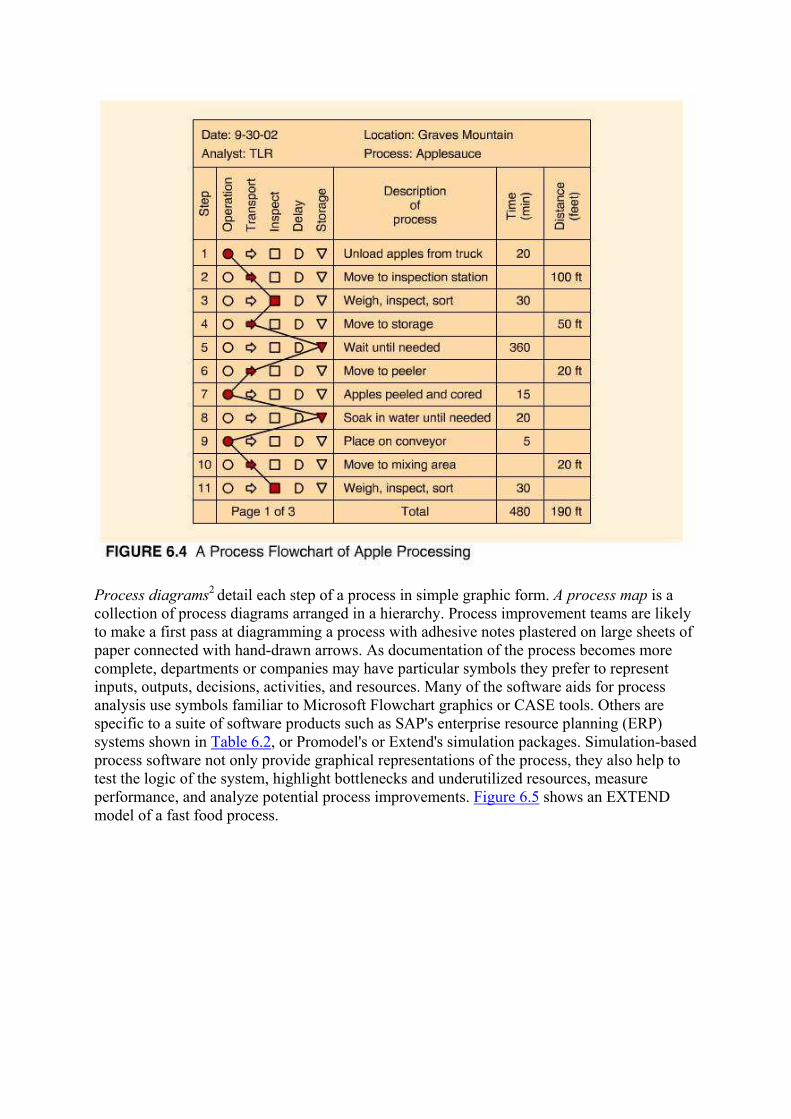
Process Flowcharts look at the manufacture of a product or delivery of a service from a broad perspective. The chart uses five standard symbols, shown in Figure 6.4, to describe a process: for operations, for inspections, for transportation, for delay, and for storage. The details of each process are not necessary for this chart; however, the time required to perform each process and the distance between processes are often included. By incorporating nonproductive activities (inspection, transportation, delay, storage), as well as productive activities (operations), process flowcharts may be used to analyze the efficiency of a series of processes, and suggest improvements. They also provide a standardized method for documenting the steps in a process and can be used as a training tool. Automated versions of these charts are available that will superimpose the charts on floor plans of facilities. In this fashion, bottlenecks can be identified and layouts can be adjusted. Process flowcharts are used in both manufacturing and service operations. They are a basic tool for reengineering, as well as job design.
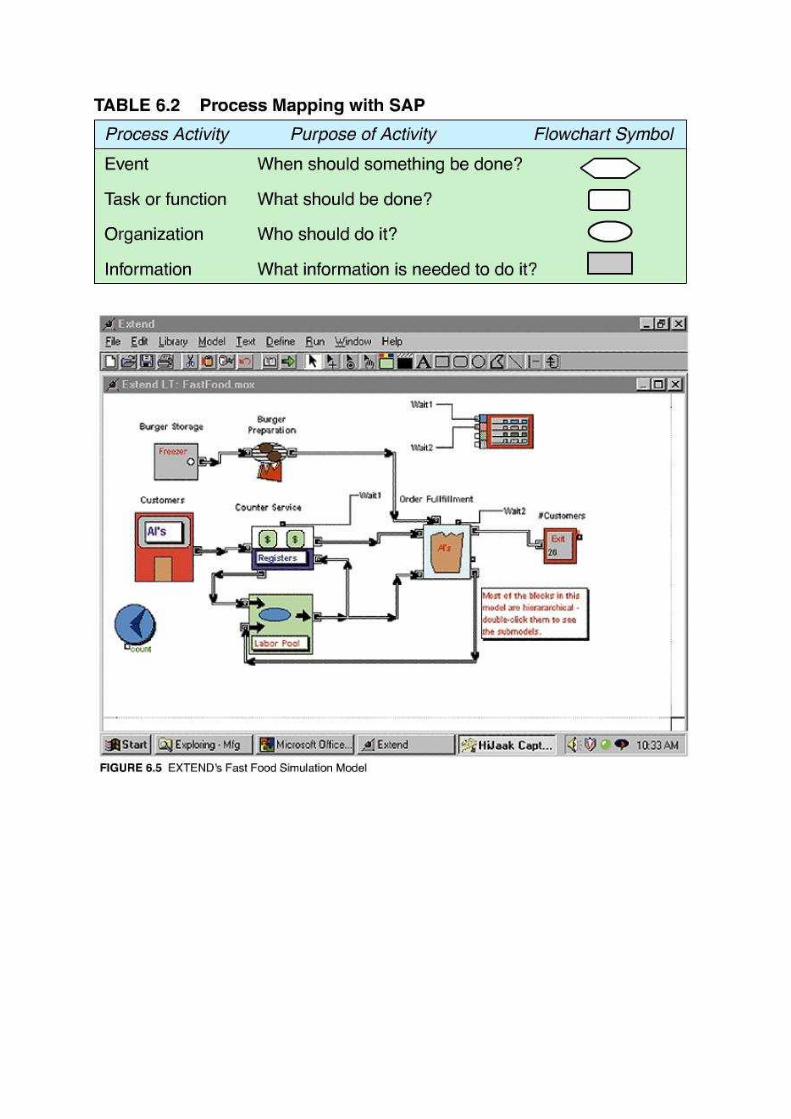
Process diagrams2 detail each step of a process in simple graphic form. A process map is a
collection of process diagrams arranged in a hierarchy. Process improvement teams are likely to make a first pass at diagramming a process with adhesive notes plastered on large sheets of paper connected with hand-drawn arrows. As documentation of the process becomes more complete, departments or companies may have particular symbols they prefer to represent inputs, outputs, decisions, activities, and resources. Many of the software aids for process analysis use symbols familiar to Microsoft Flowchart graphics or CASE tools. Others are specific to a suite of software products such as SAP's enterprise resource planning (ERP) systems shown in Table 6.2, or Promodel's or Extend's simulation packages. Simulation-based process software not only provide graphical representations of the process, they also help to test the logic of the system, highlight bottlenecks and underutilized resources, measure performance, and analyze potential process improvements. Figure 6.5 shows an EXTEND model of a fast food process.
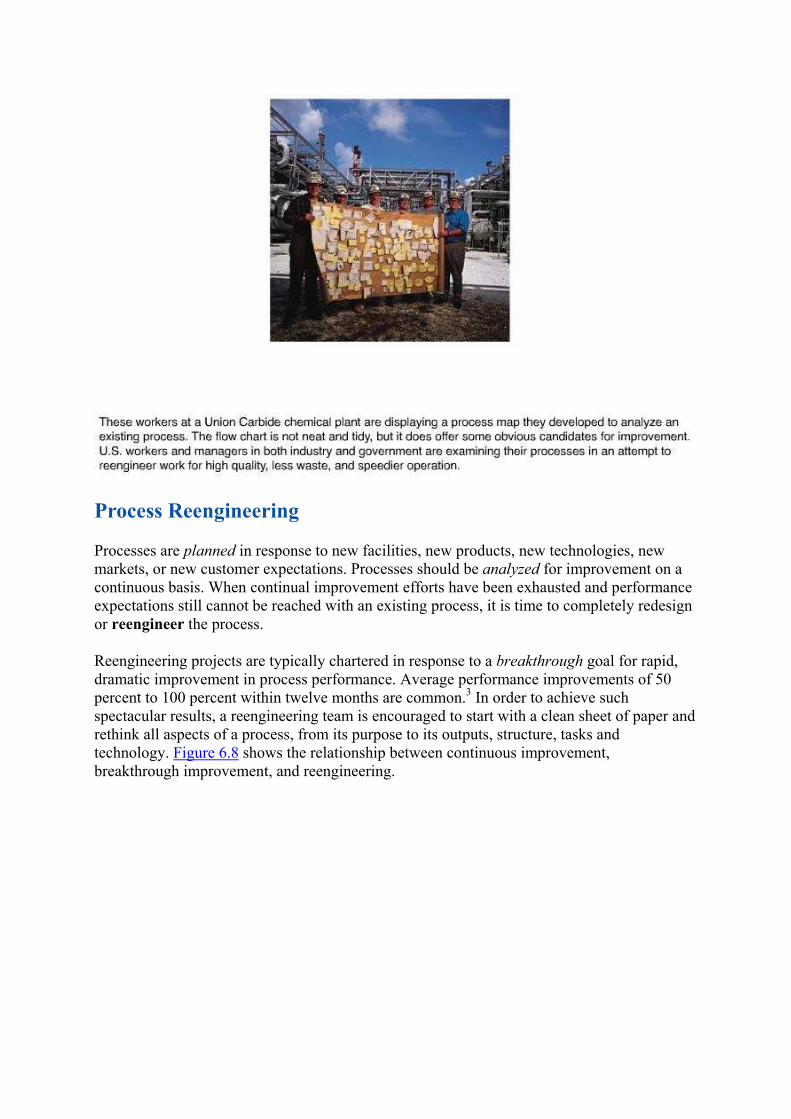
Process Reengineering
Processes are planned in response to new facilities, new products, new technologies, new markets, or new customer expectations. Processes should be analyzed for improvement on a continuous basis. When continual improvement efforts have been exhausted and performance expectations still cannot be reached with an existing process, it is time to completely redesign or reengineer the process.
Reengineering projects are typically chartered in response to a breakthrough goal for rapid, dramatic improvement in process performance. Average performance improvements of 50 percent to 100 percent within twelve months are common.3 In order to achieve such spectacular results, a reengineering team is encouraged to start with a clean sheet of paper and rethink all aspects of a process, from its purpose to its outputs, structure, tasks and technology. Figure 6.8 shows the relationship between continuous improvement, breakthrough improvement, and reengineering.
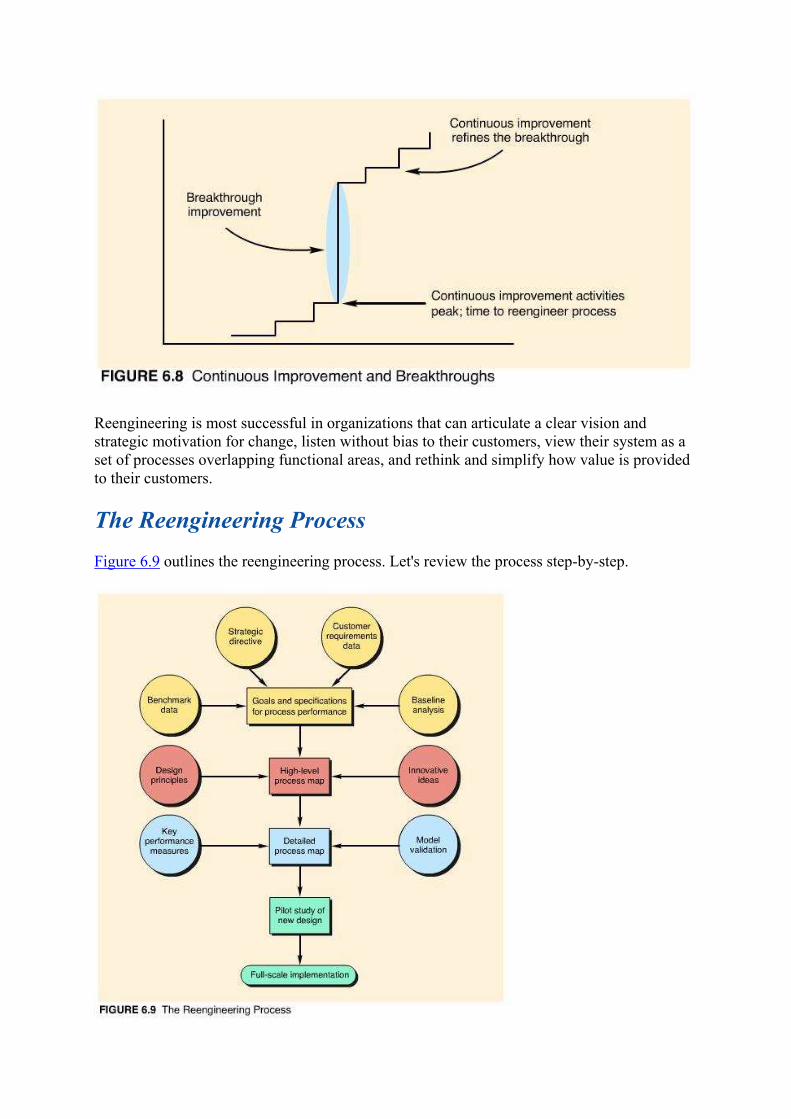
Reengineering is most successful in organizations that can articulate a clear vision and strategic motivation for change, listen without bias to their customers, view their system as a set of processes overlapping functional areas, and rethink and simplify how value is provided to their customers.
The Reengineering Process
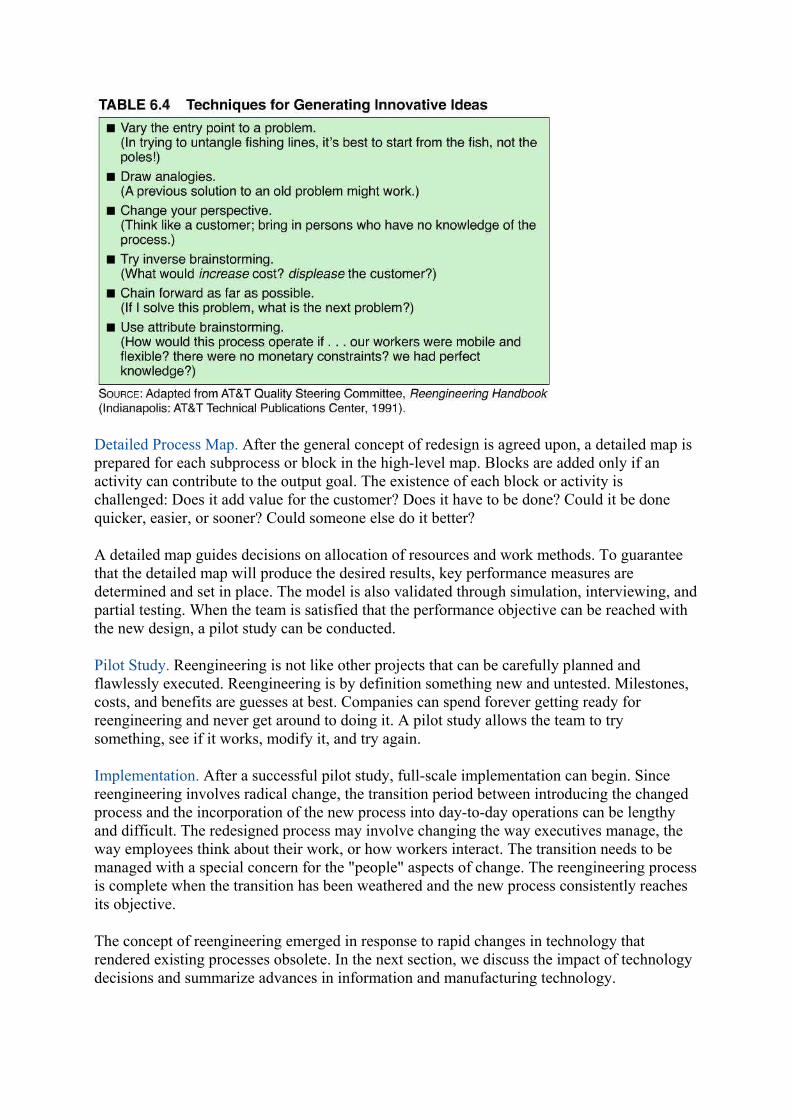
Figure 6.9 outlines the reengineering process. Let's review the process step-by-step.

Goals and Specifications. The initial step establishes the goals and specifications for process performance. Data from the existing process are used as a baseline to which benchmarking data on best industry practices, customer requirements data, and strategic directives are compared.4 Analyzing the gap between current and desired performance helps to determine whether or not the process needs to be redesigned. If reengineering is necessary, a reengineering project team is chartered and provided with the preliminary analysis and resulting goals and specifications for process performance. Although the goals for a process may be specific, the specifications are not (or else the creativity of the group is hampered). It is important that the project team be convinced that total redesign of the process is absolutely necessary to achieve the performance objectives.
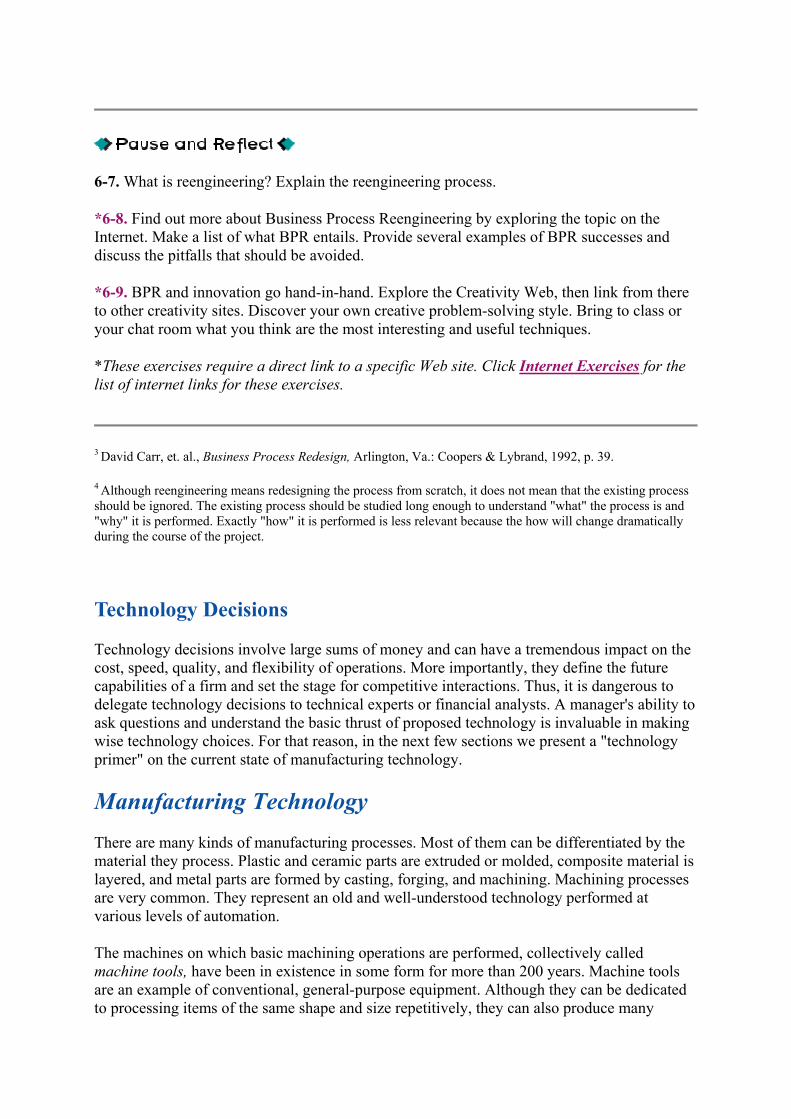
High-Level Process Map. A useful tool in beginning the redesign of a process is a high-level process map. Pared to its simplest form, a high-level map contains only the essential building blocks of a process. As shown in Figure 6.10 it is prepared by focusing on the performance goal--stated in customer terms--and working backward through the desired output, subprocesses, and initial input requirements. Design principles, such as performing subprocesses in parallel whenever possible, help to structure the map efficiently. Table 6.3 lists several additional design principles recommended for reengineering. Innovative ideas can challenge the conventional ordering of subprocesses, or the need for a subprocess. Table 6.4 presents various techniques to prompt innovative thinking.
Detailed Process Map. After the general concept of redesign is agreed upon, a detailed map is prepared for each subprocess or block in the high-level map. Blocks are added only if an activity can contribute to the output goal. The existence of each block or activity is challenged: Does it add value for the customer? Does it have to be done? Could it be done quicker, easier, or sooner? Could someone else do it better?
A detailed map guides decisions on allocation of resources and work methods. To guarantee that the detailed map will produce the desired results, key performance measures are determined and set in place. The model is also validated through simulation, interviewing, and partial testing. When the team is satisfied that the performance objective can be reached with the new design, a pilot study can be conducted.
Pilot Study. Reengineering is not like other projects that can be carefully planned and flawlessly executed. Reengineering is by definition something new and untested. Milestones, costs, and benefits are guesses at best. Companies can spend forever getting ready for reengineering and never get around to doing it. A pilot study allows the team to try something, see if it works, modify it, and try again.
Implementation. After a successful pilot study, full-scale implementation can begin. Since reengineering involves radical change, the transition period between introducing the changed process and the incorporation of the new process into day-to-day operations can be lengthy and difficult. The redesigned process may involve changing the way executives manage, the way employees think about their work, or how workers interact. The transition needs to be managed with a special concern for the "people" aspects of change. The reengineering process is complete when the transition has been weathered and the new process consistently reaches its objective.
The concept of reengineering emerged in response to rapid changes in technology that rendered existing processes obsolete. In the next section, we discuss the impact of technology decisions and summarize advances in information and manufacturing technology.
6-7. What is reengineering? Explain the reengineering process.
*6-8. Find out more about Business Process Reengineering by exploring the topic on the Internet. Make a list of what BPR entails. Provide several examples of BPR successes and discuss the pitfalls that should be avoided.
*6-9. BPR and innovation go hand-in-hand. Explore the Creativity Web, then link from there to other creativity sites. Discover your own creative problem-solving style. Bring to class or your chat room what you think are the most interesting and useful techniques.
*These exercises require a direct link to a specific Web site. Click Internet Exercises for the
list of internet links for these exercises.
3 David Carr, et. al., Business Process Redesign, Arlington, Va.: Coopers & Lybrand, 1992, p. 39.
4 Although reengineering means redesigning the process from scratch, it does not mean that the existing process should be ignored. The existing process should be studied long enough to understand "what" the process is and "why" it is performed. Exactly "how" it is performed is less relevant because the how will change dramatically during the course of the project.
Technology Decisions
Technology decisions involve large sums of money and can have a tremendous impact on the cost, speed, quality, and flexibility of operations. More importantly, they define the future capabilities of a firm and set the stage for competitive interactions. Thus, it is dangerous to delegate technology decisions to technical experts or financial analysts. A manager's ability to ask questions and understand the basic thrust of proposed technology is invaluable in making wise technology choices. For that reason, in the next few sections we present a "technology primer" on the current state of manufacturing technology.
Manufacturing Technology
There are many kinds of manufacturing processes. Most of them can be differentiated by the material they process. Plastic and ceramic parts are extruded or molded, composite material is layered, and metal parts are formed by casting, forging, and machining. Machining processes are very common. They represent an old and well-understood technology performed at various levels of automation.
The machines on which basic machining operations are performed, collectively called machine tools, have been in existence in some form for more than 200 years. Machine tools are an example of conventional, general-purpose equipment. Although they can be dedicated to processing items of the same shape and size repetitively, they can also produce many
different shapes and sizes by changing the tool used to cut the material. This flexibility requires that the operator know how to set up the machine to process the material. The proper tool must be selected and installed, the depth of cut must be determined, and a mechanism must be developed for stopping the tool when the desired cut is achieved. The operator must set the speed at which the tool operates as well as the rate at which work is fed into the machine. The workpiece must be secured and positioned with jigs, clamps, or fixtures so that the cut is taken in the exact location specified. Finally, the operator must be able to detect tool wear and determine when the tool needs to be replaced, when more coolant is needed, or when the machine should be stopped and adjusted. Skilled machinists usually make these decisions based on experience with no written instructions other than a blueprint of the designed part. Often this involves setting up the machine tool, running a few pieces through to test the arrangement, and then adjusting the setup until an acceptable part is produced. This can be a time-consuming and tedious process.
Numerically controlled (NC) machines were developed at MIT in the mid-1950s. With NC machines, machine motion is controlled by instructions contained on a punched tape. Operators do not have to determine machine settings, but they must still select and install the tools, and load and unload the machine. It is also the operator's job to monitor the operation of the machine tool to make sure the tape has been programmed properly and is in good condition, and to listen for signs of excessive tool wear.
The addition of an automatic tool changer (ATC) to an NC machine significantly increases the machine's flexibility, while reducing setup time and operator requirements. The punched tape not only guides the machine's operation, it also selects the right tool from a bank of 20 to 100 available tools and changes it within seconds.
Advances in computer technology since the mid-1970s have replaced the punched tape of NC machines with software instructions stored in the memory of a computer. These computer numerical controlled (CNC) machine tools are equipped with a screen and keyboard for writing and editing NC programs at the machine. This facilitates the access, editing, and loading of operating instructions and also encourages the collection of processing information and the control of processing quality. For example, records of tool use can be used to predict tool wear and generate replacement schedules before a substandard part is produced.
The control of several NC machines by a larger single computer is referred to as direct numerical control (DNC). DNC can also refer to distributed numerical control, in which each machine tool has its own microcomputer and the systems are linked to a central controlling computer. DNC machine tools can be of different types and can be programmed to carry out different tasks. When an automated material handling system is installed to link these machine tools together physically, a flexible manufacturing system (FMS) results.
Automated Material Handling
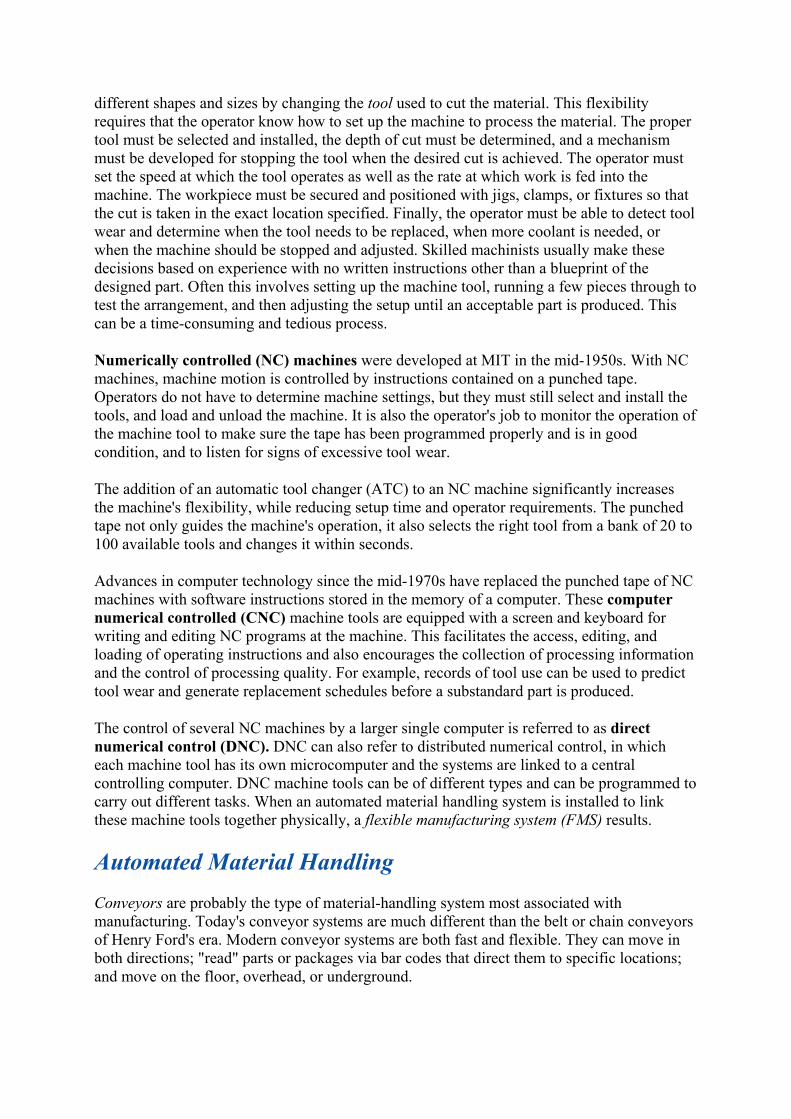
Conveyors are probably the type of material-handling system most associated with manufacturing. Today's conveyor systems are much different than the belt or chain conveyors of Henry Ford's era. Modern conveyor systems are both fast and flexible. They can move in both directions; "read" parts or packages via bar codes that direct them to specific locations; and move on the floor, overhead, or underground.
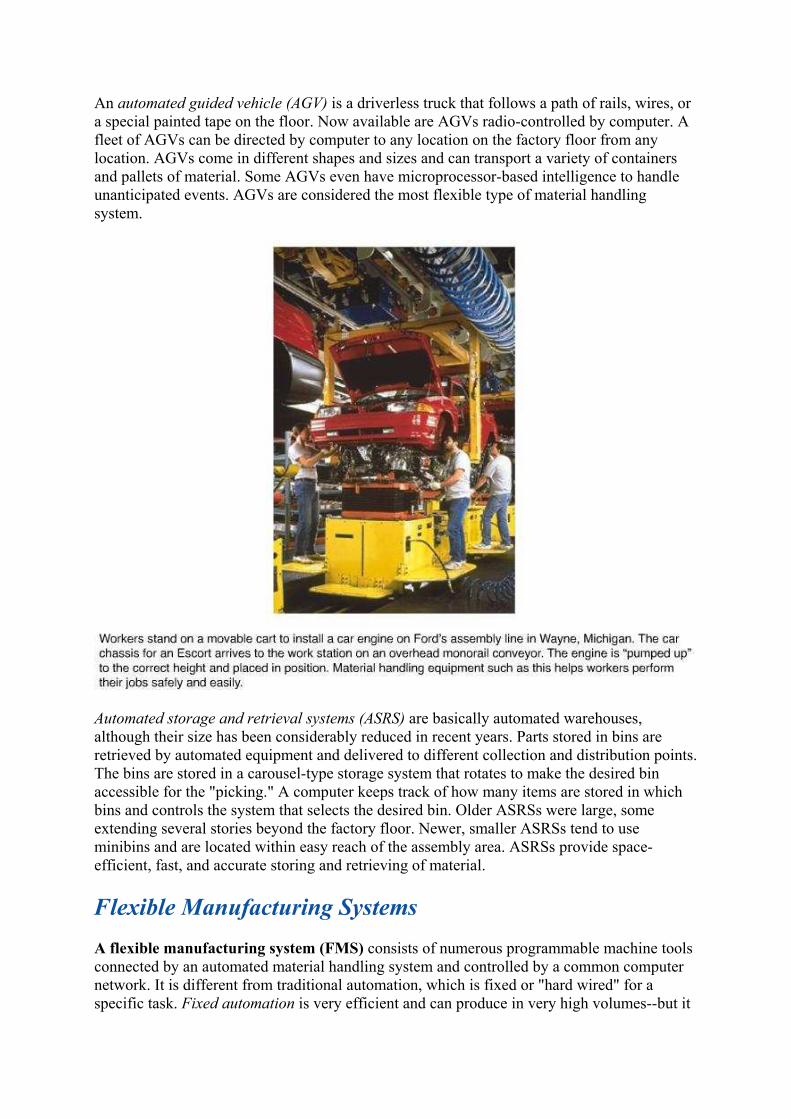
An automated guided vehicle (AGV) is a driverless truck that follows a path of rails, wires, or a special painted tape on the floor. Now available are AGVs radio-controlled by computer. A fleet of AGVs can be directed by computer to any location on the factory floor from any location. AGVs come in different shapes and sizes and can transport a variety of containers and pallets of material. Some AGVs even have microprocessor-based intelligence to handle unanticipated events. AGVs are considered the most flexible type of material handling system.
Automated storage and retrieval systems (ASRS) are basically automated warehouses, although their size has been considerably reduced in recent years. Parts stored in bins are retrieved by automated equipment and delivered to different collection and distribution points. The bins are stored in a carousel-type storage system that rotates to make the desired bin accessible for the "picking." A computer keeps track of how many items are stored in which bins and controls the system that selects the desired bin. Older ASRSs were large, some extending several stories beyond the factory floor. Newer, smaller ASRSs tend to use minibins and are located within easy reach of the assembly area. ASRSs provide space-efficient, fast, and accurate storing and retrieving of material.
Flexible Manufacturing Systems
A flexible manufacturing system (FMS) consists of numerous programmable machine tools connected by an automated material handling system and controlled by a common computer network. It is different from traditional automation, which is fixed or "hard wired" for a specific task. Fixed automation is very efficient and can produce in very high volumes--but it
is not flexible. Only one type or model of product can be produced on most automated production lines, and a change in product design would require extensive changes in the line and its equipment.
An FMS combines flexibility with efficiency. Tools change automatically from large storage carousels at each machine that hold 100 or more tools. The material handling system (usually conveyors or automated guided vehicles) carries workpieces on pallets, which can be locked into a machine for processing. Pallets are transferred between the conveyor and machine automatically. Computer software keeps track of the routing and processing requirements for each pallet. Pallets communicate with the computer controller by way of bar codes or radio signals. Parts can be transferred between any two machines in any routing sequence. With a variety of programmable machine tools and large tool banks, an FMS can theoretically produce thousands of different items.
The efficiency of an FMS is derived from reductions in setup and queue times. Setup activities take place before the part reaches the machine. A machine is presented only with parts and tools that are ready for immediate processing. Queuing areas at each machine hold pallets that are ready to move in the moment the machine finishes with the previous piece. The pallet also serves as a work platform, so no time is lost transferring the workpiece from pallet to machine or positioning and fixturing the part. Advanced FMSs may contain a second material handling system, whose job consists of replacing old tools with new ones and, when possible, taking worn tools away to be sharpened or repaired. The machines in an advanced FMS, such as five-axis CNC machining centers, simultaneously perform up to five operations on a workpiece that would normally require a series of operations on individual machines.
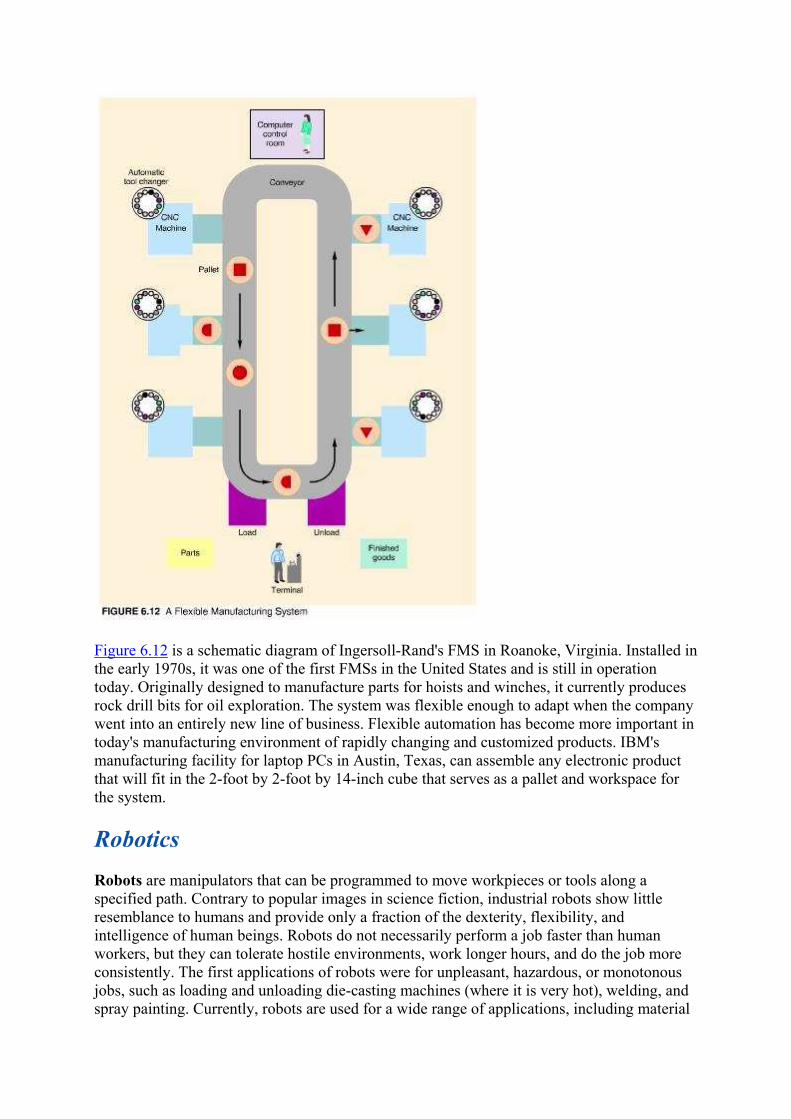
Figure 6.12 is a schematic diagram of Ingersoll-Rand's FMS in Roanoke, Virginia. Installed in the early 1970s, it was one of the first FMSs in the United States and is still in operation today. Originally designed to manufacture parts for hoists and winches, it currently produces rock drill bits for oil exploration. The system was flexible enough to adapt when the company went into an entirely new line of business. Flexible automation has become more important in today's manufacturing environment of rapidly changing and customized products. IBM's manufacturing facility for laptop PCs in Austin, Texas, can assemble any electronic product that will fit in the 2-foot by 2-foot by 14-inch cube that serves as a pallet and workspace for the system.
Robotics
Robots are manipulators that can be programmed to move workpieces or tools along a specified path. Contrary to popular images in science fiction, industrial robots show little resemblance to humans and provide only a fraction of the dexterity, flexibility, and intelligence of human beings. Robots do not necessarily perform a job faster than human workers, but they can tolerate hostile environments, work longer hours, and do the job more consistently. The first applications of robots were for unpleasant, hazardous, or monotonous jobs, such as loading and unloading die-casting machines (where it is very hot), welding, and spray painting. Currently, robots are used for a wide range of applications, including material
handling, machining, assembly, and inspection. Applications are shifting from simple to complex operations. In the 1980s, almost 50 percent of robots sold were used for welding and painting operations. Now robots are purchased more for assembly and inspection.
The use of robots has been both exciting and disappointing. Robots perform over 98 percent of the welding for Ford's Taurus, drill 550 holes in 3 hours (versus 24 hours' worth of manual drilling) for General Dynamic's F-16 fighter planes, install disk drives in personal computers, snap keys onto electronic keyboards, and assemble circuit boards with a feather-light touch. However, widespread adoption of robotics in the United States has been limited to larger industries. The automobile industry alone accounts for over half of the robots in use in this country. One reason for the slow diffusion of robotic technology may be the ineffective integration of robots into existing design and manufacturing systems or the failure to adapt those systems to the unique requirements of automation. The next section addresses the issues involved in integrating manufacturing technologies.
Computer-Integrated Manufacturing
CNC machines, DNC machines, FMSs, robots, and automated material handling systems are part of the collection of technologies referred to as computer-aided manufacturing (CAM). The integration of these and other technologies is called computer integrated manufacturing (CIM). CIM is often perceived as the ultimate in automated processing--the lights-out factory of the future with no human interference. But a more accurate description of CIM is the use of computer technology to tie together the design, production, marketing, and delivery of a product into a totally integrated system. Thus, CIM is a strategy for organizing and controlling a factory rather than specific technology that can be purchased.
CIM's job is to develop linkages between people, machines, databases, and decisions. The major components of CIM are shown in Figure 6.13. Each CIM component represents a

different type of linkage.
CAD can physically link different design components together to create new or modified designs and communicate electronically to other systems. Group technology (GT) classifies existing designs so that new designs can incorporate the expertise of earlier designs. CAE (computer-aided engineering) links the functional design of the product to the CAD-generated form design. CAPP (computer-aided process planning) converts design specifications from CAD into instructions for manufacture for CAM. CAD/CAM describes the direct physical link between design and manufacturing.
Within the manufacturing function, CAM technologies (e.g., CNC machines, robots, automatic tool changers) facilitate remote control and integration of operations. Different operations may be physically linked with automated material handling systems. In advanced CAM systems, such as flexible manufacturing systems, automated machines communicate directly with each other, work together, and are centrally controlled.
The CIM environment was made possible by the development of shared databases, standards, and networking within the manufacturing function. For example, MAP (manufacturing automation protocol), originally developed by General Motors to solve its automation headaches, sets standards for communication between pieces of automated equipment produced by different vendors. TOP (technical and office protocol) serves the same function in an office environment. IGES (initial graphics exchange specification) translates graphics data (mainly wireframe models) between different CAD systems. PDES (product data exchange specification) translates additional aspects of CAD design, such as solid modeling data, tolerance specifications, surface finishes, and material specifications in the same manner. DMIS (dimensional measuring interface specification) provides a standard medium for exchanging inspection information between CAD systems and computerized inspection equipment. STEP (standard for the exchange of product model data) is the European version
of MAP, TOP, IGES, PDES, and DMIS, combined and extended. Developed in conjunction with ISO 10303, STEP can represent all critical product specifications (such as shape, material, tolerances, behavior, function, and structure); consider the entire product life cycle (from development to manufacture through use and disposal); and specify process sequences for specific production systems (such as automobiles, shipbuilding, architectural engineering, or plant engineering).
In the process of manufacturing a product, materials need to be ordered, workers scheduled, demand forecasted, customer orders received and entered into the manufacturing system, production planned, progress reports issued, costs and quality documented, and customers billed. Computerized manufacturing control systems developed to collect, store, and display this information are an integral part of CIM. Manufacturing resource planning (MRP II), and enterprise resource planning (ERP), discussed in Chapter 13, are examples of such systems.
Just-in-time (JIT) and total quality management (TQM) systems require the collection, sharing, and exchange of information outside of the manufacturing organization. CIM accomplishes this with automatic identification systems (bar codes), EDI, EFT e-mail, and satellite communications.