process simulation and optimization
TRANSCRIPT
8/9/2019 Process Simulation and Optimization
http://slidepdf.com/reader/full/process-simulation-and-optimization 1/8
R jeas Research Journal in Engineering and Applied Sciences 1(5) 266-273 R jeas© Emerging Academy Resources (2012) (ISSN: 2276-8467)
www.emergingresource.org
266
PROCESS SIMULATION AND OPTIMIZATION OF PALM OIL WASTE
COMBUSTION USING ASPEN PLUS
Mohd Halim Shah Ismail, Zahra Haddadian, and Mohammad Amin ShavandiDepartment of Chemical and Environmental Engineering,
Faculty of Engineering, Universiti Putra Malaysia,43400 UPM Serdang, Selangor, Malaysia.
Corresponding Author: M ohd H alimS hah I smail
___________________________________________________________________________
ABSTRACT
The difficulty of controlling the required air during the incineration of the fiber and shell; the low heating value
of solid fuel due to the excessive moisture content of fiber and shell and further formation of slagging or clinkerin the reactor as a result of high ash content, are some problems raised when incinerating both fiber and shell. in
this simulation work, the effects of air flow rate; moisture content of shell, moisture content of fiber, and
moisture content of both shell and fiber; the ash content of fiber and shell and temperature were investigated and
optimized on flue gas emissions and the combustion behavior using steady state simulation by ASPEN PLUS
(Version 7.1). From the results obtained, the fiber-shell type solid fuel is preferable and the air flow rate should be controlled and suggested maintained at 30% excess air to regulate NOX emission. Besides, the moisture
content and ash shows negative effect to the combustion efficiency and the moisture content is suggested in therange of 6%-19.5% for fiber and 5%-13% for shell. Last but not least, the operating temperature is suggested donot exceed 972ºC to regulate the NOX emission.
©Emerging Academy Resources
KEYWORDS: Simulation; Modeling; Combustion; Aspen Plus; Fiber; Shell.
________________________________________________________________________________________
INTRODUCTION
World demand for energy sources is increasing, and
thus, renewable energy sources have become analternative to the depleting fossil fuel. One type of
renewable energy sources comes from combustion of
biomass waste, which is also called solid fuel, to produce heat and energy. This is a promising
technology to reduce waste and moreover provide aclean and renewable energy source by applying
waste-to-wealth concept. Malaysia has become thelargest exporter of oil palm product in the world (Foo
& Hameed, 2010). While generating huge income
from oil palm business, there are abundant of oil
palm biomass waste (generally fiber and shell)
generated at the same time. This biomass waste has been utilized to generate energy and electricity to
support the mill process. In addition, the fiber andshell are also burnt to generate steam for downstream
processes that required steam such as sterilization. As
such, a lot of savings can be done because this energyis considered free for the palm milling process. At the
same time, using the fiber and shell as boiler fuel canhelp to dispose these bulky materials which can
contribute to environmental pollution. The energycontent varies depending on the moisture, residual oil
contents and its high specific energy content. in 2003
a simulation work has been done by Mahlia et al .,(Mahlia, Abdulmuin, Alamsyah, & Mukhlishien,
2003) to develop a steady-space dynamic model for a
palm waste boiler. The solid fuel used was also fiberand shell from palm oil processing. However, in
Mahlia et al. study, moisture content and calorificvalue of fuel, and air-fuel ratio are assumed to be
constant, while temperature of the boiler is assumed
to be proportional to fuel rate. This is not the caseapply for the current simulation study because the
ultimate aim in this simulation work is to study theeffect of moisture content, ash content, air flow rate
and temperature on combustion process and flue gasemission. Bignal et al . (Bignal, Langridge, & Zhou,
2008) has investigated the effect of moisture content
of fuel and boiler operating conditions on pollutant
concentrations, and it is suggested that solid fuel
should have low moisture content in order to reduceair pollutants. In another study, Yang et al . (Yang,
Sharifi, & Swithenbank, 2004) has carried outmathematical simulations and experiments to studythe effect of primary air flow rate and moisture level
in the fuel on the combustion process of wood chipsand the incineration of simulated municipal solid
wastes. From Yang et al . (Yang, et al., 2004) study, itis found that volatile release and char burning has
been intensified with increasing in the primary airflow rate until a critical point is reached, and also
increase in moisture level in the fuel produces a
higher flame front temperature at low air flow rates.However, in the current simulation, the effect of
moisture level in the fuel on calorific value or mass
8/9/2019 Process Simulation and Optimization
http://slidepdf.com/reader/full/process-simulation-and-optimization 2/8
Research Journal in Engineering and Applied Sciences ( ISSN: 2276-8467) 1(5):266-273Process Simulation and Optimization of Palm Oil Waste Combustion Using Aspen Plus
!"#
enthalpy is highlighted, but not on the flame fronttemperature. While for air flow rate, its effect on flue
gas emission is studied on current simulation work,which can be compared with study from Yang et al .
(Yang, et al., 2004). The typical values for proximate
and ultimate analysis on the dry basis of shell andfiber biomass feedstock are shown in Table 1.
Fiber Shell
Proximate
analysis,
wt%
• Moisture: 31.84
• Fixed carbon: 48.61
• Volatile matters: 13.2
•
Ash: 6.35
• Moisture: 12
• Fixed carbon:
68.2
• Volatile
matters: 16.3
• Ash: 3.5
Ultimate
analysis,
wt%
• Ash: 8.4
• Carbon: 47.2
• Hydrogen: 6
• Nitrogen: 1 .4
•
Chlorine: 0
•
Sulfur: 0.3
• Oxygen: 36.7
• Ash: 3.2
• Carbon: 52.4
• Hydrogen: 6.3
• Nitrogen: 0 .6
•
Chlorine: 0
•
Sulfur: 0.2
• Oxygen: 37.3
Table 1. Properties of the solid fuel used.
THEORY
Heating value is an important indication for solid
fuel, and it can be reported as high heating value
(HHV) or low heating value (LHV). The difference between HHV and LHV is equal to the heat of
vaporization of water formed by combustion of thefuel. The potential energy from fiber and shell can be
obtained by Dulong formula based on ultimateanalysis:
338.2 1442.8( )8( / )
1000
OC H
HHV M J k g
+ −
= (1)
20.16 2.24( / )
1000
HHV H M LHV MJ kg
− −=
(2)
From the steam generated amount, the amount ofsolid fuel consumed in the boiler can be known. With
a known palm oil milling capacity, the amount ofsteam needed to generate electricity can be calculated
based on the following equation:
Steam required = Energy required to process 1 ton of
FFB ! Milling capacity ! Amount of steam required
to produce 1kWh electric(
Theoretically, the potential energy conversion from
fiber and shell for palm oil mill can be represented bythe following formula:
= +P f f S S
E M LHV M LHV (3)
where Mf and Ms is the mass composition of fiberand shell in total solid fuel.
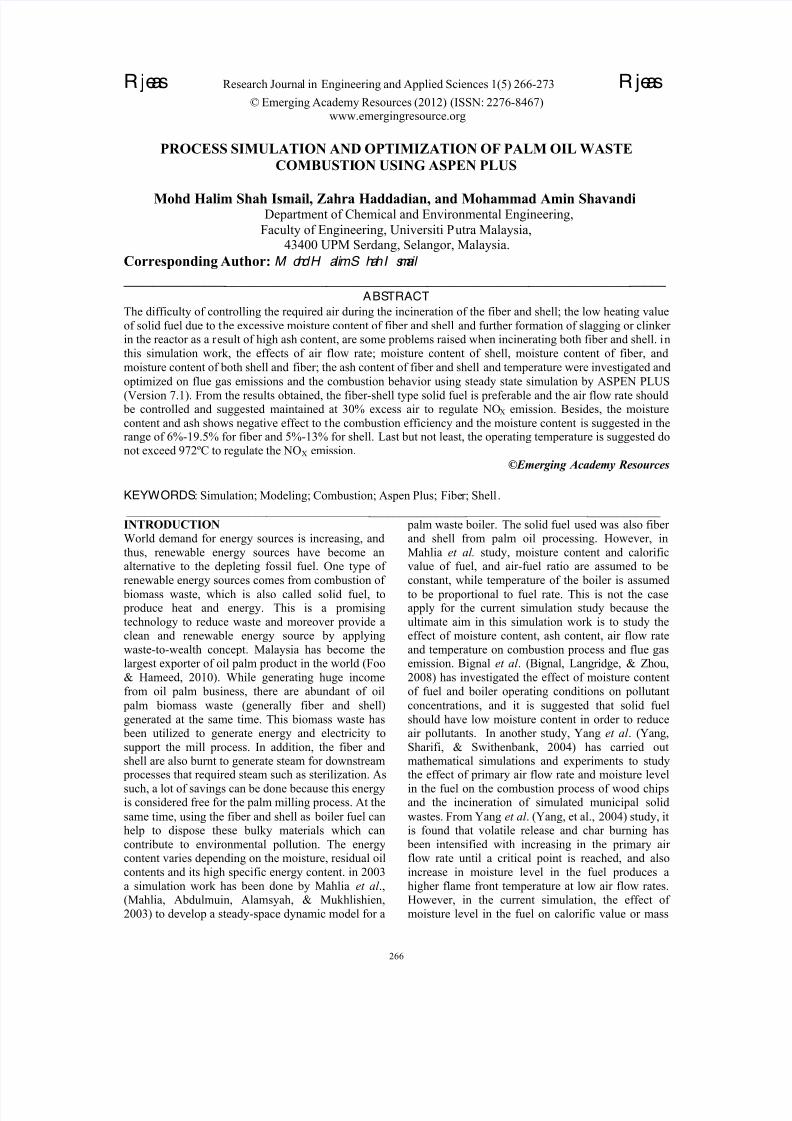
MATERIAL AND METHODAn Overview to SimulationThe software used in the simulation was ASPEN
PLUS (Version 7.1). The layout of simulationmethod was shown in Figure 1, which was from
reactor selection until gaining the final result ofsimulation.
Figure 1. Layout of simulation methods
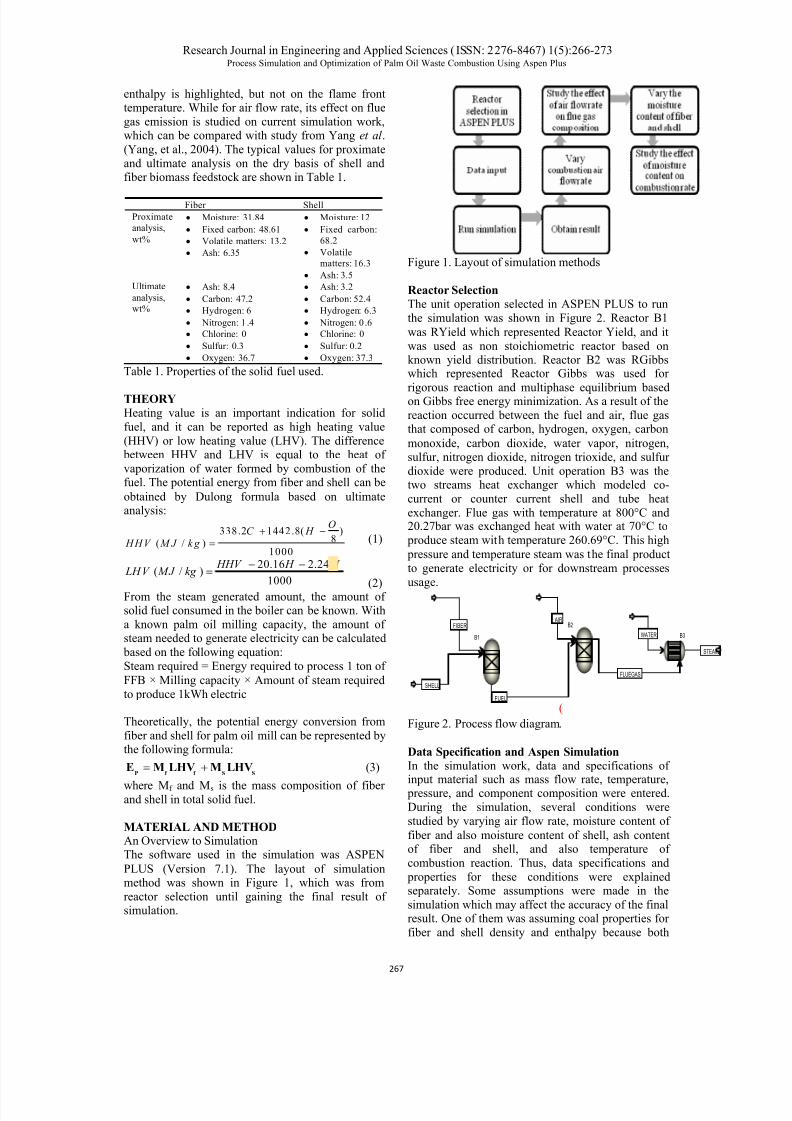
Reactor Selection
The unit operation selected in ASPEN PLUS to run
the simulation was shown in Figure 2. Reactor B1
was RYield which represented Reactor Yield, and it
was used as non stoichiometric reactor based onknown yield distribution. Reactor B2 was RGibbswhich represented Reactor Gibbs was used for
rigorous reaction and multiphase equilibrium basedon Gibbs free energy minimization. As a result of the
reaction occurred between the fuel and air, flue gasthat composed of carbon, hydrogen, oxygen, carbon
monoxide, carbon dioxide, water vapor, nitrogen,sulfur, nitrogen dioxide, nitrogen trioxide, and sulfur
dioxide were produced. Unit operation B3 was thetwo streams heat exchanger which modeled co-
current or counter current shell and tube heat
exchanger. Flue gas with temperature at 800°C and20.27bar was exchanged heat with water at 70°C to
produce steam with temperature 260.69°C. This high
pressure and temperature steam was the final product
to generate electricity or for downstream processes
usage.
FIBER
SHELL
FUEL
AIR
FLUEGAS
WATER
STEAM
B1
B2
B3
Figure 2. Process flow diagram.
Data Specification and Aspen Simulation
In the simulation work, data and specifications ofinput material such as mass flow rate, temperature,
pressure, and component composition were entered.
During the simulation, several conditions were
studied by varying air flow rate, moisture content of
fiber and also moisture content of shell, ash contentof fiber and shell, and also temperature of
combustion reaction. Thus, data specifications and
properties for these conditions were explainedseparately. Some assumptions were made in the
simulation which may affect the accuracy of the finalresult. One of them was assuming coal properties for
fiber and shell density and enthalpy because both
8/9/2019 Process Simulation and Optimization
http://slidepdf.com/reader/full/process-simulation-and-optimization 3/8
8/9/2019 Process Simulation and Optimization
http://slidepdf.com/reader/full/process-simulation-and-optimization 4/8
Research Journal in Engineering and Applied Sciences ( ISSN: 2276-8467) 1(5):266-273Process Simulation and Optimization of Palm Oil Waste Combustion Using Aspen Plus
!"%
Table 5. Summary of each simulationSet 1 Set 2 Set 3
Solid fuel
Composition
70% fiber
and 30%
shell
100% fiber 100% shell
Mass of fiber, kg/hr 2360 3490 -Mass of shell, kg/hr 1011 - 3120
Total Solid fuel,
kg/hr
3370 3490 3120
Steam generated,kg/hr
18000 18000 18000
Moisture content infiber, %
31.84 31.84 -
Moisture content in
shell, %
12 - 12
Calorific Value,kJ/kg
27,573 27,167 28,415
Potential energy ,
kJ/hr
92,949,270 94,842,979 88,623,277
Mass flow rate of
CO2, kg/hr
6460 6591 6159
Mass flow rate of
SO2, kg/hr
20.2 23.01 12.46
Mass flow rate of
NO, kg/hr
3.2 3.17 3.22
Mass flow rate of NO2, kg/hr
0.5 0.49 0.51
Mass flow rate of
NO3, kg/hr
Trace
(3.21x10⁻⁷
)
Trace
(3.13x10⁻⁷
)
Trace
(3.27x10⁻⁷
)
From the calculation, it shows that solid fuelconsumed in simulation set 2 is higher than set 1 and
set 3. This is because the fiber has lower heating
value/calorific value compared to the shell, and thiscan be proven from the simulation results.
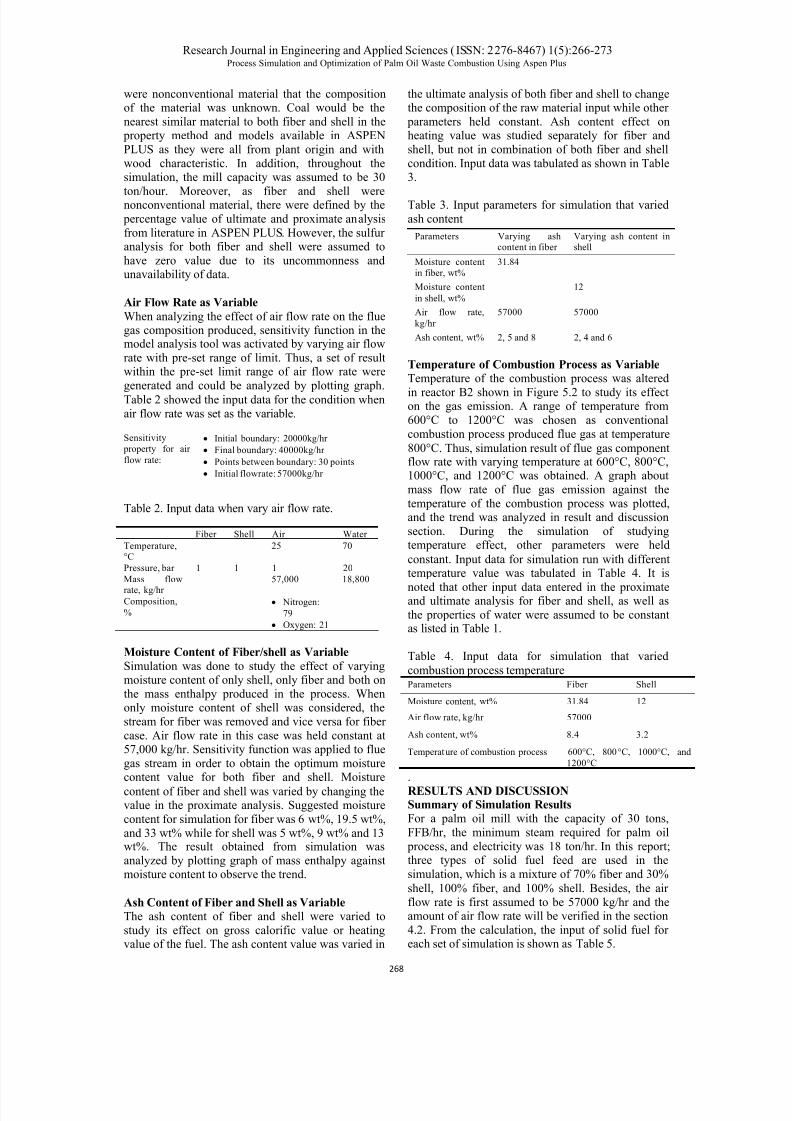
Figure 3. Calorific value for different fuel.
Figure 3 shows the calorific value of the solid fueldetermined by computer simulation. From the results
obtained, it is obviously shown that shell has the
highest calorific value, and the fiber has lowestheating value. Meanwhile, the simulation set 1, which
comprised of solid fuel mixture, has moderate heatingvalue. The high calorific value of shell can be due to
the low moisture content. Besides, there are many
similar researches, which were proven that moisturecontent in the shell is usually much lower than fiber
and eventually has higher calorific value (Li, Yin,Zhang, Liu, & Yan, 2009; Olufayo, 1989; Werther,
Saenger, Hartge, Ogada, & Siagi, 2000).
Experimentally, the calorific value for palm waste is
in the range of 18MJ/hr to 20MJ/hr (Yusoff, 2004).The results obtained from the simulation are
obviously higher than the experimental value. Thismay due to the limitation of software Aspen Plusused in this report. In the nutshell, it is suggested that
the shell which has the highest calorific value is the
most suitable solid fuel for combustion. However, theamount of shell produced for a typical palm oil mill is
60kg/hr for every 1ton FFB/hr. This amount is notenough to generate steam for whole plant. Thus, it is
suggested that solid fuel with the fiber-shell mixture
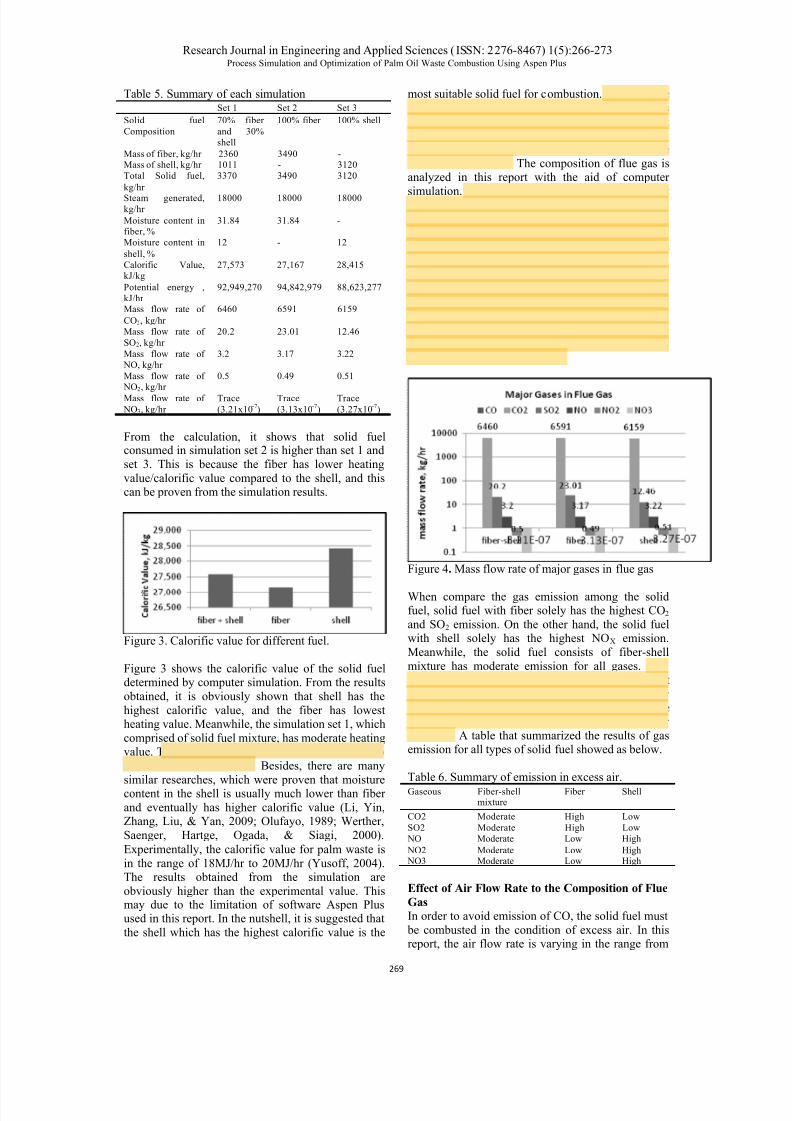
is the better solution. The composition of flue gas isanalyzed in this report with the aid of computer
simulation. Figure 4 shows the major gas constituentin the flue gas for different type of solid fuel. From
the results obtained, the CO2 is the major component
in the flue gas and followed by SO2, NOX.Meanwhile, the simulation results show that there is
no CO gas emission. This is due to the completecombustion of solid fuel in the excess air, and all the
carbon are converted to CO2. Besides, the resultsshow that the amount of NO3 is extremely small and
can be negligible and the NO is the majority of NOX.According to the research, the NOX are
predominantly NO and NO2, in which NO is the 95%
of total NOX (Ganapathy, 2003).
Figure 4. Mass flow rate of major gases in flue gas
When compare the gas emission among the solidfuel, solid fuel with fiber solely has the highest CO2
and SO2 emission. On the other hand, the solid fuelwith shell solely has the highest NOX emission.
Meanwhile, the solid fuel consists of fiber-shell
mixture has moderate emission for all gases. This
obviously showed that shell which has the highest
calorific value is not suitable to become the onlysolid fuel in the combustion. In order to reduce theemission, the solid fuel should comprise of both fiber
and shell. A table that summarized the results of gasemission for all types of solid fuel showed as below.
Table 6. Summary of emission in excess air.Gaseous Fiber-shell
mixture Fiber Shell
CO2 Moderate High Low
SO2 Moderate High Low
NO Moderate Low High
NO2 Moderate Low High NO3 Moderate Low High
Effect of Air Flow Rate to the Composition of Flue
Gas
In order to avoid emission of CO, the solid fuel must
be combusted in the condition of excess air. In thisreport, the air flow rate is varying in the range from
8/9/2019 Process Simulation and Optimization
http://slidepdf.com/reader/full/process-simulation-and-optimization 5/8
Research Journal in Engineering and Applied Sciences ( ISSN: 2276-8467) 1(5):266-273Process Simulation and Optimization of Palm Oil Waste Combustion Using Aspen Plus
!#&
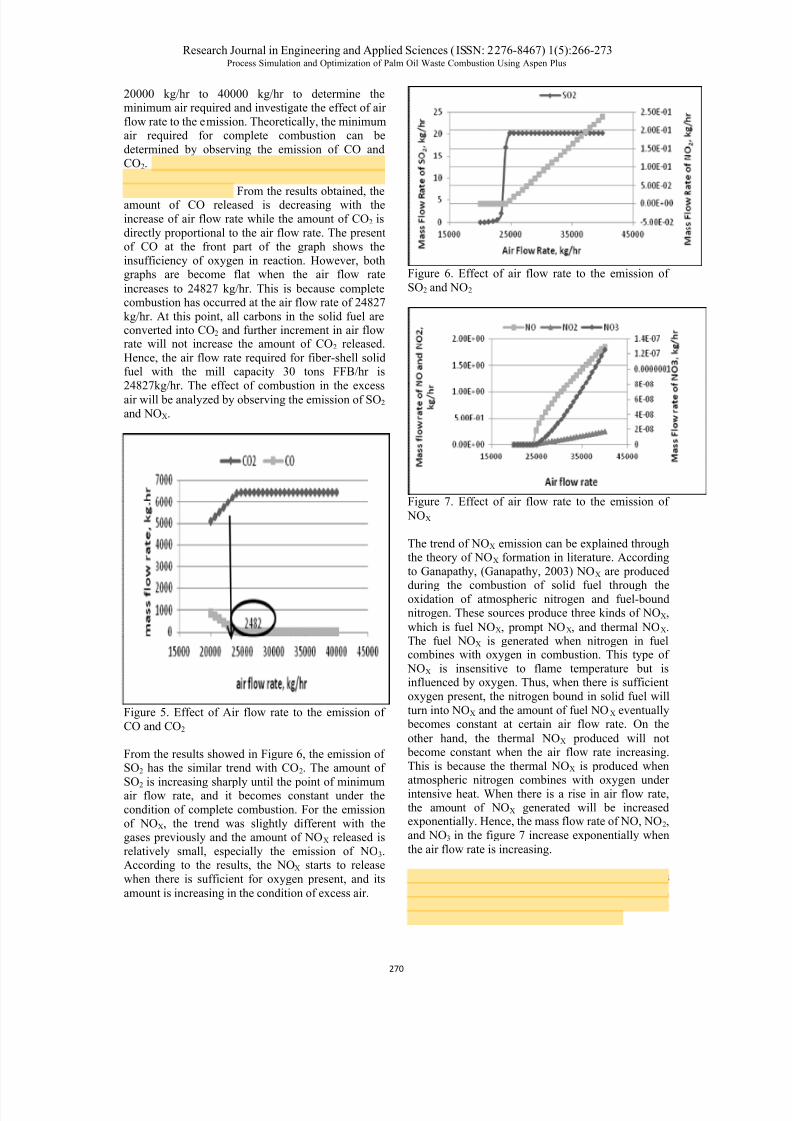
20000 kg/hr to 40000 kg/hr to determine theminimum air required and investigate the effect of air
flow rate to the emission. Theoretically, the minimumair required for complete combustion can be
determined by observing the emission of CO and
CO2. Figure 5 shows the amount of CO and CO2 released when burning of fiber-shell mixture at
different air flow rate. From the results obtained, theamount of CO released is decreasing with the
increase of air flow rate while the amount of CO2 is
directly proportional to the air flow rate. The presentof CO at the front part of the graph shows the
insufficiency of oxygen in reaction. However, bothgraphs are become flat when the air flow rate
increases to 24827 kg/hr. This is because completecombustion has occurred at the air flow rate of 24827
kg/hr. At this point, all carbons in the solid fuel areconverted into CO2 and further increment in air flowrate will not increase the amount of CO2 released.
Hence, the air flow rate required for fiber-shell solidfuel with the mill capacity 30 tons FFB/hr is
24827kg/hr. The effect of combustion in the excess
air will be analyzed by observing the emission of SO2
and NOX.
Figure 5. Effect of Air flow rate to the emission of
CO and CO2
From the results showed in Figure 6, the emission ofSO2 has the similar trend with CO2. The amount of
SO2 is increasing sharply until the point of minimumair flow rate, and it becomes constant under the
condition of complete combustion. For the emission
of NOX, the trend was slightly different with thegases previously and the amount of NOX released is
relatively small, especially the emission of NO3.According to the results, the NOX starts to release
when there is sufficient for oxygen present, and its
amount is increasing in the condition of excess air.
Figure 6. Effect of air flow rate to the emission of
SO2 and NO2
Figure 7. Effect of air flow rate to the emission of
NOX
The trend of NOX emission can be explained throughthe theory of NOX formation in literature. According
to Ganapathy, (Ganapathy, 2003) NOX are produced
during the combustion of solid fuel through theoxidation of atmospheric nitrogen and fuel-boundnitrogen. These sources produce three kinds of NOX,
which is fuel NOX, prompt NOX, and thermal NOX.The fuel NOX is generated when nitrogen in fuelcombines with oxygen in combustion. This type of
NOX is insensitive to flame temperature but isinfluenced by oxygen. Thus, when there is sufficient
oxygen present, the nitrogen bound in solid fuel will
turn into NOX and the amount of fuel NOX eventually becomes constant at certain air flow rate. On the
other hand, the thermal NOX produced will not become constant when the air flow rate increasing.
This is because the thermal NOX is produced when
atmospheric nitrogen combines with oxygen underintensive heat. When there is a rise in air flow rate,the amount of NOX generated will be increasedexponentially. Hence, the mass flow rate of NO, NO2,
and NO3 in the figure 7 increase exponentially when
the air flow rate is increasing.
According to the industry practice, the 30% excess
air is applied to the solid fuel combustion. Thus,
when 30% excess air is applied to the simulation, thecomposition of each gas is shown as table 7.
8/9/2019 Process Simulation and Optimization
http://slidepdf.com/reader/full/process-simulation-and-optimization 6/8
Research Journal in Engineering and Applied Sciences ( ISSN: 2276-8467) 1(5):266-273Process Simulation and Optimization of Palm Oil Waste Combustion Using Aspen Plus
!#'
Table 7. Composition of gases in 30% excess air.
Comparing the reading in Table 7 and 8, the amount
of CO2 and SO2 released are same. However, theamount of NOX released in 30% excess air is
significantly reduced. In short, the solid fuel whichconsists of solid only has the best performance in
30% excess air and the solid fuel which comprises
fiber-shell mixture has moderate gases emission.Hence, it is suggested that the solid fuel in palm oil
mill should be comprised of fiber-shell mixture orshell only.
Table 8. Summary of emission in 30% excess airGaseous Fiber-shell mixture Fiber Shell
CO2 Moderate High LowSO2 Moderate High Low
NO Moderate High Low
NO2 Moderate High Low
NO3 Moderate High Low
Effect of Moisture Content to the Heating Value
and Heat Duty of Boiler
The proximate analysis of fiber and shell issignificantly different. The fiber has the typical
moisture content in the range of 6% to 33% while itis 5% to 13% for the shell (Li, et al., 2009). As a
result, the effect of moisture content to the heat of
combustion is investigated in this report. Table 9
shows the summarized of each trial in the simulation.
Table 9. Summary of each trial in the simulation
Trial
Moisture
Content of
Fiber, %
Moisture
Content of
Shell, %
Calorific
Value of
Fuel, kJ/kg
Heat duty
of Boiler,
kJ/hr
1 6 5 27573.2 111507488
2 6 9 27573.2 111950207
3 6 13 27573.2 112392926
4 19.3 5 27573.2 115014102
5 19.3 9 27573.2 115456821
6 19.3 13 27573.2 115899540
7 33 5 27573.2 118520716
8 33 9 27573.2 118963435
9 33 13 27573.2 119406154
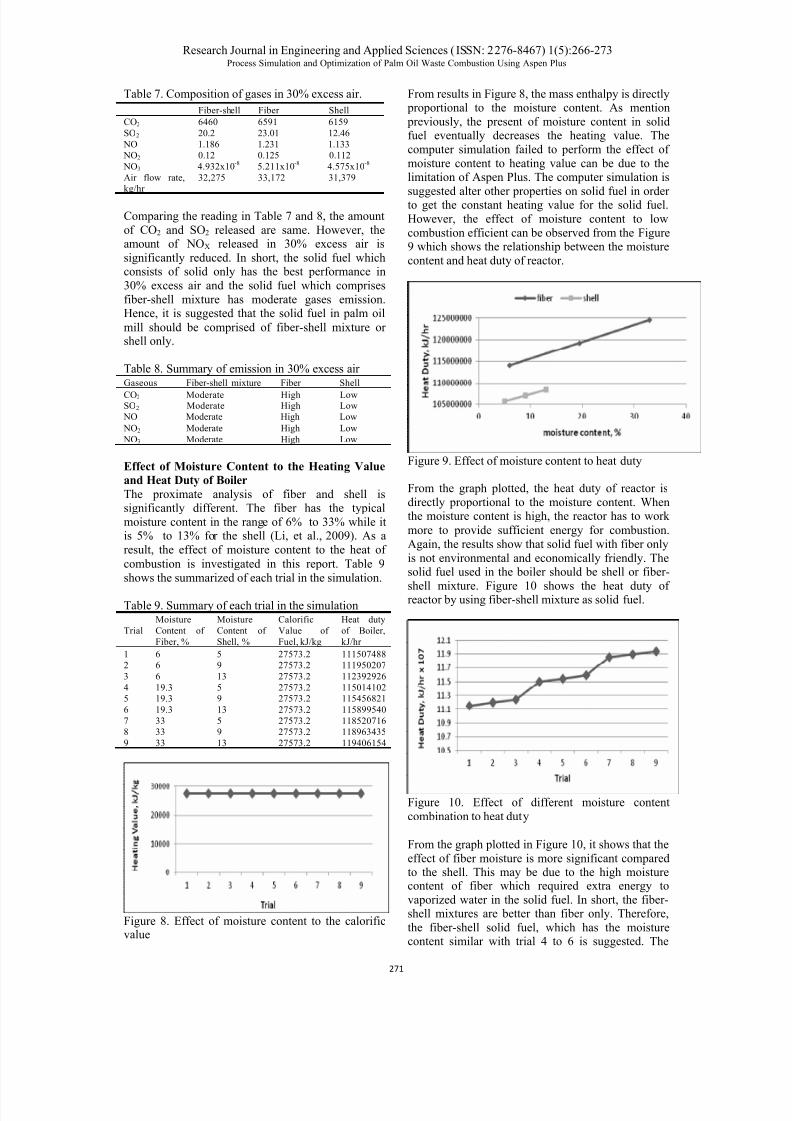
Figure 8. Effect of moisture content to the calorificvalue
From results in Figure 8, the mass enthalpy is directly proportional to the moisture content. As mention
previously, the present of moisture content in solidfuel eventually decreases the heating value. The
computer simulation failed to perform the effect of
moisture content to heating value can be due to thelimitation of Aspen Plus. The computer simulation is
suggested alter other properties on solid fuel in orderto get the constant heating value for the solid fuel.
However, the effect of moisture content to low
combustion efficient can be observed from the Figure9 which shows the relationship between the moisture
content and heat duty of reactor.
Figure 9. Effect of moisture content to heat duty
From the graph plotted, the heat duty of reactor is
directly proportional to the moisture content. Whenthe moisture content is high, the reactor has to work
more to provide sufficient energy for combustion.
Again, the results show that solid fuel with fiber only
is not environmental and economically friendly. Thesolid fuel used in the boiler should be shell or fiber-
shell mixture. Figure 10 shows the heat duty ofreactor by using fiber-shell mixture as solid fuel.
Figure 10. Effect of different moisture content
combination to heat duty
From the graph plotted in Figure 10, it shows that the
effect of fiber moisture is more significant comparedto the shell. This may be due to the high moisturecontent of fiber which required extra energy to
vaporized water in the solid fuel. In short, the fiber-shell mixtures are better than fiber only. Therefore,
the fiber-shell solid fuel, which has the moisturecontent similar with trial 4 to 6 is suggested. The
Fiber-shell Fiber Shell
CO2 6460 6591 6159
SO2 20.2 23.01 12.46
NO 1.186 1.231 1.133
NO2 0.12 0.125 0.112
NO3 4.932x10⁻⁸ 5.211x10
-8 4.575x10
-8
Air flow rate,
kg/hr
32,275 33,172 31,379
8/9/2019 Process Simulation and Optimization
http://slidepdf.com/reader/full/process-simulation-and-optimization 7/8
Research Journal in Engineering and Applied Sciences ( ISSN: 2276-8467) 1(5):266-273Process Simulation and Optimization of Palm Oil Waste Combustion Using Aspen Plus
!#!
results may slightly deviate from the experimentalvalue due to the assumption Aspen Plus.
Effect of Ash Content to the Heating Value
Ash content is referring to the mass fraction of
incombustible material in solid fuel. It was foundthat the ash is the heat sink in the same way as
moisture, lowering combustion efficiency (Ciolkosz,2010). Besides, the similar literature showed that
systems that are designed to combust wood can be
overwhelmed by the volume of ash if other biofuelsare used, which can reduce the combustion efficiency
or clog the ash handling mechanisms (Pritchard,2002). Thus, the relationship between heating value
of solid fuel and ash content is the study to predictthe effect to combustion efficiency. Table 10 shows
the summarized of each trial in the simulation.
Table 10. Summary of each trial in the simulation ash
sensitivityTrial Ash
content
ofFiber,
%
Ash
Content
ofShell,
%
Heating
Value of
Fiber,kJ/kg
Heating
Value of
Shell,kJ/kg
Heat duty
of Boiler,
kJ/hr
1 2 2 -8833.66 -
6346.94
120213475
2 2 4 -8833.66 -
6158.07
120022532
3 2 6 -8833.66 -
5969.21
119831589
4 5 2 -8614.24 -
6346.94
119695626
5 5 4 -8614.24 -
6158074
119504683
6 5 6 -8614.24 -
5969208
119313740
7 8 2 -8394.81 -
6346939
119177778
8 8 4 -8394.81 -6158074
118986835
9 8 6 -8394.81 -
5969208
118795892
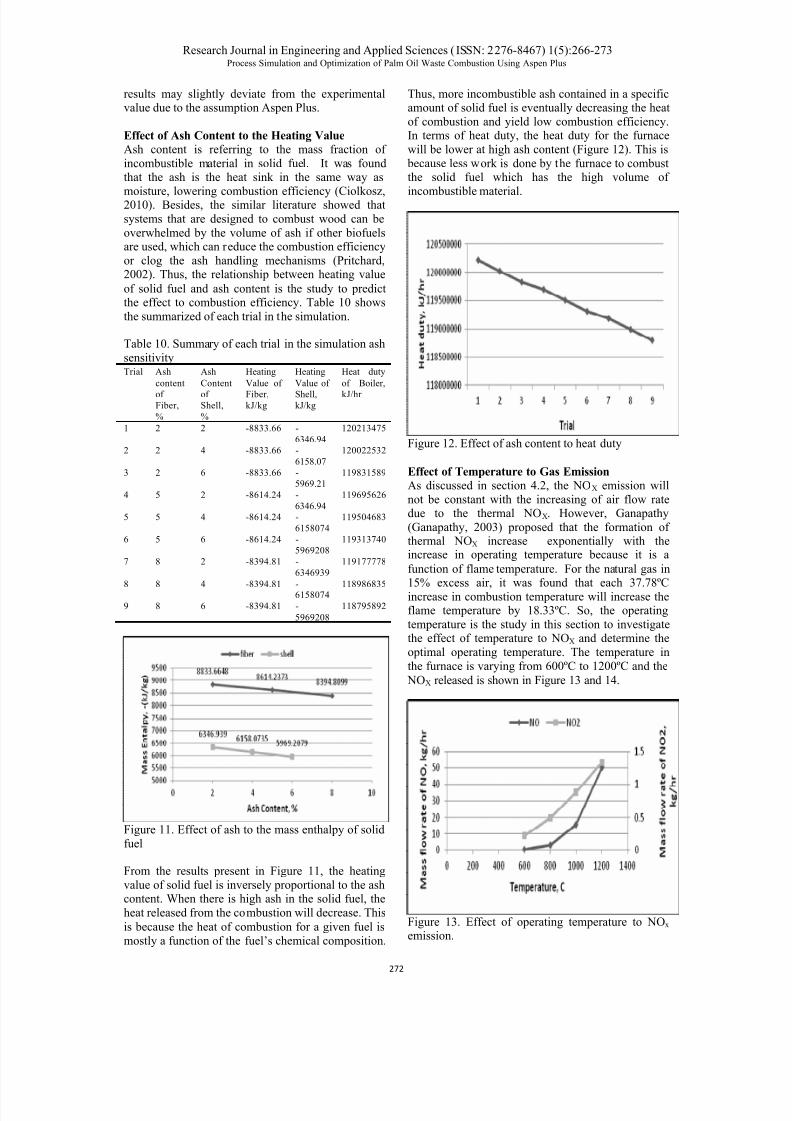
Figure 11. Effect of ash to the mass enthalpy of solid
fuel
From the results present in Figure 11, the heating
value of solid fuel is inversely proportional to the ashcontent. When there is high ash in the solid fuel, the
heat released from the combustion will decrease. This
is because the heat of combustion for a given fuel is
mostly a function of the fuel’s chemical composition.
Thus, more incombustible ash contained in a specificamount of solid fuel is eventually decreasing the heat
of combustion and yield low combustion efficiency.In terms of heat duty, the heat duty for the furnace
will be lower at high ash content (Figure 12). This is
because less work is done by the furnace to combustthe solid fuel which has the high volume of
incombustible material.
Figure 12. Effect of ash content to heat duty
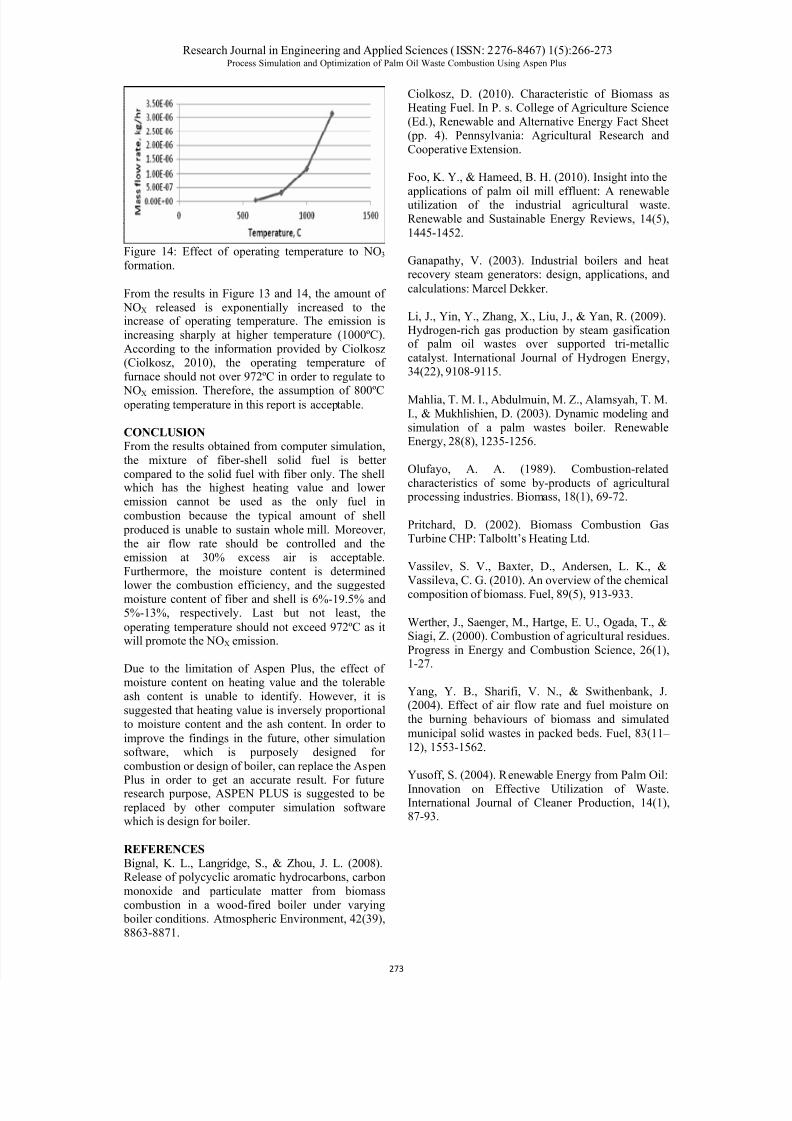
Effect of Temperature to Gas Emission
As discussed in section 4.2, the NOX emission will
not be constant with the increasing of air flow ratedue to the thermal NOX. However, Ganapathy
(Ganapathy, 2003) proposed that the formation ofthermal NOX increase exponentially with theincrease in operating temperature because it is a
function of flame temperature. For the natural gas in15% excess air, it was found that each 37.78ºC
increase in combustion temperature will increase theflame temperature by 18.33ºC. So, the operating
temperature is the study in this section to investigatethe effect of temperature to NOX and determine the
optimal operating temperature. The temperature in
the furnace is varying from 600ºC to 1200ºC and the
NOX released is shown in Figure 13 and 14.
Figure 13. Effect of operating temperature to NOx emission.
8/9/2019 Process Simulation and Optimization
http://slidepdf.com/reader/full/process-simulation-and-optimization 8/8
Research Journal in Engineering and Applied Sciences ( ISSN: 2276-8467) 1(5):266-273Process Simulation and Optimization of Palm Oil Waste Combustion Using Aspen Plus
!#(
Figure 14: Effect of operating temperature to NO3
formation.
From the results in Figure 13 and 14, the amount of
NOX released is exponentially increased to theincrease of operating temperature. The emission is
increasing sharply at higher temperature (1000ºC).
According to the information provided by Ciolkosz(Ciolkosz, 2010), the operating temperature of
furnace should not over 972ºC in order to regulate to
NOX emission. Therefore, the assumption of 800ºCoperating temperature in this report is acceptable.
CONCLUSION
From the results obtained from computer simulation,
the mixture of fiber-shell solid fuel is better
compared to the solid fuel with fiber only. The shellwhich has the highest heating value and lower
emission cannot be used as the only fuel in
combustion because the typical amount of shell
produced is unable to sustain whole mill. Moreover,
the air flow rate should be controlled and theemission at 30% excess air is acceptable.
Furthermore, the moisture content is determined
lower the combustion efficiency, and the suggestedmoisture content of fiber and shell is 6%-19.5% and5%-13%, respectively. Last but not least, the
operating temperature should not exceed 972ºC as itwill promote the NOX emission.
Due to the limitation of Aspen Plus, the effect ofmoisture content on heating value and the tolerable
ash content is unable to identify. However, it is
suggested that heating value is inversely proportionalto moisture content and the ash content. In order to
improve the findings in the future, other simulationsoftware, which is purposely designed for
combustion or design of boiler, can replace the Aspen
Plus in order to get an accurate result. For futureresearch purpose, ASPEN PLUS is suggested to be
replaced by other computer simulation softwarewhich is design for boiler.
REFERENCES
Bignal, K. L., Langridge, S., & Zhou, J. L. (2008).Release of polycyclic aromatic hydrocarbons, carbon
monoxide and particulate matter from biomass
combustion in a wood-fired boiler under varying boiler conditions. Atmospheric Environment, 42(39),
8863-8871.
Ciolkosz, D. (2010). Characteristic of Biomass asHeating Fuel. In P. s. College of Agriculture Science
(Ed.), Renewable and Alternative Energy Fact Sheet(pp. 4). Pennsylvania: Agricultural Research and
Cooperative Extension.
Foo, K. Y., & Hameed, B. H. (2010). Insight into the
applications of palm oil mill effluent: A renewableutilization of the industrial agricultural waste.
Renewable and Sustainable Energy Reviews, 14(5),
1445-1452.
Ganapathy, V. (2003). Industrial boilers and heatrecovery steam generators: design, applications, and
calculations: Marcel Dekker.
Li, J., Yin, Y., Zhang, X., Liu, J., & Yan, R. (2009).Hydrogen-rich gas production by steam gasificationof palm oil wastes over supported tri-metallic
catalyst. International Journal of Hydrogen Energy,34(22), 9108-9115.
Mahlia, T. M. I., Abdulmuin, M. Z., Alamsyah, T. M.
I., & Mukhlishien, D. (2003). Dynamic modeling and
simulation of a palm wastes boiler. RenewableEnergy, 28(8), 1235-1256.
Olufayo, A. A. (1989). Combustion-related
characteristics of some by-products of agricultural processing industries. Biomass, 18(1), 69-72.
Pritchard, D. (2002). Biomass Combustion GasTurbine CHP: Talboltt’s Heating Ltd.
Vassilev, S. V., Baxter, D., Andersen, L. K., &
Vassileva, C. G. (2010). An overview of the chemical
composition of biomass. Fuel, 89(5), 913-933.
Werther, J., Saenger, M., Hartge, E. U., Ogada, T., &Siagi, Z. (2000). Combustion of agricultural residues.
Progress in Energy and Combustion Science, 26(1),1-27.
Yang, Y. B., Sharifi, V. N., & Swithenbank, J.(2004). Effect of air flow rate and fuel moisture on
the burning behaviours of biomass and simulated
municipal solid wastes in packed beds. Fuel, 83(11–
12), 1553-1562.
Yusoff, S. (2004). Renewable Energy from Palm Oil:
Innovation on Effective Utilization of Waste.International Journal of Cleaner Production, 14(1),87-93.