processing digital ideas
TRANSCRIPT
Active Learning Pedagogy: Applying active research to a learning methodology for ESL
studentsby
Willard G. Van De BogartLanguage Institute, Bangkok University
Chulalongkorn University Language InstituteInternational Research Seminar 2016
In Celebration of Chulalongkorn University Language Institute’s 39th Anniversary“Action Research in ELT for Quality
Instruction”July 15, 2016
I D E A
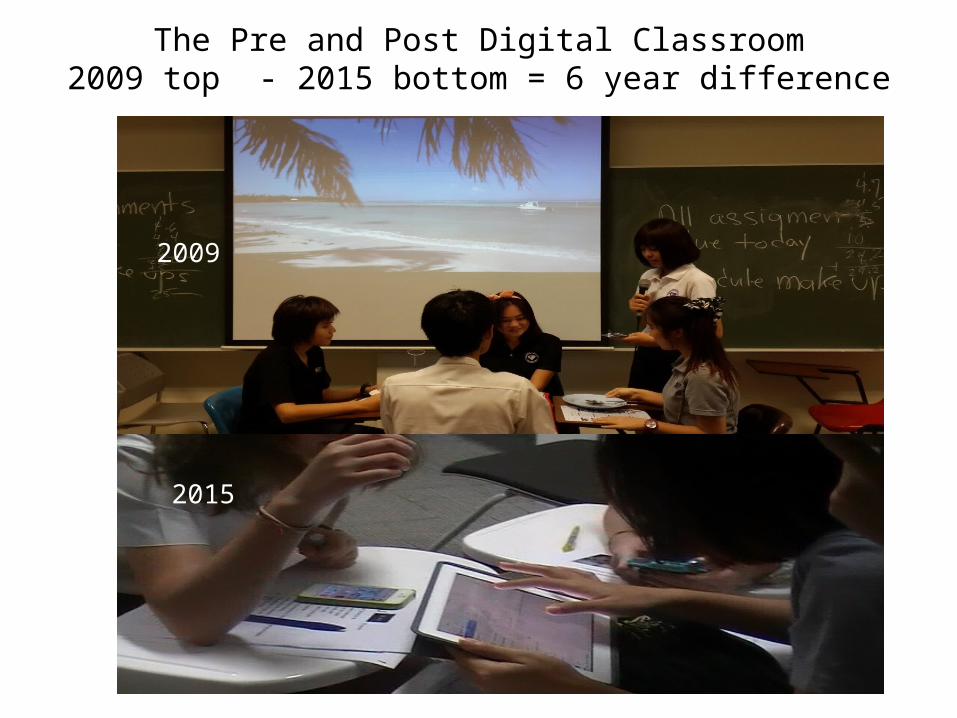
The Pre and Post Digital Classroom2009 top - 2015 bottom = 6 year difference
2009
2015
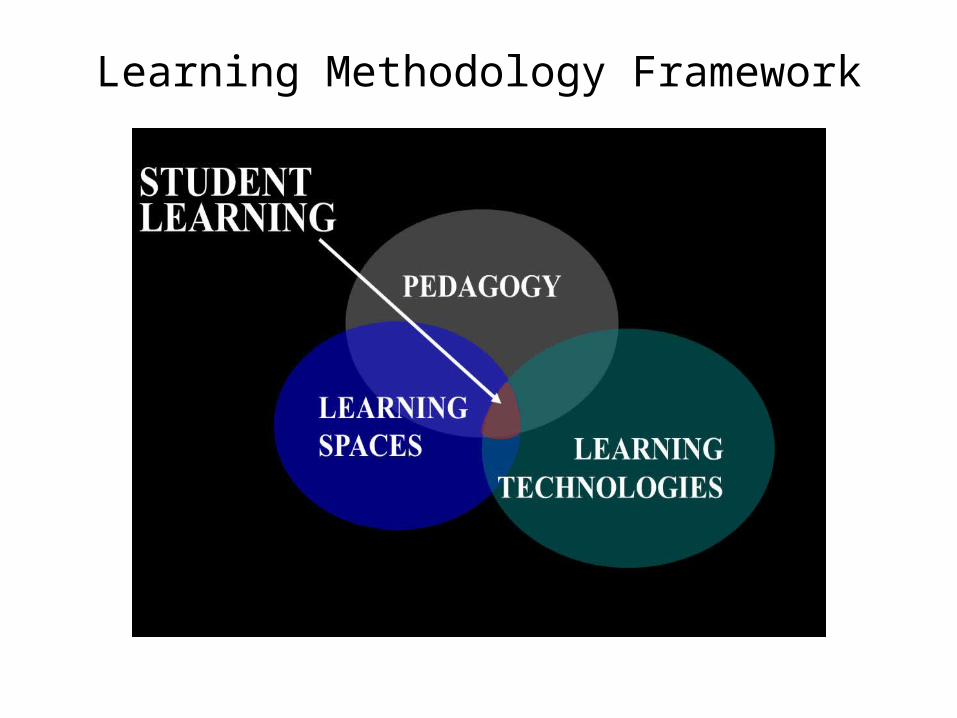
Learning Methodology Framework
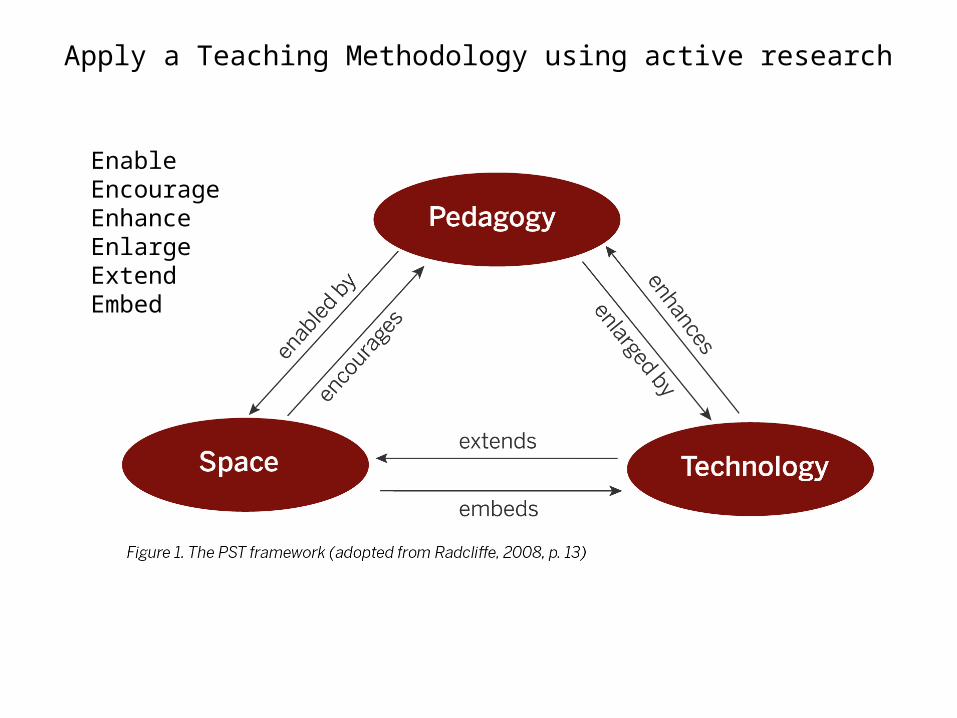
Apply a Teaching Methodology using active research
EnableEncourageEnhanceEnlargeExtendEmbed
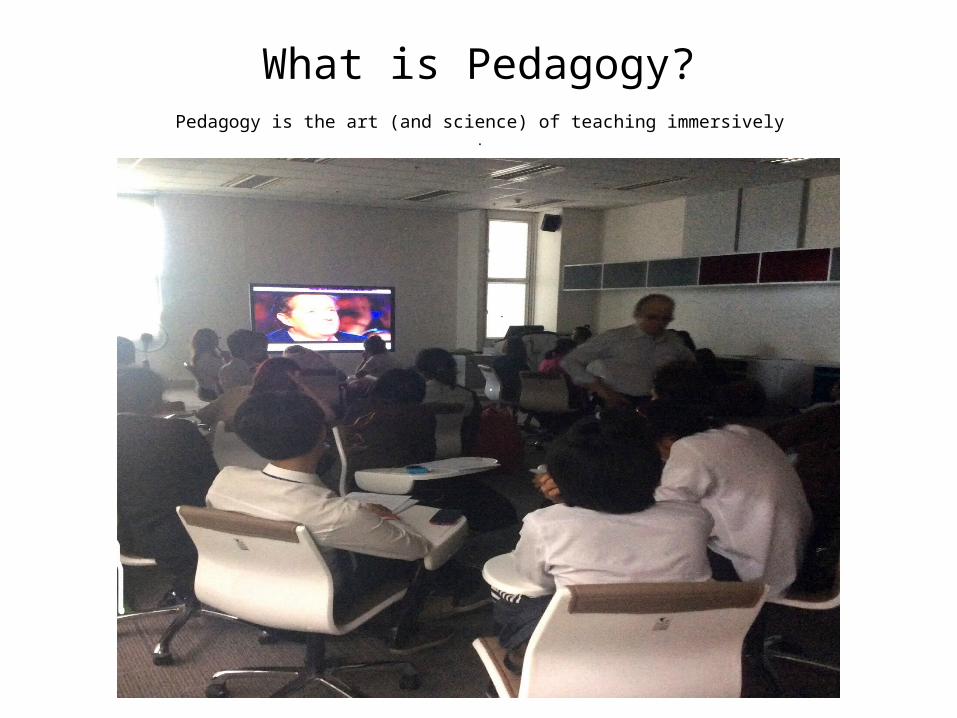
What is Pedagogy?Pedagogy is the art (and science) of teaching immersively
.
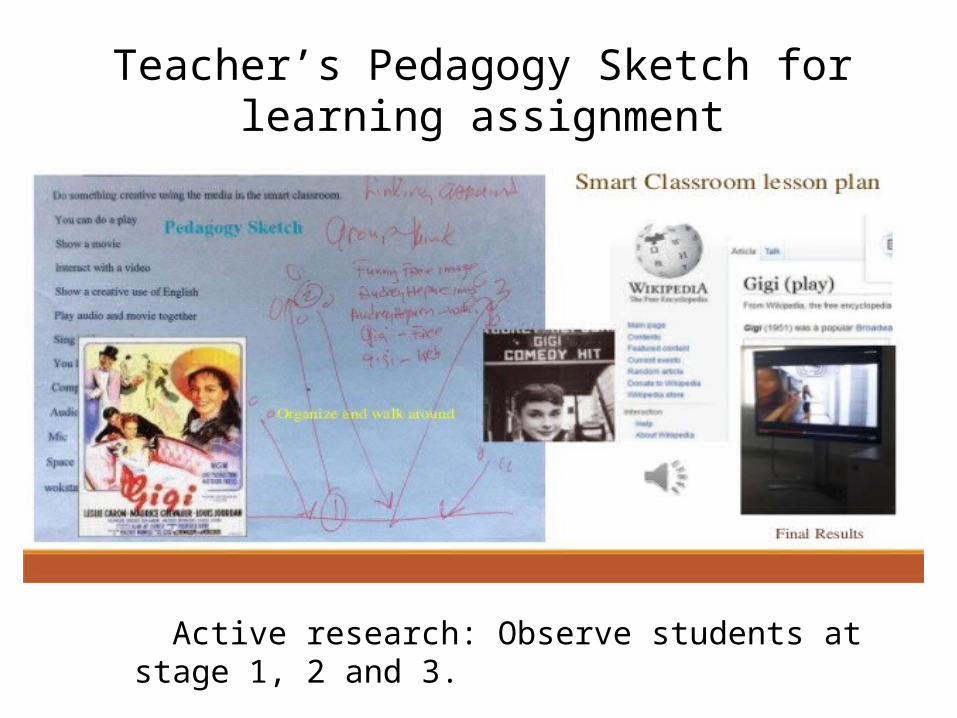
Teacher’s Pedagogy Sketch for learning assignment
Active research: Observe students at stage 1, 2 and 3.
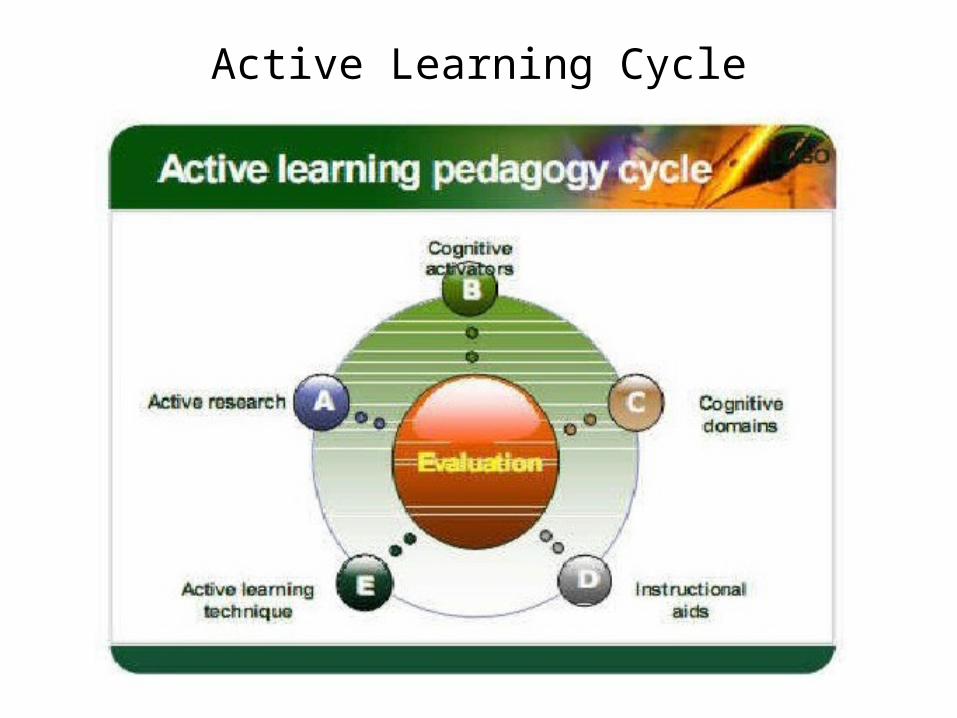
Active Learning Cycle
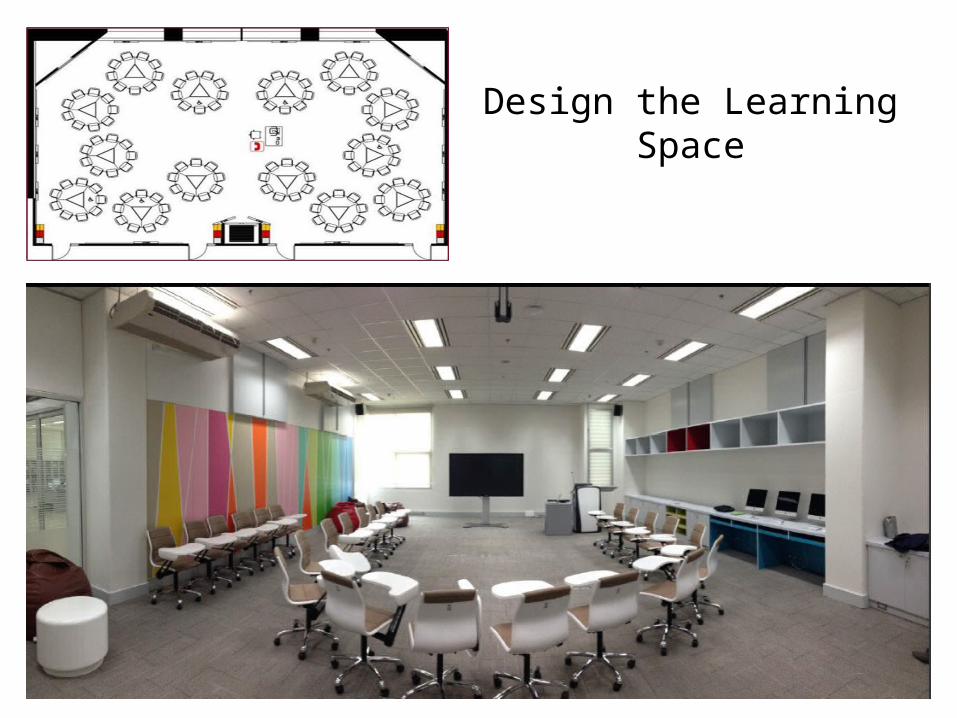
Design the Learning Space
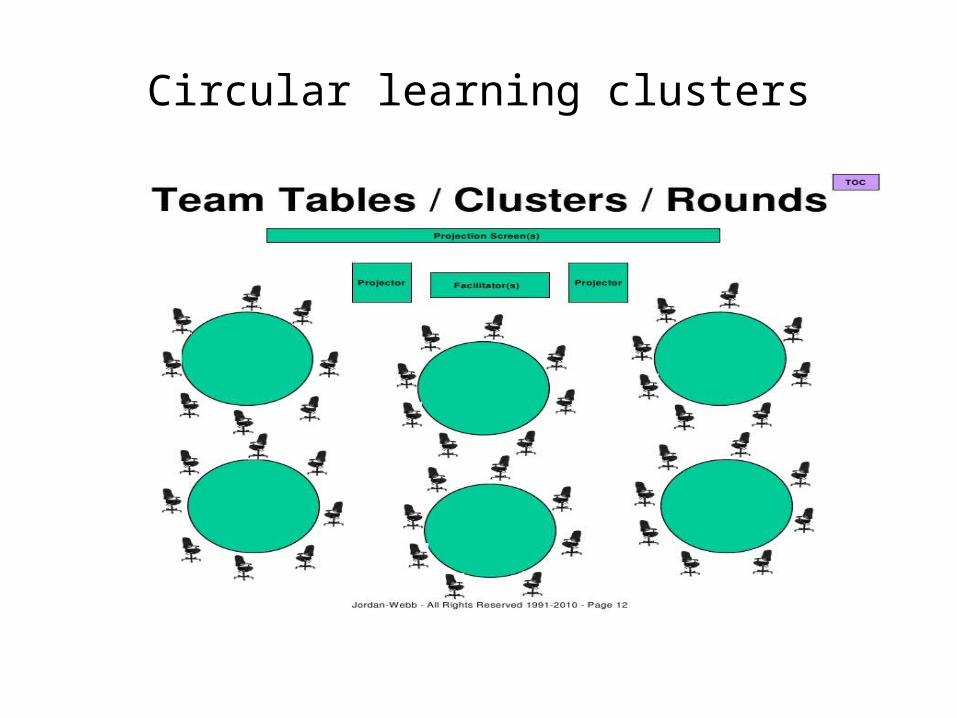
Circular learning clusters
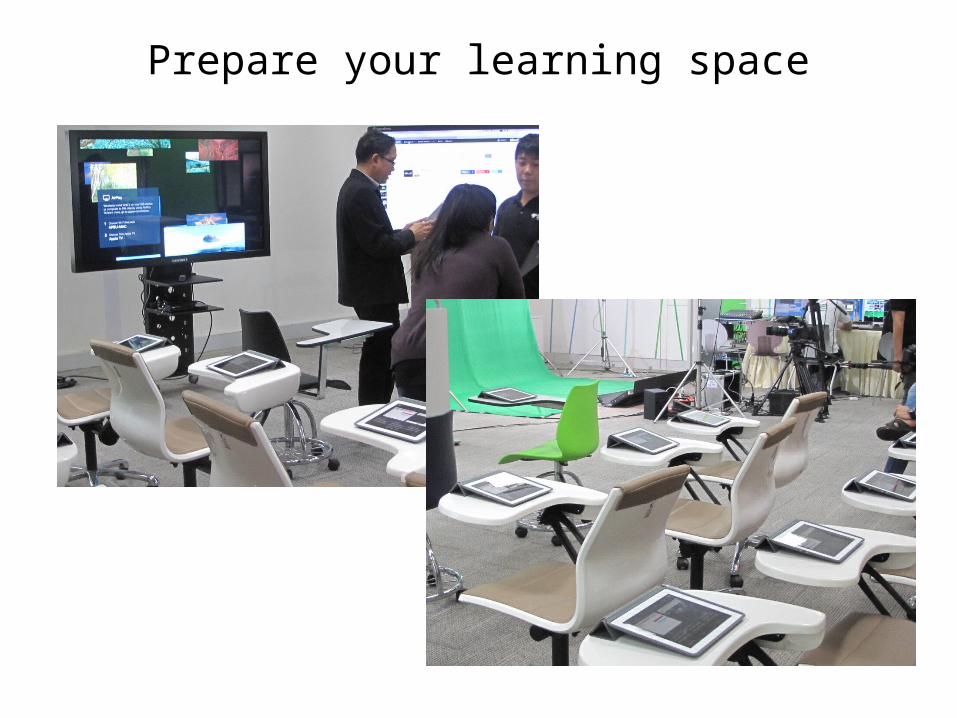
Prepare your learning space
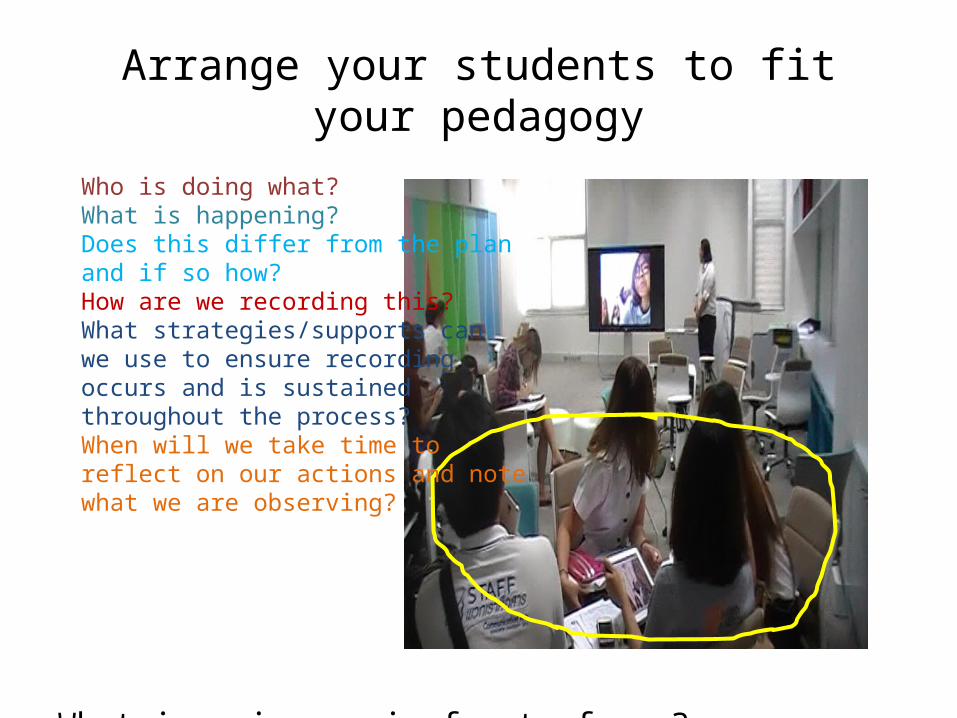
Arrange your students to fit your pedagogy
What is going on in front of you?
Who is doing what?What is happening?Does this differ from the plan and if so how?How are we recording this?What strategies/supports can we use to ensure recording occurs and is sustained throughout the process?When will we take time to reflect on our actions and note what we are observing?
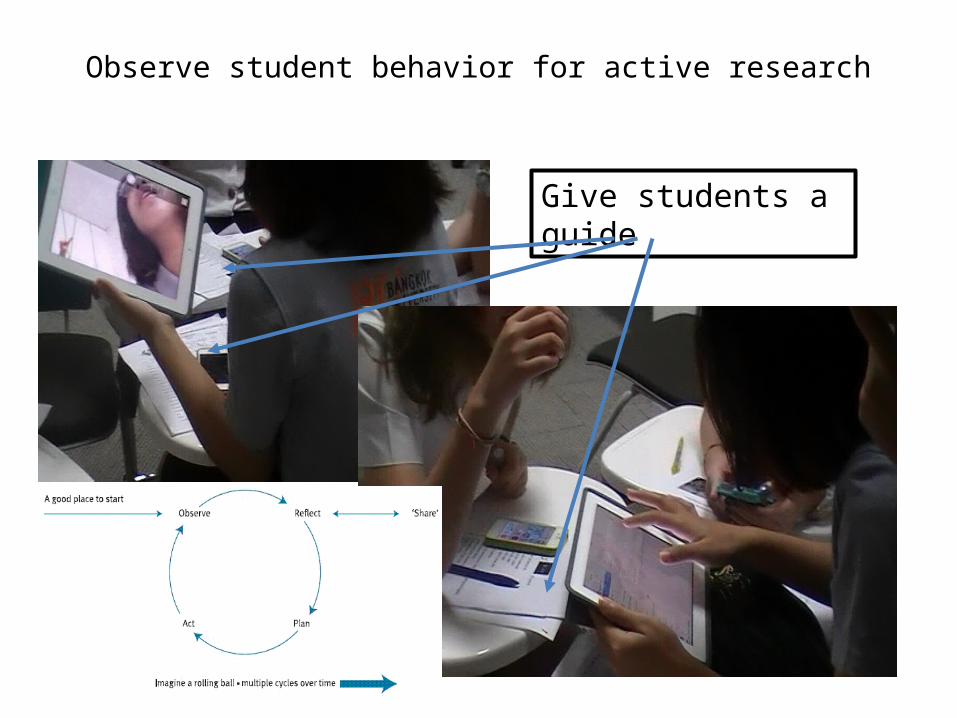
Observe student behavior for active research
Give students a guide
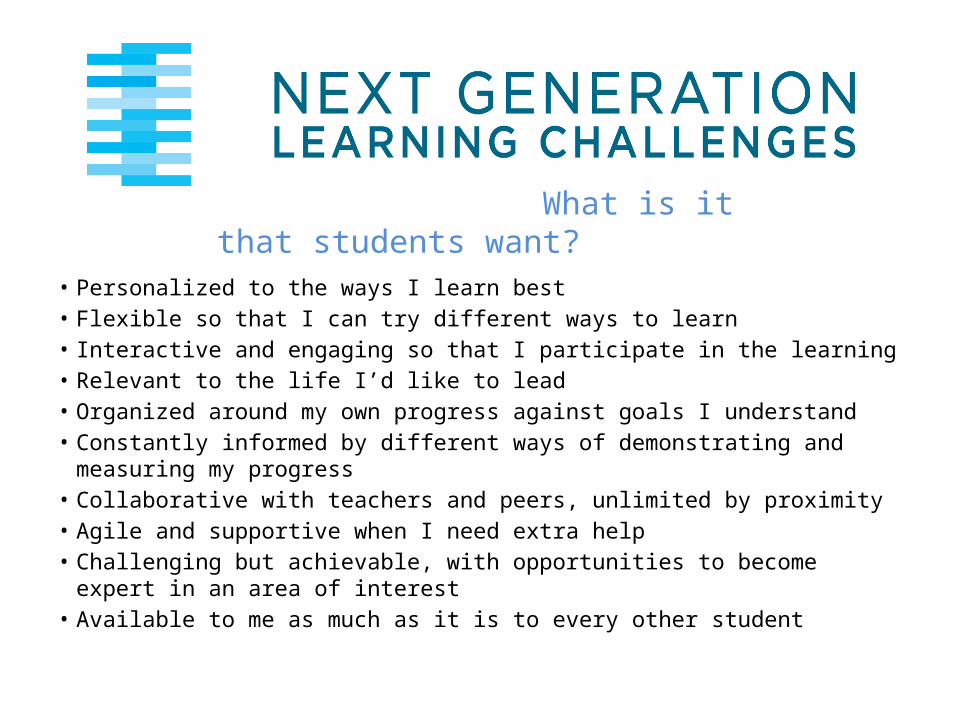
• Personalized to the ways I learn best• Flexible so that I can try different ways to learn• Interactive and engaging so that I participate in the learning• Relevant to the life I’d like to lead• Organized around my own progress against goals I understand• Constantly informed by different ways of demonstrating and measuring my
progress• Collaborative with teachers and peers, unlimited by proximity• Agile and supportive when I need extra help• Challenging but achievable, with opportunities to become expert in an area of
interest• Available to me as much as it is to every other student
What is it that students want?
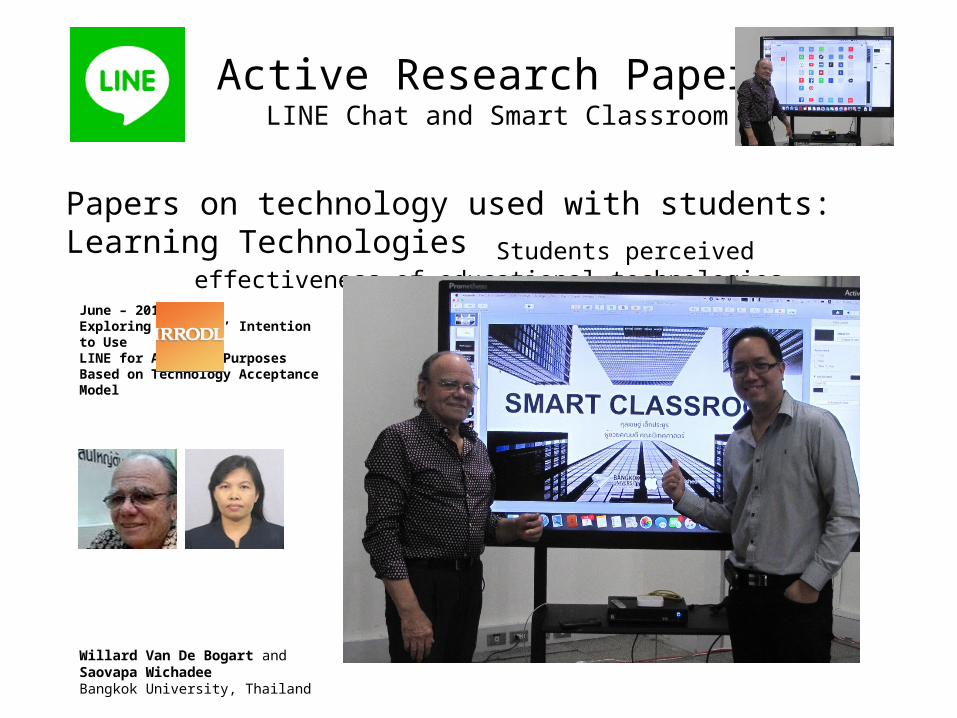
Active Research PapersLINE Chat and Smart Classroom
Papers on technology used with students: Learning Technologies
June – 2015Exploring Students’ Intention to Use LINE for Academic Purposes Based on Technology Acceptance Model
Willard Van De Bogart and Saovapa Wichadee Bangkok University, Thailand
Students perceived effectiveness of educational technologies
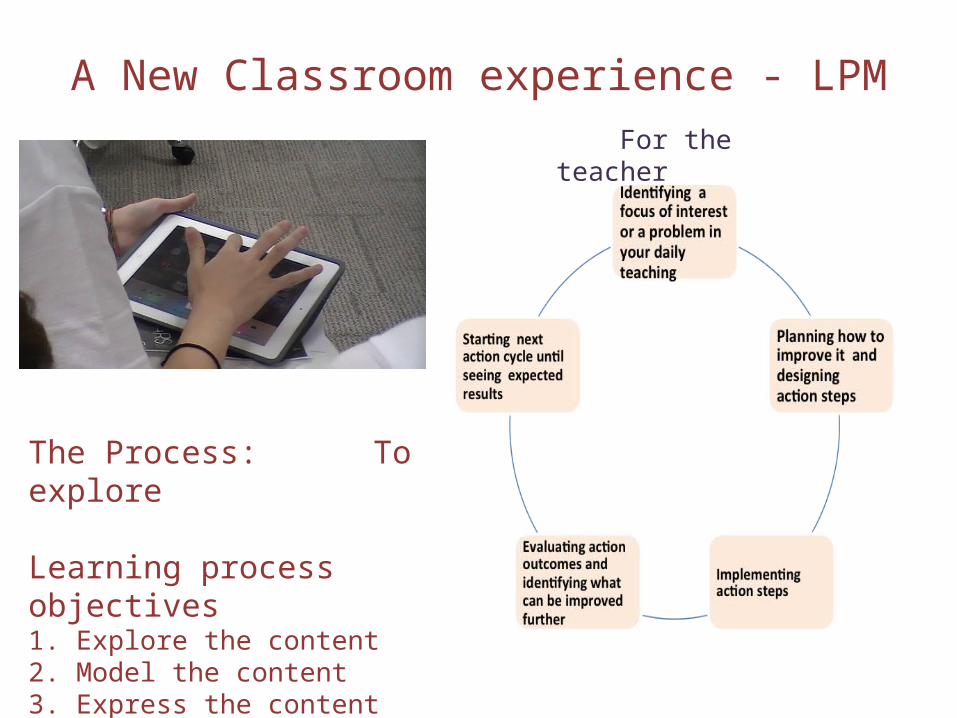
A New Classroom experience - LPM
The Process: To explore
Learning process objectives1. Explore the content2. Model the content3. Express the content
For the teacher
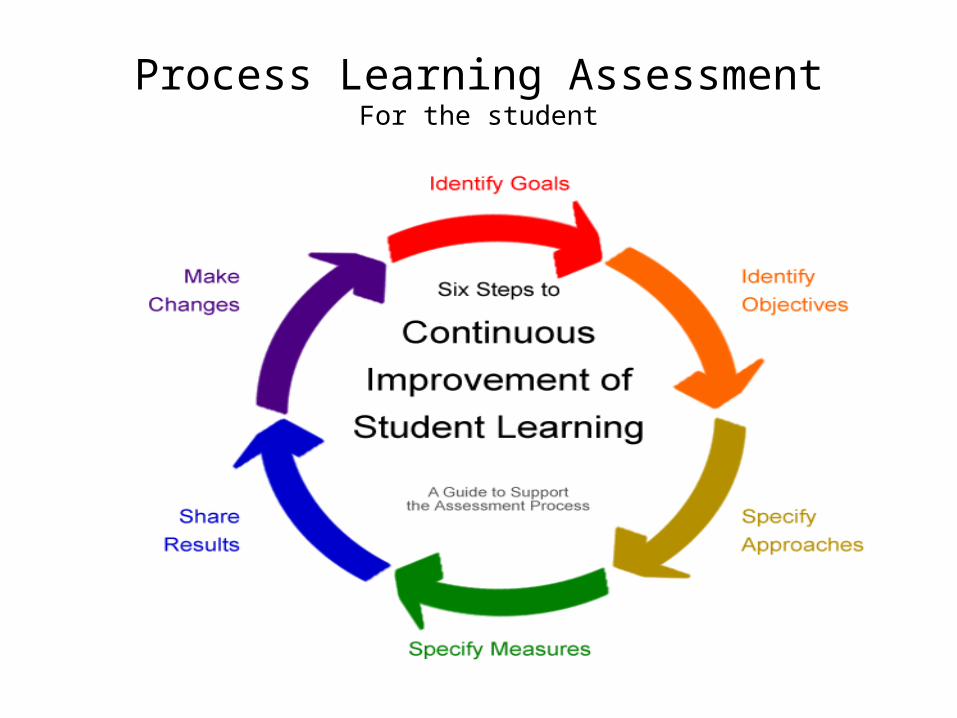
Process Learning AssessmentFor the student
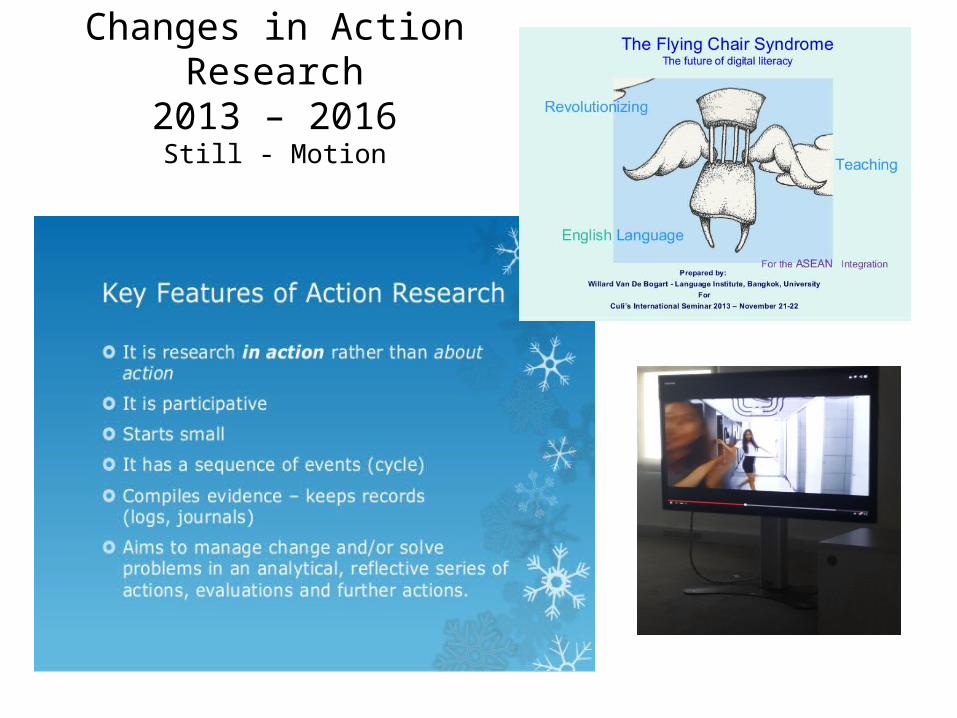
Changes in Action Research2013 – 2016
Still - Motion
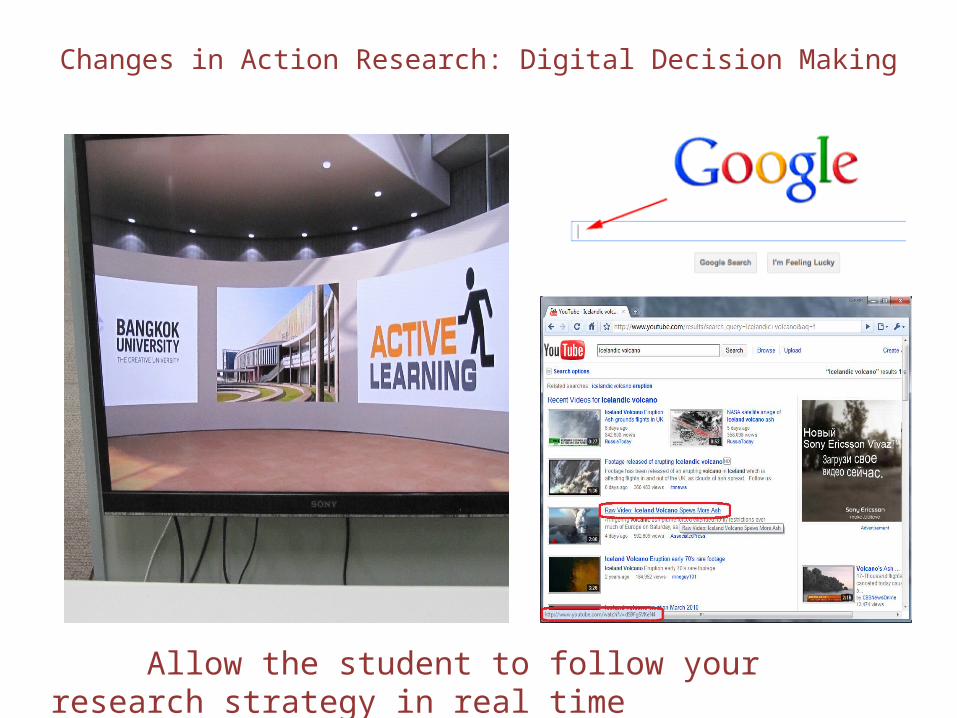
Changes in Action Research: Digital Decision Making
Allow the student to follow your research strategy in real time
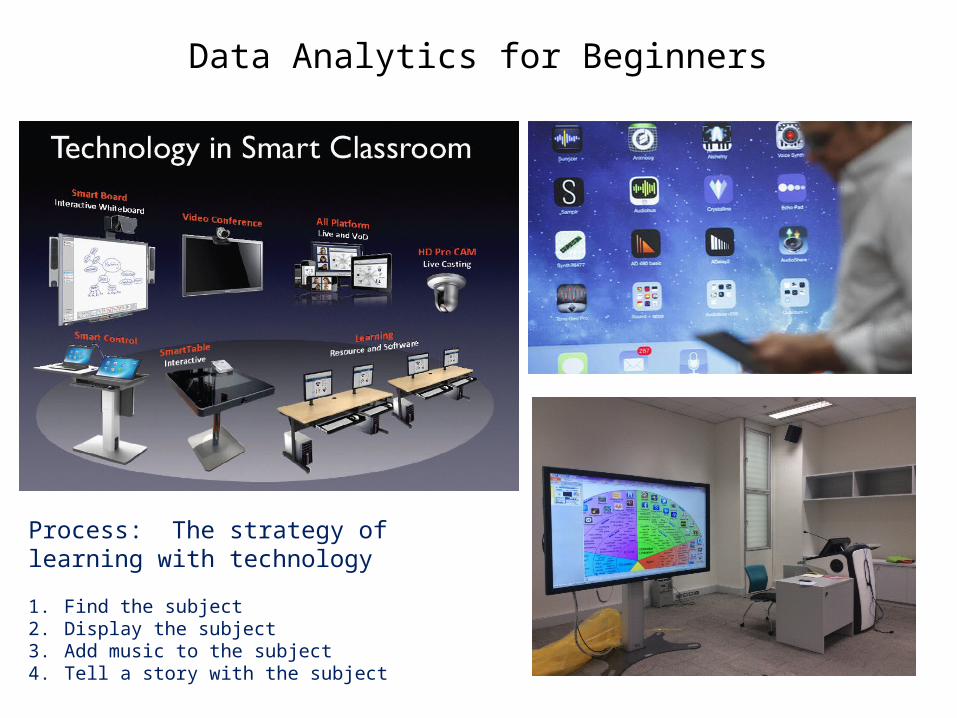
Data Analytics for Beginners
Process: The strategy of learning with technology
1. Find the subject2. Display the subject3. Add music to the subject4. Tell a story with the subject
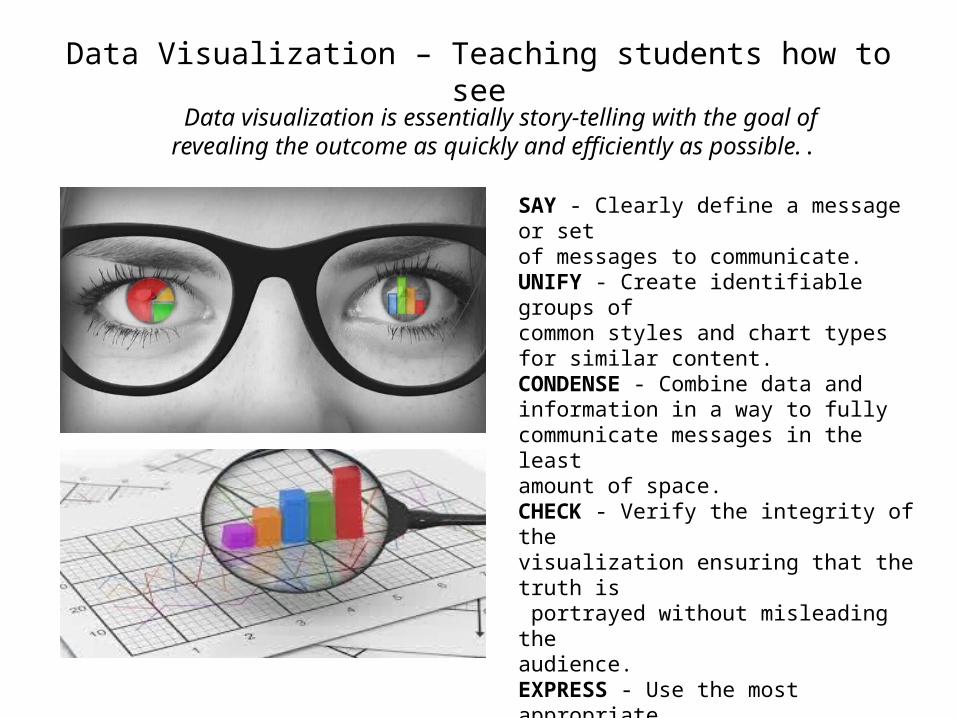
Data Visualization – Teaching students how to seeData visualization is essentially story-telling with the goal of revealing the
outcome as quickly and efficiently as possible..
SAY - Clearly define a message or set of messages to communicate.UNIFY - Create identifiable groups of common styles and chart types for similar content.CONDENSE - Combine data and information in a way to fully communicate messages in the least amount of space.CHECK - Verify the integrity of the visualization ensuring that the truth is portrayed without misleading the audience.EXPRESS - Use the most appropriate visual components for the data and message to be articulated.SIMPLIFY - Remove unnecessary content and ensure clean presentation.

Visualizing Big Data: Bar Charts for Wordshttp://www.wired.com/2008/06/pb-visualizing/
The biggest challenge of the Petabyte Age won't be storing all that data, it'll be figuring out how to make sense of it. Martin Wattenberg, a mathematician and computer scientist at IBM's Watson Research Center in Cambridge, Massachusetts
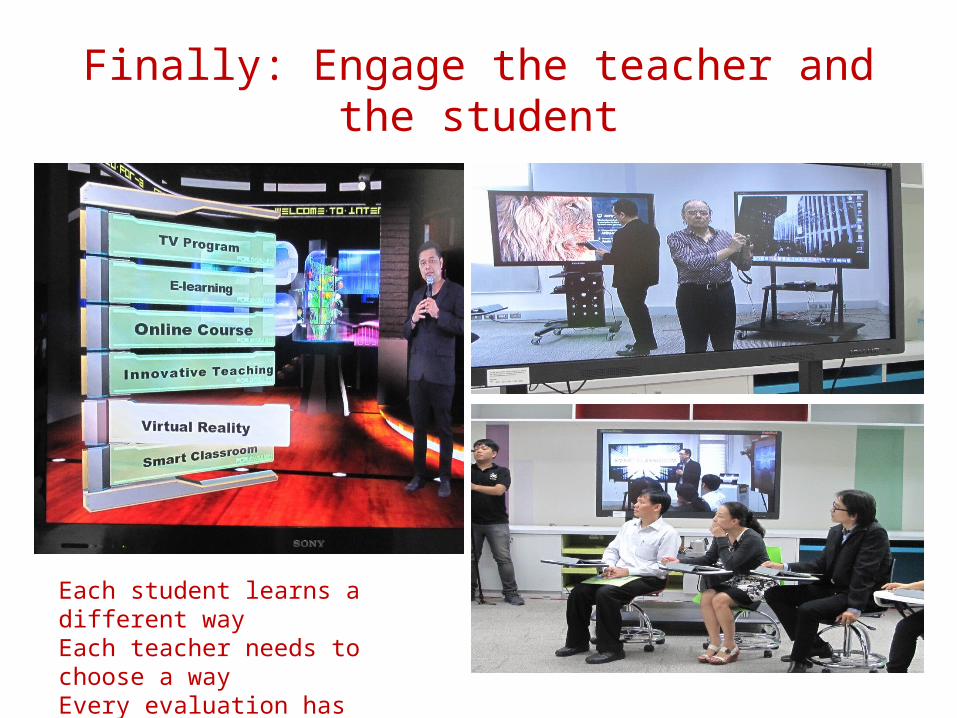
Finally: Engage the teacher and the student
Each student learns a different wayEach teacher needs to choose a wayEvery evaluation has merit