procter and gamble
TRANSCRIPT

PRESENTED TO:
PRESENTED BY:
ANALYSIS ON
P&G
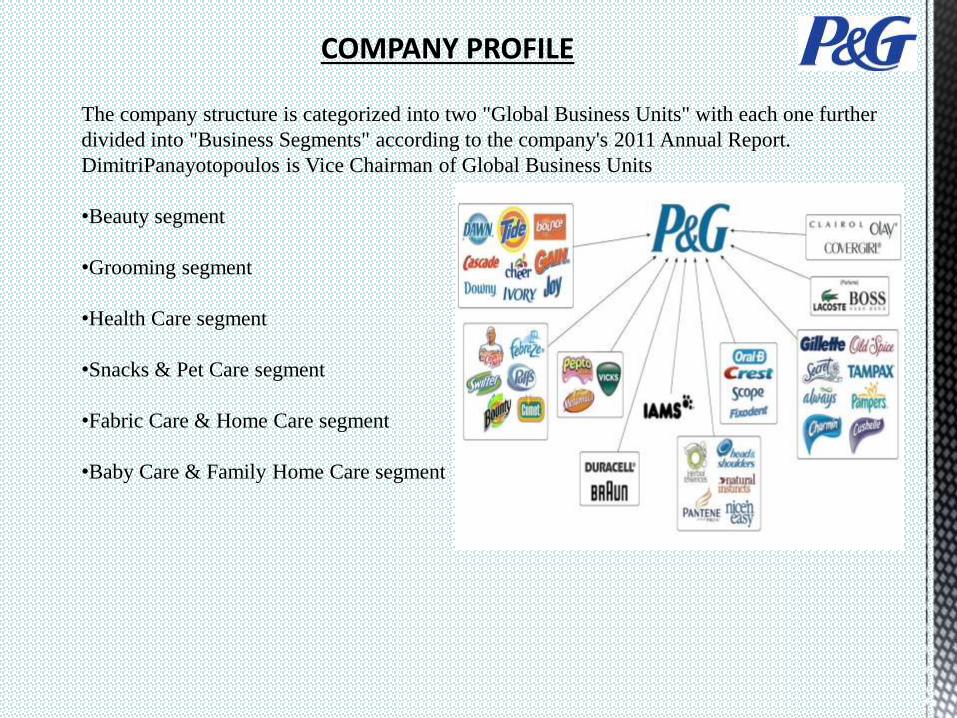
The company structure is categorized into two "Global Business Units" with each one further
divided into "Business Segments" according to the company's 2011 Annual Report.
DimitriPanayotopoulos is Vice Chairman of Global Business Units
•Beauty segment
•Grooming segment
•Health Care segment
•Snacks & Pet Care segment
•Fabric Care & Home Care segment
•Baby Care & Family Home Care segment
COMPANY PROFILE
Audited the attached Balance Sheet of Procter & Gamble Hygiene and Health Care Limited (the
Company), as at 30th June,2012, the Statement of Profit and Loss and the Cash Flow Statement
of the Company for the Financial Year ended on that date, both annexed thereto.
Financial statements are the responsibility of the Company's Management.
Our responsibility is to express an opinion on these financial statements based on our audit.
Standards require that we plan and perform the audit to obtain reasonable assurance about
whether the financial statements are free of material misstatements.
An audit includes examining, on a test basis, evidence supporting the amounts and the
disclosures in the financial statements. An audit also includes assessing the accounting
principles used and significant estimates made by the Management, as well as evaluating the
overall financial statement presentation. We believe that our audit provides a reasonable basis
for our opinion.
We have obtained all the information and explanation which to the best of our knowledge and
belief were necessary for the purposes of our audit; in our opinion, proper books of account as
required by law have been kept by the Company so far as it appears from our examination of
those books; the Balance Sheet, the Statement of Profit and Loss and also the Cash Flow
Statement dealt with by this report are in agreement with the books of account; in our opinion
and to the best of our information and according to the explanations given to us.

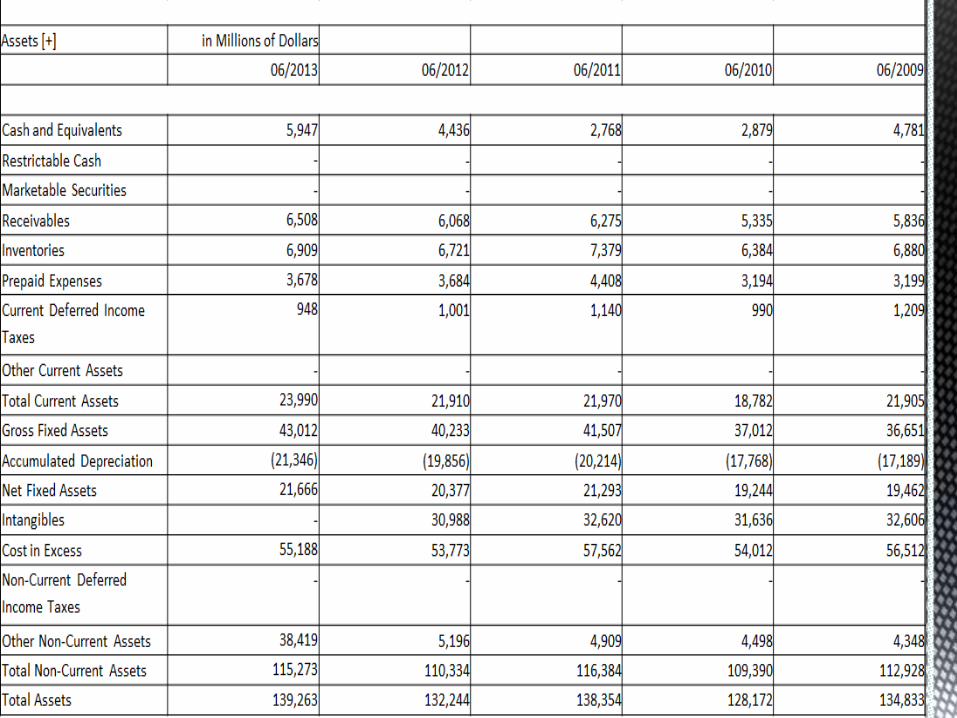
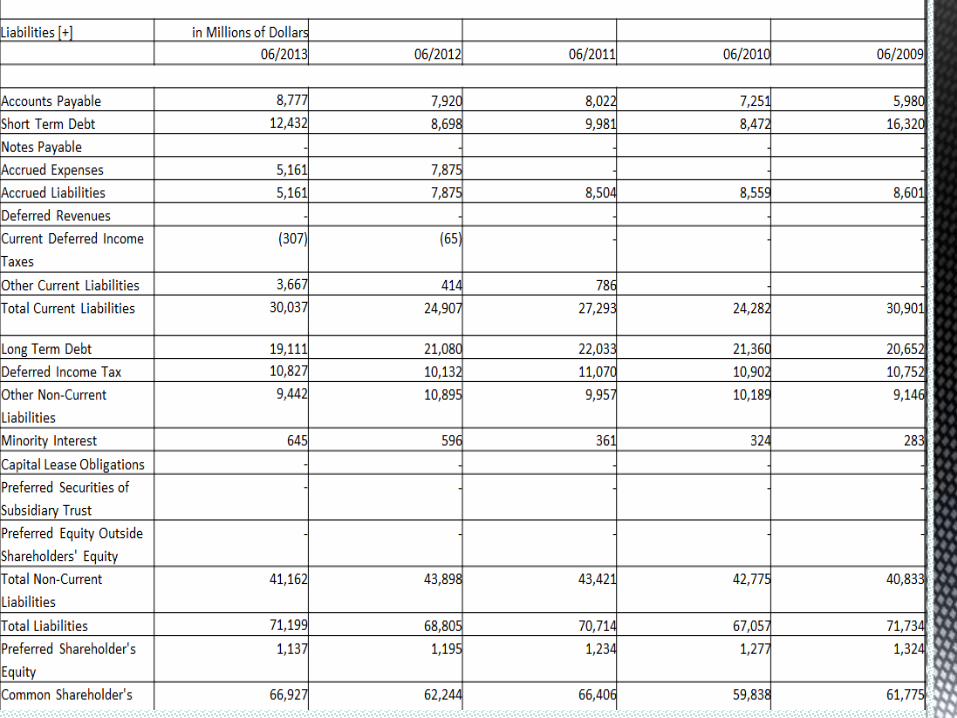
BALANCE SHEET
Commodity costs will increase modestly next year, executives said on the conference
call. Fourth-quarter sales fell 1.2 percent to $20.21 billion, trailing the $20.25 billion
average of analysts’ estimates compiled by Bloomberg. Executives on the conference
call said they expected the company to return to long-term growth rates by fiscal year
2014, helped by a strengthening U.S. business.
PG +1.01% fiscal fourth-quarter earnings fell 48% amid restructuring and other
charges, while the world's largest consumer-products company's sales and unit
volume improved. P&G is rapidly cutting costs and eliminating jobs over the next
couple of years to help fund the development and introduction of new products,
ranging from unit-dose Tide Pods laundry detergent to thicker Bounty paper towels.
The efforts have helped lift P&G's profit in recent quarters, but the underperformance
of some segments, like its beauty business, continues to challenge its sales growth.
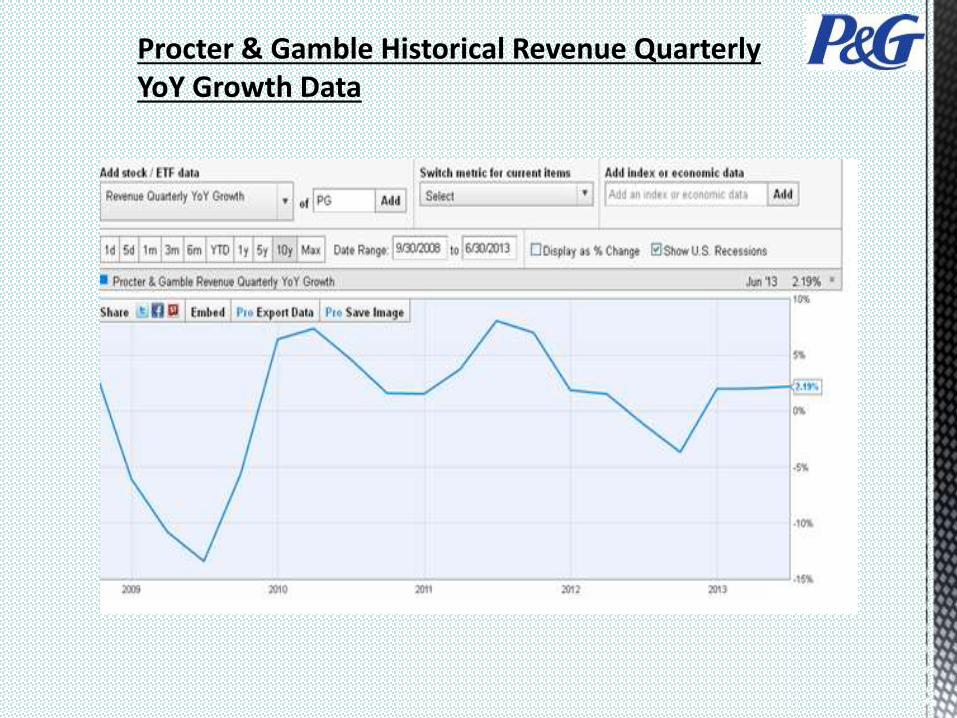
Procter & Gamble Historical Revenue Quarterly YoY Growth Data
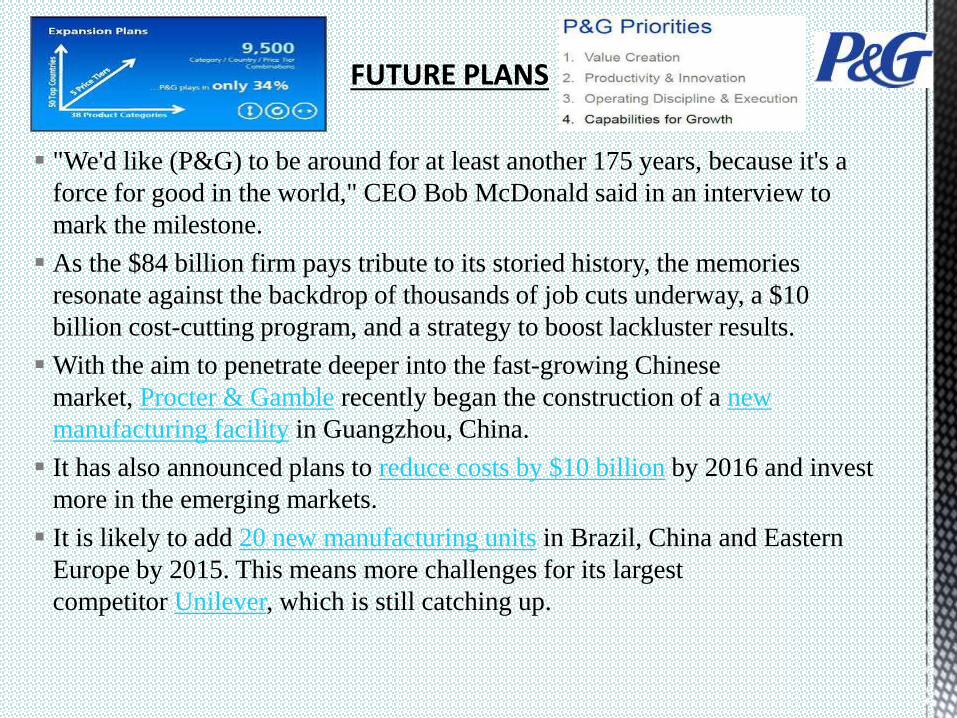
"We'd like (P&G) to be around for at least another 175 years, because it's a
force for good in the world," CEO Bob McDonald said in an interview to
mark the milestone.
As the $84 billion firm pays tribute to its storied history, the memories
resonate against the backdrop of thousands of job cuts underway, a $10
billion cost-cutting program, and a strategy to boost lackluster results.
With the aim to penetrate deeper into the fast-growing Chinese
market, Procter & Gamble recently began the construction of a new
manufacturing facility in Guangzhou, China.
It has also announced plans to reduce costs by $10 billion by 2016 and invest
more in the emerging markets.
It is likely to add 20 new manufacturing units in Brazil, China and Eastern
Europe by 2015. This means more challenges for its largest
competitor Unilever, which is still catching up.
Procter & Gamble Co.'s cash and cash equivalents increased from 2011 to 2012 and from 2012 to 2013.
Accounts receivable declined from 2011 to 2012 but then increased from 2012 to 2013 exceeding 2011 level.
Inventories declined from 2011 to 2012 but then slightly increased from 2012 to 2013.
Current assets declined from 2011 to 2012 but then increased from 2012 to 2013 exceeding 2011 level.
Net property, plant and equipment, net declined from 2011 to 2012 but then increased from 2012 to 2013 exceeding 2011 level.
Noncurrent assets declined from 2011 to 2012 but then increased from 2012 to 2013 not reaching 2011 level.
Total assets declined from 2011 to 2012 but then increased from 2012 to 2013 exceeding 2011 level.
"I'm very optimistic about the future as we look forward." The company posted fiscal fourth-
quarter earnings excluding items of 79 cents per share, down from 82 cents a share in the year-
earlier period.
Revenue increased to $20.7 billion from $20.21 billion a year ago. Analysts had expected
earnings excluding items of 77 cents a share on $20.55 billion in revenue, according to a
consensus estimate from Thomson Reuters.
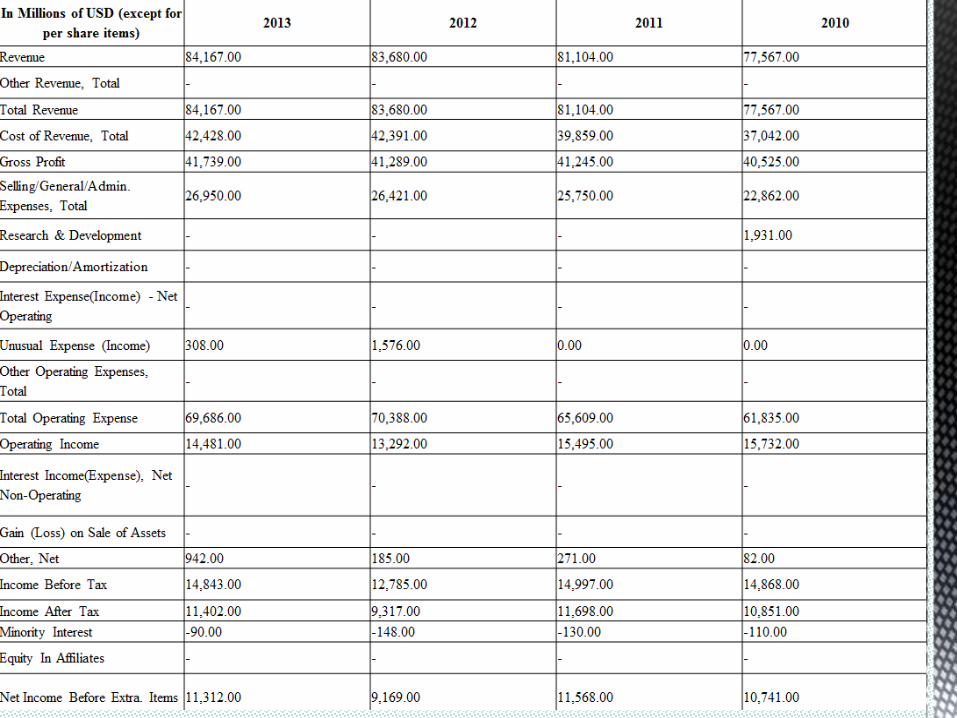
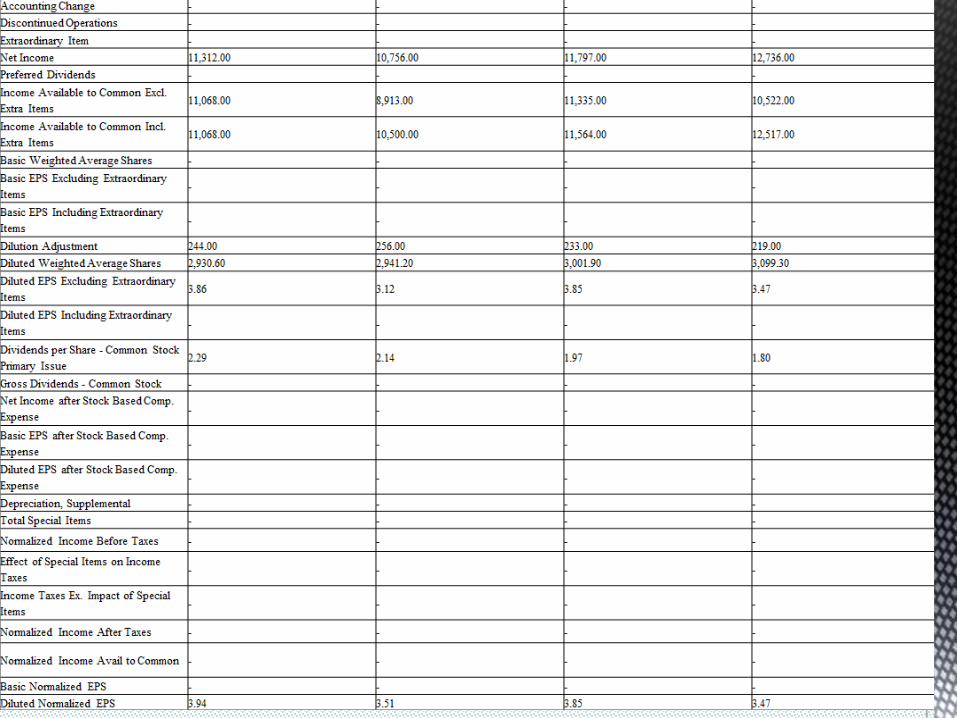
For the year, net income after paying preferred dividends rose 5 percent to $11.31 billion, or
$3.86 per share. That compares with net income of $10.76 billion, or $3.66 per share in the
previous year. Revenue rose 1 percent to $84.17 billion from $83.68 billion a year ago. Moeller
said. "We're expecting 3-4 percent" growth.