procurement value for money indicators guidance · procurement indicators procurement value for...
TRANSCRIPT

1
Procurement Indicators
Procurement value for money indicators guidance
1) Introduction
This document sets out the indicators to be collected for the Procurement function.
The guidance below starts by defining the scope of the function and goes on to
identify key questions which reflect the requirements of a modern, value for money
Procurement function that the indicators are aiming to help organisations explore. The
scope and key questions are included as background information as well as the
primary and secondary indicators
2) Scope
The scope includes the key activities performed by the procurement function across
the procure-to-pay process:
• Understanding the demand and business requirements for goods and services;
• Sourcing of the required goods and services from qualified suppliers at best value
and in accordance with the appropriate tendering regulations;
• Ensuring that contracts and service levels are agreed and clearly defined with
suppliers;
• End users are able to raise requisitions which result in approved purchase orders
transmitted to the supplier; and
• Supplier performance is managed against contractual standards and Service Level
Agreements.
In the way the procurement function is carried out the scope also includes:
• The degree to which the procurement strategy and objectives are aligned with
corporate objectives;
• Sustainability in relation to the procurement of goods and services;
• Ethical contracting and purchasing standards;
• Awareness and application of technology to support the procurement function in
achieving efficient and effective delivery;
• Appropriate procurement structures, policies and procedures in relation to the
organisation‟s procurement requirements; and
• Capability and skills of those involved in the procurement function
• The degree to which the procurement department assess their performance against
peers and other industries to seek continuous improvement and innovation to deliver
greater value
to the organisation.
2
3) Key questions
In order to help derive our VFM indicators for the Procurement function, we have
identified some key questions that reflect a modern, value for money Procurement
function which we hope the indicators will help to explore:
• Is the Procurement function / model used by the organisation cost effective and
appropriate?
• Does the Procurement effectively support the delivery of the organisation‟s strategic
objectives?
• Are Procurement processes operated in an efficient, timely and effective manner?
(which minimise risk and maximise impact)
• Does Procurement effectively understand the requirements of the demand and
business requirements for goods and services?
• Does Procurement have a good understanding of markets and effectively manage
suppliers?
• Is appropriate use made of technology to support the organisation‟s procurement
activity to achieve efficient and effective delivery?
• Is Procurement effectively supporting the organisation in achieving cost reduction?
• Is corporate social responsibility a serious consideration in the procurement of goods
and services including sustainability and ethical procurement?
• Are internal customers / end users satisfied with the services provided by
Procurement?
In relation to the indicators we are not seeking to be prescriptive about how the
procurement function is set up in terms of the structure or model the organisation
uses. We are concerned only that the organisation adopts the right practices to secure
the best possible outcomes.
Our view is that organisations should use the indicators to question whether their
current procurement arrangements provide best value for money and if not, how they
should change to achieve this whether this is through increased centralisation, greater
collaboration or other options such as shared services and outsourcing.
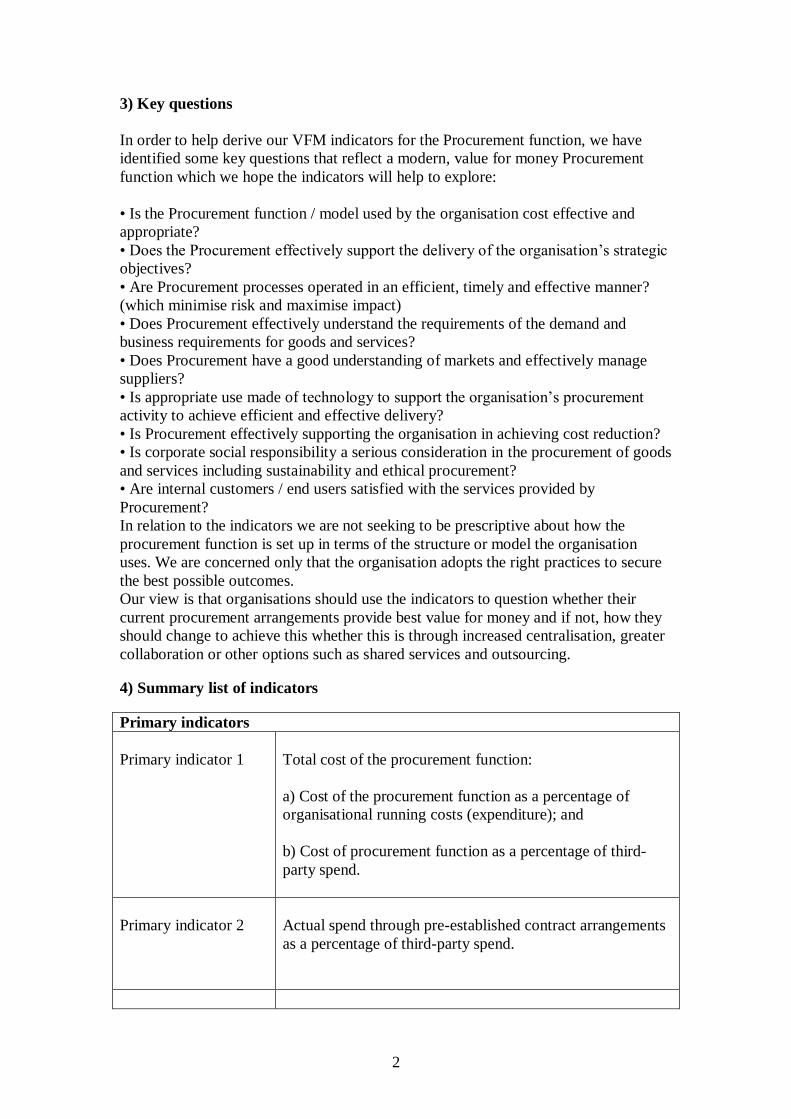
4) Summary list of indicators
Primary indicators
Primary indicator 1
Total cost of the procurement function:
a) Cost of the procurement function as a percentage of
organisational running costs (expenditure); and
b) Cost of procurement function as a percentage of third-
party spend.
Primary indicator 2
Actual spend through pre-established contract arrangements
as a percentage of third-party spend.

3
Primary indicator 3 Percentage of third-party spend which is actively managed
by procurement professionals.
Primary indicator 4 The percentage of third party spend channelled through
collaborative procurement arrangements with other
organisations or Professional Buying Organisations
Primary indicator 5
Average (weighted) savings achieved through procurement
for the 5 largest procurement projects delivered in the
previous financial year.
Primary indicator 6
Commissioner and user satisfaction index - a composite
indicator compiled from the responses to a set of statements
by commissioners and users.
Commissioner statements:
The Procurement function supports the overall
objectives of the organisation.
The Procurement function is proactive in sourcing
goods and supplies which represent best value.
The Procurement function provides appropriate
advice and support on major strategic procurement
projects.
The Procurement function is responsive to my ad hoc
needs.
The Procurement function provides value for money.
User statements:
There is a consistent and easy to follow process for
ordering goods and supplies.
The goods and supplies that we are given are of
appropriate quality.
Technology is used to make the process of ordering
and paying for goods easy and efficient.
The Procurement function is responsive when I need
help in sourcing or ordering goods and supplies.
The Procurement Function is helping staff to develop
their skills in relation to the procurement process.
Primary indicator 7
Management practice indicator – the number of practices
that have been adopted by the organisation out of a possible
total of 10:
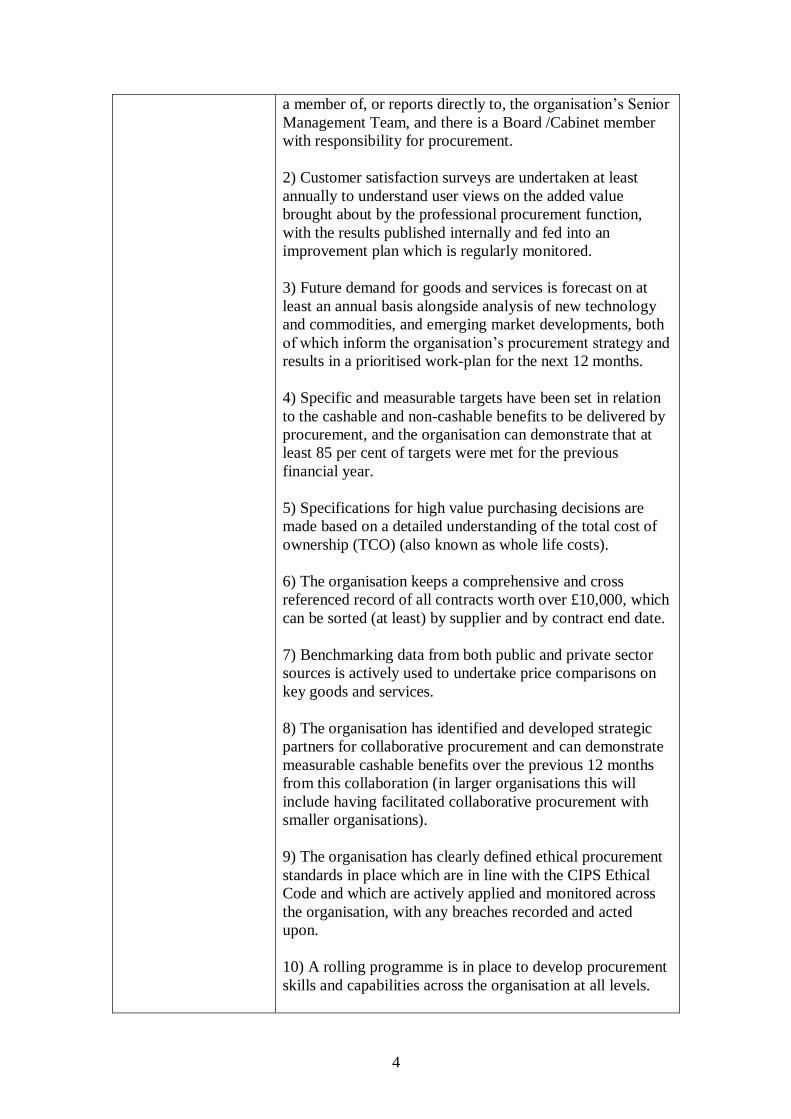
1) The individual with lead responsibility for procurement is
4
a member of, or reports directly to, the organisation‟s Senior
Management Team, and there is a Board /Cabinet member
with responsibility for procurement.
2) Customer satisfaction surveys are undertaken at least
annually to understand user views on the added value
brought about by the professional procurement function,
with the results published internally and fed into an
improvement plan which is regularly monitored.
3) Future demand for goods and services is forecast on at
least an annual basis alongside analysis of new technology
and commodities, and emerging market developments, both
of which inform the organisation‟s procurement strategy and
results in a prioritised work-plan for the next 12 months.
4) Specific and measurable targets have been set in relation
to the cashable and non-cashable benefits to be delivered by
procurement, and the organisation can demonstrate that at
least 85 per cent of targets were met for the previous
financial year.
5) Specifications for high value purchasing decisions are
made based on a detailed understanding of the total cost of
ownership (TCO) (also known as whole life costs).
6) The organisation keeps a comprehensive and cross
referenced record of all contracts worth over £10,000, which
can be sorted (at least) by supplier and by contract end date.
7) Benchmarking data from both public and private sector
sources is actively used to undertake price comparisons on
key goods and services.
8) The organisation has identified and developed strategic
partners for collaborative procurement and can demonstrate
measurable cashable benefits over the previous 12 months
from this collaboration (in larger organisations this will
include having facilitated collaborative procurement with
smaller organisations).
9) The organisation has clearly defined ethical procurement
standards in place which are in line with the CIPS Ethical
Code and which are actively applied and monitored across
the organisation, with any breaches recorded and acted
upon.
10) A rolling programme is in place to develop procurement
skills and capabilities across the organisation at all levels.

5
Secondary indicators
Secondary indicator 1
Professionally qualified procurement employees (FTEs) as a
percentage of total procurement employees (FTEs).
Secondary indicator 2
Average invoice value.
Secondary indicator 3
Number of the organisation‟s top 10 suppliers (by spend
value) who have a formal partnership / framework
agreement with the organisation.
Secondary indicator 4
The percentage of third-party spend that is channelled
directly through SMEs (Small and Medium sized
Enterprises).
Secondary indicator 5
a) Percentage of third party spend categorised, understood
and fully reported (to UNSPSC level two or equivalent) in
the current year Public Sector Procurement Expenditure
Survey (PSPES)
b) Percentage of third party spend subject to supplier
relationship management (SRM),
c) Percentage of third party spend managed via structured
category management.
.
Secondary indicator 6
The use of technology within procurement:
a) The percentage of total goods and services spend that is
sourced electronically;
and
b) The percentage of total goods and services spend
managed through e-Purchasing.

6
5) Detailed definitions for Primary indicators
Reference number
Primary indicator 1
Description
Total cost of the procurement function:
a) Cost of the procurement function as a percentage of
organisational running costs (expenditure); and
b) Cost of procurement function as a percentage of third-
party spend.
Rationale
This is a high-level indicator measuring the cost-
effectiveness of the organisation‟s procurement function
(whether managed centrally, devolved or a combination of
approaches).
In most circumstances organisations would aim to reduce
the costs of procurement relative to their spend over time.
However organisations should interpret their score against
this indicator with their results against measures of
effectiveness such as primary indicators 3 (percentage of
spend managed by procurement professionals), 4 (third-
party spend channelled through collaborative procurement
arrangements), 6 (the commissioner and user satisfaction
index) and 7 (the management practice indicator).
Definition
The indicator should be based on the latest financial year.
Total cost of the procurement function should include:
Employee costs including employers NI, pension and
recruitment costs
IT costs
Accommodation costs
Supplies / consumables
Outsourcing costs
Other costs
Where some or all procurement activity is devolved in the
organisation (for example where there is no centralised
procurement function, or where individuals work outside of
any centralised function and are based in service
departments) include the total cost of those staff who spend
more than 50 per cent of their time on strategic and / or

7
operational procurement activities.
Any payments made to third parties to conduct procurement
on the organisation‟s behalf should also be included in the
costs of procurement.
Part a) Organisational running costs (expenditure)
Organisational running costs (expenditure) are the costs for
delivering the primary responsibilities / remit of the
organisation. Pension cost adjustments as required under
FRS 17 should be excluded from organisational running
costs – in-year service costs should be included.
It should also exclude transfer payments, capital programme
spend, and programme spend grants, precepts and other
funds which simply flow through to another body, for
example grants made to voluntary organisations.
It should include payments made to any contractors for
services which are within the main remit of the organisation
(for example a refuse contract in a local authority.
Part b) Third-party spend
Total third-party spend is calculated based upon the total
value of invoices paid per annum, excluding VAT, to all
suppliers for the purchase of goods and services.
Third-party spend is defined as including:
Goods – tangible products such as stationery, which
are often also known as supplies
Services – provision of an intangible product such as
refuse collection, elderly home care, whether carried
out internally or externally
Works – including construction works
Utilities – energy costs
It excludes employee costs, non-cash expenditure (e.g.
depreciation), grants, trust payments and other non-
controllable payments to other government departmental
bodies but should include spending on agency staff, capital
expenditure and programme spend on commodities and
services (but in local authorities exclude spending on
agency/supply staff in schools).
Example
a) To calculate the cost of the procurement function as a
percentage of organisational running costs (expenditure)

8
Cost of the procurement function = £150,000
Organisational running costs = £20 million
The cost of the procurement function as a percentage of
organisational running costs is therefore 150,000 /
20,000,000 = 0.75 per cent
b) To calculate the cost of procurement function as a
percentage of third-party spend
Cost of the procurement function = £150,000
Third-party spend = £9 million
The cost of procurement function as a percentage of third-
party spend is therefore 150,000 / 9,000,000 = 1.67 per cent

9
Reference number
Primary indicator 2
Description
Actual spend through pre-established contract arrangements
as a percentage of third-party spend.
Rationale
This indicator assesses the level of non-contract spend
across the organisation and so provides an indication of the
level of influence and control exerted by procurement
professionals.
An efficient organisation that buys specific goods or
services regularly should establish pre-agreements so that
terms are clear, risks are mitigated and a degree of leverage
will be applied. Over time, organisations would therefore
seek to achieve and maintain a high percentage figure for
this indicator.
Definition
The indicator should be based on the latest financial year.
For the purpose of this indicator, pre-established contracts
are written agreements with third parties for the provision of
goods, services, works and utilities, including framework
agreements. This can include contracts established by the
organisation or by another organisation, for example through
nationally established framework agreements or
collaborative arrangements with other organisations.
„Pre-established‟ means that formal legal contracts for the
spend are in place before goods and services are ordered.
Contracts and their value should be identified through the
organisation‟s contracts database. The organisation should
calculate the actual total spend against each contract in the
financial year.
Total third-party spend is calculated based upon the total
value of invoices paid per annum, excluding VAT, to all
suppliers for the purchase of goods and services.
Third-party spend is defined as including:
• Goods – tangible products such as stationery, which are
often also known as supplies
• Services – provision of an intangible product such as
refuse

10
collection, elderly home care, whether carried out internally
or
externally
• Works – including construction works
• Utilities – energy costs
It excludes employee costs, grants, trust payments and other
non-controllable payments to other government
departmental bodies but should include spending on agency
staff (but in local authorities exclude spending on
agency/supply staff in schools)
Example
Spend against pre-established contract arrangements = £15
million
Total third-party spend = £200 million
Spend committed against pre-established contract
arrangements as a percentage of third-party spend is
therefore (15,000,000 / 200,000,000) x 100 per cent = 7.5
per cent

11
Reference number
Primary indicator 3
Description
Percentage of third-party spend which is actively managed
by procurement professionals.
Rationale
This indicator examines the extent to which procurement
spend is managed by procurement professionals either
working in a central procurement function or who work in
business units (for example qualified procurement staff
embedded in IT). Most organisations would aim to achieve a
high percentage for this indicator and to increase it over
time. Organisations should interpret their achievement
against this indicator alongside primary indicator 5 (average
savings achieved through procurement).
Definition
The indicator should be based on the latest financial year.
The organisation should assess the amount of third-party
spend which has been actively controlled by procurement
professionals operating either within a central procurement
function or procurement professionals who are devolved
into departments / services.
Total third-party spend is calculated based upon the total
value of invoices paid per annum, excluding VAT, to all
suppliers for the purchase of goods and services.
Procurement professionals should be consistent with those
staff included in Primary Indicator 1.
.
“Procurment professionals are full-time equivalent staff
holding a
qualification recognised by the Chartered Institute of
Purchasing and Supply (CIPS) which includes:
• The Government Procurement Service Certificate of
Competence in Purchasing and Supply
• The Certificate and Advanced Certificate in Purchasing
and Supply
• The CIPS Graduate Diploma (Foundation and Professional
levels)
• NVQs and SVQs in Procurement

12
Other appropriate qualifications may include:
• MSc Procurement, Construction qualification which
requires procurement expertise, National standards for
Commissioning, Procurement and Contracting.
• staff who have 5 years or more experience in running
procurement processes
„Active control‟ – this is defined as spend where the
procurement
professionals are actively supporting the sourcing process,
for example providing guidance would not be deemed as
„active support‟, they should be an active participant in
defining and running the sourcing process.
Third-party spend is defined as including:
• Goods – tangible products such as stationery, which are
often also known as supplies
• Services – provision of an intangible product such as
refuse
collection, elderly home care, whether carried out internally
or
externally
• Works – including construction works
• Utilities – energy costs
It excludes employee costs, grants, trust payments and other
non-controllable payments to other government
departmental bodies but should include spending on agency
staff (but in local authorities exclude spending on
agency/supply staff in schools)
Example
Third-party spend which is actively managed by
procurement
professionals = £150 million
Total non pay spend = £260 million
Percentage of third-party spend which is actively managed
by
procurement professionals is therefore (150,000,000 /
260,000,000) x 100 per cent = 57.6 per cent

13
Reference number Primary indicator 4
Description The percentage of third party spend channelled through
collaborative procurement arrangements with other
organisations or Professional Buying Organisations
Rationale This indicator assesses the effectiveness of the organisation
in sourcing goods and services through collaborative
procurement channels such as local or national consortia
arrangements, cross Government bodies or shared services
centres.
The Government‟s Efficiency review encourages
government bodies to work collaboratively and deliver on
joint procurement projects to deliver greater efficiencies.
In most circumstances organisations would aim to increase
the percentage of spend made through collaborative
arrangements in order to secure more competitive deals.
Definition This indicator should be based on the latest financial year.
Total third-party spend is calculated based upon the total
value of invoices paid per annum, excluding VAT, to all
suppliers for the purchase of goods and services.
Third-party spend is defined as including:
• Goods – tangible products such as stationery, which are
often also known as supplies
• Services – provision of an intangible product such as
refuse
collection, elderly home care, whether carried out internally
or
externally
• Works – including construction works
• Utilities – energy costs
It excludes employee costs, grants, trust payments and other
non-controllable payments to other government
departmental bodies but should include spending on agency
staff (but in local authorities exclude spending on
agency/supply staff in schools)
Collaboration is defined as the use of joint contracts and
framework agreements (for example consortium contracts
including catalogues) and joint projects with other public
sector bodies. Use of national government framework

14
arrangements or call-off contracts is included. These include
buying solutions frameworks.
To calculate this indicator, and divide by total third party
spend and multiply by 100.
Example
Total value of contracts and orders placed through a
collaborative arrangement = £1.5 million
Total third-party spend = £35 million
The percentage of third party spend channelled through
collaborative procurement arrangements with other
organisations or Professional Buying Organisations is
therefore (1,500,000 / 35,000,000) x 100 = 4.28 per cent

15
Reference number
Primary indicator 5
Description
Average (weighted) savings achieved through procurement
for the 5 largest procurement projects delivered in the
previous financial year.
Rationale
This examines the effectiveness of procurement in achieving
savings.
The Government‟s Efficiency Review: Releasing Resources
for the Front line (2004) focused on efficiencies that can be
achieved in back office activities with the aim of redirecting
resources. Procurement is a key area targeted to deliver
these savings. Organisations would therefore seek to
increase this average over time. Organisations should
interpret their achievement against this indicator alongside
primary indicators 1 (cost of procurement function) and 3
(percentage of spend managed by procurement
professionals).
Definition
This indicator should be based on figures for the latest
financial year.
The indicator should be based on the organisation‟s 5 largest
procurement projects in the previous financial year.
A procurement project is where the organisation made a
formal approach to the market to tender for specific goods /
services.
To calculate the indicator, for each project identify the
annual spend on the relevant goods / services prior to re-
tendering and calculate a total across the five projects.
Identify the annual spend based on the new contract for each
project and calculate a total across the five projects.
Calculate the saving (i.e. difference between new and old
contract) as a percentage of the annual spend prior to re-
tendering using the total figures.
Example:
Project 1:
Annual spend on the relevant goods/services prior to re-
tendering = £20 million
Annual spend based on the new contract = £16 million

16
Project 2:
Annual spend on the relevant goods/services prior to re-
tendering = £15m
Annual spend based on the new contract = £14.5 million
Project 3:
Annual spend on the relevant goods/services prior to re-
tendering = £550,000
Annual spend based on the new contract = £475,000
Project 4:
Annual spend on the relevant goods/services prior to re-
tendering = £357,000
Annual spend based on the new contract = £335,000
Project 5:
Annual spend on the relevant goods/services prior to re-
tendering = £225,000
Annual spend based on the new contract = £210,000
Total spend prior to re-tendering across all 5 projects =
£36,132,000
Total spend against new contracts across all 5 projects =
£31,520,000
Saving = £4, 612, 000
Percentage saving is therefore 4,612,000 / 36,132,000 X 100
per cent = 12.8 per cent

17
Reference number
Primary indicator 6
Description
Commissioner and user satisfaction index - a composite
indicator compiled from the responses to a set of statements
by commissioners and users.
Rationale
This indicator examines the effectiveness of the procurement
function by assessing the perceptions of commissioners and
users of procurement.
Over time, organisations should seek to increase the
proportion of commissioners and users agreeing with the
statements.
(Organisations may wish to incorporate these statements
into existing surveys of users and commissioners.)
Definition
See main guidance document for details on the approach to
collecting data for this indicator.
Commissioners are defined as senior management, for
example, senior decision-makers within the organisation.
Users are internal staff that use the service for example,
frontline managers and staff.
The commissioner and user statements are as follows:
Commissioner statements:
The Procurement function supports the overall
objectives of the organisation.
The Procurement function is proactive in sourcing
goods and supplies which represent best value.
The Procurement function provides appropriate
advice and support on major strategic procurement
projects.
The Procurement function is responsive to my ad hoc
needs.
The Procurement function provides value for money.
User statements:
There is a consistent and easy to follow process for

18
ordering goods and supplies.
The goods and supplies that we are given are of
appropriate quality.
Technology is used to make the process of ordering
and paying for goods easy and efficient.
The Procurement function is responsive when I need
help in sourcing or ordering goods and supplies.
The Procurement function is helping staff to develop
their skills in relation to the procurement process.

19
Reference number
Primary indicator 7
Description
Management practice indicator – the number of practices
that have been adopted by the organisation out of a possible
total of 10.
Rationale
This indicator is to assess the extent to which the
Procurement Function has adopted a set of key management
practices. This provides an indication of whether it is well-
run, modernised and a professionally mature function.
It is not anticipated that most organisations will have
adopted all of the practices listed when first measuring
themselves against this indicator set. However organisations
should expect that the number of practices that they have
adopted would increase over time.
(The list of practices will be updated, if appropriate, in
future revisions of the indicator set).
Definition
The management practices indicator consists of 10
statements of management practice. The respondent should
assess whether their organisation follows each practice as set
out below:
1) The individual with lead responsibility for procurement is
a member of, or reports directly to, the organisation‟s Senior
Management Team, and there is a Board / Cabinet member
with responsibility for procurement.
2) Customer satisfaction surveys are undertaken at least
annually to understand user views on the added value
brought about by the professional procurement function,
with the results published internally and fed into an
improvement plan which is regularly monitored.
3) Future demand for goods and services is forecast on at
least an annual basis alongside analysis of new technology
and commodities, and emerging market developments, both
of which inform the organisation‟s procurement strategy and
results in a prioritised work plan for the next 12 months.
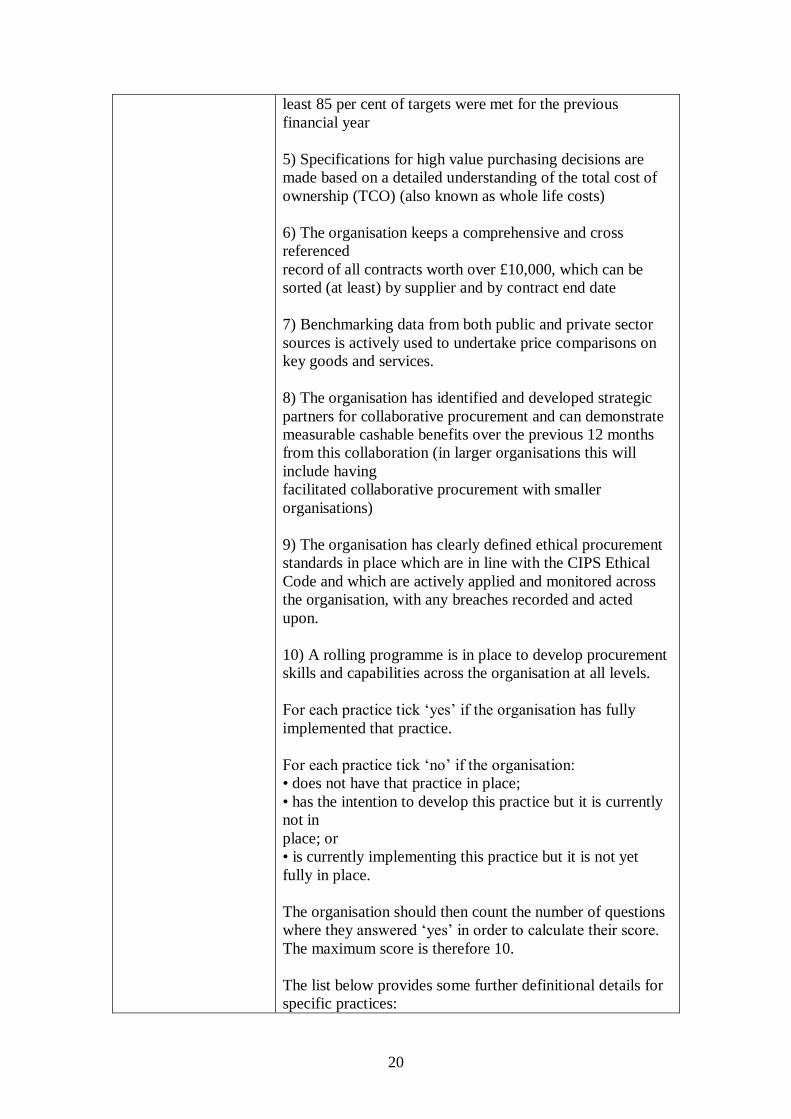
4) Specific and measurable targets have been set in relation
to the cashable and non-cashable benefits to be delivered by
procurement, and the organisation can demonstrate that at
20
least 85 per cent of targets were met for the previous
financial year
5) Specifications for high value purchasing decisions are
made based on a detailed understanding of the total cost of
ownership (TCO) (also known as whole life costs)
6) The organisation keeps a comprehensive and cross
referenced
record of all contracts worth over £10,000, which can be
sorted (at least) by supplier and by contract end date
7) Benchmarking data from both public and private sector
sources is actively used to undertake price comparisons on
key goods and services.
8) The organisation has identified and developed strategic
partners for collaborative procurement and can demonstrate
measurable cashable benefits over the previous 12 months
from this collaboration (in larger organisations this will
include having
facilitated collaborative procurement with smaller
organisations)
9) The organisation has clearly defined ethical procurement
standards in place which are in line with the CIPS Ethical
Code and which are actively applied and monitored across
the organisation, with any breaches recorded and acted
upon.
10) A rolling programme is in place to develop procurement
skills and capabilities across the organisation at all levels.
For each practice tick „yes‟ if the organisation has fully
implemented that practice.
For each practice tick „no‟ if the organisation:
• does not have that practice in place;
• has the intention to develop this practice but it is currently
not in
place; or
• is currently implementing this practice but it is not yet
fully in place.
The organisation should then count the number of questions
where they answered „yes‟ in order to calculate their score.
The maximum score is therefore 10.
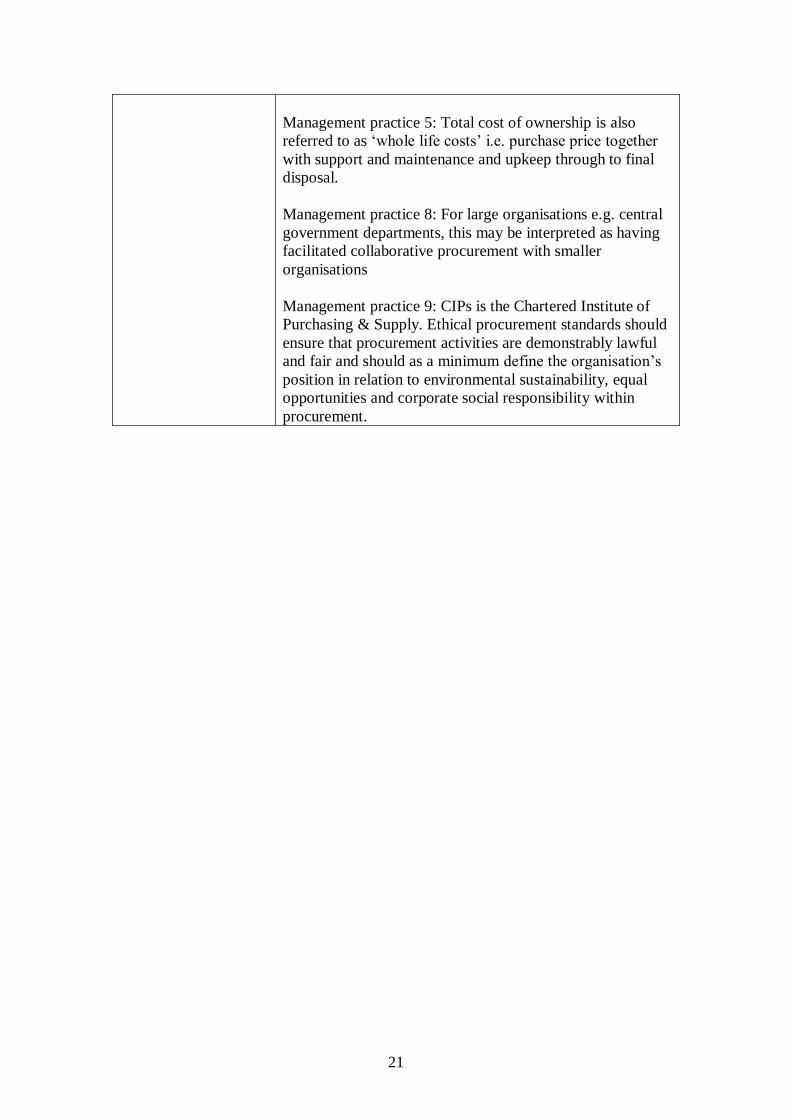
The list below provides some further definitional details for
specific practices:
21
Management practice 5: Total cost of ownership is also
referred to as „whole life costs‟ i.e. purchase price together
with support and maintenance and upkeep through to final
disposal.
Management practice 8: For large organisations e.g. central
government departments, this may be interpreted as having
facilitated collaborative procurement with smaller
organisations
Management practice 9: CIPs is the Chartered Institute of
Purchasing & Supply. Ethical procurement standards should
ensure that procurement activities are demonstrably lawful
and fair and should as a minimum define the organisation‟s
position in relation to environmental sustainability, equal
opportunities and corporate social responsibility within
procurement.

22
6) Detailed definitions for Secondary indicators
Reference number
Secondary indicator 1
Description
Professionally qualified procurement employees (FTEs) as a
percentage of total procurement employees (FTEs)
Rationale
This indicator measures the proportion of procurement
personnel (both within the procurement function and
embedded in business units) who have procurement
qualifications. In most cases organisations would aim to
secure a period-on-period increase in respect of this
indicator.
Definition
This indicator should be based on the latest financial year
Procurement professionals should be consistent with those
staff included in Primary Indicator 1.
.
“Procurement professionals are full-time equivalent staff
holding a
qualification recognised by the Chartered Institute of
Purchasing and Supply (CIPS) which includes:
• The Government Procurement Service Certificate of
Competence in Purchasing and Supply
• The Certificate and Advanced Certificate in Purchasing
and Supply
• The CIPS Graduate Diploma (Foundation and Professional
levels)
• NVQs and SVQs in Procurement
Other appropriate qualifications may include:
• MSc Procurement, Construction qualification which
requires procurement expertise, National standards for
Commissioning, Procurement and Contracting.
• staff who have 5 years or more experience in running
procurement processes
Total Procurement employees = total full-time equivalent
23
(FTE) staff (including part-time staff who should be
calculated on the basis of the proportion of time of a full-
time equivalent that they work).
Where some or all procurement activity is devolved in the
organisation (for example where there is no centralised
procurement function, or where individuals work outside of
any centralised function and are based in service
departments) include those staff who spend more than 50
per cent of their time on strategic and / or operational
procurement activities.
For staff leaving / joining during the 12 month period,
calculate on a fulltime equivalent basis the proportion of the
year that they worked. For example if someone left 3
months into the year they would be a 0.25 FTE, or if they
served 6 months it would be 0.5 FTE etc. The same
principle applies for anyone who joined, it should be based
on the proportion of the year that they worked translated into
an FTE figure.
Your calculation should include any temporary / agency
staff who are brought in for periods of over 10 per cent of
the working days available in the 12 month period
Worked example
Number of Professionally Qualified Procurement employees
= 5.5 FTEs
Total procurement employees = 15.3 FTEs
The percentage of professionally qualified procurement
employees is therefore (5.5 / 15.3) x 100 per cent = 35.95
per cent

24
Reference number
Secondary indicator 2
Description
Average invoice value.
Rationale
In most circumstances organisations should, wherever
possible, ensure that invoices for their purchases are
consolidated in order to reduce transaction costs.
Organisations should therefore expect to see an increase in
the average value of their invoices over time.
Definition
This indicator should be based on figures for the latest
financial year.
To calculate this indicator divide the total spend on goods
and services by the total number of invoices processed.
Total spend is calculated based upon the total value of
invoices paid per annum, excluding VAT, to all suppliers for
the purchase of goods, services, works and utilities.
The total number of invoices per annum can generally be
obtained through accounts payable, finance system or any
eProcurement tools or spend analysis carried out by your
organisation.
Invoices refer to transactions and can be either paper or
electronic.
Worked example:
Total spend on goods and services = £22 million
Total number of invoices = 12,000
Average invoice value is therefore 22,000,000 / 12000 =
£1,833

25
Reference number
Secondary indicator 3
Description
Number of organisation‟s top 10 suppliers (by spend value)
who have a formal partnership / framework agreement with
the organisation
Rationale
This indicator examines the extent to which the organisation
has formal agreements with its suppliers in order to manage
their relationship with them and to better control its
expenditure. In most cases high-performing organisations
would expect the number of such agreements to increase
over time.
The indicator measures the proportion of the department‟s
spending with key suppliers which are managed within a
formal partnership.
Definition
This indicator should be based on the latest financial year.
To calculate this indicator the organisation should rank their
suppliers according to total spend on goods, services works
and utilities (excluding VAT) in the latest financial year.
For the top 10 suppliers, identify those suppliers where the
organisation had a formal framework/partnership agreement
in place with the supplier.
Example:
Number of the organisation‟s top 10 suppliers who have a
formal
partnership/framework agreement with the organisation = 6

26
Reference number
Secondary indicator 4
Description
The percentage of third-party spend channelled through
SMEs (small and medium sized enterprises)
Rationale
This indicator examines the effectiveness of the procurement
function in relation to its corporate social responsibility
objectives. In most circumstances, organisations should
expect the percentage of spend with SMEs to increase.
However organisations which are seeking to increase the
aggregation of their purchasing (for example where there is
currently little central procurement leading to uncompetitive
prices being paid for goods and services) the percentage may
decrease.
High-performing organisations will strike a balance between
their achievement against this indicator and against
secondary indicators 6 (a) and (b) which examine the extent
to which organisations have aggregated their purchasing
arrangements.
Note:
(a) It is recognised that the importance and relevance of this
indicator may be greater in some sectors than others, for
example in local government it is often seen as particularly
important to corporate objectives. The indicator needs to be
set therefore in the context of what the organisation is
seeking to achieve through procurement. It is not intended
that a high value is pursued at the expense of achieving
value for money in procurement decisions.
(b) It should be noted that SME‟s do not necessarily imply
they are local to the area served by the organisation.
Definition
This indicator should be based on the latest financial year.
Total spend on goods and services is calculated based upon
the total value of invoices paid per annum, excluding VAT,
to all suppliers for the purchase of goods and services.
Third-party spend is defined as including:
• Goods – tangible products such as stationery, which are
often also known as supplies
• Services – provision of an intangible product such as
refuse

27
collection, elderly home care, whether carried out internally
or
externally
• Works – including construction works
• Utilities – energy costs
It excludes employee costs, grants, trust payments and other
non-controllable payments to other government
departmental bodies but should include spending on agency
staff (but in local authorities exclude spending on
agency/supply staff in schools)
For the purposes of this indicator small and medium sized
enterprises (SMEs) are those that have less than 250
employees.
This is in line with the Department of Trade and Industry
(DTI) who define a small enterprise as one with 0 – 49
employees, and a medium-sized enterprise as one with 50 –
249 employees.
To calculate this indicator, total the value of contracts and
orders placed directly with SMEs and divide by total third-
party spend, and multiply by 100.
Exclude any contracts and orders placed with suppliers
where the contract specifies that the supply chain includes a
proportion of SMEs.
Example:
Amount of third-party spend channelled through SMEs =
£20 million
Total third-party spend = £35 million
The percentage of third-party spend channelled through
SMEs is therefore 20,000,000 / 35,000,000 = 57.1 per cent

28
Reference number
Secondary indicator 5
Description
a) Percentage of third party spend categorised, understood
and fully reported (to UNSPSC level two or equivalent) in
the current year Public Sector Procurement Expenditure
Survey (PSPES)
b) Percentage of third party spend subject to supplier
relationship management (SRM),
c) Percentage of third party spend managed via structured
category management.
Rationale
This indicator provides a measure of the extent to which
there is an effective in-house intelligent client function that
optimises the value of external resources and expertise.
Wherever feasible the procurement function should seek to
maximise its use of proactive relationship management in
order to achieve this.
Organisations should use structured category management
of their third-party spend to maximise the value obtained. In
most circumstances departments would seek to increase the
proportion of third-party spend subject to category
management.
Definition
Total third-party spend is calculated based upon the total
value of invoices paid per annum, excluding VAT, to all
suppliers for the purchase of goods and services.
Third party spend is defined as including:
Goods – tangible products such as stationery, which are
often also known as supplies
Services – provision of an intangible product such as
refuse collection, elderly home care, whether carried out
internally or externally
Works – including construction works
Utilities – energy costs
It should exclude employee costs, non-cash expenditure (e.g.
depreciation), grants, trust payments and other non
controllable payments to other government departmental
bodies but should include spending on agency staff, capital
expenditure and programme spend on commodities and
services (but in local authorities exclude spending on
agency/supply staff in schools).

29
Part a) Percentage of third party spend categorised,
understood and fully reported (to UNSPSC Level 2 or
equivalent) in the current year PSPES return.
PSPES
Public Sector Procurement Expenditure Survey see
http://www.ogc.gov.uk/procurement_public_spending.asp
for details
Part b) Percentage of third party spend subject to
supplier relationship management (SRM).
Supplier relationship management (SRM)
Supplier Relationship Management (including analysis) is
the proactive management of an ongoing business
relationship to secure a competitive advantage for your own
organisation. The focus is on overall relationships between
the supplier and the buying organisation rather than a focus
on a specific contract. Its purpose is to encourage purchasing
and business management to develop a structured
understanding of the nature of current relationships that exist
within and between your organisation and the suppliers.
The objectives for SRM are likely to include:
Reduction in costs
Service improvement
Solution development
Flexibility and mutual benefit
Part c) Percentage third party spend via managed
structured category management.
This is defined as a structured approach to procuring
routinely required goods and services. Spend is assigned to a
hierarchy of items and an active process of managing
categories of expenditure is put in place that includes
understanding stakeholder requirements, developing a
sourcing strategy, development of a specification, supplier
selection and contract management. A standard set of
categories have been developed across government
including professional services, facilities, office solutions,
ICT, travel, energy and vehicles.

30
Reference number
Secondary indicator 6
Description
The use of technology within procurement:
a) The percentage of total third-party spend that is sourced
electronically
b) The percentage of total third-party spend managed
through ePurchasing
Rationale
This indicator examines the use of technology to support
efficiency in the procurement of goods and services. In most
circumstances organisations would expect to increase these
percentages over time.
Definition
Both parts of this indicator should be based on the latest
financial year.
Third-party spend is defined as including:
• Goods – tangible products such as stationery, which are
often also known as supplies
• Services – provision of an intangible product such as
refuse
collection, elderly home care, whether carried out internally
or
externally
• Works – including construction works
• Utilities – energy costs
It excludes employee costs, grants, trust payments and other
non-controllable payments to other government
departmental bodies but should include spending on agency
staff (but in local authorities exclude spending on
agency/supply staff in schools)
Part a: eSourcing
Total spend is calculated based upon the total value of
invoices paid per annum, excluding VAT, to all suppliers for
the purchase of goods, services, works and utilities.
The definition of eSourcing is taken from OGC‟s
eProcurement Guidance – “the Blue Frogs”.
Electronic sourcing (eSourcing) is the use of internet
technology to establish, manage and monitor contracts: It
includes:

31
• eSpend analysis – this tool assists with the collation of
information, removal of duplication in data and the initial
grouping of the goods or services bought;
• eTendering (which may include electronic reverse auctions
(eAuctions) and collaborative e-auctions) - tenders that are
managed on-line i.e. - invited, received and evaluated
electronically
• eEvaluation - An automated process of tender evaluation
against pre-agreed criteria. eEvaluation allows evaluation
panels to streamline processes for:
o Developing and structuring assessment criteria
o Conducting tender evaluation, and
o Comparing tender responses.
• eRFQs – electronic requests for quotations/evaluations
• eCollaboration - This tool is provided via an extranet (a
shared working environment) to enable geographically-
dispersed groups to discuss and document-share during any
part of the tendering process.
• eContract Management - This is an online tool that helps to
establish, manage and monitor contracts including collating
supplier bid histories including the value and number of
contracts awarded.
The tool will notify buyers (via email) when contracts are
due for
renewal and collates supplier performance information
against contractually agreed criteria.
To calculate this indicator, identify the value of those
contracts that have been placed further to the use of
eSourcing and divide this figure by the total spend on goods
and services and multiply by 100 to give the percentage.
To qualify for inclusion contracts must have been placed
using eSourcing in at least one key activity within the
preparatory stage which would include:
• Identifying and researching potential suppliers
• Advertising requirements
• Generating and receiving pre-qualification questionnaires
• Creating an Invitation to Tender (ITT) and Invitation to
Negotiate (ITN) and in at least one key activity in the
evaluation and negotiation stage which would include:
• Receiving responses, including tenders
• Evaluating tenders

32
• Undertaking negotiations
• Issuing contract award
Exclude any contracts which are have only used eSourcing
at the contract management stage (eContract Management)
or in just the preparatory stage or just the evaluation and
negotiation stage.
Worked example:
Value of contracts placed using e-sourcing = £2.5 million
Total spend on goods and services = £12 million
The percentage of total third-party spend that is sourced
electronically is (2,500,000 / 12,000,000) x 100 per cent =
20.83 per cent
Part b: ePurchasing
An IT system needs to process both purchase orders and
invoices electronically to be included here.
Total spend is calculated based upon the total value of
invoices paid per annum, excluding VAT, to all suppliers for
the purchase of goods, services, works and utilities.
The definition of ePurchasing is taken from OGC‟s
eProcurement
Guidance – “the Blue Frogs”.
ePurchasing tools can help procurement professionals and
end users achieve more efficient processes and more
accurate order details. The two aims of (a) maximising
control and (b) process efficiency are the function of
ePurchasing tools such as purchase-to-pay systems,
purchasing cards and electronic invoicing solutions.
Purchasing cards including the Government Procurement
card -
Purchasing cards (P-cards) are similar in principle to charge
cards used by consumers (for example suppliers are paid
within five days; the buyer is billed monthly in a
consolidated invoice), but with extra features which make
them more suitable for business-to-business purchasing.
eOrdering – electronic ordering of goods and services.
Purchase-to-pay tools - software and systems which allow
online trading and transactions between buyer and supplier.

33
They include:
• Buy-side systems, designed to streamline the internal
workflow
associated with procurement
• Marketplaces hosted on the internet where many buyers
and
suppliers can trade online
• Sell-side solutions, or suppliers‟ own web shops.
eInvoicing - Electronic invoicing is the transmission and
storage of invoices, without the delivery of paper
documents, by electronic means.
To calculate this indicator, identify the value of those goods
and services that have been ordered and paid for through
ePurchasing and divide this figure by the total spend on
goods and services and multiply by 100 to give the
percentage.
Use of self-billing an arrangement whereby the customer
determines the value of goods or services supplied, raises
the supplier's invoice and forwards a copy to the supplier,
with, or separately from, the payment (It may be a paper-
based or an electronic process) is not included in this
definition of ePurchasing.
Worked example:
Value of goods and services ordered and paid for through
ePurchasing solutions = £7.5 million
Total spend on goods and services = £22 million
The percentage of total third-party spend managed through
ePurchasing is therefore (7,500,000 / 22,000,000) x 100 per
cent = 34.09 per cent