product analysis and thermodynamic simulations from the pyrolysis of several biomass feedstocks
TRANSCRIPT
Product Analysis and Thermodynamic Simulations from thePyrolysis of Several Biomass Feedstocks
Jieling Zhang,† Hossein Toghiani,*,† Dinesh Mohan,*,‡,§ Charles U. Pittman, Jr.,‡ andRebecca K. Toghiani†
DaVe C. Swalm School of Chemical Engineering, Mississippi State UniVersity, Mississippi State,Mississippi 39762, Department of Chemistry, Mississippi State UniVersity, Post Office Box 9573,
Mississippi State, Mississippi 39762, and EnVironmental Chemistry DiVision, Industrial ToxicologyResearch Centre, Post Office Box 80, Mahatma Gandhi Marg, Lucknow 226001, India
ReceiVed December 28, 2006. ReVised Manuscript ReceiVed March 21, 2007
The pyrolysis of southern pine, red oak, and sweet gum sawdust is reported. Pyrolysis experimentswere conducted under either a helium or nitrogen atmosphere at∼371-871 °C, to determine the balancebetween liquid and gas products. Gas- and liquid-phase pyrolysis products were identified using gaschromatography (GC) and GC/mass spectrometry (MS). A total of 109 liquid and 40 gas compounds wereidentified. A total of 59 chemical compounds (35 liquids and 24 gaseous products) were quantitativelydetermined. The influence of the gas-phase residence time and biomass feed particle size were studied.The gas residence time determined the extent of secondary reactions. Very short residence times enhancedliquid production versus gas production. Particle sizes (d < 105µm, 105µm < d < 149µm, 149µm < d <297 µm, andd > 297 µm) did not have a pronounced effect on either the yield or product distributions,indicating that heat-transfer limitations within the particles were negligible. The pyrolysis of pine, red oak,and sweet gum sawdust yielded similar product distributions. Simulations were conducted using the ASPEN/SP software package based on Gibbs energy minimization. At high temperatures, dominant species werehydrogen and carbon monoxide, while at lower temperatures, methane, carbon dioxide, and water were thepredominant species. Above 871°C, further increases in the temperature did not affect the product distribution.Lower gasification temperatures and higher steam/carbon ratios resulted in higher hydrogen and carbon monoxideproduction.
1. Introduction
The need for resource conservation and renewable fuels haspromoted efforts to convert biomass to liquid fuels, gases, andspecific chemicals since the oil crisis in the mid-1970s.1,2 Oilis a nonrenewable resource, and the United States is heavilyreliant on foreign oil sources. These are excellent incentivesfor developing renewable energy sources. The accelerated rateof growth of energy consumption in Asia, particularly Chinaand India, raises this incentive for all countries. In addition,fossil fuel combustion adds carbon dioxide to the atmosphere,thought to contribute to global warning. Conversely, the use ofbiomass is more CO2-neutral. Furthermore, biomass representsabout 80% of energy resources in countries such as India orsubtropical Africa (38% on a worldwide scale).3 Biological andthermochemical conversions are now recognized as the mostefficient ways to utilize biomass for fuels.
Biomass fast pyrolysis is a promising route to liquid fuels.1,4-8
Pyrolysis of biomass in an inert atmosphere produces gaseousproducts (CO2, H2, CO, CH4, C2H2, C2H4, C6H6, etc.),liquids (tars, high-molecular hydrocarbons, and water), and solidchar. The variation of the heating rate and temperature modifiesthe distribution of gases, liquids, and chars obtained. Fastpyrolysis to maximize biocrude liquid yields requires very highheating rates (>100 °C/min), elimination of heat-transferlimitations through the use of finely ground biomass (<1 mm),temperatures from 425 to 500°C, and rapid vapor/aerosolcondensation.1,5,8Maximum pyrolysis oil yields occur from 425to 557°C.5,9-12
* To whom correspondence should be addressed. E-mail: [email protected] (H.T.); [email protected] (D.M.).
† Dave C. Swalm School of Chemical Engineering, Mississippi StateUniversity.
‡ Department of Chemistry, Mississippi State University.§ Industrial Toxicology Research Centre.(1) Mohan, D.; Pittman, C. U.; Steele, P. Pyrolysis of wood/biomasss
A critical review.Energy Fuels2006, 20, 848-889.(2) Tsai, W. T.; Lee, M. K.; Chang, Y. M. Fast pyrolysis of rice straw,
sugarcane bagasse and coconut shell in an induction-heating reactor.J. Anal.Appl. Pyrolysis2006, 76, 230-237.
(3) Guehenneux, G.; Baussand, P.; Brothier, M.; Poletiko, C.; Boissonnet,G. Energy production from biomass pyrolysis: A new coefficient ofpyrolytic valorization.Fuel 2005, 84, 733-739.
(4) Huber, G. W.; Iborra, S.; Corma, A. Synthesis of transportation fuelsfrom biomass: Chemistry, catalysts, and engineering.Chem. ReV. 2006,106, 4044-4098.
(5) Bridgwater, A. V. Renewable fuels and chemicals by thermalprocessing of biomass.Chem. Eng. J.2003, 91, 87-102.
(6) Bridgwater, A. V.; Czernik, S.; Piskorz, J.An OVerView of FastPyrolysis; Blackwell Science: London, U.K., 2001; Vol. 2, pp 977-997.
(7) Bridgwater, A. V.; Meier, D.; Radlein, D. An overview of fastpyrolysis of biomass.Org. Geochem.1999, 30, 1479-1493.
(8) Bridgwater, A. V.; Peacock, G. V. C. Fast pyrolysis process forbiomass.Renewable Sustainable Energy ReV. 2000, 4, 1-73.
(9) Butt, D. A. E. Formation of phenols from the low-temperature fastpyrolysis of Radiata pine (Pinus radiata). Part 1. Influence of molecularoxygen.J. Anal Appl. Pyrolysis2006, 76, 38-47.
(10) Piskorz, J.; Majerski, P.; Radlein, D.; Scott, D. S.; Bridgwater, A.V. Fast pyrolysis of sweet sorghum and sweet sorghum bagasse.J. Anal.Appl. Pyrolysis1998, 46, 15-29.
(11) Murwanashyaka, J. N.; Pakdel, H.; Roy, C. Separation of syringolfrom birch wood-derived vacuum pyrolysis oil.Sep. Purif. Technol.2001,24, 155-165.
2373Energy & Fuels2007,21, 2373-2385
10.1021/ef0606557 CCC: $37.00 © 2007 American Chemical SocietyPublished on Web 05/25/2007
Wood thermal decomposition at 425-557 °C5,9,10 in theabsence of oxygen causes extensive depolymerization/frag-mentation of the macromolecular structures of the wood.Primary products may further crack to yield lower molecular-weight products. Cross-linking via condensation reactionsand water loss results in char formation.13 Very high heat-transfer rates reduce char formation because volatilization israpid, minimizing second-order polymerization rates.14 Longervapor residence times at pyrolysis temperatures permit moresecondary vapor-phase cracking to gases, water, formic andacetic acids, and other low-molecular-weight products.9 There-fore, rapid vapor quenching minimizes the extent of cracking.
Fast pyrolysis-derived bio-oil is used as an energy sourceand a feedstock for chemical production.15-22 Methods for bio-oil include the application of ablative fluidized beds, rotatingcones, vacuum moving beds, entrained flow, and transportedbed reactors.1,5-8 The physical and chemical properties of bio-oil have been discussed from various feedstocks, includingwood,11,17 bark,18-22 agricultural wastes/residues,23,24 nuts andseeds,25 algae,11,26grasses,11 forestry residues,27,28and celluloseand lignin.29
The compound distributions in both liquid and gaseousproducts are not well-known for many biomass feeds. Somestudies are available on product identification and simulation.9,30-36
Recently, Lee et al.37 demonstrated that Sandia’s perfectly stirredreactor code (PSR) is a powerful tool for the simulation ofbiomass pyrolysis when coupled with the Health and SafetyCommission (HSC) thermodynamic software.38
This paper examines the pyrolysis of southern pine, red oak,and sweet gum sawdust under either helium or nitrogen aspurge gases at temperatures ranging from 371 to 871°C. Thegas and liquid pyrolysis products were identified using gaschromatography (GC) and GC/mass spectrometry (MS). Theinfluence of the gas-phase residence time and biomass feedparticle size were studied. Maximizing the production of liquidproducts is a key objective. The gas products from the pyrolysesof biomass under inert atmospheres have much lower fuel valuesper unit weight than the liquid products. Also, the total heatingvalue of liquid products, as a fraction of the entire heating valueof the initial wood feed, is greater than that of converting thesame weight of wood to gases. Therefore, a study of the pyro-lysis products over a wide temperature range was conducted.
Pyrolyses were first simulated using ASPEN/SP processsimulation software based on the assumption that chemicalequilibrium was obtained. The overall objectives to undertakethe present study were (1) identification and quantification ofpyrolysis chemicals produced, (2) understand the influence ofthe reactor temperature on pyrolysis product distributions, (3)determine the influence of the gas-phase residence time oncarbon monoxide, hydrogen, and methane production, (4)establish the influence of the sawdust particle size on the productdistribution, and (5) study the influence of the feedstock on theproduct distribution.
2. Materials and Methods
All AR-grade chemicals were used. Acetone (water content of0.17%, high purity), dichloromethane [99.9% ACS high-perfor-mance liquid chromatography (HPLC) grade], and methanol (99%)were employed. A tire pyrolysis mixture purchased from AbsoluteStandard, Inc. was used as the liquid product GC analysis standard,while a transformer oil gas standard from Scott Analyzed Gas anda reference gas sample from Hewlett-Packard were used as the gasproduct standards. The standard for permanent gases, “Airgas”, was
(12) Murwanashyaka, J. N.; Pakdel, H.; Roy, C. Step-wise and one-stepvacuum pyrolysis of birch-derived biomass to monitor the evolution ofphenols.J. Anal. Appl. Pyrolysis2001, 60, 219-231.
(13) Meier, D.; Faix, O. State of the art of applied fast pyrolysis oflignocellulosic materialssA review. Bioresour. Technol.1999, 68, 71-77.
(14) Diebold, J. P.; Czernik, S. Additives to lower and stabilize theviscosity of pyrolysis oils during storage.Energy Fuels1997, 11, 1081-1091.
(15) Huber, G. W.; Chheda, J. N.; Barrett, C. J.; Dumesic, J. A.Production of liquid alkanes by aqueous-phase processing of biomass-derived carbohydrates.Science2005, 308, 1446-1450.
(16) Sarma, A. K.; Konwer, D. Feasibility studies for conventionalrefinery distillation with a (1:1) w/w of a biocrude blend with petroleumcrude oil.Energy Fuels2005, 19, 1755-1758.
(17) Kang, B.-S.; Lee, K.-H.; Park, H. J.; Park, Y.-K.; Kim, J.-S. Fastpyrolysis of radiata pine in a bench scale plant with a fluidized bed:Influence of a char separation system and reaction conditions on theproduction of bio-oil.J. Anal. Appl. Pyrolysis2006, 76, 32-37.
(18) Ba, T.; Chaala, A.; Garcia-Perez, M.; Rodrigue, D.; Roy, C. Colloidalproperties of bio-oils obtained by vacuum pyrolysis of softwood bark.Characterization of water-soluble and water-insoluble fractions.EnergyFuels2004, 18, 704-712.
(19) Ba, T.; Chaala, A.; Garcia-Perez, M.; Roy, C. Colloidal propertiesof bio-oils obtained by vacuum pyrolysis of softwood bark. Storage stability.Energy Fuels2004, 18, 188-201.
(20) Boucher, M. E.; Chaala, A.; Pakdel, H.; Roy, C. Bio-oils obtainedby vacuum pyrolysis of softwood bark as a liquid fuel for gas turbines.Part II: Stability and ageing of bio-oil and its blends with methanol and apyrolytic aqueous phase.Biomass Bioenergy2000, 19, 351-361.
(21) Boucher, M. E.; Chaala, A.; Roy, C. Bio-oils obtained by vacuumpyrolysis of softwood bark as a liquid fuel for gas turbines. Part 1: Propertiesof bio-oil and its blends with methanol and a pyrolytic aqueous phase.Biomass Bioenergy2000, 19, 337-350.
(22) Chaala, A.; Ba, T.; Garcia-Perez, M.; Roy, C. Colloidal propertiesof bio-oils obtained by vacuum pyrolysis of softwood bark: Aging andthermal stability.Energy Fuels2004, 18, 1535-1542.
(23) Garcia-Perez, M.; Chaala, A.; Pakdel, H.; Kretschmer, D.; Rodrigue,D.; Roy, C. Multiphase structure of bio-oils.Energy Fuels2006, 20, 364-375.
(24) Garcia-Perez, M.; Chaala, A.; Pakdel, H.; Kretschmer, D.; Rodrigue,D.; Roy, C. Evaluation of the influence of stainless steel and copper on theaging process of bio-oil.Energy Fuels2006, 20, 786-795.
(25) Gonzalez, J. F.; Ramiro, A.; Gonzalez-Garcia, M. C.; Ganan,J.; Encinar, M. J.; Sabio, E.; Rubiales, J. Pyrolysis of almond shells.Energy applications of fractions.Ind. Eng. Chem. Res.2005, 44, 3003-3012.
(26) Miao, X.; Wu, Q.; Yang, C. Fast pyrolysis of microalgae to producerenewable fuels.J. Anal. Appl. Pyrolysis2004, 71, 855-863.
(27) Oasmaa, A.; Kuoppala, E.; Gust, S.; Solantausta, Y. Fast pyrolysisof forestry residue. 1. Effect of extractives on phase separation of pyrolysisliquids. Energy Fuels2003, 17, 1-12.
(28) Oasmaa, A.; Kuoppala, E.; Solantausta, Y. Fast pyrolysis of forestryresidue. 2. Physicochemical composition of product liquid.Energy Fuels2003, 17, 433-443.
(29) Fullana, A.; Contreras, J. A.; Striebich, R. C.; Sidhu, S. S.Multidimensional GC/MS analysis of pyrolytic oils.J. Anal. Appl. Pyrolysis2005, 74, 315-326.
(30) Duquesnoy, E.; Dinh, N. H.; Castola, V.; Casanova, J. Compositionof a pyrolytic oil from Cupressus funebrisEndl. of Vietnamese origin.FlaVour Fragrance J.2006, 21, 453-457.
(31) Yan, R.; Yang, H.; Chin, T.; Liang, D. T.; Chen, H.; Zheng, C.Influence of temperature on the distribution of gaseous products frompyrolyzing palm oil wastes.Combust. Flame2005, 142, 24-32.
(32) Babu, B. V.; Chaurasia, A. S. Pyrolysis of biomass: Improvedmodels for simultaneous kinetics and transport of heat, mass and momentum.Energy ConVers. Manage.2004, 45, 1297-1327.
(33) Varhegyi, G.; Antal, M. J. J.; Jakab, E.; Szabo, P. Kinetic modelingof biomass pyrolysis.J. Anal. Appl. Pyrolysis1997, 42, 73-87.
(34) Savage, P. E. Mechanisms and kinetics models for hydrocarbonpyrolysis.J. Anal. Appl. Pyrolysis2000, 54, 109-126.
(35) Sipila, K.; Kuoppala, E.; Fagerna¨s, L.; Oasmaa, A. Characterizationof biomass-based flash pyrolysis oils.Biomass Bioenergy1998, 14, 103-113.
(36) Strezov, V.; Lucas, J. A.; Strezov, L. Experimental and modellingof the thermal regions of activity during pyrolysis of bituminous coals.J.Anal. Appl. Pyrolysis2004, 71, 375-392.
(37) Lee, D. H.; Yang, H.; Yan, R.; Liang, D. T. Prediction of gaseousproducts from biomass pyrolysis through combined kinetic and thermody-namic simulations.Fuel 2006, in press.
(38) Glarborg, P.; Kee, R. J.; Grcar, J. F.; Miller, J. A.PSR: A FortranProgram for Modeling Well-Stirred Reactors; Sandia Report, Livermore,CA, 1991.
2374 Energy & Fuels, Vol. 21, No. 4, 2007 Zhang et al.

obtained from Gulf States. Liquid pyrolysis products were analyzedusing a HP 5890 series II gas chromatograph coupled with a HP5972 series mass selective detector (MSD). Simulation of the woodpyrolysis as well as the gasification process was performed usingASPEN/SP (Simulation Sciences, Inc.).
2.1. Pyrolysis Apparatus.Pyrolysis experiments were conductedin a modified Dohrmann DC-50/52 series total organic carbonanalyzer. The horizontal fused quartz tube of the analyzer was usedas a pyrolysis plug-flow reactor. The tube was divided into twozones. The sizes of the inlet and outlet zones were 180× 10 mm(L × ID) and 120× 20 mm (L × ID), respectively. The outletzone further tapers to 65× 8 mm (L × ID). The temperatures inthese two zones were controlled by separate analog temperaturecontrollers, and the temperature set points were adjusted manually.The temperatures in both zones were kept the same. The gas andliquid products were collected at the outlet of the quartz tube. Thesampling time was chosen as the time interval between pushingthe sample boat into the heating zone and the time the productshad completely exited the reactor. This ensured that all of theproducts were collected.
A schematic of the experimental apparatus is shown in Figure1. Purge gas (helium or nitrogen) was fed to the tubular reactor atthe purge inlet to maintain an inlet pressure of 5 psig. Ap-proximately 0.04 g of ground sawdust (southern pine, red oak, orsweet gum) was weighed in the platinum sample boat and thenplaced in the carrier plate at the end of the pushrod. The boat waspositioned in the Pyrex inlet tube. The system was purged withhelium or nitrogen at 20 cm3/min for 30 min to ensure that noresidual oxygen remained. The volume of the quartz tube was∼300cm3. The inlet and outlet zone heaters were energized to reach theoperating temperature.
The outlet was connected to either a Tedlar bag for gas samplingor an impinger immersed in an ice bath for liquid sampling.Acetone, dichloromethane, and methanol were tested as con-densing media to collect liquid products. The highest liquid yieldwas obtained with acetone as the condensing media. Therefore,acetone was used in the impinger to collect the liquid product. Thepushrod was quickly moved toward the reactor so that the sampleboat was placed at the center of the heating zones. Usually, thisprocess took 1.5 s. After a designated interval, the pushrod waswithdrawn, leaving the sample boat in the inlet tube to cool and beweighed. This time interval was chosen depending upon the re-action temperature. Higher reaction temperatures required shorterreaction times. Inert gas purge was maintained throughout theprocess.
2.2. Analytical Experimentation. A HP-1 cross-linked methylsilicon gum column (length of 50 m, diameter of 0.2 mm, and filmthickness of 0.5µm) was used for the GC analysis of liquidproducts. The column temperature was programmed from 45°C(8 min hold) to 280°C (5 min hold) at a rate of 5°C/min. Theinjector and the GC/MS interface were kept at constant temperatures
of 300 and 280°C, respectively. Helium was the carrier gas, witha constant flow rate of 0.7 mL/min. Organic products were analyzedusing a J&W Scientific GS-QP/N 113-3432 capillary column(length of 30 m and diameter of 0.32 mm), at a temperatureprogrammed from 44°C (4 min hold) to 180°C (8 min hold) at arate of 10°C/min. The injector and the GC/MS interface were heldconstant at 200 and 280°C, respectively. Helium (1.3 mL/min)was the carrier gas.
Noncondensable gases were analyzed using a Chrompack Car-boplot P7 column (length of 25 m and diameter of 0.53 mm) anda thermal conductivity detector (TCD). The column temperaturewas programmed from 30°C (3 min hold) to 80°C (3 min hold)at a rate of 15°C/min. Argon (7.5 mL/min) was used as the carriergas to ensure H2 detection.
A library MS search was performed to provide likely analysesof each component and compliment an individual analysis of eachMS fragmentation pattern.
2.3. GC/MS and GC Calibration, Operation, and QualityControl. The experimental reliability of gas and liquid productyields (except for CO, H2, and CH4) depended upon the detectionof products by the HP 5890 series II GC and the HP 5972 seriesMSD. Thus, MS tuning and the calibration of the GC/MS and GCwere crucial for quantitative analysis.
The MSD was tuned daily using either the “Manual Tune”method followed by the “Standard Spectra Autotune” method fromMS ChemStation Software or the “Standard Spectra Autotune”,depending upon MSD conditions. Known amounts of the tuningstandard, perfluorotributylamine (PFTBA) with major fragment ionsatm/e69, 219, and 502, were injected. The unknown samples wereinjected under the same conditions. One-point calibrations wereused for liquid and most gas sample analyses, except for hydrogen,carbon monoxide, methane, methanol, and acetone. Responsefactors were determined for each compound. The calibration gasGC standard samples described above were employed. Benzeneand toluene existed at high concentrations; therefore, their standardswere made from pure benzene, toluene, and acetone.
Three-point calibrations were used to quantify the compositionof carbon monoxide, methane, ethanol, and acetone, while two-point calibrations were used for hydrogen. Calibration plots forhydrogen, carbon monoxide, and methane gave straight linesthrough the origin.
Gas standards for methanol and acetone were made by injectinga known amount of liquid methanol and acetone into a Tedlar bagcontaining nitrogen and ensuring complete liquid evaporation.
3. Results and Discussion
3.1. Thermodynamic Simulation.Simulation of the woodpyrolysis and gasification was performed using ASPEN/SP(Simulation Sciences, Inc.) based on the assumption thatchemical equilibrium was obtained. Because of the complexity
Figure 1. Pyrolysis apparatus: (1) pyrolysis tube, (2) sample boat, (3) furnace, (4) impinger, and (5) helium-purge inlet.
Pyrolysis of SeVeral Biomass Feedstocks Energy & Fuels, Vol. 21, No. 4, 20072375

of the reaction mechanism and the large number of reactionsinvolved in biomass pyrolysis and gasification, the use ofchemical equilibrium calculations is a convenient method toexamine a product distribution and does not reflect the timedependence of the process. Chemical equilibrium calculationsare based on the minimization of Gibbs energy and predict thefinal composition assuming that sufficient time has elapsed toachieve equilibrium. The predicted composition also reflects,to a certain extent, those species identified as present in theeffluent by the modeler. In this work, the compound subset waslimited to include only the following gaseous species: CO, CO2,H2, N2, H2O, and CH4 This does significantly reduce the numberof chemical reactions that are considered during the minimiza-tion process.
In fluidized bed, entrained bed, and tubular pyrolysis reactors,the residence time varies from a few seconds to a few minutes.Chemical equilibrium calculations can be compared to experi-ments to illustrate the extent to which equilibrium is achieved.These calculations qualitatively describe the influence of reactionconditions and predict the composition if the residence timewas sufficient to achieve equilibrium.
The effects of temperature and pressure on the yield (definedas the mass of the component obtained divided by the initialmass of the sawdust sample) of CH4, CO, H2O, H2, and CO2
were predicted for different sawdust (Figures 2 and 3). Theinfluence of the temperature and the steam/carbon mole ratioon the gasification products were also examined (Figures 4-11).The sawdust composition provided to the simulation wasobtained using the ultimate and proximate analyses.39 Theultimate analysis of the wood mixture supplied to the ASPEN/SP program39 was carbon, 49.5 wt %; hydrogen, 6.0 wt %;oxygen, 42.7 wt %; nitrogen, 0.2 wt %; sulfur, 0.1 wt %; andash, 1.5 wt %. This composition is representative of a hard-wood mixture. Complete conversion of sawdust to gas andash at chemical equilibrium was assumed at a pressure of 14.7psia.
Predicted CO yields increased dramatically with increasingtemperature from 538 to 871°C (Figure 2). Above 871°C, theCO yield remained almost constant. Much lower yields ofhydrogen and methane (<10%) are predicted at the lowesttemperature examined, and the predicted H2 yield increased andthe CH4 yield decreased with an increase in the temperature, at
temperatures below 982°C. Above 982°C, the H2 and CH4
yields remained almost constant at fairly low percent values(somewhat masked by the scale used in Figure 2). Predictedyields of both H2O and CO2 decreased when the temperatureincreased, essentially disappearing at temperatures above 982°C.Reactions of interest are31,40-42
The endothermic reactions (eqs 1-4) are favored at hightemperatures, while the reverse is true for exothermic reactions(eqs 5 and 6). Higher H2 and CO yields and lower CH4 andH2O yields are predicted at higher temperatures.
Predicted CO and H2 yields decreased as the pressureincreased, while CO2, CH4, and water yields increased withthe pressure (Figure 3). Pressure has little influence on the H2
yield at higher pressures (>5 atm). Low pressures in thepyrolysis process will favor CO production. Reactions 1-3 areshifted toward the products, and the reactions 5 and 6 are shifted
(39) Green, D.Perry’s Chemical Engineers’ Handbook, 6th ed.; McGraw-Hill: NewYork, 1984.
(40) Encinar, J. M.; Beltran, F. J.; Ramiro, A.; Gonzalez, J. F. Pyrolysis/gasification of agricultural residues by carbon dioxide in the presence ofdifferent additives: Influence of variables.Fuel Process. Technol.1998,55, 219-233.
(41) McKendry, P. Energy production from biomass (part 3): Gasifica-tion technologies.Bioresour. Technol.2002, 83, 55-63.
(42) Schuster, G.; Loffler, G.; Weigl, K.; Hofbauer, H. Biomass steamgasificationsAn extensive parametric modeling study.Bioresour. Technol.2001, 77, 71-79.
Figure 2. Effect of the reactor temperature on the predicted yields ofCO, H2, CH4, CO2, and H2O from sawdust pyrolysis (from ASPEN/SP).
Figure 3. Effect of the reactor pressure on the predicted yields ofCO, H2, CO2, CH4, and H2O at 704°C (from ASPEN/SP).
3H2 (g) + CO (g)T CH4 (g) + H2O (g)
∆H2980 ) -206 MJ/kmol (1)
4H2 (g) + CO2 (g) T CH4 (g) + 2H2O (g)
∆H2980 ) -165 MJ/kmol (2)
H2O (g) + CO (g)T CO2 (g) + H2 (g)
∆H2980 ) -41 MJ/kmol (3)
C (s)+ 2H2 (g) T CH4 (g) ∆H2980 ) -75 MJ/kmol
(4)
C (s)+ CO2 (g) T 2CO (g) ∆H2980 ) +168 MJ/kmol
(5)
C (s)+ H2O (g) T CO (g)+ H2(g)
∆H2980 ) +175 MJ/kmol (6)
2376 Energy & Fuels, Vol. 21, No. 4, 2007 Zhang et al.
toward the reactants with increasing pressure. Thus, as thepressure is increased, more CH4 and H2O and less CO and H2will form.
Predictions of the effect of the steam/carbon mole ratioon H2, CO, CO2, and CH4 production were examined (dataomitted for brevity). The H2 yields at low temperature(538-954 °C, Figure 4) and at high temperature (1038-1371°C, Figure 5), respectively, were predicted. At H2O/C >1.4, the H2 production reached a maximum at a temperature of704 °C. CO increased with the temperature and reached amaximum at a H2O/C mole ratio of 0.35, above 704°C. HighCO2 yields were obtained at high steam/carbon ratios andlow temperatures. Less CH4 was predicted at higher steam/carbon ratios and high temperatures. Very high steam/carbonmole ratios shifted reactions 1 and 2 toward the reactants. Thewater-gas shift (reaction 3) was shifted toward CO2 production,resulting in lower CO and CH4 yields and higher H2 and CO2
yields.ASPEN/SP and STANJAN simulations were compared.
Katofsky43 simulated an adiabatic operation using STANJANand assumed 100% carbon conversion to gaseous species.Species present at equilibrium were H2, CO, CO2, CH4, H2O,and N2 (Table 1). Both ASPEN/SP and STANJAN simulations
gave similar results. At temperatures below 1085°C, CO, CO2,and H2 were dominant, while CH4 was only present in traceamounts.
3.2. Heat Transfer into Wood Particles.Biomass pyro-lysis is extremely temperature-sensitive. The temperatureprofile within the biomass particle during pyrolysis is critical.If a significant temperature gradient exists within the particleor if the time required for the center of a particle to reach thereactor temperature is comparable to the time needed for thevarious pyrolysis reactions to occur, the lag in heat transfer mustbe considered. In such a case, the overall process may not becontrolled by the chemical reaction kinetics.
The surface temperature of the solid is not determined solelyby the reactor or carrier gas temperature. The energy generatedor consumed (exo- or endothermic) during the primary andsecondary pyrolysis reactions will also influence the temperature.The energy is transferred mainly by convection to volatileproducts at the particle surface. In addition, the velocity profileof the gas passing by the particle and direct solid/reactor wallcontact will affect the temperature distribution within the solidfeed.44 This heat-transfer process is very complex. Thus, asimplified case is considered: sawdust particles suspended inthe hot gas are heated by conduction from the hot gas. Radiationwas assumed not to be significant at lower pyrolysis tempera-tures, and the particle had a unique surface temperature. Thenet rate of energy transfer to the particle is
whereh is the heat-transfer coefficient corresponding to the totalsurface area of the hot gas particle,Tg andTp are the gas andparticle temperatures, andAp is the surface area for the particle,respectively. The net rate of energy transfer is expressed as
wheremp, Fp, Cp, andVp are the weight, density, heat capacity,and volume of the particle, respectively. Combining eqs 7 and8 yields
Equation 9 can also be expressed as
(43) Katofsky, R. E. The production of fluid fuels from biomass.Princeton University, Princeton, NJ, 1993.
(44) Bilbao, R.; Murillo, M. B.; Millera, A.; Arauzo, J.; Celeya, J. M.Thermal decomposition of a wood particle. Temperature profiles on thesolid surface.Thermochem. Acta1992, 197, 431-442.
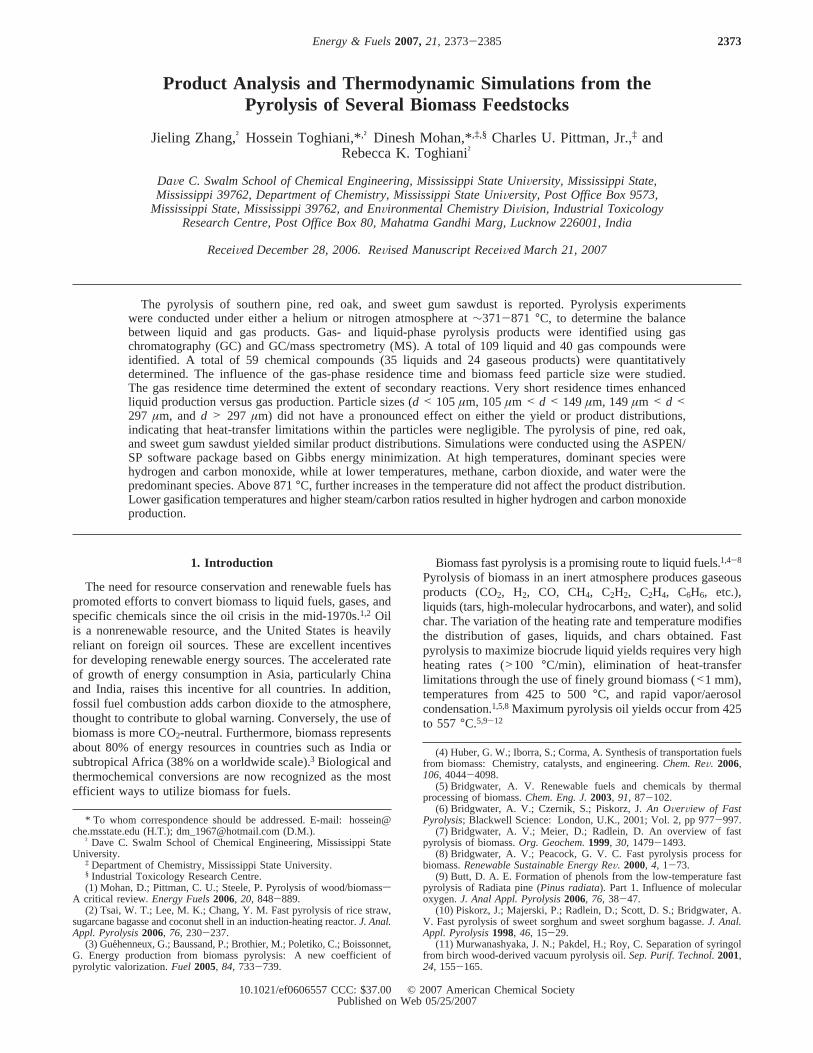
Figure 4. Time dependence of the wood particle temperature computedfor various gas temperatures according to eq 13 assuming no relativegas versus particle motion (particle size) 100 µm).
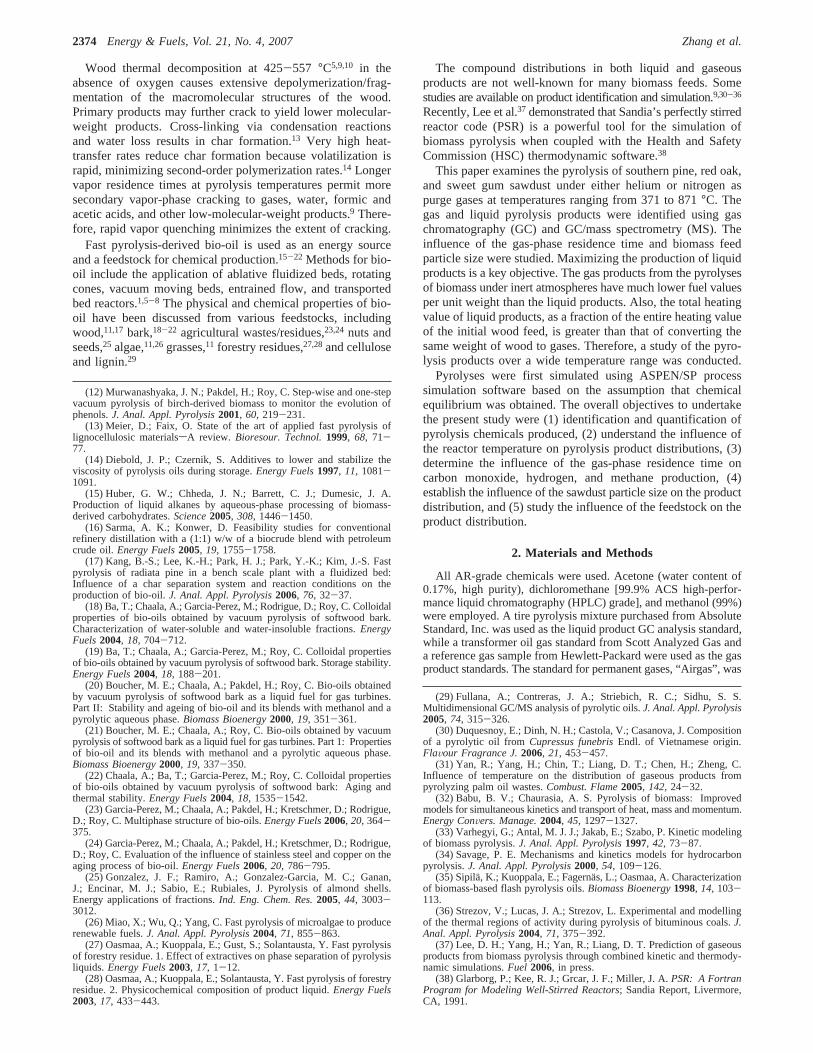
Figure 5. Time dependence of the wood particle temperature at a gastemperature of 649°C for various particle diameters (in micrometers)computed by eq 13 assuming no relative gas versus particle motion.
Table 1. Chemical Equilibrium Results from ASPEN/SP versusSTANJAN
overall C/H/O ratiotemperature (°C)
1/1.93/1.591085
gas composition (mol %)
components ASPEN/SP STANJAN43
H2 30.48 30.67CO 39.45 39.04CO2 11.41 11.77CH4 0.001 0.10H2O 18.60 18.36N2 0.054 0.05
q ) hAp(Tg - Tp) (7)
q ) mpCp
dTp
dt) FpVpCp
dTp
dt(8)
FpVpCp
dTp
dt) hAp(Tg - Tp) (9)
dTp
dt)
6Nukg
FpCpdp2(Tg - Tp) (10)
Pyrolysis of SeVeral Biomass Feedstocks Energy & Fuels, Vol. 21, No. 4, 20072377

where Nu is the Nusselt number, defined by eq 11
Here, kg is the thermal conductivity of the surrounding gas.When forced convection around submerged objects occurs, theNusselt number is
where Re is the gas fluid Reynolds number (DpVgFg/µg) and Pris the fluid Prandtl number.45 If there is no relative motionbetween the gas and the particle, the Nusselt number is 2.Integrating eq 10 yields eq 1346
The particle temperature increase versus time at various gastemperatures is shown in Figure 4. The time dependence of theparticle temperature in a 649°C gas medium, computed fordifferent particle sizes (eq 13), is shown in Figures 5 and 6.The physical constants for pine sawdust used in the calculationswereFp ) 551.036 kg/m3 andCp ) 0.32 kcal (kg°C)-1,39 andthe thermal conductivity of nitrogen is39
Particles (100µm) take approximately 0.026 s to reach thesurrounding gas temperature at 649°C. The time to reach thegas temperature is sensitive to the particle size as illustrated inFigures 5 and 6. Particles more than 500µm in diameter requiremore than 0.48 s to reach the gas temperature. These calculationswill overestimate the time required because it is assumed thatthe particle is not moving with respect to the gas in eq 13 withthe use of Nu) 2. Thus, Figures 5 and 6 represent the slowest(longest) heating times possible in the experimental work.
3.3. Experimental Pyrolysis of Various Biomass Feeds.Experiments determined the time required to complete sawdust
pyrolysis under various operating conditions. Sawdust wasweighed, placed in the reactor, pyrolyzed, and reweighed aftercompletion of the reaction. The residue ratio is defined as themass of residue/mass of sawdust. The reaction time is definedas the time for the pyrolysis residue (char) to reach a constantmass. Experimental reaction times dropped with an increase inthe reaction temperature (Figure 7). All of the three wood feedshave similar reaction times at 649°C (Figure 8).
The pyrolysis products obtained from pine, sweet gum, andred oak at 371-816°C were similar under identical conditions.The liquid products are summarized in Table 2, and the gaseousproducts are listed in Table 3. A total of 109 compounds wereidentified in the liquid portion, while 40 compounds wereidentified in the gas portion. The general similarities in theproduct distributions from pine, sweet gum, and red oak speciesat the same temperatures should not be surprising. The overalllignin, cellulose, and hemicellulose contents of these speciesare comparable. Softwoods, such as pine, contain lignin madeof guaiacyl units, while hardwoods, such as oak, have bothguaiacyl and syringyl lignin building blocks. Despite suchdifferences, we have repeatedly found that pine and oak woodpyrolyses do not lead to large composition differences from thesebuilding blocks. For example, in an auger-fed fast pyrolysisreactor operating at 450°C, we have observed that guaiacylunits constituted 17.3% of all carbons in the lignin-rich ethylacetate fraction of pine bio-oil and 15.3% for oak by13C nuclear
(45) Bird, R. B.; Stewart, W. E.; Lightfoot, E. N.Transport Phenomena;John Wiley and Sons: NewYork, 1960.
(46) Ozturk, Z. Pyrolysis of cellulose using a single pulse shock tube.Kansas State University, Manhattan, KS, 1991.
Figure 6. Time dependence of the wood particle temperature computedby eq 13 for various particle diameters (in micrometers) at a gastemperature of 649°C assuming no relative gas versus particle motion.
Nu )hdF
kg(11)
Nu ) 2 + 0.60(Re)1/2(Pr)1/3 (12)
Tg - Tp
(Tg - Tp)0
) exp( - 6Nukgt
FpCpdp2 ) (13)
kg ) -9.2093× 10⁻³ + 8.5836× 10⁻⁵ Tg - 1.8941×10⁻⁸ Tg2 W (m K)-1 (14)
Figure 7. Effect of the reaction time on the experimental char yieldduring pine sawdust pyrolysis at different gas temperatures (reactiontimes at 816°C).
Figure 8. Effect of the reaction time on the char yield during thepyrolysis of pine, sweet gum, and red oak sawdust at 649°C.
2378 Energy & Fuels, Vol. 21, No. 4, 2007 Zhang et al.

Table 2. Liquid Products Found in Pine Wood, Red Oak, and Sweet Gum Sawdust Pyrolysisa
temperature (°C)
649
componentsretention
time (min) 377 427 538 pineredoak
sweetgum 816
2-butanal 7.89 D D1-hydroxy-2-propanone 8.04 D D Dbenzene 8.64 D D D D D1-propanol 9.15 D1-(1-methylethoxy)-2-propanone 11.67 D1-hydroxy-2-propanone 12.23 D Dtoluene 12.58 D D D D D2-cyclopenten-1-one 14.27 D D D D2-furancarbox-aldehyde 14.4 D D D2-butanone 14.83 D D D2-furanmethanol 15.49 D D Dethylbenzene 16.37 D D D D2(5H)-furanone 16.67 D D1,3-dimethyl-benzene 16.71 D D D Dphenylethyne 16.74 D2-cyclohexen-1-ol 17.01 D D Dstyrene 17.39 D D D D Dp-xylene 17.59 D D D Dcyclohexanone 17.87 D D2-cyclohexen-1-one 18.27 D D D3,3-dimethyl-2-butanone 19.13 D3-methyl-2-cyclopenten-1-one 19.37 D D Dhydroquinone 19.44 D Dphenol 20.21 D D D D D D D2,5-piperazinedione 20.48 D DR-methylstyrene 20.83 D D1,4-cyclohexanedione Dbenzofuran 21.28 D D D D D2,3-dihydro-3-methylfuran 21.05 D D3-methyl-1,2-cyclopentanedione 21.86 D D1,4-diethoxy-2-butene 21.94 D2-ethyl-1,3-dioxolane 22.38 D D D2-methylphenol 22.83 D D D D Dindene 23.05 D D D D D4-methylphenol 23.48 D D D D D D2-propanamine 23.94 D Dbutanal 24.48 D7-methylbenzofuran 24.99 D D D D3-phenyl-2-propenal 25.11 D D D2-methoxyphenol 25.16 D D2-ethylphenol 25.59 D D Dcyclobutanone 25.79 D2,4-dimethylphenol 25.96 D D D5-methyl-2-heptanamine 25.16 D2-ethylphenol 26.46 D D3-ethyl-2-hydroxy-2-cyclopenten-1-one 26.47 D1-methyl-1H-indene 26.75 D D D D4-(methylthio)acetophenone 26.75 D3,5-dimethylphenol 27.32 D D D D D Dcyclopentanol 27.63 Dnaphthalene 27.64 D D D D D2,3-dihydrobenzofuran 27.88 D D D D1,2-benzenediol 28.29 D D D D Dcis-1,2-cyclohexanediol 28.65 D4-ethylphenol 28.77 D D3(2H)-benzofuranone 28.88 D2,3-dihydro-1H-indene-1-one 29.94 D D1,4:3,6-dianhydro-R-D-glucopyranose 30.03 D2-(2-propenyl)phenol 30.14 D D2-methoxy-4-methylphenol 30.17 D D5-(hydroxymethyl)-2-furancarboxaldehyde 30.34 D D2,3-dihydrobenzofuran 30.79 D D D2-methylnaphthalene 30.99 D D D D3-phenyl-2-propenal 31.38 D D1-methylnaphthalene 31.46 D D D D2-(1-methylethyl)phenol 31.90 D Dethenylbenzaldehyde 32.01 D Dhydroquinone 32.37 D3-methyl-1,2-benzenediol 32.45 D D Dbiphenyl 33.18 D D D D4-methyl-1,2-benzenediol 33.52 D D D4-ethyl-2-methoxyphenol 33.61 D
Pyrolysis of SeVeral Biomass Feedstocks Energy & Fuels, Vol. 21, No. 4, 20072379

magnetic resonance (NMR) spectroscopy.47 Syringyl-derivedunits made 2.7% of this fraction for pine and 7.4% for oak.Some syringyl units may be thermally converted to guaiacylderivatives during pyrolysis.
At 538 °C, the major liquid components were ketones,alcohols, cresols, and smaller amounts of aromatic compounds(Table 2). Above 538°C, benzene, phenols, cresols, and otheraromatic compounds dominated. The polycyclic aromaticcompounds, pyrene, fluoranthene, phenanthrene, anthracene,naphthalene and acenaphthalene, were detected above 760°C,and their yields increased with increasing temperature.
Wood pyrolysis proceeds via primary and secondary reac-tions. Cellulosic ring fragmentations, depolymerizations, anddehydrations are primary reactions that form carbonyls, car-boxylic acids, and alcohols, while anhydrosugars (primarilylevoglucosan) are obtained from depolymerization and waterloss. Dehydration reactions produce char, water, gas, and tar.48
Levoglucosan was detected in the liquid product generatedbelow 649°C. Secondary reactions became more important athigher temperatures and residence times. Decarboxylation and
dehydration reactions favor the production of olefins. Propylene,ethylene, and butane were produced at higher temperatures.Olefin production is followed by reactions to form cyclic olefins.The six-carbon ring intermediates then undergo dehydrogenationto benzene and its derivatives. Associative reactions lead to theformation of polycyclic aromatic hydrocarbons at even highertemperatures.49
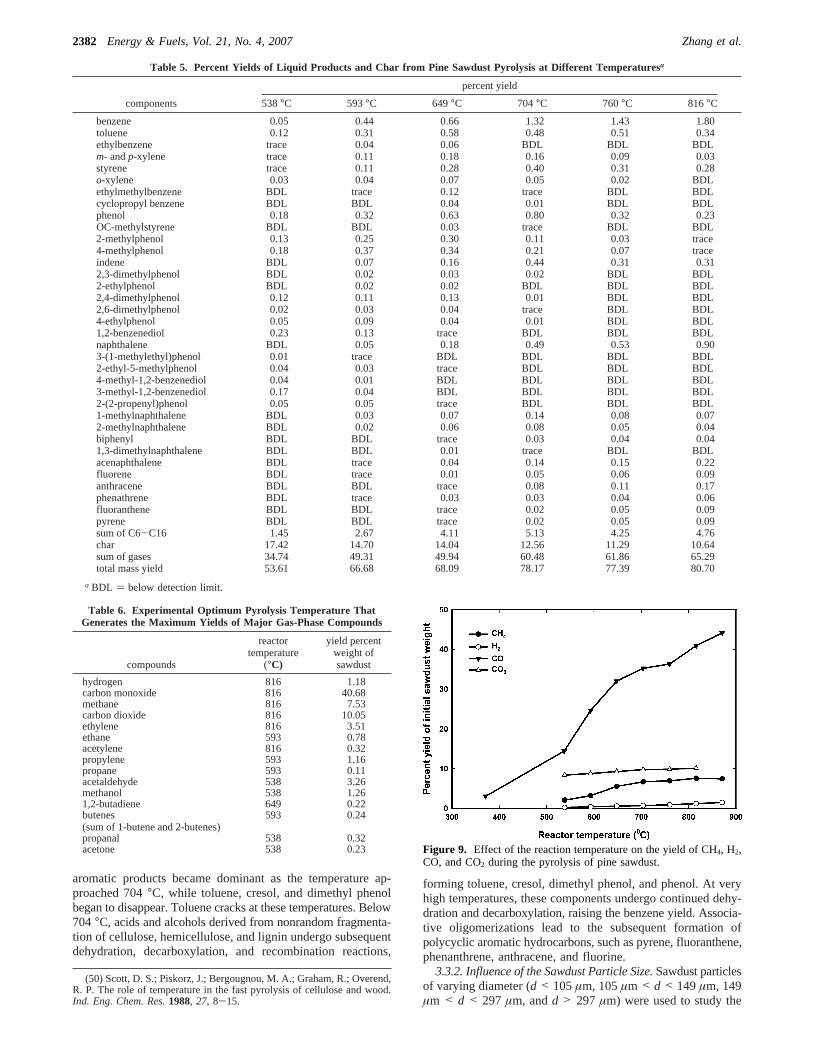
Table 4 provides a compilation of the yields for gaseousproducts from pine sawdust at various pyrolysis temperatures.The yield of a component is defined as the mass of thecomponent (calculated from quantitative analytical results)divided by the original pyrolysis sample mass. Table 5 providesquantitative results for the liquid product from pine sawdust atvarious pyrolysis temperatures.
3.3.1. Influence of the Temperature.Products from pyrolysiscarried out at 538-816 °C were quantitatively analyzed. Thegaseous products, namely, hydrogen, carbon monoxide, meth-ane, ethylene, ethane, propylene, and methanol were thepredominant species. Table 6 shows the temperature at whichthe maximum yield for each of these species was obtained. Theexperimental temperature dependence of specific gas productsis shown in Figures 17-20. Yields of hydrogen, carbonmonoxide, carbon dioxide, and methane increased with increas-
(47) Ingram, L.; Mohan, D.; Bricka, M.; Steele, P.; Strobel, D.; Crocker,D.; Mitchell, B.; Mohammad, J.; Pittman, C. U. J. Pyrolysis of wood andbark in an auger reactor: Physical properties and chemical analysis.2007,manuscript in preparation.
(48) Graham, R. G. A characterization of the fast pyrolysis of celluloseand wood biomass. University of Western Ontario, London, Ontario, Canada,1993.
(49) Williams, P. T.; Horne, P. A. The influence of catalyst regenerationon the composition of zeolite-upgraded biomass pyrolysis oils.Fuel 1995,74, 1839-1851.
Table 2. Continued
temperature (°C)
649
componentsretention
time (min) 377 427 538 pineredoak
sweetgum 816
2-ethylnaphthalene 33.74 D D D2-(2-propenyl)phenol 33.75 D D1,8-dimethylnaphthalene 34.05 D D1,7-dimethylnaphthalene 34.45 D D2,6-dimethylnaphthalene 34.55 D D2-ethenylnaphthalene 36.64 D1-(3-methoxy-phenyl)ethanone 34.74 Dacenaphthylene 35.19 D D D D1,4-dimethylnaphthalene 35.37 D D D4-(2-propenyl)phenol 35.42 D D2-methyl-1,1′-biphenyl 35.94 D1-naphthalenol 36.11 D D Deugenol 36.27 D2-naphthalenol 36.3 D D D4-ethyl-1,3-benzenediol 36.73 D Ddibenzofuran 36.92 D D D Dvanillin 37.06 D D3-methyl-1,1′-biphenyl 37.52 D D D1,6-anhydro-â-D-glucopyranose 37.77 D D D2-methoxy-4-(1-propenyl)phenol 37.90 Dfluorene 38.55 D D D D2-methyl-1-(1,1-dimethylethyl)-2-methyl-1,3-propanediylpropanoate 38.71 D D D D2′,4′-dihydroxypropiophenone 39.04 D2-methoxy-4-(1-propenyl)phenol 39.31 D D9H-fluorene-9-carboxylic acid 39.56 D D D1-(4-hydroxy-3-methoxy-phenyl)ethanone 40.16 D D1-methyl-9-H-fluorene 41.26 D4-methyl-9-H-fluorene 41.41 D4-ethyl-2-methoxyphenol 41.85 Dphenanthrene 43.05 D D D Danthracene 43.32 D D D D3,5-dimethylbenzoic acid 44.99 D4-hydroxy-3-methoxybenzeneacetic acid 46.43 D2-phenylnaphthalene 46.87 Dfluoranthene 48.81 D D3-methoxycinnamic acid 48.96 Dpyrene 49.83 D
a D ) detectable.
2380 Energy & Fuels, Vol. 21, No. 4, 2007 Zhang et al.
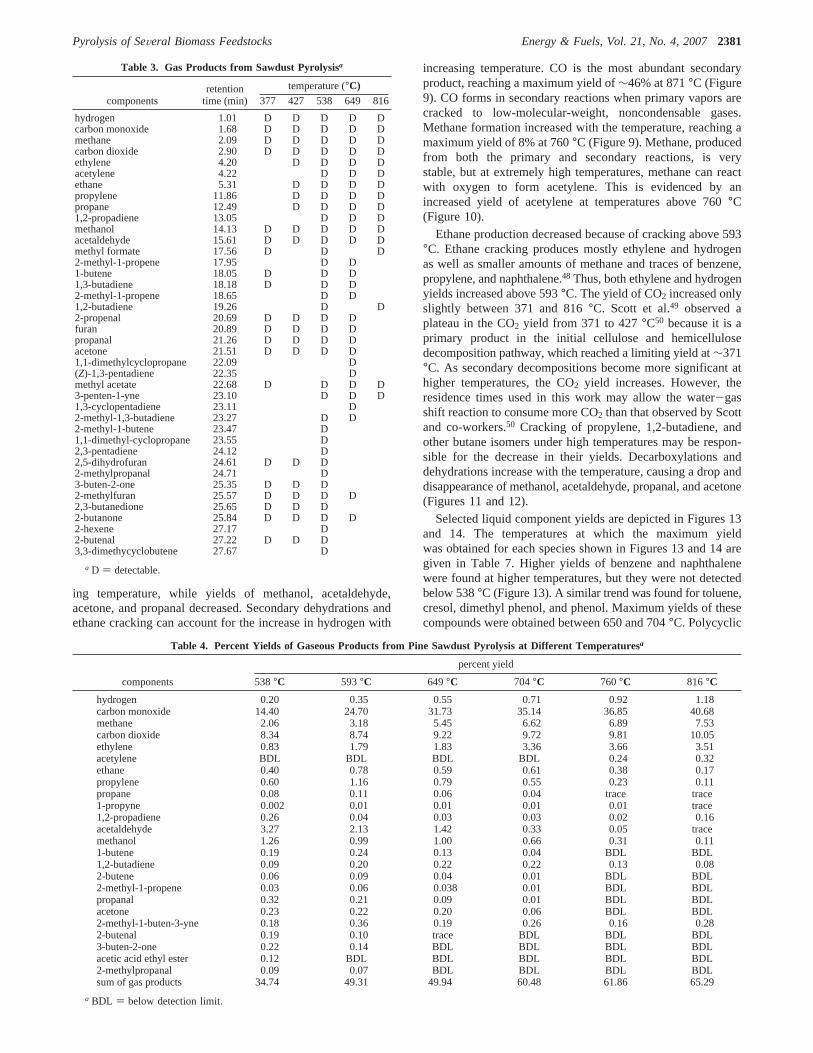
ing temperature, while yields of methanol, acetaldehyde,acetone, and propanal decreased. Secondary dehydrations andethane cracking can account for the increase in hydrogen with
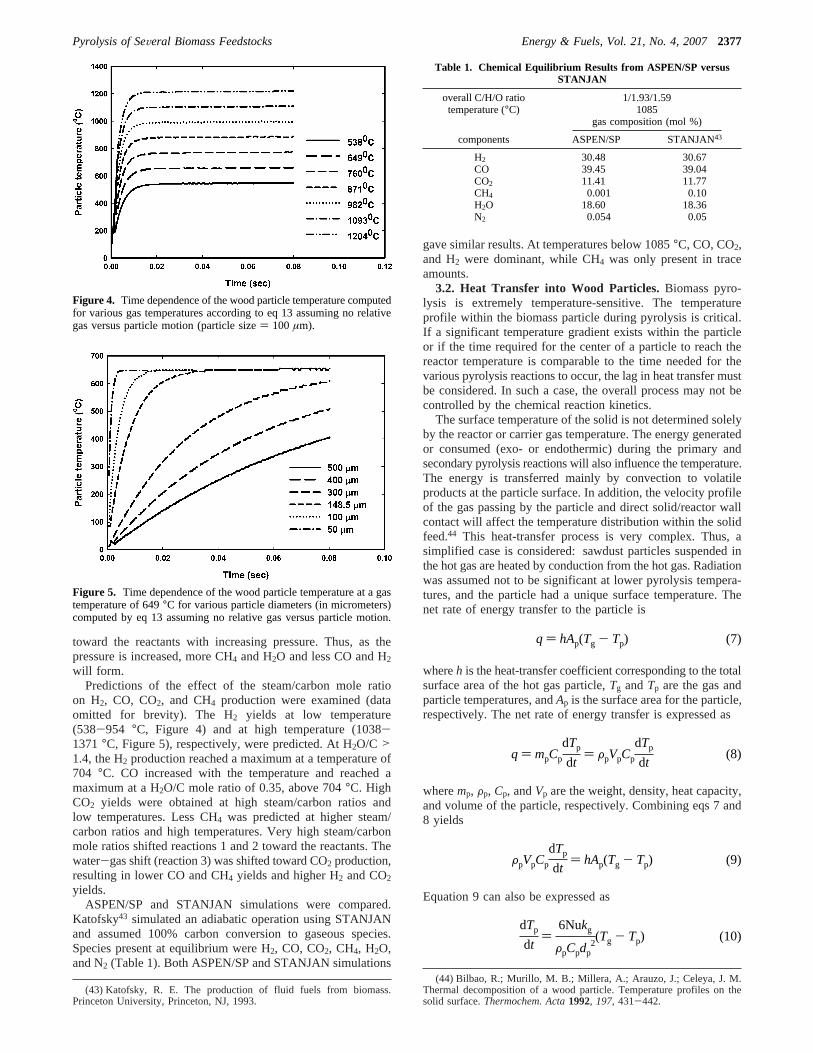
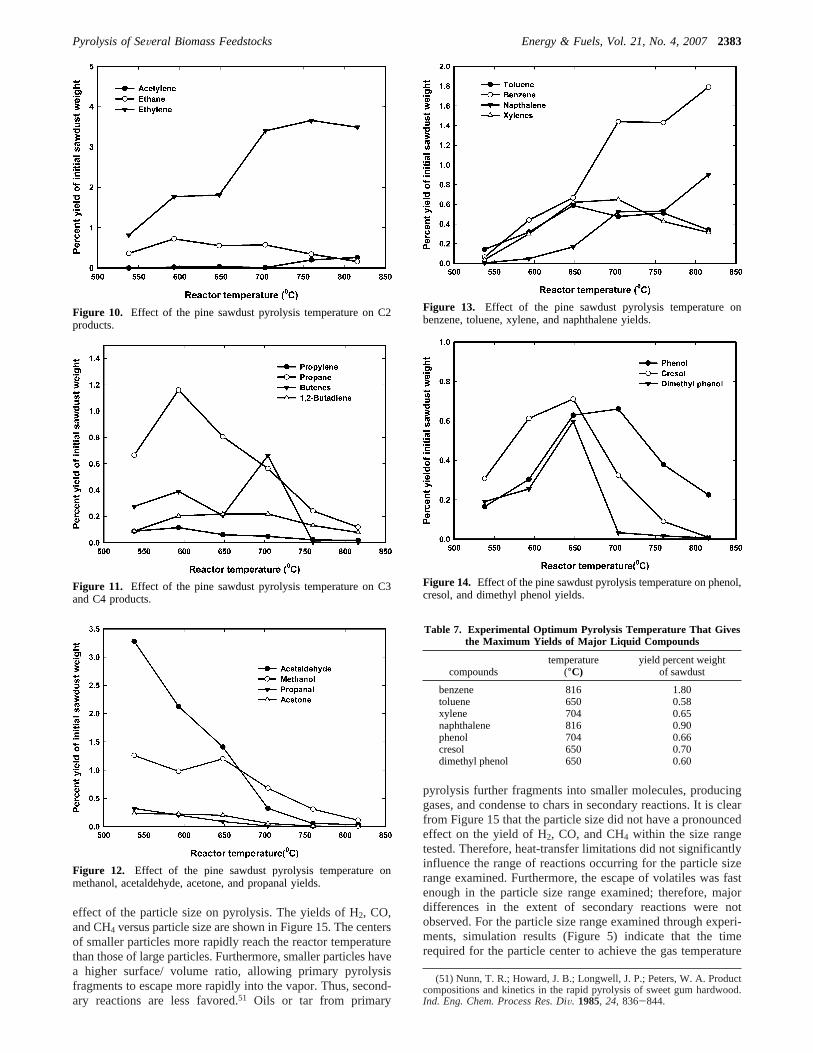
increasing temperature. CO is the most abundant secondaryproduct, reaching a maximum yield of∼46% at 871°C (Figure9). CO forms in secondary reactions when primary vapors arecracked to low-molecular-weight, noncondensable gases.Methane formation increased with the temperature, reaching amaximum yield of 8% at 760°C (Figure 9). Methane, producedfrom both the primary and secondary reactions, is verystable, but at extremely high temperatures, methane can reactwith oxygen to form acetylene. This is evidenced by anincreased yield of acetylene at temperatures above 760°C(Figure 10).
Ethane production decreased because of cracking above 593°C. Ethane cracking produces mostly ethylene and hydrogenas well as smaller amounts of methane and traces of benzene,propylene, and naphthalene.48 Thus, both ethylene and hydrogenyields increased above 593°C. The yield of CO2 increased onlyslightly between 371 and 816°C. Scott et al.49 observed aplateau in the CO2 yield from 371 to 427°C50 because it is aprimary product in the initial cellulose and hemicellulosedecomposition pathway, which reached a limiting yield at∼371°C. As secondary decompositions become more significant athigher temperatures, the CO2 yield increases. However, theresidence times used in this work may allow the water-gasshift reaction to consume more CO2 than that observed by Scottand co-workers.50 Cracking of propylene, 1,2-butadiene, andother butane isomers under high temperatures may be respon-sible for the decrease in their yields. Decarboxylations anddehydrations increase with the temperature, causing a drop anddisappearance of methanol, acetaldehyde, propanal, and acetone(Figures 11 and 12).
Selected liquid component yields are depicted in Figures 13and 14. The temperatures at which the maximum yieldwas obtained for each species shown in Figures 13 and 14 aregiven in Table 7. Higher yields of benzene and naphthalenewere found at higher temperatures, but they were not detectedbelow 538°C (Figure 13). A similar trend was found for toluene,cresol, dimethyl phenol, and phenol. Maximum yields of thesecompounds were obtained between 650 and 704°C. Polycyclic
Table 3. Gas Products from Sawdust Pyrolysisa
temperature (°C)components
retentiontime (min) 377 427 538 649 816
hydrogen 1.01 D D D D Dcarbon monoxide 1.68 D D D D Dmethane 2.09 D D D D Dcarbon dioxide 2.90 D D D D Dethylene 4.20 D D D Dacetylene 4.22 D D Dethane 5.31 D D D Dpropylene 11.86 D D D Dpropane 12.49 D D D D1,2-propadiene 13.05 D D Dmethanol 14.13 D D D D Dacetaldehyde 15.61 D D D D Dmethyl formate 17.56 D D D2-methyl-1-propene 17.95 D D1-butene 18.05 D D D1,3-butadiene 18.18 D D D2-methyl-1-propene 18.65 D D1,2-butadiene 19.26 D D2-propenal 20.69 D D D Dfuran 20.89 D D D Dpropanal 21.26 D D D Dacetone 21.51 D D D D1,1-dimethylcyclopropane 22.09 D(Z)-1,3-pentadiene 22.35 Dmethyl acetate 22.68 D D D D3-penten-1-yne 23.10 D D D1,3-cyclopentadiene 23.11 D2-methyl-1,3-butadiene 23.27 D D2-methyl-1-butene 23.47 D1,1-dimethyl-cyclopropane 23.55 D2,3-pentadiene 24.12 D2,5-dihydrofuran 24.61 D D D2-methylpropanal 24.71 D3-buten-2-one 25.35 D D D2-methylfuran 25.57 D D D D2,3-butanedione 25.65 D D D2-butanone 25.84 D D D D2-hexene 27.17 D2-butenal 27.22 D D D3,3-dimethycyclobutene 27.67 D
a D ) detectable.
Table 4. Percent Yields of Gaseous Products from Pine Sawdust Pyrolysis at Different Temperaturesa
percent yield
components 538°C 593°C 649°C 704°C 760°C 816°C
hydrogen 0.20 0.35 0.55 0.71 0.92 1.18carbon monoxide 14.40 24.70 31.73 35.14 36.85 40.68methane 2.06 3.18 5.45 6.62 6.89 7.53carbon dioxide 8.34 8.74 9.22 9.72 9.81 10.05ethylene 0.83 1.79 1.83 3.36 3.66 3.51acetylene BDL BDL BDL BDL 0.24 0.32ethane 0.40 0.78 0.59 0.61 0.38 0.17propylene 0.60 1.16 0.79 0.55 0.23 0.11propane 0.08 0.11 0.06 0.04 trace trace1-propyne 0.002 0.01 0.01 0.01 0.01 trace1,2-propadiene 0.26 0.04 0.03 0.03 0.02 0.16acetaldehyde 3.27 2.13 1.42 0.33 0.05 tracemethanol 1.26 0.99 1.00 0.66 0.31 0.111-butene 0.19 0.24 0.13 0.04 BDL BDL1,2-butadiene 0.09 0.20 0.22 0.22 0.13 0.082-butene 0.06 0.09 0.04 0.01 BDL BDL2-methyl-1-propene 0.03 0.06 0.038 0.01 BDL BDLpropanal 0.32 0.21 0.09 0.01 BDL BDLacetone 0.23 0.22 0.20 0.06 BDL BDL2-methyl-1-buten-3-yne 0.18 0.36 0.19 0.26 0.16 0.282-butenal 0.19 0.10 trace BDL BDL BDL3-buten-2-one 0.22 0.14 BDL BDL BDL BDLacetic acid ethyl ester 0.12 BDL BDL BDL BDL BDL2-methylpropanal 0.09 0.07 BDL BDL BDL BDLsum of gas products 34.74 49.31 49.94 60.48 61.86 65.29
a BDL ) below detection limit.
Pyrolysis of SeVeral Biomass Feedstocks Energy & Fuels, Vol. 21, No. 4, 20072381
aromatic products became dominant as the temperature ap-proached 704°C, while toluene, cresol, and dimethyl phenolbegan to disappear. Toluene cracks at these temperatures. Below704°C, acids and alcohols derived from nonrandom fragmenta-tion of cellulose, hemicellulose, and lignin undergo subsequentdehydration, decarboxylation, and recombination reactions,
forming toluene, cresol, dimethyl phenol, and phenol. At veryhigh temperatures, these components undergo continued dehy-dration and decarboxylation, raising the benzene yield. Associa-tive oligomerizations lead to the subsequent formation ofpolycyclic aromatic hydrocarbons, such as pyrene, fluoranthene,phenanthrene, anthracene, and fluorine.
3.3.2. Influence of the Sawdust Particle Size.Sawdust particlesof varying diameter (d < 105µm, 105µm < d < 149µm, 149µm < d < 297 µm, andd > 297 µm) were used to study the
(50) Scott, D. S.; Piskorz, J.; Bergougnou, M. A.; Graham, R.; Overend,R. P. The role of temperature in the fast pyrolysis of cellulose and wood.Ind. Eng. Chem. Res.1988, 27, 8-15.
Table 5. Percent Yields of Liquid Products and Char from Pine Sawdust Pyrolysis at Different Temperaturesa
percent yield
components 538°C 593°C 649°C 704°C 760°C 816°C
benzene 0.05 0.44 0.66 1.32 1.43 1.80toluene 0.12 0.31 0.58 0.48 0.51 0.34ethylbenzene trace 0.04 0.06 BDL BDL BDLm- andp-xylene trace 0.11 0.18 0.16 0.09 0.03styrene trace 0.11 0.28 0.40 0.31 0.28o-xylene 0.03 0.04 0.07 0.05 0.02 BDLethylmethylbenzene BDL trace 0.12 trace BDL BDLcyclopropyl benzene BDL BDL 0.04 0.01 BDL BDLphenol 0.18 0.32 0.63 0.80 0.32 0.23OC-methylstyrene BDL BDL 0.03 trace BDL BDL2-methylphenol 0.13 0.25 0.30 0.11 0.03 trace4-methylphenol 0.18 0.37 0.34 0.21 0.07 traceindene BDL 0.07 0.16 0.44 0.31 0.312,3-dimethylphenol BDL 0.02 0.03 0.02 BDL BDL2-ethylphenol BDL 0.02 0.02 BDL BDL BDL2,4-dimethylphenol 0.12 0.11 0.13 0.01 BDL BDL2,6-dimethylphenol 0.02 0.03 0.04 trace BDL BDL4-ethylphenol 0.05 0.09 0.04 0.01 BDL BDL1,2-benzenediol 0.23 0.13 trace BDL BDL BDLnaphthalene BDL 0.05 0.18 0.49 0.53 0.903-(1-methylethyl)phenol 0.01 trace BDL BDL BDL BDL2-ethyl-5-methylphenol 0.04 0.03 trace BDL BDL BDL4-methyl-1,2-benzenediol 0.04 0.01 BDL BDL BDL BDL3-methyl-1,2-benzenediol 0.17 0.04 BDL BDL BDL BDL2-(2-propenyl)phenol 0.05 0.05 trace BDL BDL BDL1-methylnaphthalene BDL 0.03 0.07 0.14 0.08 0.072-methylnaphthalene BDL 0.02 0.06 0.08 0.05 0.04biphenyl BDL BDL trace 0.03 0.04 0.041,3-dimethylnaphthalene BDL BDL 0.01 trace BDL BDLacenaphthalene BDL trace 0.04 0.14 0.15 0.22fluorene BDL trace 0.01 0.05 0.06 0.09anthracene BDL BDL trace 0.08 0.11 0.17phenathrene BDL trace 0.03 0.03 0.04 0.06fluoranthene BDL BDL trace 0.02 0.05 0.09pyrene BDL BDL trace 0.02 0.05 0.09sum of C6-C16 1.45 2.67 4.11 5.13 4.25 4.76char 17.42 14.70 14.04 12.56 11.29 10.64sum of gases 34.74 49.31 49.94 60.48 61.86 65.29total mass yield 53.61 66.68 68.09 78.17 77.39 80.70
a BDL ) below detection limit.
Table 6. Experimental Optimum Pyrolysis Temperature ThatGenerates the Maximum Yields of Major Gas-Phase Compounds
compounds
reactortemperature
(°C)
yield percentweight ofsawdust
hydrogen 816 1.18carbon monoxide 816 40.68methane 816 7.53carbon dioxide 816 10.05ethylene 816 3.51ethane 593 0.78acetylene 816 0.32propylene 593 1.16propane 593 0.11acetaldehyde 538 3.26methanol 538 1.261,2-butadiene 649 0.22butenes(sum of 1-butene and 2-butenes)
593 0.24
propanal 538 0.32acetone 538 0.23 Figure 9. Effect of the reaction temperature on the yield of CH4, H2,
CO, and CO2 during the pyrolysis of pine sawdust.
2382 Energy & Fuels, Vol. 21, No. 4, 2007 Zhang et al.
effect of the particle size on pyrolysis. The yields of H2, CO,and CH4 versus particle size are shown in Figure 15. The centersof smaller particles more rapidly reach the reactor temperaturethan those of large particles. Furthermore, smaller particles havea higher surface/ volume ratio, allowing primary pyrolysisfragments to escape more rapidly into the vapor. Thus, second-ary reactions are less favored.51 Oils or tar from primary
pyrolysis further fragments into smaller molecules, producinggases, and condense to chars in secondary reactions. It is clearfrom Figure 15 that the particle size did not have a pronouncedeffect on the yield of H2, CO, and CH4 within the size rangetested. Therefore, heat-transfer limitations did not significantlyinfluence the range of reactions occurring for the particle sizerange examined. Furthermore, the escape of volatiles was fastenough in the particle size range examined; therefore, majordifferences in the extent of secondary reactions were notobserved. For the particle size range examined through experi-ments, simulation results (Figure 5) indicate that the timerequired for the particle center to achieve the gas temperature
(51) Nunn, T. R.; Howard, J. B.; Longwell, J. P.; Peters, W. A. Productcompositions and kinetics in the rapid pyrolysis of sweet gum hardwood.Ind. Eng. Chem. Process Res. DiV. 1985, 24, 836-844.
Figure 10. Effect of the pine sawdust pyrolysis temperature on C2products.
Figure 11. Effect of the pine sawdust pyrolysis temperature on C3and C4 products.
Figure 12. Effect of the pine sawdust pyrolysis temperature onmethanol, acetaldehyde, acetone, and propanal yields.
Figure 13. Effect of the pine sawdust pyrolysis temperature onbenzene, toluene, xylene, and naphthalene yields.
Figure 14. Effect of the pine sawdust pyrolysis temperature on phenol,cresol, and dimethyl phenol yields.
Table 7. Experimental Optimum Pyrolysis Temperature That Givesthe Maximum Yields of Major Liquid Compounds
compoundstemperature
(°C)yield percent weight
of sawdust
benzene 816 1.80toluene 650 0.58xylene 704 0.65naphthalene 816 0.90phenol 704 0.66cresol 650 0.70dimethyl phenol 650 0.60
Pyrolysis of SeVeral Biomass Feedstocks Energy & Fuels, Vol. 21, No. 4, 20072383
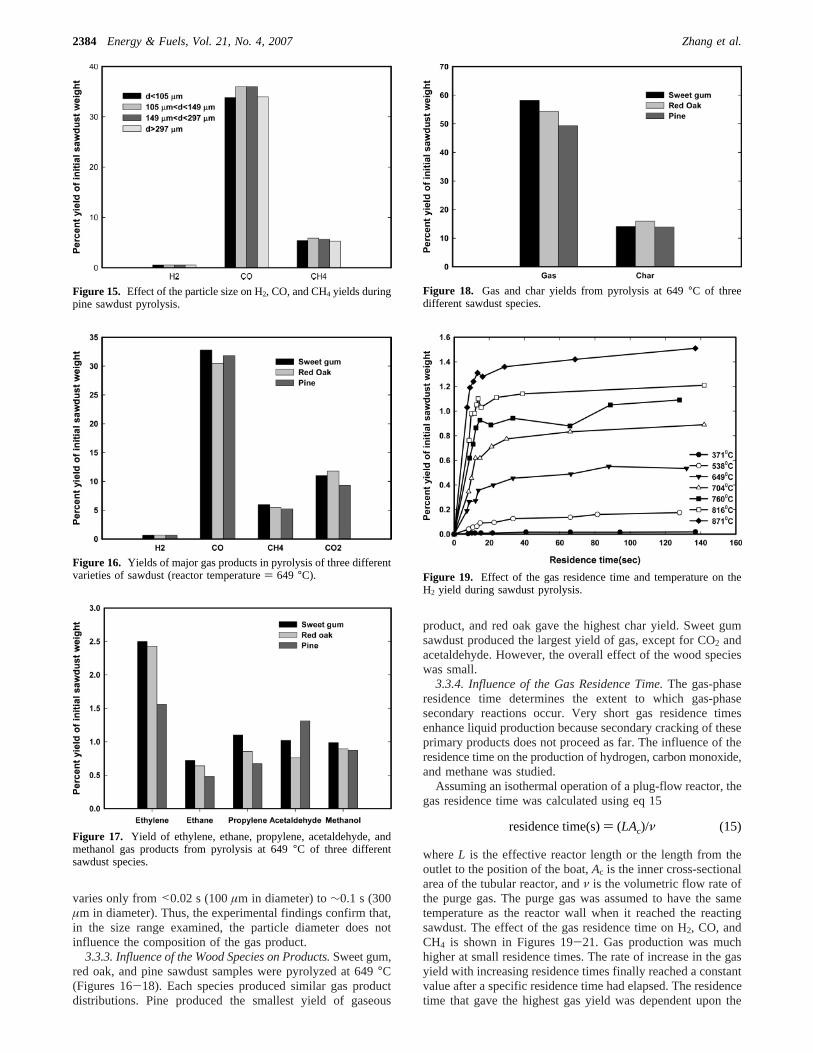
varies only from<0.02 s (100µm in diameter) to∼0.1 s (300µm in diameter). Thus, the experimental findings confirm that,in the size range examined, the particle diameter does notinfluence the composition of the gas product.
3.3.3. Influence of the Wood Species on Products.Sweet gum,red oak, and pine sawdust samples were pyrolyzed at 649°C(Figures 16-18). Each species produced similar gas productdistributions. Pine produced the smallest yield of gaseous
product, and red oak gave the highest char yield. Sweet gumsawdust produced the largest yield of gas, except for CO2 andacetaldehyde. However, the overall effect of the wood specieswas small.
3.3.4. Influence of the Gas Residence Time.The gas-phaseresidence time determines the extent to which gas-phasesecondary reactions occur. Very short gas residence timesenhance liquid production because secondary cracking of theseprimary products does not proceed as far. The influence of theresidence time on the production of hydrogen, carbon monoxide,and methane was studied.
Assuming an isothermal operation of a plug-flow reactor, thegas residence time was calculated using eq 15
whereL is the effective reactor length or the length from theoutlet to the position of the boat,Ac is the inner cross-sectionalarea of the tubular reactor, andν is the volumetric flow rate ofthe purge gas. The purge gas was assumed to have the sametemperature as the reactor wall when it reached the reactingsawdust. The effect of the gas residence time on H2, CO, andCH4 is shown in Figures 19-21. Gas production was muchhigher at small residence times. The rate of increase in the gasyield with increasing residence times finally reached a constantvalue after a specific residence time had elapsed. The residencetime that gave the highest gas yield was dependent upon the
Figure 15. Effect of the particle size on H2, CO, and CH4 yields duringpine sawdust pyrolysis.
Figure 16. Yields of major gas products in pyrolysis of three differentvarieties of sawdust (reactor temperature) 649 °C).
Figure 17. Yield of ethylene, ethane, propylene, acetaldehyde, andmethanol gas products from pyrolysis at 649°C of three differentsawdust species.
Figure 18. Gas and char yields from pyrolysis at 649°C of threedifferent sawdust species.
Figure 19. Effect of the gas residence time and temperature on theH2 yield during sawdust pyrolysis.
residence time(s)) (LAc)/ν (15)
2384 Energy & Fuels, Vol. 21, No. 4, 2007 Zhang et al.
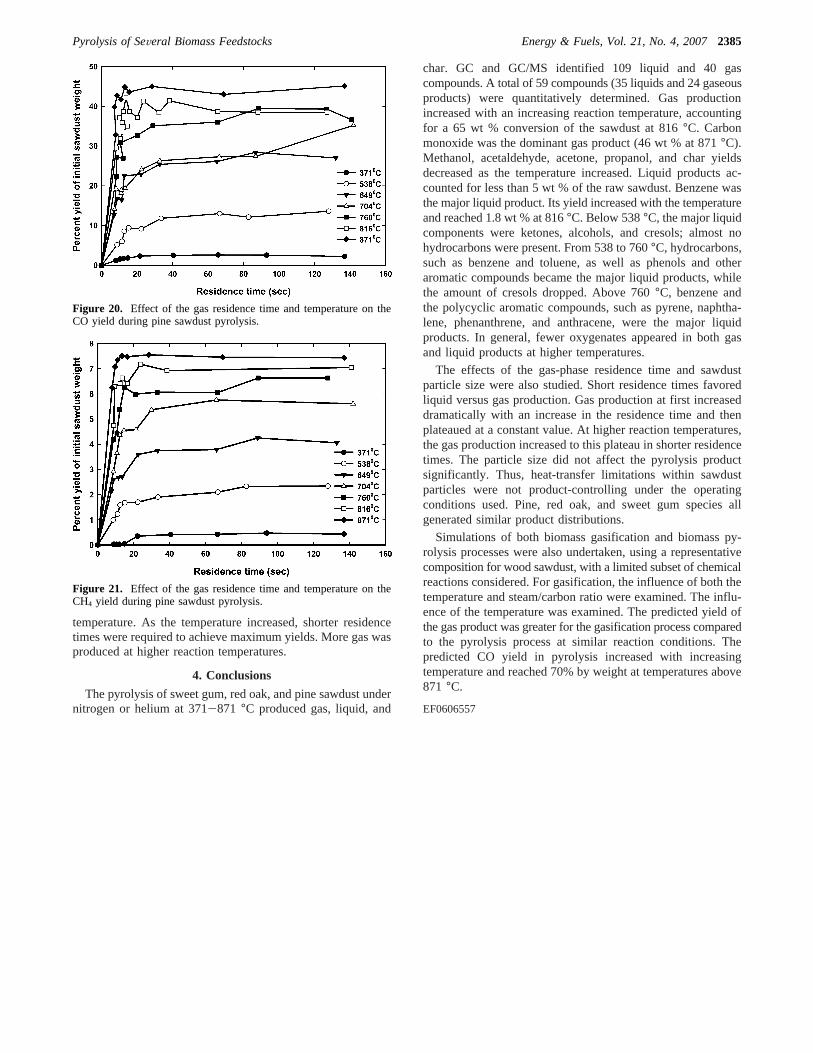
temperature. As the temperature increased, shorter residencetimes were required to achieve maximum yields. More gas wasproduced at higher reaction temperatures.
4. Conclusions
The pyrolysis of sweet gum, red oak, and pine sawdust undernitrogen or helium at 371-871 °C produced gas, liquid, and
char. GC and GC/MS identified 109 liquid and 40 gascompounds. A total of 59 compounds (35 liquids and 24 gaseousproducts) were quantitatively determined. Gas productionincreased with an increasing reaction temperature, accountingfor a 65 wt % conversion of the sawdust at 816°C. Carbonmonoxide was the dominant gas product (46 wt % at 871°C).Methanol, acetaldehyde, acetone, propanol, and char yieldsdecreased as the temperature increased. Liquid products ac-counted for less than 5 wt % of the raw sawdust. Benzene wasthe major liquid product. Its yield increased with the temperatureand reached 1.8 wt % at 816°C. Below 538°C, the major liquidcomponents were ketones, alcohols, and cresols; almost nohydrocarbons were present. From 538 to 760°C, hydrocarbons,such as benzene and toluene, as well as phenols and otheraromatic compounds became the major liquid products, whilethe amount of cresols dropped. Above 760°C, benzene andthe polycyclic aromatic compounds, such as pyrene, naphtha-lene, phenanthrene, and anthracene, were the major liquidproducts. In general, fewer oxygenates appeared in both gasand liquid products at higher temperatures.
The effects of the gas-phase residence time and sawdustparticle size were also studied. Short residence times favoredliquid versus gas production. Gas production at first increaseddramatically with an increase in the residence time and thenplateaued at a constant value. At higher reaction temperatures,the gas production increased to this plateau in shorter residencetimes. The particle size did not affect the pyrolysis productsignificantly. Thus, heat-transfer limitations within sawdustparticles were not product-controlling under the operatingconditions used. Pine, red oak, and sweet gum species allgenerated similar product distributions.
Simulations of both biomass gasification and biomass py-rolysis processes were also undertaken, using a representativecomposition for wood sawdust, with a limited subset of chemicalreactions considered. For gasification, the influence of both thetemperature and steam/carbon ratio were examined. The influ-ence of the temperature was examined. The predicted yield ofthe gas product was greater for the gasification process comparedto the pyrolysis process at similar reaction conditions. Thepredicted CO yield in pyrolysis increased with increasingtemperature and reached 70% by weight at temperatures above871 °C.
EF0606557
Figure 20. Effect of the gas residence time and temperature on theCO yield during pine sawdust pyrolysis.
Figure 21. Effect of the gas residence time and temperature on theCH4 yield during pine sawdust pyrolysis.
Pyrolysis of SeVeral Biomass Feedstocks Energy & Fuels, Vol. 21, No. 4, 20072385