product brochure: latin america online payment methods: full year 2016
TRANSCRIPT
LATIN AMERICA ONLINE PAYMENT METHODS: FULL YEAR 2016 PUBLICATION DATE: MARCH 2017
PAGE 2 GENERAL INFORMATION I PAGE 3 KEY FINDINGS I PAGE 4-5 TABLE OF CONTENTS I PAGE 6 REPORT-SPECIFIC SAMPLE
CHARTS I PAGE 7 METHODOLOGY I PAGE 8 RELATED REPORTS I PAGE 9 CLIENTS I PAGE 10-11 FREQUENTLY ASKED QUESTIONS
PAGE 12 ORDER FORM I PAGE 13 TERMS AND CONDITIONS
2
2
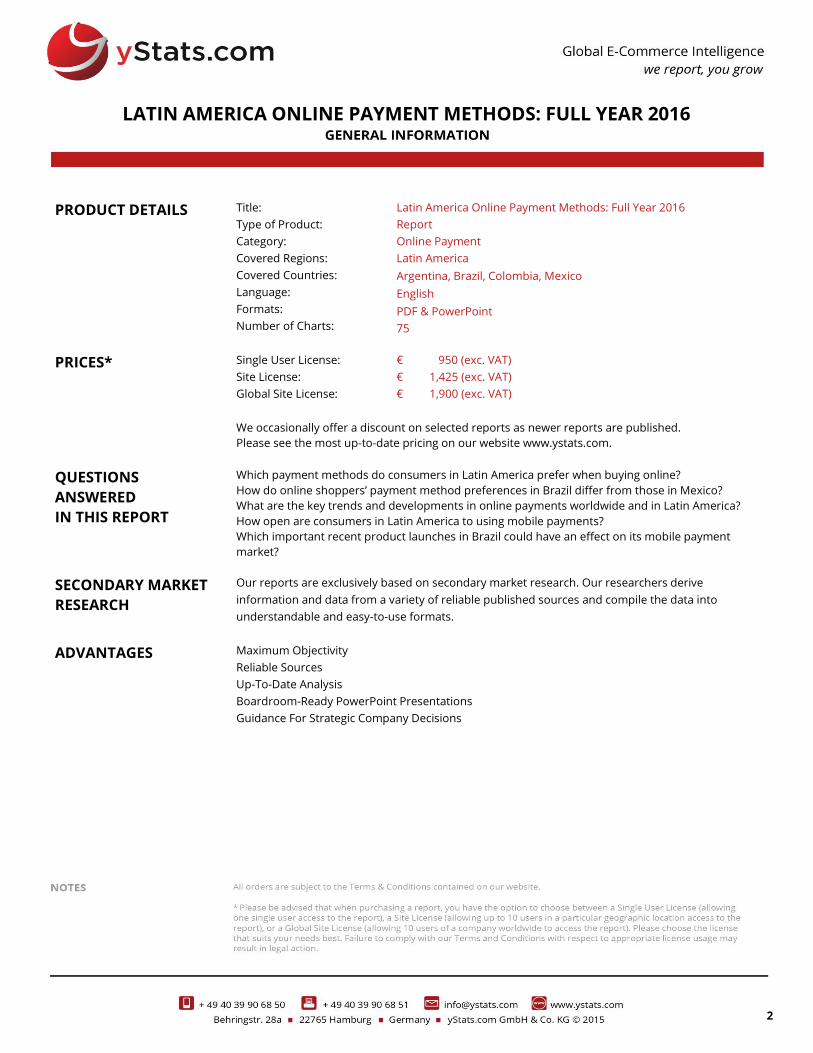
PRODUCT DETAILS Title:
Type of Product:
Category:
Covered Regions:
Covered Countries:
Language:
Formats:
Number of Charts:
Latin America Online Payment Methods: Full Year 2016
Report
Online Payment
Latin America
Argentina, Brazil, Colombia, Mexico
English
PDF & PowerPoint
75
PRICES* Single User License:
Site License:
Global Site License:
€ 950 (exc. VAT)
€ 1,425 (exc. VAT)
€ 1,900 (exc. VAT)
We occasionally offer a discount on selected reports as newer reports are published.
Please see the most up-to-date pricing on our website www.ystats.com.
QUESTIONS
ANSWERED
IN THIS REPORT
Which payment methods do consumers in Latin America prefer when buying online?
How do online shoppers’ payment method preferences in Brazil differ from those in Mexico?
What are the key trends and developments in online payments worldwide and in Latin America?
How open are consumers in Latin America to using mobile payments?
Which important recent product launches in Brazil could have an effect on its mobile payment
market?
SECONDARY MARKET
RESEARCH
Our reports are exclusively based on secondary market research. Our researchers derive
information and data from a variety of reliable published sources and compile the data into
understandable and easy-to-use formats.
ADVANTAGES Maximum Objectivity
Reliable Sources
Up-To-Date Analysis
Boardroom-Ready PowerPoint Presentations
Guidance For Strategic Company Decisions
LATIN AMERICA ONLINE PAYMENT METHODS: FULL YEAR 2016
CREDIT CARD IS THE LEADING ONLINE PAYMENT METHOD IN LATIN AMERICA
Credit card is the leading payment method used by online shoppers worldwide and
in Latin America, according to an international consumer survey cited in this new report by
yStats.com. Debit card ranks second in popularity on the regional level, followed by digital
payment systems like PayPal. Nevertheless, some important differences exist in online
shoppers’ preferences in various countries.
In Brazil, credit cards are used by nearly three-quarters of digital buyers. It is
important to note that these are mostly domestic credit cards, accounting for around half of
B2C E-Commerce sales in Brazil in 2015. Boleto Bancario ranked second in share and
international credit card was third. Credit card was also the most used online payment
method in Argentina. In both these countries, the popularity of credit card payments is
supported by the possibility of paying in installments. Online retailers in Argentina who
offer this payment option reported in 2015 that a major share of their sales was through
payment in installments.
In Mexico, online shoppers have a different preference rank. A 2016 survey cited in
yStats.com’s report indicated PayPal as the leading online payment method, followed by
debit and then credit card. Both PayPal and debit card gained several percentage points in
share of online shoppers between 2015 and 2016, while credit card lost a few. In Colombia,
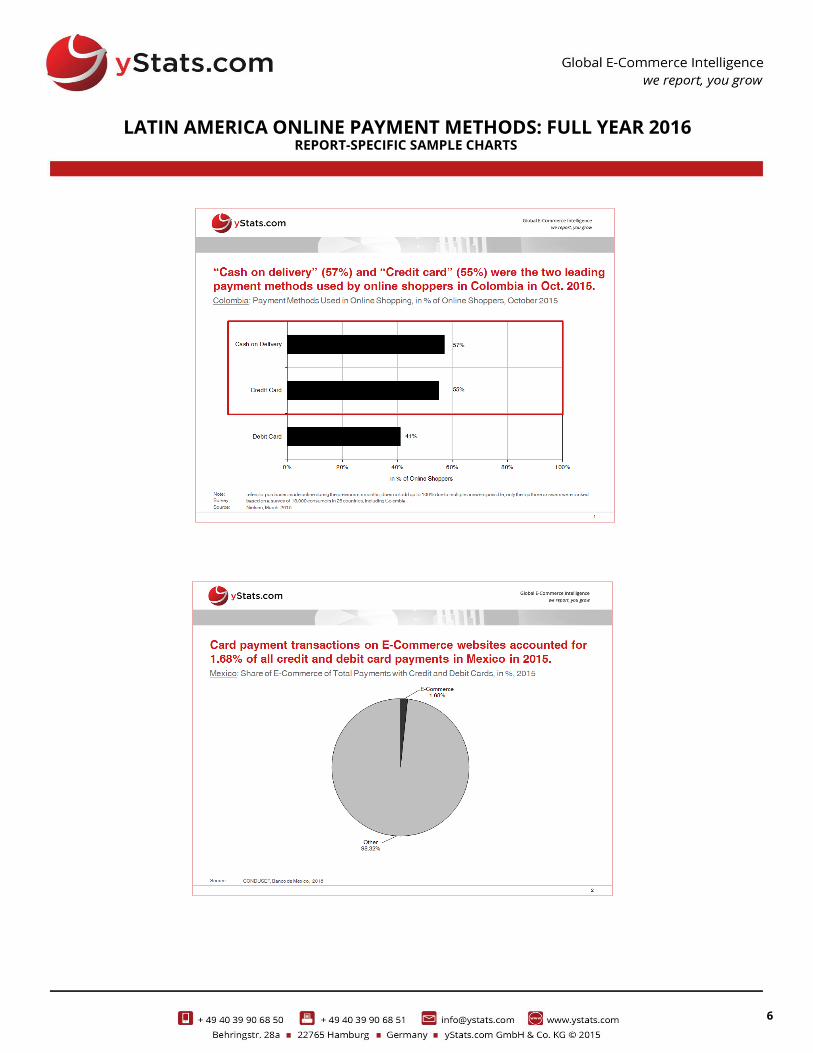
credit card is nose-to-nose with cash on delivery in a ranking of online payment methods.
Mobile payment usage in Latin America is nascent, but shows a strong potential, as
yStats.com’s report reveals. In a recent global survey of Internet users, Latin America
contributed the highest share of respondents who were looking forward to paying more via
mobile. In Brazil and Mexico, more than three-quarters of consumers were interested in
making mobile payments in-store. In 2016, Brazil was the first country in this region to roll
out Samsung Pay and Starbuck’s mobile payment service.
LATIN AMERICA ONLINE PAYMENT METHODS: FULL YEAR 2016
3
MANAGEMENT SUMMARY
GLOBAL DEVELOPMENTS
Online and Mobile Payment Trends, H2 2016
Breakdown of E-Commerce Sales by Payment Methods, in %, 2015 & 2020f
Payment Methods Used in Online Shopping, in % of Online Shoppers, October 2015
Payment Methods Used in Online Shopping, by Regions, in % of Online Shoppers, October 2015
Top 3 Payment Methods Preferred in Cross-Border Online Shopping, in % of Cross-Border Online Shoppers, August
2016
Top 3 Considerations When Choosing a Payment Method in Cross-Border Online Shopping, in % of Cross-Border
Online Shoppers, August 2016
Reasons To Choose the Preferred Payment Method in Cross-Border Online Shopping, in % of Cross-Border Online
Shoppers, 2016
Value of Online Payment Fraud, in USD billion, 2015 & 2020f
Breakdown of Online Payment Fraud by Segments, in % and in USD billion, 2020f
Security Authentication Features That Online Shoppers in the USA and the UK Would Consider Setting Up for Online
Purchases in the Next 12 Months, in %, November 2016
Breakdown of the Number of Online Payment Options Offered, in % of Online Merchants, January 2016
Top 10 Merchant Acquirers, by Volume, in USD billion, 2015
Mobile Payments Share of Total Consumer Card Payments, in %, 2016e & 2021f
Breakdown of Mobile Payments by Usage Case, by Europe and North America, 2016e
Mobile Proximity Payment Transaction Value, in USD billion, 2014 & 2019f
Number of Proximity Mobile Payment Users, in millions, 2014 – 2019f
Mobile P2P Money Transfer Transaction Value, in USD billion, 2014 & 2019f
Number of Mobile P2P Money Transfer Users, in millions, 2014 – 2019f
Mobile and Wearable Contactless Payments, in USD billion, 2015 & 2018f
Mobile Payment Usage In-Store and Online, in % of Respondents, by Generation, 2015
Perception of Security of Mobile Payments, in % of Respondents, by Generations, 2015
Share of Internet Users Who Look Forward to Being Able to Pay for More Transactions from Mobile Device, in %, by
Asia-Pacific, Europe, Latin America, the USA, and Global Average, August 2016
Contactless Payment User Penetration, in % of Banked Population, July 2016
Payment Methods Used in Mobile Shopping, in % of Mobile Shoppers, by Selected Regions, August 2016
Products and Services Paid for via Mobile Wallet, in % of Mobile Shoppers Who Paid with Mobile Wallet, August 2016
Share of Mobile Shoppers Paying with Mobile Wallets, by Selected Countries, in %, August 2016
Probability of Using Mobile Wallets, in % of Smartphone Owners, by Selected Countries, July 2016
Number of Mobile Money Accounts, by Registered and Active, by Selected Regions, in millions, December 2015
Breakdown of Types of Payments Made with Mobile Money, by Number of Transactions and Value of Transactions,
in %, December 2015
LATIN AMERICA
3.1. REGIONAL
Payment Methods Used in Online Shopping, in % of Online Shoppers With Bank Account, July 2016
Penetration and Usage of Contactless Cards and Mobile Payment, in % of Consumers With Bank Account, July 2016
2
LATIN AMERICA ONLINE PAYMENT METHODS: FULL YEAR 2016 TABLE OF CONTENTS (1 OF 2)
4
1
3
5
5
LATIN AMERICA (CONT.)
3.1. REGIONAL (CONT.)
Share of Consumers Interested in In-Store Mobile Payments, in % of Surveyed Consumers, by Brazil and Mexico,
June 2016
Top 5 Mobile Services That Have Never Been Used by Mobile Internet Users, incl. Payment-Related, in % of Mobile
Internet Users, 2015
3.2. BRAZIL
Online and Mobile Payment Trends and News About Players, H1 2016
Online and Mobile Payment Trends and News About Players, H2 2016
Breakdown of B2C E-Commerce Sales by Payment Methods, in %, 2015
Breakdown of Payment Methods Used in Online Shopping, in % of Online Shoppers, 2015
Breakdown of Online Shoppers’ Preference for Payment in Installments, in %, H1 2016
3.3. MEXICO
Payment Methods Used in Online Shopping, in % of Online Shoppers, 2015
Top 10 Payment Methods Used in Online Shopping, in % of Online Shoppers, 2015 & 2016
Online Payment Methods Used in Online Shopping, by Device Used, in % of Online Shoppers, August 2016
Offline Payment Methods Used in Online Shopping, by Device Used, in % of Online Shoppers, August 2016
Reasons for Not Storing Credit/Debit Card Information With Online Shops, in % of Online Shoppers, 2015 & 2016
Share of E-Commerce of Total Payments with Credit and Debit Cards, in %, 2015
Breakdown of E-Commerce Card Payment Transactions by Credit Card and Debit Card, in %, 2015
Number of Authorized Payment Transactions on E-Commerce Websites, in millions, Value, in MXN billion, and
Authorization Rate, in % of Transactions and in % of Transaction Value, by Credit Cards and Debit Cards, Q1 2015 –
Q3 2016
Chargeback Rate, in % of Number of Authorized Payment Transactions on E-Commerce Websites and in % of Their
Value, by Credit Cards and Debit Cards, Q1 2015 – Q3 2016
Number of Online Payment Users, in millions, 2014 & 2015
Types of Products and Services Paid for Online, in % of Online Payment Users, 2011 - 2015
Reasons for Not Shopping Online, incl. Payment-Related, in % of Internet Users Who Do Not Shop Online, 2015
Share of Banked Internet Users Who Conduct Banking Transactions on Smartphones, in %, 2015
3.4. ARGENTINA
Breakdown of E-Commerce Sales by Payment Method, in %, 2015
Share of Installments in Total E-Commerce Sales of Companies That Offer Payment by Installments, in %, and
Breakdown of Number of Installment Payments, in %, 2015
3.5. COLOMBIA
Payment Methods Used in Online Shopping, in % of Online Shoppers, October 2015
Share of Online Shoppers Preferring to Pay by Credit Card, in %, June 2016
Breakdown of Online Payment Made Through Payment Gateways by Credit Cards, Debit to Bank Account and
Others, 2014 & 2015
LATIN AMERICA ONLINE PAYMENT METHODS: FULL YEAR 2016
TABLE OF CONTENTS (2 OF 2)
3
6
6
LATIN AMERICA ONLINE PAYMENT METHODS: FULL YEAR 2016
REPORT-SPECIFIC SAMPLE CHARTS
GENERAL METHODOLOGY OF OUR MARKET REPORTS Secondary Market Research
The reports are compiled based on secondary market research.
Secondary research is information gathered from previously published
sources. Our reports are solely based on information and data acquired
from national and international statistical offices, industry and trade
associations, business reports, business and company databases,
journals, company registries, news portals and many other reliable
sources. By using various sources we ensure maximum objectivity for all
obtained data. As a result, companies gain a precise and unbiased
impression of the market situation.
Cross referencing of data is conducted in order to ensure
validity and reliability.
The source of information and its release date are provided on
every chart. It is possible that the information contained in one chart is
derived from several sources. If this is the case, all sources are mentioned
on the chart.
The reports include mainly data from the last 12 months prior
to the date of report publication. Exact publication dates are mentioned in
every chart.
Definitions
The reports take into account a broad definition of B2C E-
Commerce, which might include mobile commerce. As definitions may
vary among sources, exact definition used by the source (if available) is
included at the bottom of the chart.
Chart Types
Our reports include text charts, pie charts, bar charts, rankings,
line graphs and tables. Every chart contains an Action Title, which
summarizes the main idea/finding of the chart and a Subtitle, which
provides necessary information about the country, the topic, units or
measures of currency, and the applicable time period(s) to which the data
refers. With respect to rankings, it is possible that the summation of all
categories amounts to more than 100%. In this case, multiple answers were
possible, which is noted at the bottom of the chart.
Report Structure
Reports are comprised of the following elements, in the following
order: Cover page, preface, legal notice, methodology, definitions, table of
contents, management summary (summarizing main information
contained in each section of report) and report content (divided into
sections and chapters). When available, we also include forecasts in our
report content. These forecasts are not our own; they are published by
reliable sources. Within Global and Regional reports, we include all major
developed and emerging markets, ranked in order of importance by using
evaluative criteria such as sales figures.
Notes and Currency Values
If available, additional information about the data collection, for
example the time of survey and number of people surveyed, is provided in
the form of a note. In some cases, the note (also) contains additional
information needed to fully understand the contents of the respective data.
When providing information about amounts of money, local
currencies are most often used. When referencing currency values in the
Action Title, the EUR values are also provided in brackets. The conversions
are always made using the average currency exchange rate for the
respective time period. Should the currency figure be in the future, the
average exchange rate of the past 12 months is used.
METHODOLOGY OF OUR LATIN AMERICA ONLINE PAYMENT METHODS: FULL YEAR 2016
Report Coverage
This report covers the online payment market in Latin America.
It takes into account a wide definition of online payment, including
payment methods used in online shopping and mobile payment, such as
remote and proximity payments.
The report includes data mostly published in 2016. The exact
date of publication of the source is stated on each chart. The time period
which the data refers to differs by source.
Report Structure
The global chapter opens the report, featuring an overview of
global online and mobile payment developments.
Next, information about regional development and country
comparisons are included.
The rest of the report contains country-specific information. The
countries in the region are presented in the descending order of B2C E-
Commerce sales.
Depending on data availability, the following types of market
information are included: payment methods most used by online shoppers,
breakdown of E-Commerce sales by payment methods, number and value
of online/mobile payment transactions, mobile payment usage and
consumer awareness of mobile payment providers. Not all the mentioned
types of information are available for each of the covered countries.
For the leading country in the region, also online and mobile
payment trends and news about major players, such as payment providers,
banks and retailers are presented on text charts.
LATIN AMERICA ONLINE PAYMENT METHODS: FULL YEAR 2016
7
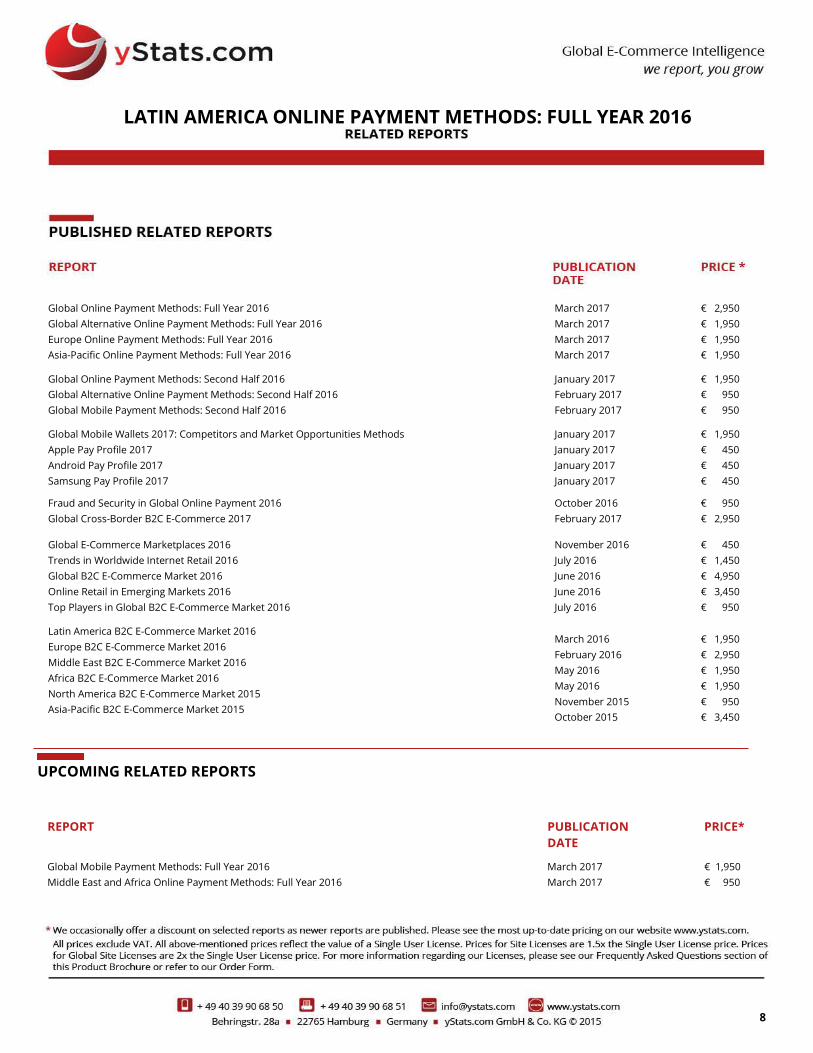
Global Online Payment Methods: Full Year 2016
Global Alternative Online Payment Methods: Full Year 2016
Europe Online Payment Methods: Full Year 2016
Asia-Pacific Online Payment Methods: Full Year 2016
Global Online Payment Methods: Second Half 2016
Global Alternative Online Payment Methods: Second Half 2016
Global Mobile Payment Methods: Second Half 2016
Global Mobile Wallets 2017: Competitors and Market Opportunities Methods
Apple Pay Profile 2017
Android Pay Profile 2017
Samsung Pay Profile 2017
March 2017
March 2017
March 2017
March 2017
January 2017
February 2017
February 2017
January 2017
January 2017
January 2017
January 2017
€ 2,950
€ 1,950
€ 1,950
€ 1,950
€ 1,950
€ 950
€ 950
€ 1,950
€ 450
€ 450
€ 450
Fraud and Security in Global Online Payment 2016
Global Cross-Border B2C E-Commerce 2017
Global E-Commerce Marketplaces 2016
Trends in Worldwide Internet Retail 2016
Global B2C E-Commerce Market 2016
Online Retail in Emerging Markets 2016
Top Players in Global B2C E-Commerce Market 2016
October 2016
February 2017
November 2016
July 2016
June 2016
June 2016
July 2016
€ 950
€ 2,950
€ 450
€ 1,450
€ 4,950
€ 3,450
€ 950
Latin America B2C E-Commerce Market 2016
Europe B2C E-Commerce Market 2016
Middle East B2C E-Commerce Market 2016
Africa B2C E-Commerce Market 2016
North America B2C E-Commerce Market 2015
Asia-Pacific B2C E-Commerce Market 2015
March 2016
February 2016
May 2016
May 2016
November 2015
October 2015
€ 1,950
€ 2,950
€ 1,950
€ 1,950
€ 950
€ 3,450
UPCOMING RELATED REPORTS
REPORT PUBLICATION
DATE
PRICE*
Global Mobile Payment Methods: Full Year 2016
Middle East and Africa Online Payment Methods: Full Year 2016
March 2017
March 2017
€ 1,950
€ 950
LATIN AMERICA ONLINE PAYMENT METHODS: FULL YEAR 2016
8

9
10
11
12
13