product characterisation towards personalisationproduct characterisation towards personalisation...
TRANSCRIPT
Product Characterisation towards PersonalisationLearning Attributes from Unstructured Data to Recommend Fashion Products
Ângelo Cardoso∗ISR, IST, Universidade de Lisboa
Lisbon, [email protected]
Fabio DaolioASOS.comLondon, UK
Saúl VargasASOS.comLondon, UK
ABSTRACTIn this paper, we describe a solution to tackle a common set of chal-lenges in e-commerce, which arise from the fact that new productsare continually being added to the catalogue. The challenges in-volve properly personalising the customer experience, forecastingdemand and planning the product range. We argue that the founda-tional piece to solve all of these problems is having consistent anddetailed information about each product, information that is rarelyavailable or consistent given the multitude of suppliers and typesof products. We describe in detail the architecture and method-ology implemented at ASOS, one of the world’s largest fashione-commerce retailers, to tackle this problem. We then show howthis quantitative understanding of the products can be leveragedto improve recommendations in a hybrid recommender systemapproach.
CCS CONCEPTS• Information systems→ Recommender systems; • Computingmethodologies→ Learning to rank; Supervised learning by classifi-cation;Multi-task learning; Neural networks; •Applied computing→ Online shopping;
KEYWORDSMulti-Modal, Multi-Task, Multi-Label Classification, Deep NeuralNetworks, Weight-Sharing, Missing Labels, Fashion e-commerce,Hybrid Recommender System, Asymmetric Factorisation
1 INTRODUCTIONASOS is a global e-commerce company that creates and curatesclothing and beauty products for fashion-loving 20-somethings. Allof the company’s sales are originated online via mobile apps andcountry-specific websites. ASOS’s websites attracted 174 millionvisits during December 2017 (December 2016: 139 million) and asat 31 December 2017 it had 16.0 million active customers.
At any moment in time, ASOS’s catalogue can offer around 85Kproducts to its customers, with around 5K new propositions beingintroduced every week across its platforms. Over the years, thisamounts to more than one million unique styles, that is, withoutaccounting for size variants. For each of these products, different di-visions within the company produce and consume different productattributes, most of which are not even customer-facing and, hence,are not always present and consistent. However, these incompleteattributes still carry information that is relevant to the business.
The ability to have a systematic and quantitative characterisationof each of these products, particularly the yet-to-be-released ones,
∗work developed while at ASOS.com
is key for the company to make data-driven decisions across a setof problems including personalisation, demand forecasting, rangeplanning and logistics. In this paper, we show how we predict acoherent and complete set of product attributes and illustrate howthis enables us to personalise the customer experience by providingmore relevant products to customers.
To achieve a coherent characterisation of all products, we lever-age manually annotated attributes that only cover part of the prod-uct catalogue as illustrated in Figure 1. As data that is consistentlyavailable for all products, we have a set of images, a text descriptionas well as product type and brand, as shown in Figure 2.
Aiming to show how customer experience can be improved byenriching product/content data, this paper contributes:
(1) the description of a real use case where augmenting productinformation enables better personalisation;
(2) a system for consolidating product attributes that deals withmissing labels in a multi-task setting and at scale;
(3) a hybrid recommender system approach using vector com-position of content-based and collaborative components.
The key features of the product annotation pipeline are:
• shared model – a neural network where most of layers areshared across the tasks (i.e. the attributes) to leverage re-lationship between the tasks as well as to reduce the totalnumber of free parameters;
• training algorithm – a custom model fitting procedure toachieve a balanced solution across all tasks and to deal withpartially-labelled data.
The main aspects of the hybrid recommender system are:
• model composition – the hybrid model is a vector composi-tion of a collaborative and content-based models;
• simultaneous optimisation – we optimise the two compo-nents of the hybrid model simultaneously.
The remainder of the paper is organised as follows: Section 2presents the product attribute prediction pipeline and related liter-ature, Section 3 illustrates how product information can improverecommendations and related literature, Section 4 presents a dis-cussion.
2 PREDICTING ATTRIBUTESTo quote Niels Bohr, “prediction is very difficult, especially if itis about the future”. In our case, it is rather about the past andthe present (product data), but it remains a non-trivial affair. Inthis section, we present the challenges we face, the approaches weconsider, and we give an overview of the current results.
1
arX
iv:1
803.
0767
9v1
[st
at.M
L]
20
Mar
201
8
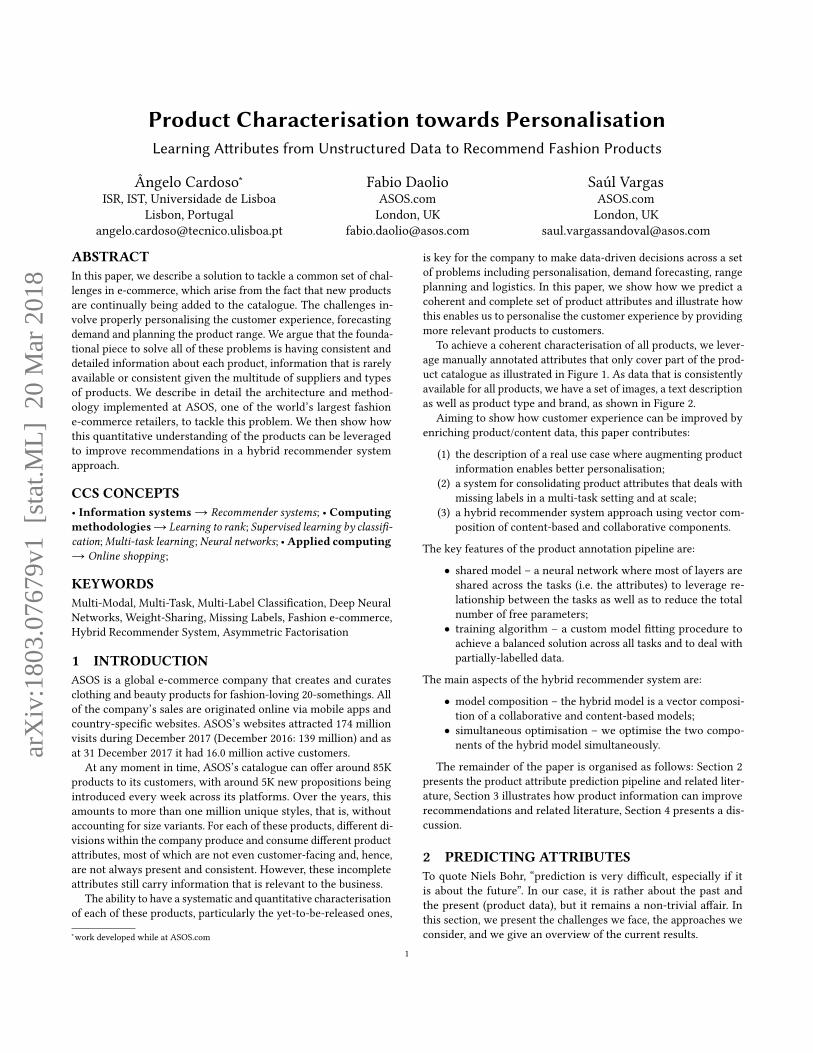
product type segment pattern ...
A dress ? floral ?B dress girly girl ? ...C skirt ? check ?... ... ... ... ...
Figure 1: Illustrative representation of the problemwith theoriginal product data – most products have part of the at-tributes missing and almost no products have all the at-tributes available.
2.1 MotivationThe fact that different divisions within the company produce andconsume different product attributes presents particular challengesregarding the coverage and consistency of this information.
Retail, for instance, uses specific “personas” to represent the corecustomer groups it targets. These are pre-defined characters thatepitomise a particular fashion taste or style, often in associationwith particular brands. The retail persona, or customer segment,despite its name, is implemented as a product attribute: a dressmay identify a ‘girly girl’ persona, or rather a ‘glam girl’, and soon. If this information, whenever applicable, were available forall the products customers interact with, that would allow for abetter understanding of the customers’ behaviour and preferences.It would provide actionable insight into how to improve customers’experience by providing the most relevant products to match thecustomers’ unique taste. Unfortunately, if we take the category ofdresses as a representative example, the customer segment is miss-ing across 75% of the catalogue history. Moreover, the segment’staxonomy changes over time in accordance with fashion trends.
Likewise, even more straightforward product aspects, such asthe design pattern, are often missing: 70% of all dresses carry anempty pattern label. That keeps us from being able to analyse orforecast the sales performance of ‘floral’ dresses for instance or toexplicitly recommend dresses with ‘animal’ prints, etc. In addition,any model that requires multiple attributes at a time would havevery few input samples to learn from, since, even within the samecategory, different products might be missing values for differentattributes. For example, design pattern and customer segment arejointly available only on about 5% of all dresses. Figure 1 providesan illustration of the situation, which essentially applies to all theproduct attributes that are not customer-facing.
In order to enable more in-depth analytics and better data prod-ucts such as content-based and hybrid product recommendations —which will be discussed in Section 3 — it is then necessary to con-solidate the available product data by filling in the missing attributevalues. To this end, we implemented a multi-task multi-modal neu-ral network to leverage all the unstructured information that isavailable on product pages: namely, product images, product name,brand, and description, as illustrated in Figure 2. Our methodologyis detailed in the following sections.
2.2 DesignWe illustrate next the design choices we made to be able to predictproduct attributes at scale from partially-labelled samples.
2.2.1 Image Classification. Fashion is a very visual domain and,with the popularity of Deep Learning, there already exist in theliterature several approaches to classify and predict clothing at-tributes from images, both from models trained end-to-end or fromintermediate representations: e.g. [7, 18, 23]. Our setup is peculiaras, along with images, we have textual information to leverage andwe need to be able to do so at scale. Therefore, image processingbecomes part of a bigger pipeline where visual features extractedfrom products’ shots are precomputed and stored, in order to speedup the training of the attribute prediction model, but also in orderfor said features to be readily available for other applications.
The visual feature generation step is an example of representationlearning; to this end, we apply a VGG16 [24] Convolutional NeuralNetwork with weights pre-trained on ImageNet. Although not anymore state-of-the-art in classification, this architecture is still widelyapplied to the related tasks of object detection, image segmenta-tion and retrieval due to the transferability of its convolutionalfeatures [30]. For each product shot, we extract the 7 × 7 × 512 rawfeatures from the last convolution layer before the fully-connectedones and perform a global max-pooling operation on those. Thisresults in 512 visual features for each product shot: each image isthereby projected onto a so-called embedding space.
2.2.2 Text Classification. Convolutional neural networks (CNN)have proved to be effective at classifying not only images but alsotext [10]. Indeed, sentences can be treated as word sequences, whereeach word in turn can be represented as a vector in a multidimen-sional word embedding space. A 1-D convolution over this represen-tation, with filters covering multiple word embeddings at a time,is an efficient way to take word order into consideration [8]. Fol-lowing [10], we experimented with both fixed, i.e. pre-trained em-beddings and free, randomly initialised ones; the latter performedsignificantly better in our case. We also made sure that the chosenarchitecture had an advantage over a well-tuned linear classifierover normalised bag-of-words (TF-IDF), which provides a strongbaseline since words in the product description often contain —ordirectly relate to— the target attribute value.
The central branch of the diagram in Figure 3 depicts our textprocessing pipeline: a simple 1D convolution over the word embed-ding layer, followed by a max-over-time pooling of convolutionalfeatures, and a fully-connected layer. In fact, since our productcaptions are often short (e.g., 50 words or less), we did not needany custom pooling layer despite the multi-label nature of ourproblem [16]. In order to build enough capacity to be able to learnmultiple attributes at a time, we just increased the number of filtersand the number of neurons in the convolutional and in the denselayer, respectively [31].
2.2.3 Multi-modal Fusion. Merging the visual features of an im-age with the semantic information extracted from the text accompa-nying said image, has already proved helpful in object recognitiontasks [6], especially when the number of object classes is largeor fine-grained information is hard to gather from images alone.Regarding applications to fashion in particular, there exist multi-modal approaches to sales forecasting [3], product detection [21],and search [13].
Zahavy et al. [29] solve a closely-related problem, product classi-fication in a large e-commerce; they use an image CNN, a text CNN,
2
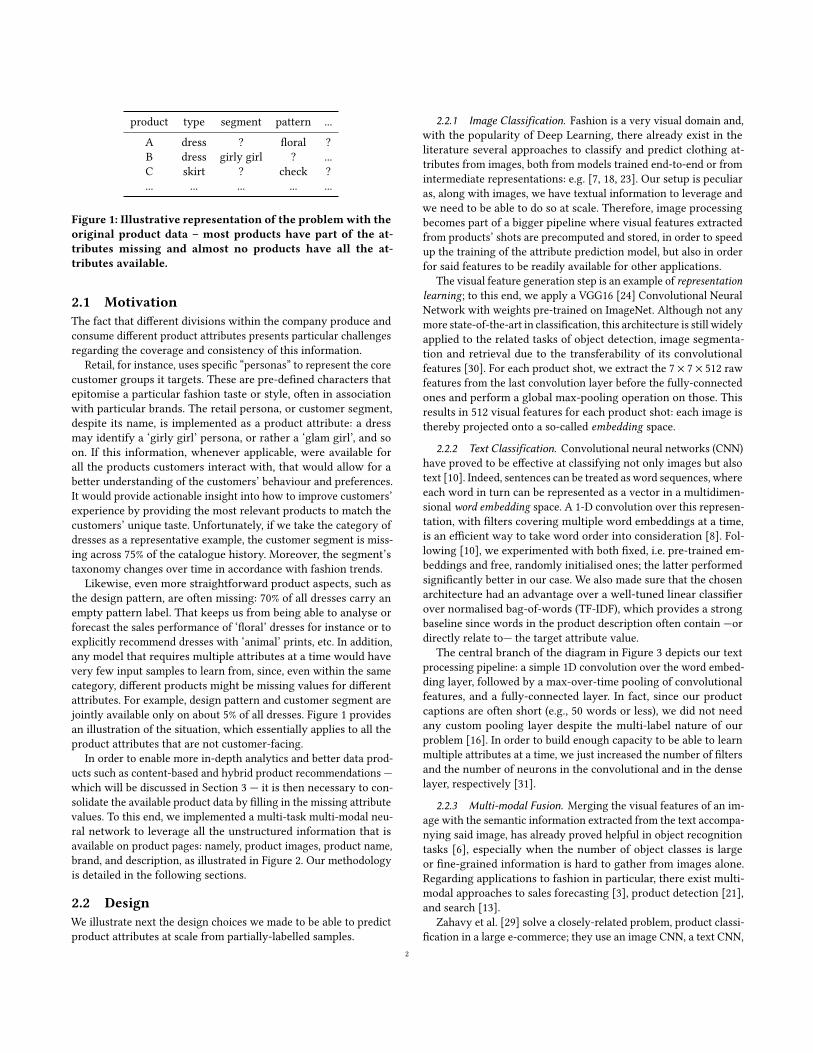
(a) Input images
ASOS Mini Tea Dress In Yellow Floral PrintDress by ASOS Collection• Floral print fabric• Crew neck• Button-keyhole back• Fit-and-flare style• Regular fit - true to size• Machine wash• 94% Viscose, 6% Elastane• Our model wears a UK 8/EU 36/US 4 and is176 cm/5’9.5" tall
New Look Oversized Dropped ShoulderSweatshirt In EcruSweatshirt by New Look• Loop-back sweat• Crew neck• Dropped shoulders• Ribbed trims• Step hem• Oversized fit - falls generously over the body• 80% Cotton, 20% Polyester• Our model wears a size Medium and is 188cm/6’2" tall
(b) Input text
DRESS TYPE casual dressesPATTERN floralBACK TO SCHOOL/COLLEGE noCUSTOMER SEGMENT girly girlUSE/OCCASION day casualSTYLE tea dressesSEASONAL EVENT high summerRANGE main collectionPRICE RANGE high streetCATEGORY day dresses - jersey printLENGTH mini...
PRODUCT LENGTH longlinePATTERN plainBACK TO SCHOOL/COLLEGE noCUSTOMER SEGMENT street luxSTYLE sweatshirtsSEASONAL EVENT cold weatherRANGE main collectionPRICE RANGE high streetPRODUCT FIT oversizedNECKLINE crewSLEEVE LENGTH long sleeve...
(c) Attributes output
Figure 2: Example instances with their associated (a) product images and (b) product details, as they appear on product pages.Using these inputs together with a product’s type, brand and division, the network predicts a set of product attributes (c).
and investigate possible fusion policies tomerge the respective CNNoutputs. Our solution, besides having to deal with partially anno-tated labels, as will be discussed in the next section, also consumesadditional product metadata (product type, brand, and division),and merges the encodings from all these inputs via the architecturedepicted in Figure 3. In particular, the product type information isused both when merging pre-computed image embeddings, sincefull-body shots contain multiple products, and when merging thevisual features with the semantic information (product title anddescription) processed by the text CNN, along with brand and di-vision embeddings that are trained end-to-end. Notably differentfrom [29], is the structure of the output layers as discussed next.
2.2.4 Multi-Task learning withMissing Labels. Themost straight-forward solution to the multi-label scenario would be to one-hotencode and concatenate all target labels into a single output, thentrain a network with binary cross-entropy as a loss function andsigmoid activation in its last layer [16, 29]. However, this approachwould treat all classes across all labels as being mutually indepen-dent, whereas in reality each target attribute only takes a subset ofall possible target values. In related work for multi-label image clas-sification and annotation, state-of-the-art approaches aim to alsomodel these labels dependencies, for instance by stacking a CNNwith a recurrent layer (RNN) that processes the labels predicted bythe CNN [26]. Nevertheless, the prominence of missing labels in ourtraining data would require implementing a custom loss function
or masking layers in order to avoid propagating errors when a labelis not available. For this reason, we opted for a simpler multi-taskapproach [19], which still allows for a degree of label hierarchybecause it matches each target attribute with a cross-entropy loss,whereby the predicted class is chosen amongst the possible valuesfor that attribute only. That is, each target becomes a separate, im-balanced, multi-class problem. Hence, we can implement customweighting schemes for the loss of the different targets dependingon the labels frequencies of the specific attribute [14].
A multi-task network provides us with an effective way to learnfrom all the products for which at least one of the target attributeshas been labelled, thereby performing implicit data augmentation,and also implicit regularisation since simultaneously fittingmultipletargets should favour a more general internal representation [22].Conversely, even disregarding the added complexity of having tomaintain multiple models in production, single-task networks forindividual attributes could only leverage a fraction of the data (seeTable 1, second column), with a higher risk of overfitting. Evenworse, as previously discussed, a single-task multi-label modelwould just not have enough training data without a clever way todeal with missing labels.
In practice, as illustrated by Figure 3, we build one model perattribute, but they all share the same parameters up to the outputlayer, following the ‘hard’ parameter-sharing paradigm [19, 22]. Wealso prepare one dataset per attribute. During training, in a randomsequential order, we update each model with a gradient descent
3
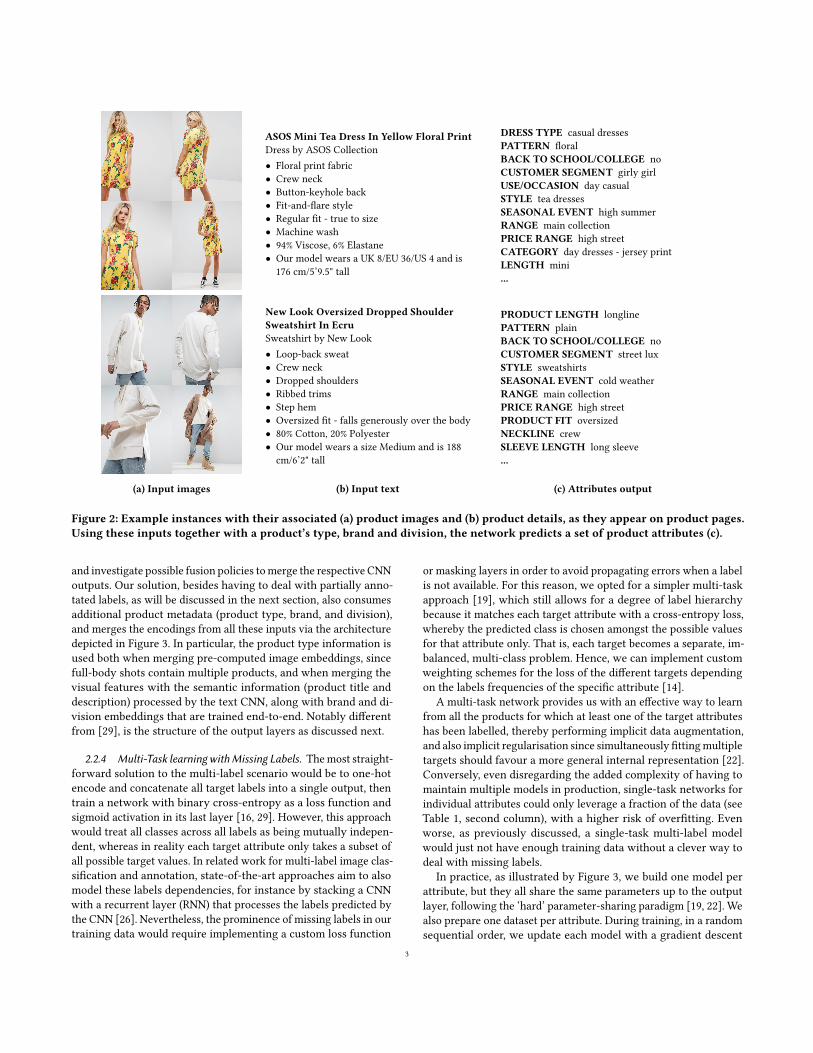
Sharedlayers
Task-specificlayers
Input: img1(-,512)
Concatenate( -, 2366 )
Input: img2(-,512)Input: img3
(-,512)Input: img 4
( -, 512 )Input: type( -, 318 )
Dense+BN( -, 1024 )
Input: text( -, 50 )
Embedding( -, 50, 64 )
Conv1D+BN( -, 48, 2048 )
MaxPool1D( -, 2048 )
Dense+BN( -, 1024 )
Input: brand( -, 1 )
Embedding( -, 1, 32 )
Input: div( -, 1 )
Embedding( -, 1, 2 )
Concatenate( -, 2400 )
Flatten( -, 32 )
Flatten( -, 2 )
Dense+BN( -, 8192 )
Softmax out( -, 22 ) … … …
Figure 3: Multi-modal multi-task architecture. In grey theinputs to the network, in blue the hidden layers and in redthe output layers (one per task, i.e., attribute). In parenthesis,the output size of each layer, which reflects the input encod-ing for input layers, the embedding dimensionality for em-bedding layers, and the number of filters and neurons forconvolutional and dense layers, respectively.
step on a randomly sampled mini-batch from its correspondingdataset. The hard sharing implies that each stochastic gradientdescent (SGD) step also updates the common layers’ parameters; asmall learning rate and the randomised update order ensure thattraining is stable.
As a matter of fact, preliminary experiments produced instabilitywhen using adaptive optimisers with momentum [11]; namely,validation set accuracy seemed to stall faster and to oscillate moreacross the various models. There is empirical evidence that adaptivemethods might yield solutions that generalise worse than thosefrom simple SGD with momentum [28]. However, it is not clearwhether that applies to a multi-task setting with parameter sharing.In our case, the simple addition of momentum to SGD seemed toalready hurt training performance. Hence, we eventually resorted tousing vanilla SGD with a constant learning rate and no momentum.
2.3 Experimental SetupWe collected data for all products ever available on any of ourplatforms up to September 2017, which had a product type, fourimage shots and a text description available, resulting in about883K samples. The problem inputs and outputs are illustrated inFigure 2. For each of these products, we also collected all manuallyannotated attributes that contained missing values, as illustratedin Figure 1. Although not all attributes might apply to all producttypes, coverage can be low (see Table 1, column #samples). Themanual annotations in historical data do not always come with afixed taxonomy, are not always curated and in some cases mightcontain incorrect labels. To construct a ground-truth, we use a setof heuristics to determine which attributes apply to which product
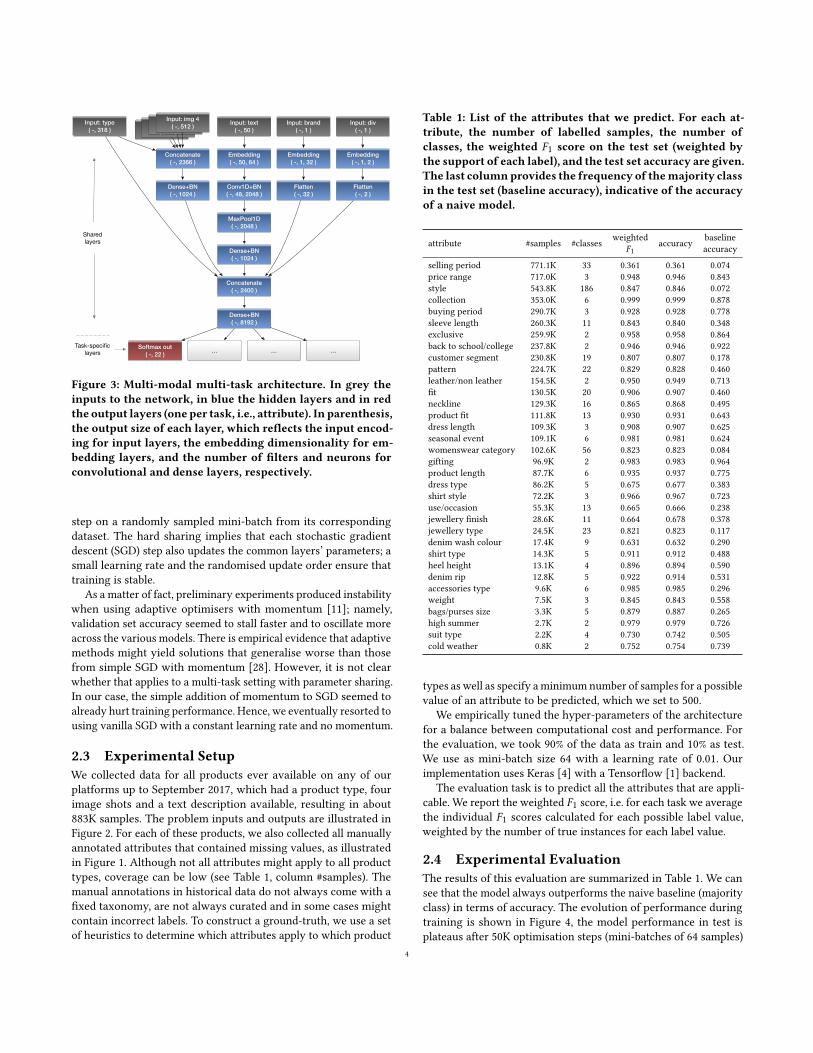
Table 1: List of the attributes that we predict. For each at-tribute, the number of labelled samples, the number ofclasses, the weighted F1 score on the test set (weighted bythe support of each label), and the test set accuracy are given.The last columnprovides the frequency of themajority classin the test set (baseline accuracy), indicative of the accuracyof a naive model.
attribute #samples #classes weightedF1
accuracy baselineaccuracy
selling period 771.1K 33 0.361 0.361 0.074price range 717.0K 3 0.948 0.946 0.843style 543.8K 186 0.847 0.846 0.072collection 353.0K 6 0.999 0.999 0.878buying period 290.7K 3 0.928 0.928 0.778sleeve length 260.3K 11 0.843 0.840 0.348exclusive 259.9K 2 0.958 0.958 0.864back to school/college 237.8K 2 0.946 0.946 0.922customer segment 230.8K 19 0.807 0.807 0.178pattern 224.7K 22 0.829 0.828 0.460leather/non leather 154.5K 2 0.950 0.949 0.713fit 130.5K 20 0.906 0.907 0.460neckline 129.3K 16 0.865 0.868 0.495product fit 111.8K 13 0.930 0.931 0.643dress length 109.3K 3 0.908 0.907 0.625seasonal event 109.1K 6 0.981 0.981 0.624womenswear category 102.6K 56 0.823 0.823 0.084gifting 96.9K 2 0.983 0.983 0.964product length 87.7K 6 0.935 0.937 0.775dress type 86.2K 5 0.675 0.677 0.383shirt style 72.2K 3 0.966 0.967 0.723use/occasion 55.3K 13 0.665 0.666 0.238jewellery finish 28.6K 11 0.664 0.678 0.378jewellery type 24.5K 23 0.821 0.823 0.117denim wash colour 17.4K 9 0.631 0.632 0.290shirt type 14.3K 5 0.911 0.912 0.488heel height 13.1K 4 0.896 0.894 0.590denim rip 12.8K 5 0.922 0.914 0.531accessories type 9.6K 6 0.985 0.985 0.296weight 7.5K 3 0.845 0.843 0.558bags/purses size 3.3K 5 0.879 0.887 0.265high summer 2.7K 2 0.979 0.979 0.726suit type 2.2K 4 0.730 0.742 0.505cold weather 0.8K 2 0.752 0.754 0.739
types as well as specify aminimum number of samples for a possiblevalue of an attribute to be predicted, which we set to 500.
We empirically tuned the hyper-parameters of the architecturefor a balance between computational cost and performance. Forthe evaluation, we took 90% of the data as train and 10% as test.We use as mini-batch size 64 with a learning rate of 0.01. Ourimplementation uses Keras [4] with a Tensorflow [1] backend.
The evaluation task is to predict all the attributes that are appli-cable. We report the weighted F1 score, i.e. for each task we averagethe individual F1 scores calculated for each possible label value,weighted by the number of true instances for each label value.
2.4 Experimental EvaluationThe results of this evaluation are summarized in Table 1. We cansee that the model always outperforms the naive baseline (majorityclass) in terms of accuracy. The evolution of performance duringtraining is shown in Figure 4, the model performance in test isplateaus after 50K optimisation steps (mini-batches of 64 samples)
4
0.8
0.9
1.0
0 10000 20000 30000 40000 50000
SGD steps per attribute
f1
datatesttrain
(a) Average (line) and 0.95 CI (shade) across all attributes.
0.25
0.50
0.75
1.00
0 10000 20000 30000 40000 50000
SGD steps per attribute
test
f1
(b) Test set performance for each attribute.
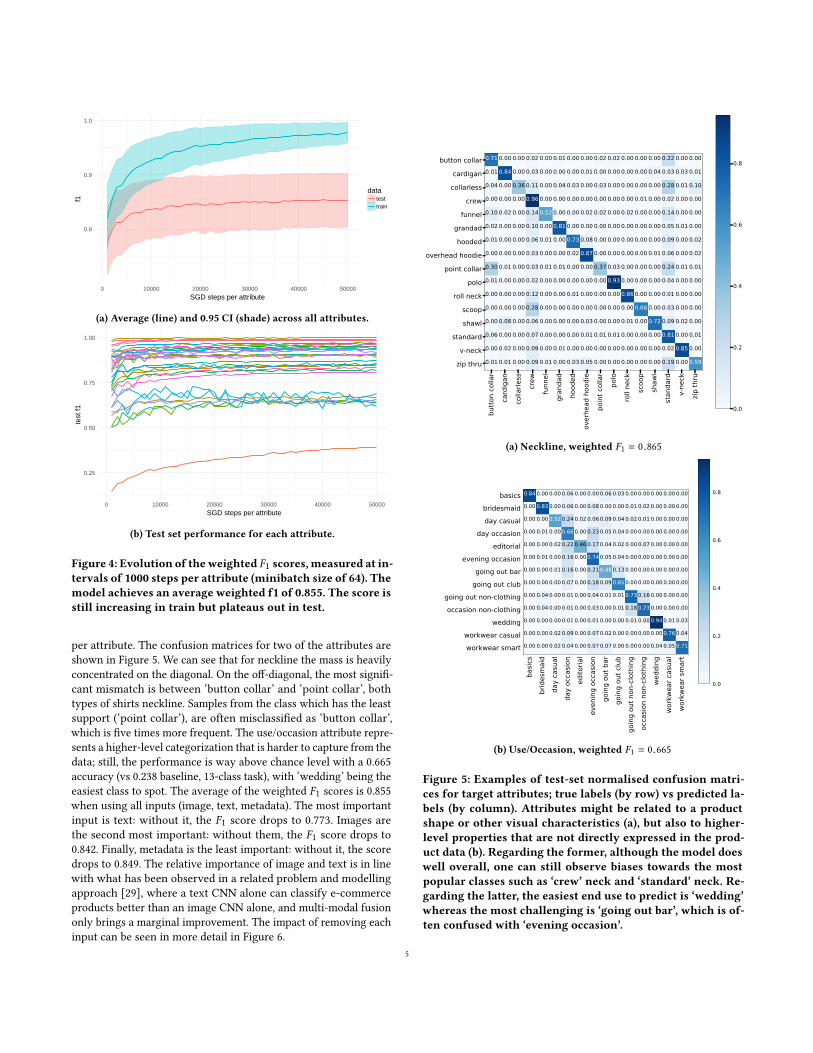
Figure 4: Evolution of theweighted F1 scores,measured at in-tervals of 1000 steps per attribute (minibatch size of 64). Themodel achieves an average weighted f1 of 0.855. The score isstill increasing in train but plateaus out in test.
per attribute. The confusion matrices for two of the attributes areshown in Figure 5. We can see that for neckline the mass is heavilyconcentrated on the diagonal. On the off-diagonal, the most signifi-cant mismatch is between ‘button collar’ and ‘point collar’, bothtypes of shirts neckline. Samples from the class which has the leastsupport (‘point collar’), are often misclassified as ‘button collar’,which is five times more frequent. The use/occasion attribute repre-sents a higher-level categorization that is harder to capture from thedata; still, the performance is way above chance level with a 0.665accuracy (vs 0.238 baseline, 13-class task), with ‘wedding’ being theeasiest class to spot. The average of the weighted F1 scores is 0.855when using all inputs (image, text, metadata). The most importantinput is text: without it, the F1 score drops to 0.773. Images arethe second most important: without them, the F1 score drops to0.842. Finally, metadata is the least important: without it, the scoredrops to 0.849. The relative importance of image and text is in linewith what has been observed in a related problem and modellingapproach [29], where a text CNN alone can classify e-commerceproducts better than an image CNN alone, and multi-modal fusiononly brings a marginal improvement. The impact of removing eachinput can be seen in more detail in Figure 6.
butto
n co
llar
card
igan
colla
rless
crew
funn
elgr
anda
dho
oded
over
head
hoo
die
poin
t col
lar
polo
roll
neck
scoo
psh
awl
stan
dard
v-ne
ckzip
thru
button collarcardigancollarless
crewfunnel
grandadhooded
overhead hoodiepoint collar
poloroll neck
scoopshawl
standardv-neck
zip thru
0.71 0.00 0.00 0.02 0.00 0.01 0.00 0.00 0.02 0.02 0.00 0.00 0.00 0.22 0.00 0.00
0.01 0.84 0.00 0.03 0.00 0.00 0.00 0.01 0.00 0.00 0.00 0.00 0.04 0.03 0.03 0.01
0.04 0.00 0.36 0.11 0.00 0.04 0.03 0.00 0.03 0.00 0.00 0.00 0.00 0.28 0.01 0.10
0.00 0.00 0.00 0.96 0.00 0.00 0.00 0.00 0.00 0.00 0.00 0.01 0.00 0.02 0.00 0.00
0.10 0.02 0.00 0.14 0.52 0.00 0.00 0.02 0.02 0.00 0.02 0.00 0.00 0.14 0.00 0.00
0.02 0.00 0.00 0.10 0.00 0.81 0.00 0.00 0.00 0.00 0.00 0.00 0.00 0.05 0.01 0.00
0.01 0.00 0.00 0.06 0.01 0.00 0.73 0.08 0.00 0.00 0.00 0.00 0.00 0.09 0.00 0.02
0.00 0.00 0.00 0.03 0.00 0.00 0.02 0.87 0.00 0.00 0.00 0.00 0.01 0.06 0.00 0.02
0.30 0.01 0.00 0.03 0.01 0.01 0.00 0.00 0.37 0.03 0.00 0.00 0.00 0.24 0.01 0.01
0.01 0.00 0.00 0.02 0.00 0.00 0.00 0.00 0.00 0.93 0.00 0.00 0.00 0.04 0.00 0.00
0.00 0.00 0.00 0.12 0.00 0.00 0.01 0.00 0.00 0.00 0.86 0.00 0.00 0.01 0.00 0.00
0.00 0.00 0.00 0.28 0.00 0.00 0.00 0.00 0.00 0.00 0.00 0.68 0.00 0.03 0.00 0.00
0.00 0.08 0.00 0.06 0.00 0.00 0.00 0.03 0.00 0.00 0.01 0.00 0.72 0.09 0.02 0.00
0.06 0.00 0.00 0.07 0.00 0.00 0.00 0.01 0.01 0.01 0.00 0.00 0.00 0.81 0.00 0.01
0.00 0.02 0.00 0.09 0.00 0.01 0.00 0.00 0.00 0.00 0.00 0.00 0.00 0.02 0.85 0.00
0.01 0.01 0.00 0.09 0.01 0.00 0.03 0.05 0.00 0.00 0.00 0.00 0.00 0.19 0.00 0.59
0.0
0.2
0.4
0.6
0.8
(a) Neckline, weighted F1 = 0.865
basic
sbr
ides
mai
dda
y ca
sual
day
occa
sion
edito
rial
even
ing
occa
sion
goin
g ou
t bar
goin
g ou
t clu
bgo
ing
out n
on-c
loth
ing
occa
sion
non-
cloth
ing
wedd
ing
work
wear
cas
ual
work
wear
smar
t
basicsbridesmaidday casual
day occasioneditorial
evening occasiongoing out bar
going out clubgoing out non-clothingoccasion non-clothing
weddingworkwear casualworkwear smart
0.84 0.00 0.00 0.06 0.00 0.00 0.06 0.03 0.00 0.00 0.00 0.00 0.00
0.00 0.83 0.00 0.06 0.00 0.08 0.00 0.00 0.01 0.02 0.00 0.00 0.00
0.00 0.00 0.52 0.24 0.02 0.06 0.09 0.04 0.02 0.01 0.00 0.00 0.00
0.00 0.01 0.00 0.66 0.00 0.23 0.05 0.04 0.00 0.00 0.00 0.00 0.00
0.00 0.00 0.02 0.22 0.46 0.17 0.04 0.02 0.00 0.07 0.00 0.00 0.00
0.00 0.01 0.00 0.16 0.00 0.74 0.05 0.04 0.00 0.00 0.00 0.00 0.00
0.00 0.00 0.01 0.16 0.00 0.21 0.48 0.13 0.00 0.00 0.00 0.00 0.00
0.00 0.00 0.00 0.07 0.00 0.18 0.09 0.65 0.00 0.00 0.00 0.00 0.00
0.00 0.04 0.00 0.01 0.00 0.04 0.01 0.01 0.73 0.16 0.00 0.00 0.00
0.00 0.04 0.00 0.01 0.00 0.03 0.00 0.01 0.18 0.73 0.00 0.00 0.00
0.00 0.00 0.00 0.01 0.00 0.01 0.00 0.00 0.01 0.00 0.94 0.01 0.03
0.00 0.00 0.02 0.09 0.00 0.07 0.02 0.00 0.00 0.00 0.00 0.76 0.04
0.00 0.00 0.02 0.04 0.00 0.07 0.07 0.00 0.00 0.00 0.04 0.05 0.71
0.0
0.2
0.4
0.6
0.8
(b) Use/Occasion, weighted F1 = 0.665
Figure 5: Examples of test-set normalised confusion matri-ces for target attributes; true labels (by row) vs predicted la-bels (by column). Attributes might be related to a productshape or other visual characteristics (a), but also to higher-level properties that are not directly expressed in the prod-uct data (b). Regarding the former, although the model doeswell overall, one can still observe biases towards the mostpopular classes such as ‘crew’ neck and ‘standard’ neck. Re-garding the latter, the easiest end use to predict is ‘wedding’whereas the most challenging is ‘going out bar’, which is of-ten confused with ‘evening occasion’.
5
0.4 0.6 0.8 1.0
f1
dens
ity
inputsallno metano imgno txt
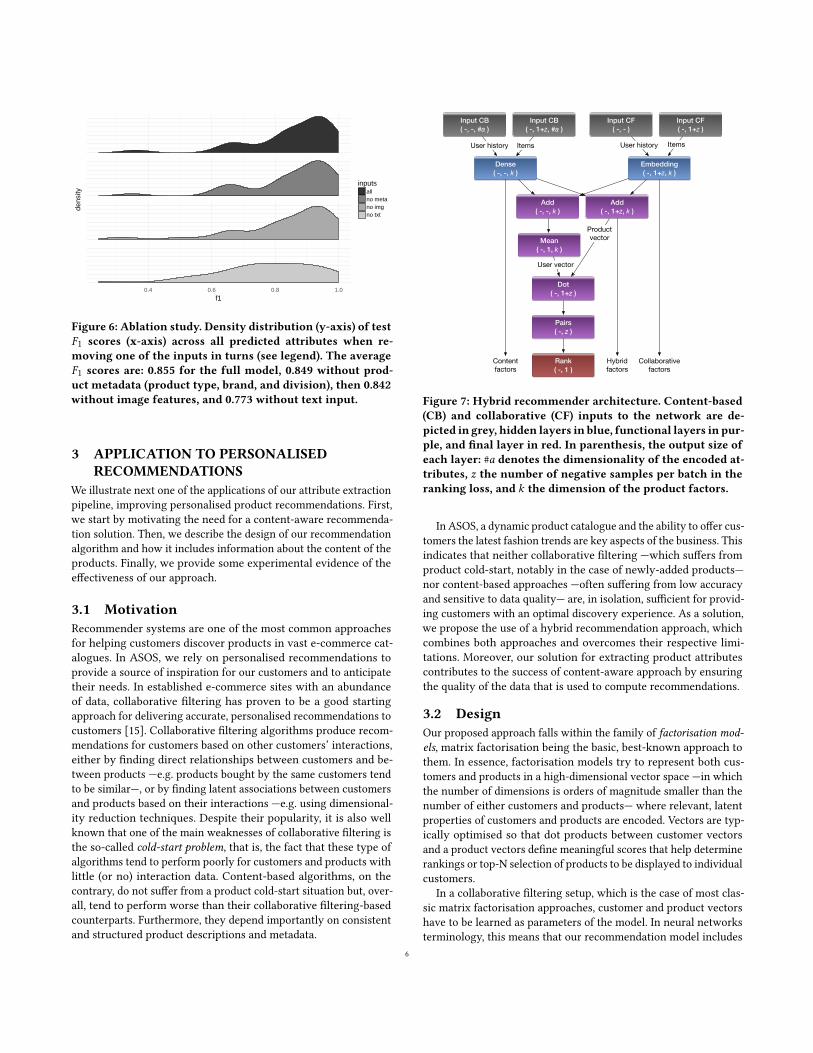
Figure 6: Ablation study. Density distribution (y-axis) of testF1 scores (x-axis) across all predicted attributes when re-moving one of the inputs in turns (see legend). The averageF1 scores are: 0.855 for the full model, 0.849 without prod-uct metadata (product type, brand, and division), then 0.842without image features, and 0.773 without text input.
3 APPLICATION TO PERSONALISEDRECOMMENDATIONS
We illustrate next one of the applications of our attribute extractionpipeline, improving personalised product recommendations. First,we start by motivating the need for a content-aware recommenda-tion solution. Then, we describe the design of our recommendationalgorithm and how it includes information about the content of theproducts. Finally, we provide some experimental evidence of theeffectiveness of our approach.
3.1 MotivationRecommender systems are one of the most common approachesfor helping customers discover products in vast e-commerce cat-alogues. In ASOS, we rely on personalised recommendations toprovide a source of inspiration for our customers and to anticipatetheir needs. In established e-commerce sites with an abundanceof data, collaborative filtering has proven to be a good startingapproach for delivering accurate, personalised recommendations tocustomers [15]. Collaborative filtering algorithms produce recom-mendations for customers based on other customers’ interactions,either by finding direct relationships between customers and be-tween products —e.g. products bought by the same customers tendto be similar—, or by finding latent associations between customersand products based on their interactions —e.g. using dimensional-ity reduction techniques. Despite their popularity, it is also wellknown that one of the main weaknesses of collaborative filtering isthe so-called cold-start problem, that is, the fact that these type ofalgorithms tend to perform poorly for customers and products withlittle (or no) interaction data. Content-based algorithms, on thecontrary, do not suffer from a product cold-start situation but, over-all, tend to perform worse than their collaborative filtering-basedcounterparts. Furthermore, they depend importantly on consistentand structured product descriptions and metadata.
Input CB( -, -, #a )
Dense( -, -, k )
Input CB( -, 1+z, #a )
Input CF( -, - )
Input CF( -, 1+z )
Add( -, -, k )
Rank( -, 1 )
Embedding( -, 1+z, k )
Add( -, 1+z, k )
Mean( -, 1, k )
Pairs( -, z )
Dot( -, 1+z )
Productvector
User vector
User history User historyItems Items
Contentfactors
Collaborativefactors
Hybridfactors
Figure 7: Hybrid recommender architecture. Content-based(CB) and collaborative (CF) inputs to the network are de-picted in grey, hidden layers in blue, functional layers in pur-ple, and final layer in red. In parenthesis, the output size ofeach layer: #a denotes the dimensionality of the encoded at-tributes, z the number of negative samples per batch in theranking loss, and k the dimension of the product factors.
In ASOS, a dynamic product catalogue and the ability to offer cus-tomers the latest fashion trends are key aspects of the business. Thisindicates that neither collaborative filtering —which suffers fromproduct cold-start, notably in the case of newly-added products—nor content-based approaches —often suffering from low accuracyand sensitive to data quality— are, in isolation, sufficient for provid-ing customers with an optimal discovery experience. As a solution,we propose the use of a hybrid recommendation approach, whichcombines both approaches and overcomes their respective limi-tations. Moreover, our solution for extracting product attributescontributes to the success of content-aware approach by ensuringthe quality of the data that is used to compute recommendations.
3.2 DesignOur proposed approach falls within the family of factorisation mod-els, matrix factorisation being the basic, best-known approach tothem. In essence, factorisation models try to represent both cus-tomers and products in a high-dimensional vector space —in whichthe number of dimensions is orders of magnitude smaller than thenumber of either customers and products— where relevant, latentproperties of customers and products are encoded. Vectors are typ-ically optimised so that dot products between customer vectorsand a product vectors define meaningful scores that help determinerankings or top-N selection of products to be displayed to individualcustomers.
In a collaborative filtering setup, which is the case of most clas-sic matrix factorisation approaches, customer and product vectorshave to be learned as parameters of the model. In neural networksterminology, this means that our recommendation model includes
6
two embedding layers, one for customers and one for products.Nevertheless, we go beyond this configuration and extend it for ourpurposes. For example, instead of embedding layers for products,we also rely on a content-based approach and use features associ-ated with products (attributes, brand, etc.) to produce said productvectors. The mapping between product features and vectors canbe achieved by, e.g., a feed-forward neural network. Moreover, it ispossible to combine vectors coming from an embedding layer withthose coming from a feature-fed neural network, thus producinga hybrid representation of products. This forms the basis of ourhybrid recommendation algorithm, where we have found out thatembedded and content-derived vectors can be combined by sum-ming them [12]. In particular, our approach leverages product type,price, recency, popularity, text descriptions (≈1K), image-based fea-tures (≈0.5K) and, importantly, predicted product attributes (≈0.5K).The content-based component takes as input #a (≈2.4K) attributesper product.
A second modification that we perform with respect to classicmatrix factorisation is the so-called asymmetric matrix factorisa-tion [25]. This method aims to reduce the complexity of the modelby eliminating the need to learn an embedding layer for customers.Instead, vectors for customers vu are computed as an intermediaterepresentation. Specifically, we do this by gathering the vectors viof the set Iu of products the customer u has interacted with, and bycombining them, e.g. simply by taking the average:vu = avgi ∈Iuvi .Note that, in cases where customer attributes are to be taken into ac-count (gender, country, estimated budget), it is possible to combinecustomer attributes with product vectors using a neural network, asin the approach of Covington et al. [5] or, as proposed by Rendle [20]or Kula [12], by doing vector composition. Notably, eliminatingthe customer embedding layer from the model reduces drasticallythe size of the model, which has positive consequences in terms ofimproving the scalability of the approach and reducing the risk ofover-fitting.
Finally, we provide some details about the optimisation criterionthat we are using to train the model. Following the recent streamof learning to rank approaches [9], we minimise during traininga loss function that models a ranking problem where positive in-teractions in training —such as products that have been purchasedby a customer in our training data— have to be ranked higher thana sampled selection of negative items (items that are believed notto be relevant to the customer based on lack of interaction). Inparticular, we have chosen the WMRB loss function [17], which isa batch-oriented adaptation of the WARP loss function [27], whichhas proven to be effective at producing good item rankings. Thisfunction, given a customer u, a positive product i and a randomselection Z of negatively sampled products, tries to find appropriatescores su,i from the factorisation model so that the rank of positiveitem i when ordered with the products in Z by decreasing score isas low as possible. Given that the exact rank is not differentiable,WMRB optimises the following approximation instead:
LWMRB (u, i,Z ) = log∑j ∈Z
��1 − su,i + su, j��+
(1)
where |·|+ is a rectifier function. The resulting architecture designis summarised in Figure 7.
3.3 Experimental SetupIn order to show the effectiveness of our proposed hybrid design,we have performed an experiment with a sample of our data. Inparticular, we have collected 13 months of interactions of our malecustomers starting from March 2016. The first 12 months havebeen used to train and validate the recommendation algorithms,whereas the last month was used for evaluation purposes. Out ofall interactions, we kept only those that show a strong intention ofbuying (save for later, add to bag) together with actual purchases.Then, we randomly sampled 200K customers, ensuring that halfof them had interactions in both training and test. In total, thisamounted to 9M interactions with 117K products in the training setand 1M interactions with 54K products in the test set. We normaliseall product features as follows: we first normalise to unit-norm eachfeature independently, and then we normalise to unit-norm eachsample (i.e. each product).
The training procedure using the first 12 months of data goesas follows. Interactions of the last month of the training window(February 2017) were taken as the positive examples for the WMRBfunction, while negative instances were randomly sampled fromthe non-observed interactions with products that were availableduring the whole training window. As inputs to the predictions,i.e. interactions with products (and their features) to produce cus-tomer vectors, we chose for every customer 5 randomly sampleinteractions preceding the positive one whose rank we want tooptimise in the loss function. This means that customers with lessthan 6 interactions (5 for input, 1 for prediction) were discardedfrom training.
The evaluation task is to predict the purchases that customersmade in the test period (March 2017). Note that this type of eval-uation provides a lower bound of the performance of a recom-mendation, as it assumes that recommended products that werenot purchased were not interesting to the customer. Another par-ticularity of our task is that it freezes the learned model and itsrepresentations of the customer before the test period. This is help-ful to illustrate the ability of the hybrid solution in dealing withcold-start products, i.e. those that are added to the catalogue im-mediately before or during the test period. In reality, we updateour models daily so that we can alleviate the cold-start as much aspossible. Precision and recall at cut-off 10 have then been used asthe metrics to assess this task.
To provide meaningful comparisons when discussing the validityof our hybrid approach, two baselines have been included usingthe same training and evaluation approach. First, we compare ourapproachwith the obvious baseline for ranking tasks, i.e. popularity-based ranking [2]. Second, in order to see the benefit of fusingcollaborative filtering and content, we also compared our hybriddesign with collaborative-only and content-only versions. For allvariations of our approach, we used the same vector size (k=200),the number of negative items z = |Z | = 100, batch size of 1024,and a variable number of epochs up to 100 that is determined by avalidation set of 10% of customers in training.
3.4 Experimental EvaluationThe results of this evaluation, summarised as the average valuesfor each metric and algorithm across all customers in the test set,
7
Query Collaborative Content Hybrid
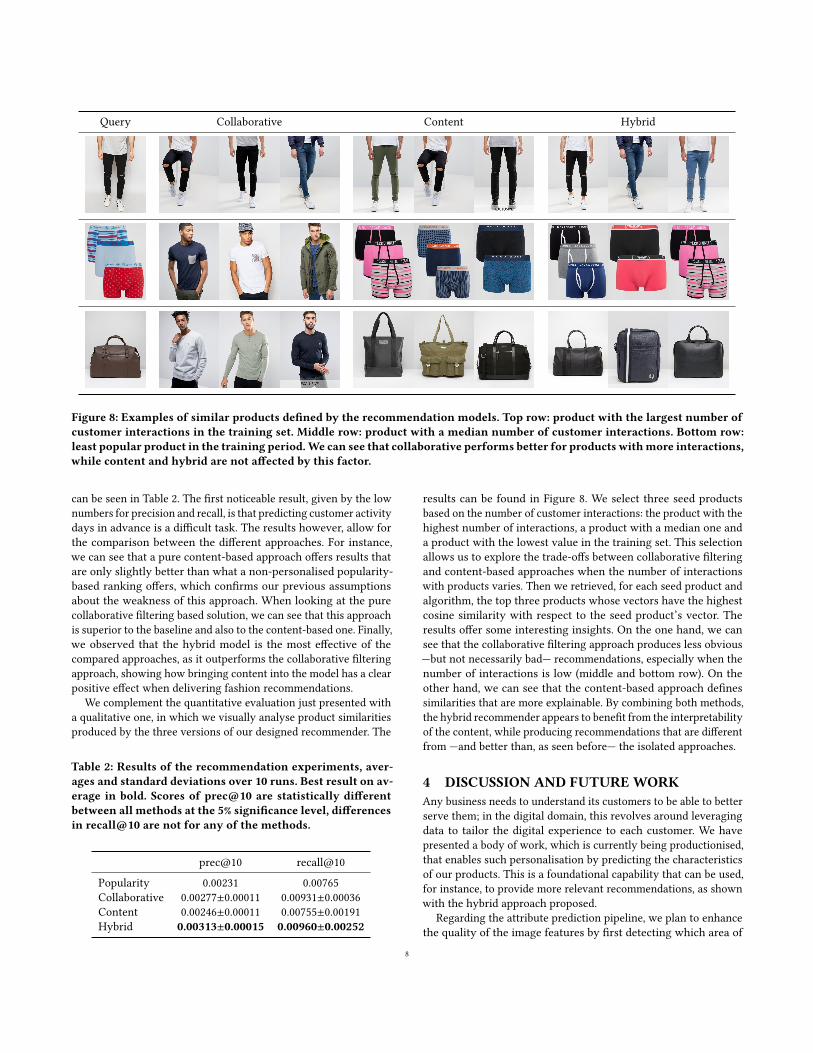
Figure 8: Examples of similar products defined by the recommendation models. Top row: product with the largest number ofcustomer interactions in the training set. Middle row: product with a median number of customer interactions. Bottom row:least popular product in the training period.We can see that collaborative performs better for products withmore interactions,while content and hybrid are not affected by this factor.
can be seen in Table 2. The first noticeable result, given by the lownumbers for precision and recall, is that predicting customer activitydays in advance is a difficult task. The results however, allow forthe comparison between the different approaches. For instance,we can see that a pure content-based approach offers results thatare only slightly better than what a non-personalised popularity-based ranking offers, which confirms our previous assumptionsabout the weakness of this approach. When looking at the purecollaborative filtering based solution, we can see that this approachis superior to the baseline and also to the content-based one. Finally,we observed that the hybrid model is the most effective of thecompared approaches, as it outperforms the collaborative filteringapproach, showing how bringing content into the model has a clearpositive effect when delivering fashion recommendations.
We complement the quantitative evaluation just presented witha qualitative one, in which we visually analyse product similaritiesproduced by the three versions of our designed recommender. The
Table 2: Results of the recommendation experiments, aver-ages and standard deviations over 10 runs. Best result on av-erage in bold. Scores of prec@10 are statistically differentbetween all methods at the 5% significance level, differencesin recall@10 are not for any of the methods.
prec@10 recall@10
Popularity 0.00231 0.00765Collaborative 0.00277±0.00011 0.00931±0.00036Content 0.00246±0.00011 0.00755±0.00191Hybrid 0.00313±0.00015 0.00960±0.00252
results can be found in Figure 8. We select three seed productsbased on the number of customer interactions: the product with thehighest number of interactions, a product with a median one anda product with the lowest value in the training set. This selectionallows us to explore the trade-offs between collaborative filteringand content-based approaches when the number of interactionswith products varies. Then we retrieved, for each seed product andalgorithm, the top three products whose vectors have the highestcosine similarity with respect to the seed product’s vector. Theresults offer some interesting insights. On the one hand, we cansee that the collaborative filtering approach produces less obvious—but not necessarily bad— recommendations, especially when thenumber of interactions is low (middle and bottom row). On theother hand, we can see that the content-based approach definessimilarities that are more explainable. By combining both methods,the hybrid recommender appears to benefit from the interpretabilityof the content, while producing recommendations that are differentfrom —and better than, as seen before— the isolated approaches.
4 DISCUSSION AND FUTUREWORKAny business needs to understand its customers to be able to betterserve them; in the digital domain, this revolves around leveragingdata to tailor the digital experience to each customer. We havepresented a body of work, which is currently being productionised,that enables such personalisation by predicting the characteristicsof our products. This is a foundational capability that can be used,for instance, to provide more relevant recommendations, as shownwith the hybrid approach proposed.
Regarding the attribute prediction pipeline, we plan to enhancethe quality of the image features by first detecting which area of
8
the picture contains the relevant product, since most fashion modelshots contain multiple products. Another possible refinement is tofine-tune the image network —now pre-trained on ImageNet— onour own data, or to train the whole model end-to-end at an evenhigher computational cost. Regarding the application of the hybridapproach to other datasets, we expect the relative improvement ofhybrid over collaborative filtering to grow with the sparsity of theuser-item interaction matrix and to depend on the relevance of theproduct features. The optimisation of the hybrid model might alsoprove more challenging and, unlike with our dataset, require theregularisation of the activation/weights of the content/collaborativecomponents.
As further future work we plan to use the capability to charac-terize products to enable additional use cases such as: data-assisteddesign; better product analytics; sales forecasting; range planning;finding similar products; and improving search with predicted meta-data. Regarding the hybrid recommender system approach, we planto study the trade-offs between content and collaborative in regimesranging from cold-start to highly popular products.
REFERENCES[1] Martín Abadi, Paul Barham, Jianmin Chen, Zhifeng Chen, Andy Davis, Jeffrey
Dean, Matthieu Devin, Sanjay Ghemawat, Geoffrey Irving, Michael Isard, et al.2016. TensorFlow: A System for Large-Scale Machine Learning.. In OSDI, Vol. 16.265–283.
[2] Xavier Amatriain. 2013. Mining Large Streams of User Data for PersonalizedRecommendations. SIGKDD Explor. Newsl. 14, 2 (April 2013), 37–48. https://doi.org/10.1145/2481244.2481250
[3] Christian Bracher, Sebastian Heinz, and Roland Vollgraf. 2016. Fashion DNA:Merging content and sales data for recommendation and article mapping. arXivpreprint arXiv:1609.02489 (2016).
[4] François Chollet et al. 2015. Keras. (2015).[5] Paul Covington, Jay Adams, and Emre Sargin. 2016. Deep Neural Networks
for YouTube Recommendations. In Proceedings of the 10th ACM Conference onRecommender Systems (RecSys ’16). ACM, New York, NY, USA, 191–198. https://doi.org/10.1145/2959100.2959190
[6] Andrea Frome, Greg S Corrado, Jon Shlens, Samy Bengio, Jeff Dean, TomasMikolov, et al. 2013. Devise: A deep visual-semantic embedding model. In Ad-vances in neural information processing systems. 2121–2129.
[7] Naoto Inoue, Edgar Simo-Serra2 Toshihiko Yamasaki, and Hiroshi Ishikawa. 2017.Multi-Label Fashion Image Classification with Minimal Human Supervision. InProceedings of the IEEE Conference on Computer Vision and Pattern Recognition.2261–2267.
[8] Rie Johnson and Tong Zhang. 2014. Effective use of word order for text cate-gorization with convolutional neural networks. arXiv preprint arXiv:1412.1058(2014).
[9] Alexandros Karatzoglou, Linas Baltrunas, and Yue Shi. 2013. Learning to Rank forRecommender Systems. In Proceedings of the 7th ACMConference on RecommenderSystems (RecSys ’13). ACM, New York, NY, USA, 493–494. https://doi.org/10.1145/2507157.2508063
[10] Yoon Kim. 2014. Convolutional neural networks for sentence classification. arXivpreprint arXiv:1408.5882 (2014).
[11] Diederik P Kingma and Jimmy Ba. 2014. Adam: A method for stochastic opti-mization. arXiv preprint arXiv:1412.6980 (2014).
[12] Maciej Kula. 2015. Metadata Embeddings for User and Item Cold-start Recom-mendations. CoRR abs/1507.08439 (2015). arXiv:1507.08439 http://arxiv.org/abs/1507.08439
[13] Katrien Laenen, Susana Zoghbi, and Marie-Francine Moens. 2017. Cross-modalsearch for fashion attributes. In Proceedings of the KDD 2017Workshop on MachineLearning Meets Fashion. ACM.
[14] Ruifan Li, Fangxiang Feng, Ibrar Ahmad, and Xiaojie Wang. 2017. Retrievingreal world clothing images via multi-weight deep convolutional neural networks.Cluster Computing (2017), 1–12.
[15] Greg Linden, Brent Smith, and Jeremy York. 2003. Amazon.com recommendations:item-to-item collaborative filtering. IEEE Internet Computing 7, 1 (Jan 2003), 76–80.https://doi.org/10.1109/MIC.2003.1167344
[16] Jingzhou Liu, Wei-Cheng Chang, Yuexin Wu, and Yiming Yang. 2017. DeepLearning for Extreme Multi-label Text Classification. In Proceedings of the 40thInternational ACM SIGIR Conference on Research and Development in InformationRetrieval. ACM, 115–124.
[17] Kuan Liu and Prem Natarajan. 2017. WMRB: Learning to Rank in a ScalableBatch Training Approach. In Proceedings of the Poster Track of the 11th ACMConference on Recommender Systems (RecSys ’17). CEUR Workshop Proceedings,2. http://ceur-ws.org/Vol-1905/
[18] Ziwei Liu, Ping Luo, Shi Qiu, Xiaogang Wang, and Xiaoou Tang. 2016. Deepfash-ion: Powering robust clothes recognition and retrieval with rich annotations. InProceedings of the IEEE Conference on Computer Vision and Pattern Recognition.1096–1104.
[19] Bharath Ramsundar, Steven Kearnes, Patrick Riley, Dale Webster, David Konerd-ing, and Vijay Pande. 2015. Massively multitask networks for drug discovery.arXiv preprint arXiv:1502.02072 (2015).
[20] Steffen Rendle. 2010. Factorization Machines. In Proceedings of the 2010 IEEEInternational Conference on Data Mining (ICDM ’10). IEEE Computer Society,Washington, DC, USA, 995–1000. https://doi.org/10.1109/ICDM.2010.127
[21] Antonio Rubio, LongLong Yu, Edgar Simo-Serra, and Francesc Moreno-Noguer.2017. Multi-Modal Embedding for Main Product Detection in Fashion. In Pro-ceedings of the IEEE Conference on Computer Vision and Pattern Recognition. 2236–2242.
[22] Sebastian Ruder. 2017. An overview of multi-task learning in deep neural net-works. arXiv preprint arXiv:1706.05098 (2017).
[23] Alexander Schindler, Thomas Lidy, Stephan Karner, and Matthias Hecker. 2017.Fashion and Apparel Classification using Convolutional Neural Networks. In Pro-ceedings of the 10th ForumMedia Technology and 3rd All Around Audio Symposium(FMT 2017).
[24] Karen Simonyan and Andrew Zisserman. 2014. Very deep convolutional networksfor large-scale image recognition. arXiv preprint arXiv:1409.1556 (2014).
[25] Harald Steck. 2015. Gaussian Ranking by Matrix Factorization. In Proceedings ofthe 9th ACM Conference on Recommender Systems (RecSys ’15). ACM, New York,NY, USA, 115–122. https://doi.org/10.1145/2792838.2800185
[26] Jiang Wang, Yi Yang, Junhua Mao, Zhiheng Huang, Chang Huang, and Wei Xu.2016. Cnn-rnn: A unified framework for multi-label image classification. InComputer Vision and Pattern Recognition (CVPR), 2016 IEEE Conference on. IEEE,2285–2294.
[27] Jason Weston, Samy Bengio, and Nicolas Usunier. 2011. WSABIE: Scaling Upto Large Vocabulary Image Annotation. In Proceedings of the Twenty-SecondInternational Joint Conference on Artificial Intelligence - Volume Volume Three(IJCAI’11). AAAI Press, 2764–2770. https://doi.org/10.5591/978-1-57735-516-8/IJCAI11-460
[28] Ashia CWilson, Rebecca Roelofs, Mitchell Stern, Nati Srebro, and Benjamin Recht.2017. The marginal value of adaptive gradient methods in machine learning. InAdvances in Neural Information Processing Systems. 4151–4161.
[29] Tom Zahavy, Alessandro Magnani, Abhinandan Krishnan, and Shie Mannor. 2016.Is a picture worth a thousand words? A Deep Multi-Modal Fusion Architecturefor Product Classification in e-commerce. arXiv preprint arXiv:1611.09534 (2016).
[30] Andrew Zhai, Dmitry Kislyuk, Yushi Jing, Michael Feng, Eric Tzeng, Jeff Donahue,Yue Li Du, and Trevor Darrell. 2017. Visual discovery at pinterest. In Proceedingsof the 26th International Conference on World Wide Web Companion. InternationalWorld Wide Web Conferences Steering Committee, 515–524.
[31] Ye Zhang and Byron Wallace. 2015. A sensitivity analysis of (and practitioners’guide to) convolutional neural networks for sentence classification. arXiv preprintarXiv:1510.03820 (2015).
9