product family strategy and platform design optimzationweb.mit.edu/deweck/www/pdf_archive/2 refereed...
TRANSCRIPT
Product Family Strategy
and Platform Design Optimzation
Olivier L. de Weck∗, Eun Suk Suh†
Massachusetts Institute of Technology, Cambridge, MA 02139
and David Chang‡
General Motors Research and Development,Warren, MI 48093
1 Abstract
Numerous manufacturing industries are seeking ways to reduce manufacturing costs and
development times of product families through implementation of platform strategies. De-
ploying several variants from a single product platform can yield considerable savings in time,
cost and maximize profits. It is, however, generally accepted that product platforms impose
design and component reuse constraints that can lead to a compromise in performance, rel-
ative to a set of individually tailored products. Currently, a number of methodologies to
determine an optimum product platform architecture have been developed. These method-
ologies are helpful in determining the components that should be common between products
and therefore represent the constituent elements of a product platform. However, a company
producing a large number of products also has to determine the total number of platforms to
deploy along with the most appropriate leveraging strategy with respect to the target market
segments. It appears that little research has been done on systematically determining the
optimum number of product platforms to maximize overall product family profitability. In
this paper, a methodology is presented to determine the optimum number of platforms to
maximize overall profit for a product family given a set of simplifying assumptions. The
methodology is based on a careful analysis of the target market segments, the identification
of the performance vs. price position of the segment leaders and a bi-level design optimiza-
tion scheme to simultaneously optimize platform and variant designs. The usefulness of the
methodology is demonstrated for a hypothetical set of automotive vehicle platforms that
attempt to serve seven different vehicle market segments. It is found that the use of three
distinct platforms will maximize overall profit by pursuing primarily a horizontal leveraging
1 of 38
strategy in this example.
∗Assistant Professor, Department of Aeronautics and Astronautics, Engineering Systems Division (ESD)†Research Assistant, Engineering Systems Division‡Chief Scientist, Math Tools
2 of 38

NomenclatureACP Product components to variant assignment matrix
APM Variant to market segment assignment matrix
AΠP Platform to variant assignment matrix
AXΠ Design variable to platform assignment matrix
Cc Set of product components
JM,JP Set of objective functions
M Set of market segments
P Set of product variants offered
Ω Objective preference weight matrix
Π Set of product platforms
XΠ,XP Set of design vectors x
J Product objective vector
xπ,xP Design vectors
D Weighted performance objective distance
J Normalized aggregate objective function value
CP Total variable cost of product family
Cπ Cost of a product platform
CComp Cost of a product component
CCap Capital investment
K Number of product components
M Number of market segment
N Number of product platform
n,r Number of product design variables
P Price
P Normalized price
Q Number of objective functions
SV Sales volume
TFUc Theoretical first unit cost of product component
TFUπ Theoretical first unit cost of product platform
Uc Component usage
V Number of product variants
Introduction
Modern manufacturing industries are concentrating their efforts on maximizing profits by
seeking ways to reduce development and manufacturing costs, while at the same time offering
3 of 38
a set of competitive products in many diverse market segments. One way of achieving this
objective is to implement a product platform strategy. By implementing a product platform
strategy, manufacturers are able to reduce overall production costs and development time,
while satisfying diverse customer demands. A platform strategy is essentially an effective and
deliberate program of component reuse which takes advantage of the economies of scale across
the product family, while minimizing the negative impact of reuse on individual product
variant distinctiveness and performance.
Because of its advantages, product platform strategies are aggressively implemented by
various product manufacturers. Volkswagen is the recognized global leader in platform strat-
egy for passenger cars, and currently produces over four million vehicles from just four
platforms.? Boeing is developing the platform based Blended Wing Body (BWB) aircraft
family consists of a tanker, commercial aircraft and bomber. Hewlett-Packard implemented
platform strategies on its DeskJet products.? The overall objective is to maximize the prod-
uct variants to platform ratio V/N , while maximizing the performances of each product
variant. V is the number of product variants in the product family P (sometimes called
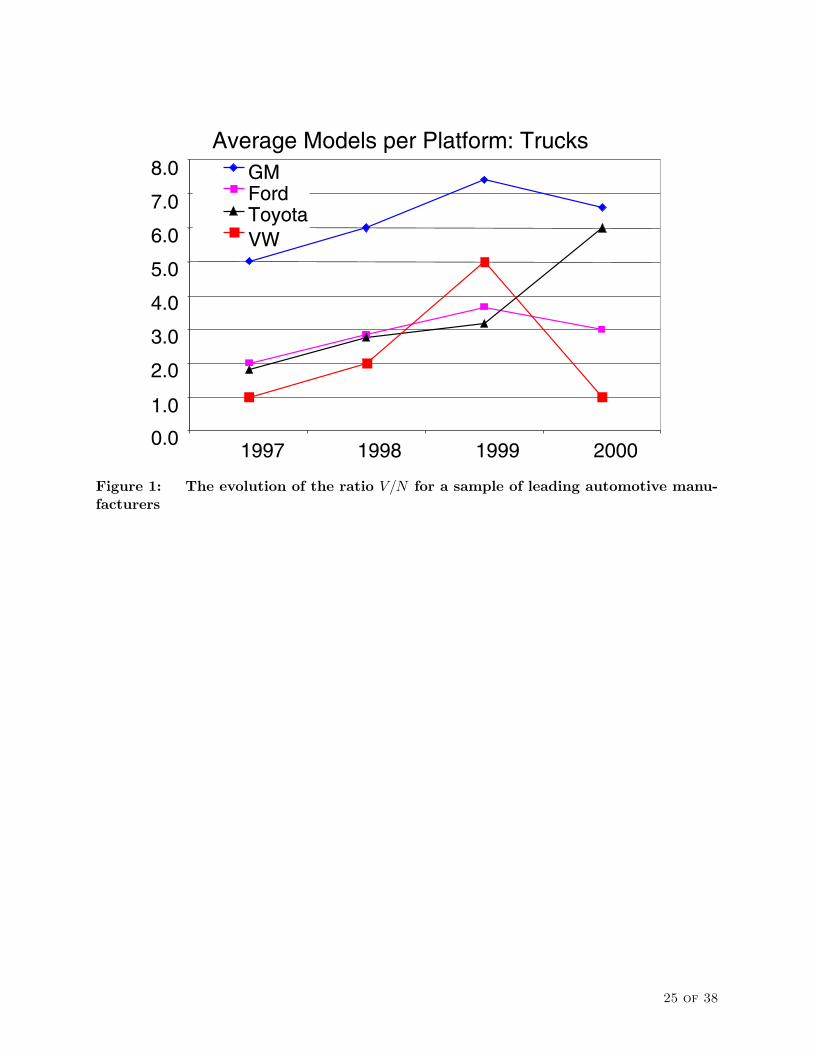
portfolio), and N is the number of platforms in the set Π. Example of this trend is shown
by analyzing the V/N ratio for four leading automotive manufacturers in Figure 1.
Previous Research
Many product platform strategies are developed by various scholars throughout academia.
Simpson et al.? proposed the Product Platform Concept Exploration Method (PPCEM)
to define the market segment and product platform specification for a vertically scalable
product family. Simpson and D’Souza? proposed a multiobjective two level genetic algorithm
optimization method to optimize product family and individual product variants using the
Product Family Penalty Function, which was developed by Messac et al.? Martin and
Ishii? proposed a method to develop decoupled product platform architecture using the
General Variety Index (GVI) and the Coupling Index (CI) to create robust product platform.
Fellini et al.? developed a method for making commonality decisions for product platforms
while controlling individual performance losses. Also, a new methodology for selecting the
product platform with information from individual product variant optimization using the
Sharing Penalty Vector (SPV) was introduced by Fellini et al.? for family products with mild
variation. Gonzalez-Zugasti et al.? proposed a methodology to design product platforms
and variants which take technical performance requirements and product family costs into
consideration.
Until now, most product platform strategies were focused on selecting common compo-
nents and architectures for a single platform to achieve commonality goals, while maintaining
4 of 38
performance thresholds of product variants. It is observed that there is no clear and rigorous
methodology to determine the optimum number of platforms to cover wide market segments.
In this paper, an optimization methodology to determine the optimum number of platforms
is proposed.
In the following section, various platform strategies are presented. In proceeding sections,
a new two level optimization methodology for the product family is proposed in detail.
The methodology identifies the leader for each market segment, calculates the weighted
distance of each of the competitors from the market leader, obtains sales volumes for each
product variant, and finally, determines the optimum number of platforms and leveraging
strategy that produces the largest net profit. The proposed methodology is implemented
to automotive product family to determine the optimum number of vehicle platforms. The
results and analysis are presented, and conclusions are drawn.
Platform and Platform Strategy
There are many definitions of the term platform. Ulrich and Eppinger? define platform
as a collection of assets, including component designs, shared by multiple products. Simpson
and Souza? define platform as a group of related products that share common components
and/or subsystems. Figure 2 illustrates three different products, each assembled with differ-
ent combinations of elements A, B, C, D and E.
It is apparent that three products in Figure 2 share elements A, B, and C together, while
elements D and E are shared among one or two products. Based on set theory, it can be
concluded that this product family shares a common platform that contains elements A, B
and C. However, if we analyze the Design Structure Matrices (DSM) of these products, it
can be concluded that only element A constitutes the platform.
Many well known products are developed on platforms. Products based on platforms
include airplanes, computers, power tools and automobiles. In the automotive industry,
Volkswagen, along with its partners Skoda, Seat and Audi, produces the Beetle, the Golf,
the Bora, the Octavia, the Toledo and the A3 from a single platform, which share common
components such as engine, transmission, brakes, seat, axles, etc. Boeing is currently in
the process of developing the Blended Wing Body (BWB) aircrafts, which will share iden-
tical wings, cockpit, and center body elements among its product family. Today’s personal
computers are made of a motherboard with standardized interfaces for CPU, hard drive,
ethernet cards and other components, which enable rapid implementation of next generation
technologies. In general, platforms are categorized into three classes. They are modular
platforms, scalable platforms and generational platforms.
5 of 38

Modular (Functional) Platforms: A modular platform is a platform that allows creation
of functionally different product variants. A good example is the Blended Wing Body
aircrafts from Boeing. Using a common platform, the firm is able to create different
airplane variants, which can be a tanker, commercial airplane, global transport, and
bomber.
Scalable Platforms: A scalable platform allows creation of functionally identical products
of various capacities. A camera film is a good example. Using a film casing and the
film itself as platform elements, products with a differing exposures and film qualities
can be manufactured and offered to suit various consumer needs.
Generational Platforms: A generational platform is a platform that can be used as a lever
for rapid next generation development. A good example of generational platforms is
a personal computer, which has standardized interfaces for components with short de-
velopment cycles. This allows the quick and easy implementation of new technologies,
without changing the base platform.
Although product platforms can help reduce cost and development time, they must be
implemented effectively. Based on empirical evidence, platforms should be implemented
when the family of products can be described by one or more of following criteria:
• the product family is a system with a common basic sets of attributes.;
• the product family has a long life cycle and distributed ownership;
• the product family has highly interconnected systems with a need for future growth
and a constant update of technologies;
• the product family must adapt to rapidly changing environments, trends and ”fast
clock speed” technologies;
• the product family has stable core functionality but has variability in secondary func-
tions and/or external styling;
• the product family interfaces with an intricate peripheral customized architecture.
In some cases, using the product platform may not be appropriate. Products with the
following characteristics are not suitable for platform implementation:
• the product is intended for a single use or has short life cycles without need for product
variety;
6 of 38
• the product is insensitive to change over time;
• the product has only a single function;
• the product consists of fixed packaging and/or design;
• the product is sold in a slowly changing markets;
• the product is placed in an ultra-high performance market, where no performance
compromises can be tolerated;
Once the decision to implement platforms is made, there are different strategies for the
product implementation. Figure 3 illustrates various platform strategies that are imple-
mented throughout various industries. With a single platform, the firm can cover different
market segments using different approaches. Some of the most widely practiced platform
strategies are No Leveraging, Vertical Leveraging, Horizontal Leveraging, and the Beachhead
Strategy.
No Leveraging: The platform is designed exclusively for a single market segment. There is
no other market segment that shares this particular platform. This strategy is usually
implemented for a high performance product with relatively high development cost
limits and performance tolerance range.
Vertical Leveraging: The platform is shared among low-end, mid-range and high-end mar-
ket segments within the same brand. It is ”vertical” in a sense that a single platform
is implemented from a low to high end of the market segment.
Horizontal Leveraging: The platform is shared across different brands but within the
same class of market segment. A good example would be the Volkswagen A platform,
which covers medium vehicle market segments for Volkswagen, Skoda, Seat and Audi.
Beachhead Approach: This is the most ambitious platform strategy. A single platform
is implemented across different brands and market segments.
Implementing a platform strategy has many advantages. It increases standard parts,?
reduces product design lead times,? makes coverage of market niches easier,? reduces design
risk and cost, allows faster response to changing market needs, and makes standardization
of manufacturing processes and tooling easier.
However, platform strategy has shortcomings that are rarely discussed in the literature.
By implementing platforms, undesirable functions can be introduced to the system, causing
7 of 38

unexpected technical difficulties to the platform based product family. Audi retrofitted a
tail spoiler to its TT sports roadster to fix the rear wheel pressure problem. The cause of
the problem was traced to the utilization of a common platform for this particular vehicle,
which in turn, had unexpected side effects. Cannibalization of common platform based high
end products by low end products is a weakness for the vertical leveraging strategy. Another
disadvantage of an aggressive platform strategy is a performance compromise. If the degree
of commonality is too high, each variant from product platform might not be competitive in
their respective market segment due to inferior performance (with respective to the market
leader) caused by sharing constraints.
Platform Strategy Formulation
General Overview
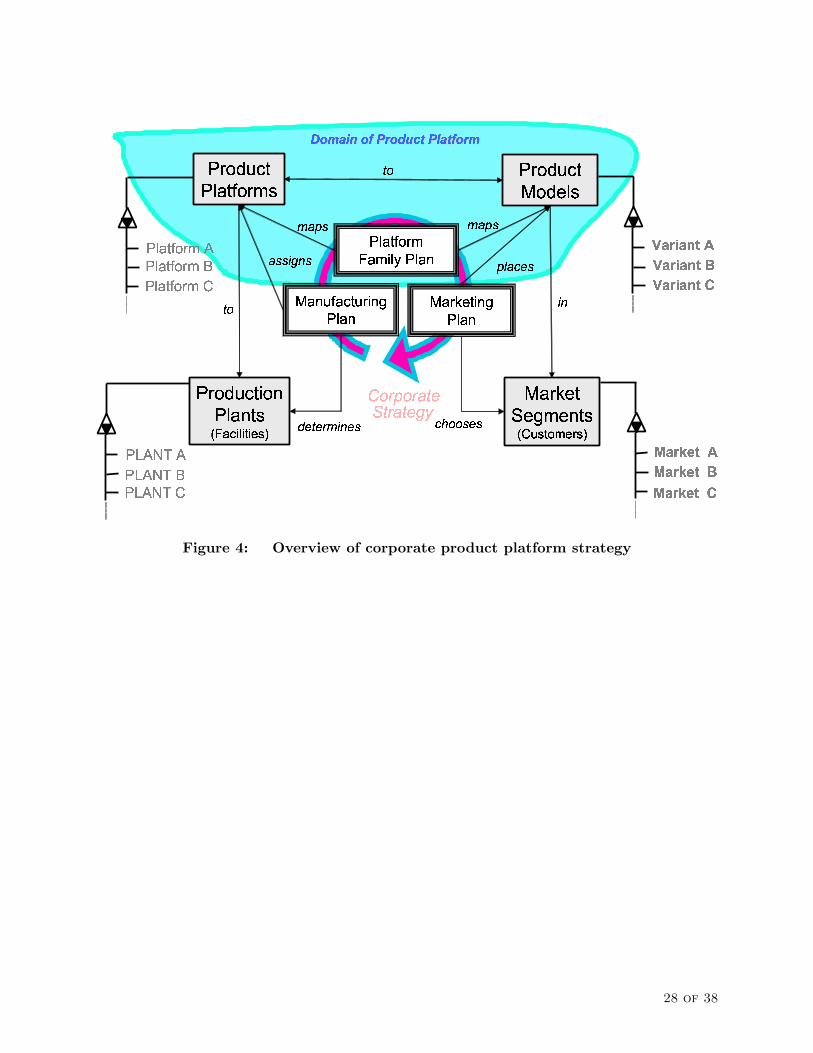
Product platform strategy is a powerful concept that is widely implemented throughout
many industries. Figure 4 shows an overview of general corporate strategy for product
development.
A typical product family development plan consists of the marketing plan, designing
plan, and manufacturing plan. The marketing plan identifies potential niche markets and
products that could generate corporate profit. The product design plan outlines target
specification values for product variant in each market segment, and the efficient platform
strategy to design the product family. The manufacturing plan outlines detailed product
family production plan that could achieve low cost, high facility reuse and utilization. All
three plans are subjects of interesting research. In this study, the product design plan,
particulary the product platform strategy, was discussed in detail.
In general, the product platform strategy can be expressed as
Xπ, Cπ → Π→ P → M (1)
where the chosen platform design variable set Xπ and platform component set Cπ is mapped
to the product platform set Π, which then maps to the product family set P . The product
family set P is then mapped to the market segment setM. In the past, many methods have
been developed to assign proper design variables and components to product platforms.
These methods are mentioned in the introduction. This study focuses on product design
plan, with emphasis mapping Π to P , and P toM.
8 of 38

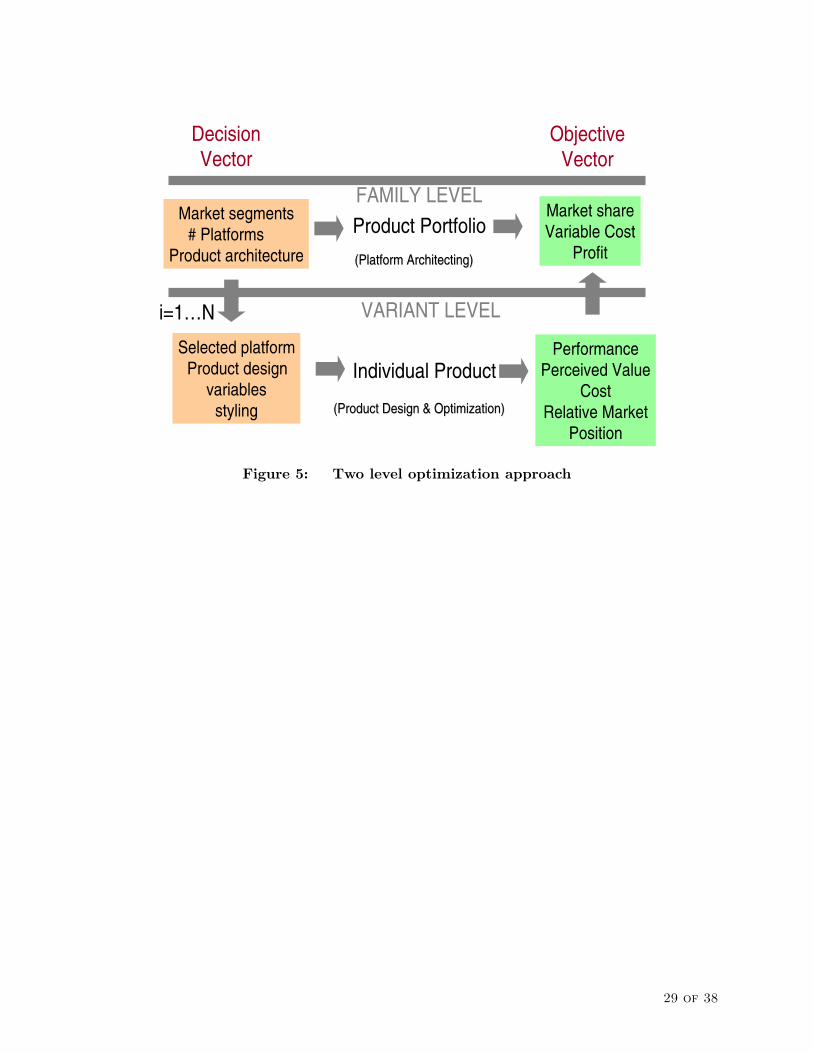
Two Level Design Optimization
The product design plan is divided into product family level design plan and product
variant design plan. During the product family design stage, decision makers choose and
optimize product family variables such as the market segment, the overall product family
architecture, the product platform architecture, the number of platforms, and the platform
placement in appropriate market segments.
After the product family architecture variables are decided, individual product variants
are optimized with respect to their specific market segment. Each product variant is op-
timized within the constraint of the platform the variant is based on. Once the product
variant is optimized, the total revenue and the profit of the product family is calculated.
The optimization process switches back and forth between the upper (family) level and the
lower (variant) level to see if a new assignment AΠM and platform design variable set XΠ
yields better overall profit. The optimization process continuously iterates until the product
family with the best aggregate product variant performance and profits are found. This
optimization process is represented in Figure 5.
Proposed two level optimization is implemented with certain limitations. It is assumed
that on the product family optimization, the contending market segments and the product
platform architecture (component to platform assignment) are already decided, leaving the
number of product platforms as the only family level variable. By optimizing the number of
product platforms fromN = 1, 2, . . . , V , the best product variant to platform assignment and
the product platform to market segment assignment are determined. In order to generate
accurate two level optimization simulation, appropriate product platform model, product
variant model, and market segment model are needed.
Product Platform Model
A product platform is a set of design variables or components that are commonly shared
across the product family (See Figure 2). A typical product platform consists of components
or design variables that have finite range of flexibility, imposing constraint on the individual
product variant optimization. Mathematically, a product platform can be represented as
a set of design variable, XΠ, that is common across the platform sharing variants in the
product family set, P . The design variable assignment matrix AXΠ that assigns a set of
design variables XΠ to a set of product platform Π can be generated:
AXΠΠ =
aXΠΠ,11 ... aXΠΠ,1N
... ... ...
aXΠΠ,R1 ... aXΠΠ,RN
(2)
9 of 38
where the rows of the AXΠΠ represent available design variables and the columns represent
available product platforms. If ith design variable is part of jth platform, a 1 is placed in
that cell. It is entirely possible that each platform has different design variables set from the
other platforms.
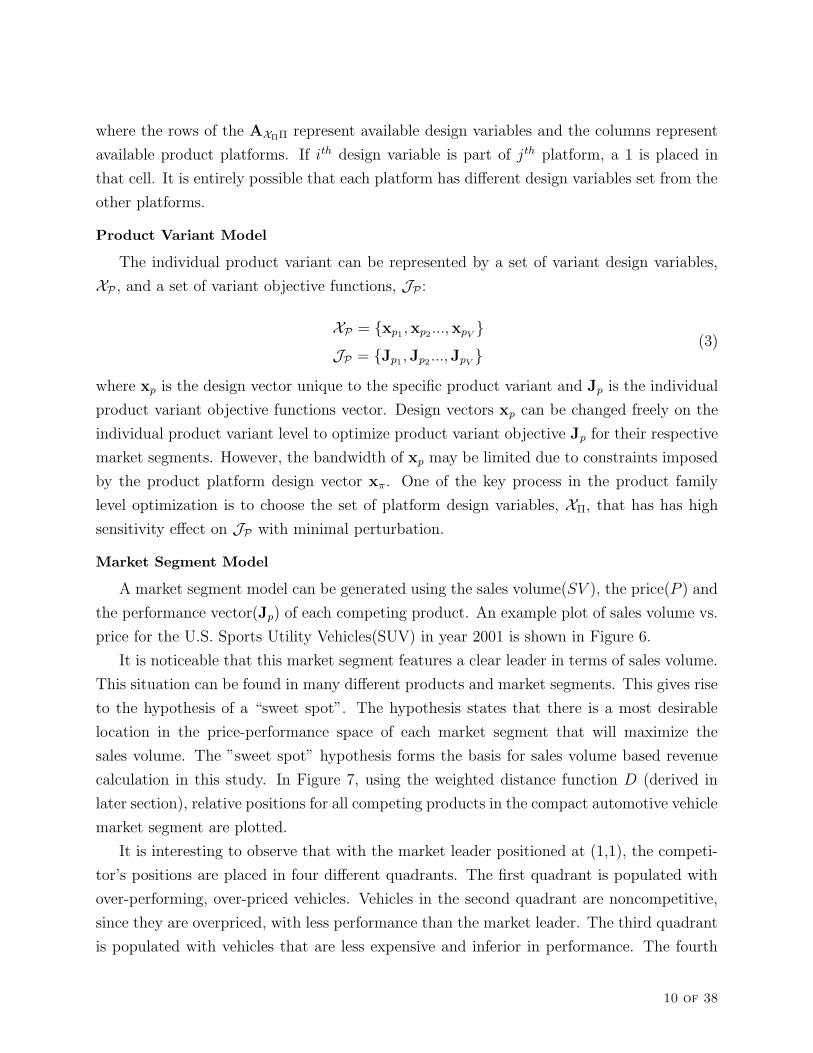
Product Variant Model
The individual product variant can be represented by a set of variant design variables,
XP , and a set of variant objective functions, JP :
XP = xp1 ,xp2 ...,xpV
JP = Jp1 ,Jp2 ...,JpV
(3)
where xp is the design vector unique to the specific product variant and Jp is the individual
product variant objective functions vector. Design vectors xp can be changed freely on the
individual product variant level to optimize product variant objective Jp for their respective
market segments. However, the bandwidth of xp may be limited due to constraints imposed
by the product platform design vector xπ. One of the key process in the product family
level optimization is to choose the set of platform design variables, XΠ, that has has high
sensitivity effect on JP with minimal perturbation.
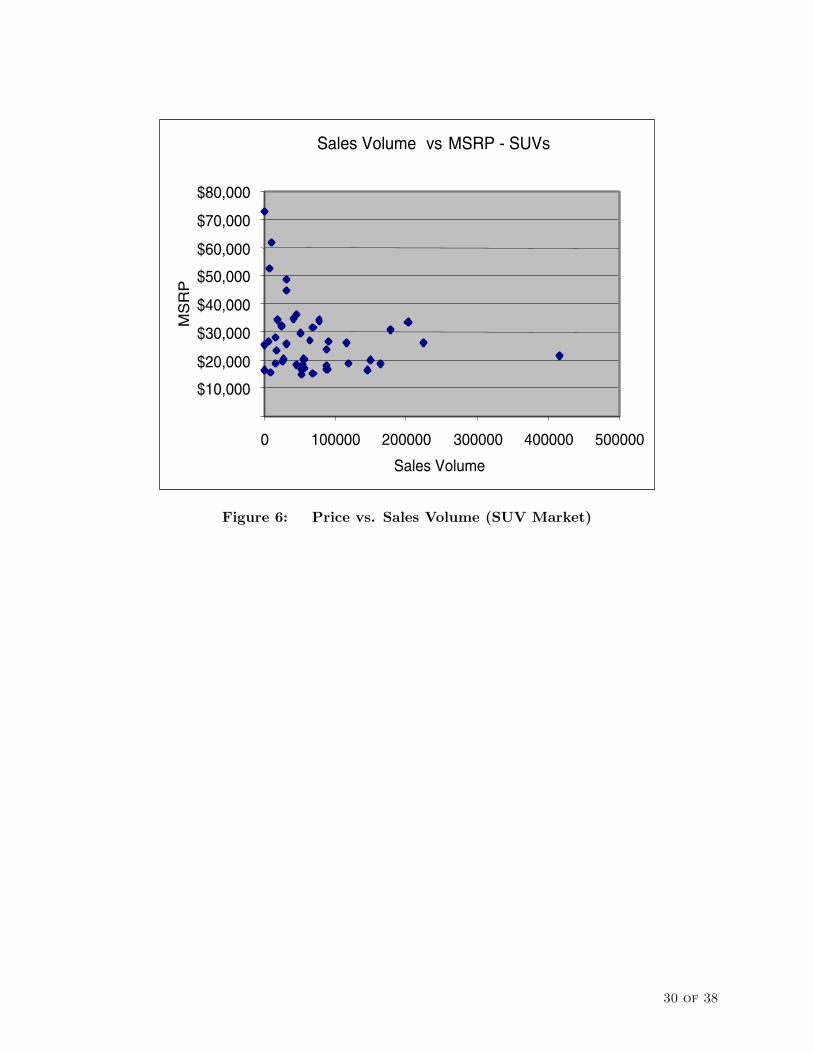
Market Segment Model
A market segment model can be generated using the sales volume(SV ), the price(P ) and
the performance vector(Jp) of each competing product. An example plot of sales volume vs.
price for the U.S. Sports Utility Vehicles(SUV) in year 2001 is shown in Figure 6.
It is noticeable that this market segment features a clear leader in terms of sales volume.
This situation can be found in many different products and market segments. This gives rise
to the hypothesis of a “sweet spot”. The hypothesis states that there is a most desirable
location in the price-performance space of each market segment that will maximize the
sales volume. The ”sweet spot” hypothesis forms the basis for sales volume based revenue
calculation in this study. In Figure 7, using the weighted distance function D (derived in
later section), relative positions for all competing products in the compact automotive vehicle
market segment are plotted.
It is interesting to observe that with the market leader positioned at (1,1), the competi-
tor’s positions are placed in four different quadrants. The first quadrant is populated with
over-performing, over-priced vehicles. Vehicles in the second quadrant are noncompetitive,
since they are overpriced, with less performance than the market leader. The third quadrant
is populated with vehicles that are less expensive and inferior in performance. The fourth
10 of 38
quadrant contains possible contenders for this market segment, offering better performance
at the lower price than the market leader.
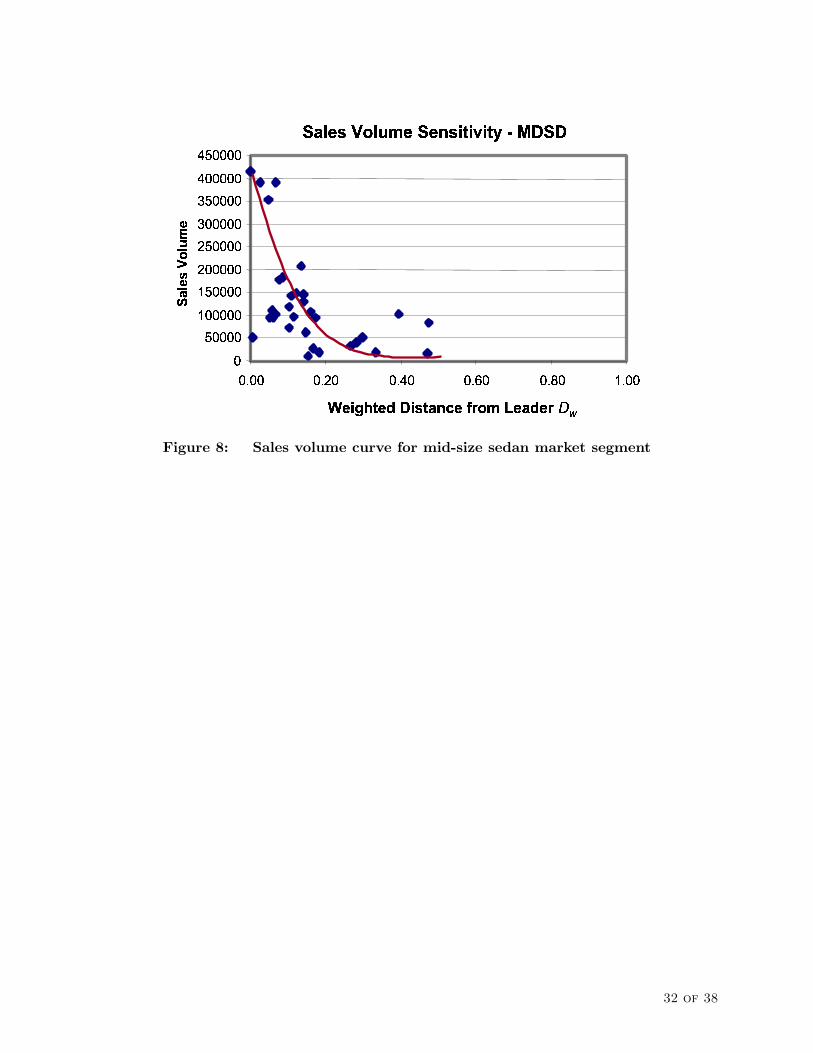
Performing the regression analysis using the relative positions of all competitors, the
estimated sales volume for each competitor can be calculated. Relevant equations for sales
volume calculation are introduced in the next section. Figure 8 shows the plot of sales volume
for a medium size automotive vehicle market segment as the function of absolute weighted
distance Dij of each product:
where Dij is the weighted distance of ith variant in jth market segment, and is a function of
the normalized price P and the normalized aggregated product variant performance J .
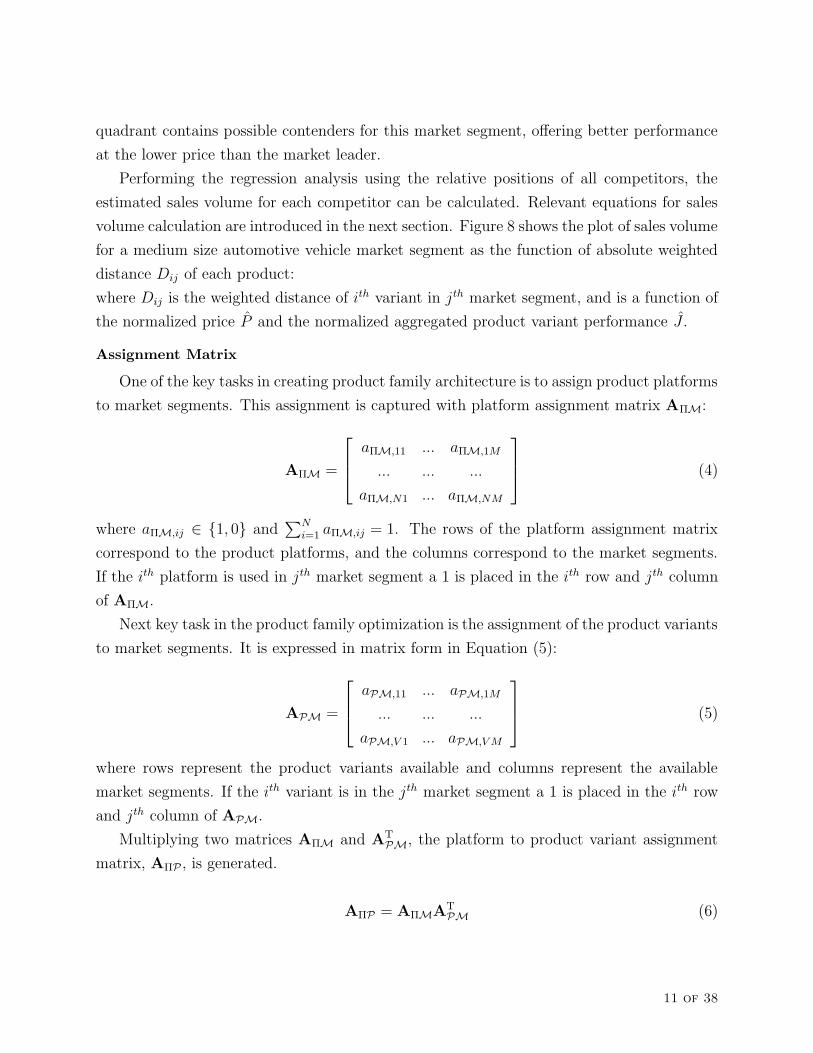
Assignment Matrix
One of the key tasks in creating product family architecture is to assign product platforms
to market segments. This assignment is captured with platform assignment matrix AΠM:
AΠM =
aΠM,11 ... aΠM,1M
... ... ...
aΠM,N1 ... aΠM,NM
(4)
where aΠM,ij ∈ 1, 0 and∑N
i=1 aΠM,ij = 1. The rows of the platform assignment matrix
correspond to the product platforms, and the columns correspond to the market segments.
If the ith platform is used in jth market segment a 1 is placed in the ith row and jth column
of AΠM.
Next key task in the product family optimization is the assignment of the product variants
to market segments. It is expressed in matrix form in Equation (5):
APM =
aPM,11 ... aPM,1M
... ... ...
aPM,V 1 ... aPM,V M
(5)
where rows represent the product variants available and columns represent the available
market segments. If the ith variant is in the jth market segment a 1 is placed in the ith row
and jth column of APM.
Multiplying two matrices AΠM and ATPM, the platform to product variant assignment
matrix, AΠP , is generated.
AΠP = AΠMATPM (6)
11 of 38
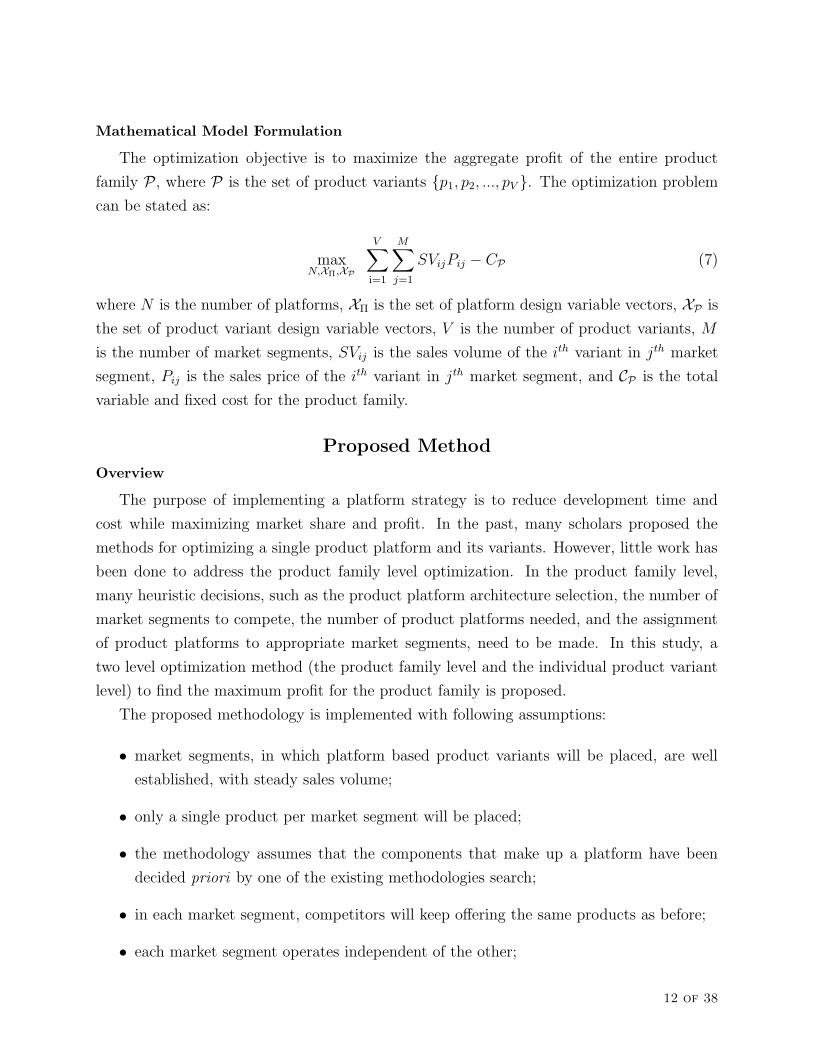
Mathematical Model Formulation
The optimization objective is to maximize the aggregate profit of the entire product
family P , where P is the set of product variants p1, p2, ..., pV . The optimization problem
can be stated as:
maxN,XΠ,XP
V∑
i=1
M∑
j=1
SVijPij − CP (7)
where N is the number of platforms, XΠ is the set of platform design variable vectors, XP is
the set of product variant design variable vectors, V is the number of product variants, M
is the number of market segments, SVij is the sales volume of the ith variant in jth market
segment, Pij is the sales price of the ith variant in jth market segment, and CP is the total
variable and fixed cost for the product family.
Proposed Method
Overview
The purpose of implementing a platform strategy is to reduce development time and
cost while maximizing market share and profit. In the past, many scholars proposed the
methods for optimizing a single product platform and its variants. However, little work has
been done to address the product family level optimization. In the product family level,
many heuristic decisions, such as the product platform architecture selection, the number of
market segments to compete, the number of product platforms needed, and the assignment
of product platforms to appropriate market segments, need to be made. In this study, a
two level optimization method (the product family level and the individual product variant
level) to find the maximum profit for the product family is proposed.
The proposed methodology is implemented with following assumptions:
• market segments, in which platform based product variants will be placed, are well
established, with steady sales volume;
• only a single product per market segment will be placed;
• the methodology assumes that the components that make up a platform have been
decided priori by one of the existing methodologies search;
• in each market segment, competitors will keep offering the same products as before;
• each market segment operates independent of the other;
12 of 38

• the sales price of the product is equal to the Manufacturer’s Suggested Retail Price
with no discounts;
• the proposed entry’s price is set to the sales price of the marker leader for that particular
market segment. Competition occurs over relative performance;
• the sales volume of the product is equal to the number of products produced.
Proposed Methodology
Step 1: Identify market segments and corresponding market leaders
Define a set of market segments M, where M = m1,m2, ...,mM. Individual market
segments are chosen according to the preference of best profit opportunity for the product
family variant and potential for profitable market share. This is a product family level
heuristic variable and is usually determined through financial analysis. In this study, the
market segment setM is assumed to be decided and fixed.
Once the market segment set M is defined, the market leader for each market segment
can be identified. In the proposed methodology, the market leader is defined as the product
with the largest sales volume.
Step 2: Establish the design variable set for each market segment
The second step is to define the product platform design variable set XΠ and the product
variant design variable set XP that belongs to each element in the market segment setM:
XΠ = xπ1 ,xπ2 , ...,xπM
XP = xp1 ,xp2 , ...,xpM
(8)
Set XΠ is a collection of product family level design variables pertaining to the product
platform set Π, and it acts as an imposed constraint for the product variant optimization.
Set XP is a collection of design variables that belongs to the product variant set P and
enables product variants to be optimized to its respective market segment. The flexibility
range of set XP may be limited by the constraint imposed from the platform design variable
set XΠ. In this study, set XΠ and XP are known a priori.
One of the task of optimizing the product family is the assignment of best product plat-
forms for each individual market segment from the available platform set Π. The constraint
is the number of platforms that are allowed to be used for the entire product family, which
ranges from N = 1...M . Let
13 of 38
xπ,Optimum,j = xπ,Leader,j (9)
where xπ,Optimum,j is the optimum platform design vector for jth market segment and xπ,Leader,j
is the platform design vector for the sales leader in the market segment.
The elements of product platform design variable xπ in set XΠ may vary, but there are
critical elements that need to be included and imposed upon all product variants that are
based on the particular platform. They are the target price of the platform based product
variant, the Theoretical First Unit cost of the platform (TFUπ), the Theoretical First Unit
costs of the product variant components (TFUc). The target price for a product that is
based on a particular platform is the sales price of the market sales volume leader where
the platform originated from. TFUπ and TFUc are also functions of the market leader sales
volume as follows:
TFUπ = Cπ
SVLeader,jSV B
Leader,j
TFUc = Cc
SVLeader,jSV B
Leader,j
(10)
where
B = 1−ln((100%)/S)
ln 2(11)
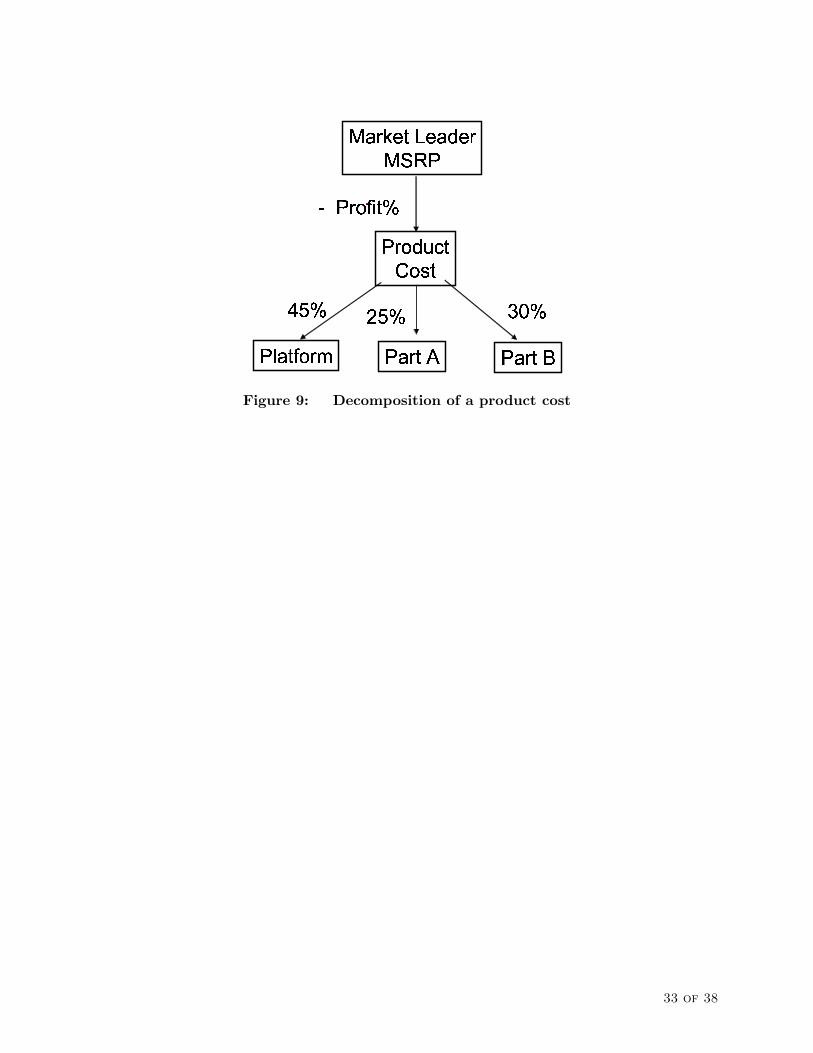
Cπ = PLeader,j (1 - Profit Margin) (Cost Margin)
Cc = PLeader,j (1 - Profit Margin) (Component Cost Margin)(12)
S is the learning curve coefficient. The cost of platform Cπ and the cost of component Cc are
determined from the percentage of total cost, which in turn, is the price of the sales leader
for jth market segment minus the profit margin for that market segment. An example of a
generic product profit and cost decomposition is shown in Figure 9.
In all, N product platforms are created, where N = 1, 2, ...,M . The purpose of creating
platforms for each individual market segment is that when determining the optimum number
of platforms for the entire product family, the platform will be utilized in the order of their
sales volume. For example, when a single platform is used for the entire product family, the
platform with highest sales volume is used. For two platform utilization, two platforms with
largest sales volume are used, and so on. This process continues until each market segment
uses their own platform, indicating customization for each market segments.
14 of 38

Step 3: Identify market specific performance objective functions
Define the market specific performance objective function set JM, where JM = J1,J2, ...,JM.
Objective functions are defined by translating the customer preferred attributes to target
specifications. Examples of objective functions are the CPU speed for personal computers,
0-60 mph acceleration time for automotive vehicles, and copies per minute rate for copiers.
Each objective vector J in set JM has objective values of the corresponding market sales
leader. Also, all objective vectors have the same attributes. The purpose of establishing JM
is to establish the benchmark values for JP , which is the objective function vector set for
product variants set P , subject to optimization.
Usually performance objectives are identified through customer survey and conjoint anal-
ysis. It is assumed that the set of objective functions are already established.
Step 4: Establish objective weight factors for each market segment
Each market segment has its own order of objective function preference. For example, a
truck buyer might consider the cargo volume to be the most important feature, compared to a
compact car buyer, who prefers fuel economy above all other attributes. To mathematically
express different customer preferences for different market segments, the objective weight
factors matrix, Ω, is defined:
Ω =
ω11 ... ω1M
... ... ...
ωQ1 ... ωQM
(13)
where
Q∑
i=1
ωij = 1 (14)
The rows represent different objective functions; columns represent individual market seg-
ments; Q is the number of objective functions; and M is the number of market segments.
For example, if ith objective in jth market segment has a 40% impact on consumer prefer-
ence, 0.4 is placed on that particular cell. The sum of all objective preference for a single
market segment must equal one. This matrix helps to calculate the product variant’s aggre-
gate performance value, which in turn, is used to calculate the product variant’s weighted
performance distance from the leader. Equations for the weighted performance distance are
explained in the later section.
15 of 38

Step 5: Establish the sales volume equation for each market segment
Determining the sales volume of each product variant is a key step of this methodology.
It can be stated that the sales volume of a product variant is a function of its performance
weighted distance, which in turn, is a function of the normalized price and the aggregate sum
of a variant’s performance objective values. The sales volume of ith variant in jth market
segment is:
SVij =SVLeader,jβjDij + 1
(15)
where SVLeader,j is the sales volume of the market leader in jth market segment, Dij is the
performance weighted distance of ith variant in jth market segment, and βj is the curve
fitting coefficient for jth market segment.
The weighted distance, Dij, of ith product in jth market segment is a function of the
normalized price (P ) and the normalized aggregate performance value (J) of a product
variant:
Dij =Pij
Jij
√
(Jij − 1)2 + (Pij − 1)2 (16)
where
Pij =Pij
PLeader,j(17)
and
Jij =
Q∑
k=1
ωkjJij,k
JLeader,j,k(18)
Pij is a normalized price of ith variant in jth market segment respect to the price of the
market leader in PLeader,j . Jij is the normalized aggregate performance objective value of ith
product in jth market segment. Note that Jij is the aggregate sum of k normalized objective
functions multiplied by the corresponding objective function preference weights ωkj, where
ωkj ∈ Ω. The curve fitting coefficient βj for jth market segment is obtained by plotting sales
volume vs. Dij (see Figure 8) for all competitors in the market segment and calculating the
best curve fitting coefficient from the regression analysis. The equations of sales volume vs.
weighted distance curve for each market segment can be obtained by Equations (15) - (18).
16 of 38
Step 6: Product variant optimization
In order to create the best product variant, a good product platform must be assigned
to the target market segment. If there are N product platforms available, the best platform
for jth market segment is determined using following criteria:
maxN
√
√
√
√
n∑
k=1
(xπ,k − xπ,Leader,jk)2 (19)
where xπ is is the platform variable vector element for one of the N platforms available, and
n is the number of platform design variables. At the end, all platforms are assigned to the
appropriate market segment, thus populating the assignment matrix AΠM.
Once the product platform is assigned to the market segment, a market specific product
variant must be optimized to generate the best performance output that will maximize the
sales volume. The optimization problem can be stated as:
minxp
∣
∣
∣Jij − 1
∣
∣
∣
subject to xπ(20)
where xp is the product variant design vector, and xπ is the product platform design vector
that acts as a constraint in variant optimization. The objective of the product variant
optimization is to bring the product variant’s total aggregate performance as close to the
market leader’s value. It is clear from the established equations that the sales volume and
profit of a product variant is closely related to the proximity of the product performance to
that of the market leader.
Step 7: Estimate the total profit of the product family
The total cost of the product family can be expressed as:
CTotal = CP + CCap (21)
where CP is the total sum of the product family variant cost and CCap is the total capital
investment cost. CCap is aggregate sum of investment costs, such as factory cost, die cost
and research and development cost. The capital investment cost is relatively insensitive to
the product family sales volume, and is treated as constant in this paper.
The total variable cost of the product family variant is a function of the TFU ’s and the
sales volume of each variant. The variable cost of an individual product variant i in market
17 of 38

segment j can be expressed as:
Cij = Cπ,ij + CComp,ij (22)
where
Cπ,ij = TFUπ,jSVBij (23)
and
CComp,ij =c
∑
k=1
TFUc,kSVBij,kUc,k (24)
TFUπ,j is the Theoretical First Unit cost of a product platform assigned to j th market
segment and SVij is the sales volume of platform based variant i in the market segment.
The total cost of c number of components can be written in a similar way, with exception of
the usage coefficient Uc,k, which represents the quantity of kth components used in a single
product variant.
Calculate the total profit of the product family using Equation (7), given the constraints
V = M and N = 1...M. Repeat the process by varying the number of platforms from
N = 1...M .
Limitations:
The proposed method has certain limitations which must be considered:
• the methodology is applicable to existing, well established market segments and prod-
ucts, with known customer preferences and sales volumes;
• since the product platform specifications for each market segment complies with the
market leader specifications, the product platform model is quite sensitive to annual
changes in the market leader.
• Proposed methodology benchmarks against the current market leader.
In the next section, a case study of an automotive vehicle family optimization is presented
as a hypothetical example. The optimum number of platforms is determined through the
execution of the proposed methodology.
18 of 38
Case study: An automotive vehicle family
Problem Background
A new automotive manufacturer is preparing to enter the competitive automotive market.
The manufacturer has identified seven market segments for its entry products. The manu-
facturer has to determine the optimum number of vehicle platforms, N , that will maximize
the profit of the vehicle product family.
Methodology Implementation
Step 1: Identify market segments and corresponding market leaders
The manufacturer decided to develop vehicles for following market segments: Low Com-
pact Sedan (LOW), Mid-size Sedan (MED), Luxury Sedan (LXD), Sports Car (SPT), Sports
Utility Vehicle (SUV), Pickup Truck (PUP), and the Van (VAN) segment, respectively. The
vehicle market segments selected for product entry are shown in Figure 10.
For the vehicle product family, following family level decisions were made:
• only one product entry per market segment (V =M);
• the basic vehicle architecture is body-on-frame (BOF);
• the fixed operating cost per year (CCap) is four billion dollars;
• each vehicle will be offered at the same price as the segment leader (Pij = PLeader,j).
Next, the market leader for each market segment is identified according to the vehicle
sales volume for year 2001. For example, the Ford Explorer is designated as the market
leader for SUV market segment. Manufacturer suggested retail price of the market leader is
obtained through publicly available data on the internet.?
Step 2: Identify the product platform variables set and product variant variables set for
each market segment
It is important to define the vehicle platform design variable set XΠ and the vehicle
variant design variable set XP :
XΠ = xπ1 ,xπ2 , ...,xπ7; xπ = WB,WT
XP = xp1 ,xp2 , ...,xp7; xp = ED,HT
WB is the vehicle wheelbase, WT is the vehicle wheel track, ED is the engine displace-
ment, and HT is the vehicle height. All market segments have same platform design vector
19 of 38

and product variant design vector variables, but the values of these variables are different
depending on the market segment specifications.
Next task is to establish the appropriate product platform design vector values. Since
there is one platform for each market segment, total of seven platform design vectors are
created. Using the Equation (9), market leader’s design vector values are assigned as the
optimum platform design vector values for that particular market. For example, in the
mid-size sedan segment (MID), the optimum platform design vector elements WB and WT
values are values of Honda Accord, current sales volume leader in the market.
Final task in creating the platform model for each market segment is to calculate the
TFUs for the platform and other components. For this particular case study, the cost
decomposition of the automotive vehicle is shown below:
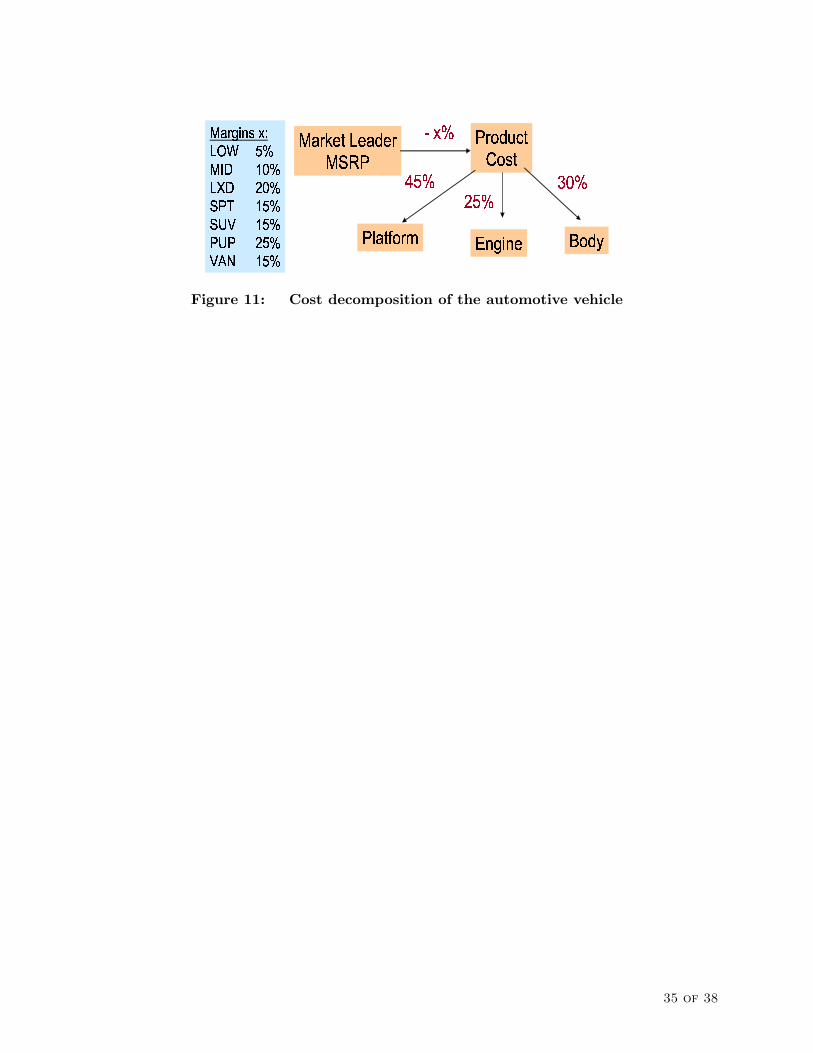
Each market has different profit margin. This is due to the fact that in general corporate
strategy, a company sets higher profit margin for more luxurious products, since customers
in this market segments are more willing to pay for them.
In the vehicle family example, a vehicle cost is decomposed into a platform cost, an
engine cost, and a body cost. Their respective cost margin is shown in the Figure 11. With
Equation (10) and 23), TFUπ and TFUc for each platform was determined.
Step 3: Identify market specific performance objective functions
When customers purchase automotive vehicles, many performance criteria are consid-
ered. Example of such criteria are acceleration (AC), horsepower (HP), fuel efficiency (FE),
passenger volume (PV), and cargo volume (CV), to just name a few. For this case study, five
performance criteria that mentioned previously are used as elements of J for each market
segment. Translating it in mathematical terms:
JM = J1,J2, ...,J7
JM = AC,HP, FE, PV,CV
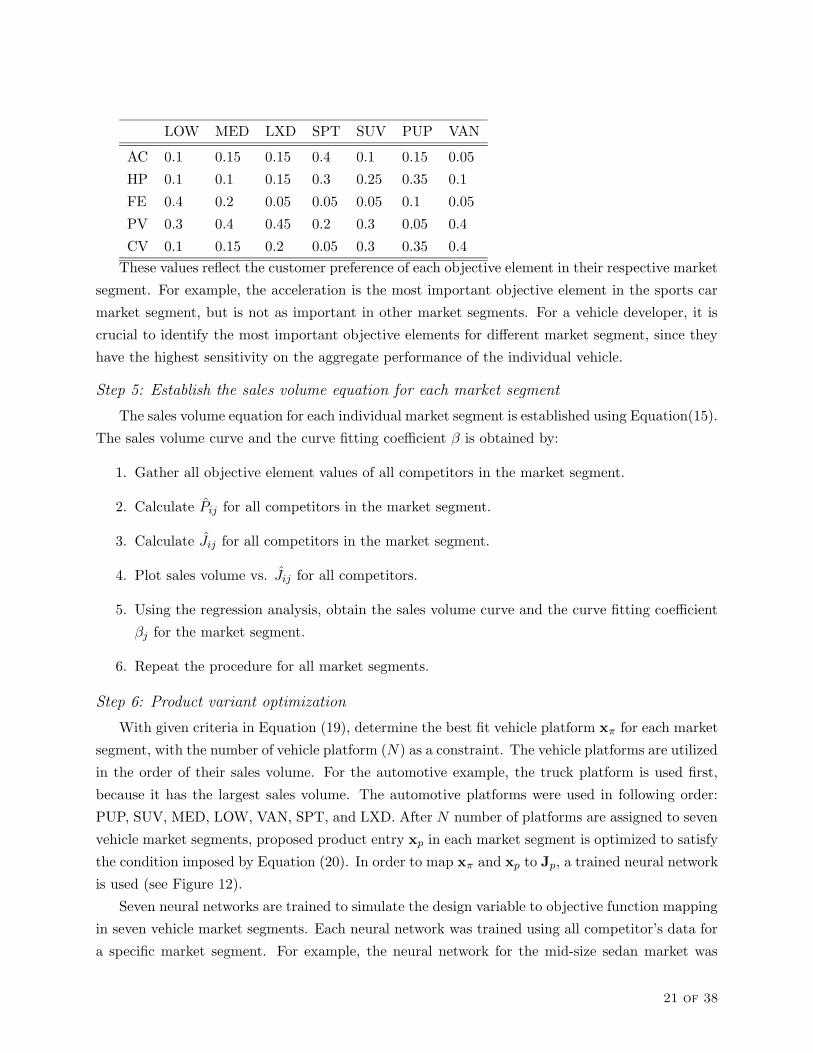
Step 4:Establish objective weight factors for each market segment
The object preference weight matrix (Ω) is created. The values of Ωij for seven different
market segments is shown below:
20 of 38
LOW MED LXD SPT SUV PUP VAN
AC 0.1 0.15 0.15 0.4 0.1 0.15 0.05
HP 0.1 0.1 0.15 0.3 0.25 0.35 0.1
FE 0.4 0.2 0.05 0.05 0.05 0.1 0.05
PV 0.3 0.4 0.45 0.2 0.3 0.05 0.4
CV 0.1 0.15 0.2 0.05 0.3 0.35 0.4
These values reflect the customer preference of each objective element in their respective market
segment. For example, the acceleration is the most important objective element in the sports car
market segment, but is not as important in other market segments. For a vehicle developer, it is
crucial to identify the most important objective elements for different market segment, since they
have the highest sensitivity on the aggregate performance of the individual vehicle.
Step 5: Establish the sales volume equation for each market segment
The sales volume equation for each individual market segment is established using Equation(15).
The sales volume curve and the curve fitting coefficient β is obtained by:
1. Gather all objective element values of all competitors in the market segment.
2. Calculate Pij for all competitors in the market segment.
3. Calculate Jij for all competitors in the market segment.
4. Plot sales volume vs. Jij for all competitors.
5. Using the regression analysis, obtain the sales volume curve and the curve fitting coefficient
βj for the market segment.
6. Repeat the procedure for all market segments.
Step 6: Product variant optimization
With given criteria in Equation (19), determine the best fit vehicle platform xπ for each market
segment, with the number of vehicle platform (N) as a constraint. The vehicle platforms are utilized
in the order of their sales volume. For the automotive example, the truck platform is used first,
because it has the largest sales volume. The automotive platforms were used in following order:
PUP, SUV, MED, LOW, VAN, SPT, and LXD. After N number of platforms are assigned to seven
vehicle market segments, proposed product entry xp in each market segment is optimized to satisfy
the condition imposed by Equation (20). In order to map xπ and xp to Jp, a trained neural network
is used (see Figure 12).
Seven neural networks are trained to simulate the design variable to objective function mapping
in seven vehicle market segments. Each neural network was trained using all competitor’s data for
a specific market segment. For example, the neural network for the mid-size sedan market was
21 of 38
trained using data of over twenty five vehicles that are competing in the market segment. If there
are clear mathematical relationship between the design vectors and the objective functions, it can
take place in lieu of neural network.
With constraint imposed on the vehicle family by the number of platforms it can use, vehicle
objective function Jp in their respective market segments were optimized by perturbing xp, while
keeping xπ constant.
Step 7: Estimate the total profit of the product family
Total cost of the product family is calculated by summing up the cost of vehicles manufactured
for each market segment plus the capital investment. For this particular vehicle family, the vehicle
cost is divided into a platform cost, an engine cost, and a body cost. With TFUs obtained from Step
2 and implementing Equation (21) - (24), the total cost of individual vehicle variant is obtained.
Summing up the cost from seven vehicle variants and the initial $4 Billion investment, the total
cost of the vehicle family (CP) for N platform is calculated. Finally, the total profit is obtained by
Equation (7). Repeat the procedure with N = 1..7 platforms.
Results and observation
Figure 13 shows the profit for total product family, P, given N = 1, 2, . . . , V platforms.
Profit is maximized when three vehicle platforms are implemented. A vehicle family produced
lowest profit when N = 1, due to the fact that performance had to be compromised by an exces-
sively high level of commonality. It is interesting to note that the product family with customized
platforms for each market segment (N = 7) was able to generate the second highest profit. This was
due to the fact that the vehicle entry in each market segment was optimized to match the market
leader performance without the constraint of the number of platform, N . It was also observed that
with increasing number of platforms, the performance penalty decreases, but with increasing CP
as the consequence.
The platform strategy corresponding to the highest profit is shown in Figure 14. The truck
market segment has its own customized platform, since it commands the highest sales volume. The
other two platforms are shared among similar sized vehicles, which indicates a horizontal levering
strategy.
Conclusion
In this paper, a quantitative method to determine the optimum number of platforms for a
product family is proposed. Using the sales volume function based on relative product performance,
the total sales volume of a platform-based product can be estimated. The total profit of a product
family based on fixed number of platform was obtained from product family sales volume and total
product family costs. The optimum number of platforms compromises the best balance between
22 of 38
variable cost savings and performance losses due to parts commonality. The proposed methodology
was applied to a hypothetical automotive vehicle family, where the optimum number of vehicle
platforms was determined for a given number of variants. Both the aggressive platform strategy
(use N = 3 platforms for seven market segments) as well as the no leveraging strategy appear to
be promising based on this case study.
Further research
In this study, a limited two level optimization scheme was implemented to find the optimum
number of product platforms. The next step is to develop a methodology to determine best product
architecture and to determine the best market segments. Proposed task will be possible by measur-
ing the sensitivity of different objective functions with respect to different family design variables.
The decision maker’s task is to choose architecture design variables with high sensitivity and low
change cost. As part of research effort, a fully integrated two level optimization scheme will be
developed.
23 of 38
List of Figures1 The evolution of the ratio V/N for a sample of leading automotive manufacturers 252 Three products built on a common platform . . . . . . . . . . . . . . . . . . 263 Various platform strategies . . . . . . . . . . . . . . . . . . . . . . . . . . . . 274 Overview of corporate product platform strategy . . . . . . . . . . . . . . . . 285 Two level optimization approach . . . . . . . . . . . . . . . . . . . . . . . . . 296 Price vs. Sales Volume (SUV Market) . . . . . . . . . . . . . . . . . . . . . . 307 Relative position of market competitors . . . . . . . . . . . . . . . . . . . . . 318 Sales volume curve for mid-size sedan market segment . . . . . . . . . . . . . 329 Decomposition of a product cost . . . . . . . . . . . . . . . . . . . . . . . . . 3310 Vehicle market segments . . . . . . . . . . . . . . . . . . . . . . . . . . . . . 3411 Cost decomposition of the automotive vehicle . . . . . . . . . . . . . . . . . 3512 Neural network model for an automotive vehicle . . . . . . . . . . . . . . . . 3613 Product Family Profit for Number of Platforms . . . . . . . . . . . . . . . . 3714 Optimum Platform Strategy . . . . . . . . . . . . . . . . . . . . . . . . . . . 38
24 of 38
Average Models per Platform: Trucks
0.0
1.0
2.0
3.0
4.0
5.0
6.0
7.0
8.0
1997 1998 1999 2000
GMGMFordFordToyotaToyotaVWVW
Figure 1: The evolution of the ratio V/N for a sample of leading automotive manu-facturers
25 of 38

A
B C D
A
BC
A
B CE E
Product 1 Product 2 Product 3
Figure 2: Three products built on a common platform
26 of 38

Low-End
Mid-Range
High-End
Luxury
Brand A Brand B Brand C Brand D
“MarketSegment”
VerticalLeveraging
BeachheadApproach
No Leveraging
HorizontalLeveraging
Figure 3: Various platform strategies
27 of 38
! !"$# % # &'# (*)$+
,-./
,01.2 .435./'678)9& :<;(<= )$+
>? @BADCEGFHIJ@GHLK ? ML>N? @GO
PQ@1OBRSC@UTVAWRUFK OYX>? @1O
PQ@GFZV[<A\K OYX>? @GO
] ^
_`ba<c _`baBc
] ^
`*cbc9d e*fSc>? @BADCEGFHhg>? @<AiCEJFjHlk>N? @BADCEGFHnm
opUqsr pJtBu1vo4pUqwr pJtxuNy
z* ] $| _/d f c
o4pUqwr pGtBu~aY `! c
^*^ c c
d f
pUqsS<uy>*g4g>Vgk>*g4m
4w~W/'sW1
NSQ! QB<J B¡x¢Y£Y¤SG¥ Y¤i¦S NYQ* QB<J B¡x¢<£S¤SG¥ <¤D¦Y
§pJqY<uv
pUqsS<u
Figure 4: Overview of corporate product platform strategy
28 of 38
Product Portfolio
Individual Product
DecisionVector
ObjectiveVector
Market segments# Platforms
Product architecture
Market shareVariable Cost
Profit(Platform Architecting) (Platform Architecting)
FAMILY LEVEL
VARIANT LEVEL
(Product Design & Optimization) (Product Design & Optimization)
Selected platformProduct design
variablesstyling
PerformancePerceived Value
CostRelative Market
Position
i=1…N
Figure 5: Two level optimization approach
29 of 38
Sales Volume vs MSRP - SUVs
$10,000
$20,000
$30,000
$40,000
$50,000
$60,000
$70,000
$80,000
0 100000 200000 300000 400000 500000
Sales Volume
MS
RP
Figure 6: Price vs. Sales Volume (SUV Market)
30 of 38

¨Q©ªi«~¬8 ®4©5¯°±D¬8'°²´³¶µ·Vµ ¬¸©«¹©4·º¸»¼¾½
¿YÀJÁ ÂYÀ¿YÀJÁ ÃSÀ¿YÀJÁ ÄYÀ¿YÀJÁ ÅYÀ¿GÆSÁ ÀYÀ¿GÆSÁ'Æ8À¿GÆSÁ Ç<À¿GÆSÁ ÈYÀ¿GÆSÁ ÉBÀ¿GÆSÁ ÊYÀ¿GÆSÁ ÂYÀ
ÀUÁ Ä<ÀYÀ ÀUÁ Å<ÀYÀ ÆSÁ ÀYÀ<À ÆSÁ'Æ8À<À Æ!Á ÇBÀYÀËÌJÍ ÎSÏÐ ÑxÌÒGÌUÓWÔÕ1ÓÖ×ÎUØBÙYÌ
Ú ÛÜ ÝÞß àÛá âß ãÛ
ä åçæèéNêUë\ìNêJíîìNï
äBæ4ðñGìïòxóUéôGìîíääxæõéNêGóxéNöôGì1ë÷ ë÷ ñJì
äääBæùøêGíîìNïòxóxéNôGìîí
Figure 7: Relative position of market competitors
31 of 38
ú§ûüiýþ´ÿü5ý¶úýþ Qú
! ! ! ! " ! # $ %&('*),+.-/&.0213' 45-76(8(9:&<;>=7?A@CBD&.6:0E&(=F3G
H IJ KLM NJ OPK
Figure 8: Sales volume curve for mid-size sedan market segment
32 of 38
QSRUTVEWXZYW3R3[3W\TQ^]`_a
abTdc3[\egf,Xh cjikX
aml*RX7ndcUTo a<RUTXp a<RUTXZqrUsut v sut w3x t
yy abTdcnz Xt
Figure 9: Decomposition of a product cost
33 of 38

|~`|k
<
b
7UA,g g ¡¢
£¤
Figure 10: Vehicle market segments
34 of 38
¥¦§¢¨$©5ªE«!©.¦.¬.©§¥Z®3¯ ¯§±°.¬²!³´ªµ °:¶ª
¯· ¦5ª¹¸°§»º ¼¾½!¿À ½ © Á °.¬5ÂÃ(Ä(Å Æ Ä(Å Ç.È ÅÉ(Ê ÅËÌÍ ÎÏ ÐÑ,ÒÓÔÕAÖ ×´ØËjÙ Ú ÛÜ´ØÔÝAÚ Þ´Ü´Øßàá Û×´Øßâ:ã Û×´Øà.âEà Þ´×´Øã:ä,å Û×´Ø
Figure 11: Cost decomposition of the automotive vehicle
35 of 38
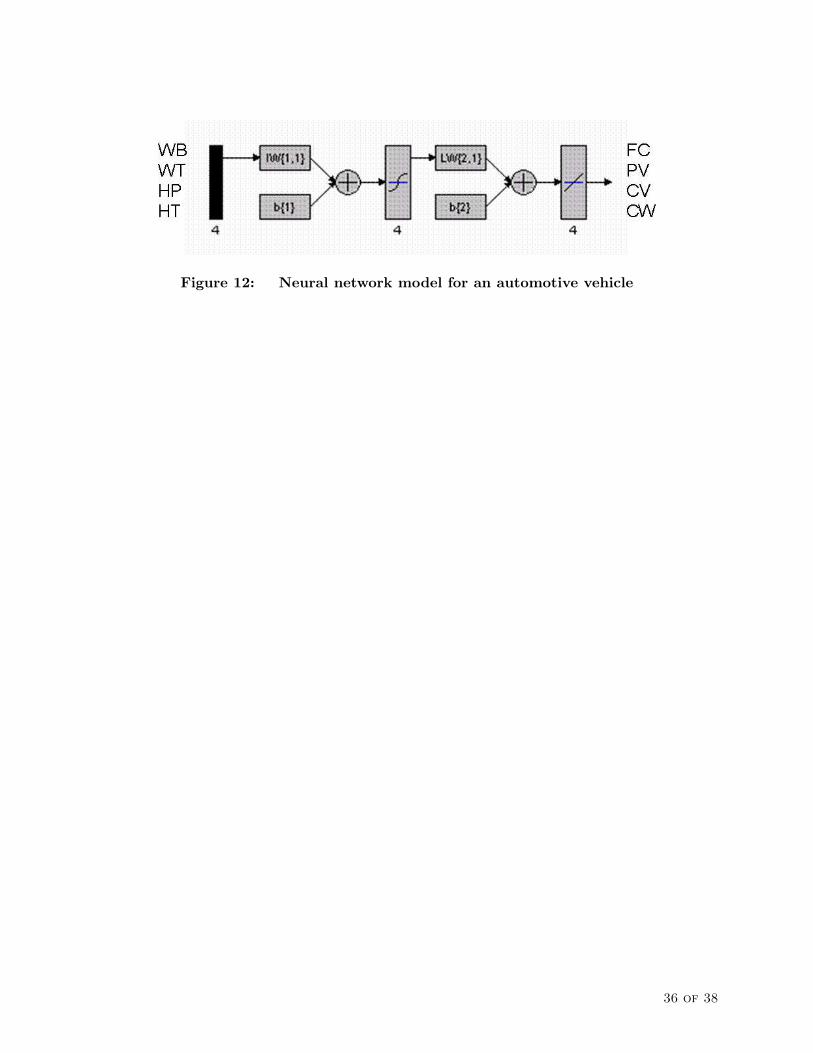
Figure 12: Neural network model for an automotive vehicle
36 of 38

æ ç è é ê ë ìíí!î çíî éíî ëíî ïææðî çæðî éæðî ëæðî ïç
ñAòó3ô$õö÷$ø:ùDú û´ü ø¹÷öýóþjñ
ÿ ÿ
Figure 13: Product Family Profit for Number of Platforms
37 of 38

"!$#%
'&)(
(+*+,
-/.1032304.65798;:=<?>A@ 7CBEDGF . @
#%HJI
Figure 14: Optimum Platform Strategy
38 of 38