product latest newscdn.bdigital.org/pdf/bigdatacongress2016/20.kingeclient.pdfsocial 4% other 1%...
TRANSCRIPT

PRODUCT LATEST NEWS
Sr. Mustafa Can Ödezmir
Data Visualization Expert
King e-Clienthttp://king-eclient.com
@king_eclient

3
Modular Data Visualization Model by
KEC & Tableau
4
Index
1. Introduction
2. Who we are
3. Looking Back
4. The Power of Data
5. How to Merge Concepts?
6. Tableau – “A mission that matters”
7. Why do we use Tableau?
8. Examples – KEC Project
9. Conclusion

5
1. Introduction
We as KEC, will be presenting the use of a concept in terms of Website Analytics, Website
Metrics and User Experience.
It is a service which combines all the crucial information of
websites all in just one dashboard!

6
2. Who we are
King-eClient is an eBusiness UX consultancy
firm with a section specialized on digital
consultancy.
Our mission is to guide and walk our clients to
their objectives thanks to our expertise and
innovative methodology in the online sector.
7
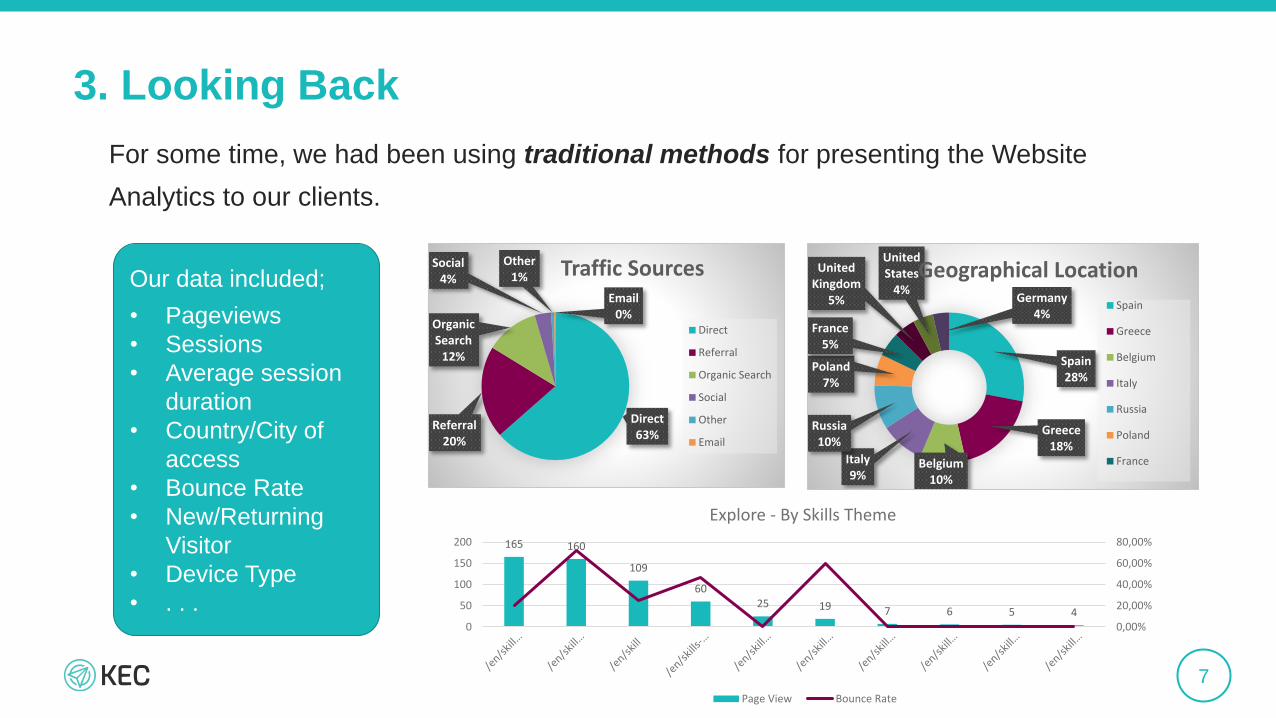
3. Looking Back
For some time, we had been using traditional methods for presenting the Website
Analytics to our clients.
Our data included;
• Pageviews
• Sessions
• Average session
duration
• Country/City of
access
• Bounce Rate
• New/Returning
Visitor
• Device Type
• . . .
Direct63%
Referral20%
Organic Search
12%
Social4%
Other1%
Email0%
Traffic Sources
Direct
Referral
Organic Search
Social
Other
165 160
109
6025 19 7 6 5 4
0,00%
20,00%
40,00%
60,00%
80,00%
0
50
100
150
200
Explore - By Skills Theme
Page View Bounce Rate
Spain28%
Greece18%
Belgium10%
Italy9%
Russia10%
Poland7%
France5%
United Kingdom
5%
United States
4%Germany
4%
Geographical Location
Spain
Greece
Belgium
Italy
Russia
Poland
France

8
4. The Power of Data
Data Intelligence
UserDecision makingData Visualization
High value opportunities
9
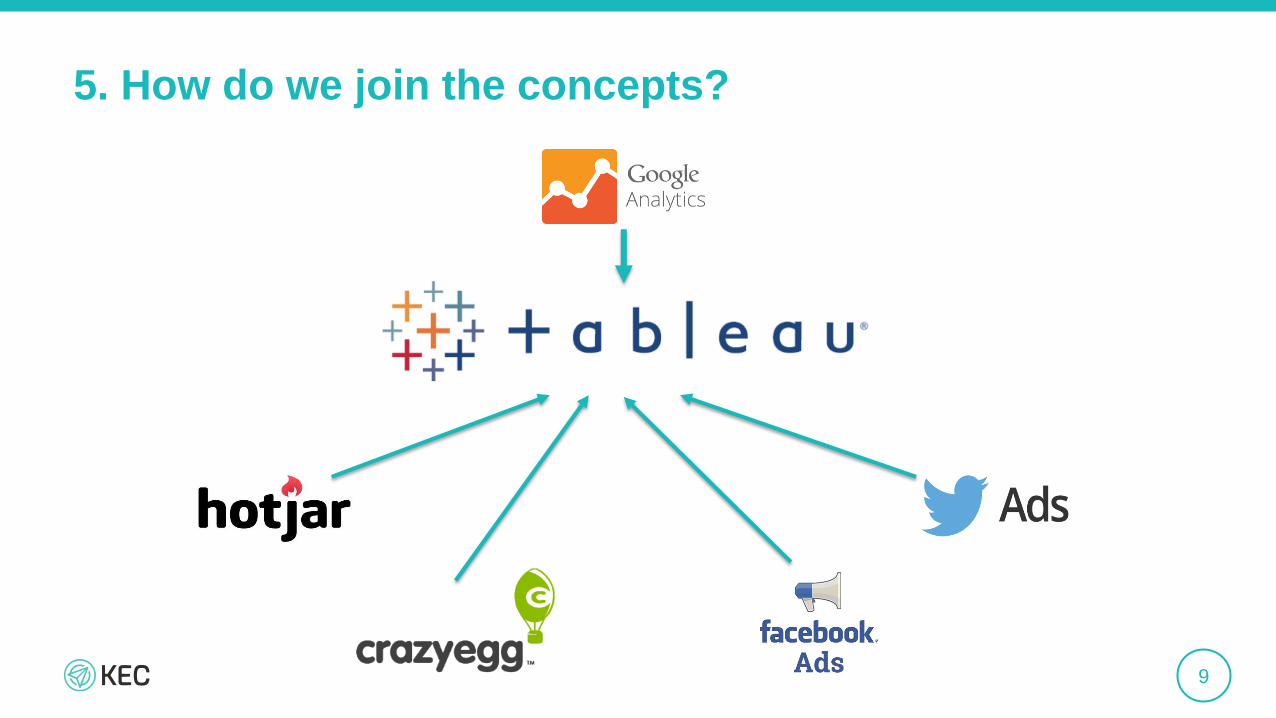
5. How do we join the concepts?

10
6. Tableau - “A mission that matters”
“We help people see and understand their data. Eight words that
drive everything we do. And they’ve never been more important”
Tableau is business intelligence software that allows anyone to easily connect to data, then
visualize and create interactive, shareable dashboards.

11
7. Why do we use Tableau?
What are the main benefits of this tool?
But most importantly;
• Very quick load and connections to data sources
• Simple drag and drop functions
• High-performance Data Engine
• Effortless and pleasant
• Fun and interactive
Requires minimum IT skills, making it suitable for almost anyone!

12
8. KEC Project Example
.
What will we include in the dashboards?
• Pageviews
• Sessions
• Time on Page
• Bounce Rates
• Geographic Locations
• Device Category (Mobile, Desktop, Tablet)
• New vs Returning Visitor
• Top Referrals
• Top Website Content

13
9. Conclusion
The main perks of such a concept is that it can explain so much in just a very simple
and easy manner while also giving much more detail in terms of information.
All in all, it is a vital concept to understand the website analytics in a
more detailed, interactive and informative way!

14
If a picture is worth than a 1.000 words,
a good data visualization is worth than a 1.000 pictures!
15
Thank you !