product maturity metrics (pmms)
TRANSCRIPT

APT Proprietary
Product Maturity Metrics (PMMs) — a concise and effective way to assess and communicate program risks —
Dr. Thomas Fiorino
703-237-9545
4 June 2012
Advanced Product
Transitions
© Copyright 2011 APT Corp. All Rights Reserved.

Advanced Product Transitions
APT Proprietary
Why Product Maturity Metrics™ (PMMs)? • Over the last ten years various GAO audits and reports, Nunn-McCurdy breaches
(high cost, delayed programs) and test/field failures all point to a DOD acquisition process that needs improvement. Highlights of the GAO findings are: ▫ There is little incentive for DOD program managers to capture knowledge early in the
development process ▫ In 2008 the cumulative cost growth of 96 major defense acquisition programs was $296
billion ▫ The total acquisition costs for these programs increased 25% from first estimates ▫ The average delay in delivery to the war-fighter was 22 months ▫ DOD needs to do a better job ensuring acquisitions begin with realistic plans and
baselines prior to the start of development
• The April 2009 GAO report further delineates a clear set of prerequisites that must be met by each program’s acquisition strategy before a measurement of the program’s health will be of real value ▫ Establishing an evolutionary, knowledge-based business case for each acquisition ▫ Separating technology development from product development ▫ Limiting time and requirements for product development to manageable levels ▫ Employing systems engineering early on in the process to arrive at realistic cost and
schedule estimates
© Copyright 2011 APT Corp. All Rights Reserved. 2

Advanced Product Transitions
APT Proprietary
PMM Background • In 2002 Engineering Manufacturing Readiness Levels (EMRLs) were developed for
the Missile Defense Agency as a standardized methodology to assess risk during product development and production utilizing: ▫ DoD and Industry Best Practices ▫ Willoughby Templates ▫ GAO recommendations
• EMRLs have proven to be effective as a streamlined, objective measure of product maturity and risk identification at key milestones in programs such as: ▫ Aegis BMD and THAAD ▫ H1 Helicopter, ARH-70A Helicopter, P-8A Aircraft, JSF, and F135 Engine
• EMRLs incorporate and streamline both Manufacturing Readiness Levels (MRLs) and Technology Readiness Levels (TRLs), in addition to incorporating the broader programmatic risks ▫ MRLs focus on in depth evaluation of manufacturing ▫ TRLs focus on in depth evaluation of technology
• PMM criteria and metrics, refined and enhanced to improve their utility, were developed to provide differentiation from MRLs and TRLs while maintaining the EMRL concept of an easy-to-use tool to assess product maturity during development and production
3 © Copyright 2011 APT Corp. All Rights Reserved.

Advanced Product Transitions
APT Proprietary
PMM Benefits • PMMs provide the product manager (PM), integrated product teams
(IPTs), and independent reviewers with an easy to use, resource friendly means to:
▫ Assure systems engineering is employed early on in the development process
▫ Assure realistic plans and baselines are in place at the start of development
▫ Measure technology and design maturity before entering product development
▫ Limit time and requirements for product development to manageable levels
▫ Capture knowledge early in the development process and reduce the risks of cost, schedule and performance problems
• PMMs provide the PM and others the ability to quickly assess product development high risks as part of scheduled product status reviews in addition to major milestones or gate reviews
• PMMs provide PMs with 20 criteria and associated metrics, enabling them to concisely and effectively assess product development status and risks at the product level, as well as lower levels in the supply chain
4 4 © Copyright 2011 APT Corp. All Rights Reserved.

Advanced Product Transitions
APT Proprietary
PMM Description Product Maturity Metrics™ are a means of concisely and effectively assessing and communicating the degree to which a product is designed to be producible, reliable, sustainable, and affordable.
PMMs:
• Measure product maturity during all phases of design, development, and production
• Establish a level of risk at each product development milestone
• Capture knowledge required to successfully transition with minimal risk
• Measure time certain development and delivery of a product during design, development, and production
• Are composed of five gates matched to an established product development milestone with twenty consistent criteria and corresponding metrics
5
PMMs provide concise and easy to use measures of product maturity and risk
© Copyright 2011 APT Corp. All Rights Reserved.

Advanced Product Transitions
APT Proprietary
PMM Best Practices
6
PMM 1
Entrance to Technology Development
PMMs (Product Maturity)
PMM 3
Entrance to Product Demonstration
PMM 5
Entrance to Full Rate Production
PMM 4
Entrance to Low Rate Initial Production
PMM 2
Entrance to Product Development
C A B
DoD 5000.02
Materiel Solution
Analysis
Technology
Development
Engineering and Manufacturing
Development
Production and
Deployment
Ops and
Support
PDR LRIP CDR SRR FRP ASR
© Copyright 2011 APT Corp. All Rights Reserved.
• PMM 1 – ASR complete before Milestone A decision • PMM 2 – PDR complete before Milestone B decision • PMM 3 – CDR complete and design stability demonstrated
Note: An analysis of current ASR, PDR, and CDR guidance and checklists shows a lack of
consistency and completeness from one review to the next across the Acquisition Lifecycle
Framework.

Advanced Product Transitions
APT Proprietary
Product Maturity Gates
7
PMM 1
Entrance to Technology Development
PMMs (Product Maturity)
PMM 3
Entrance to Product Demonstration
PMM 5
Entrance to Full Rate Production
PMM 4
Entrance to Low Rate Initial Production
PMM 2
Entrance to Product Development
C A B
DoD 5000.02
Materiel Solution
Analysis
Technology
Development
Engineering and Manufacturing
Development
Production and
Deployment
Ops and
Support
PDR LRIP
CDR SRR FRP ASR
Time Certain Development and Delivery
1 to 2 years 2 to 5 years 1 to 3 years
© Copyright 2011 APT Corp. All Rights Reserved.

Advanced Product Transitions
APT Proprietary
PDR LRIP CDR SRR FRP ASR
Phased Maturity • To minimize product development risks, products lower in the supply chain should
be more mature in development (at a higher PMM gate) than the next higher level product
• As example, an infrared heat-seeking missile: ▫ Missile has met the entrance criteria for the Product Development Phase (Milestone
B/PDR) ▫ Sensor Assembly has met the entrance criteria for product demonstration (CDR) ▫ Focal Plane Array should be at or near Low Rate Initial Production (LRIP)
8
Focal Plane Array
PMM 4
Missile PMM 2
PMMs (Product Maturity)
PMM 1 Entrance to Technology Development
PMM 3 Entrance to Product Demonstration
PMM 5 Entrance to Full Rate Production
PMM 4 Entrance to Low Rate Initial Production
PMM 2 Entrance to Product Development
Sensor Assembly
PMM 3
© Copyright 2011 APT Corp. All Rights Reserved.

Advanced Product Transitions
APT Proprietary
Performing an Assessment
• To implement a PMM assessment for a product, the PM must first determine where the product, subsystems, and components are in the development cycle based on the scheduled reviews and milestones ▫ This will establish the maturity gate against which the product and lower level
products in the supply chain should be assessed ▫ PMM assessments should be performed from Materiel Solution Analysis until
the product is transitioned from production
• To transition from one phase of development to the next with minimal risk, all of the entrance criteria for a particular gate or milestone should be met
9
PMM 1
Entrance to Technology Development
PMMs (Product Maturity)
PMM 3
Entrance to Product Demonstration
PMM 5
Entrance to Full Rate Production
PMM 4
Entrance to Low Rate Initial Production
PMM 2
Entrance to Product Development
C A B DoD 5000.02
Materiel Solution
Analysis
Technology
Development
Engineering and Manufacturing
Development
Production and
Deployment
Ops and
Support
PDR LRIP CDR SRR FRP ASR
© Copyright 2011 APT Corp. All Rights Reserved.
Advanced Product Transitions
APT Proprietary
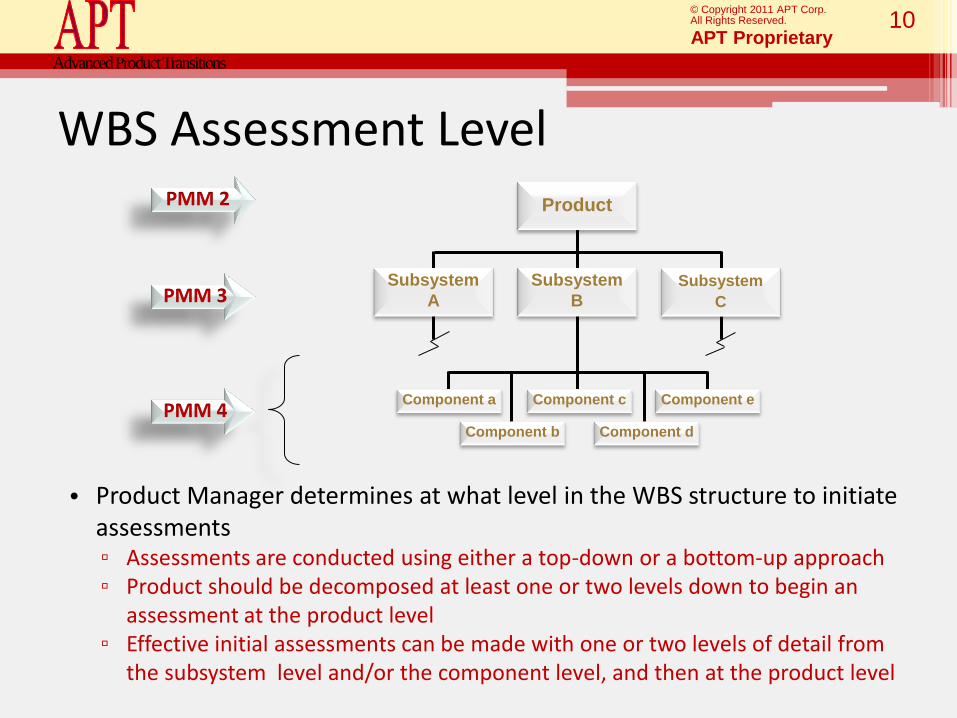
WBS Assessment Level
• Product Manager determines at what level in the WBS structure to initiate assessments ▫ Assessments are conducted using either a top-down or a bottom-up approach ▫ Product should be decomposed at least one or two levels down to begin an
assessment at the product level ▫ Effective initial assessments can be made with one or two levels of detail from
the subsystem level and/or the component level, and then at the product level
10
PMM 2
PMM 3
PMM 4 Component a Component c
Component d
Component e
Component b
Subsystem
A
Subsystem
B
Product
Subsystem
C
© Copyright 2011 APT Corp. All Rights Reserved.

Advanced Product Transitions
APT Proprietary
PMM Templates The assessment template consists of two worksheets
• The detail worksheet
▫ Lists several sub-factors or guidance for each criterion
▫ Has area for capturing evidence and notes
▫ Automatically updates the summary worksheet
• The summary worksheet
▫ Shows the 20 entrance criteria
▫ Shows the one page score summary
▫ Is useful for reporting purposes
11
The assessment is conducted using the detail sheets
© Copyright 2011 APT Corp. All Rights Reserved.

Advanced Product Transitions
APT Proprietary
PMM Detail Sheets
• Rate the risk of 20 criteria and metrics
• Sub-factors for guidance only • Capture evidence and notes
12 © Copyright 2011 APT Corp. All Rights Reserved.

Advanced Product Transitions
APT Proprietary
The PMM assessment uses a Green, Yellow, and Red color scheme to rate the maturity and risk for each of the twenty entrance criteria listed. Each color is defined as follows:
Green – Product meets the entrance criterion or requirement for the gate assessed and is within cost and schedule
Yellow – Product does not meet the entrance criterion or requirement for the gate assessed; however, the entrance criterion or requirement will be met without impact to cost or schedule
Red – Product does not satisfy the entrance criterion or requirement for the gate assessed and meeting the criterion will impact cost, schedule, or both
N/A – “Not applicable” should be avoided; use only if the criterion does not apply at the gate of product being assessed
Risk Rating Criteria Metrics by Color
13 © Copyright 2011 APT Corp. All Rights Reserved.

Advanced Product Transitions
APT Proprietary
PMM Assessment – Block Report • A WBS overview
display can be constructed based on PMM assessments performed
• Display shows high risks at all WBS levels assessed
14 © Copyright 2011 APT Corp. All Rights Reserved.
Assessment
Date: 12/15/10 11/30/10 11/15/10 12/1/10 12/2/10 12/3/10 11/27/10 11/28/10 11/29/10 11/30/10M
iss
ile
Mis
sil
e S
tru
ctu
re
Se
ns
or
As
sy
Bo
os
ter
Mo
tor
Co
mm
Su
b-s
ys
tem
Ord
ina
nc
e S
ub
-sy
ste
m
Te
les
co
pe
Ele
ctr
on
ics
Inte
gra
ted
De
wa
r
Fo
ca
l P
lan
e A
rra
y
1 Y Y Y Y G G Y Y Y Y
2 R R Y G G G G G G G
3 Y G Y G G G Y G G G
4 Y G Y G G G G G G G
5 Y G G G G G Y G Y G
6 R G R G G G Y G Y R
7 G G G G G G G
8 Y G Y G G G Y G Y G
9 R G R G Y G Y G Y R
10 Y G Y G G G Y G Y G
11 Y G G G Y G
12 R R G G G G
13 R G R Y Y G Y Y Y R
14 Y G Y G G G G G G Y
15 R R G G G G G G G G
16 Y G G Y G G G G G G
17 R G R G G G G G R G
18 Y G Y Y G G Y Y Y Y
19 Y G Y G G G Y G Y Y
20 R G R G G G R G G R
PMM 2 PMM 3 PMM 4
Criteria
Number

Advanced Product Transitions
APT Proprietary
PMM Assessment – Flag Report
15
Display shows high risks at all WBS levels assessed
© Copyright 2011 APT Corp. All Rights Reserved.
PMM 2
PMM 3
PMM 4
Y R Y Y Y R G Y R Y Y R R Y R Y R Y Y R
Y G G G G G G G G G G G Y G G Y G Y G G G G G G G G G G Y G Y G Y G G G G G G G
Y R G G G G G G G G G R G G R G G G G G Y Y Y Y G R G Y R Y G G R Y G G R Y Y R G G G G G G G G G G G G G G G G G G G G
YGGGGR GRG RYGGGYYR
YGGGYY YYY YGGGRYYG
YGGGGGGGGG YGGGGYGG
YGYGYY YYY YGGGGYYR
MISSILE
Ordinance Sub-system
Comm Sub-systemBooster Motor
Sensor AssyMissile Structure
Integrated Dewar
Focal Plane Array
Computer System
Electronics

Advanced Product Transitions
APT Proprietary
Summary • PMMs provide the product manager, product support teams, and
independent reviewers with an easy to use, resource friendly means to:
▫ Assure systems engineering is employed early on in the development process
▫ Assure realistic plans and baselines are in place at the start of development
▫ Measure technology and design maturity before entering product development
▫ Limit time and requirements for product development to manageable levels
• PMMs enable the product manager to capture knowledge early in the development process and reduce the risks of cost, schedule and performance problems
• PMMs provide the product manager and others the ability to concisely and effectively assess product development risks as part of scheduled product status reviews, in addition to major milestones or gate reviews
• PMMs provide product managers with the criteria and metrics to assess product development status and risks at the product level, as well as lower WBS levels (lower levels in the supply chain)
16 16 © Copyright 2011 APT Corp. All Rights Reserved.