product replacement: strategies for simultaneous product deletion and launch
TRANSCRIPT
J PROD INNOV MANAG 433 1994; 11:433-450
OOOO
Product Replacement: Strategies for Simultaneous Product Deletion and Launch
John Saunders and David Jobber
John Saunders and David Jobber report results of their study of strategies for the simultaneous deletion and introduction of new products. Companies' long- term survival depends upon their replacement of existing products with new ones. Managers have to accomplish the task successfully. This article explores product replacement and examines the difference between successful and unsuccessful replacements. Qualitative research helps formulate a conceptual model of product replacement strategies and to set hypotheses. A quantitative study of American and British firms helps to test the hypotheses.
Address correspondence to John Saunders, National Westminster Bank Professor of Marketing, Loughborough University Business School, Ashby Road, Loughborough, Leicestershire, LE11 3TU, England.
Introduction
For products the old proverb, "If it works, don't fix it" is overtaken by the new proverb, "If it works, it's probably out of date." This substitution of the old by the new is one of an increasing number of product replacements that are a consequence of accelerated product life cycles and reduced product development times. The result is a need to focus upon a previously neglected problem: how to manage the replacement of the old product by the new. The aim of this article is to identify the replacement strategies used by companies and their associated competitive environments.
Managers face dilemmas when replacing products; one is how much to change the market offering. Using the latest fashion or technology may make a product currently competitive, but there are risks of following fads. Should changes be few thereby reducing techni- cal uncertainty and the danger of "innovation resis- tance" [38]? When the tangible product changes, should the rest of the marketing mix be changed also? The names made the progression from Intel's 286 to 486 seem incremental and safe to customers but what of the jump to the Pentium chip? Radical new products may attract enthusiasts but how do the majority of customers view major changes? At the extreme, the marketer has to choose between an old product relaunched as "new and improved" and a radical innovation made to look risk-free by using traditional styling and familiar brand names.
The next managerial dilemma is how to manage the substitution of one product by another in the market place. Should it be done during a low season to minimize production and logistics problems or in a
© 1994 Elsevier Science Inc. 0737-6782/94/$7.00 655 Avenue of the Americas, New York, NY 10010
434 J PROD INNOV MANAG J. SAUNDERS AND D. JOBBER 1994; 11:433--450
BIOGRAPHICAL SKETCHES
John Saunders is National Westminster Bank Professor of Market- ing and Co-Director of Loughborough University Business School. Previously he was with Bradford University Management Centre, the University of Warwick, the Pacific-Asian Management Institute (Hawaii), and the Hawker Siddeley Group. He has a degree in Aeronautical Engineering from Loughborough University, an M.B.A. from Cranfield Institute of Technology and a doctorate from Bradford University. Research interests are marketing strategy, South East Asia, and computer and model assisted marketing. Publications include several books, business games and over 50 articles in leading academic journals. He is editor of the International Journal of Research in Marketing and assistant editor of the British Journal of Management. As a senior consultant he has worked with many companies and institutions. These include Unilever, ICI, Nestlr, Rolls Royce, T1, Woolworth, British Standards Institute, the Asian Development Bank, and the Sin- gapore Government.
David Jobber (Ph.D., University of Bradford) is Reader in Marketing at the University of Bradford Management Centre, England. His research interests are new product development, sales management, and information provision for marketing. He has published articles in MIS Quarterly, Journal of International Business Studies, Journal of Business Research, International Journal of Research in Marketing, Journal of the Operational Research Society, European Journal of Operational Research and Industrial Marketing Management, among others. He is co-author of the book Sales Technique and Management.
high season to gain customer attention? Should the old and new product be sold side by side for a while or should the switch be accelerated using "end of line kickers" to get rid of the old line? Products replace- ment is not a new management problem, but it is a growing one.
The evolution of the modern typewriter shows how product life cycles are shortening. The first generation of modern mechanical typewriters dominated the market for twenty-five years but following generations had shorter lives: fifteen years for electro-mechanical models, seven years for electronic models, and five years for first-generation, microprocessor-controlled models. Some markets move even faster. In Germany, first generation injectable cephalosporins were domi- nant for twelve years, whereas the fourth generation began to overtake the third in less than a year. For models within a product class, the shortening of life has been little short of cataclysmic, the average life of Japanese consumer electronics models now being well under one year [30].
Speedy product development is a manifestation of the time compression that has become part of the "new wisdom" about how to compete successfully [28].
Although faster product development does not require more frequent product replacement, it has allowed companies to develop strategies that depend upon frequent changes in the market place. Gomory [17] explains how Japanese companies try new products out in the market place, then use their rapid redesign capability to develop a replacement in response to actual buying patterns. By these means, even if a company starts out with an inferior product, it can overtake the industry leader in a few turns.
The problem facing marketing managers is how to manage product replacement successfully. The long- term survival of many industries (for example, automobiles and microcomputers) depends on effec- tive replacement strategies as much as developing new products. Although rapid product replacement can lead to enhanced consumer satisfaction when they are able to buy improved products, the increased speed of competitive obsolescence has its problems: buyers of fast-moving consumer goods may resist the deletions of familiar lines, buyers of a consumer durable may resent the new possession becoming out of date, distributors left with a clutter of old stock, manufactur- ing processes changed, and the whole market presenta- tion can become confused. The regularity of product replacement problems demonstrates their difficulty. Some examples of failure are: Ford Europe's replace- ment of the market leading Cortina by the Sierra-- "Ford's European Edsel?" [7]--Unilever's unsuc- cessful replacement of Persil Automatic with New System Persil Automatic [25], Schlitz's problems with their reformulated beer [29], and Coca Cola's replay of the same problem with Coke [14].
Despite the problems, companies have found that product replacement, like brand extensions [1], can be a way of reducing the risk of launching new products. First, developing known technology [24] and markets reduce product development time and costs. These benefits continue into manufacturing, where current manufacturing facilities are kept [10] and experience curve effects continued [42]. An example of this is the Ford Sierra, which employs the same engine and many other components of the old Cortina. Second, product line clutter is avoided and customer confusion avoided [18,39]. Third, replacements can build upon prior distribution channels [24] and by substitution reduce the problem of obtaining retail space [39]. Fourth, promotional advantages include the reduced need to spend so heavily on promotion, because residual awareness and goodwill may exist from the old product [43]. Fifth, from the customer viewpoint, the

SIMULTANEOUS PRODUCT DELETION AND LAUNCH J PROD INNOV MANAG 435 1994; 11:433--450
risks involved in trial may seem lower if the new product relates to a well-established old version. Many companies in the fast-moving consumer goods field capitalize on such brand loyalty by introducing "new," "bigger," and "better" versions of long- standing brands.
Historically the "uninspiring and depressing proc- ess of putting products to death" is neglected in favor of new products [4]. Work by Avlonitis [8,9] and others have helped to redress the imbalance but new product and deletion decisions remain separate, al- though they need treating together [44]. This has occurred despite the early recognition that many products are not deleted in isolation but removed to be replaced by new or improved versions [21 ].
This article attempts to gain an understanding of product replacement strategies. It starts with a qualita- tive study to gain an understanding of the nature of product replacement and to develop a conceptual model of product replacement. From this, hypotheses are formed. A quantitative study gathered details of a sample of product replacements to test the aforemen- tioned hypotheses. The results of the study are analyzed and discussed. Finally, the typology of product replacement strategies is adjusted to accom- modate the quantitative findings.
Conceptual Model and Hypothesis Development
Despite the recognition that the synchronization of product launch and deletion was a preoccupation of many companies [8] and that they should be treated together [44], a search revealed little academic literature to guide or explain the processes. An exception was Abemathy and Baloff [3] who illus- trated the stockholding and production problems of product succession and recognized the need for interfunctional planning. A qualitative view of product replacement was therefore sought from primary and secondary sources.
Secondary sources included an analysis of the literature of product management, new product launch and product deletion, and a review of past product succession such as GM's successful replacement of the rear wheel drive Ascona/Cavalier by their J-Car. Primary sources involved twenty-four unstructured personal interviews with marketing managers. Al- though no source gave a comprehensive picture of product replacement, they did provide complementary information. The personal interviews with managers
confirmed their familiarity with product replacement but also showed that none had developed a systematic way of viewing the problem. Nonetheless, their examples and those published elsewhere, allowed the development of a conceptual model (Figure 1) that draws upon that of Gatignon and Robertson [16].
The conceptual model has two main components: the supply side factors, showing how product replace- ments are managed, and the competitive environment. The aim of this research is to understand the replacement strategies used and their relation to the competitive environment. Taking a managerial view, replacement strategies are criterion variables chosen to fit the competitive environment (predictor variables). If the manager's choice is wise, and all other things are equal, some strategies should be more successful than others. Predicting success is the aim of much innova- tion research [10] but is not the focus here. Although of great managerial interest, the success-oriented litera- ture has not been very productive, and there are severe measurement problems [20], particularly across sec- tors [37].
Phasing Strategy
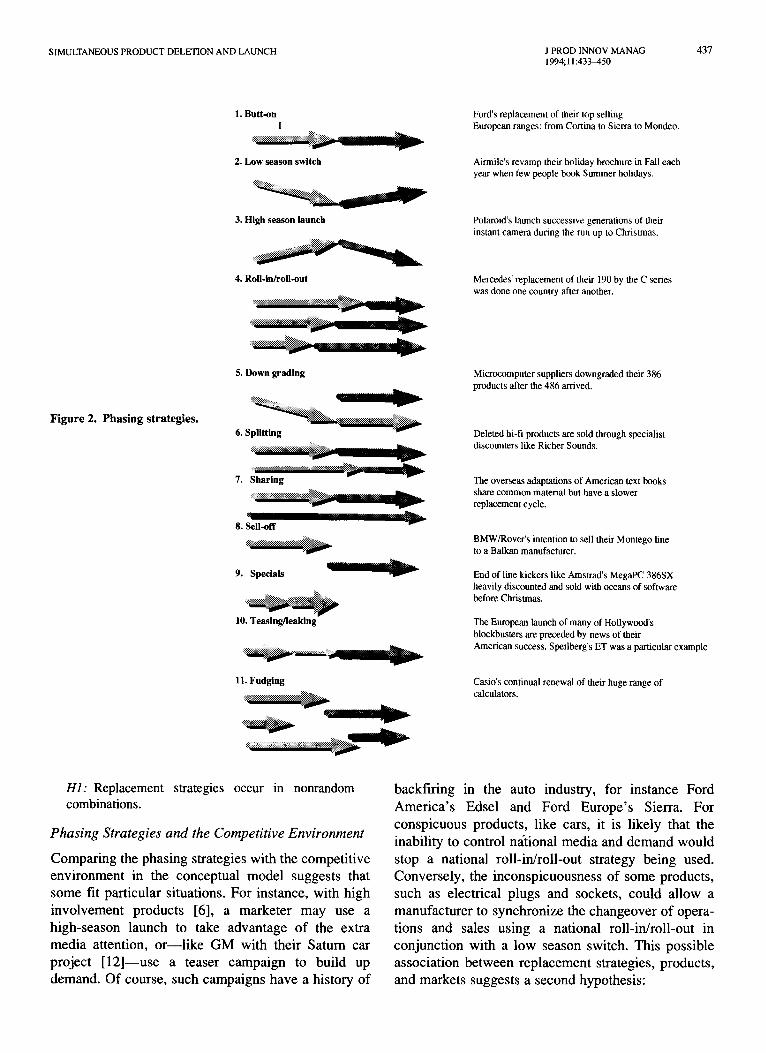
How to phase in new products while phasing out old ones is the central issue of the conceptual model. Figure 2 shows the range of phasing strategies used by companies interviewed to reduce the shock of the basic butt-on approach, where a new product immediately replaces an old one. In seasonal markets inconspicuous substitution can be a low season switch conducted while demand is low and consumers' attention is elsewhere. This can have a secondary advantage if the trade launch coincides with trade shows where institutions start ordering for the next high season. Businesses selling low consumer involvement goods, such as kitchen equipment, often use this strategy.
With conspicuous goods publicity gains motivate a pre-high season or high season launch. This increases discontinuity problems in the distribution chain but can also stimulate sales force and retailer effort. In these cases the production discontinuities need not be great because experience is gained and stocks built up during the low season. Simultaneous roll-in/roll-out can reduce discontinuity problems by spreading changes over time. Global marketers can act first in home markets, try out the new product, and then continue the replacement in other markets. Downgrad- ing is a variation on segmental roll-in/roll-out where the retained old product serves a distinct market

436 J PROD INNOV MANAG J. SAUNDERS AND D. JOBBER 1994; 11:433--450
I ~ " . . . "
F i g u r e 1. C o n c e p t u a l m o d e l o f p r o d u c t r e p l a c e m e n t .
segment. In Europe, Rover and General Motors did this when they retained the Mini and Chevette to serve the market for cheap basic cars after their development of more advanced products (Metro and Astra). Down- grading is clearly a form of line extension where the attributes of the old product are shared between two newly positioned ones.
Splitting is a special case of segmental roll-in/roll- out where a product has specialized variations. For instance both Ford and Rover used this strategy when retaining pick-up and van variations of their old products after deletion of the sedan versions (Cortina and Marina). Advances in production technology and cost consciousness have produced more sharing of components by products. This can occur when one product changes radically (as occurred with GM's J-car replaced rear wheel drive family sedans) but parallel products retain major components (in this case GM's Opel Manta).
Sell-off is a strategy that rebounded on Fiat after they sold licenses and helped build factories for Russia (Lada) and Poland (Polski Fiat) who then became competitors in their export markets [40].
IBM and many automobile manufacturers use spe- cials or "end of line kickers" to stimulate demand in products being run out. This can be necessary for conspicuous products where consumers anticipate a
product replacement may make current purchases obsolete. A problem here is that specials themselves can signal to the customer that replacement is to occur. Doyle and Saunders [13] suggested consumer antici- pation is used to management's advantage by using teaser campaigns or leaking news to the media about impending changes. This slows demand for the with- drawing product and stacks up demand for the impend- ing launch. A danger in this, as Ford found, is loss of market share to competitors during the build-up [7].
The final strategy, fudging, seeks to reduce disconti- nuity by overlapping and not broadcasting the relation- ship between replacement and replaced. Businesses with large product lines (Honda motorcycles and Casio) or with smaller ranges (Renault) do this.
Although shown separately in Figure 2, a product replacement could involve more than one strategy being used. For instance, in Europe car manufacturers roll-in new products across the continent to coincide with motor shows that correspond to the high season in each country. The result is, therefore, a roll-in/roll-out consisting of a high season launch in each country. In contrast, another company may use a low season switch in conjunction with specials promoting the old product to clear stocks before the high season. These potential relationships lead to a hypothesis concerning the concurrence of replacement strategies:
SIMULTANEOUS PRODUCT DELETION AND LAUNCH J PROD INNOV MANAG 437 1994;11:433-450
F i g u r e 2. P h a s i n g s t r a t e g i e s .
1. Butt-on I
2. Low season switch
3. High season launch
4. Roll-in/roll-out
~ : ~ i ~ ~ ~ . ~ i ~ ......
~,~ : :~ :~:~, .. . . . . . ~i:~ .....
5. Down grading
6. Splitting
================================ ......:.........:.:.i~:.~:.~.
7. Sharing
8. Sell-off - w -
9. Specials w
:~.~:~----:~.'.:~:~.~:~ii;f¢~ ~ ~ ......
10. Teasing/leaking
11. Fudging
Ford's replacement of their top selling European ranges: from Cortina to Sierra to Mondeo.
Airmile's revamp their holiday brochure in Fall each year when few people book Summer holidays.
Polaroid's launch successive generations of their instant camera during the run up to Christmas.
Mercedes' replacement of their 190 by the C series was done one country after another.
Microcomputer suppliers downgraded their 386 products after the 486 arrived.
Deleted hi-fi products are sold through specialist discounters like Richer Sounds.
The overseas adaptations of American text books share common material but have a slower replacement cycle.
BMW/Rover's intention to sell their Montego line to a Balkan manufacturer.
End of line kickers like Amstrad's MegaPC 386SX heavily discounted and sold with oceans of software before Christmas.
The European launch of many of Hollywood's blockbusters are preceded by news of their American success. Speilberg's ET was a particular example
Casio's continual renewal of their huge range of calculators.
HI: R e p l a c e m e n t s t r a t e g i e s o c c u r i n n o n r a n d o m
combinations.
Phasing Strategies and the Competitive Environment
Comparing the phasing strategies with the competitive environment in the conceptual model suggests that some fit particular situations. For instance, with high involvement products [6], a marketer may use a high-season launch to take advantage of the extra media attention, or--l ike GM with their Saturn car project [12]--use a teaser campaign to build up demand. Of course, such campaigns have a history of
backfiring in the auto industry, for instance Ford America's Edsel and Ford Europe's Sierra. For conspicuous products, like cars, it is likely that the inability to control national media and demand would stop a national roll-in/roll-out strategy being used. Conversely, the inconspicuousness of some products, such as electrical plugs and sockets, could allow a manufacturer to synchronize the changeover of opera- tions and sales using a national roll-in/roll-out in conjunction with a low season switch. This possible association between replacement strategies, products, and markets suggests a second hypothesis:

438 J PROD INNOV MANAG J. SAUNDERS AND D. JOBBER 1994; 11:433-450
H2: The replacement phasing strategies used will depend upon the product/markets involved.
Extent of Change
From the interviews with managers it was apparent that a product replacement can involve all manner of changes in the marketing mix. A modification of Ansoff's [5] product/market expansion grid expresses the alternatives (Figure 3): from minor, continuous innovations to major, discontinuous ones [34].
Figure 2 shows ways of replacing one product with another, whereas Figure 3 shows how the marketing mix changes during that process. Product changes are on the horizontal axis and changes to the rest of the marketing mix on the vertical axis. Replacements are then classified according to what is, and what is not, changed.
1. Face-lift. The most minor change is a face-lift. This occurs when a product undergoes changes in appearance designed to enhance its appeal. In the automobile market, models are often given a face-lift mid-life-cycle.
2. Inconspicuous substitution: a technology change with no alteration of the other elements of the marketing mix is a techno-regrade. Brand loyalty to instant mashed potatoes held through major techno- logical process and product changes.
3. Re-merchandising. This involves the modification of name, promotion, price, package, and/or distri- bution, while maintaining the basic product. A failing deodorant for men was successfully re- merchandised by repackaging using a "masculine" bottle shape, heavier advertising, higher price, and a new name "Brut."
4. Re-launch is another variant of replacement. Both product and other marketing mix elements are re-mixed. Re-launches are common in the automo- bile industry when every four to five years a model is replaced with an upgraded version, sometimes retaining the old model name, sometimes not. Other examples of a re-launch are the ill-fated replace- ment of Coca Cola with reformulated Coke, and the replacement of the original Black and Decker heatgun with a more compact, ergonomically advanced successor that required only half the components of the original.
5. Conspicuous substitution: a major technological change that causes a radical replacement opportu- nity accompanied by heavy promotions (and other mix changes) to stimulate awareness and trial. An
No Change
PRODUCT
No Change M o d i f i e d Technology
MARKETING Modified
New Market/ Segment
Figure 3. The phasing continuity spectrum.
example was the replacement of the IBM PC by the IBM PS/2.
6. Intangible repositioning: replacement can also take place by changing a product 's target market. Intangible repositioning maintains the basic prod- uct while changing other mix elements and target customers. Lucozade was first positioned as a children's health drink. Advertising showed Lu- cozade being given to ill children by caring mothers. Research found that mothers had begun drinking it as a mid-day "pick-me-up." Advertis- ing repositioned Lucozade into this niche. More recently Lucozade was repositioned as a mass- market energy drink using Daley Thompson in its advertising. During all of this activity the basic product has remained the same.
7. Tangible positioning: this strategy involves chang- ing the product, other mix elements and the target market. Retailing provides a number of examples of product repositioning. In the UK, Kendalls--a down-market women's accessory chain--was repo- sitioned as Next, an up-market (yuppie) medium to high price points clothing outlet for 25- to 35-year-old working women. The essential differ- ence between intangible and tangible repositioning is that with the latter the product is modified to accommodate the new market position.
8. Neo-innovation: this is a fundamental technology change accompanied by target market and mix changes. An example is the computer industry.

SIMULTANEOUS PRODUCT DELETION AND LAUNCH J PROD INNOV MANAG 439 1994; 11:433--450
Compaq started life as a less expensive IBM PC compatible and soon became the fastest growing company in the US. With the arrival of the 286 chip, however, Compaq became a premium-priced market leader positioned above IBM.
The difficulty of the strategies with Ansoff 's matrix increases from the top left market penetration comer, where a firm is operating in familiar products/markets to the more demanding bottom right-hand comer, which corresponds to diversification [36]. Because the benefits of product replacement depend on keeping things the same, it follows that the continuity spectrum represents strategies of increasing difficulty from the top left comer, where a face-lift has few changes, to neo-innovation in the bottom left-hand comer with many changes. This suggests a third hypothesis:
H3: The difficulty, and therefore the failure rate, of product replacement increases with the number of changes made.
Not all changes represented on the continuity spectrum require equal effort, for instance, brand names, promotions, and price can be changed more easily than the product and distribution. Being easier to alter, it is likely that the "sof t" marketing variables of price, positioning, and names change more frequently than the "hard" variables of raw material, manufacturing, and production. This is not to say that the marketing variables are easy to change but, in most markets, development and plant costs make product changes very difficult. For instance, at one extreme Nestlr 's top selling count line Kit-Kat is made on a series of expensive but dedicated production lines that are both inflexible and globally standardized; at the other extreme, it is impossible for Volvo to change their sturdy range of cars quickly, so they have chosen to reposition them as "animal-like and exciting." Hy- pothesis four reflects this:
H4: The "soft" marketing variables of price, posi- tioning, and names change more frequently than the "hard" operational and product variables.
Product replacement strategies relate to other forms of portfolio analysis beside the Ansoff matrix. In business portfolio analysis, using the Boston Consulting Group's growth share matrix or the GE multifactor portfolio model [41], product replacement is a way of improving a company's competitive position and
High
LAUNCH PROMOTIONS
High Low
LAUNCH PRICE
Low
Figure 4. Launch deletion matrix.
market share. This could be by direct replacement of a new product for old or by "downgrading" an old product to allow a new product to occupy the old product position.
When used in conjunction with product-market portfolio analysis, product replacement can change or extend a company's market coverage [2]. For example, it describes how a company concentrating on a single segment could change its focus or how one with "selective specialization" could shuffle its portfolio.
Promotional Shift and Timing
Kotler's [22] matrix of introductory marketing strategies suggests how to coordinate the price and promotion of a product launch. If the product launch has a synchronous deletion it follows that the launch and deletion strategies balance (Figure 4). For instance, where the launch strategy is a rapid penetration, the replaced product is likely to suffer a quick death as the new product takes its market, its decline being accelerated by lack of price competitiveness and the possibility of promotional resources being switched to the new product. The quick death may also help the rapid acceptance of the new products, as consumers switch from the old to the new.
As with rapid penetration, the quick removal of the old product helps the acceptance of a new product
Figure 5. Product replacement grid.
PRODUCT
MARKETING
No Change
Modified
New
No Change Modified New

440 J PROD INNOV MANAG J. SAUNDERS AND D. JOBBER 1994; 11:433-450
being launched by a rapid skim. Alternatively, the deleted product remains in the market at a lower price to provide a datum against which to judge the quality cue within the rapid skim price. In addition, since the rapid skim strategy suggests a shift up-market, the delayed deletion of the old product may prevent loss of market share amongst price sensitive consumers. The appropriate deletion strategy to accompany rapid skim may, therefore, be a short life rather than a quick death. This provides hypothesis five:
H5: The deletion strategy accompanying rapid skim will be longer than that accompanying rapid penetration.
If slow skim or slow penetration launches were not accompanied by the slow deletion of the old product, companies would have to accept market share losses during the switch over. This leads to hypothesis six:
H6: The deletions associated with slow penetration and slow skim will be longer than those associated with rapid skim and rapid penetration.
The slow skim tends to provide high short-term returns by combining a high price with low expenditure on promotions and manufacturing build up. This can be accompanied by harvesting the old product by reduc- ing promotional support while living under the price umbrella of the slow skim launch. In contrast, for the slow death deletions accompanying the slow penetra- tion launch no such price umbrella exists. This leads to hypothesis seven:
H7: The deletions accompanying slow skim launch strategies are likely to be higher priced than the deletions accompanying slow penetrations.
The remainder of this article concerns the quantifica- tion of product replacement; the design and analysis of a mail survey designed to test the previous hypotheses, to examine the occurrence of elements of the product replacement process, and to develop a strategic typology of product replacement activities.
Given the novelty of the study of product develop- ment, it is likely that other hypotheses will occur as more researchers consider the issue. As they stand, the proposed hypotheses attempt to investigate relation- ships amongst the elements of replacement strategy, in particular the ways in which elements of replacement strategy are used together (HI), how they change with the product markets involved (H2), their success rate
(H3), the frequency with which individual product/ marketing elements change (H4) and the integration of product launch and deletion strategies (H5-H7).
Methodology
A dichotomized task technique asked respondents to describe marketing practices and environmental condi- tions associated with a clearly successful and a clearly unsuccessful product replacement of his/her choice. The questionnaire (described in Appendix I) went to senior marketing executives of the top 200 USA and British industrial corporations. Service companies were not in the sample. The Fortune listing of top American companies and the Times Top 1000 were the sampling frames. A follow-up letter and questionnaire went approximately three weeks after the initial mailing. A third and fourth wave went to a sample of marketing executives from the subsidiaries and divi- sions of nonresponding companies. Subsidiaries and divisions were from Who Owns Whom UK and USA. Addresses were from the Kompass Directory and Dun and Bradstreet Key British Enterprises for UK Companies, and the Thomas Directory and Dun and Bradstreet Million Dollar Directory for US firms. For each country the names and addresses of subsidiaries for nonresponding parent companies were located. As an inducement to respond, 20p or $.25 coins were attached to the covering letter. Small monetary incentives have an excellent record of increasing response rates [19,32]. A follow-up letter and ques- tionnaire went out about three weeks later.
Results
The overall response rate was 33.5%--a figure reduced to 32.25% (129 questionnaires) after remov- ing unusable cases. This compares favorably with similar studies of managers that got response rates between 5.9% and 22% [16]. Comparison of the responses with the sample frame showed that there was no bias in the country of origin or industry classifica- tions. The respondents were half US and half UK; 22% made consumer durables, 34% consumer non-dura- bles, 17% industrial products, and 27% components.
The respondents provided data on 194 product replacements. The managers rated 67% of them as successful. Sixty-four respondents gave details of a success and a failure, sixty-five respondents gave a success, and one gave a failure. Although this shows
SIMULTANEOUS PRODUCT DELETION AND LAUNCH J PROD INNOV MANAG 441 1994; 11:433--450
managers to be happier giving information on suc- cesses than failures, the split between the two sets did not show any bias in nationality or industry. The respondents chose their criteria for measuring success or failure but the results were highly convergent: 70% using sales relative to target, 18% using profits relative to target, and 10% using costs relative to target. No other criterion was mentioned by more than 10% of the respondents. There was, interestingly, no significant difference between the reasons chosen for success and failure. The corresponding figures for sales relative to target, profits relative to target and costs were 68%, 19% and 9% respectively.
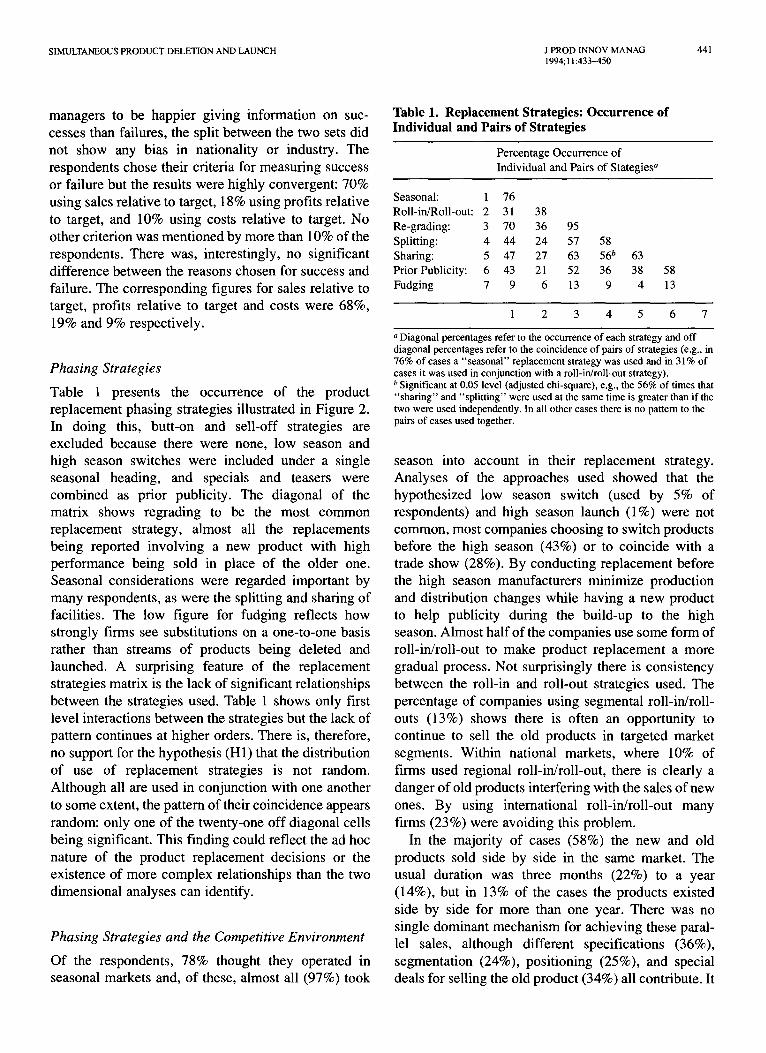
Phasing Strategies
Table 1 presents the occurrence of the product replacement phasing strategies illustrated in Figure 2. In doing this, butt-on and sell-off strategies are excluded because there were none, low season and high season switches were included under a single seasonal heading, and specials and teasers were combined as prior publicity. The diagonal of the matrix shows regrading to be the most common replacement strategy, almost all the replacements being reported involving a new product with high performance being sold in place of the older one. Seasonal considerations were regarded important by many respondents, as were the splitting and sharing of facilities. The low figure for fudging reflects how strongly firms see substitutions on a one-to-one basis rather than streams of products being deleted and launched. A surprising feature of the replacement strategies matrix is the lack of significant relationships between the strategies used. Table 1 shows only first level interactions between the strategies but the lack of pattern continues at higher orders. There is, therefore, no support for the hypothesis (HI) that the distribution of use of replacement strategies is not random. Although all are used in conjunction with one another to some extent, the pattern of their coincidence appears random: only one of the twenty-one off diagonal cells being significant. This finding could reflect the ad hoc nature of the product replacement decisions or the existence of more complex relationships than the two dimensional analyses can identify.
Phasing Strategies and the Competitive Environment
Of the respondents, 78% thought they operated in seasonal markets and, of these, almost all (97%) took
Table 1. Replacement Strategies: Occurrence of Individual and Pairs of Strategies
Percen tage Occur rence o f
Individual and Pairs o f Stategies a
Seasonal : 1 76
Roll- in/Roll-out : 2 31 38
Re-grading: 3 70 36 95
Splitting: 4 44 24 57 58
Sharing: 5 47 27 63 56 b
Prior Publici ty: 6 43 21 52 36
Fudg ing 7 9 6 13 9
63
38 58
4 13
1 2 3 4 5 6 7
"Diagonal percentages refer to the occurrence of each strategy and off diagonal percentages refer to the coincidence of pairs of strategies (e.g., in 76% of cases a "seasonal" replacement strategy was used and in 31% of cases it was used in conjunction with a roll-in/roll-out strategy). b Significant at 0.05 level (adjusted chi-square), e.g., the 56% of times that "sharing" and "splitting" were used at the same time is greater than if the two were used independently. In all other cases there is no pattern to the pairs of cases used together.
season into account in their replacement strategy. Analyses of the approaches used showed that the hypothesized low season switch (used by 5% of respondents) and high season launch (1%) were not common, most companies choosing to switch products before the high season (43%) or to coincide with a trade show (28%). By conducting replacement before the high season manufacturers minimize production and distribution changes while having a new product to help publicity during the build-up to the high season. Almost half of the companies use some form of roll-in/roll-out to make product replacement a more gradual process. Not surprisingly there is consistency between the roll-in and roll-out strategies used. The percentage of companies using segmental roll-in/roll- outs (13%) shows there is often an opportunity to continue to sell the old products in targeted market segments. Within national markets, where 10% of firms used regional roll-in/roll-out, there is clearly a danger of old products interfering with the sales of new ones. By using international roll-in/roll-out many firms (23%) were avoiding this problem.
In the majority of cases (58%) the new and old products sold side by side in the same market. The usual duration was three months (22%) to a year (14%), but in 13% of the cases the products existed side by side for more than one year. There was no single dominant mechanism for achieving these paral- lel sales, although different specifications (36%), segmentation (24%), positioning (25%), and special deals for selling the old product (34%) all contribute. It
442 J PROD INNOV MANAG J. SAUNDERS AND D. JOBBER 1994; 11:433-450
is noticeable that in over one-third of cases (37%) consumer pressure forced the retention of old products. This, together with a special deal used to sell the old product, suggests that parallel marketing is a strategy forced upon manufacturers.
In over half the replacements considered (58%), some form of pre-launch promotion warned the consumers or the channels of the impending change. Trade promotions were the most common form (48%) used. Public relations (17%) were also more popular than consumer promotions (12%) as a way of contacting the public. Given the promotional attrac- tiveness of a new product, it is somewhat surprising that so many firms choose to keep the development secret until the launch itself.
A Strategic Typology
The identification of strategic typologies has been an important strand in management research. For example the organization typology developed by Miles and Snow [26] and the generic strategy typology of Porter [31 ] have provided the foundations for much strategic thinking and research in recent years. The data gathered in our study allows the development of a typology of product replacement activities.
All the variables in Appendix I were examined to see if they contributed to the success or failure of product replacements. The two variables significant at a 0.05 level are ignored as the number is consistent with them occurring by chance. This result could have occurred because the individual elements of replace- ment strategy have no impact upon success or failure, or because the picture is more complex than the aggregate statistics show. There are two possible approaches to take a more comprehensive multivariate view of product replacement; either fit the cases to their classifications proposed in Figures 1-3, or search the data without any a priori assumptions about its structure. Because Figures 1-3 were based on a small number of qualitative interviews rather than well- established theory, it was inappropriate to restrict the analysis by imposing them upon the data. Cluster analysis was used instead.
As a first stage, factor analysis was used on the variables describing replacement strategies. These analysis variables measured the degree of commonal- ity between the new and old product and the relative levels of expenditure supporting the launch (items 1 and 2 in Appendix I). Three sets of descriptive variables were not used in the multivariate analysis:
1. Categorical variables describing the replacement strategies (excluded because they do not lend themselves to this form of multivariate analysis [33]),
2. Performance variables relating to profitability and sales (excluded because they would be used to check for performance differences across the clusters found), and
3. Environmental variables that could later be used to describe the circumstances in which strategies were deployed.
Partitioning the variables in this way focuses the multivariate analysis on the dimensions of the phasing continuity spectrum (Figure 3) and the launch deletion matrix (Figure 4). The descriptive variables were used to validate the results and to see if there is a relationship between replacement strategies and their environments. Ward's [41] method produced clusters from the factor scores. Both the upper tail rule and the moving average quality control rule helped determine the number of clusters of final solution [27]. The choice between five and six clusters was ambiguous, but a five-cluster solution was chosen because the sixth cluster only had four cases. The final solution was validated by the U-method [23]. Random subsets of ten observations were withdrawn from the sample on twenty occasions and the resulting solutions compared with that originally found. A highly signifi- cant 87% of the cases was correctly classified so the original Ward's solution was accepted.
Table 2 gives the five-cluster solution. The clusters have considerable variation in size and strategies but there is no significant difference in their performance: their success rates differ but insufficiently to register a significance using a chi-squared test. They have different sales and profit performances but such is the variation within each group that there is no claim for one strategy over another. Not surprisingly there are many significant differences between the levels of the strategic variables used to form a cluster. However, less expected was the extent to which the clusters correspond to the classification within the product replacement and launch phasing matrices. Each group is described. The statistics flagged with an asterisk (*) are all significant at a 0.05 level and are descriptive variables not used in the cluster analysis. The other percentages given are also statisti- cally significant but they are not indicated so, as they formed the clusters. The number of differences identi- fied supports the hypothesis (H2) that replacement strategies associate with some product markets.

SIMULTANEOUS PRODUCT DELETION AND LAUNCH J PROD INNOV MANAG 443 1994; 11:433-450
Table 2. Replacement Strategy Clusters
Group Number 1 2 3 4 5
Sample size 62 32 15 67 Sample share (%) 32 16 8 35 Success rate (%) 72 58 73 66
Sales gains (%) 19 44 11 24 Profit gain (%) 11 13 27 15
Sales vs target (%) 104 103 93 112 Profit vs. target (%) 105 117 99 97
Replacement type Inconspicuous Tangible Conspicuous Intangible (Figure 2) substitution repositioning substitution repositioning
Launch-phase strategy Slow penetration Rapid penetration Rapid skim Rapid skim (Figure 3)
Seasonality Pre-high Trade show Low/Pre-high None/Pre-high
Roll-in/Roll-out None National Segmental None
Prior publicity None Trade Trade/PR Trade leaks
Parallel marketing 3 mo--1 yr 3 mo 1 yr + 3 mo
18 9
61
17 28
107 107
Facelift
Slow skim
Pre-high
Regional
Trade
1 wk
Cluster 1: Inconspicuous Substitution. This is a cluster of small- to medium-sized industrial companies (60%)* replacing products that are not market leaders (65%)* but where there are many small competitors (55%)*. Compared with other groups they face a relatively high pressure to change product features (61%)* and product design (43%)*.
In response they tend to change appearance (86%), materials (77%), manufacturing (46%) or product performance (98%) significantly more than other groups. These changes and their neglect of the marketing mix other than product tends to classify them as inconspicuous substitutors. They do however intend to decrease price (55%) and are therefore following the slow penetration strategy identified in Figure 4, This view is supported by the long period that the old and new products are sold in parallel.
Cluster 2: Tangible Repositioning. These are predominantly domestically oriented (61%)* indus- trial companies (68%)* facing intense (71%)* and increasing (68%)* international competition. Few see domestic competition as strong (32%)* although there are many competitors in the market (71%)*. More than any other group, they see themselves facing rapid technological change (68%)* and design convergence (45%)*.
In the face of these threats they are making relatively cosmetic changes--a strategy reflected in their having the lowest absolute success rate of any of the groups.
The appearance of the products changes (78%) as does name t38%), and some components (26%). There is also a desire to cut costs and follow that with price declines (42%). These moves back advertising (55%), trade (64%), and sales campaigns (58%) that are stronger than those suggested by any other group. This combination suggests that they are indulging in tangible repositioning, which involves the high change in the market variables but only a modified change in the product. However, unlike cluster 1, this group is backing their low price by high promotions and therefore is pursuing rapid penetration. This strong promotional push reflects their intention to use trade shows as an opportunity to launch and the relatively short duration of parallel marketing.
Cluster 3: Conspicuous Substitution. This is a small group of market leaders (67%)* from industrial (40%)* and consumer (40%)* companies who operate in markets with a few dominant competitors (93%)*. The markets are highly competitive with a number of brands (63%)*, domestic (67%)*, and international (87%)* competition increasing. All members of the group face competition over product performance (100%)* and product features (80%)*. Their environ- ment, however, is benign concerning the pressure to change design (20%)*, or from changing consumer taste (27%)*.
Their change of name (67%), promotion (73%), price (100%), distribution (47%) along with produc-

444 J PROD INNOV MANAG J. SAUNDERS AND D. JOBBER 1994; 11:433---450
tion (46%), components (47%), and performance (98%) suggests the company is indulging in conspicu- ous substitution. These firms combined a high price (100%) with high promotion (92%) in their product launch and therefore tended to follow a rapid skim policy. This they backed by wide trade (69%) and public relations campaigns (25%) sometimes with leaks (54%) concerning the impending change. Con- sistent with the move up-market that the rapid skim would involve, the group intended to use segmental roll-in/roll-out (80%). A strategy that probably helped them achieve the long-term parallel marketing of over one year.
Cluster 4: Intangible Repositioning. These are largely manufacturers of industrial (42%)* or con- sumer non-durables (37%)* in mature markets facing intensive domestic competition (77%)*. The main force for product replacement is changing customer tastes (67%)*.
They intend to change price (93%), target market (44%), and advertising (68%). This substantial shift in marketing with no shift in product classifies the group as intangible repositioners. They tend to charge a high price (93%) in combination with high promotions (90%), thereby using a rapid skim strategy. They do not, however, have a sophisticated seasonal or roll-in/ roll-out approach and see their period of parallel marketing as being quite short. This could reflect the ability of the consumer non-durable manufacturers to deplete their stocks rapidly.
Cluster 5: Face-lift. These were predominantly industrial (44%)* and consumer durable (44%)* companies who are replacing products that are not market leaders (39%)*. The main forms of competition they are facing are price (67%)*, promotion (57%)* and distribution (50%)* from domestic suppliers (78%)*. The need for technological change (16%)* and improved product performance (39%)* is rela- tively slight, with changed customer taste being the major reason for altering the product (67%)*.
The changes intended by the company are relatively few--appearance (43%) and consumer promotions (82%). This suggests they are face-lifters, although with a leaning toward relaunch to reflect their promotional campaigns. They show little intention of changing price (44%) or spending highly on promotion (44%) and therefore cannot by default appear to be following a slow skimming strategy. Against this proposal is the short duration of their parallel marketing, in that the company seems close to pursuing a butt-on strategy.
The Success of Strategies
The five clusters embody different degrees of change: conspicuous substitution and tangible repositioning representing situations with more changes than do inconspicuous substitutions, intangible repositioning, and face lift. Their similar success rate does not, therefore, support the hypothesis (H3) that the diffi- culty, and therefore the future rate, of product replacement increases with the number of changes made. However, inspection of the cluster suggests that their similar successes are because of the poor deployment of the replacement strategies. For exam- ple, cluster 4 (intangible repositioning) and cluster 5 (face-lift) both correspond to businesses who tend to be reacting to changed customer tastes by making minimal changes to the product. The replacement may be easy to manage but involves superficial changes that are insufficient to rectify the old product's inadequacy. In contrast, the companies who are making more substantial changes are facing a more difficult task, but one that is more likely to deliver the benefits of product superiority.
A multiple discriminant analysis of the clusters (Appendix II) provides an additional insight into how the strategies differ. The first and highly dominant discriminant function concentrates on variables con- cerned with re-launch: launch, promotion, price, and changed target markets---changed appearance has a negative loading. Function 2 associates with changed target markets and changed appearance. Noticeable are the negative coefficients for positioning and raw materials. Function 3 identifies production changes not strongly linked to changes in target markets and appearance whereas function 4 positively associates name and price changes with trade promotions.
The emergence of fewer clusters than the nine cells of Figure 3 suggests a reduced form of the product replacement matrix would better reflect the findings. Figure 5 gives a typology with four cells: (1) a re-launch quadrant that combines the old re-launch, face-lift and re-merchandising cells, (2) inconspicuous substitution, (3) a conspicuous substitution cell expanded to include neo-innovation, and (4) repositioning.
The identification of five strategic clusters does not necessarily undermine the nine cells proposed earlier (Figure 3). In this application cluster analysis is used in the normal way to identify spherical groups of items that are separate from other groups [15]. Since Figure 3 represents a continuum, strategies are not discrete but gradually change from one to another.

SIMULTANEOUS PRODUCT DELETION AND LAUNCH J PROD INNOV MANAG 445 1994; 11:433-450
Table 3. Brand Changes: Occurrence and Coincidence
Percentage Occurrences of Individual and Pairs of Brand Changes a
Product Changes Performance: 1 81
Appearance: 2 59 73
EVCb: 3 49 46 c 57
Production: 4 36 28 22
Parts: 5 55 54 ¢ 40
Costs: 6 60 57 44
36
29 ~ 65
30 c 51 75
Market Changes
Name: 7 40 40c 29 18 31 33 47
Target: 8 19 20 c 15 8 14 18 18 c 23
Positioning: 9 40 36 c 28 16 16 33 29 c 2(F 45
Competition: 10 23 24 ~ 17 13 ~ 18 21 17 c 12 c 19 c 27
Price: 11 51 53 c 46 c 22 40 52 c 34 c 20 C 34 c 21 ~
Distribution: 12 18 17 c 14 12 c 16 18 14 c 8 c 16 c 11 c 63 18 c 20
1 2 3 4 5 6 7 8 9 10 11 12
a Diagonal percentages refer to the occurrence of each item being changed substantially and off diagonal percentages refer to the coincidence of pairs of changes (e.g., in 81% of cases performance was changed substantially and in 59% of cases both performance and appearance were changed substantially. b Economic value to the customer c Significant at 0.05 level (adjusted chi-square), e.g., the 46%frequency with which EVC and appearance were changed at the same time is greater than if the two were being changed independently.
Extent of Change
The responses had great variety in the elements of the product marketing mix changed. Table 3 shows the frequencies with the product and marketing elements changed substantially (corresponding to a score of three or more on five-point scales). Inspection of the diagonal of the matrix shows performance, costs, and appearance to be the most frequently changed. This suggests that most of the replacements reported tend to be relatively substantial product changes that corre- spond to the tangible repositioning, conspicuous substitution, or neo-innovation cells of the product replacement matrix (Figure 3). Despite the high frequency of the product changes, there seems to be little covariance between the changes that did occur. This may reflect the high cost and risk associated with product changes where companies try to change one dimension at a time.
In contrast, the marketing changes are highly interrelated----every one of the diagonal cells is significant. Among the marketing variables there is a tendency to change the easily changed elements, like price and name. In contrast target markets, distribution and competition are expensive to manipulate and rarely changed. Taken overall, appearance and price appear to have a pivotal role in the replacement
process. They often change with other product market- ing variables. It may be appearance because it forms a link between product and market adjustments, and price because it is so easy to change and so closely allied to profitability.
The results in Table 3 do not provide uniform support for the hypothesis (H4) that the soft marketing variables of price, positioning, and names change more frequently than the hard operational and product variables. Consid- ering the marketing variables alone, the hypothesis is supported: the percentage of substantial changes in name, positioning, and price (47, 45, and 63) are all greater than the percentage for substantial changes in targeting, competition, and distribution (23, 27, and 20) at a 0.001 confidence level. However, the situation reverses for the product changes associated with performance, appearance, parts, and cost (81, 73, 65, and 75) all of which occur more frequently than changes in name, positioning, or price (significance levels all above 0.05 level). Why should this be so? The answer probably lies within the competitive pressure for substitution. Although the marketing variables are easier to change, they are in themselves insufficient to counter competi- tive activity. The centrality of product performance to the success of new products [11] and innovations [36] are well documented. Competitive pressures force product change, whereas marketing variables provide

446 J PROD INNOV MANAG J. SAUNDERS AND D. JOBBER 1994; 11:433-450
continuity between the new and the old. Cost pressures may also stimulate product changes. Substitution of cheaper components may lead to performance and/or appearance changes but with no change in name, positioning, or price.
Launch~Deletion Strategies
Marketing mix activities (Table 4) show a significant switch of resources from the old product to the new one. The attractiveness of this is clear, because it allows the old product to be milked to provide resources for the new product launch. Given the elegance of this symmetry, it is rather surprising that almost half the companies make little shift in their marketing activity. Also unexpected was the similarity between the price shifts expected for the old and the new products. That companies can charge a higher price for their new products is expected, but the parallel opportunity to charge more for the one being withdrawn is less so. There are several reasons why this may occur: (1) old products are sold to conserva- tive but price-insensitive segments, (2) in the short- term the demand for the old product may increase in anticipation of its impending demise, (3) an opportu- nity taken to milk the old product, because its market share objectives are no longer important, or (4) a need to prevent the old product cannibalizing the new one.
Statistics on the deletions associated with the four launch strategies from the launch/deletion matrix (Figure 4) are in Table 5. These show the duration, pricing, and promotion of deletions varies with the launch strategy used. Indeed, the adjusted chi-squared statistics based on the variation of all three are significant at the 0.05 level. This suggests that launch and deletion strategies are synchronized to some degree, although there is not uniform support for the associated hypotheses (H5 to H7).
The results do not support the hypothesis (H5) that the deletion accompanying rapid skim will be longer than that accompanying rapid penetration. Rapid penetration has more deletions taking place in under three months (64%) than does rapid skim (56%), but the difference is not statistically significant.
In contrast there is evidence that the deletions associated with slow launches have a longer duration than those associated with rapid launches (H6). The statistics comparing the duration of deletions associ- ated with rapid penetration against slow skim, rapid penetration against slow penetration, and rapid skim against slow skim are all significant at a 0.05 level. In
Table 4. Marketing Mix Activity
Percentage with Changes Relative to Regular Levels
For old product For new product launch withdrwal
Lower Higher Lower Higher
Price 26 40 23 46 Advertising 55 4 20 40 Consumer
promotions 50 5 6 41 Trade promotions 48 5 9 48 Added benefits 39 17 4 77
addition the deletions associated with rapid skim tend to be quicker than those for slow penetration, but the difference is not statistically significant.
Summing the pairs of rapid and slow strategies gives results that again support hypothesis (H6). The 60% of deletions occurring in less than three months with the rapid launches is significantly (0.01 level) greater than the 38% with slow launches.
Hypothesis (H7) provides further evidence support- ing the launch/deletion. This refers to the deletions associated with slow skim being priced higher than those accompanying slow penetration. The difference is significant at a 0.01 level.
Conclusions
This article classifies product replacement strategies and provides evidence of their use. There was some evidence for the hypothesized components of product replacement. There is evidence that elements of replacement strategy occur in all conceivable combi- nations. However, other than for marketing and appearance changes, there is little pattern in their use. Some dimensions for product replacement strategies do dominate. Most changes involve some degree of performance, appearance, components, cost and price changes, with the remainder lagging behind. Replace- ments come with the increased promotional expendi- tures but it is rare for companies to change their target market, the competition or the distribution channels. This suggests that replacement is a defensive move rather than one that allows companies to move into more attractive markets. Consistent with the tendency of product replacement to involve increased perform- ance, most replacements also involve a degree of upgrading in the market place. There is also a high

SIMULTANEOUS PRODUCT DELETION AND LAUNCH J PROD INNOV MANAG 447 1994; 11:433-450
Table 5. Deletion Profiles
Launch Strategy
Deletion Profile Rapid Skim Rapid Penetration Slow Skim Slow Penetration
Frequency 70 56 19 49 Deleted in under 3 months(%) 39(56) 36(64) 6(32) 20(41) Price reduced (%) 18(26) 20(36) 3(16) 12(24) Promotion reduced(%) 49(70) 34(61) 8(42) 34(69)
likelihood that companies will synchronize their replacement to seasonal patterns within the market. Despite the frequency of parallel marketing, the splitting of lines and the sharing of facilities, the low use of fudging indicates that the view of one product replacing another predominates.
The quantitative results did not support the existence of low season and high season launches the most popular seasonal option being a pre-high season launch or the use of trade shows. These provide an opportunity to maximize the promotional potential of a product change while, in the case of the pre-high season launch, minimizing logistic discontinuity. Many companies took advantage of roll-in/roll-out of their products or parallel marketing to minimize the shock of sudden product changes. In particular, international roll-in/roll-out is a means of separating product markets so that old and new products sell at the same time.
The evidence of promotional activity during product replacements tends to be bimodal. Whereas half the companies used little in pre-launch activities or made little adjustment to promotional expenditures both before and after launch, some players use a wide variety of trade, consumer, and public relations activity to gain pre-launch publicity and made drastic shifts of promo- tional support from the old product to the new. This diversity becomes more explicit when examining the strategic typologies from cluster analysis.
Cluster analysis based on replacement strategies suggests four broad strategic typologies to describe the replacement process: re-launch with moderate changes in product and marketing, repositioning where little changed products are marketed differently, inconspic- uous substitution where a much changed product is clothed in the market position of its predecessor, and conspicuous substitution, where the product and its market change substantially. Analysis of the markets of the strategies showed there were significant varia- tions in the pressures that require product replacement. Despite these differences, there was no significant difference in the success rate of the four strategies, this
despite conspicuous substitution being a more com- plex activity than, say, re-launch. Inspection of the pressures for replacement suggests why success rates are so similar. The minor product-market changes often occur as a minimal response to environment changes. The small changes reduce technological uncertainty and costs, but the commercial uncertainty increases because of the inadequacy of the responses. Conversely, the radical changes provide more oppor- tunities for things to go wrong but, if successful, have a higher potential for commercial gains.
Although the launch and deletion of products are normally separated by academics, the links between the launch and deletion strategies suggest that practi- tioners do synchronize them. The results suggest that the familiar price-promotion launch matrix mirrors a deletion matrix: rapid launch strategies being accom- panied by rapid deletion, and low price launches being accompanied by even lower priced deletions.
The immaturity of replacement research means this article exposes as many opportunities for further research as it provides answers. Because the process has been to define hypotheses from qualitative research and then test them, many of the findings need cross-validating using further studies. There are also questions that go beyond the present study:
1. Because product replacements now often follow rapidly one after another, how should a series of deletions be managed? In particular, would it be better to launch a series of minor changes or make a series of less frequent but more substantial ones? Our results suggest that a few major changes are best as major and minor changes have the same risk. However, the competitive gains from having up-to-date variants on the market may compensate for the cumulative risk of frequent changes.
2. What is the optimal degree of change? Are there, for certain market segments, points where it is best to disguise major changes as minor ones, or vice versa? Our results show associations between the magnitude
448 J PROD INNOV MANAG J. SAUNDERS AND D. JOBBER 1994; 11:433-450
of changes made and competitive pressures but only consumer research will resolve this dilemma.
3. Is there a minimum life of product that is acceptable to customers? The pace of technological and market change means that products are becoming competi- tively obsolete before they are material-, fashion-, or technologically dated. Competitive pressures are forcing firms to update their product ranges more and more rapidly. This means the buyers always get the best available, but at what point does the speed of products being replaced stimulate a regret that reduces long-run consumer satisfaction? Our re- sults show both the trade and consumers rejecting product replacements. Maybe this is an unavoida- ble cost when technological competition forces the pace of change.
4. The move toward planned, rather than ad hoc, product replacements suggests that the positioning of deleted and launch products be orchestrated. For instance, what "end of life kicker" best helps coming launches? Sales promotions are themselves a neglected research area; so much needs doing to understand what campaigns can kill one product while building another.
5. How should companies organize the replace- ment process? Should both launch and deletion be managed by one team? What reward schemes are appropriate for a successful deletion?
This article provides evidence of the increasing complexity of the marketing problem. No longer is the problem the product, but the product line; no longer the brand, but the brand extension; and, in this case, no longer a product life cycle, but a series of synchronized product life cycles--a multidimensional rather than a one dimensional decision and one in which marketing plays one part in the interplay among organizations, technology, and the environment.
References 1. Aaker, David A. and Keller, Kevin L. Consumer evaluation of brand
extension. Journal of Marketing 54(1):27-41 (1990).
2. Abell, Derek F. Defining the Business: The Starting Point of Strategic Planning. Englewood Cliffs, NJ: Prentice-Hall, 1980.
3. Abemathy, William J. and Baloff, Nigel. Interfunctional planning for new product introduction. Sloan Management Review 14:25-44 (Winter 1972-1973).
4. Alexander, Ralph S. The death and burial of "sick" products. Journal of Marketing 28:1-7 (April 1964).
5. Ansoff, Igor. Corporate Strategy. Harmondsworth, England: Penguin, 1957.
6. Assael, Henry. Consumer Behavior and Marketing Action. Boston: Kent Publishing, 1987.
7. Automotive News. Will Sierra Become Ford's European Edsel? D1-2: (April 25 1983).
8. Avlonitis, George J. The product elimination decision and strategies. Industrial Marketing Management 12(1 ): 31-43 (1983).
9. Avlonitis, George J. Industrial product elimination: major factors to consider. Industrial Marketing Management 13(2):77-85 (1984).
10. Cooper, Robert G. The dimensions of industrial new product success and failure. Journal of Marketing 43:93-103 (Summer 1979).
11. Davidson, Hugh. Offensive Marketing, 2d edition. New York: Viking Penguin, 1987.
12. Dickson, Michael. The workers tell it the way they see it. Financial Times 12 (November 8, 1990).
13. Doyle, Peter and Saunders, John. The lead effects of marketing decisions. Journal of Marketing Research XXII:54-65 (February 1985).
14. Enrico, Roger and Kornbluth, Jesse. The Other Guy Blinked: How Pepsi Won the Cola Wars. New York: Bantam Books, 1986.
15. Everitt. Cluster Analysis. London: Heinemann, 1974.
16. Galignon, Hubert and Robertson, Thomas S. Technology diffusion: an empirical test of competitive effects. Journal of Marketing 53:35-49 (January 1989).
17. Gomory, Ralph E. From the "ladder of science" to the product development cycle. Harvard Business Review 89(6):99-105 (1989).
18. Guiltinan, Joseph P. and Paul, Gordon W. Marketing Management Strategies and Programs. New York: McGraw-Hill, 1982.
19. Hansen, Robert A. A self-perception theory of the effect of monetary and non-monetary incentives on mail survey response behavior. Journal of Marketing Research 18:88-93 (1980).
20. Hart, Susan. Dimensions of success in new product development: an exploratory investigation. Journal of Marketing Management 9(1):23- 41 (January 1993).
21. Hise, Richard T. and McGinniss, Joseph. Product elimination: practice, policies, and ethics. Business Horizons 18:25-32 (June 1975).
22. Kotler, Philip. Marketing Management: Analysis, Planning, Implemen- tation, and Control, 6th edition. Englewood Cliffs, N J: Prentice-Hall, 1988.
23. Lachenbruch, Peter A. and Mickey, M. Ray. Estimation of error rates in discriminant analysis. Technometrics 10:1-10 (February 1968).
24. Lazer, William, Luqmani, Mushtaq and Quraeshi, Zahir. Product rejuvenation strategies. Business Horizons 26(6):21-28 (1984).
25. Marketing. Lever explains Persil u-turn. 17(13):4 (June 1984).
26. Miles, Raymond E. and Snow, Charles C. Organizational Strategy, Structure, and Process. New York: McGraw-Hill, 1978.
27. Mojena, Robert and Wishart, David. Stopping roles for Ward's clustering method. COMPSTAT 1980 Proceedings, Physics-Verlag, 426-432 (1980).
28. Moss-Kanter, Rose. How to compete. Harvard Business Review 90(1):7-8 (1990).
29. Nash, Bruce and Zullo, Allan. The Mis-Fortune 500. New York: Pocket Books, 1988.
30. Nevens, T. Michael, Summe, Gregory L. and Uttal, Bro. Commercial- izing technology: what the best companies do. Harvard Business Review 90(3): 154-163 (1990).
31. Porter, Michael E. Competitive Strategy. New York: Free Press, 1980.
32. Pressley, Milton M. and Tullar, William. A factor interactive investigation of mail survey response rates from a commercial population. Journal of Marketing Research 41 : 108-112 (1977).
33. Punj, G. and Stewart, D.W. Cluster analysis in marketing research; a review and suggestion for application. Journal of Marketing Research 20(2): 111-129 (1983).
34. Robertson, Thomas S. 'Innovative Behavior and Communication. New York: Holt, Rinehart & Winston, 1971.
35. Rogers, Everett M. The Diffusion of Innovations. New York: Free Press, 1983.

SIMULTANEOUS PRODUCT DELETION AND LAUNCH J PROD INNOV MANAG 449 1994; 11:433-450
36. Saunders, John. Brands and valuation. International Journal of Advertising Research 9(2):95-100 (1990).
37. Saunders, John, Brown, Michael and Laverick, Smart. Research note on the best of British companies: a peer evaluation of Britain's leading firms. British Journal of Management 3(4): 181-196 (1992).
38. Sheth, Jagdish N. Psychology of innovation resistance: the less developed concept (LDC) in diffusion research. In: Research in Marketing, J. N. Sheth (ed.). Greenwich, CT: JAI Press, 1981, pp. 273-282.
39. Silverman, Brian. Why new products fail: the retail dimension. ADMAP 241:338-340 (June 1985).
40. Stewart, David and Hood, Neil. Evaluating the strategies of East European car producers in the U K. Management Decision 20(1 ):3-14 (1982).
41. Ward, Joe H., Jr. Hierarchical grouping to optimise an objective function. Journal of the American Statistical Association 58:236-244 (1963).
42. Wensley, Robin. Strategic marketing: betas, boxes or basics. Journal of Marketing 45:173-183 (Summer 1981).
43. White, Roderick. Consumer Product Development. London: Penguin, 1976.
44. Wind, Yoram. Product Policy: Concepts, Method and Strategy. Reading, MA: Addison-Wesley, 1982.
Appendix I. Data Description
1. Variables measuring the degree of commonality between the old and new product using a five-point scale.
Brand name, target market, product positioning, distribution channels, product appearance, raw materials/components, production facilities, and competition. (1 -- exactly the same to 5 = completely different).
Price, manufacturing costs, cost of use to the consumer, performance. (1 -- much lower to 5 -- much higher).
2. Variables measuring expenditures with average market prices, using a five-point scale. Questions repeated for the old and new product. (1 -- much lower to 5 = much higher).
Price, advertising, consumer promotions, trade promotions, sales force effort, and benefit/extras added.
3. Categorical variables relating to number of prod- ucts involved.
New product entirely replaced the old, new product replaced more than one old, old product replaced by more than one new, new product an upgrade, new product a downgrade.
4. Categorical variables relating to the roll in/roll out of products.
Across the whole market at once, nation after nation, across the country, and segment by segment.
5. Categorical variables relating to the seasonality of the replacement.
During low season, prior to high season, during high season, after high season, no particular season, market not season, for major trade show.
6. Categorical variables relating to public relations.
Forthcoming replacement broadcast widely to the trade . . . . the general public, officially leaked to the media, unofficially leaked . . . . and kept secret until the launch.
7. Categorical variables concerning the old and new product being sold side by side.
To different segments, had different specification, because of consumer pressure, old product reposi- tioned, old product sold off through special channels, and old product exported.
Two sold side by side: not at all, week, month, three months, year, more.
8. Variables relating to the change in the background to the replacement. (1 -- completely untrue to 5 -- completely true).
Market size increasing, product/brands, number of competitors, international competition, number of nations competing, price competition, promo- tional competition, product performance competi- tion, product features, distribution, new products, few dominant competitors, many similar competi- tors, rapid technological change, rapid style/ design change, changing tastes, new dominant design, replaced product and market leader, many small competitors, competition mainly domestic, large potential market, product replacement fre- quent, company has much product replacement experience.
9. Success or failure.
Categorical variable for success or failure.
Open-ended questions asking reasons for classify- ing as success or failure.
Sales/profits as a percentage of old product sales/ target sales.
10. Industry classification.
Size of company, nationality, sector, and product.

450 J PROD INNOV MANAG J. SAUNDERS AND D. JOBBER 1994; 11:433-450
Appendix II. Multiple Discriminant Analysis of the Clusters
Standardized Discriminant Function Mean Group Scores
Variable 1 2 3 4 1 2 3 4 5
Appearance 1 -0.51 0.61 --0.45 0.22 3.75 3.42 2.60 2.89 3.56 Name 1 0.11 -0.32 0.36 0.38 2.41 2.93 3.27 2.62 2.72 Target I 0.48 0.50 ~3.81 -0.29 1.66 1.77 1.40 2.05 1.22 Positioning I -0.17 -0.56 0.34 -0.47 2.29 2.29 2.73 2.39 1.56 Raw materials l ~0.02 -0.83 -0.37 -0.13 3.36 3.42 3.33 2.36 2.33 Production 1 -0.09 0.18 0.55 -0.45 2.54 1.74 2.73 2.03 2.33 Competition 1 -0 .24 -0 .34 0.27 0.23 2.00 1.93 2.47 1.72 1.78 Price 1 0.49 -0.16 0.24 0.40 2.77 3.03 3.40 3.61 3.39 Cost a 0.04 0.33 0.23 -0 .50 2.67 2.45 2.87 3.16 2.83 Performance ~ -0.36 0.25 0.31 -0.33 4.11 3.68 4.27 3.91 3.94 Price z 0.14 0.12 -0.16 -0.02 2.97 3.13 3.53 3.60 3.22 Advertising 2 0.49 -0.07 -0.29 -0 .50 2.79 3.68 3.40 3.75 2.61 Sales promotion 2 0.43 -0 .04 0.19 0.05 3.12 3.71 3.67 3.80 3.44 Trade promotion 2 0.23 -0.08 0.00 0.42 3.00 3.81 3.67 3.70 3.17
Eigenvalue 0.97 0.26 0.20 0.12
Relative % 62.6 16.84 12.94 7.64 Wilks Lambda 0.30 0.59 0.74 0.89 Chi square 215 94 53 20 Degree of freedom 56 39 24 11 Significance level 0.00 0.00 0.00 0.00
l Variables representing product changes. 2 Variables representing changes in expenditure.