production and characterisation of self-crosslinked
TRANSCRIPT
Production and Characterisation of Self-Crosslinked
Chitosan-Carrageenan Polyelectrolyte Complexes
Nawar Al-Zebari
St. John’s College, Cambridge
Department of Materials Science and Metallurgy
University of Cambridge
April 2017
This dissertation is submitted for the degree of Doctor of Philosophy

Chapter 1 - Overview and Motivation
i
Declaration
This dissertation is the original work of the author and does not include any research that is the
outcome of work done in collaboration with others, except where specifically indicated in the text and
acknowledgements.
The enclosed research was conducted in the Department of Materials Science and Metallurgy,
University of Cambridge, under the supervision of Prof. Ruth Cameron and Prof. Serena Best between
October 2013 and April 2017. This thesis has not been submitted, nor is in the process of being
submitted, for any other qualifications at this or any other institution.
In accordance with the Degree Committee of the Faculty of Physics and Chemistry, this dissertation
does not exceed 60,000 words.
Nawar Al-Zebari
April 2017

Chapter 1 - Overview and Motivation
ii
This thesis is dedicated to my loving parents, Mudhaffar Al-Zebari & Julyana Randquist.

Chapter 1 - Overview and Motivation
iii
Acknowledgements
First and foremost, I would like to express my deepest gratitude to my supervisors Prof. Ruth Cameron
and Prof. Serena Best for their support and guidance throughout my PhD. I am indebted to them for
providing me with the opportunity to carry out my research at the University of Cambridge. Your
wisdom has made me the person I am today. I would also like to thank my tutor Miss Sylvana Tomaselli
from St. John’s College for all her support and her open-door policy to discuss any personal matters.
Particular thanks to Dr Jose Araujo, who has helped me get started with my PhD by answering my
e-mails while he was working in Switzerland. Huge thanks to Dr Daniel Bax, who became a great friend.
He introduced me to all the biological work and taught me cell culture techniques. I also thank him for
proofreading my biological chapter. His kindness and fruitful discussions have always inspired me.
Also, thanks to Dr Edi Tanase and Dr Natalia Davidenko for the helpful experimental discussions.
Appreciation to Robert Cornell for his help with polymer characterisation, Simon Griggs for his
technical assistance with the SEM and Dr Andrew Rayment for his technical support with mechanical
testing. Also thanks to Wayne Skelton-Hough and Zlatko Saracevic for their help in the CCMM lab.
To my great friend, Ismael Moreno-Gomez, thank you for inviting me to your home in Granada, Spain.
I cannot forget all the work you and Igor Romanov put in for the Enterprise competitions, and all the
fun times we had, which was one of the greatest things I did outside the office. Also thanks to my dear
friend Zein Azhari who has been an excellent buddy throughout all the academic and fun activities in
Cambridge and her help with reading the chapters. I would also like to thank Robert Murphy for his
companionship, kindness and help with reading my work.
Thanks to CCMM group for the numerous extracurricular activities and the fun times you provided me
during the pub trips, Christmas dinners, outings and of course by sharing our office together.
All this work would not have been possible without the funding provided by the Cambridge Home and
EU Scholarship Scheme (CHESS) and the financial support from St. John’s College who has made my
time here in Cambridge an unforgettable one. Thanks to Cambridge Philosophical Society, the Institute
of Materials, Minerals and Mining and the Armourers and Brasiers for their conference travel funding.
Last but not least, I would like to thank all my family for their love, support, and assistance. This PhD
would not have been completed without the backing of my parents and brothers. I cannot thank them
enough for all the sacrifices they have made for me to reach my academic goals.
Lord, thank you for always being there for me.

Chapter 1 - Overview and Motivation
iv
“The journey of a thousand miles begins with one step.” - Lao Tzu

Chapter 1 - Overview and Motivation
v
Abstract
Macromolecular biomaterials often require covalent crosslinking to achieve adequate stability and
mechanical strength for their given application. However, the use of auxiliary chemicals may be
associated with long-term toxicity in the body. Oppositely-charged polyelectrolytes (PEs) have the
advantage that they can self-crosslink electrostatically and those derived from marine organisms are
an inexpensive alternative to glycosaminoglycans present in the extracellular matrix of human tissues.
A range of different combinations of PEs and preparation conditions have been reported in the
literature. However, although there has been some work on complex formation between chitosan (CS)
and carrageenan (CRG), much of the work undertaken has ignored the effect of pH on the consequent
physicochemical properties of self-crosslinked polyelectrolyte complex (PEC) gels, films and scaffolds.
Chitosan is a positively-charged polysaccharide with NH3+ side groups derived from shrimp shells and,
carrageenan is a negatively-charged polysaccharide with OSO3- side groups derived from red seaweed.
These abundant polysaccharides possess advantageous properties such as biodegradability and low
toxicity. However, at present, there is no clear consensus on the cell binding properties of CS and CRG
or CS-CRG PEC materials.
The aim of this study was to explore the properties of crosslinker-free PEC gels, solvent-cast PEC films
and freeze-dried PEC scaffolds based on CS and CRG precursors for medical applications. The objective
was to characterise the effect of pH of the production conditions on the physicochemical and
biological properties of CS-CRG PECs. Experimental work focused on the interaction between PEs, the
composition of PECs, the rheological properties of PEC gels and the mechanical properties of PEC films
and scaffolds. In addition, cell and protein attachment to the PEC films was assessed to determine
their interactions in a biological environment.
For biomedical applications, these materials should ideally be stable when produced such that they
can be processed to form either a film or a scaffold and have mechanical properties comparable to
those of collagenous soft tissues. FTIR was used to confirm PEC formation. Zeta potential
measurements indicated that the PECs produced at pH 2-6 had a high strength of electrostatic
interaction with the highest occurring at pH 4-5. This resulted in stronger intra-crosslinking in the PEC
gels which led to the formation of higher yield, solid content, viscosity and fibre content in PEC gels.
The weaker interaction at pH 7-12 resulted in higher levels of CS incorporated into the complex and
the formation of inter-crosslinking through entanglements between PEC units. This resulted in the
production of strong and stiff PEC films and scaffolds appropriate for soft tissue implants. The PECs
prepared at pH 7.4 and 9 also exhibited low swelling and mass loss, which was thought to be due to

Chapter 1 - Overview and Motivation
vi
the high CS content and entanglements. From the range of samples tested, the PECs produced at pH
7.4 appeared to show the optimum combination of yield, stability and homogeneity for soft tissue
implants.
Biological studies were performed on CS, CRG and PECs prepared at pH 3, 5, 7.4 and 9. All of the PE
and PEC films were found to be non-cytotoxic. When the response of three different cell types and a
high binding affinity protein (tropoelastin) was evaluated; it was found that the CS-CRG PEC films
displayed anti-adhesive properties. Based on these experimental observations and previous studies,
a mechanistic model of the anti-adhesive behaviour of PEC surfaces was proposed. It was therefore
concluded that the CS-CRG PECs produced might be suitable for non-biofouling applications.

Chapter 1 - Overview and Motivation
vii
Abbreviations
% v/v Percent volume/volume
% w/v Percent weight/volume
°C Degrees Celsius
µl Microlitre
2-D Two-dimensional
3-D Three-dimensional
AFM Atomic force microscopy
Alg Alginate
ATCC American Type Culture Collection
AU Arbitrary units
BA-4 Mouse anti-elastin antibody
BSA Bovine serum albumin
C-4-S Chondroitin-4-sulfate
CB Carboxybetaine
CBR (3B-A) Cibacron brilliant red 3B-A
ChS Chondroitin sulfate
Coll Collagen
CRG Carrageenan
CS Chitosan
DAPI 4′,6-diamidino-2-phenylindole
DDA Degree of deacetylation
DMEM Dulbecco's Modified Eagle’s Medium
DNA Deoxyribonucleic acid
DRG Dorsal root ganglion
DS Dermatan sulfate
DSC Differential scanning calorimetry
EB Elongation to break
ECACC European Collection of Animal Cell Cultures
ECM Extracellular matrix
EDC 1-ethyl-3-(3-dimethylaminopropyl) carbodiimide hydrochloride

Chapter 1 - Overview and Motivation
viii
EDTA Ethylenediaminetetraacetic acid
ELISA Enzyme-linked immunosorbent assay
EtOH Ethanol
FBS Foetal bovine serum
FDA Food and Drug Administration
FITC Fluorescein isothiocyanate
FTIR Fourier transform infrared spectroscopy
g gram
G’ Storage modulus
G’’ Loss modulus
GA Glutaraldehyde
GAG Glycosaminoglycan
GPC Gel permeation chromatography
GRAS Generally recognised as safe
h Hour
hASCs Human adipose-derived stem cells
HMEC Human microvascular endothelial cells
hMSCs Human mesenchymal stem cells
HPLC High-performance liquid chromatography
HRP Horseradish peroxidase
HT1080 Human fibrosarcoma cell line
HyA Hyaluronic acid
Hz Hertz
ICDD International Centre for Diffraction Database
IgG-HRP Goat anti-mouse secondary antibody coupled with HRP
ITC Isothermal titration calorimetry
l Litre
LDPE Low-density polyethylene
LVR Linear viscoelastic region
m Mass
m0 Initial mass
MB Methylene blue

Chapter 1 - Overview and Motivation
ix
md Dried mass
Micro-CT X-ray micro-computed tomography
min Minute
ml Millilitre
mt Total mass
mV Millivolt
MW Molecular weight
mw Wet mass
N Newton
NCS Nitrogen, carbon, sulfur elemental analysis
NHS N-hydroxy-succinimide
nm Nanometre
nX Non-crosslinked
OM Optical microscope
OPA o-Phthalaldehyde
Pa Pascal
PAA Polyacrylic acid
PBS Phosphate buffer solution
PE Polyelectrolyte
PEC Polyelectrolyte complex
PEG Polyethylene glycol
pKa Acid dissociation constant
PLL Poly-L-lysine
pNPP p-Nitrophenyl phosphate
PP Polypropylene
PS Polystyrene
PTFE polytetrafluoroethylene
PVA polyvinyl alcohol
Rad/s Radiant/second
RGD Arginyl-glycyl-aspartic acid
rpm Rotation per minute
RT Room temperature

Chapter 1 - Overview and Motivation
x
s Second
SAXS Small angle X-ray diffraction and spectroscopy
SB Sulfobetaine
SE Secondary electrons
SEC-MALLS Size exclusion chromotography-multi-angle light scattering detection
SEI Strength of electrostatic interaction
SEM Scanning electron microscope
SUP Supernatant
SW1353 Chondrosarcoma cell line
TB Toluidine blue
TCPP Tissue culture plate polystyrene
TGA Thermogravimetric analysis
TGF-β Transforming growth factor beta
TMB 3,3’,5,5’-tetramethylbenzidine
TS Tensile strength
UMR Unit molar ratio
UTS Ultimate tensile strength
UV-Vis Ultraviolet-Visible Spectroscopy
WAXS Wide-angle X-ray scattering analysis
Wt. % Weight percent
WVP Water vapour permeability
XL Crosslinked
XPS X-ray photoelectron spectroscopy
ζ-potential Zeta potential
ι-CRG iota-Carrageenan
κ-CRG kappa-Carrageenan
λ-CRG lambda-Carrageenan
Chapter 1 - Overview and Motivation
xi
Contents
Chapter 1 - Overview and Motivation ............................................................................... 1
Chapter 2 – Literature Review ............................................................................................. 3
2.1 Polyelectrolytes ................................................................................................................ 3
2.1.1 Introduction to Polyelectrolytes ............................................................................................ 3
2.1.2 Polysaccharides as Polyelectrolytes ....................................................................................... 4
2.1.3 Chitin/Chitosan ...................................................................................................................... 5
2.1.4 Carrageenan ........................................................................................................................... 8
2.2 Polyelectrolyte Complexes ............................................................................................... 9
2.2.1 Introduction to Polyelectrolyte Complexes ........................................................................... 9
2.2.2 General Concept of Polyelectrolyte Complex Formation .................................................... 10
2.2.3 Effect of Experimental Conditions on Polyelectrolyte Complex Formation ........................ 13
2.2.4 Chitosan-Carrageenan Polyelectrolyte Complexes .............................................................. 15
2.3 Conclusions and Unanswered Questions ....................................................................... 19
2.4 Project Aims ................................................................................................................... 19
2.5 Thesis Structure .............................................................................................................. 20
Chapter 3 – Spectrophotometric Study ........................................................................... 21
3.1 General Introduction ...................................................................................................... 21
3.2 Quantification of Chitosan and Carrageenan ................................................................. 22
3.3 Comparative Study of UV-Vis Spectrometer and Plate Reader ..................................... 30
3.4 Time Measurements to Study Dye Decay ...................................................................... 32
3.5 Confirmation of Wischke and Borchert’s Study ............................................................. 34
3.6 Polyelectrolyte-Dye Interaction ..................................................................................... 36
3.7 Overall Conclusions ........................................................................................................ 44
Chapter 4 – Polyelectrolyte Complex Gels ...................................................................... 45
4.1 Introduction .................................................................................................................... 45
4.2 Materials and Methods .................................................................................................. 46
4.2.1 Materials .............................................................................................................................. 46
4.2.2 Thermogravimetric Analysis ................................................................................................ 46
4.2.3 Ζeta Potential ....................................................................................................................... 47
4.2.4 Molar Ratio Calculation........................................................................................................ 47
4.2.5 Preparation of PEC Gels ....................................................................................................... 48

Chapter 1 - Overview and Motivation
xii
4.2.6 Optical Microscopy .............................................................................................................. 50
4.2.7 Yield of PEC Gels................................................................................................................... 50
4.2.8 Moisture, Solid Content and pH of PEC Gels ....................................................................... 50
4.2.9 Nitrogen, Carbon and Sulfur Elemental Analysis ................................................................. 51
4.2.10 Fourier Transform Infrared Spectroscopy.......................................................................... 51
4.2.11 X-Ray Diffraction ................................................................................................................ 52
4.2.12 Rheology ............................................................................................................................ 52
4.3 Results ............................................................................................................................ 53
4.3.1 Thermogravimetric Analysis ................................................................................................ 53
4.3.2 Ζeta Potential ....................................................................................................................... 54
4.3.3 Visual Assessment of PEC Gels ............................................................................................. 55
4.3.4 Optical Microscopy .............................................................................................................. 56
4.3.5 Yield, Moisture and Solid Content of PEC Gels .................................................................... 56
4.3.6 pH Measurements of PEC Gels ............................................................................................ 58
4.3.7 Nitrogen, Carbon and Sulfur Elemental Analysis ................................................................. 58
4.3.8 Fourier Transform Infrared Spectroscopy ............................................................................ 59
4.3.9 X-Ray Diffraction .................................................................................................................. 60
4.3.10 Rheology ............................................................................................................................ 61
4.4 Discussion ....................................................................................................................... 63
4.4.1 Thermal Degradation ........................................................................................................... 63
4.4.2 Impurities ............................................................................................................................. 63
4.4.3 Nature of Interactions .......................................................................................................... 64
4.4.4 Physicochemical Properties of PEC Gels .............................................................................. 66
4.4.5 Composition of PEC Gels ...................................................................................................... 68
4.4.6 Rheological Properties of PEC Gels ...................................................................................... 69
4.5 Conclusions ..................................................................................................................... 74
Chapter 5 – Polyelectrolyte Complex Films .................................................................... 75
5.1 Introduction .................................................................................................................... 75
5.2 Materials and Methods .................................................................................................. 76
5.2.1 Preparation of CS, CRG and PEC Films ................................................................................. 76
5.2.2 Preparation of Collagen Films .............................................................................................. 77
5.2.3 Swelling and Dissolution ...................................................................................................... 77
5.2.4 Enzymatic Degradation ........................................................................................................ 78
5.2.5 Scanning Electron Microscopy ............................................................................................. 78
5.2.6 Contact Angle Measurements ............................................................................................. 79

Chapter 1 - Overview and Motivation
xiii
5.2.7 Mechanical Tensile Testing .................................................................................................. 79
5.3 Results ............................................................................................................................ 80
5.3.1 Swelling ................................................................................................................................ 80
5.3.2 Dissolution ........................................................................................................................... 80
5.3.3 PEC Films pH Measurements ............................................................................................... 82
5.3.4 Enzymatic Degradation ........................................................................................................ 82
5.3.5 Scanning Electron Microscopy ............................................................................................. 84
5.3.6 Contact Angle Measurements ............................................................................................. 85
5.3.7 Mechanical Tensile Testing .................................................................................................. 86
5.4 Discussion ....................................................................................................................... 89
5.4.1 Structural Properties ............................................................................................................ 89
5.4.2 Stability ................................................................................................................................ 92
5.4.3 Mechanical Properties ......................................................................................................... 94
5.5 Conclusions ..................................................................................................................... 99
Chapter 6 – Polyelectrolyte Complex Scaffolds ........................................................... 100
6.1 Introduction .................................................................................................................. 100
6.2 Materials and Methods ................................................................................................ 101
6.2.1 Preparation of Scaffolds ..................................................................................................... 101
6.2.2 Swelling .............................................................................................................................. 103
6.2.3 Scanning Electron Microscopy ........................................................................................... 103
6.2.4 X-Ray Micro-Computed Tomography ................................................................................ 103
6.2.5 Mechanical Compression Testing ...................................................................................... 104
6.3 Results .......................................................................................................................... 105
6.3.1 Stability and Swelling ......................................................................................................... 105
6.3.2 Scanning Electron Microscopy ........................................................................................... 108
6.3.3 X-Ray Micro-Computed Tomography ................................................................................ 110
6.3.4 Mechanical Compression Testing ...................................................................................... 113
6.4 Discussion ..................................................................................................................... 116
6.4.1 Stability and Swelling ......................................................................................................... 116
6.4.2 Pore Structure and Pore Size Analysis ............................................................................... 116
6.4.3 Mechanical Properties ....................................................................................................... 118
6.5 Conclusions ................................................................................................................... 123

Chapter 1 - Overview and Motivation
xiv
Chapter 7 – Biological Response of Polyelectrolyte Complexes .............................. 124
7.1 Introduction .................................................................................................................. 124
7.2 Literature Review ......................................................................................................... 126
7.2.1 Factors Affecting Cell Adhesion ......................................................................................... 126
7.2.2 Biological Properties of CS, CRG and PECs ......................................................................... 129
7.2.3 Biofouling and Anti-Adhesive Surfaces .............................................................................. 131
7.2.4 Aim and Objectives ............................................................................................................ 134
7.3 Materials and Methods ................................................................................................ 135
7.3.1 Materials ............................................................................................................................ 135
7.3.2 Film Preparation for Cell Culture ....................................................................................... 135
7.3.3 Fibrosarcoma Cells ............................................................................................................. 136
7.3.4 Primary Human Dermal Fibroblast Cells ............................................................................ 138
7.3.5 Chondrosarcoma Cells ....................................................................................................... 138
7.3.6 Protein Adhesion ................................................................................................................ 139
7.4 Results .......................................................................................................................... 140
7.4.1 Fibrosarcoma Cells ............................................................................................................. 140
7.4.2 Primary Human Dermal Fibroblast Cells ............................................................................ 147
7.4.3 Chondrosarcoma Cells ....................................................................................................... 149
7.4.4 Protein Adhesion ................................................................................................................ 151
7.5 Discussion ..................................................................................................................... 154
7.5.1 Cell Studies ......................................................................................................................... 154
7.5.2 Protein Study ...................................................................................................................... 157
7.6 Conclusions ................................................................................................................... 161
Chapter 8 – Overall Conclusions and Future Work ..................................................... 162
8.1 General Conclusions ..................................................................................................... 162
8.2 Recommendations for Future Work ............................................................................ 164
References ........................................................................................................................... 166

Chapter 1 - Overview and Motivation
1
Chapter 1 - Overview and Motivation
There is an increasing interest in the development of effective, sustainable and economical
biomaterials that possess the appropriate physicochemical and biological cues for their intended
applications. Biomacromolecules such as polysaccharides have wide potential as biomaterials 1,2, but
often require chemical crosslinking to confer appropriate stability and mechanical strength 3. Some
auxiliary crosslinker chemicals such as glutaraldehyde crosslinker are known to be toxic and
mutagenic, and their fate in the body is not always well understood 4,5. “Self-crosslinking” via
electrostatic interactions (polyelectrolyte complexing) can avoid the use of cytotoxic crosslinkers
whilst maintaining stability at pH 7.4 and below 6. Unlike covalently crosslinked macromolecules, the
advantage of polyelectrolyte complexes (PECs) is that no significant purification processes are
required prior to administration 3. The PECs are dynamic materials owing to their reversible
electrostatic bonds and charged groups which make them highly sensitive to their surrounding
environment (especially to pH, ionic strength and PE concentration) 6–8. This dynamic structure can
lead to controlled swelling and degradation, and may, therefore, be used for tissue engineering or
drug-delivery applications in changing physiological environments.
This research focuses on the preparation, and physicochemical characterisation of PECs based on
chitosan (CS) and κ-carrageenan (CRG) derived from shrimp shells and red seaweed, respectively. CS
and CRG are less expensive than their glycosaminoglycan (GAG) counterparts found in the
extracellular matrix of the body such as hyaluronic acid, chondroitin sulfate and heparin 9. The low
costs are due to the vast abundance of waste shrimp shells 10 and farmed red seaweed 11 and their
relatively simple extraction methods 9.
CS, a positively-charged polysaccharide is widely considered as the second most abundant organic
material after cellulose 13. CS possesses appealing intrinsic properties such as non-toxicity 16 and
biodegradability 17, as well as being bioadhesive 18 and bacteriostatic 19.
CRG, a negatively-charged polysaccharide, is an inexpensive alternative to heparin 20. It contains highly
sulfated charged groups which result in immune-stimulating effects in organisms 21 or provide non-
thrombogenic properties to coatings 20. CRG has also been shown previously to improve the formation
of extracellular matrix components through bio-molecular crowding 22 and has been proposed for
protein drug delivery 23 owing to its biocompatibility 24 and promotion of cell viability 25.

Chapter 1 - Overview and Motivation
2
In the literature, there is a mixed view of the biological properties of CS and CRG materials. They have
been reported to be suitable for both cell-adhesive and cell non-adhesive surfaces as shown in reviews
by Liu et al. (2014) 26 and Junter et al. (2016) 27 and the references therein.
Although there have been wide interests in using CS and CRG as individual materials, there is currently
little work published on CS-CRG PEC materials. PECs from CS and CRG have been prepared as freeze-
dried 3-D scaffolds by Araujo et al. (2014) 28. These scaffolds were found to be attractive for osteoblast
cell attachment and showed potential for bone tissue engineering. However, CS-CRG PECs have also
been widely reported to reduce cell adhesion such as in work carried out by Bratskaya et al. (2007) 29
where CS-CRG PECs were used in a layer-by-layer film form. A reduction in the adhesion of two
enterococcal strains was observed when compared with glass. Therefore, the biological properties of
CS-CRG PECs merit further investigation in the form of films to exclude any potential complicating
effects from the 3-D scaffold structure such as cell entrapment 30 and 3-D architecture 31.
The motivation for using CS-CRG PECs as opposed to CS and CRG alone is the potential for stable
coatings, gels, films and scaffolds without further crosslinking, purification or modification. For
example, once the PEC gel is produced, it can be solvent cast into non-porous films 32 or freeze-dried
into porous scaffolds 33. CS alone can be too brittle for some applications due to its inherent chain
rigidity 34 and is difficult to control drug delivery when entangled alone 3. CS is also highly soluble in
acidic conditions due to its pKa value of 6.4 35. CRG is soluble in water and therefore cannot be used in
its pure form without covalent crosslinking 36. CRG is also known to be more hydrophilic than CS 37,
and therefore the mechanical and hydration properties of CS-CRG PECs may be tailored by controlling
the composition.
In this thesis, a rigorous approach to the synthesis and characterisation of PEC gels, films and scaffolds
is presented. Previous research has shown that pH is a highly influential parameter on the charge
density of PEs which could alter the physicochemical properties of PECs 38. However, there are
currently no detailed studies investigating the effect of pH on the physicochemical and biological
properties of CS-CRG PECs. This study will improve the understanding of the effect of electrostatic
complexing and self-crosslinking type upon the mechanical performance. It is hypothesised that
varying the pH during PEC preparation will have a significant influence on the strength of the
electrostatic interaction and ultimately on the stability of PECs produced.
The possibility of using polysaccharides for both tissue engineering and anti-fouling applications
merits more detailed investigation as to whether the materials are adhesive or non-adhesive for cells.
Therefore, the materials produced in this thesis will be tested with three different cell lines using cell
attachment studies and a protein adhesion study. The origins of any effects observed will be discussed.
Chapter 2 – Literature Review
3
Chapter 2 – Literature Review
2.1 Polyelectrolytes
2.1.1 Introduction to Polyelectrolytes
Polyelectrolytes (PEs) are polymers with ionisable groups and exist as polycations (positively-charged
polymers) and polyanions (negatively-charged polymers) 39. These materials become charged when
their counterions are dissociated in an aqueous solution 40. They are similar to electrolytes, except
that they consist of high molecular weight polymers and are therefore also known as polysalts because
of their salt-like conductivity and polymer-like structure 41.
PEs can be divided into weak and strong types 42. The strong PEs usually consist of highly negatively-
charged side groups such as sulfates (SO3H) and phosphates (PO3H2) whereas weak PEs usually consist
of carboxylic (COOH) side groups 43. Strong PEs dissociate at a wide pH range (e.g. pH 2-13), whereas
weak PEs only dissociate at a more narrow pH range (e.g. pH 1-5) 44.
Generally, a non-charged polymer in a solution exists in a random conformation whereas a charged
polymer will adopt a more expanded and rigid rod-like structure as previously measured with static
and dynamic light scattering 45,46. The reason for the latter case is due to the high charge density of
the side groups which causes the chains to repel each other 47,48.
The PE conformation is also largely influenced by the experimental conditions used 47,49,50. The charge
density can be further altered with a change in counterion concentration (ionic strength) 42. The rigid
chain structure may collapse back into a random neutral polymer like conformation when the ionic
strength is increased 49. The random polymer conformation is due to the charge screening of the PEs
by the counterions from the salt, and therefore reducing the overall charge density 51.
A similar random coil conformation of the PE may take place when the pH is near the pKa value of the
PE, inducing a neutral charge 38. Polymer conformation can affect the bulk properties i.e. viscosity and
turbidity of solutions and can be studied using rheology, UV-Vis spectroscopy and static light scattering
techniques 52,53.
A myriad of oppositely-charged PEs is available commercially for the production of self-crosslinked
PECs. These PEs include polysaccharides 26, proteins 54, nucleic acids 55 and synthetic polymers 56,57.
However, in this thesis, the emphasis will be placed on polysaccharides.

Chapter 2 – Literature Review
4
2.1.2 Polysaccharides as Polyelectrolytes
Polysaccharides can be divided into mammalian and non-mammalian types 9. CS is one of the few
available positively-charged PEs 58. Therefore, the majority of PECs investigated are complexes
between CS and other anionic PEs 59. Table 2.1 below shows a non-exhaustive list of the various types
of polysaccharides and their associated charged side groups.
Table 2.1 – This table presents different types of existing PEs (mammalian and non-mammalian). The PEs available are mainly negatively-charged with the carboxylic side groups dominating the charges. The positively-charged CS may be used to complex with oppositely-charged polyanions.
Polysaccharides Charged Side group
Non-mammalian
Acacia (Aca) COO-
Alginate (Alg) COO-
Carboxymethyl cellulose (CMC) COO-
Gellan gum (GG) COO-
Gum kondagogu (GK) COO-
Pectin (Pec) COO-
Xanthan gum (XG) COO-
Xylan (Xyl) COO-
Carrageenan (CRG) OSO3-
Fucoidan (FD) OSO3-
Porphyran (Por) OSO3-
Chitosan (CS) NH3+
Mammalian
Dextran sulfate (DexS) OSO3-
Heparan sulfate (HS) OSO3-
Keratan sulfate (KS) OSO3-,
Chondroitin sulfate (ChS) OSO3-, COO-
Heparin (Hep) OSO3-, COO-
Dermatan sulfate (DS) OSO3-, COO-
Hyaluronic acid (HyA) COO-

Chapter 2 – Literature Review
5
Despite their disparate origins, non-mammalian and mammalian polysaccharides possess similar
structures with recognised side groups (Fig. 2.1). Hence, non-mammalian polysaccharides have been
used before as an alternative substitute to glycosaminoglycans (GAGs) for drug delivery and tissue
engineering applications 28. It has been reported that non-mammalian polysaccharides like chitosan
(CS) and κ-carrageenan (κ-CRG) have a lower immunogenic response and pathogen transmission risk
than the bioactive GAGs 9,60. The next two sections will describe the production, structure and
properties of CS and CRG in greater detail.
Figure 2.1 - Widely used polysaccharides as biomaterials. Note the similarity in backbone structure, bonding and functional groups
present between non-mammalian (top row) and mammalian (bottom row) polysaccharides 9.
2.1.3 Chitin/Chitosan
Chitin is found in the shells of crustaceans (shrimp shell, crab shell), the exoskeleton of insects and cell
walls of fungi 59,61. Every year 6-8 million tonnes of crustacean waste is produced which makes chitin
highly abundant as well as economically and environmentally sustainable 10,62. Since chitin does not
dissolve in acids or alkalis, it is usually deacetylated with strong alkalis such as NaOH (replacing the
acetyl groups with amine groups) to form chitosan 63. The extraction of chitosan from raw crustacean
shells can be described in four main stages: 1) cleaning and grinding of shells, 2) deproteination of the
shell to chitin/calcium carbonate, 3) demineralisation of chitin/calcium carbonate to chitin, 4)
deacetylation of chitin to chitosan 64. A more detailed description of the production process of CS is
described below:

Chapter 2 – Literature Review
6
1) Shrimp shells are used because the walls are thin and therefore the isolation of chitin becomes
easier. The selected shells are then cleaned, dried, and ground into small shell pieces.
2) The chemical bonds between the chitin and the proteins are disrupted when using NaOH at a
concentration ranging from 0.125 to 0.5 M, at varying temperatures (up to 160 °C) and
treatment duration (from few minutes up to few days). Invariably, the chemical NaOH used
can also result in partial deacetylation or hydrolysis of CS. The protein is removed since this is
the primary cause for an allergic reaction in humans.
3) Dilute HCl (up to 10 % w/v) at room temperature, and reaction time ranging from 15 min to
48 h, are used for the decomposition of calcium carbonate present in the chitin matrix. Longer
demineralisation time results in lower ash (salt) contents but also causes polymer
degradation.
4) Alkali deacetylation is used more frequently than acid deacetylation because the glycosidic
bonds are more susceptible to acid than to alkali which results in lower MW. The
N-deacetylation of chitin is carried out by a hot concentrated solution of NaOH for a few hours
to obtain a degree of deacetylation (DDA) of 85-99 %. Alternatively, chitin is placed in
concentrated NaOH (30 g NaOH/45 g H2O/3 g of chitin) at 25 °C for 3 hours or more, followed
by dissolution in crushed ice around 0 °C. This method produced a soluble CS with a DDA of
48-55 %.
As a linear polysaccharide, CS is composed of β-1,4-linked glucosamine (deacetylated) and N-acetyl-
D- glucosamine (acetylated units) (Fig. 2.2) 14. Commercially, the polymer can be obtained with a
deacetylation between 50 to 95 % with a molecular weight between 10 to 1000 kDa 59,65,66. The
polymer can be classified as low molecular weight (< 150 kDa) and high molecular weight (> 700 kDa)
59. When the MW reaches < 10 kDa, the material is known as an oligochitosan 14.

Chapter 2 – Literature Review
7
Figure 2.2 - Molecular structures of chitin, chitosan, and protonated chitosan polymer 67.
CS has been widely used in biomedical applications and is considered safe for human use in topical,
subcutaneous and ocular applications 68,69. The glycosidic bonds present in CS can be broken by
enzymes (i.e. lysozyme) present in the body into oligosaccharides such as glucosamine (present in the
body as a constituent for joint lubrication) 70. This allows films or scaffolds to be broken down in the
long-term into biocompatible components and could ultimately reduce the chronic inflammatory
response and potentially help to reduce fibrotic encapsulation 71,72. CS has also found applications in
weight loss treatments, although the outcomes have not been very effective 73,74. The positive charges
present in CS molecules make it potentially bactericidal 75,76. The antibacterial effect is thought to be
due to the interaction between the positively-charged groups in CS and the negatively-charged anions
located in bacterial cell walls 77. This interaction disrupts the cell walls and releases their inner
contents 78. CS has been found to have mucoadhesive properties which increases retention at the site
of implantation 18. The effect of pH on the solubility of CS in water and the low viscosity at high
concentration makes CS suitable as a cell penetration enhancer for genes or as a drug delivery
system 59,79. CS is also a highly effective haemostatic agent and can aggregate platelets which result in
rapid blood clotting in major liver injuries 80. For this reason, CS is widely used as a form of coating or
replacement of cellulose fibre as a form of haemostatic gauzes to stop critical bleeding injuries
encountered in the battlefield. Other researchers have also reported that CS is non-adhesive to cells
or proteins 81. Therefore, CS has found uses in both medical implants for tissue engineering or anti-
fouling applications. Finally, CS can be complexed with negatively-charged molecules including growth
factors, nucleic acids, cytokines, anionic glycosaminoglycans (GAGs) and proteoglycans, which are
essential components of the extracellular matrix (ECM) found throughout the body 82.

Chapter 2 – Literature Review
8
2.1.4 Carrageenan
CRG is a natural linear sulfated polysaccharide and is obtained from edible red algae (Rhodophyceae)
83. It is also known as Irish moss because it historically originates from the county of Carraghen situated
on the south coast of Ireland where it has reportedly been used for the past 600 years 83. Essentially,
dried red algae are washed and soaked in water for 24 h 84. The pulp (cut and pressed algae) is then
mixed with water at a concentration of 1:80 (v/v). The mixture is adjusted to pH 9 with Ca(OH)2
solution followed by warming at 90 °C for 2 h by stirring. The extracted viscous filtrate is separated
from the cellulose (solid material) of the algae. The filtrate is neutralised to pH 7 with 1 % HCl solution
and reheated to 60 °C for 30 min. The filtrate is then coagulated using KCl solution at a concentration
range of 1.5-3.5 % for 15 min, and the CRG gel is subsequently filtered to remove the water. Finally,
the CRG gel is soaked in 96 % ethanol, dried at 70 °C in air for 24 h and milled.
CRG consists of a linear backbone built up by β-D-galactose and 3,6-anhydro-α-D-galactose linked with
α-1,3 and β-1,4-glycosidic bonds 85. When the polymer is dissolved in water, the sulfate groups ionise
to give a negatively-charged molecule. There are three main commercial types of CRGs: kappa (κ) -
(one sulfate group per disaccharide), iota (ι) - (two sulfate groups per disaccharide) and lambda (λ) -
(three sulfate groups per disaccharide) CRG (Fig. 2.3) 86. κ-, ι-CRG can change from a random coil into
a double helix conformation and could, therefore, gel when the critical concentration is achieved at a
critical temperature 87. On the other hand, λ-CRG does not form a gel but only increases in viscosity
with an increase in concentration. The US Food and Drug Administration (FDA) has considered CRG
“generally recognised as safe” (GRAS) for consumption and topical applications 83. CRG is widely used
as a thickener in ice creams, stabiliser in toothpaste and dispersant for barium sulfate suspension used
in medical imaging 83. It has also been proposed for tissue engineering and drug delivery systems, due
to its biocompatibility 24,88 and its ability to enhance cell viability 23,25. On the other hand, CRG has also
been shown to reduce cell adhesion of which some of the factors were thought to be due to the highly
hydrophilic nature and highly repulsive sulfate groups preventing negatively-charged cells to adhere
29,89.
Figure 2.3 – The molecular structures of commercially available CRG types: κ-CRG, ι-CRG and λ-CRG with one, two and three sulfate groups per monomer unit, respectively 83.

Chapter 2 – Literature Review
9
2.2 Polyelectrolyte Complexes
2.2.1 Introduction to Polyelectrolyte Complexes
Polyelectrolyte complexing is similar to ionic crosslinking (complexing). The difference is that in ionic
complexing, a small and well-defined MW is used compared to the polyelectrolytes containing a broad
MW distribution with charged side groups 69.
The formation of PECs can be an attractive alternative to covalent crosslinking since PECs have a
dynamic structure due to their reversible bonds 5. These reversible bonds are more sensitive to any
external factors such as ionic strength and pH compared to covalent bonds. As a consequence, the
swelling characteristics can be changed with the change in charge density. Unlike covalently
crosslinked macromolecules, dissolution can occur at certain pH ranges in PECs 6. Hence, smart
polymeric systems may be created that can deliver drug controllably at changes in physiological
conditions. In addition, since no covalent crosslinkers are required for stability, these PEC materials
may be combined with biologically stimulating ingredients such as growth factors, drugs, antibiotics,
bioactive materials, cells, cytokines, proteins, enzymes and nucleic acids for specific medical
applications 34,90,91.
The advantage of PECs is that no significant purification methods are required after preparation since
no crosslinkers are needed to be removed. Also, the strengths and stiffness of PEC gels are usually
lower than those in covalently crosslinked macromolecules which may be used for softer tissues 92.
The interactions between PEs can be strong and long-term under physiological conditions which make
PEC materials well tolerated and potentially stable as implants 69. These PECs are relatively versatile
as they can be shaped into many different assemblies (e.g. coatings, films, gels, nanoparticles, colloids,
fibres, and scaffolds) 93.
However, the main drawback of the PEC system is that preparation can be quite laborious and the
production yield in large scale may be difficult 94. The final properties of the PECs can also change
significantly depending on pH, ionic strength, temperature, time of mixing, the degree of ionisation of
each of the oppositely-charged PEs, the density of the charges on the PEs, charge distribution over the
polymeric chains, concentrations of the PEs and polymer chain flexibility 95. Reproducibility can be
difficult since small changes in many parameters can affect the physicochemical properties of PECs
during preparation.

Chapter 2 – Literature Review
10
2.2.2 General Concept of Polyelectrolyte Complex Formation
The theory of formation and organisation of PECs was pioneered in the early 1980s by Japanese
scientists E. Tsuchida, Y. Osada and H. Ohno 96 and Russian scientists V. A. Kabanov and A. B. Zezin 97.
The equation below signifies a polyelectrolyte complexation reaction:
(A-c+)n + (C+a-)m ⇌ (A-C+)x + (A-c+)n-x + (C+a-)m-x + xc+ + xa- (2.1)
where A- and C+ are PEs, a- and c+ are the corresponding counterions, n and m are the numbers of ionic
groups, and x is the molar mixing ratio i.e. n/m = x or m/n = x 59. Complex formation is entropically
driven since the counterions are released when the macromolecules are reacted 43,54. The entropic
increase of the liberation of counterions is higher than the entropic decrease caused by the
condensation of the two PEs 98. For complexing to occur, the oppositely-charged PEs need to be in an
aqueous environment at a pH interval between the pKa values of the two polymers, CS (pKa = 6.5) 99
and CRG (pKa = 2) 100 e.g. pH 4.25.
Secondary interactions such as hydrogen bonding, ion-dipole and dipole-dipole attractions may also
take place, but the primary form of binding is due to the electrostatic attraction (ionic bonds) 101. The
ionic bonds are associated with high water content and electrical charge density 5. New ionic bonds
formed between oppositely-charged PEs may be indicated using FTIR spectroscopy where a new
and/or shifted wavenumber is detected 102–104. The polyelectrolyte complexation process can also be
followed with microscopy 105, viscosity of supernatant 48,106, conductometric and potentiometric
titration of mixture 34,107,108 and turbidity of mixture or supernatant solutions 34,106,109–111.
Many of the above-mentioned factors are mainly determined by the charge density of the polyions
which is influenced by the pH used 112. When the pH is adjusted to reduce the charge density of a
single PE, the PEC becomes softened and turns into a complex coacervate like structure, whereas at
optimal interaction pH, the charge density for both PEs is high and therefore a precipitate is likely to
occur due to stronger interaction 43. Complex coacervation is also used as a term for polyelectrolyte
complexing where oppositely-charged colloids complex together. Bungenberg de Jong and Kruyt 113
coined the term complex coacervation to distinguish it from the mere coacervation of a single polymer
as cited by Kizilay et al. (2011) 114. However, the term complex coacervate is also widely used for
weakly bound oppositely-charged PEs exhibiting a gel-like or fluid-like consistency distinguished from
the solid consistency found in complex precipitates 43. Precipitation can be avoided when the charge
interaction is weakened by adding adequate amounts of NaCl or adjusting the pH close to the pKa of
the weak PE 7,115. However, at high ionic strength, the PEC can be suppressed, and therefore no phase
separation such as complex coacervation is likely to occur. Depending on the strength of interaction

Chapter 2 – Literature Review
11
between PEs the time-scale of diffusion measured with a stopped-flow instrument can range from
milliseconds to days and even longer in precipitates since it is harder to rearrange strongly attracted
PEs 116. The structure is, therefore, dynamic and reversible and can vary with the strength of
interaction which ultimately depends on the PEs and the conditions of the solvents used 43.
To improve the stability of PECs, further ionic crosslinking can be induced by the addition of ions such
as Ca2+ in alginate and K+ in CRG 117,118. Ionic crosslinking is governed by the strength of electrostatic
interaction between the polymers, and this depends on the global charge densities which control the
relative amount of individual PE in a PEC 48. The PE with a lower charge density is usually present in
higher amounts within the PEC as more polymer is required to cancel out the opposite charge of the
other PE. The stability of PEC solids can also be enhanced by annealing the complex at high
temperatures which may result in covalent bond formation under dry conditions 119.
PECs can exist in various forms, and their structures can generally be divided into two types i.e. the
ladder-like and the scrambled egg-like model (Fig. 2.4) 59. The ladder-like model was one of the earliest
models used to depict PEC structures, where the PEs were proposed to be only extended and zipped
together. The scrambled egg model represents more flexible PEs ionically linked into a random coil-
like conformation. PECs represent a combination of both models, however the latter being more
representative of most PEC structures 120. The irregular scrambled egg structure makes some of the
free ionic charges not always accessible due to steric effects 121. The structures of PECs have been
determined by using a combination of characterisation techniques including x-ray analysis, polarised
light and electron microscopy, potentiometric titration, dynamic light scattering, viscosity, turbidity,
circular dichroism and calorimetry 96,121–123.
Figure 2.4 – Schematic depiction of two possible PEC structures (ladder-like and scrambled egg-like model) 59.

Chapter 2 – Literature Review
12
In order to understand the structure of PECs and its influence on the stability and mechanical
properties PEC gels and solids, it is important to recognise how PECs are formed. E. Tsuchida 122 was
the first to present the structures of PECs as it is known today. PECs are generally formed in the
following three processes described below and shown schematically in Figure 2.5 122,124:
1. Primary complex formation (Coulomb forces): mainly a rapid electrostatic attraction between the
charged molecules results in the formation of an amorphous aggregate which is also known as the
random primary complex. The structure formed is referred to as the scrambled egg-like structure due
to the random arrangement of the macromolecules.
2. Ordered secondary complex: formation of new bonds and/or the correction of distorted bonds of
PE chains within intracomplexes, mainly through rearrangement and hydrogen bonding between the
macromolecules. The structure formed is known as the ladder-like structure due to the ordered
rearrangement of the macromolecules.
3. Intercomplex aggregation processes: complex aggregates are mainly formed through hydrophobic
interactions and subsequent entanglements to form intercomplexed fibrils that can further develop
into networks 122. Note, that the random primary complex can also turn into a stable intercomplex
aggregate through entanglements without the need to reform into an intracomplex first.
Figure 2.5 – Schematic representation of PEC formation 122.
PEC formation is mainly driven by the ion-exchange reaction that occurs at a high rate even when
dilute solutions are used 125. When weak PEs are utilised then the effect of pH can dramatically
influence their charge density (supported by zeta potential measurements) 112, and therefore the
extent of reaction can be varied.

Chapter 2 – Literature Review
13
2.2.3 Effect of Experimental Conditions on Polyelectrolyte Complex
Formation
PEC preparation is a versatile process, and the final properties are highly dependent on the
physicochemical properties of the polymers and the reaction conditions used 126,127. Understanding
the effect of reaction conditions could potentially control the strength of electrostatic interaction and
ultimately the mechanics and stability of films and scaffolds in the search for self-crosslinked
biomaterials.
The strength of electrostatic interaction between oppositely-charged PEs can be altered depending
on several factors such as the degree of ionisation of each PE, degree of deacetylation of CS, the charge
distribution over the polymeric chains (charges can be evenly distributed or concentrated in one end
of chain), the nature of the ionic groups on the polymeric chains (carboxylic groups, sulfate groups
and amine groups), the molecular weight of the PEs (i.e. higher molecular weight may result in greater
entanglement) and the polymer chain flexibility 95,128. Other parameters can be altered externally such
as the concentration of the PEs, their mixing molar ratio, the mixing order of PEs, speed of mixing
(dropwise addition or one-shot addition), the duration of mixing, as well as the temperature (some
polymers need heat to dissolve), ionic strength, and pH used to fully dissolve the material (the right
pH needs to be used in the medium to ionise the PE fully) 58. PEC formation can be either stoichiometric
or non-stoichiometric depending on the molar mixing ratio, acidity/basicity, chain length and chain
flexibility of PEs in PECs 129. In theory, when equal amounts of oppositely-charged groups are combined
in a stoichiometric manner, the overall net charge becomes zero, and therefore the complex formed
is an insoluble precipitate 130.
Other indirect factors that affect the stability and formation of PECs are the diffusion coefficient, chain
conformation (straight chains, helical chains or random folded chains), viscosity (viscous solutions
reduce complex formation), miscibility (the more miscible the more reactive) between PE solutions,
centrifugation step, stirring rate, acid type and washing steps 131. In the next few paragraphs, the most
important parameters on PEC formation are discussed in more detail.
The pH has been found to be an important parameter affecting PEC formation due to its influence on
the degree of ionisation on polyions 38,44. When both polyions are weak PEs, their ionisation degree is
highly dependent on the pH. It was found that the strength of electrostatic interaction as measured
with zeta potential was highest, and drug release was lowest when the PEs have complexed at an
optimal pH range i.e. pH in the range between the pKa of both PEs 33,132. For the case of CS complexed
with a strong PE, a decrease in pH results in higher ionisation degree of CS and the polyanion which
results in strong interaction 38. However, at extreme acidic and alkaline conditions in the presence of

Chapter 2 – Literature Review
14
weak PEs, one of the reacting PEs would either be fully ionised or non-ionised and therefore
electrostatic interaction would not likely occur 37. In a different study, large insoluble complexes were
formed when β-lactoglobulin was complexed with alginate at pH 3 and 4 due to the strong
electrostatic interactions 133. At pH 5, soluble complexes were formed whereas, at pH 6 and 7, no
complexes were formed due to the charge reversal of the polyampholyte β-lactoglobulin which
resulted in electrostatic repulsion with negatively-charged alginate. The pH was also found to strongly
affect the zeta potential of the individual chitosan and gum arabic PEs, with the highest PEC yield 134
and viscoelastic properties 102 at pH 4.5. Similarly, the interaction between whey protein isolate and
κ-carrageenan displayed higher viscosity at pH 4.5 that could be associated with a more compact
microstructure and robust PECs prepared at pH 4 109. These results show that only a small change in
pH can largely influence the electrostatic interaction and ultimately the physical properties of PECs.
The ionic strength is another parameter that can significantly affect the complex formation 44. The
addition of large amounts of inorganic salts results in the screening of the charged groups present in
the PEs and can, therefore, reduce the overall charge density 135 136. This leads to the weakening of the
electrostatic interaction of polyions 128. Thus, complex coacervation of PECs may occur. Coacervates
can break when excess salt is added but may not break complex precipitates since these structures
are usually irreversible in optimal pH conditions 137.
The initial concentration of the PEs is of great importance for polyelectrolyte complexation. Work
carried out by Chieng and Chen have shown that at low concentrations of
poly(diallyldimethylammonium chloride) (PDADMAC) result in vesicle complex formation between
PDADMAC and phospholipids 138. At very high concentration and chain length of PDADMAC, the
vesicles become interconnected, forming a supramolecular network. This factor influences the
composition, size, surface charge, and stability of PECs. Ultimately, it is of great interests to control
the self-crosslinking of PECs by varying the production conditions to control film and scaffold
mechanics and stability for specific applications.
The degree of deacetylation (DDA) of CS is directly related to the number of amino groups present per
disaccharide (monomer unit), and therefore the interaction with other polyanions is strongly
dependent on this parameter 38. It was confirmed by Gåserød et al. (1998) 139 that an increased
number of acetyl groups resulted in weaker interaction between CS and alginate due to the decrease
in overall charge density (charges per unit length) of CS as supported by zeta potential.
Molecular weight is an important parameter since it directly relates to the chain length of the PE and
can be a limiting factor to the binding to other polyanions. It was previously found by others that a
higher MW resulted in less intensive and surface limited binding than with low MW CS as measured

Chapter 2 – Literature Review
15
using a fluorescent microscope to observe the fluorescently stained CS 139. This was due to the ability
of small chain CS molecules to diffuse and penetrate more easily into the core of the PEC. On the other
hand, the drug release was shown to be prolonged with higher MW CS compared with low MW CS.
This could be ascribed to the thicker, more viscous and less permeable outer wall produced on the
PEC when using higher MW CS 140. Higher MW can also lead to a higher drug encapsulation efficiency.
However, the high viscosity can hinder diffusion and binding of CS molecules to other polyanions 141.
Therefore, complexation between CS and polyanions may be completely or partially halted 142.
Several facts can be drawn from the complexation studies presented in the literature. It seems that
when:
- One of the polyions is a strong PE then a precipitate is more likely to occur rather than a
complex coacervate gel. Precipitates are more likely to happen in polysaccharides with
strongly charged side groups containing sulfates or phosphates than they are in
polysaccharides with weakly charged side groups containing carboxyls 43.
- The mixing ratio is equal, the resultant complex is neutral 143.
- An excess PE is present, the overall complex is only to some extent charged with the
charge of the PE in excess 110
- The pH of the solution is adjusted close to the pKa of the PEs, the complexation may be
suppressed 144.
- Salt is added, complexation may be suppressed 7,145.
Additional information on complexation can be found in the extensive review on PECs written by
Thünemann et al. (2004) 123.
2.2.4 Chitosan-Carrageenan Polyelectrolyte Complexes
This section of the review spans work carried out on PECs based on CS-CRG from two decades i.e. from
the years 1997 to 2017. The review includes information on hydrogels, films and scaffolds and their
associated properties obtained such as stability, mechanics and degradability. Table 2.2, summarises
the parameters controlled, methods and results of the typical PECs produced based on CS and CRG.
With respect to the CS-CRG PEC gels, the main parameters studied previously include the effects of
CRG concentration 7, ionic strength (NaCl concentration) 11, CRG type (κ-, ι-, λ-) 21, different CS and
CRG concentration 146, and varying degree of deacetylation of CS with various CRG types (κ-, ι-, λ-) 143.
Homogeneous complex coacervate gels have been produced when reacting CS and CRG with 5.7 %
NaCl and extended mixing times (5-7 days) 21.

Chapter 2 – Literature Review
16
There have been several studies reported in the literature on the production and characterisation of
CS-CRG films. Carneiro et al. (2013) 147 have solvent cast CS-CRG PEC gels into films to produce non-
thrombogenic materials for blood contacting applications. These were prepared by using four
different volumetric proportions of CS and CRG. The swelling of the PECs was found to decrease when
the amount of CS was increased. The PECs were found to be non-toxic to fibroblasts making them
suitable for cell therapies. In another study, CS-CRG PEC films were also made by solvent casting the
mixtures using different acids (acetic, ascorbic, lactic, malic and citric acid) for potential wound healing
applications 148. Further information about the results can be found in the summary written in Table
2.2.
Three-dimensional structures made from CS-CRG PECs have only been reported by
Araujo et al. (2014) 6. Araujo and co-workers have shown that stable PEC scaffolds can be produced at
pH 7.4 and below at different CS-CRG molar ratios (1:1, 2:1 and 3:1). However, they did not investigate
the effect of varying pH on the PEC scaffold formation. Instead, they investigated the stability of the
PECs under different pH conditions (4.5, 7.4, 9 and 11). They found that the PECs at very high pH (9
and 11) can induce solubilisation of the PEC whereas, at pH 7.4, the complexes were stable.
To the best of the author's knowledge, there appear to be no previous studies looking at the effect of
pH on the preparation of CS-CRG PEC gels. In addition, the PEC gels in the literature have not been
characterised systematically or in great detail. Some characterisation techniques for CS-CRG PEC gels
such as ζ-potential and microscopy remain unexplored. In addition, the effects of the strength of
electrostatic interaction and the type of crosslinking (electrostatic vs. secondary interactions) on the
mechanical performance in terms of gels, films and scaffolds are limited. Finally, a systematic study of
the biological response using a variety of cells and proteins to PECs with controlled composition is still
missing in the literature.

Chapter 2 – Literature Review
17
Table 2.2 – A table summarising the parameters controlled during CS-CRG PEC gels, films and scaffold preparation.
PEC Type
&
Reference
Parameters Controlled
During PEC Preparation
Summary of PEC Preparation
Method
Summary of Results
Gel 7
• Ionic Strength
• Molar Ratio of CS
and NaCMC
• Sodium
Carboxymethyl
Cellulose (NaCMC)
Concentration
CS was dissolved in dilute acetic acid
at 80 °C. CRG and NaCMC were mixed
with NaCl. The solutions were then
mixed and kept at 5 °C for two days.
Aggregates were formed due to the strong
electrostatic interaction between CS and highly
charged CRG. As NaCMC content was increased,
more homogeneous PECs were formed, but at very
high NaCMC, no PEC was formed due to the weaker
(–ve) carboxylic groups. The addition of salts
suppressed the high charge density and reduced the
swelling.
Gel 21 • CRG Type (κ, ι, λ)
• CS Concentration
• CRG Concentration
CS was dissolved in dilute sodium
acetate buffer (0.02 M). CRG was
dissolved in water at 50 °C. The PEs
were mixed for 5-7 days.
At low concentrations of CS and λ-CRG, insoluble
precipitates were formed. At higher concentrations,
complex coacervate gels were formed.
Concentrations higher than 1 % (w/v) of either PE
becomes too viscous, and no complexation would
occur. The mechanical strength was highest at κ-CRG
and lowest at λ-CRG. This effect was explained by the
formation of additional crosslinks by double helixes
in κ-CRG.
Gel 145 • Ionic Strength CS and κ-CRG were dissolved in 1 %
acetic acid and in water at 70–80 °C,
respectively. The PEs were mixed at
varying NaCl content. The suspension
was then centrifuged and washed.
Considerable amounts of NaCl (4 % or 6 % w/w)
inhibits PEC formation due to the screening the PE
charges. Swelling of PEC gel at pH 10-12 was 10.2 x
higher than the rest of the pHs. The maximum
swelling occurred at pH 10.5. At pH < 9 and pH > 13,
no swelling was observed.
Gel 146 • CS MW
• CS Concentration
• Molar Ratio of CS
and CRG
CRG and CS solutions were mixed in
PBS. CS and CRG were determined
spectrophotometrically using
oppositely-charged dyes.
At high CRG concentration, soluble complexes were
formed. Low MW CS bonds more efficiently to CRG
than high MW CS due to the lower steric hindrance
in the shorter chain length. High MW CS is in a
random coil conformation and can, therefore,
screen some of the binding sites.
Gel 143 • CRG Type (κ-, ι-, λ-)
• Ionic Strength
• CS Concentration
• CRG Concentration
• Temperature
CRG was dissolved in water at 50 °C
for 30 min. PECs were formed by
adding CS and CRG at different
concentrations. The PECs were
centrifuged and the amount of non-
reacted PEs was detected
At increased ionic strength, the coil-helix transition
is inhibited and therefore complexes with charge
ratios slightly less than unity was formed.
Hydrophobic forces were thought to dominate at
high salt concentrations.

Chapter 2 – Literature Review
18
spectrophotometrically from the
supernatants.
Film 147 • Molar Ratio of CS
and CRG
CS was dissolved in acetic acid
solution and cast into films followed
by neutralisation in 1 M NaOH
solution for 24 h. κ-CRG was
dissolved in water under stirring at 80
°C for 1 h and cast and immersed in 2
M KCl solution for 24 h and washed
with water and dried for 2 days. CS
dissolved in acetic acid was mixed
with CRG dissolved in water at
different proportions. The films were
neutralised in NaOH for 24 h and
dried.
The swelling of PECs decreased when the amount of
CS increased. Bovine serum albumin (BSA)
adsorption was decreased on PECs but fibrinogen
adsorption increased when compared to the
individual CS and CRG films. Although all films
showed similar cell expansion and viability, the PEC
50:50 vol. % CS/κ-CRG has been proposed as an
acceptable scaffold material for new cell therapies,
due to their positive effect on cell survival.
Film 148 • Acid Type
• Molar Ratio of CS
and CRG
Either acetic acid, ascorbic acid, lactic
acid, malic acid or citric acid were
used with ascorbic acid to dissolve
CS. The PECs were prepared by
mixing κ-CRG and CS with glycerine
and PEG as plasticisers. The films
were dried in an oven at 70 °C for 12
hours.
Malic acid exhibited overall highest tensile strength
(TS), elongation (EB) and low water vapour
permeability (WVP). Citric acid exhibited the lowest
TS, Young’s modulus (E) and WVP properties. Acetic
acid showed a relatively high TS but a low EB and
WVP. Lactic acid showed average TS and E but with
highest WVP of all acid types used.
Scaffold 6 • Molar Ratio of CS
and CRG
CS solution was dissolved in dilute
HCl. CRG was dissolved in water at
60 °C. The CS solution was added to
the CRG solution and mixed
vigorously. The PEC was centrifuged
and the amount of CRG in the
supernatant was detected
spectrophotometrically. The PEC was
washed and freeze-dried to obtain a
scaffold.
The PECs were stable at pH < 7.4 but dissolved as the
pH increased to non-physiological values of 9 and 11.
The PECs precipitated at pH 4.5 with some
hysteresis. This showed that the PEC formation was
reversible during preparation at different
conditions. The use of higher CRG concentration
resulted in an increase in hydrophilicity and water
absorption in scaffolds. An increase in CS content
resulted in an increase in mechanical properties.
Overall, it was shown that the PEC scaffolds were
very stable under physiological conditions.

Chapter 2 – Literature Review
19
2.3 Conclusions and Unanswered Questions
Previous studies have shown that pH is highly influential on the PEC formation in different PEC
systems. However, very little work has been conducted on the effect of pH on the physicochemical
properties of CS-CRG PECs. This thesis considers the effect of pH on the PEC interaction between weak
CS and strong CRG. The resulting properties of PEC gels, films and scaffolds are then characterised and
discussed.
2.4 Project Aims
The ability of self-crosslinking materials without having to use toxic chemicals is highly desirable for
both tissue engineering or anti-fouling applications. This work aims to provide a comprehensive
analysis of the effect of a change in pH on the production and characterisation of PECs, as gels, films
and scaffolds. This study will aid the understanding of the binding between PEs under wet and dry
conditions. The use of films offers the potential to understand the properties of a surrogate for a
scaffold strut. Once there is sufficient understanding of the key parameters and their effects on the
physicochemical properties of PECs, then the biological response to the films can be measured. The
effects observed in scaffolds may be both chemistry-related, and due to the physical effects of the
scaffold architecture.
This thesis will explore the production, and physicochemical characterisation of PECs and
compositions optimised for stability will subsequently be evaluated using biological testing. The aims
of this thesis are as follows:
• Establish a suitable methodology to quantitatively measure the concentration of PEs
present in the PEC mixture.
• Production and characterisation of CS-CRG PEC gels, films and scaffolds.
• Establish and understand the effect of pH on the interaction and composition of prepared
PECs using physicochemical analytical techniques.
• Establish the biological properties of the PECs using three different general cell lines and a
protein adhesion study to find out whether the materials are cell adhesive or anti-cell
adhesive in nature.

Chapter 2 – Literature Review
20
2.5 Thesis Structure
The structure of this thesis is as follows:
• Chapter 3 explores the potential of a developmental study of a spectrophotometric method
to potentially determine the level unreacted PEs during PEC formation and ascertain the
composition of the PECs.
• Chapter 4 describes the preparation of self-crosslinked CS-CRG PEC gels. These PEC gels were
characterised in their native state to understand the interaction between CS and CRG
macromolecules. The strength of electrostatic interaction and composition of PEC gels were
controlled by preparing the PECs at various pH.
• Chapter 5 describes the preparation of self-crosslinked CS-CRG PEC films. These films were
developed as free-standing materials through solvent casting the PEC gel suspensions to test
the effect of self-crosslinking on mechanical properties.
• Chapter 6 concerns the development of self-crosslinked CS-CRG PEC scaffolds. These scaffolds
were formed by freeze-drying the PEC suspension to form a porous three-dimensional
structure. The effect of self-crosslinking was tested on the mechanical properties of scaffolds.
• Chapter 7 considers the biological properties of the self-crosslinked CS-CRG films. Three
different cell lines and a protein were used to determine the applicability of CS-CRG PEC
materials for tissue engineering or non-biofouling applications.
• Chapter 8 reports the overall conclusions and outlines suggestions for future work.

Chapter 3 – Spectrophotometric Study
21
Chapter 3 – Spectrophotometric Study
3.1 General Introduction
In this thesis, a method is required to quantitatively measure polyelectrolyte (PE) concentrations in
dilute mixed polyelectrolyte systems. The dilute mixed PE systems studied consisted of two
oppositely-charged PEs namely, chitosan (CS) and carrageenan (CRG).
Methods previously employed in the literature to confirm PEC formation have included visual
observation, fourier transform infrared spectroscopy (FTIR) 34,46,149–155, thermogravimetric analysis
(TGA) 149,150,155, differential scanning calorimetry (DSC) 151,34, X-ray diffraction spectroscopy (XRD) 151,153–
155, the viscosity of supernatant 156, the viscosity of PEC 34, potentiometric titration 149, conductometric
titration 149, turbidimetric titration 149,157, and pH 34. However, most of these techniques can only
provide a global evaluation of complex reaction and do not explicitly provide quantitative information
on complex interaction and composition 46. Quantitative methods that were previously used to
determine the composition of the complex include elemental analysis techniques 46 such as energy-
dispersive X-ray spectroscopy (EDX) 158, X-ray photoelectron spectroscopy (XPS) 46,147, nitrogen, carbon
and sulfur (NCS) elemental analysis 112,137,159,160, solid-state nuclear magnetic resonance spectroscopy
(NMR) 159 or high-performance liquid chromatography (HPLC) 161.
In this chapter, the potential of a spectrophotometric method to measure the concentration of CS and
CRG in dilute mixed PE solutions will be investigated. The spectrophotometric method measures the
change in dye absorbance with the change in polyelectrolyte (PE) concentration. It has been previously
shown that small quantities between 0 to 80 µg/ml 162,163 of chitosan could be measured in this way.
However, it is yet unknown whether the CS or CRG molecules can be accurately determined in the
presence of the other interfering PE within the same solution. CS and CRG concentration will be
measured using oppositely-charged dyes such as cibacron brilliant red 3B-A (CBR) and methylene blue
(MB), respectively. The use of dyes is necessary since the individual PEs are not detectable under UV
or visible light. This change in colour then will be detected using sensitive colorimetric instruments
such as a UV-Vis spectrometer or a general visible light spectrum plate reader. The accuracy and
reliability of both techniques are compared and outlined in this chapter.
The primary objective of this study was to identify whether the spectrophotometric method can be
accurately and reliably used to determine the concentration of unreacted CS and CRG that remained
in the supernatants after the PEC reaction 46,6. By knowing the amounts of PEs present in the
supernatant, the composition of the remaining non-dilute PEC system can then be derived.

Chapter 3 – Spectrophotometric Study
22
Previously, Araujo et al. (2014) investigated the composition of CS-CRG PECs using the MB dye only 6.
The composition was found by adding the dye to the supernatants to observe the presence of any
remaining unreacted CRG. However, it was assumed that no chitosan remained in the supernatant
and any effect from interference between PEs was not considered. In the present study, the effect of
interference between the competing PE was investigated by using two dyes as mentioned above.
The objectives of this chapter were to investigate:
1. The quantification of chitosan and carrageenan separately using oppositely-charged dyes.
2. The difference between UV-Vis spectrophotometer and plate reader to measure the
absorbance values. The speed, accuracy and reliability were compared.
3. The stability of the prepared dye solutions.
4. The optimised experiment presented in the literature.
5. The polyelectrolyte-dye interactions and the quantification of PEs in mixed PE systems.
3.2 Quantification of Chitosan and Carrageenan
3.2.1 Introduction
Solubilised CS has been quantitatively determined using Orange II 46, Alizarin S, Alizarin GG, Congo
Red, Reactive Red 123, Reactive Yellow 145 and Bromocresol purple dyes 164,165. Some of these listed
dyes posed several disadvantages. For example, Orange II dye required long mixing times with CS and
the CS-dye complex needed to be centrifuged for extended periods before the measurements could
take place 46. The use of picric acid and ninhydrin dyes required pre-hydrolysis of the CS, and the
preparation was therefore too lengthy 166–168. Also, ninhydrin is known to be a harmful and irritant
material 167. More sensitive methods have been developed to detect CS in solution. These methods
include fluorescent biomarkers such as o-phthalaldehyde that can be conjugated to primary amino
groups present on the CS molecules 169. This method gives the advantage of detecting CS in the
presence of other primary amino groups, i.e. in the presence of proteins and other polyelectrolytes
169. However, the method requires extra preparation steps. Other fluorescent methods employed
involve hydrolysis of CS with sodium nitrite, and the amine group is replaced with thiobarbituric acid
dye 165, fluorescein isothiocyanate (FITC) conjugated 170 and ortho-phthalaldehyde (OPA) conjugated
CS nanoparticles 171. In this study, CBR was chosen because the dye dissolves readily in water, and the
sodium ions dissociate to form four negatively-charged sulfate groups per molecule (Fig. 3.1) 172. The
sulfate groups are situated on opposite sides and therefore promote the interaction with polycations.
CBR is a red anionic dye that turns magenta when the sulfonic acid groups in the dye bind to the
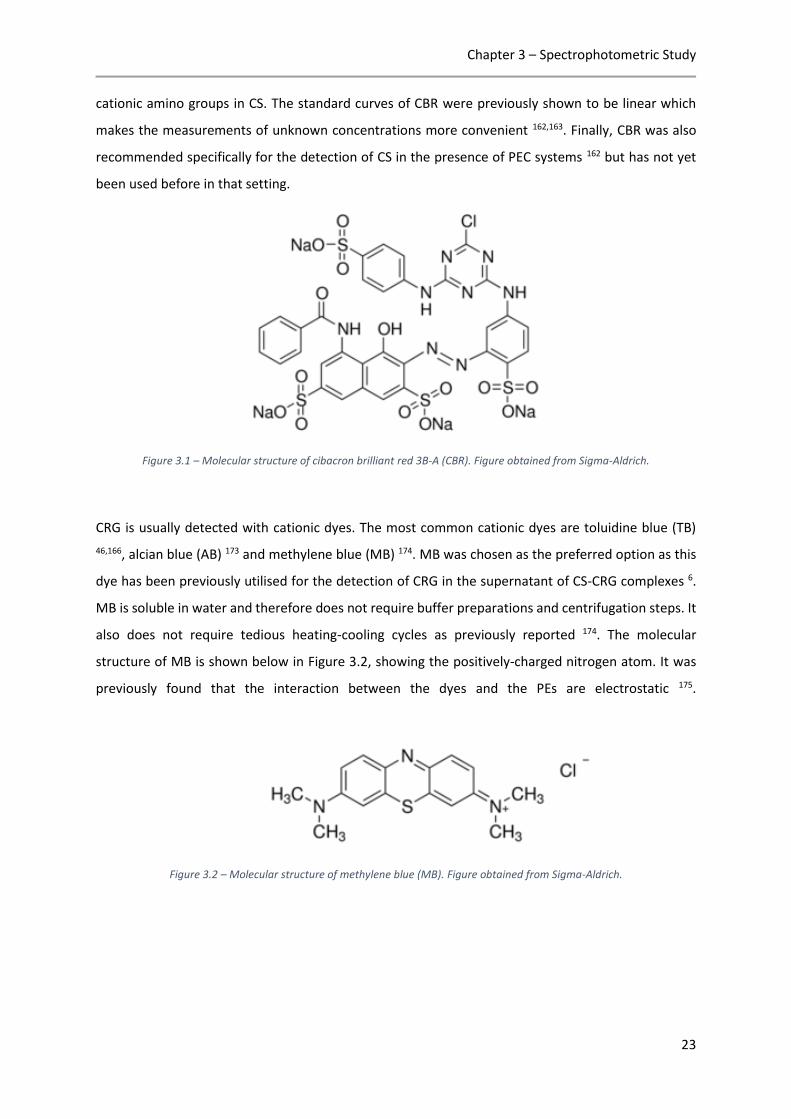
Chapter 3 – Spectrophotometric Study
23
cationic amino groups in CS. The standard curves of CBR were previously shown to be linear which
makes the measurements of unknown concentrations more convenient 162,163. Finally, CBR was also
recommended specifically for the detection of CS in the presence of PEC systems 162 but has not yet
been used before in that setting.
Figure 3.1 – Molecular structure of cibacron brilliant red 3B-A (CBR). Figure obtained from Sigma-Aldrich.
CRG is usually detected with cationic dyes. The most common cationic dyes are toluidine blue (TB)
46,166, alcian blue (AB) 173 and methylene blue (MB) 174. MB was chosen as the preferred option as this
dye has been previously utilised for the detection of CRG in the supernatant of CS-CRG complexes 6.
MB is soluble in water and therefore does not require buffer preparations and centrifugation steps. It
also does not require tedious heating-cooling cycles as previously reported 174. The molecular
structure of MB is shown below in Figure 3.2, showing the positively-charged nitrogen atom. It was
previously found that the interaction between the dyes and the PEs are electrostatic 175.
Figure 3.2 – Molecular structure of methylene blue (MB). Figure obtained from Sigma-Aldrich.

Chapter 3 – Spectrophotometric Study
24
3.2.2 Materials and Methods
3.2.2.1 Quantification of CS
An original method for CS quantitation using CBR published by Muzzarelli 162 was slightly modified to
suit the CS-CRG PEC system. HCl was used instead of lactic acid because the HCl was utilised in the
formation of PECs as later shown (Chapter 4). Furthermore, the use of salt in the buffer was eliminated
to avoid electrostatic interactions and charge screening of charged groups 176. In summary, 1 litre of
the glycine-HCl buffer at 0.1 M (pH 1.5) and 100 ml of CBR (0.15 % w/v) dye solutions were prepared.
Then 50 ml of CBR (0.15 % w/v) was added to 950 ml glycine-HCl buffer (0.1 M) to obtain a
concentration of 0.0075 % w/v of CBR in glycine-HCl buffer solution (CBR dye buffer). CS solution of
0.05 % w/v was made using 0.05 g of CS in 99.5 ml ultrapure type 1 water with 0.5 ml of 12.2 M HCl.
The standards were prepared by pipetting 0, 15, 30, 45, 60, 80, 100, 150, 200, and 250 µl of CS solution
into 7 ml-bijou bottles and made up to 300 µl with the glycine-HCl buffer (0.1 M). Then, 3 ml of the
dye-buffer solution was added to each concentration standard. The standards were mixed in a vortex
mixer (SCILOGEX MX-S Vortex Mixer, Germany) at medium speed (approximately 1300 rpm) for 3 s at
RT. A summary of the samples used for the CS standard calibration is shown in Table 3.1. The
absorbances were measured at a wavelength of 570 nm with a UV-Vis spectrometer (Lambda 25;
Perkin Elmer Inc., USA) set at a resolution of 1 nm and speed of 960 nm/min. All measurements were
carried out in triplicate.
Table 3.1 – Production method of calibration standard solution at different CS concentrations using CBR dye. The solutions are added in sequential order.
Sample No.: 1 2 3 4 5 6 7 8 9 10
1st Add CS 0.05 % w/v, µl 0 15 30 45 60 80 100 150 200 250
2nd Add HCl-Glycine buffer, µl 300 285 270 255 240 220 200 150 100 50
3rd Add CBR dye buffer, ml 3 3 3 3 3 3 3 3 3 3
Final CS concn., µg/ml 0 2.3 4.5 6.8 9.1 12.1 15.2 22.7 30.3 37.9
3.2.2.2 Quantification of CRG
The method utilised in this study is based on a technique first reported by Michon 174. In summary, 1 l
of 0.0015 % w/v MB solution was diluted from 0.05 % w/v MB stock solution. A concentration of 0.1
% w/v CRG in 100 ml water was prepared as the stock solution. Then 50 ml of 0.1 % w/v CRG stock
solution was added to 50 ml deionised water to produce 0.05 % w/v CRG solution (adjusted to pH 7).
The sample was then diluted further, by using 50 ml of 0.05 % w/v CRG solution to 50 ml water to
produce a CRG concentration of 0.025 % w/v. The solution was then diluted six more times (Table 3.2).
Then 1 ml of each CRG concentration solution was added to 9 ml of MB in a 30-ml beaker. The

Chapter 3 – Spectrophotometric Study
25
standards were mixed in a vortex mixer (SCILOGEX MX-S Vortex Mixer, Germany) at medium speed
for 3 s at 25 °C. Subsequently, the optical densities of the standards were measured at 554 nm, 615
nm, and 663 nm using a UV-Vis spectrometer (Lambda 25; Perkin Elmer Inc., USA) set at a resolution
of 1 nm and speed of 960 nm/min. All measurements were carried out in triplicate.
Table 3.2 – Production method of calibration standard solution at different CRG concentrations using MB dye. The solutions are added in sequential order.
Sample
No.:
1 2 3 4 5 6 7 8 9 10 11
1st
Add
MB
solution,
ml
9 9 9 9 9 9 9 9 9 9 9
2nd
Add
1 ml of
CRG, (X)
% w/v
0 7.81 x 10⁻⁵ 1.56 x 10⁻⁴ 3.13 x 10⁻⁴ 6.25 x 10⁻⁴ 1.25 x 10⁻³ 18.75 x 10⁻³ 2.5 x 10⁻³ 3.75 x 10⁻³ 5 x 10⁻³ 1 x 10⁻²
Final CRG
concn.
µg/ml
0 0.78 1.56 3.13 6.25 12.5 18.75 25 37.5 50 100
3.2.3 Results
3.2.3.1 Quantification of CS
Figure 3.3 shows the full visible light spectrum (400-700 nm) of CS at different concentrations. A
standard curve was obtained from the absorbance values recorded at 515 nm and 570 nm (Fig. 3.4).
The absorbance values of the main peak at 570 nm and shoulder peak at 515 nm were shown to
increase and decrease respectively in a linear fashion with CS concentration. CBR changed colour from
red to magenta during the interaction between the dye and the polycation.
Figure 3.3 – Full visible-light spectrum of different CS concentration obtained by UV-Vis spectroscopy over a wavelength range of 400-700 nm. The legend on the right shows the concentration of CS (µg/ml) in ascending order.

Chapter 3 – Spectrophotometric Study
26
Figure 3.4 (a) – CS concentration standard curve at A515. Mean ± SD, n = 3.
Figure 3.4 (b) – CS concentration standard curve at A570. Mean ± SD, n = 3.
0.8
0.85
0.9
0.95
1
1.05
1.1
0 5 10 15 20 25 30 35 40
Ab
sorb
ance
[5
15
nm
], A
U
CS concentration, μg/ml
0
0.2
0.4
0.6
0.8
1
1.2
1.4
0 5 10 15 20 25 30 35 40
Ab
sorb
ance
[5
70
nm
], A
U
CS concentration, μg/ml

Chapter 3 – Spectrophotometric Study
27
3.2.3.2 Quantification of CRG
Figure 3.5 shows the spectrum obtained from 400-700 nm at different concentrations of CRG. A high
absorbance value at the wavelength of 663 nm corresponds to a low concentration of CRG in solution.
In Figure 3.6, three CRG standard curves are presented based on three different wavelengths. All
wavelengths can be used for the detection of CRG concentration. The MB changed colour from blue
to purple immediately after the addition of CRG. The CRG concentration could only be measured until
60 µg/ml before the absorbance values plateaued.
Figure 3.5 – Full visible-light spectrum of different CRG concentration obtained by UV-Vis spectroscopy over a wavelength range of 400-700 nm. The legend on the right shows the concentration of CRG (µg/ml) at descending order.

Chapter 3 – Spectrophotometric Study
28
0 20 40 60 80 100
0.4
0.6
0.8
1.0
1.2
1.4
1.6
1.8
2.0
2.2
2.4
2.6
Ab
sorb
ance
[6
63
nm
], A
U
CRG concentration, µg/ ml (a)
0 20 40 60 80 100
0.4
0.6
0.8
1.0
1.2
1.4
1.6
1.8
2.0
2.2
2.4
2.6
Ab
sorb
ance
[6
15
nm
], A
U
CRG concentration, µg/ ml(b)
0 20 40 60 80 100
0.4
0.6
0.8
1.0
1.2
1.4
1.6
1.8
2.0
2.2
2.4
2.6
Ab
sorb
ance
[5
54
nm
], A
U
CRG concentration, µg/ ml (c)
Figure 3.6 – CRG concentration standard curves at wavelengths of (a) 663 nm (b) 615 nm and (c) 554 nm. Mean ± SD, n = 3. It is assumed that the best fit is an exponential curve as previously denoted by Michon et al. (2002) 174 and Araujo (2013) 28.

Chapter 3 – Spectrophotometric Study
29
3.2.4 Discussion
3.2.4.1 Quantification of CS
The formation of CS-CBR complexes resulted in an increase in A570 and a decrease in A515, known as a
bathochromic shift or red shift 163. The bathochromic shift is the change in colour from a short
wavelength to a longer wavelength. After complex formation between CBR and polycation, the A570
increased and the A515 decreased obeying the Lambert-Beer law (Fig. 3.4) 162. The Lambert-Beer law is
the linear relationship between the absorbance and concentration of the absorbing species. The
standard curves in this study are comparable to the ones previously reported by Muzzarelli (1998) 22
and Wischke & Borchert (2006) 23.
3.2.4.2 Quantification of CRG
For CRG, a decrease in A663 & A615 and an increase in A554 relates to the formation of new CRG-MB
complexes (metachromatic complexes) 174. As the concentration of CRG increases, the absorbance
reaches a plateau due to the depletion of the dye 175. Once the concentration limit was reached for
CRG at 100 μg/ml, it can be assumed that all MB molecules were saturated by sulfate groups present
in CRG. In the case of CRG-MB complexes, metachromatic complexes between MB molecules
stabilised by water through long-range forces result in the absorbance at 554 nm 177. However, the
absorbance at 663 nm (α-band) is more widely used because of its greater separation points in
absorbance values at different CRG concentrations 174. Free MB molecules result in the absorbance at
663 nm. The long-range forces can only occur when the MB molecules were close enough to each
other i.e. between 0.35 and 0.7 nm 177. The spectrophotometric method has also been previously used
to characterise the coil to helix transition by measuring the absorbance of the metachromatic complex
at different temperatures 174. At 60 °C, the CRG chains are in a coil conformation which results in a
greater separation distance (1 nm) between the sulfate groups of ι-CRG molecules, and in theory, no
long-range forces can form to have an absorbance at 554 nm. However, at a lower temperature
(between 50 and 30 °C), the CRG molecules turn into a helix and become stiffer. This helical
conformation results in the shortening of the distance between the sulfate groups in CRG (0.66 nm)
and hence the formation of metachromatic complexes.

Chapter 3 – Spectrophotometric Study
30
3.2.5 Conclusion
A quantitative colorimetric method for both CS and CRG were presented. The CS-CBR showed two
peaks at 515 and 570 nm, whereas the peaks for CRG-MB were at 554, 615 and 663 nm. The calibration
curves obtained for CS were linear, while those for CRG plateaued at high CRG content. The
wavelengths of 554 nm and 663 nm were chosen for the measurement of CS and CRG, respectively.
These wavelengths were selected because the absorbances were found to be very sensitive to changes
in PE concentrations. The CS standard curves were linear over the concentration range (0-37 µg/ml)
tested, whereas CRG could be measured from 0-60 µg/ml before absorbance value plateaued.
3.3 Comparative Study of UV-Vis Spectrometer and Plate Reader
3.3.1 Introduction
A UV-Vis spectrometer is more widely used than a plate reader for the detection of polyelectrolyte
concentrations. In this study, the accuracy and reliability of the plate reader were evaluated because
of its advantages over UV-Vis such as rapid analysis and small volume requirements. The aim of this
sub-study was to assess the speed and accuracy of both instruments and to identify the best apparatus
for spectrophotometric studies in this thesis.
3.3.2 Method
The standard curves for CS and CRG were compared using a UV-Vis spectrometer (Lambda 25, USA)
and a plate reader (Spectro Star Nano, Germany). The absorbance peaks for CS and CRG were
measured at 570 nm and 663 nm, respectively.
3.3.3 Results
The plate reader was a faster method than the UV-Vis spectrometer. However, the absorbance values
obtained from the UV-Vis spectrometer were more than double the absorbance values obtained with
the plate reader (Fig. 3.7 and 3.8). The UV-Vis spectrometer also produced more reproducible results
when the measurements were taken on different days. In other words, the UV-Vis spectrometer was
more reliable than the plate reader. Therefore there is a trade-off between speed and accuracy when
comparing the two instruments.

Chapter 3 – Spectrophotometric Study
31
Figure 3.7 – CS standard curves produced using UV-Vis spectrometer and plate reader.
Figure 3.8 – CRG standard curves produced using UV-Vis spectrometer and plate reader.
y = 0.02x + 0.55R² = 0.98
y = 0.01x + 0.22R² = 0.95
0
0.2
0.4
0.6
0.8
1
1.2
1.4
0.00 5.00 10.00 15.00 20.00 25.00 30.00 35.00 40.00
Ab
sorb
ance
[5
70
nm
], A
U
CS concentration, µg/ml
UV-Vis Spectrometer
Plate Reader

Chapter 3 – Spectrophotometric Study
32
3.3.4 Discussion
The UV-Vis spectrometer was more sensitive to measurements than the plate reader. This can be
observed by the greater absorbance range found in the UV-Vis spectrometer. The higher absorbance
values obtained in UV-Vis spectrometer may be due to the longer path length of the cuvette sample
found in UV-Vis spectrometer. It is known from the Lambert-Beer Law that an increased light path
through the cuvette increases the absorbance values 178. The standard curves produced seem to be
relatively reproducible with small error bars. This signifies that the colorimetric assay is a reliable and
sensitive technique.
3.3.5 Conclusion
Since the concentrations of PEs were minuscule, the method with the highest sensitivity and accuracy
was required. Therefore, it is concluded that the UV-Vis spectrometer is the preferred choice for the
detection of polyelectrolytes in this thesis. Where specified, the plate reader will be used for its
rapidness and where the measurement of PEs is not precisely required such as in time measurement
studies presented in the next sub-study presented in Section 3.4.
3.4 Time Measurements to Study Dye Decay
3.4.1 Introduction
This study was conducted to measure the decay of dyes with time. The aim of this study was to find
out whether the dye solutions needed to be prepared freshly every single time or whether the same
batch of solution can be used over some days without the need to create a new standard curve.
3.4.2 Method
The absorbance of dye-polyelectrolyte complexes was measured on three different days using the
same dye stock solution produced from the same batch. The time points used for CS were 1, 5 and 15
days and for CRG were 1, 7 and 17 days. Between measurements, the dye solutions were kept at 4 °C
and covered with aluminium foil to prevent decay. Absorbance values were determined using a plate
reader.
3.4.3 Results
The absorbance values are shown for CS (Fig. 3.9) and CRG (Fig. 3.10) as a function of PE concentration
value. Both dyes decayed with time, illustrated by the shift of the standard curves to lower absorbance
values with time. However, the gradients of each graph were unchanged with time.

Chapter 3 – Spectrophotometric Study
33
Figure 3.9 – Original standard calibration curves at different time points to observe decay of CBR 3B-A dye.
0 10 20 30 40 50 60 70 80 90 1000.0
0.1
0.2
0.3
0.4
0.5
0.6
0.7
0.8
0.9
1.0 Day 1
Day 7
Day 17
Ab
sorb
ance
[6
63
nm
], A
U
CRG concentration, µg/ml
Figure 3.10 – Original standard calibration curves at different time points to observe decay of MB dye.

Chapter 3 – Spectrophotometric Study
34
3.4.4 Discussion
Figures 3.9 and 3.10 indicate that a new standard calibration curve is required for every single time
point which supports the data reported by Soedjak (1994) 175. Therefore, the best option is to obtain
the supernatant samples and conduct the measurements together using the plate reader to avoid
time-colour change discrepancy. It was previously reported that MB decomposes very slowly in the
aqueous solution 179. The decay of the dye with time may be due to the conversion of MB to methylene
violet by hydrolysis of dimethylamino groups 179,180. Although the dye solutions were covered with
aluminium foil, some illumination may have resulted in photo-reduction of MB dye 179. Photo-
reduction may occur by receiving one or more electrons by the photo-excited species 181. It may be
that a similar photo-reduction mechanism was occurring for CBR. Overall, both dyes showed only little
decay with time, which may be due to the low temperature and light conditions used during storage.
3.4.5 Conclusion
The data showed that the calibration curves changed with time due to the ageing of the dye solutions,
even under appropriate storage conditions. Therefore, new standard curves should always be
produced when measuring absorbance values at different time points.
3.5 Confirmation of Wischke and Borchert’s Study
3.5.1 Introduction
It was previously claimed by Wischke and Borchert (2006) that the sensitivity and the detection limit
of the technique carried out with CBR to detect CS can be increased by reducing the volume of CBR-
buffer solution used 163. The aim of this sub-study was to confirm this claim and whether the result
could be reproduced.
3.5.2 Method
Various volumes of 0.05 % w/v CS solutions were made up to 300 µl using the buffer solution as
outlined before in Section 3.2.2.1. This mixture was then mixed with CBR-buffer solutions as used in
the earlier section or reduced level of 1 ml and 2 ml. The absorbance was measured using a plate
reader.
3.5.3 Results
Figure 3.11 shows the effect of CBR volume on the formation of standard curves. The sensitivity

Chapter 3 – Spectrophotometric Study
35
increases with decreasing CBR-buffer volumes used. However, the reduction in dye volume also
resulted in a lower detection limit of the CS concentration due to the loss of linearity in absorbance
measurements beyond 12 µg/ml.
Figure 3.11 – Effect of CBR volume on standard curves produced. Using different dye volumes of CBR-buffer at 0.075 % w/v.
3.5.4 Discussion
Figure 3.11 shows that the 3 ml CBR-buffer solution used by Muzzarelli (1998) 162 provided a linear
gradient across the wider concentration range. This result is contrary to that reported by Wischke and
Borchert (2006) 163 where the data indicated that the concentration limit could be increased to
100 µg/ml by using lower dye volumes. While slightly more sensitive at lower dye volumes, in these
results the signal plateaued at a lower CS concentration range. Unfortunately, the method reported
by Wischke and Borchert (2006) could not be reproduced in this study.
A possible explanation for the plateau at low dye volumes is that the number of dye molecules present
was not sufficient to interact with a large number of CS molecules, and therefore, the dye molecules
of CBR were saturated early with CS. In other words, smaller dye volumes increased the sensitivity,
but the concentration detection limit was reduced.
3.5.5 Conclusion
In conclusion, the method proposed by Wischke and Borchert (2006) 163 to increase the sensitivity and
CS detection range could not be reproduced. At higher CBR dye volumes, the sensitivity reduces and
the concentration detection range increases. For this thesis, 3 ml dye volume was chosen as the best
method for a relatively sensitive measurement combined with a high concentration detection range.
0
0.1
0.2
0.3
0.4
0.5
0.6
0.7
0.8
0 5 10 15 20 25 30 35 40
Ab
sorb
ance
[5
70
nm
], A
U
Chitosan concentration, µg/ml
1 ml
2 ml
3 ml

Chapter 3 – Spectrophotometric Study
36
3.6 Polyelectrolyte-Dye Interaction
3.6.1 Introduction
In earlier reports, it was found that the addition of interfering compounds such as acids, sugars, salts,
milk, proteins, dyes, emulsifiers and neutral hydrocolloids may be diluted out to prevent the
interference with the absorbance measurements of CRG-MB complexes 175. This suggests that the MB
dye can be used in mixed PE systems and may therefore be used to measure the concentrations of
PEs in supernatants in the presence of oppositely-charged PEs. This study aims to test the claim above
and to deduce the competitive interactions between CS and CRG with either CBR or MB dyes. The
competitive binding of MB with other cationic PEs towards CRG has been studied before using MB
reacted with ιota-CRG/poly-L-lysine 182, ιota-CRG/gelatin 176 or pectate/poly-L-lysine 183. In all the
studies, it was shown that the addition of the opposing PE+ to the MB+-PE- complex increases the
absorbance at 665 nm and decreases the absorbance at 570 nm. On the other hand, the use of CBR
with other PEs is relatively new in PECs and therefore no competitive binding assays have been carried
out before. Nevertheless, the interaction between CS and CRG have never been tested before by
either MB or CBR. Therefore, the objective of this study was to observe whether concentration
measurements were affected by interference from complex formation between the dyes (CBR and
MB) and the oppositely-charged PEs (CS and CRG). Ultimately, this study may provide information as
to whether the use of a particular dye can determine the concentration of a specific PE in the presence
of an oppositely-charged PE in the supernatant.
3.6.2 Addition of CRG to CS-CBR
3.6.2.1 Method
Competitively charged dyes were used to examine the interaction between CS and CRG at different
PE concentrations. PE interactions were carried out at two different concentrations. The method is
described briefly below. All measurements were performed in triplicate.
The samples were prepared as described in Section 3.2.2, with the exception that 50 µl of 0.05 % w/v
or 0.5 % w/v CRG were added to have a CRG concentration of 7.58 µg/ml or 75.76 µg/ml, respectively.
The method was carried out in the following order: different volumes of CS 0.05 % w/v were pipetted
and made up to 250 µl with HCl-glycine buffer (CBR-dye buffer). Next, 3 ml CBR dye-buffer solution
was added to each sample, and finally, 50 µl of either 0.05 % w/v or 0.5 % w/v of CRG were added to
the mixture. Thus, a chance was given for competitive interaction to occur between CRG and CBR with
CS. In other words, the dye and the oppositely-charged PE were added together first. Then the

Chapter 3 – Spectrophotometric Study
37
competitive PE was added. In practice, the situation will be the other way in that the two PEs will be
present before the dye is added (Fig. 3.12). Therefore, the competitive binding may be even greater
in the supernatant system. If in the first experiment, the CRG displaces the CBR dye, then it is very
likely that the CBR will not displace the CRG molecules found in the supernatant. Table 3.3 shows a
detailed outline of the amounts and addition order used for each standard solution produced.
Figure 3.12 – The methods above are showing the steps involved in adding the reagents followed by absorbance measurements using the UV-Vis spectrometer. In the competitive binding experiment as presented in this section (shown left), CS is added to CBR first before adding the CRG molecule as the competing PE. In the PEC manufacture experiment (shown right), CBR is added to the CS-CRG found in the supernatant.
Table 3.3 - The content used to produce the standard solutions CS-CBR with CRG as a competing PE at different concentrations. For 7.58 or 75.76 µg/ml CRG (competition method). The solutions are added in sequential order.
1st Add CS 0.05 % w/v, µl 0 15 30 45 60 80 100 150 200 250
2nd Add HCl-Glycine buffer, µl 250 235 220 205 190 170 150 100 50 0
3rd Add CBR dye buffer, ml 3 3 3 3 3 3 3 3 3 3
4th Add CRG 0.05 % w/v or
0.5 % w/v, µl
50 50 50 50 50 50 50 50 50 50
Final CS concn.,
µg/ml
0 2.3 4.5 6.8 9.1 12.1 15.2 22.7 30.3 37.9
3.6.2.2 Results
Figure 3.13 shows the standard curves of the interaction between CS-CBR-CRG at two different CRG
concentrations. As can be observed from A570 (Fig. 3.14), the addition of 7.58 µg/ml of CRG to the CS
standard curve did not have a significant effect on the interaction between CS and CBR. However, the
addition of 75.76 µg/ml lowered the absorbance after reaching a CS concentration of 12 µg/ml. As the
amounts of CS and CRG increase, the interference between CRG and CS-CBR complex becomes
greater.

Chapter 3 – Spectrophotometric Study
38
Figure 3.13 (a) - Full visible-light spectrum of CS-CBR absorbance with 0 % w/v CRG. The legend on the right shows the concentration of CS (µg/ml).
Figure 3.13 (b) - Full visible-light spectrum of CS-CBR absorbance with 0.05 % w/v CRG. The legend on the right shows the concentration of CS (µg/ml).
Figure 3.13 (c) - Full visible-light spectrum of CS-CBR absorbance with 0.5 % w/v CRG. The legend on the right shows the concentration of CS (µg/ml).
0
0.2
0.4
0.6
0.8
1
1.2
1.4
400 450 500 550 600 650 700
Ab
sorb
ance
, AU
Wavelength, nm
With 0 % w/v CRG37.9
30.3
22.7
15.2
12.1
9.1
6.8
4.5
2.3
0
0
0.2
0.4
0.6
0.8
1
1.2
1.4
400 450 500 550 600 650 700
Ab
sorb
ance
, AU
Wavelength, nm
With 0.05 % w/v CRG 37.9
30.3
22.7
15.2
12.1
9.1
6.8
4.5
2.3
0
0
0.2
0.4
0.6
0.8
1
1.2
400 450 500 550 600 650 700
Ab
sorb
ance
, AU
Wavelength, nm
With 0.5 % w/v CRG37.9
30.3
22.7
15.2
12.1
9.1
6.8
4.5
2.3
0

Chapter 3 – Spectrophotometric Study
39
Figure 3.14 – Effect of CRG concentration on CS calibration standards at 570 nm.
3.6.2.3 Discussion
The change in absorbance during the addition of the CRG to the CS-CBR complex may have been due
to the dissociation of the CS-CBR (bathochromic complexes) and the formation of CS-CRG complexes.
The dissociation results in the release of free CBR dyes into the medium. Therefore the affinity of CS-
CRG binding is stronger than that found in CS-CBR complexes (Fig. 3.15).
On the other hand, the results showed that the addition of small concentrations of CRG to the CS-CBR
complex did not change the absorption values significantly. Therefore, it is likely that concentrations
of CS in the supernatant can be adequately quantified when a small concentration of interfering CRG
is present. When necessary, the supernatant may be diluted to a low concentration range to access
the non-interfering linear region.
Figure 3.15 - A representation of the competition between negatively-charged carrageenan (CRG) and negatively-charged cibacron brilliant red (CBR-) for the positively-charged chitosan (CS). At very high CRG concentration, a small number of dye molecules are displaced, producing a shift in absorbance.
0
0.2
0.4
0.6
0.8
1
1.2
1.4
0 10 20 30 40
Ab
sorb
ance
[5
70
nm
], A
U
CS concentration, µg/ ml
0 µg/ml CRG 7.58 µg/ml CRG 75.76 µg/ml CRG

Chapter 3 – Spectrophotometric Study
40
3.6.3 Addition of CS to CRG-MB
3.6.3.1 Method
The samples were prepared as outlined in Section 3.2.2 with the difference that 0.1 ml of 0.05 % w/v
or 0.5 % w/v CS was added to 8.9 ml of MB solution. Then, 1 ml of CRG at different concentrations was
added to the previous mixture. Therefore, the amount of CS present in 10 ml CRG-MB solution was
either 5 µg/ml or 50 µg/ml. If in the first experiment, the CS displaces the MB dye, then it is very likely
that the MB will not displace the CRG molecules found in the supernatant (Fig. 3.16). Table 3.4 shows
a detailed outline of the amounts and addition order used for each standard solution produced.
Figure 3.16 – The methods above are showing the steps involved in adding the reagents followed by absorbance measurements using the UV-Vis spectrometer. In the competitive binding experiment here (shown left), CRG is added to MB first before adding the CS molecule as the competing PE. In the PEC manufacture experiment (shown right), CBR is added to the CS-CRG found in the supernatant. If the CS displaces the MB dye in the first experiment, then it is very likely that the MB will not displace the CS molecules found in the supernatant.
Table 3.4 – The content used to produce the standard solutions of CRG-MB with CS as a competing PE at different concentrations. For 5 or 50 µg/ml CS (competition method). The solutions are added in sequential order.
1st
Add
MB solution,
ml
8.9
8.9 8.9 8.9 8.9 8.9 8.9 8.9 8.9 8.9 8.9
2nd
Add
1 ml of CRG,
(X) % w/v
0 7.81 x 10⁻⁵ 1.56 x 10⁻⁴ 3.13 x 10⁻⁴ 6.25 x 10⁻⁴ 1.25 x 10⁻³ 18.75 x 10⁻³ 2.5 x 10⁻³ 3.75 x 10⁻³ 5 x 10⁻³ 1 x 10⁻²
3rd
Add
CS 0.05 %
w/v or 0.5 %
w/v, ml
0.1 0.1 0.1 0.1 0.1 0.1 0.1 0.1 0.1 0.1 0.1
Final CRG
concn.,
µg/ml
0 0.78 1.56 3.13 6.25 12.5 18.75 25 37.5 50 100
3.6.3.2 Results
The spectra of CRG standard curves with CS are shown below in Figure 3.17. The absorbance values of
all the conditions measured at 663 nm are presented in Figure 3.18. When a low concentration of CS
(5 µg/ml) was added to the CRG-MB complex, the absorbance at 663 nm remained at the same level

Chapter 3 – Spectrophotometric Study
41
of the MB-dye solution. When a higher concentration of CS (50 µg/ml) was added, the absorbance
was slightly changed due to the interference from the competing PE.
Figure 3.17 (a) - Full visible-light spectrum of CRG at a CS concentration of 0 % w/v. The absorbance of various concentrations of CRG was measured at 663 nm. The legend on the right shows the concentration of CRG in µg/ml.
Figure 3.17 (b) - Full visible-light spectrum of CRG at a CS concentration of 0.05 % w/v. The absorbance of various concentrations of CRG was measured at 663 nm. The legend on the right shows the concentration of CRG in µg/ml.
Figure 3.17 (c) - Full visible-light spectrum of CRG at a CS concentration of 0.5 % w/v. The absorbance of various concentrations of CRG was measured at 663 nm. The legend on the right shows the concentration of CRG in µg/ml.
0
0.5
1
1.5
2
2.5
3
400 450 500 550 600 650 700
Ab
sorb
ance
, AU
Wavelength, nm
With 0 % w/v CS0
0.78
1.56
3.13
6.25
12.5
25
50
100
0
0.5
1
1.5
2
2.5
3
400 450 500 550 600 650 700
Ab
sorb
ance
, AU
Wavelength, nm
With 0.05 % w/v CS0
0.78
1.56
3.13
6.25
12.5
25
50
100
0
0.5
1
1.5
2
2.5
3
400 450 500 550 600 650 700
Ab
sorb
ance
, AU
Wavelength, nm
With 0.5 % w/v CS0
0.78
1.56
3.13
6.25
12.5
25
50
100

Chapter 3 – Spectrophotometric Study
42
Figure 3.18 – Effect of CS concentration on CRG calibration standard curves.
3.6.3.3 Discussion
The addition of CS to CRG-MB complexes increased A554 and decreased A663 corresponding to a decline
in metachromatic complexes and release of free MB molecules in the medium (Fig. 3.17). The results
showed that the addition of small amounts of CS (5 µg/ml) reduced the interaction between CRG-MB.
This was despite the fact that the CRG and MB molecules were added together before the CS was
added. This showed that the interaction between CS-CRG was stronger and displaced the interaction
between CRG-MB (Fig. 3.19). A possible explanation for this may be due to the positioning of the
positively-charged groups present on CS and MB. The amino group in CS is positioned outwards and
therefore increasing the potential for interaction. The sulfur group in MB is slightly positive which
reduces the degree of interactions. Finally, the flexibility of the PE chains are higher than in the dye
molecules and therefore the interaction between the PE-PE molecules is higher than in the PE-dye
molecules.
0
0.2
0.4
0.6
0.8
1
1.2
1.4
1.6
1.8
2
2.2
2.4
2.6
0 10 20 30 40 50 60 70 80 90 100
Ab
sorb
ance
[6
63
nm
], A
U
CRG concentration, µg/ ml
0 µg/ ml CS 5 µg/ml CS 50 µg/ml CS

Chapter 3 – Spectrophotometric Study
43
Figure 3.19 – A representation of the competition between positively-charged chitosan and positively-charged methylene blue for the negatively-charged carrageenan. At higher CS concentration, the dye molecules are displaced, producing a shift in the absorbance.
3.6.4 Conclusions
As the amount of competing PE was increased, the interference resulted in the dissociation of the PE-
dye complex. The effect was greater in CRG-MB assays, where the addition of CS at 50 µg/ml
completely dissociated the interaction between CRG and MB. Similarly, but less affected, the CS-CBR
bond separated in favour of adding CRG at 75.76 µg/ml to form a CS-CRG bond. Therefore, the
interaction between PEs was significantly stronger than the interaction between the PE and the dye.
As a result, it can be predicted that the unknown CRG concentration may not be identified accurately
within the supernatant in the presence of a low concentration of oppositely-charged CS. It is projected
that the spectrophotometric method will underestimate the amount of PE present in the supernatant.
Hence, for this thesis, it is important to have another assay that can determine the concentration of
CRG.

Chapter 3 – Spectrophotometric Study
44
3.7 Overall Conclusions
It has been of interest to develop a protocol to measure the composition and interaction of PECs. The
spectrophotometric method was effective in detecting small concentrations of PEs. CS and CRG can
be measured separately with high sensitivity and accuracy. The UV-Vis spectrometer was more
reliable, sensitive and accurate than the plate reader. However, the plate reader can measure small
sample volumes and provide rapid measurements. The dye solutions were found to be affected by
some decay with time. Therefore, sample measurements need to be conducted together to provide a
more reliable assay. The reportedly improved method devised by Wischke and Borchert (2006) for the
detection of CS could not be reproduced, and a higher CS concentration detection limit was obtained
when greater volumes of CBR-dye buffers were used. Finally, it was found that the addition of
interfering PEs at high and in some cases at low concentrations resulted in the interference between
the PE-dye complex. It would be likely that the exact presence of PEs in the supernatant can be
underestimated. Therefore, other techniques used for the determination of PEC composition should
be considered.

Chapter 4 – Polyelectrolyte Complex Gels
45
Chapter 4 – Polyelectrolyte Complex Gels
4.1 Introduction
The definition of a gel is still a matter of debate, but according to Peppas, gels are defined as
macromolecular networks swollen in water or biological fluids 184. PECs can be categorised into two
types of gels; a complex coacervate gel (liquid with a dynamic structure like a particle dispersion) and
a fibrous precipitate gel (concentrated viscoelastic polymer solution with a pseudo-plastic behaviour)
43. When the interaction between PEs is weak or strong, homogeneous complex coacervate gels or
heterogeneous fibrous precipitate gels are formed, respectively 185.
This chapter concerns the preparation and characterisation of polyelectrolyte complexes between CS
and CRG by using different pH conditions. In previous studies, pH was found to be an important
parameter affecting the complex formation between polyelectrolytes, where at least one of the
macromolecules is a weak PE type (only stable in solution at narrow pH range) 38,44. The pH can
significantly influence the dissociation of the weak PE, and thereby modify the strength of electrostatic
interaction (SEI) between PEs. This phenomenon is attributed to the acid dissociation constant (pKa)
of the PEs. The pKa can be used to describe the strength of acids. The lower the pKa value, the stronger
the acid. The pKa of carrageenan is 2, and the sulfate groups dissociate to become negatively-charged
when the pH is higher than the pKa value 100. Hence, the pH range for CRG deprotonation is large and
therefore the material is considered to be a strong PE i.e. the polyanion attains its fully ionised form
in a wide pH-range. In contrast, the pKa of the glucosamine segments in chitosan is 6.5, and the
material becomes positively-charged when the pH of the solution is below the pKa value 99. Therefore,
the pH range for the protonation of CS is relatively narrow (< pH 6.5) and considered a weak PE.
The SEI of PEC gels can be assessed in various ways i.e. physically or chemically. Simple visual
assessment can provide a good estimate of the physical properties of the gels but is not adequate for
comparison. The potential difference (zeta potential) of PEs can also be measured quantitatively using
a zetasizer, and the product of the zeta potential (ζ-potential) values of both molecules at each pH can
be obtained 10 to predict the SEI. Rheology measurements on PEC gels can be used to provide a direct
quantitative comparison of the SEI 186. It is envisaged that the pH will significantly affect the SEI and
therefore the viscosity of PEC gels. These results will inform the choice of fabrication pH and will
provide a platform from which PEC-based films and scaffolds can be developed. The production and
characterisation of films and scaffolds will be discussed in Chapter 5 and Chapter 6, respectively.

Chapter 4 – Polyelectrolyte Complex Gels
46
The objectives of this chapter were to investigate:
1. The charge density of CS and CRG at different pHs using zeta potential measurements to
predict the strength of electrostatic interaction in PECs.
2. The preparation of CS-CRG PEC gels at different pHs.
3. The morphology of PEC gels using optical microscopy.
4. The yield and moisture content of CS-CRG PEC gels.
5. The effect of pH on PEC formation to control the degree of self-crosslinking and ultimately the
viscoelastic properties of the gels using rheology.
6. The effect of pH on the resulting composition of the PECs using nitrogen, carbon, and sulfur
(NCS) elemental analysis.
7. The confirmation of the electrostatic interaction between PEs using Fourier-transform
infrared spectroscopy (FTIR) and X-ray diffraction (XRD).
4.2 Materials and Methods
4.2.1 Materials
Low molecular mass chitosan (72 mPa.s, 1 % w/v in 1 % v/v acetic acid at 25 °C) with 93.1 % degree of
deacetylation (DDA) and κ-carrageenan (6.4 mPa.s, 0.3 % w/v in H2O at 25 °C) were purchased from
Sigma-Aldrich, UK. The chitosan was sourced from Pandalus borealis (cold water shrimp) shell in
Iceland. The carrageenan was sourced from Chondrus crispus (red seaweed) in the Philippines.
Hydrochloric acid (HCl) and sodium hydroxide (NaOH) were also purchased from Sigma-Aldrich, UK.
All other chemical reagents were of analytical grade unless stated otherwise.
4.2.2 Thermogravimetric Analysis
TGA measurements were carried out in a TA Instruments Q600 (TA Instruments, England). The
samples (2-4 mg) were placed in platinum pans and heated from 25 to 700 °C at a heating rate of
20 °C min-1 and an air flow of 60 ml min-1. This technique was used to analyse the humidity and
degradation temperature of the materials and the amount of impurities present in PEs and PECs. The
percentage impurities could then be accounted for during the preparation of the PECs. The weight
loss of the materials is typically associated with the release of adsorbed moisture content and the
actual degradation of the polymeric chains. The mass of the materials was considered 100 % at the
onset of degradation. In other words, the amount of impurities in the samples were normalised and
the average of three measurements was taken for each sample.
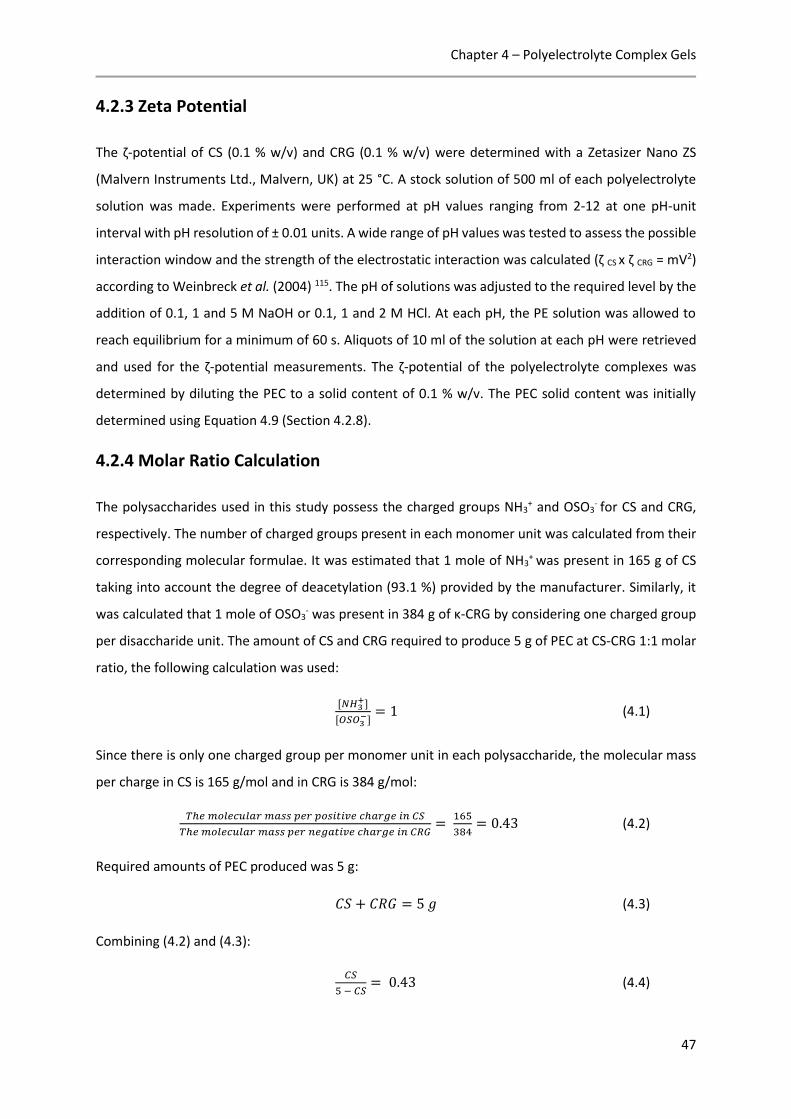
Chapter 4 – Polyelectrolyte Complex Gels
47
4.2.3 Ζeta Potential
The ζ-potential of CS (0.1 % w/v) and CRG (0.1 % w/v) were determined with a Zetasizer Nano ZS
(Malvern Instruments Ltd., Malvern, UK) at 25 °C. A stock solution of 500 ml of each polyelectrolyte
solution was made. Experiments were performed at pH values ranging from 2-12 at one pH-unit
interval with pH resolution of ± 0.01 units. A wide range of pH values was tested to assess the possible
interaction window and the strength of the electrostatic interaction was calculated (ζ CS x ζ CRG = mV2)
according to Weinbreck et al. (2004) 115. The pH of solutions was adjusted to the required level by the
addition of 0.1, 1 and 5 M NaOH or 0.1, 1 and 2 M HCl. At each pH, the PE solution was allowed to
reach equilibrium for a minimum of 60 s. Aliquots of 10 ml of the solution at each pH were retrieved
and used for the ζ-potential measurements. The ζ-potential of the polyelectrolyte complexes was
determined by diluting the PEC to a solid content of 0.1 % w/v. The PEC solid content was initially
determined using Equation 4.9 (Section 4.2.8).
4.2.4 Molar Ratio Calculation
The polysaccharides used in this study possess the charged groups NH3
+ and OSO3- for CS and CRG,
respectively. The number of charged groups present in each monomer unit was calculated from their
corresponding molecular formulae. It was estimated that 1 mole of NH3+ was present in 165 g of CS
taking into account the degree of deacetylation (93.1 %) provided by the manufacturer. Similarly, it
was calculated that 1 mole of OSO3- was present in 384 g of κ-CRG by considering one charged group
per disaccharide unit. The amount of CS and CRG required to produce 5 g of PEC at CS-CRG 1:1 molar
ratio, the following calculation was used:
[𝑁𝐻3+]
[𝑂𝑆𝑂3−]
= 1 (4.1)
Since there is only one charged group per monomer unit in each polysaccharide, the molecular mass
per charge in CS is 165 g/mol and in CRG is 384 g/mol:
𝑇ℎ𝑒 𝑚𝑜𝑙𝑒𝑐𝑢𝑙𝑎𝑟 𝑚𝑎𝑠𝑠 𝑝𝑒𝑟 𝑝𝑜𝑠𝑖𝑡𝑖𝑣𝑒 𝑐ℎ𝑎𝑟𝑔𝑒 𝑖𝑛 𝐶𝑆
𝑇ℎ𝑒 𝑚𝑜𝑙𝑒𝑐𝑢𝑙𝑎𝑟 𝑚𝑎𝑠𝑠 𝑝𝑒𝑟 𝑛𝑒𝑔𝑎𝑡𝑖𝑣𝑒 𝑐ℎ𝑎𝑟𝑔𝑒 𝑖𝑛 𝐶𝑅𝐺=
165
384= 0.43 (4.2)
Required amounts of PEC produced was 5 g:
𝐶𝑆 + 𝐶𝑅𝐺 = 5 𝑔 (4.3)
Combining (4.2) and (4.3):
𝐶𝑆
5 − 𝐶𝑆= 0.43 (4.4)

Chapter 4 – Polyelectrolyte Complex Gels
48
𝐶𝑆 = 1.5 𝑔
𝐶𝑅𝐺 = 3.5 𝑔
The impurities of CS and CRG was found with TGA analysis and the final amounts of CS and CRG
required to produce a 1:1 molar ratio was calculated as below:
1.5100 % − 𝐼𝑚𝑝𝑢𝑟𝑖𝑡𝑦 %
100⁄ => 𝐶𝑆 𝑔 𝑟𝑒𝑞𝑢𝑖𝑟𝑒𝑑 𝑡𝑜 𝑎𝑑𝑑 (4.5)
and
3.5100 % − 𝐼𝑚𝑝𝑢𝑟𝑖𝑡𝑦 %
100⁄=> 𝐶𝑅𝐺 𝑔 𝑟𝑒𝑞𝑢𝑖𝑟𝑒𝑑 𝑡𝑜 𝑎𝑑𝑑 (4.6)
4.2.5 Preparation of PEC Gels
CS and κ-CRG PEC gels were prepared based on the method first reported by Araujo et al. (2014) 6 and
a diagram of the experimental setup is shown below for visual representation (Fig. 4.1). For a unit
molar ratio (UMR) of 1:1 CS-CRG, approximately 1.53 g of CS (0.38 % w/v) and 4.40 g of κ-CRG (0.63 %
w/v) were dissolved in 400 ml of 0.16 M HCl and 700 ml of ultrapure type 1 water respectively for 24
hours under vigorous magnetic stirring. The pH of the CS solution was increased from 2 to 4 using
approximately 10 ml of 5 M NaOH. The κ-CRG solution was heated to 60 °C before the mixing reaction
using a water bath. The CS solution was kept at 20 °C and added to the CRG solution in a drop-wise
fashion at a rate of 14 ml/min. The polyelectrolyte reaction was carried out inside a 2 l Pyrex media
bottle (Fisher Scientific, UK) with vigorous stirring using both a magnetic flea and overhead stirrer at
5000 rpm. After complete addition of CS, the mixture was cooled using a water bath at RT for 15 min,
followed by pH measurements. The pH of the polymer solutions and the PEC mixtures were measured
with a pH-meter (Thermo Scientific Orion 3-star Benchtop, UK) at RT. This process was repeated to
obtain PEC mixtures prepared at pH 3-12 at 1-unit intervals. The polyelectrolyte mixture was then
poured into 50 ml centrifuge tubes and centrifuged (Hermle LaborTechnik Z300, Germany) at 4500
rpm (3222 x g) for 2 min and washed twice with ultrapure type 1 water to remove the dissociated
counterions and unreacted CS and CRG. This washing and centrifuging protocol were then repeated.
Subsequently, the supernatant was decanted, and the PEC gel was homogenised at 13.500 rpm for 1
min using a medium-sized homogenizer (VR, VDI 25, UK) while cooling using an ice box. The
homogenised PECs were then centrifuged again to remove the excess water. All homogenised PECs
were stored at 4 °C until further use. The PEC gels were photographed for visual assessment using a
Canon EOS 5D Camera, Japan.

Chapter 4 – Polyelectrolyte Complex Gels
49
Figure 4.1 – A schematic diagram showing the preparation of PEC gels and final medical materials.

Chapter 4 – Polyelectrolyte Complex Gels
50
4.2.6 Optical Microscopy
Optical micrographs were taken using bright field illumination with an optical microscope equipped
with dry lenses (GX Microscopes, L2000B HTG, UK) and a digital camera (Moticam, 3.0 MP, China). The
PEC gels were gently mixed before analysis to ensure that they were homogeneous. A drop of PEC gel
suspension (non-homogenised) was placed on a microscope glass slide and covered with a glass
coverslip (22 mm diameter x 0.17 mm thickness) by ensuring no air gap is trapped between the sample
and the coverslip. The scale of the micrographs was calibrated using a 1 cm graticule with 100 µm
intersections.
4.2.7 Yield of PEC Gels
After PEC gel preparation, the total PEC mass was measured using an analytical balance (Sartorius,
BP61 model, Germany) with an accuracy of ± 0.1 mg. Three samples of approximately 0.1-0.3 g were
weighed before and after freeze drying. The samples were freeze-dried at -20 °C and 80 mTorr for 17.5
hours until completely dry, as was confirmed by TGA. The PEC yield was determined by mass using the
following equation:
𝑌𝑖𝑒𝑙𝑑, % = 𝑚𝑑
𝑚𝑖 𝑥 100 (4.7)
where mi is the total pure PE powder mass used to make the PE solutions i.e. 5 g, and md is the mass
of the dried PEC.
4.2.8 Moisture, Solid Content and pH of PEC Gels
The moisture content of PECs was analysed using the following equation:
𝑀𝑜𝑖𝑠𝑡𝑢𝑟𝑒 𝐶𝑜𝑛𝑡𝑒𝑛𝑡, % =𝑚𝑤 − 𝑚𝑑
𝑚𝑑 𝑥 100 (4.8)
where mw is the mass of the wet PEC sample and md is the mass of the dry PEC sample after freeze-
drying. The final solid content (wt. %) of the centrifuged polyelectrolyte complexes was determined
using the following equation:
𝑃𝐸𝐶 𝑆𝑜𝑙𝑖𝑑 𝐶𝑜𝑛𝑡𝑒𝑛𝑡, % =𝑚𝑑
𝑚𝑤 𝑥 100 (4.9)
The results of the solid content of PECs were used for the production of solvent-cast films and can be
found in Chapter 5 – PEC Films. The pH of the PEC gels before and after washing steps was measured
when the PEC gel was in a solution property. Type 1 water was added to PEC gels to turn PEC gels into
PEC solutions.

Chapter 4 – Polyelectrolyte Complex Gels
51
4.2.9 Nitrogen, Carbon and Sulfur Elemental Analysis
The composition of the freeze-dried complexes and individual materials was determined by measuring
the amount of nitrogen present in PECs. The elements were measured using nitrogen, carbon, sulfur
(NCS) element analyser (FlashEA 1112, Thermo Fischer Scientific, Italy). The sensitivity of the machine
to sulfur concentration was low. Hence, only the % nitrogen data was used to determine the
composition of the final complex. The instrument was calibrated using a sulphanilamide standard.
Approximately, 1 to 2 mg of lyophilised samples for 17.5 hours at 80 mTorr were measured using a
microbalance (Sartorius, Cubis-MSA, Germany) with a sensitivity to ± 0.1 µg. The materials were
placed inside tin container catalysts and heated to 980 °C. The materials were combusted, and the
elements present were converted into simple gases (CO2, N2 and SO2). The gases were then
homogenised, and the system controlled the exact conditions (pressure, temperature and volume). A
column was used to separate the homogenised gases in a stepwise steady-state manner to detect the
elements as a function of their thermal conductivities. The machine identified the total N and C to the
precision of 0.1 µg. The NCS analysis measurements were undertaken by James Rolfe at the
Department of Earth Science, University of Cambridge. The raw data of N measured by the machine
was presented in mass % and were subsequently converted into mol % using the following equations:
MCRGPEC = % CSp − % PEC
% CSp x Mt (4.10)
MCSPEC = Mt − MCRGPEC (4.11)
𝑴𝒐𝒍𝑪𝑹𝑮𝑷𝑬𝑪 = MCRGPEC
CRGmwt (4.12)
𝑴𝒐𝒍𝑪𝑺𝑷𝑬𝑪 = MCSPEC
CSmwt (4.13)
where MCRGPEC is the mass of CRG in PEC and MCSPEC is the mass of CS in PEC. The % CSp and % PEC
denote the % N found in pure CS and the PEC samples, directly from the NCS analysis machine,
respectively. Mt is the total pure mass of CS and CRG used (5 g). CRGmwt and CSmwt represent the
molecular mass per disaccharide unit for both CS (165 g/mol) and CRG (384 g/mol), respectively.
Finally, the molar ratio of CS and CRG were presented as MolCSPEC and MolCRGPEC, respectively.
4.2.10 Fourier Transform Infrared Spectroscopy
The PEC gels produced at different pHs were freeze-dried for 17.5 hours at 80 mTorr before analysis.
The PECs were analysed using an FTIR instrument (Spectrum 100 Perkin Elmer, USA) with attenuated
total reflectance using a zinc selenide (ZnSe) crystal. The absorbance values of CS and CRG were

Chapter 4 – Polyelectrolyte Complex Gels
52
analysed independently. The non-complexed mixture of CS and CRG were also analysed and compared
with the PECs to confirm complex formation by electrostatic interaction. Electrostatic interaction of
PECs was confirmed using the absorbance values at 1592 cm-1 and 1216 cm-1. The data were averaged
over 16 scans, using a resolution of 8 cm-1, in the spectral region of 1700 – 600 cm-1. The complexes
were also confirmed after homogenisation to determine whether the homogenisation process has
disrupted the electrostatic interactions.
4.2.11 X-Ray Diffraction
A vertical diffractometer (PW 1830P, Philips, Netherlands) was used to determine the crystallinity and
identify possible crystalline contaminants and confirm complex formation. The individual PEs were
analysed using a step size of 0.05° and a 4 s dwell time from 5-80o, while the PECs were analysed from
5-50o. The voltage and current used were 30 kV and 30 mA, respectively. Measured diffraction
patterns were compared against powder diffraction files from the International Centre for Diffraction
Database (ICDD) using PANalytical Highscore Plus software.
4.2.12 Rheology
Rheological measurements of PEC gels were performed to measure the SEI between PEs at varying pH
values directly. Controlling the self-crosslinking of PECs may potentially be valuable for controlling the
mechanics and stability of films and scaffolds produced. The viscoelastic properties of PECs were
determined using a rheometer (Discovery Hybrid 2.0, TA Instruments, USA). The temperature during
measurement was controlled at 20 °C using a Peltier element. A parallel plate (stainless steel)
geometry (0o, 40 mm) was used with a gap of 500 µm between the flat surfaces of both elements. For
each sample, approximately 1 ml of PEC gel sample was used. The samples were subjected to
amplitude sweep (strain sweep) of 0.1-100 % strain (up) at a frequency of 10 rad s-1 to determine their
linear viscoelastic region (LVR). The samples were put into a humidity trap to reduce the evaporation
of the water situated inside the gels. The oscillating sweep measurement was carried out over an
extended angular frequency domain of 0.1-100 (up) rad s-1 at a strain of 1 %, which was in the linear
regime for all samples (as confirmed by amplitude sweep measurements). Finally, the flow curves
were measured at increasing shear rate (flow sweep or rate sweep) from 0.01 s-1 to 100 s-1 to
determine the shear properties such as the change in viscosity of the materials.

Chapter 4 – Polyelectrolyte Complex Gels
53
4.3 Results
4.3.1 Thermogravimetric Analysis
The TGA scans of CS, CRG and CS-CRG PECs prepared at different pHs are shown in Figure 4.2. The
mass loss occurred in three distinct stages. The first stage showed approximately a 10 % step-drop
due to water evaporation at temperatures from 25 to 150 °C. The second stage is the rapid
degradation of CS and CRG with onset temperatures of 270 °C and 220 °C, respectively. The third stage
is the complete degradation of the organic matter of the sample, and only the impurities were
retained within the mixture. The temperature of this stage starts at 650 °C for CS and 500 °C for CRG
with around ten times more impurities present in CRG (20.51 %) compared to CS (1.96 %). The amount
of impurities (presumed to be inorganic) was calculated from the mean of three different sample
measurements (Fig. 4.3). The onset temperature of PEC degradation was higher for the complexes
prepared at higher pH. The pH 9 PEC contained the highest impurity (5.78 %) followed by the rest of
the PECs with impurities not exceeding 2.43 %.
Figure 4.2 – Thermogravimetric analysis of CS, CRG and CS-CRG PECs prepared at different pHs.
Figure 4.3 – Amount of impurities present in CS, CRG and CS-CRG PECs prepared at various pHs as determined by TGA (mean ± SD, n = 3).
0
10
20
30
40
50
60
70
80
90
100
0 50 100 150 200 250 300 350 400 450 500 550 600 650 700
Wei
ght,
%
Temperature, oC
Chitosan
PEC pH 3
PEC pH 5
PEC pH 7.4
PEC pH 9
Carrageenan
1.96 2.43 1.88 2.13
5.71
20.51
0
5
10
15
20
25
Chitosan PEC pH 3 PEC pH 5 PEC pH 7.4 PEC pH 9 Carrageenan
Imp
uri
ty. %

Chapter 4 – Polyelectrolyte Complex Gels
54
4.3.2 Ζeta Potential
In Figure 4.4, the ζ-potential of CS and CRG are presented for pH values ranging from 3-12. The ζ-
potential of CS is shown to be at a maximum (+30 mV) at pH 2-5. As the pH was increased to pH 8
(with the addition of NaOH), the ζ-potential decreased gradually towards neutrality (0 mV). Further
addition of NaOH resulted in a switchover of the ζ-potential to -7 mV. The ζ-potential of CRG was found
to be strongly negative and remained relatively constant throughout the pH range studied from pH 3
(-60.6 mV) to pH 10 (-68.9 mV). The lowest and highest charge density of CRG was found at pH 2 (-50
mV) and pH 11 (-93.7 mV), respectively. The PECs at 1:1 molar ratio displayed a negative ζ-potential
across the full range of pHs tested.
Figure 4.4 – ζ-potential of CS, CRG and CS-CRG 1:1 molar ratio at different pH values. Mean ± SD, n = 3.
Finally, the SEI of PECs at a particular pH was predicted by multiplying the CS charge with the CRG
charge measured at the same pH (Fig. 4.5). It was predicted that the interaction between CS and CRG
is the strongest at pH 4 and 5.
Figure 4.5 - The strength of the electrostatic interaction (SEI) for CS-CRG. Mean ± SD, n = 3.
-100
-90
-80
-70
-60
-50
-40
-30
-20
-10
0
10
20
30
40
50
2 3 4 5 6 7 8 9 10 11 12
ζ-p
ote
nti
al, m
V
pH
CS CRG CS:CRG 1:1
-1000
-500
0
500
1000
1500
2000
2500
2 3 4 5 6 7 7.4 8 9 10 11 12Stre
ngh
t o
f El
ectr
ost
atic
In
tera
ctio
n, m
V2
pH

Chapter 4 – Polyelectrolyte Complex Gels
55
4.3.3 Visual Assessment of PEC Gels
The immediate observation was that the pH strongly influenced the appearance and consistency of
the polyelectrolyte complex gels. The newly prepared polyelectrolyte complex gels after the washing
and centrifuging protocol are shown in Figure 4.6. After phase separation, a dense white precipitate
was formed at 3 ≤ pH ≤ 7 and a translucent watery complex coacervate at 7.4 ≤ pH ≤ 12. The
supernatant produced across the pH range showed very low turbidity suggesting that there might
have been small amounts of unreacted PE and non-centrifuged PEC remaining.
Figure 4.6 – Visual assessment of CS-CRG PECs at pH 3-12 after washing and centrifugation protocol (non-homogenised).
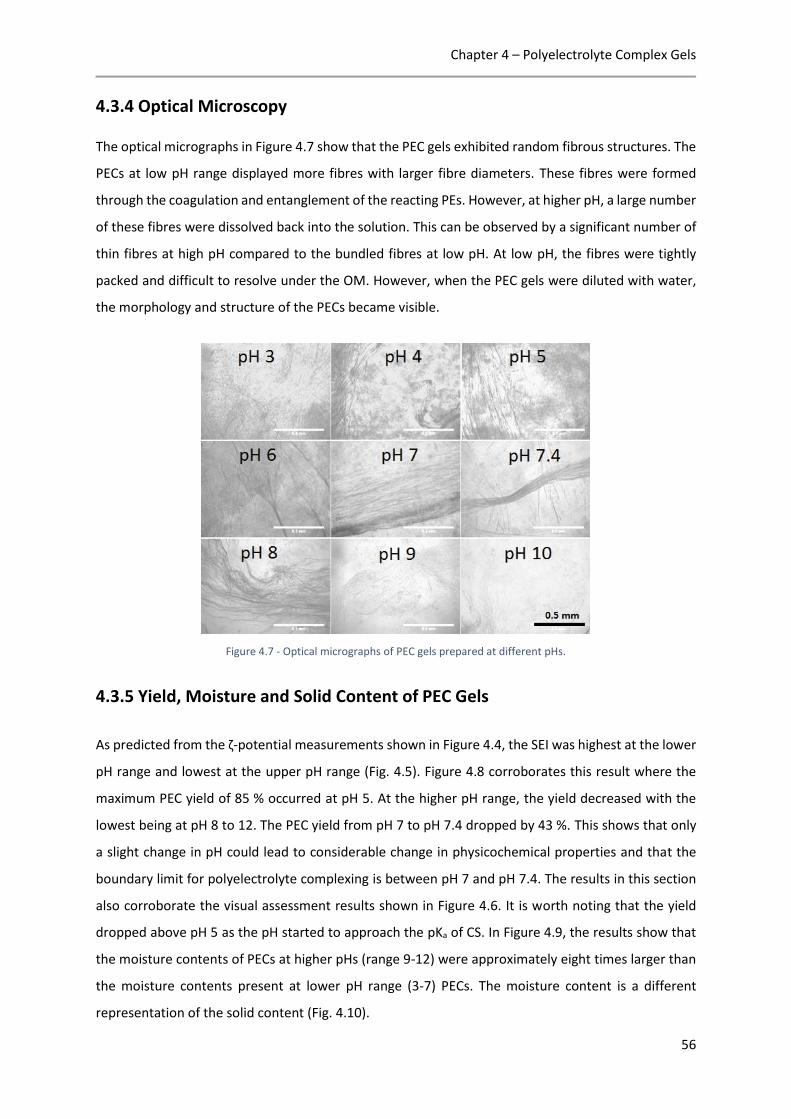
Chapter 4 – Polyelectrolyte Complex Gels
56
4.3.4 Optical Microscopy
The optical micrographs in Figure 4.7 show that the PEC gels exhibited random fibrous structures. The
PECs at low pH range displayed more fibres with larger fibre diameters. These fibres were formed
through the coagulation and entanglement of the reacting PEs. However, at higher pH, a large number
of these fibres were dissolved back into the solution. This can be observed by a significant number of
thin fibres at high pH compared to the bundled fibres at low pH. At low pH, the fibres were tightly
packed and difficult to resolve under the OM. However, when the PEC gels were diluted with water,
the morphology and structure of the PECs became visible.
Figure 4.7 - Optical micrographs of PEC gels prepared at different pHs.
4.3.5 Yield, Moisture and Solid Content of PEC Gels
As predicted from the ζ-potential measurements shown in Figure 4.4, the SEI was highest at the lower
pH range and lowest at the upper pH range (Fig. 4.5). Figure 4.8 corroborates this result where the
maximum PEC yield of 85 % occurred at pH 5. At the higher pH range, the yield decreased with the
lowest being at pH 8 to 12. The PEC yield from pH 7 to pH 7.4 dropped by 43 %. This shows that only
a slight change in pH could lead to considerable change in physicochemical properties and that the
boundary limit for polyelectrolyte complexing is between pH 7 and pH 7.4. The results in this section
also corroborate the visual assessment results shown in Figure 4.6. It is worth noting that the yield
dropped above pH 5 as the pH started to approach the pKa of CS. In Figure 4.9, the results show that
the moisture contents of PECs at higher pHs (range 9-12) were approximately eight times larger than
the moisture contents present at lower pH range (3-7) PECs. The moisture content is a different
representation of the solid content (Fig. 4.10).

Chapter 4 – Polyelectrolyte Complex Gels
57
Figure 4.8 – Yield of PEC gels, produced at varying pH (3-12). Mean ± SD, n = 3.
Figure 4.9 - Moisture content of PEC gels produced at varying pH (3-12). Mean ± SD, n = 3.
Figure 4.10 - Solid content of PEC gels produced at varying pH (3-12). Mean ± SD, n = 3.
0
10
20
30
40
50
60
70
80
90
100
3 4 5 6 7 7.4 8 9 10 11 12
PEC
Yie
ld, %
pH
PEC Yield, %
0
2000
4000
6000
8000
10000
12000
14000
16000
18000
3 4 5 6 7 7.4 8 9 10 11 12
Mo
istu
re C
on
ten
t, %
pH
Moisture Content, %
0
1
2
3
4
5
6
7
3 4 5 6 7 7.4 8 9 10 11 12
PEC
So
lid C
on
ten
t, w
t. %
pH
PEC Solid Content, wt. %

Chapter 4 – Polyelectrolyte Complex Gels
58
4.3.6 pH Measurements of PEC Gels
After the preparation of the PECs, the pH of the PEC gel solution was measured before and after the
washing step with ultrapure type 1 water. It was found that the PECs produced at moderate pH (4 <
pH < 8) only changed very slightly in pH after the washing step. On the other hand, the PEC gels
produced at pH 3, and 9 changed by 1 pH unit and reached pH values closer to neutrality (Fig. 4.11).
Figure 4.11 – pH of PEC gels before and after washing steps with ultrapure type 1 water.
4.3.7 Nitrogen, Carbon and Sulfur Elemental Analysis
In Figure 4.12 below, the % nitrogen and % sulfur of all candidate materials is shown in molar %. The
nitrogen content, which depicts the amount of CS in the PEC, increases at higher pH. Although the
interaction strength reduces with increasing pH up to pH 6 (Fig. 4.4), the composition was unchanged
over this range (Fig. 4.12). The PECs produced at the higher pH range (pH 9-12), contained
approximately 30 % more CS compared to PECs produced at the lower pH range (pH 3-8).
Figure 4.12 - The effect of pH on the molar composition of PECs. The result is based on the % nitrogen by using the formulae shown in the method in Section 4.2.9. Mean, n = 3.
3
4
5
6
7
8
9
3 4 5 6 7 8 9
pH
of
PEC
Gel
s (a
fter
was
hin
g)
pH used to prepare PEC gels (before washing)
After washing
Before washing
0
10
20
30
40
50
60
70
80
90
100
3 4 5 6 7 7.4 8 9 10 11 12
Mo
lar
Co
mp
osi
tio
n, %
pH
CS CRG

Chapter 4 – Polyelectrolyte Complex Gels
59
4.3.8 Fourier Transform Infrared Spectroscopy
In this section, the FTIR spectra were used to confirm PEC formation. The FTIR spectra of the individual
PEs and PECs are shown in Figure 4.13. The characteristic absorption bands for CS were at 1650 and
1587 cm-1 and for CRG at 1230, 914, 844 cm-1. The sulfate group (1230 cm-1) in CRG shifted to
1216 cm-1 during PEC formation. Also, the band in CRG at 1630 cm-1 and band in CS at 1650 cm-1 were
shifted and combined to form a stronger peak at 1634 cm-1 after PEC formation. At pH 8 and above no
PEC formation could be confirmed, as there was no trough present at 1529 cm-1 and 1216 cm-1. The
absence of complex formation was also confirmed by mixing unreacted CS with CRG powder (dark
blue curve), which appeared to have the same fingerprint region as the non-complexed PECs produced
at pH 8-12.
Figure 4.13 - FTIR data of CS, CRG, CS and CRG non-complexed mixture and CS-CRG complexes (pH 3-12). Red ellipses are highlighting the wavenumbers for the confirmation of PEC formation.

Chapter 4 – Polyelectrolyte Complex Gels
60
4.3.9 X-Ray Diffraction
X-ray diffraction peaks are presented for both the individual PEs and the PECs (Fig. 4.14). CS exhibited
two diffraction peaks at 2θ = 10.6° and 19.9°. On the other hand, CRG showed five dominant sharp
peaks at different 2θ (26o, 41o, 50o, 66o and 74o). All PECs presented only one broad peak at 2θ = 22°.
It can also be observed that no crystalline peaks were found in the PECs. The only small sharp peak
that can be noted in the PECs was at 2θ = 29° for pH 9, which may be due to some inorganic remnants.
Figure 4.14 – XRD patterns for CS, CRG and CS-CRG PECs produced at different pHs. The red ellipse highlights PEC formation. The red ellipse is highlighting the 2theta angle for the confirmation of PEC formation.

Chapter 4 – Polyelectrolyte Complex Gels
61
4.3.10 Rheology
Rheological measurements were carried out to describe the SEI of PECs quantitatively. A reasonable
pH range (3-9) was selected from the visual assessment analysis to describe the effect of pH on the
viscoelastic properties. Amplitude (strain) sweeps showed that the pH influenced the viscoelastic
properties of wet PECs significantly (Fig. 4.15). The storage moduli (G’) and loss moduli (G’’) indicated
that the linear viscoelastic region (LVR) of all PECs were well within 1 % strain. Hence a constant strain
of 1 % was used for the frequency sweep measurements. The PEC gels produced at higher pH range
(pH 6-9) induced greater strain limit (%) than the PEC precipitates prepared at the lower pH range (pH
4-5). In all cases, the G’ was higher than the G’’ at lower strains (0.1-10 %). The order of the viscoelastic
properties of the PECs with pH were as follows: G’ and G’’ = pH 5 > pH 4 > pH 3 > pH 6 > pH 7 > pH 7.4
> pH 8 > pH 9 (Fig. 4.15).
Figure 4.15 – Amplitude (strain) sweep measurements of PEC gels prepared at different pH range (3 – 9). The storage moduli (G’) and loss moduli (G’’) of the materials are shown at different oscillation strains. The linear viscoelastic region (LVR) can be found to be linear at 1 % oscillation strain (red dotted line) and below for all candidates tested.
The frequency sweep curves of the PECs prepared at different pH are shown in Figure 4.16. All PECs
displayed a moderate continuous increase in viscoelastic properties at higher angular frequencies. The
storage moduli of pH 5 (~ 10000 Pa) was in the order of two magnitudes greater than the storage
moduli of PEC produced at pH 9 (~ 100 Pa). The strength of PEC interaction with respect to pH is given
in order from highest to lowest elastic moduli: pH 5 > pH 4 > pH 3 > pH 6 > pH 7 > pH 7.4 > pH 8 > pH
9 (Fig. 4.16).

Chapter 4 – Polyelectrolyte Complex Gels
62
Figure 4.16 – Frequency sweep measurements of PEC gels prepared at different pH range (3 – 9). The storage moduli (G’) and loss moduli (G’’) of the materials are shown at different angular frequencies.
Flow experiments were also carried out to further quantify the effect of pH on the rheological
properties of CS-CRG PECs. As the shear rate was increased, the viscosity was decreased (Fig. 4.17).
However, the PECs prepared at pH 3, 4 and 5 showed viscosities two orders of magnitude higher than
those found in PECs prepared at higher pH values (6, 7, 7.4, 8 and 9).
Figure 4.17 – Flow sweep measurements of PEC gels prepared at different pH range (3 – 9). The viscosities of the materials are shown at various shear rates.

Chapter 4 – Polyelectrolyte Complex Gels
63
4.4 Discussion
4.4.1 Thermal Degradation
4.4.1.1 Thermal Degradation Properties of CS, CRG and PECs
Figure 4.2 showed that the degradation temperature of CS was higher than that of CRG. This will be
related to the temperature of oxidation of each material and may also be influenced by the higher
crystallinity of CS 187. The PECs which have a mixture of CS and CRG showed degradation temperatures
intermediate between the extremes. This intermediate degradation temperature found in PECs may
be due to the disruption of the hydrogen-bonding caused by the electrostatic interaction among the
polysaccharide chains. The hydrogen bonding is also responsible for the compact CS structure 188. In
fact, the compactness within CS was previously shown to increase at higher pH neutralisation 189. This
was due to the self-rearrangement and formation of more ordered regions within the network as was
studied by wide-angle X-ray scattering analysis (WAXS) 189. This was also supported by the increased
thermal stability of CS and chondroitin sulfate (ChS) PECs prepared at pH > 6 and between CS and
heparin PECs as illustrated by the higher degradation temperature for PECs prepared at higher pH 144.
4.4.2 Impurities
4.4.2.1 Amount of Impurities Present in PEs
The impurities remaining within the materials were confirmed to be an inorganic salt. This can be
supported by the complete degradation of the organic material within approximately 500 °C. To
confirm the inorganic material, XRD was carried out on CS, CRG and their PECs. The crystalline phases
of CRG matched with the ICDD database for potassium chloride (KCl). The absence of crystalline peaks
in CS and PECs may have been due to the relatively small amounts of impurities (~ 2 %) as was found
with TGA.
4.4.2.2 The Cause of High Salt Content in CRG
A possible explanation for the high impurity in CRG can be related to the processing methods used.
CRG can be extracted from red seaweed in two possible ways: an alcohol (isopropanol) method or, a
more widely used, salt (KCl) precipitation method 11,83. The former method produces a purer form of
CRG but is more expensive. The latter method involves the complexing of the sulfate groups present
in CRG with the potassium ions present in KCl. The use of KCl, explains the reason for the high salt
content in CRG.

Chapter 4 – Polyelectrolyte Complex Gels
64
4.4.2.3 The Cause of Low Salt Content in CS
On the other hand, dilute NaOH is typically used to deproteinate the washed crustacean shells to
produce chitin. Chitin is then further treated with concentrated NaOH to deacetylate the chitin into
CS 190. Therefore, the impurity present in CS is likely to be small amounts of sodium chloride (NaCl).
4.4.2.4 Absence of Crystalline Phases in PECs
The absence of sharp XRD crystalline peaks in PECs signifies that the crystalline contaminants have
been removed almost entirely during the washing steps. Nevertheless, there was a small exception
for PEC pH 9 showing a crystalline peak at 2θ = 29°, which could be due to the increased remnant at
5.71 wt. % as was confirmed with TGA. Finally, the amount of salt impurity in each sample was taken
into account during the preparation of polyelectrolyte complexes to produce a 1:1 molar ratio of
amino groups and sulfate groups present in each CS and CRG monomer, respectively.
4.4.3 Nature of Interactions
4.4.3.1 The pH is one of the Strongest Factors Influencing Charge Density
The pH is widely considered to be one of the strongest factors that affect the charge density of PEs
44,191,192. When the charge density changes, the three-dimensional configuration and flexibility of
polyelectrolytes also changes. It is widely accepted that when the ζ-potential is ≤ -30 mV or ≥ +30 mV,
then the PE solution is considered stable (dispersed) due to the high repulsion of like-charged PEs.
This creates an extended polymer chain that is stiff. However, when the temperature increases, the
chains of the PEs are still charged but conform to a random coil-like structure 193. PEs that are being
neutralised will turn into a random-like conformation because the charge repulsions on polymer
backbones are cancelled.
4.4.3.2 The Effect of pH on the CS Charge Density
The acid dissociation constant (pKa) of CS has been reported to be around 6.5 99. When CS powder was
dissolved in acid, NH2 groups were protonated by the hydrogen ions in the acid giving rise to positively-
charged NH3+ groups (Eq. 4.14). This was the state when CS was dissolved in acid. In contrast, the
addition of a base e.g. NaOH deprotonates the NH3+ groups back to NH2 groups which result in the
precipitation of CS (Eq. 4.15) and therefore exhibiting a weak polyelectrolyte behaviour. This was the
state when CS was precipitated in alkali. CS was found to be 17 % positively-charged at pH 7.4, which
was found to closely match with the results previously obtained by Denuziere et al. (1996) 194,
exhibiting a positive charge of 16 % at pH 7.4. In CS, the switchover to negative values in the pH range

Chapter 4 – Polyelectrolyte Complex Gels
65
8-13 (Eq. 4.16) is likely due to the screening of NH2 groups of CS by the excess hydroxide ions from the
added alkali.
(4.14)
(4.15)
(4.16)
4.4.3.3 The Effect of pH on the CRG Charge Density
In contrast, the negative ζ-potential values of CRG are the result of dissociation of OSO3K giving rise to
OSO3- in CRG molecules (Eq. 4.17). This was the state when CRG was dissolved in water. The sulfate
groups of CRG can also exist in conjugated form with calcium and sodium ions. Even though the pKa
value of CRG was reported to be at pH 2 100, the ζ-potential for CRG was unexpectedly still very high at
pH 2 (-28 mV). Therefore, the CRG molecules showed a strong PE behaviour. Similar ζ-potential values
were previously found in CRG from pH 2-7 at a concentration of 0.5 wt. % 109. However, the ζ-potential
values of CRG at pH 8-12 were not reported before. Reports from previous studies only showed
significant swelling in CS-CRG PEC gels at pHs 11-12 7,145. The high swelling was thought to be due to
the excess negative repulsive charge of CRG, and the results match with the ζ-potential at pH 11 and
12 found in the present study. The significant increase in Na+ and OH- ions may have also led to the
disruption of the CRG gel helices and thereby further exposing the negatively charged groups leading
to strong negative ζ-potential 111,145.
(4.17)
4.4.3.4 Electrostatic Interaction between CS and CRG
Equation 4.18 shows the electrostatic reaction between CS and CRG and the release of counterions in
the form of salt. Formation of polyelectrolyte complexes is the result of interactions between the
amino groups and the sulfate groups present in CS and CRG, respectively 195. The PEC complex in this
study displayed a negative ζ-potential across all pH range. This may have been caused by the
dissolution of the CRG molecules into the solvent mixture and the higher opposite charge density.
(4.18)

Chapter 4 – Polyelectrolyte Complex Gels
66
4.4.3.5 Calculating the Strength of Electrostatic Interaction
The strength of the electrostatic interaction (SEI) was determined by multiplying the absolute ζ-
potentials for both polyelectrolytes at each pH as was first applied by Weinbreck et al. (2004) 10 and
Espinosa-Andrews et al. (2013) 3. The SEI is a theoretical assumption of the electrostatic strength
between the PEs at various pH ranges. The ζ-potential measurements showed that the attraction
between PEs (SEI) is strongest at pH 3-5 and weakest at pH 8-12 as was presented in Figure 4.5. Similar
results were found previously, where the interaction between chitosan (CS) and gum-arabic (GA) was
the highest between pH 3.5-5 and lower at pH 2 and 6 due to the protonation of GA below pH 3 and
the deprotonation of CS above pH 5 38. The maximum SEI of the CS-CRG gels (1900 mV2) were almost
twice as high than the SEI of the CS-GA gels (1000 mV2) and was reflected by the stronger viscoelastic
properties of the gels in the CS-CRG PEC gels.
4.4.4 Physicochemical Properties of PEC Gels
4.4.4.1 PEC Preparation Conditions
During PEC formation, the pHs were chosen to optimally charge the PEs without subjecting them to
an extreme pH environment. The use of extreme pH environments can result in acidic degradation of
CS and CRG 196,197. The primary degradation mechanism of CS was previously shown to be due to acid
hydrolysis, while it was stable against alkali degradation 196. Similarly, preparation of CRG solution at
a pH less than 4 should be avoided 28. For these reasons, the pH of CS during PEC preparation was
adjusted to pH 4 before it was added to the CRG solution. In addition, the elevated temperature (60
°C) used during PEC preparation was intended to increase the solubility and reduce the viscosity of the
CRG solution. CRG molecules can change from a helical to a random coil-like conformation at higher
temperatures (above the average gel-sol transition temperature of 30-40 °C) 21,174,198. This enhances
the flexibility of the macromolecular backbone. The combination of the factors above was used to
increase the rate of PEC interaction and to obtain the highest yield possible.
4.4.4.2 The Effect of Interaction on the Physical Properties of PECs
To obtain homogeneous PEC gels, the SEI between the PEs needs to be at an optimal level. The PEC
gels can change from a heterogeneous precipitate gel to a homogeneous complex coacervate gel at
high and low SEI, respectively. In this study, PEC precipitate gel fibres were formed during the drop-
wise addition due to the vigorous mixing coupled with the strong interaction at pH 4. Other studies
investigating CS-CRG PECs have also observed precipitate formation due to the high SEI caused by the

Chapter 4 – Polyelectrolyte Complex Gels
67
strong sulfate groups present in CRG 143,145. Hugerth et al. (1997) 143 produced dense water-insoluble
gel precipitates by reacting CS with varying DDA (73 %, 84 % and 93 %) and different CRG types (κ-, ι-,
λ-). Sakiyama et al. (1993) 145 also showed PEC precipitation when CS and κ-CRG interacted in the
absence of NaCl. However, the addition of salt at 5.7 wt. % during the interaction between CS and CRG
was shown to produce homogeneous PEC gels 13. This is because the added salt can screen some of
the charged groups present in the PEs and therefore reduce the electrostatic interaction. The
advantage of obtaining homogeneous coacervate gels is that films and scaffolds can be produced with
reproducible mechanical properties. Another method previously used to form homogeneous CS-CRG
PEC gels was to add CS vigorously to the CRG and allowing the mixing to continue for 5-7 days at room
temperature 21. Finally, homogeneous PEC gels can be formed through homogenisation, as the process
was shown to be non-disruptive to the electrostatic interaction when confirmed with FTIR (data not
shown). Homogeneous PEC gels can be used to form homogeneous films and scaffolds. The
viscoelastic properties of the PEC gels were later quantitatively determined using rheology. Viscosity
measurements were used to provide a direct relationship with the SEI as was previously proposed by
Weinbreck et al. (2004) 199.
4.4.4.3 The Effect of pH on PEC Yield
The PEC yield was used to determine the effect of pH on the efficiency of PEC formation between CS
and CRG. At pH 5 the interaction between CS and CRG produced the highest complex yield of 85 %. It
may be that pH 5 the interaction is optimal for polyelectrolyte complex formation. Espinosa-Andrews
et al. (2007) 200 previously found a similar result, where the maximum complex yield (92 %) between
GA and CS appeared to be at pH 5 regardless of the CS concentration used (0.25, 05 and 1 % w/w).
Similarly Huang et al. (2014) 28 showed the highest complex yield between GA and CS at pH 4.5. The
reasons stated for the high complex yield at pH 5 was that the charge densities of the PEs were
stoichiometrically balanced, allowing for greater complexation to occur with higher complex yield
134,200. However, the ζ-potential of CS-CRG PECs was at -23 mV which does not fully support this notion,
unless the PEC was surrounded by excess CRG molecules which resulted in the formation of a negative
charge which was previously proposed for chitosan-dextran sulfate PEC colloids 110. The low yield and
high moisture content of PEC gels produced at high pH are the product of the neutralised CS. When
CS becomes deprotonated, CS-CRG PEC gel dissolves which reduces the yield. Also, the strongly
negatively-charged CRG increases the attraction of water molecules, and ultimately the moisture
content in the PEC gels 109.

Chapter 4 – Polyelectrolyte Complex Gels
68
4.4.4.4 The Effect of Centrifugation on PEC Yield
The centrifugation step also played a significant role on the PEC yield produced. The yield was
expected to be higher when higher speeds and longer centrifugation times were used. However, it
was found that the centrifugation at maximum speed (4500 rpm) for 2 minutes was the optimal
method used to recover most of the complex gels within the shortest time possible.
4.4.4.5 The pH of Prepared PEC Gels Before and After Washing Steps
Finally, the pH of the PEC gels was confirmed before and after washing steps with ultrapure type 1
water, to confirm whether the pH of the PEC gels remains constant after the washing steps. It can be
suggested that negligible remnants of acids and alkalis were present in the PECs prepared between
pH 4 and pH 8 since the pH of the PECs after washing remained approximately the same. However,
the PEC gels produced at pH 3 and 9 exhibited 1 pH unit closer to neutrality when washed with
ultrapure type 1 water. This suggests that the materials at pH 3 and 9 were not fully adjusted to the
required pH level, and therefore more time should have been allowed to equilibrate the pH value of
the PECs during PEC preparation.
4.4.5 Composition of PEC Gels
4.4.5.1 The Importance of Measuring the PEC Composition
Knowing the composition of PEC gels is necessary to understand and characterise the materials.
Furthermore, from a regulatory point of view within the pharmaceutical and biomedical industry,
there is a need to quantify the amounts of material fractions present in the complex. Since only small
quantities of PEs remained in the supernatant after reacting at the low pH range, it can be assumed
that most of the PEs have been consumed into the complexes. This was expected since both PEs were
highly charged at pH 3-5. At higher pHs, the CS precipitates and combines with the PECs.
4.4.5.2 FTIR Absorbance Bands of PEs and PECs
Characteristic FTIR absorbance bands were present in CS at 1650 and 1587 cm-1 due to the secondary
amide (C=O stretching) and amine (N-H bending), respectively 201,202. The bands present in pure CRG
at 1230, 914, 844 cm-1 were due to the S-O bond of the sulfate group, 3,6-anhydro-D-galactose and
D-galactose-4-sulfate, respectively 195,203,204. FTIR measurements were also carried out to confirm the
presence of electrostatic interactions as this was not possible with the spectrophotometric or NCS
elemental analysis technique. The broad absorbance region at 1200-1000 cm-1 is a standard fingerprint
region for polysaccharides, and the absorbance was the highest at 1033-1026 cm-1 due to the C-O-C
Chapter 4 – Polyelectrolyte Complex Gels
69
stretching (glycosidic linkage) that is present in both CS and CRG 149. The absorbance band at
1529 cm-1 in Figure 4.13 was only visible after PEC formation and was thought to be due to OSO3--NH3
+
that is responsible for the electrostatic complexing 23. Electrostatic PEC formation was only confirmed
at pH 3 - 7.4 due to the existence of electrostatic interactions between PEs.
4.4.5.3 Interrelationship between XRD and FTIR
The relatively broad diffraction peaks in CS at 2θ = 10.6° and 19.9° are indicative of crystal form I and
crystal form II, respectively 119,205. Therefore CS is semi-crystalline as was previously reported in the
literature 132,206,207. On the other hand, CRG showed a broad XRD curve denoting an amorphous
structure (Fig. 4.14). The broad peak observed in PECs at 2θ = 22° indicates that PECs were also
amorphous in nature. This may have been due to the quick rearrangement of the PEs in the complex.
Therefore the PEs did not have enough time to rearrange into a more ordered and crystalline
structure 208. The results from FTIR were corroborated with XRD, confirming PEC formation at
pH 3 - 7.4. The suppression of the CS peaks in the XRD curve indicates good compatibility and strong
interactions between CS and CRG in PECs. The CS peaks started to reappear in PECs produced at high
pH (pH ≥ 9), showing that the CS was slowly precipitating out from the complex. These peaks were
absent in the complexes due to the disruption of the hydrogen bonds between amino and hydroxyl
groups in CS 208.
4.4.6 Rheological Properties of PEC Gels
4.4.6.1 Direct Quantitative Measure of the Strength of Electrostatic Interaction of PEC Gels
The main advantage of directly characterising the wet PEC gels is that their native binding state can
be measured while their electrostatic complexing remains undisrupted. The direct measurement of
the PEC gels with rheology can save time, avoid loss of structural information and therefore becomes
fundamental to the understanding of PEC film and scaffold preparation and their physicochemical
properties.
4.4.6.2 Amplitude Sweep
The linear viscoelastic region (LVR) is the area where the G’ and G’’ were independent of strain. This
point was reached earlier for some PECs, but overall it was around 1 % (Fig. 4.15). Breakdown and
reformation of PEC structure network occur when the strain is beyond the LVR 38,109. For all the PECs,
the G’ was higher than the G’’ indicating that the PECs were predominantly exhibiting an elastic
behaviour. However, at higher strains (10-100 %), the crosslinks of the PEC structure were broken,
resulting in a material with a Newtonian fluid-like behaviour.

Chapter 4 – Polyelectrolyte Complex Gels
70
4.4.6.3 Frequency Sweep
Previously it was shown that the extent of electrostatic complexing is highly influential on the
viscoelastic properties. Weinbreck 199 and Espinosa 102 have also shown that electrostatic complexing
of whey-protein/gum-arabic was the strongest at pH 4. The complex coacervates formed in the
previous study were more viscous than elastic (G’’ > G’) 43. This may be due to the use of a weaker
anionic PE (gum-arabic) compared with a strong anionic PE (κ-CRG) utilised in the present study. The
mechanism behind the viscous behaviour may be attributable to the higher hydrophobic forces
(polymer-polymer interaction) compared to the strong electrostatic interactions found in this study
38,209. No cross-over point was observed for CS-CRG PEC gels at any oscillating frequency used, implying
that the PECs were highly elastic and possessed characteristics of a gel-like structure 186. Even at higher
pH where the CS was fully deprotonated, some interaction remained between CS and CRG due to
some induced electrostatic, hydrophobic and physical entanglements 6. A previous study on CS with
BSA reported a cross-over point between G’’ > G’ at higher frequencies showing a more viscous-like
behaviour 210.
4.4.6.4 Viscosity Measurements
From the viscosity measurements, it is apparent that the PEC gels displayed shear thinning properties.
All PECs behaved as Bingham fluids (evidenced by the sharp decrease in viscosity upon shearing). This
flow behaviour is a result of structure breakdown in PECs, which was recovered at rest within several
minutes (data not shown). Again, this result was consistent with the pH, showing agreeable results
between the viscosity and SEI of PECs in Figure 4.18. The only previous rheological measurements
conducted on CS-CRG PECs were carried out by Shumilina et al. (2002) 21. Measurements were
performed at strains no larger than 0.01 % and in the oscillating regime at broader frequencies ranging
from 0.001 to 40 Hz (0.0063 to 251 rad/s). They observed that the mechanical properties were
significantly affected by the concentration of CS but not by the concentration of λ-carrageenan. In
addition, the PEC gels produced from κ- and ι-CRG with CS were stronger but also more brittle than
the CS/λ-CRG PEC gels. However, the κ-CRG and ι-CRG were more sensitive to temperature changes
and showed a significant reduction in viscosity at higher temperatures. The sensitivity was caused by
the change in structural conformation of CRG from helix-to-coil transition at 30-40 °C. Although in
theory, λ-CRG has more sulfate groups per monomer of CRG to form more electrostatic interactions,
the crosslinks induced by the helix in κ-CRG and ι-CRG appeared to induce a greater effect on the gel
strengths than the effect of the number of electrostatic interactions did.
Chapter 4 – Polyelectrolyte Complex Gels
71
4.4.6.5 Desired PEC Viscosity for Producing Freeze-Dried Scaffolds
Florczyk et al. (2011) 211 recommended that the viscosity of the chitosan-alginate PEC slurry should be
below 300 Pa.s to produce uniform pores in scaffolds because the migration of growing ice crystals
becomes difficult at high viscosity leading to large and irregular pores. The polyelectrolyte complexes
produced at pH 3-7 showed the highest yield but did not have suitable viscosities for the production
of uniform freeze-dried PEC scaffolds. According to the measured viscosities, the most appropriate pH
candidates for uniform scaffold production of CS-CRG PEC gels would be those prepared at pH 7.4 and
above. Hence, the best results to control porosity in freeze-dried scaffolds is to have the lowest
viscosity possible without compromising on the mechanical properties of the final freeze-dried
structure.
Lastly, the inter/intra-molecular crosslinking of the PEs is also another important parameter to
consider for the stability and the mechanics of films and scaffolds. The freeze-dried PECs prepared at
pH 3-5 used for FTIR, XRD and NCS analysis showed noticeably lower stability than those prepared at
higher pH. This may have been due to the greater intra-crosslinking but low inter-crosslinking caused
by the strong electrostatic interactions in low pH PECs. The formation and effect of inter and intra-
crosslinking aspect will be described in greater detail in Chapter 5 and Chapter 6.
4.4.6.6 The Effect of SEI was greater than the Effect of Composition and Moisture Content
on PEC Gel Viscosity
Overall, it can be concluded that the viscosities of the PEC gels were dominated by the electrostatic
interactions rather than the composition and moisture contents of the PECs (see red ellipses in Fig.
4.18 and Fig. 4.19). The increase in pH from 5-8 led to a lower strength of electrostatic interaction and
consequently a lower viscosity (Fig. 4.18). Although the interaction strength was reduced by increasing
pH, the composition was unchanged over the pH range of 3-8 (Fig. 2.2). Unexpectedly, the moisture
content appeared not to be dependent on the composition of the PECs prepared at pH 3-8. Nor did
the moisture content show a significant effect on the viscosity. This can be confirmed at pH 5 and 6,
where the viscosity of the PEC gel at pH 5 was about two orders of magnitude higher than the gel at
pH 6, and the moisture contents and compositions were approximately the same. The PECs prepared
at pH 9-12 exhibited an increase in the fraction of CS and the moisture content but changed the
viscosity only very little when compared to the substantial viscosity change caused by the electrostatic
interactions from pH 5 to 6. However, the SEI at pH 6 did not match with the viscosity measurement,
and therefore it is important to note that the SEI results from the ζ-potential measurements can only
provide an approximate prediction of the strength of PEC interactions. The solid content of the PEC
gel measured at pH 6 was shown to be nearly as high as the PEC gels prepared at pH 3 and 4 (Fig. 4.10).

Chapter 4 – Polyelectrolyte Complex Gels
72
However, the viscosity of the PEC gels prepared at pH 3 and 4 were almost two orders of magnitude
higher than the PEC prepared at pH 6. Nonetheless, it would be interesting to further investigate the
effect of moisture and solid content on the viscoelastic properties by adjusting the water content of
the PEC gels.
Figure 4.18 – Viscosities and strength of electrostatic interactions of CS-CRG PEC gels prepared at various pHs.
Figure 4.19 – Molar composition and moisture content of CS-CRG PEC gels prepared at various pHs.
-1000
-500
0
500
1000
1500
2000
0
0.5
1
1.5
2
2.5
3
3.5
3 4 5 6 7 8 9 10 11 12
Stre
ngt
h o
f El
ectr
ost
atic
Inte
ract
ion
(SE
I),
mV
2
log 1
0V
isco
sity
(P
a.s)
, AU
pH
Viscosity SEI
0
2000
4000
6000
8000
10000
12000
14000
16000
18000
0
10
20
30
40
50
60
70
80
90
100
3 4 5 6 7 7.4 8 9 10 11 12
Mo
istu
re C
on
ten
t, %
Mo
lar
Co
mp
osi
tio
n, %
pH
CS CRG % Moisture

Chapter 4 – Polyelectrolyte Complex Gels
73
Finally, a proposed structure of the PEC gels prepared at different pHs is illustrated below in Figure
4.20. The strong interaction between PEs when reacted at low pH results in very dense complexes
with low moisture content and high fibrous structure which may restrict the sliding of the PEC units
and ultimately increases the PEC viscosity. The proposed structure of PEC gels was devised from visual
assessment, optical microscopy, moisture content and rheology.
Figure 4.20 – Proposed structure of PEC gels devised from visual assessment, optical microscopy, moisture content and rheology.

Chapter 4 – Polyelectrolyte Complex Gels
74
4.5 Conclusions
This chapter described the production and characterisation of crosslinker-free CS-CRG PEC gels.
Various pHs (2-12) were investigated. Overall, it was shown that the pH affected the charge of CS
significantly which affected the overall SEI between CS and CRG complex gels. The SEI was predicted
using ζ-potential measurements and corroborated with the viscosity, which provided a direct measure
of the strength of self-crosslinking. Overall it was found that the self-crosslinking was high at pH 3-5
and low at pH 6-12. The self-crosslinking of the PEC gels was found to be the highest at pH 5. This was
confirmed by the highest SEI, yield, solid content, and viscosity measurements. The strength of
interaction reduced when the pH was decreased or increased, due to the protonation of CRG and
deprotonation of CS, respectively. From the results, it was shown that the viscosity was mainly
influenced by the SEI and not by the composition or moisture content (3 ≤ pH ≤ 7). The high SEI at low
pH resulted in the formation of fibrous precipitates caused by the strong self-crosslinking and the
vigorous mixing. FTIR and XRD confirmed complex formation in PECs prepared at pH 3-7.4. The
composition measured with NCS analysis was found to remain relatively the same from pH 3-8 at
approximately 1:1 molar ratio between CS and CRG. In total, the amount of CS in PEC was found to be
in excess, however the amount of CRG on the surface of the PEC was dominating. Therefore, the
composition was unaffected when the SEI was reduced. The composition was only changed
significantly from pH 9 and above, because of the inclusion of the neutralised CS to the PECs.
The next chapter will present the inter-relationship between the viscosity of the gels and the
mechanics of films prepared at various pHs. Electrostatic self-crosslinking may be an ideal alternative
to control the mechanics and stability of films used for medical applications. If the physicochemical
properties of PEC films can be controlled, then the film materials may be used as promising crosslinker-
free biomaterials.

Chapter 5 – Polyelectrolyte Complex Films
75
Chapter 5 – Polyelectrolyte Complex Films
5.1 Introduction
A polyelectrolyte complex (PEC) film is a flexible two-dimensional (2-D) strip made from complexed
macromolecules 212. The study of films is a useful way to determine the physicochemical and biological
properties of the struts from complex three-dimensional (3-D) scaffolds. These strut models are
essential for the development of new materials and complex structures with tailored surface
properties 213. The measurements of intrinsic properties of different scaffold materials can be difficult.
This is because the porosity and pore sizes in scaffolds can vary significantly from one material to
another and could drastically influence the bulk properties 214.
In Chapter 4 it was shown that the composition of PECs and the strength of electrostatic interaction
(SEI) affected the form of the PEC gels. Precipitate complex fibres were obtained when the CS and CRG
PEs interacted in their fully ionic state i.e. at low pH (< pH 7). In contrast, a homogeneous complex
coacervate was formed when CS was weakly charged i.e. at high pH (> pH 7).
The initial response of the body to the biomaterial will not only depend on the composition of the
material but also on the topography of its surface 30,215,216. Surface properties may be modified using
a layer-by-layer method to enhance the cell-material interactions 217. However, the limitation is that
many dipping cycles are needed to fill the matrix material which makes the layer-by-layer method
time consuming 127. For these reasons, polyelectrolyte complex (PEC) films have been proposed as
materials which may be functional both from a mechanical perspective and have surface functionality.
In this chapter, the tensile properties of films produced from the various PECs produced at different
pH were measured and correlated with the viscosity of gels. It is envisaged that the PECs prepared at
various pHs will provide different PEC film stabilities, since the nature of the self-crosslinking will be
dependent on the types of interactions present in the PECs, such as electrostatic (intra-crosslinking)
or secondary interactions (inter-crosslinking) 5,69. In this thesis, inter-crosslinking is defined as the
interaction between the PEC molecules forming a network via entanglements, whereas, intra-
crosslinking is the formation of PEC molecules without forming a network. Solvent casting PEC gels
prepared at different pH conditions may provide tailorable PEC films that possess adequate stiffness
and strength without the need for chemical crosslinking.

Chapter 5 – Polyelectrolyte Complex Films
76
The objectives of this chapter were to investigate:
1. The preparation of CS-CRG PEC films produced at different pH conditions.
2. The water absorption capacity and stability of films.
3. The surface properties of films using SEM.
4. The mechanical properties of films using a tensile testing machine.
5.2 Materials and Methods
5.2.1 Preparation of CS, CRG and PEC Films
CS and CRG films were prepared based on the method reported by Carneiro et al. (2013) 147. In brief,
CS solution was produced by dissolving CS 2 % w/v in 0.16 M HCl for 24 hours. CRG solution was
produced by dissolving CRG 2 % w/v in ultrapure type 1 water for 24 hours followed by 1 hour of
heating at 60 °C. CS films were fabricated by casting 9 ml of the CS solution in round silicone moulds
with a diameter of 54 mm using a 5-ml transfer pipette. CRG films were fabricated by casting 8 ml of
CRG solution at 60 °C into round preheated Teflon® moulds with a diameter of 50 mm. Teflon® moulds
were pre-heated in the oven to 60 °C to avoid early jellification of CRG and to ensure the production
of uniform films. Furthermore, the polyelectrolyte solutions were pipetted slowly to prevent the
formation of air bubbles within the films. PEC films were prepared by adding appropriate amounts of
ultrapure type 1 water to the homogenised PEC gels developed in Chapter 4, to produce PEC
suspensions of 2 wt. % prior to solvent casting. Also, the solid contents of the PEC gels can be found
in Chapter 4. The pH of the diluted PEC gels was recorded, and 8 ml of PEC solution prepared at
different pH values (3, 5, 7.4 and 9), was pipetted into round Teflon® moulds with a diameter of 50
mm. The solutions were then dried in a humidified cell incubator (CO2 Incubator, BB 15,
ThermoScientific, USA) for two weeks. The humidity in the cell incubator was maintained using 100
ml of ultrapure type 2 water inside a 100-ml glass beaker. After drying, the CS and CRG films were
immersed in 1 M NaOH and 1 M KCl solutions respectively for 24 hours using a shaker at 100 rpm and
subsequently washed with ultrapure type 1 water for 1 hour and 1 min respectively using a shaker at
100 rpm. The dried PEC films did not require further treatment. All films were ultimately left to dry in
air for 24 hours followed by freeze-drying (VirTis, SP Scientific, AdVantage 2.0 BenchTop, UK) for 17.5
hours using the programme shown in Table 5.1.

Chapter 5 – Polyelectrolyte Complex Films
77
Table 5.1 – Freeze-drying protocol used for drying small-sized film materials.
Temperature (°C) Time (min) Ramp/ Hold Pressure (Torr)
Start 20 10 R 760
Ramp/ Cooling -20 60 R 760
Anneal -20 120 H 760
Dry -20 60 H 0.08
Dry 0 900 H 0.08
Dry 20 30 R 0.08
Stop 20 60 H 0.08
5.2.2 Preparation of Collagen Films
Type I collagen films from bovine Achilles tendon (Sigma) were prepared based on the method
reported by Grover et al. (2012) 213,218. The solubilised and homogenised collagen slurry (1 % w/v) in
0.05 M acetic acid was placed in silicone moulds at a volume of 9 ml. The films were dried in a
humidified incubator for two weeks. Some of the dried collagen films were crosslinked using 1.150 g
1-ethyl-3-(3-dimethylaminopropyl) carbodiimide hydrochloride (EDC) and 0.276 g N-hydroxy-
succinimide catalyst (NHS, both Sigma–Aldrich) in 70 % ethanol/water (v/v) per gram of film. The
collagen films were crosslinked for 24 h and washed twice and thrice with 70 % ethanol and ultrapure
type 1 water, respectively. The films were then dried overnight in a laminar flow hood followed by
freeze-drying using the protocol presented in Table 5.1.
5.2.3 Swelling and Dissolution
The effect of pH on the PEC stability was determined using swelling and dissolution experiments.
These experiments investigate the individual CS and CRG films and the PEC films prepared at pH 3, 5,
7.4 and 9. Circular films (ø 8 mm) were produced using a disposable biopsy punch (Kai, UK). Sample
triplicates were submerged in PBS (0.01 M, pH 7.4) at a sample/PBS ratio of 2 mg/ml and incubated at
37 °C for 28 days. The mass of the samples was measured at different time intervals (1 h, 6 h, 24 h, 3
d, 7 d, 10 d, 14 d, 21 d and 28 d). The wet (swollen) mass (mw) of the films was measured after gently
dabbing the wet films on tissue paper to remove any excess water on the surface. The mass loss was
then found when the films were dried using a freeze-drier for 17.5 hours (Table 5.1) until a constant
mass was reached (md). The final dry mass was recorded using a microbalance (Mettler Toledo, XPE
analytical, Switzerland) that is accurate to ± 0.1 mg. Swelling of films was reported in terms of water
absorption:

Chapter 5 – Polyelectrolyte Complex Films
78
𝑊𝑎𝑡𝑒𝑟 𝐴𝑏𝑠𝑜𝑟𝑝𝑡𝑖𝑜𝑛, % = 𝑊𝑒𝑡 𝑀𝑎𝑠𝑠 (𝑚𝑤) − 𝐷𝑟𝑦 𝑀𝑎𝑠𝑠 (𝑚𝑑)
𝐷𝑟𝑦 𝑀𝑎𝑠𝑠 (𝑚𝑑) × 100 (5.1)
The percentage mass loss was calculated using the equation below:
𝑀𝑎𝑠𝑠 𝐿𝑜𝑠𝑠, % = 𝐼𝑛𝑖𝑡𝑖𝑎𝑙 𝑀𝑎𝑠𝑠 (𝑚0) − 𝐷𝑟𝑦 𝑀𝑎𝑠𝑠 (𝑚𝑑)
𝐼𝑛𝑖𝑡𝑖𝑎𝑙 𝑀𝑎𝑠𝑠 (𝑚0) × 100 (5.2)
where m0 is the initial dry mass of the sample and where md is the dried mass of the sample at a
different time interval. The acidic or alkaline by-products of the films were also determined during the
swelling and dissolution study, using pH measurements. Photographs of the dried films were taken at
days 0 and 28 using a Canon EOS 5D camera, Japan.
5.2.4 Enzymatic Degradation
Cylindrical films of CS, CRG and PECs prepared at pH 3, 5, 7.4 and 9 were cut using a biopsy punch (ø
8 mm). The films were submerged in PBS (0.01 M, pH 7.4) containing 1.5 µg/ml lysozyme (hen egg-
white, 70,000 U/mg, Sigma-Aldrich, UK) and incubated at 37 °C for 28 days with shaking at 100 rpm
(KS 4000 IC Control, IKA, Germany). The concentration of lysozyme was chosen to closely match the
concentration of lysozyme present in human serum according to Porstmann et al. (1989) 219. The
lysozyme solution was refreshed every other day to ensure continuous enzyme activity. The mass of
the samples was measured at different time intervals (24 h, 7 d, 14 d, 21 d and 28 d). The films were
then rinsed with ultrapure type 1 water and the dry mass was found by removing excess water by
lyophilization using the programme presented in Table 5.1. The final dry mass was recorded using a
balance (XPE analytical, Mettler Toledo, Switzerland) that is sensitive to ± 0.1 mg. Photographs of the
dried films were taken at days 0 and 28 using a Canon EOS 5D camera, Japan. The percentage mass
loss was calculated using the equation below:
𝑀𝑎𝑠𝑠 𝐿𝑜𝑠𝑠, % = 𝐼𝑛𝑖𝑡𝑖𝑎𝑙 𝑀𝑎𝑠𝑠 (𝑚0) − 𝐷𝑟𝑦 𝑀𝑎𝑠𝑠 (𝑚𝑑)
𝐼𝑛𝑖𝑡𝑖𝑎𝑙 𝑀𝑎𝑠𝑠 (𝑚0) × 100 (5.3)
5.2.5 Scanning Electron Microscopy
Small sections of PEC films were mounted on 12 mm SEM stubs and sputter-coated (Emitech K575
sputter-coater, UK) with platinum for 50 seconds using a deposition current of 40 mA to increase the
surface conductivities of the PEC films. The surface morphologies of the films were then imaged with
secondary electrons (SE) using an SEM (FEI Nova Nano SEM 450, The Netherlands). The surface
roughness of PE and PEC films was compared at 500 x magnification. A voltage of 5 kV and a working

Chapter 5 – Polyelectrolyte Complex Films
79
distance of approximately 5 mm with a relatively small (2.5 nm) spot size (to increase resolution) were
used to image the morphological structure of PEC films at 0 and 28 d dissolution time points.
5.2.6 Contact Angle Measurements
The droplet contact angle on film surfaces was measured using a sessile drop method. A face
positioned HD Camera (Canon EOS 5D, Japan) with a 100-mm macro lens was positioned on the
droplet. A 5 µl droplet of ultrapure type 1 water was placed on the horizontal surface of each film
using a 20 µl pipette and observed with a camera positioned at a fixed horizontal angle and stable
platform. The contact angle measurements of the water droplets on the film surfaces were obtained
using a contact time of 60 seconds. The water contact angles were analysed using the protractor tool
in SketchUp. The measurements were carried out in triplicate.
5.2.7 Mechanical Tensile Testing
The mechanical properties of films were evaluated using a Hounsfield tensile tester (Hounsfield, H5KS
Materials Tester, USA) equipped with interchangeable load cells of 5 N and 250 N. The 5 N load cell
was used for all the materials except for chitosan, XL collagen and nX collagen which were tested with
a 250 N load cell. The ultimate tensile strength was used to determine the effect of pH on the extent
of self-crosslinking of PECs. All film samples were immersed in PBS (0.01 M, pH 7.4) for 24 hours at RT
and cut into rectangular samples of 26 mm in length and 7 mm in width using a scalpel. Subsequently,
the films were rehydrated in PBS, and the sample thickness was measured five times along the gauge
length (10 mm) of the film using a digital micrometer (Mitutoyo, Japan) to obtain a mean thickness
value. The screw of the micrometer was only moderately tightened to prevent damage to the wet
films. The average thickness of all films combined was at 0.24 ± 0.19 mm. Similarly, the grips of the
Hounsfield tester holding the films were finger-tightened to avoid both slippage and breakage of the
wet films at the grips. A preload of 0.01 N was used to align the films before the loading measurements
were started. All tests were performed at room temperature, and a constant extension rate of 6 mm
min-1 was used. All samples were stretched until failure and materials that failed at the grips were
discounted. The tensile strength (TS, MPa) was measured by dividing the maximum breaking force (N)
by the cross-sectional area (mm2) of each film. The linear region of the stress-strain curves was used
to calculate the Young’s modulus (E, GPa). The elongation at break (EB, %) was measured using a laser
extensometer (Hounsfield 500L-270 with an error of 0.5 - 0.2 % with a strain range of 5 % - 85 % full-
scale deflection (FSD). The EB % is the ratio between the extension of the film at the point of rupture
to the initial length of the sample expressed in percentage. The reported data for each material was
the average of five measurements.

Chapter 5 – Polyelectrolyte Complex Films
80
5.3 Results
5.3.1 Swelling
The ability of the materials to swell during cell culture or implantation was monitored at regular time
points in PBS buffer. The results showed that the swelling of all films increased with longer incubation
times, but reached their maximum swelling within 24 hours (Fig. 5.1). This demonstrates a time-
dependent nature of swelling from 0 h to 24 h for all materials. The water absorption within the first
hour was around 100 % for CS, 2100 % for CRG, 110 % for pH 3 PEC and 160 % for pH 9 PEC. It was
found that the amount of water absorbed by CRG was 21 times greater than the quantity absorbed by
CS within the first hour of swelling. The extent of water absorption of the PEC films was changed and
remained the same after 24 hours, showing the highest swelling at pH 3 (550 %) and lowest at pH 9
(200 %). PEC pH 3 absorbed about twice as much water than the PECs prepared at pH 5 and 7.4 and
three times more than the PEC prepared at pH 9. The water absorption in CS films remained constant
at 100 % after being submerged in PBS for 28 days, whereas the CRG film was fully dissolved within
six hours.
Figure 5.1 - Water absorption of films in PBS pH 7.4 over a 28-day period.
5.3.2 Dissolution
For most of the materials, the maximum dissolution occurred within 24 hours (Fig. 5.2). CRG was fully
dissolved after six hours, but only 2.9 % of the total mass was lost from CS within 24 hours. A slightly
higher mass loss was recorded for the PECs compared to the CS. The largest mass loss in PECs within
0
100
200
300
400
500
600
700
1 h 6 h 24 h 3 d 7 d 10 d 14 d 21 d 28 d
Wat
er A
bso
rpti
on
, %
Time, days
CRG
pH 3
pH 5
pH 7.4
pH 9
CS
CR
G t
o 2
10
0 %
CR
G d
isso
lved
CR
G d
isso
lved
CR
G d
isso
lved
CR
G d
isso
lved
CR
G d
isso
lved
CR
G d
isso
lved
CR
G d
isso
lved
CR
G d
isso
lved

Chapter 5 – Polyelectrolyte Complex Films
81
28 days was found to be for the PEC pH 3 (18.3 %). The PECs prepared at pH 9 showed the lowest mass
loss (~ 0 %) for the duration of the study.
Figure 5.2 –Dissolution profile of the CS and PEC films samples prepared at pH 3, 5, 7.4 and 9 using PBS.
The films used in the dissolution study were washed and freeze-dried (Fig. 5.3). It can be seen that the
CRG and CS films were transparent and opaque at 0 days respectively, whereas the PEC films exhibited
opaqueness. After 28 days of dissolution, the PEC films increased in size and became more opaque
due to the surface porosity. The CS and PEC films did not change significantly in morphology after 28
days of dissolution. All films were highly flexible when swollen. The PEC films at lower pH (3 and 5)
exhibited a higher macroscopic roughness than the CS and PEC films prepared at high pH (7.4 and 9).
Figure 5.3 – Freeze-dried films after 0 and 28 days of dissolution.
-10
0
10
20
30
0 2 4 6 8 10 12 14 16 18 20 22 24 26 28
Mas
s Lo
ss, %
Time, days
CRG
pH 3
pH 5
pH 7.4
pH 9
CS
CR
G t
o 1
00
%

Chapter 5 – Polyelectrolyte Complex Films
82
5.3.3 PEC Films pH Measurements
The pH of the PBS buffer was measured during the dissolution study of the films. It was found that the
pH of the PBS buffer did not change significantly for most of the materials tested (Fig. 5.4). The
greatest change in pH was exhibited by the PEC films prepared at pH 3 and 5, where the pH of the PBS
changed from pH 7.4 to pH 7.14 within 6 hours. The PEC film prepared at pH 7.4 showed a slight
reduction in pH to 7.26 within 28 days. For the rest of the samples (PEC pH 9, CS and CRG), the pH
values of the PBS remained almost unchanged for the duration of the study, reaching a plateau
between pH 7.3 and pH 7.5 after 3 days. The pH of the PBS buffer above remained relatively constant
between pH 7.4 and pH 7.5.
Figure 5.4 – Solution pH measurements of the PBS-buffer during the swelling and dissolution study of the film samples.
5.3.4 Enzymatic Degradation
The degradation profile of CS and the PEC films prepared at pH 3, 5, 7.4 and 9 are shown in Figure 5.5.
The PECs prepared at lower pH exhibited a higher rate of mass loss than those prepared at high pH.
No mass loss in films was found on the first day, except for the PECs prepared at pH 3, with a mass
loss of 25 %. The CS and PEC films made at pH 7.4 and pH 9 exhibited the least mass loss (1 %)
throughout the duration of the study. The pH 3 and pH 5 PEC films exhibited the highest mass loss
within 28 days at 70 % and 30 %, respectively.
6.9
7
7.1
7.2
7.3
7.4
7.5
7.6
7.7
0 2 4 6 8 10 12 14 16 18 20 22 24 26 28
pH
Time, days
CRG
pH 3
pH 5
pH 7.4
pH 9
CS
pH PBS

Chapter 5 – Polyelectrolyte Complex Films
83
Figure 5.5 – Enzymatic degradation profile of CS and PEC films prepared at pH 3, 5, 7.4 and 9 using PBS and lysozyme.
The films used in the enzymatic degradation study were washed and freeze-dried after 28 days of
degradation (Fig. 5.6). Nearly all the materials changed significantly in morphology from a translucent
appearance to a rough white surface after 28 days. It can be easily observed that the CRG films showed
the largest reduction in size and changed from a white translucent appearance to a soluble polymer.
The pH 3 PEC films showed a significant amount of enzymatic degradation and the films turned to
orange-brown.
Figure 5.6 – Freeze-dried films after 0 and 28 days of degradation.
-20.0
0.0
20.0
40.0
60.0
80.0
100.0
0 2 4 6 8 10 12 14 16 18 20 22 24 26 28
Mas
s Lo
ss, %
Time, days
pH 3
pH 5
pH 7.4
pH 9
CS

Chapter 5 – Polyelectrolyte Complex Films
84
5.3.5 Scanning Electron Microscopy
The surface morphology of the as-cast PE and PEC films were imaged using an SEM (Fig. 5.7). Almost
all films, except for CS, appear smooth and uniform microscopically. The CRG film displayed the
clearest and smoothest surface.
Figure 5.7 – SEM micrographs of the film surfaces at 0-day dissolution. Materials from top left to bottom right: CRG, pH 3, pH 5, pH 7.4, pH 9 and CS. The micrographs are shown at a magnification of 500x, and the scale bar is 100 µm. The micrograph of CRG film is shown at a magnification of 1000x, and a scale bar is 50 µm.
The SEM micrographs of the PE and PEC films incubated in PBS for 28 days showed rougher surfaces
than the as-cast materials (Fig. 5.8). The pH 3, pH 5 and CS films were rougher than the pH 7.4 and pH
9 films. It was also observed that the micro-fibres protruding from the CS film surface became more
prominent after 28 days of dissolution.
Figure 5.8 – SEM micrographs of the film surfaces after 28 days of dissolution. Materials from top left to bottom right: CRG, pH 3, pH 5, pH 7.4, pH 9 and CS. The micrographs are shown at a magnification of 500 x, and the scale bar is 100 µm.

Chapter 5 – Polyelectrolyte Complex Films
85
5.3.6 Contact Angle Measurements
Glass and polystyrene (PS) surfaces were selected as a reference for hydrophilic and hydrophobic
controls, respectively. Figure 5.9 shows that the contact angle measurements between the droplets
and the surfaces of the films were the lowest for glass (31°± 9°) and the highest for polystyrene (69° ±
3°). The maximum contact angle for the prepared films was found on CS (58° ± 14°) and lowest on CRG
(38° ± 6°). All PEC films prepared were relatively similar in contact angles (40° - 50°) and within error.
Figure 5.9 – Contact angle measurements of water droplets on film samples. Mean ± SD, n = 3.
0
10
20
30
40
50
60
70
80
90
CRG pH 3 pH 5 pH 7.4 pH 9 CS Glass PS
Co
nta
ct A
ngl
e, Ѳ
Material

Chapter 5 – Polyelectrolyte Complex Films
86
5.3.7 Mechanical Tensile Testing
The stress-strain curves for all the materials were compared with the crosslinked (XL) and non-
crosslinked (nX) collagen films (Fig. 5.10). Overall, the collagen films exhibited higher stiffness or
Young’s modulus (E) and ultimate tensile strength (UTS) than the PE and PEC films. The crosslinked
collagen showed the highest E and UTS of all materials but was three times less extensible than non-
crosslinked collagen. With regards to the polysaccharides, CS films exhibited a higher E and UTS than
the CRG and PEC films. The CRG films showed the lowest E and UTS. However, the elongation at break
(EB) for CRG was rather high in comparison with the other materials tested. Overall, the mechanical
properties of the PEC films were found to be in between the properties of CS and CRG films. The PECs
prepared at higher pH showed greater E and UTS than the PECs prepared at lower pH.
Figure 5.10 - Tensile-strain curves of films using 5 N load cell with a constant extension rate of 6 mm min-1. Note that the
stiffest materials (CS, XL Coll and nX Coll) were tested with a 250 N load cell at identical conditions.
0
2
4
6
8
10
12
0 5 10 15 20 25 30 35 40
Stre
ss, M
Pa
Strain, %
XL Collagen
nX Collagen
CRG
pH 3
pH 4
pH 5
pH 6
pH 7
pH 7.4
pH 8
pH 9
CS
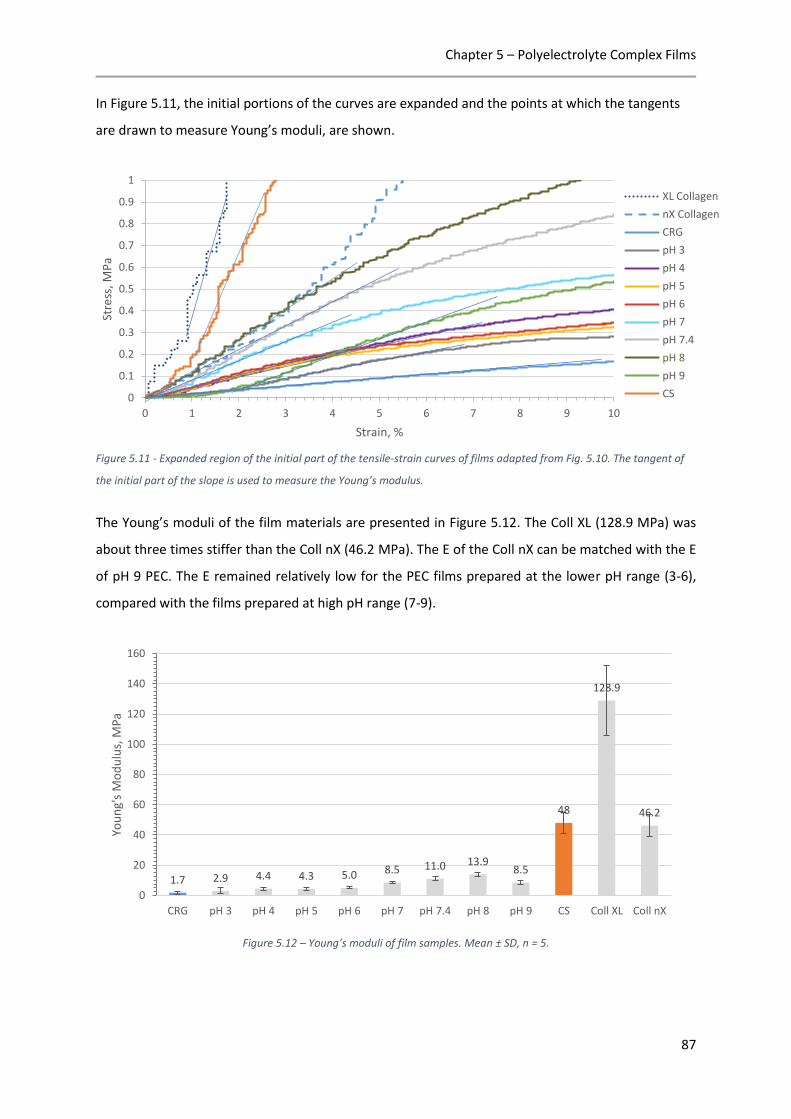
Chapter 5 – Polyelectrolyte Complex Films
87
In Figure 5.11, the initial portions of the curves are expanded and the points at which the tangents
are drawn to measure Young’s moduli, are shown.
Figure 5.11 - Expanded region of the initial part of the tensile-strain curves of films adapted from Fig. 5.10. The tangent of
the initial part of the slope is used to measure the Young’s modulus.
The Young’s moduli of the film materials are presented in Figure 5.12. The Coll XL (128.9 MPa) was
about three times stiffer than the Coll nX (46.2 MPa). The E of the Coll nX can be matched with the E
of pH 9 PEC. The E remained relatively low for the PEC films prepared at the lower pH range (3-6),
compared with the films prepared at high pH range (7-9).
Figure 5.12 – Young’s moduli of film samples. Mean ± SD, n = 5.
0
0.1
0.2
0.3
0.4
0.5
0.6
0.7
0.8
0.9
1
0 1 2 3 4 5 6 7 8 9 10
Stre
ss, M
Pa
Strain, %
XL Collagen
nX Collagen
CRG
pH 3
pH 4
pH 5
pH 6
pH 7
pH 7.4
pH 8
pH 9
CS
1.7 2.9 4.4 4.3 5.0 8.5 11.0 13.98.5
48
128.9
46.2
0
20
40
60
80
100
120
140
160
CRG pH 3 pH 4 pH 5 pH 6 pH 7 pH 7.4 pH 8 pH 9 CS Coll XL Coll nX
You
ng'
s M
od
ulu
s, M
Pa
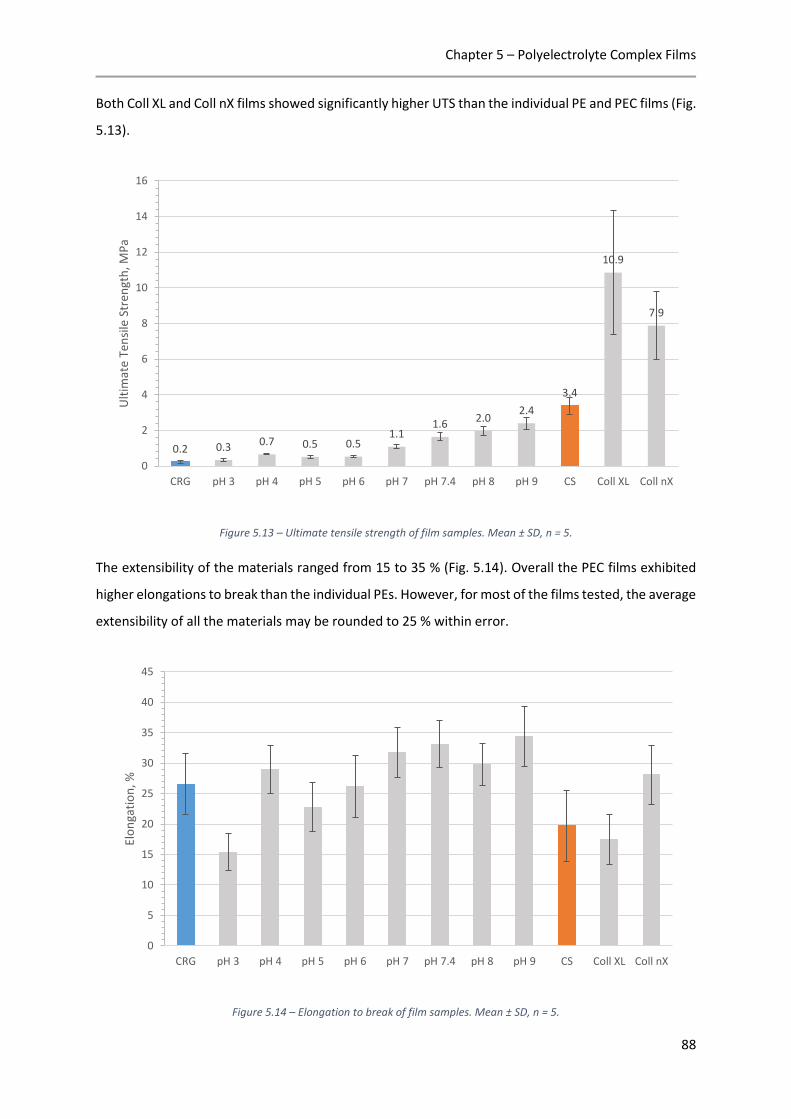
Chapter 5 – Polyelectrolyte Complex Films
88
Both Coll XL and Coll nX films showed significantly higher UTS than the individual PE and PEC films (Fig.
5.13).
Figure 5.13 – Ultimate tensile strength of film samples. Mean ± SD, n = 5.
The extensibility of the materials ranged from 15 to 35 % (Fig. 5.14). Overall the PEC films exhibited
higher elongations to break than the individual PEs. However, for most of the films tested, the average
extensibility of all the materials may be rounded to 25 % within error.
Figure 5.14 – Elongation to break of film samples. Mean ± SD, n = 5.
0.2 0.3 0.7 0.5 0.51.1
1.6 2.02.4
3.4
10.9
7.9
0
2
4
6
8
10
12
14
16
CRG pH 3 pH 4 pH 5 pH 6 pH 7 pH 7.4 pH 8 pH 9 CS Coll XL Coll nX
Ult
imat
e Te
nsi
le S
tren
gth
, MP
a
0
5
10
15
20
25
30
35
40
45
CRG pH 3 pH 4 pH 5 pH 6 pH 7 pH 7.4 pH 8 pH 9 CS Coll XL Coll nX
Elo
nga
tio
n, %

Chapter 5 – Polyelectrolyte Complex Films
89
5.4 Discussion
5.4.1 Structural Properties
5.4.1.1 PEC Films Crosslinking: Inter/Intra-Crosslinking
Chemical crosslinking has a significant effect on the swelling and stability of materials. Typically, a
higher degree of crosslinking results in a lower degree of swelling and greater stability in the material
36,220. In this study, it was found that the swelling and stability of the PEC materials were mainly
influenced by the composition and the crosslinking type. The crosslinking type can be divided into
inter and intra-crosslinking. The intra-crosslinking is the strong and direct electrostatic binding
between the PEs, whereas the inter-crosslinking is the weaker secondary interactions and
entanglement between the PEC units 189. However, it is the latter type that provides the overall
stability of the solid material since it keeps the macromolecules interconnected. The diagram in Figure
5.15 shows the effect of pH on the formation of inter and intramolecular interactions. Four possible
structure scenarios can occur when the PEC films are produced at various pHs.
5.4.1.2 Interaction at pH 2-3
At pH 2-3, the CS and CRG macromolecules are known to be degraded by the acidic conditions which
result in the reduction of the molecular weight of PE chains 196,221. The degradation of the individual
polymers was not measured with GPC in this thesis, but the degradation of PECs prepared at pH 3 was
indirectly observed by the browning effect of the films in the degradation study. The decrease in PE
chain lengths may reduce the number of entanglements and inter-crosslinking which results in
unstable structures (Fig. 5.15 (a)) 185. Also, the formation of more interstitial gaps in the PEC structure
results in greater water absorption in the film.
5.4.1.3 Interaction at pH 4-5
At pH 4-5, the macromolecules are likely to be longer than at pH 2-3 due to the less extreme pH
conditions that result in the degradation of the molecules. The macromolecular chains are likely to be
extended when the solid PE is dissolved in the aqueous solution due to the high electrostatic repulsion
caused by the high charge density within each PE (Fig. 5.15 (b)) 200,222. This extension of chains was
also indirectly observed by the increase in solution viscosities during the dissolution of the individual
PEs. Since the pH range is between the pKa values of both PEs, the materials were fully dissociated.
Therefore, the interaction between the oppositely-charged materials is stronger which may result in
more intra-crosslinking than inter-crosslinking as evidenced by the non-stable PEC precipitates

Chapter 5 – Polyelectrolyte Complex Films
90
formed. Such PEC structures formed are known as ladder-like and can lead to the formation of
heterogeneous complex precipitate gels 120. However, some intermolecular binding is likely to exist,
since entanglements between PEs are inevitable even at highly ionised states 6. In Chapter 4 it was
shown that the strong strength of electrostatic interaction (SEI) in the PECs prepared at pH 2-5
(Fig. 4.5) resulted in the formation of heterogeneous fibrous PEC gel precipitates (Fig. 4.6 and 4.7).
Hence, the solvent-cast PEC films prepared at low pH were inherently rough in macroscale (Fig. 5.3).
The strong intra-crosslinking of PEs at low pH may have resulted in the exclusion of water upon drying
which led to the reduction of the volume occupied by the polymers in the films and the creation of
local ridges and pores 147. However, the individual PE films, especially CRG (Fig. 5.3) exhibited
transparent and smooth surfaces like those produced by Lima et al. (2013) 20. CRG films were
transparent because they are amorphous and the CS films were opaque due to their semi-crystalline
nature 223. The PEC films were mostly transparent due to their relatively amorphous structure as was
depicted from XRD results (Fig. 4.14). Freeze-drying has also induced porosity in the films, turning
them opaque. Previous results also confirmed that CS films were slightly yellow in appearance and
were found to be robust and rubbery when hydrated 224.
5.4.1.4 Interaction at pH 6-8
At pH 6-8, CS becomes deprotonated as was derived with zeta potential measurements (Fig. 4.4) and
therefore loses its high charge density which is likely to form a random coil-like structure
(Fig. 5.15 (c)). Nonetheless, some charges remain within CS up to pH 8 as was previously proved by
the zeta potential measurements (Fig. 4.4). As a result, the electrostatic interactions between the PEs
decreases and the entanglements and secondary forces such as hydrogen bonding between hydroxyl
groups dominate 34,56,133. Therefore, the inter-crosslinking of the materials increases which results in
the formation of more stable PEC films. The PEC structure formed is known as the scrambled egg-like
model and may give rise to the formation of homogeneous complex coacervate gels 120,225. The weak
electrostatic interaction led to strong inter-crosslinking at high pH. The inter-crosslinks are responsible
for the stable structure that resists uniaxial tension. Therefore, the PEC films prepared at high pH
range were higher in stiffness and strength compared to the PECs prepared at lower pH.
5.4.1.5 Interaction at pH 9-12
At pH 9-12, the electrostatic interaction between CS and CRG is completely diminished due to the
complete deprotonation of CS. The inability of CRG to bind to the CS reduces the complex yield as was
previously shown in Figure 4.8. It has been demonstrated that when the CS becomes fully neutralised,
it precipitates on top of any remaining complex (Fig. 5.15 (d)). This precipitation was observed by the

Chapter 5 – Polyelectrolyte Complex Films
91
NCS elemental analysis which showed the increase in the fraction of CS at higher pH (Fig. 4.13) and
the inability to see the electrostatic complexing with FTIR (Fig. 4.14). The increase in CS content also
reduces the water absorption, because CS is less hydrophilic than CRG. The PEC gels and films
produced at this pH are more homogeneous than the PECs produced at low pH.
Figure 5.15 – Schematic diagram showing the inter and intra-crosslinking of CS-CRG PECs at various pHs.
In summary, the PECs produced at higher pH range were more inter-crosslinked than the PECs
prepared at lower pH. This can be supported by various experimental observations such as the low
stability (Fig. 5.2), stiffness (Fig. 5.12) and dense fibrous precipitate structure formed in PECs prepared
at low pH (Fig. 4.7). In contrast, the PEC films prepared at high pH contained a higher fraction of CS
and were more stable. The high pH PEC films also absorbed less water, exhibiting homogeneous
complex coacervate gels and film surfaces.

Chapter 5 – Polyelectrolyte Complex Films
92
5.4.2 Stability
5.4.2.1 Swelling of Films
The swelling of PEC films within 24 hours ranged between 200 % and 550 % for pH 9-3. The water
absorption of CS and PEC pH 7.4 films was found to be at 100 % and 250 %, respectively. In comparison
with the materials tested in this study, crosslinked collagen scaffold material previously prepared by
Davidenko et al. (2010) 226 was found to swell by 400 %. CRG is known to be very hydrophilic (Fig. 5.1
- 2100 % water absorption within 1 hour) due to the repulsion of its strongly negatively-charged sulfate
groups present on the macromolecules which result in an increase in chain distances 189. As a result,
the free volume of the molecules becomes larger, and the material becomes more permeable to
water 227,228. The driving force of water absorption in films was due to the difference in water potential
between the macromolecules and the aqueous phase.
5.4.2.2 Hydrophilicity of Film Surfaces
Contact angle measurements were carried out to find the hydrophilicity of the materials and to
support the swelling results. A surface is considered hydrophilic and hydrophobic when the water
contact angle is smaller and larger than 90°, respectively 229. The contact angles in this study confirmed
the hydrophobicity of the treated tissue culture plate polystyrene (69° ± 2.2°) and the hydrophilicity
of the glass surface (31° ± 9°). These values are in good agreement with the previous studies found
for treated polystyrene (65.5°) 230 and glass surfaces (24°) 231. The contact angle for non-treated PS
has been recorded at 90° 232. The CS (58° ± 14°) films exhibited higher drop contact angles compared
with the CRG films (38° ± 6°). Other researchers have found similar results for CS (50°) 233 and CRG
(40°) 234. It can be confirmed that the hydrophilicity of CRG is higher than the hydrophilicity of CS as
can be corroborated by the swelling study (Fig. 5.1) and contact angle measurements (Fig. 5.9). The
differences of contact angles seen in the PEC materials were approximately within the uncertainty of
the measurements.
5.4.2.3 Stability of Films
The stability of PEC films within 28 days in the non-enzymatic media ranged between -1 % and 18 %
for pH 9 to pH 3 (Fig. 5.16). The non-enzymatic mass loss of PEC pH 7.4 and CS films was found to be
at 2 % and 1 %, respectively. In comparison with stability testing of collagen scaffolds in non-enzymatic
media, it was previously shown by Davidenko et al. (2015) 214 that the non-crosslinked and crosslinked
types dissolved about 80 % and 20 %, respectively within 28 days. Although the collagen samples were

Chapter 5 – Polyelectrolyte Complex Films
93
produced as scaffolds, it seems that the PEC materials are as stable as the crosslinked collagen. The
CRG film exhibited the lowest stability due to its high water solubility (pKa = 2) 100.
Figure 5.16 – Enzymatic and non-enzymatic (dissolution) mass loss in PBS with and without lysozyme after 28 days, respectively.
5.4.2.4 The Effects of CS Parameters on PEC Stability
The negligible mass loss of the CS films in both the enzyme and non-enzyme media shows that the
materials are stable against degradation and dissolution. Firstly, this may be because the amino groups
of CS are deprotonated above pH 6 and thus become insoluble. For that reason, the PECs prepared at
pH 9 showed higher stability than the PEC prepared at pH 3, due to the higher CS content in pH 9 PEC.
Secondly, the CS used in this study is highly stable due to its high degree of deacetylation (DDA = 93.1
%). It was previously shown that CS was highly stable against enzymatic degradation due to the
formation of highly crystallised structures at high DDA (> 90 %) 61. A similar effect was found in CS
produced with a small DDA (< 10 %). In contrast, CS with an intermediate DDA (50 %) is highly water-
soluble, and the degradation can be accelerated using a low molar mass CS 235. The high solubility at
intermediate DDA was thought to be due to the large amorphous fraction in the polymer caused by
the destruction of the secondary structure 236.
The overall mass loss in the films was found to be greater when lysozyme was used, compared with
the PBS solution only. This is because the hexameric binding sites in lysozyme hydrolyse the glycosidic
bonds present between the monosaccharide units in CS 61,237. The hexasaccharide units containing 3-
4 or more acetylated units in CS contribute mainly to the initial degradation of the polysaccharide 238.
In addition, the higher soluble CRG content in the PECs prepared at lower pH explains the large initial
mass loss found in the pH 3 PEC film. The low degradation rate at later time points may have been due
to the diminished N-acetylglucosamine residues.
100
18
72 -1 1
100
69
27
-1 1-1
-10
0
10
20
30
40
50
60
70
80
90
100
CRG PEC pH 3 PEC pH 5 PEC pH 7.4 PEC pH 9 CS
Mas
s Lo
ss, %
Material
Non-enzymatic
Enzymatic

Chapter 5 – Polyelectrolyte Complex Films
94
5.4.2.5 Degradation of Films
Although the degradation study used was the closest method to simulate the in vivo environment, it
is by no means a full replication of the physiological conditions. Therefore, all that can reasonably be
achieved with this data is the ranking of PEC mass loss in the presence and absence of lysozyme.
5.4.2.6 Release of Acidic or Alkaline By-Products from PECs
During the dissolution study, pH measurements were carried out to measure the release of acidic or
alkaline by-products from the films. The slight pH reduction of the PBS media with pH 3 and pH 5 PEC
films showed that there was slight release of excess hydrogen ions due to the acidic production
conditions. Nonetheless, the pH of the PBS remained relatively constant for the other samples, and
therefore no significant acidic or alkaline by-products were released. It is therefore concluded that the
PECs prepared at various pH conditions did not adversely affect the pH and that the PECs may be
tolerable in biomedical applications in respect to the pH without further treatment.
5.4.3 Mechanical Properties
The films were placed in the tensile testing machine grips and pre-loaded at 0.01 N to align the films
prior to testing. The 0.01 N pre-load was used since the error of the 5 N load cell is at around 0.2 %.
Therefore, any loads below 0.01 N was considered as noise. The Young’s moduli of films were found
from the linear regression part of the stress-strain curve in tensile testing. The point at which the
tangent was drawn in the curve is shown in Figure 5.11. The linear part of the curve prior to yield
stress was chosen for each material for measuring the Young’s Modulus. It was found that for each
material and repeat a different strain range was used, depending on the linear regression curve. The
problem with the current method used is that breakage of the films can occur at the edge of the grips.
Perhaps on next occasion, dumbbell-shaped films may need to be used or a notch should be made in
the middle of the gauge length to allow for breakage in the middle of the film. With regards to the
Young’s modulus, the unloading part of the curve may be used, but this requires the films not to be
ruptured i.e. only elastically deformed. However, since all the films were tested in the same way, the
initial part of the loading curve is adequate for comparison of Young’s moduli of different materials.
The stress-strain curves were also truncated to remove the toe region as much as possible and start
with the linear region to measure the Young’s modulus. However, for some of the materials curves,
the toe region is still present and therefore the linear region is taken that follows the toe region.

Chapter 5 – Polyelectrolyte Complex Films
95
5.4.3.1 Mechanical Properties of Collagen from this Study and Grover’s Study
The mechanical properties of the PE and PEC films were compared with the collagen films because
collagen is widely used in tissue engineering applications. The tensile stress-strain curves of the PECs
and PEs were typical of polysaccharides 239 and similar to those found for CS-gelatin nanofibers 119.
The non-crosslinked collagen showed a significantly lower E than the crosslinked collagen films since
there were no interfibre covalent bonds present to prevent polymer chain sliding in the non-
crosslinked collagen 213. The Young’s modulus (E) and ultimate tensile strength (UTS) of the collagen
films in this study were found to be higher than those reported by Grover et al. (2012) 218. This may
have been due to several reasons; the collagen films prepared by Grover and co-workers was
submerged overnight in PBS at 37 °C rather than at 20 °C for 1 hour for this study. They also used a
specialised rig to keep the films wet during tensile testing and therefore the materials were more
hydrated during testing and potentially more compliant. In addition, Grover’s samples were
crosslinked for 2 h 218 rather than 24 h in this study.
5.4.3.2 The Viscoelastic Properties of Wet PEC Gels do not Associate with Mechanical
Properties of PEC films
The results in Chapter 4 suggest that the PECs prepared at lower pH formed stronger electrostatic
interactions as was indicated by the higher viscoelastic properties and viscosities (Section 4.3.10). It
was therefore hypothesised that the PEC films prepared at lower pH could also result in a higher E and
UTS. However, this notion was found not to be true.
5.4.3.3 The Effect of CS Structure on the Mechanical Properties
The higher CS content in the PECs also played a crucial role towards the higher E and UTS, indicating a
dominant effect of composition on the mechanics of the films. The macromolecules of CS result in the
formation of hydrogen bonds between hydroxyl groups and amino groups between the CS
macromolecules, resulting in greater crystallinity and stability 240. It can also be confirmed that the
PECs with the higher swelling, were identified with lower E and UTS due to the greater plasticising
effect caused by the water molecules 241. Other important factors include the molecular weight (MW)
of CS and the acid type used to solubilise the CS. In a previous study, the UTS of CS varied from
7-150 MPa when the MW of CS was increased and when malic acid was used to solubilise CS 240. The
elongation at break (EB) of the CS film was reported to be around 14.6-18.7 % when dissolved in acetic
acid 224 and 31.9-104.9 % when dissolved in lactic acid 240. It was also found that at high DDA, the MW
did not have an effect on the tensile properties of the CS film 242. However, when the MW of CS was

Chapter 5 – Polyelectrolyte Complex Films
96
small, and the DDA was between 10-90 %, the UTS of the films was low due to the fewer
entanglements and hydrogen bonds 61.
5.4.3.4 The cause of Low Mechanical Properties in CRG
CS and CRG films have been tested before by other researchers under tensile stress in dry conditions,
and it was found that the CRG films had higher UTS (30-38 MPa) and a lower EB (4.6-7.7 %) than the
CS films with a UTS and EB values of 3.2-4.7 MPa and 62.7-84.2 %, respectively 148. The results from
this chapter showed that the low tensile properties found in wet CRG might be due to its higher water
absorption capacity than CS. This increases the polymer chain movement 34 and weakens the
intermolecular forces between adjacent polymer chains 240. A similar result was previously found by
Yin et al. (1999) 241, showing lower UTS properties in gelatin than in chitosan (3 kPa) 241 due to the
higher swelling capacity.
5.4.3.5 Stiffness of Biological Tissues
Overall, it was shown that the PEC films were relatively stable and that chemical crosslinking was not
necessary. The E of the PEC films were in the range of 2.9 – 13.9 MPa. In contrast, the collagen films
were at 128.9 MPa (Coll-XL) and at 46.2 MPa (Coll-nX). The stiffness of most soft tissues is shown
below the mechanical properties of the PECs and the collagen films (Table 5.2). However, since the
PECs were lower in E than the collagen films, they may be more suitable for soft tissue implants from
the perspective of the stiffness. The E of articular cartilage and skin were the closest match in E to the
PECs. According to Chahine et al. (2004) 243, the E of cartilage was found to be between 3-13 MPa,
which closely resembles the E of PECs at 2.9 – 13.9 MPa. According to Pal (2014) 244, the UTS of
cartilage was found to be at 3 MPa, which most closely resembles the UTS of PEC pH 9 (2.4 MPa) and
CS (3.4 MPa). The PECs prepared in this study may be most suitable as blank slates for the repair of
cartilage tissues because of the closely related mechanical properties and the polysaccharide
composition. The PECs largely resemble the glycosaminoglycans (GAGs) present in cartilage tissues
such as hyaluronic acid, heparin sulfates, chondroitin sulfates and keratan sulfate which modulate the
lubrication and mechanics of cartilage 72. Nonetheless, it is possible that chondrocyte-like cells may
not adhere and proliferate well on the surface and therefore, protein surface modification may be
carried out to improve the biocompatibility. The biological response of the films will be discussed in
Chapter 7.

Chapter 5 – Polyelectrolyte Complex Films
97
Table 5.2 - Tensile stiffness values of biological tissues.
Soft Tissue Type Stiffness, MPa Reference
Mammary Gland 0.15 x 10⁻³ 245
Brain 0.15-0.3 x 10⁻³ 40
Liver 0.4-0.6 x 10⁻³ 40
Adipose 0.3-15.6 x 10⁻³ 246
Blood Vessel 0.2-4 x 10⁻³ 245
Kidney 2.5 x 10⁻³ 245
Skeletal Muscle 8-17 x 10-3 247
Cardiac Muscle 10-15 x 10-3 248
Lung 5-30 x 10-3 245
Skin 0.1-2 41
Soft Cartilage 0.1 244
Articular Cartilage 1 244
Anterior Cruciate Ligament 278-447 249
Patellar Tendon 597-842 249
Trabecular Bone 10-2000 250
Cortical Bone 11500-17000 250
5.4.3.6 Young’s Modulus of Films and Storage Modulus of Gels vs. SEI of Gels
Figure 5.17 shows the relationship of Young’s moduli of PEC films versus the SEI of PEC gels as
previously presented in Chapter 4. It can be observed that the film stiffness increases when the SEI
reduces. The high electrostatic interaction in PECs prepared at low pH resulted in strong intra-
crosslinking, which made the materials even less stable under uniaxial tensile testing. Therefore, the
stiffness of PEC films at low pH (3-6) was much lower than those at high pH (7-9). The opposite was
observed in rheology, where the viscoelastic behaviour of PEC gels was greater in PECs prepared at
lower pH due to the strong electrostatic interaction (Fig. 5.18). A storage modulus of PEC gels higher
than 3.2 kPa result in unstable PEC films with lower Young’s moduli. The data suggests that there is a
boundary pH, that results in the formation of stable films. This pH boundary is likely to be between pH
6 and 7 and where the electrostatic interaction is between 700-1500 mV2 (Fig 5.17 – green dotted
lines).

Chapter 5 – Polyelectrolyte Complex Films
98
Figure 5.17 – The relationship between the Young’s modulus of PEC films and the SEI of the PEC gels.
Figure 5.18 – The relationship between Young’s moduli of PEC films and storage moduli of PEC gels at an angular frequency of 1 rad/s.
1.7 2.94.4 4.3 5.0
8.511.0
13.9
8.5
48
-1000
-500
0
500
1000
1500
2000
2500
0.0
10.0
20.0
30.0
40.0
50.0
60.0
CRG pH 3 pH 4 pH 5 pH 6 pH 7 pH 7.4 pH 8 pH 9 CS
Stre
ngt
h o
f El
ectr
ost
atic
Inte
ract
ion
, mV
2
You
ng'
s M
du
lus,
MP
a
Material
Young's Modulus SEI
Complex Precipitate
Intra-crosslinking
Constant CS
Complex Coacervate
Inter-crosslinking
Increasing CS
1.7 2.9 4.4 4.3
5.0 8.5 11.0 13.9 8.5
48
-4
-2
0
2
4
6
8
10
12
14
0.0
10.0
20.0
30.0
40.0
50.0
60.0
CRG pH 3 pH 4 pH 5 pH 6 pH 7 pH 7.4 pH 8 pH 9 CS
Sto
rage
Mo
du
lus,
kP
a
You
ng'
s M
du
lus,
MP
a
Material
Young's Modulus Storage Modulus

Chapter 5 – Polyelectrolyte Complex Films
99
5.5 Conclusions
In summary, the properties of thin films were investigated and used to model the scaffold struts to
understand the microscale properties of these biomaterials. Relatively stable PEC films were produced
from CS-CRG PEC gels prepared at pH 7 and above. It was shown that the nature of crosslinking
(inter/intra-crosslinking) between CS and CRG were affected by different pH regimes. The changing
composition of PECs resulted in various swelling, stability, surface roughness and mechanical
properties of PEC films. The preparation of PECs at various pH conditions did not lead to the release
of acidic or alkaline by-products to affect the pH of the PBS media. From the results, it can be observed
that the PECs may have advantages over collagen due to the lower E in PECs compared with collagen
and the lack of the need for chemical crosslinkers which are usually highly toxic. The PECs may also
have advantages over CS because the PECs are softer, more stable at low pH values. The lower E and
UTS of PECs may be of greater advantage for specific soft-tissue engineering applications compared
with the higher E and UTS materials such as CS and collagen.
From the stiffness perspective, the most suitable applications for the PEC films would be for soft tissue
implants with moderate E such as cartilage. The next chapter will investigate whether mechanically
stable scaffolds can be produced from PECs prepared at a wide range of pH conditions. Chapter 7 will
introduce the cell-material interaction to determine the biological response of the PEC films.

Chapter 6 – Polyelectrolyte Complex Scaffolds
100
Chapter 6 – Polyelectrolyte Complex Scaffolds
6.1 Introduction
In the context of tissue engineering, a porous scaffold is an interconnected structure used to
regenerate damaged tissue by providing mechanical support to guide the growth of cells while
allowing cell and nutrient infiltration, and vascularization to occur 251. Successful scaffolds require
optimised structural and physical properties and can offer appropriate biological cues 251.
Polyelectrolyte complex (PEC) scaffolds have been used for repair in the liver 252, cartilage 72, bone
160,253,254, and for drug delivery 33,150 and stem cell delivery for the treatment of cardiac ischemia 255.
Anti-fouling materials were also produced from scaffolds based on chitosan with oxazoline oligomers
which were shown to repel protein adhesion and kill bacteria upon contact 256. The latter strategy was
thought to be useful for the prevention of micro-organism resistance in the context of biomedical
applications.
In Chapter 5, it was shown that the mechanical properties of the PEC films were mainly affected by
the inter/intra-crosslinking which were shown to dramatically change the stability, swelling and
mechanics of the PECs in their dry and wet states. The preparation of PECs at low pH conditions was
inducing a higher level of electrostatic interaction (SEI) between PEs which resulted in stronger intra-
crosslinking but weaker inter-crosslinking in PEC films. It was the inter-crosslinking formed by
secondary interactions and entanglements that provided stability and elasticity to the films. It is
therefore envisaged that a similar effect would take place with the freeze-dried scaffold swelling,
stability and mechanics. The aim of this chapter is to find whether stable scaffolds could be produced
from CS, CRG and PECs at different pHs and to potentially tailor the stiffness and strength of
biomaterials without chemical crosslinking. The mechanical behaviour of PEC scaffolds will be
compared to the mechanical properties of films and the viscoelastic properties of PEC gels. A scaffold
with bulk properties most suitable for soft tissues will be identified. In this chapter, PEC scaffolds are
prepared by freeze-drying homogenised PEC gels. The swelling properties, pore structure and
mechanical properties of the scaffolds are then studied.

Chapter 6 – Polyelectrolyte Complex Scaffolds
101
The objectives of this study were to investigate:
1. Whether stable PEC scaffolds can be produced at varying pH conditions.
2. The water uptake of the struts and pores of the scaffold.
3. The effect of production pH on the resulting structure and morphology of PEC scaffolds using
a scanning electron microscope (SEM).
4. The pore size and pore size distribution using X-ray microtomography (Micro-CT).
5. The mechanical properties of scaffolds using a mechanical compression machine.
6.2 Materials and Methods
6.2.1 Preparation of Scaffolds
CS solutions were prepared by dissolving CS 1 % w/v in 0.16 M HCl for 24 hours. CRG solutions were
prepared by dissolving CRG 1 % w/v for 24 hours followed by 1 hour of heating at 60 °C until fully
dissolved. All materials were stored at 4 °C before use. CS and CRG solutions (1 ml) were cast in 48
well-plates (14 mm diameter and 20 mm depth) made of treated polystyrene (Corning® Costar®,
Sigma-Aldrich, UK). The solutions were then freeze-dried in a VirTis AdVantage 2.0 benchtop freeze-
dryer (Biopharma Process Systems, UK) using the protocol shown below in Table 6.1 and Figure 6.1.
In summary, the solutions were frozen to -20 °C at a constant cooling rate of 1 °C min-1. The
temperature was then held constant at -20 °C for 8 hours. The ice phase was sublimed under vacuum
(0.08 Torr) at 0 °C for 24 hours. The freeze-dried scaffolds were then immersed in 1 M NaOH and 1 M
KCl solutions respectively for 24 hours using a shaker at 100 rpm. The scaffolds were subsequently
washed with ultrapure type 1 water for 1 hour and 1 min respectively using a shaker at 100 rpm. The
wet scaffolds were then freeze-dried again using the same freeze-drying protocol mentioned above.
On the other hand, the PEC gels were homogenised, and 1 g of the PEC gel was placed into 48-well
plates. The PEC gels were freeze-dried using the same protocol. Next, the PEC scaffolds were
photographed using a Canon EOS 5D camera, Japan.

Chapter 6 – Polyelectrolyte Complex Scaffolds
102
Table 6.1 – Freeze-drying protocol for small-sized scaffolds.
Temperature (°C) Time (min) Ramp/ Hold Pressure (Torr)
Start 20 5 H 760
Ramp -20 40 R 760
Anneal -20 480 H 760
Dry -20 60 R 0.08
Dry 0 20 R 0.08
Dry 0 1440 H 0.08
Dry 20 20 R 0.08
Stop 20 60 H 0.08
Figure 6.1 – The programmed protocol for the preparation of freeze-dried PEC scaffolds. This figure is intended to summarise Table 6.1. Note that the temperature and pressure do not represent the real conditions of the samples.
0.01
0.1
1
10
100
1000
-25
-20
-15
-10
-5
0
5
10
15
20
25
0.0 2.5 5.0 7.5 10.0 12.5 15.0 17.5 20.0 22.5 25.0 27.5 30.0 32.5 35.0 37.5
Time, hour
Log
Pre
ssu
re,
Torr
Tem
per
atu
re,
oC
Temperature Pressure

Chapter 6 – Polyelectrolyte Complex Scaffolds
103
6.2.2 Swelling
Cylindrical scaffolds (14 mm diameter and varying heights) were submerged in 5 ml ultrapure type 1
water at RT for 14 hours. The swollen weight of the scaffolds (water uptake of pores and struts) was
found by gently blotting the wet samples with tissue paper to remove the excess water. The
percentage water uptake by the scaffolds was calculated using the equation below:
𝑊𝑎𝑡𝑒𝑟 𝑈𝑝𝑡𝑎𝑘𝑒 𝑆𝑐𝑎𝑓𝑓𝑜𝑙𝑑, % = 𝑊𝑒𝑡 𝑀𝑎𝑠𝑠 (𝑚𝑤) − 𝐼𝑛𝑖𝑡𝑖𝑎𝑙 𝑀𝑎𝑠𝑠 (𝑚0)
𝐼𝑛𝑖𝑡𝑖𝑎𝑙 𝑀𝑎𝑠𝑠 (𝑚0) × 100 (6.1)
where mw is the mass of the wet scaffold at a specific time point, and m0 is the initial mass of the dry
scaffold.
The percentage water uptake by the struts was obtained by compressing the scaffolds between tissue
paper to remove all the water present within the pores of the scaffolds. It was calculated using the
equation below:
𝑊𝑎𝑡𝑒𝑟 𝑈𝑝𝑡𝑎𝑘𝑒 𝑆𝑡𝑟𝑢𝑡𝑠, % = 𝑊𝑒𝑡 𝑀𝑎𝑠𝑠 𝑆𝑡𝑟𝑢𝑡𝑠 (𝑚𝑤𝑠) − 𝐼𝑛𝑖𝑡𝑖𝑎𝑙 𝑀𝑎𝑠𝑠 (𝑚0)
𝐼𝑛𝑖𝑡𝑖𝑎𝑙 𝑀𝑎𝑠𝑠 (𝑚0) × 100 (6.2)
where mws is the mass of the wet struts of the scaffold.
The percentage water uptake by the pores in the scaffold was calculated using the equation below:
𝑊𝑎𝑡𝑒𝑟 𝑈𝑝𝑡𝑎𝑘𝑒 𝑃𝑜𝑟𝑒𝑠, % = 𝑊𝑎𝑡𝑒𝑟 𝑈𝑝𝑡𝑎𝑘𝑒 𝑆𝑐𝑎𝑓𝑓𝑜𝑙𝑑, % − 𝑊𝑎𝑡𝑒𝑟 𝑈𝑝𝑡𝑎𝑘𝑒 𝑆𝑡𝑟𝑢𝑡𝑠, % (6.3)
6.2.3 Scanning Electron Microscopy
A thin cross-section of the middle part (transverse plane) of the cylindrical scaffolds was mounted on
12 mm stubs using double-sided carbon black tape. The materials were sputter-coated (Emitech K575
sputter-coater, England) with platinum for 50 s using a deposition current of 40 mA to increase their
surface conductivities. Then the surface morphology of the scaffolds was observed using an SEM (FEI
Nova Nano SEM 450, Netherlands) with secondary electrons. A voltage of 5 kV and a working distance
of approximately 5 mm with a relatively small (2.5 nm) spot size (to increase resolution) were used to
view the morphology of polyelectrolyte scaffolds at a magnification of 50 x, 100 x and 500 x for each
sample.
6.2.4 X-Ray Micro-Computed Tomography
Cylindrical scaffolds prepared in a 48-well plate (14 mm diameter and 20 mm depth) were analysed
using a micro-CT (SkyScan 1172 X-ray micro-computed tomographer, SkyScan NV, Belgium). An X-ray
source potential of 25 kV and an X-ray source current of 130 μA at an exposure time of 1.8 s and a

Chapter 6 – Polyelectrolyte Complex Scaffolds
104
rotation step of 0.2°. High-resolution images (4.87 µm per pixel) were obtained using an 11 MP
camera. Image analysis was performed using NRecon (Skyscan NV, Belgium) for clipping 300 cross-
section slices as the volume of interest from the inner middle part of the scaffold. Three-dimensional
reconstructions of scaffolds were obtained using DataViewer (Skyscan NV, Belgium). Pore diameter
measurements were performed using ImageJ (NIH, USA) by training the image software on identifying
the pores and the struts of the scaffolds. The pictures of the scaffolds were turned into binary (black
and white) pixels. The average pore size was then calculated, followed by the pore size distribution of
the scaffolds. The porosity of the scaffolds was measured according to the method reported by
Bruker® using CTAn software (Skyscan NV, Belgium). The software reports a percent object volume
which is the volume of solid in the selected region of interest divided by the total region of interest.
Porosity is then calculated as 100 - percent object volume.
6.2.5 Mechanical Compression Testing
Compression stress-strain analysis of wet scaffolds was performed parallel to the plane of the vertical
cylindrical scaffold using a mechanical testing machine (Hounsfield Low Load Electric Screw, UK).
Scaffolds with diameters of 14 mm were immersed in ultrapure type 1 water at RT for 14 hours. The
dimensions of swollen scaffolds were measured using a Vernier calliper. The compression plates were
lowered to contact the sample and produce a small, but detectable load (0.002N). The scaffolds were
then tested in compression with a 5 N load cell and a crosshead speed of 6 mm min-1 until a sharp
increase in stress was detected (densification of the sample) before the tests were terminated. The
Young’s modulus (E) was obtained via a linear regression of the initial linear region of the stress-strain
curve. The stress values were obtained at 5 % and 20 % strain. Five replicate measurements were
performed for each scaffold material.

Chapter 6 – Polyelectrolyte Complex Scaffolds
105
6.3 Results
6.3.1 Stability and Swelling
The stability and swelling behaviour of the scaffolds were investigated in PBS to assess their suitability
as implants for soft tissues. The fluid uptake of the scaffolds by the pores and struts of the materials
could provide a measure of the physiologically relevant buffers to be taken up during cell culture or in
vivo studies. Dry porous scaffolds were obtained after freeze-drying the PEC gels in 48-well plates (Fig.
6.2). The dry scaffolds prepared at lower pH range (3 ≤ pH ≤ 6) were more brittle and more prone to
disintegration during handling than the PEC scaffolds prepared at higher pH range (7 ≤ pH ≤ 9). The
neutralised CS was very robust and stable during handling while the CRG was yielding and breaking to
the touch.
Figure 6.2 – Dry porous scaffolds obtained from freeze-dried carrageenan (CRG), chitosan (CS) and PEC gels prepared at pH 3, 4, 5, 6, 7, 7.4, 8 and 9.

Chapter 6 – Polyelectrolyte Complex Scaffolds
106
The stability of the scaffolds before and after swelling are shown in Figure 6.3. The CRG and the PECs
prepared at pH 3 and 5 were more prone to disintegration, whereas the CS and PECs prepared at pH
7.4 and 9 remained intact and stable after swelling.
Figure 6.3 – Appearance of carrageenan (CRG), chitosan (CS) and PEC scaffolds prepared at pH 3, 5, 7.4 and 9 before and after swelling. Scaffolds were submerged in PBS at RT for 14 hours. Unstable scaffolds: CRG, PEC pH 3 and PEC pH 5. Stable scaffolds: PEC pH 7.4, PEC pH 9 and CS.

Chapter 6 – Polyelectrolyte Complex Scaffolds
107
Figure 6.4 shows the water uptake of the scaffolds, struts and pores of the materials over a 14-hour
period. It can be observed that the water uptake increases for the materials prepared at higher pH.
The maximum water uptake was observed for pH 9 PEC which could hold 28 times its original weight.
The lowest water uptake was observed for pH 3 PEC which could hold only four times its original
weight. The chitosan scaffolds exhibited twice as much water uptake than the hydrophilic CRG
scaffolds. Most of the water uptake can be seen to arise from the pores of the scaffold rather than the
struts. The strut water uptake was approximately the same for the PECs prepared at pH 7.4, pH 9 and
CS scaffolds. They were also able to return to the non-swollen state and maintain their stability when
incubated in water after being compressed between tissue paper. The PECs prepared at pH 3, pH 5
and CRG disintegrated in the swollen state during handling. For that reason, the water uptake of the
struts and pores could not be determined for the low pH PECs and CRG samples.
Figure 6.4 – Water uptake of carrageenan (CRG), chitosan (CS) and PEC scaffolds prepared at pH 3, 4, 5, 6, 7, 7.4, 8 and 9 when submerged in ultra-pure type 1 water at RT for 14 hours.
0
500
1000
1500
2000
2500
3000
3500
CRG pH 3 pH 4 pH 5 pH 6 pH 7 pH 7.4 pH 8 pH 9 CS
Wat
er U
pta
ke, %
Materials
Water uptake of scaffolds Water uptake of struts Water uptake of pores
Disintegrated

Chapter 6 – Polyelectrolyte Complex Scaffolds
108
6.3.2 Scanning Electron Microscopy
In this section, SEM was used to determine the surface morphology and structure of porous scaffolds.
The micrographs of the freeze-dried individual PEs and PECs are shown in Figure 6.5. During sample
preparation and SEM viewing, it was observed that the scaffolds possessed different structures and
pore sizes throughout their transverse sections. The pores in the scaffolds were small at the bottom
and gradually increased in size higher up in the scaffold. For this reason, the homogeneous central
region was chosen for the comparison of the structures and morphologies for different scaffold
materials. The CS and PEC scaffolds prepared at pH 7.4 and pH 9 possessed a highly porous and
homogeneous structure with no phase separation or crystal deposition whereas the CRG and PEC
scaffolds prepared at pH 3 and pH 5 were harder to image because they were very brittle and crumbled
during sample preparation.

Chapter 6 – Polyelectrolyte Complex Scaffolds
109
Figure 6.5 – SEM micrographs of carrageenan (CRG), chitosan (CS) and PEC scaffolds prepared at pH 3, 5, 7.4, and 9. Samples were imaged at 50 x, 100 x and 500 x magnifications from left to right.

Chapter 6 – Polyelectrolyte Complex Scaffolds
110
6.3.3 X-Ray Micro-Computed Tomography
Micro-CT can be used to obtain pore size distribution, interconnectivity, and 3-D models of the
scaffolds. Due to the scope of this study only detailed 3-D images of the scaffolds and pore size
distributions were measured (Fig. 6.6 - 6.9). Nearly all scaffolds exhibited an interconnected and
homogeneous structure, except for the CRG and PECs prepared at pH 3 and 5, which possessed a
dense and fibrous heterogeneous structure (Fig. 6.5 and Fig. 6.6).
Figure 6.6 – X-ray microtomography images (side views) of the carrageenan (CRG), chitosan (CS) and PEC scaffolds prepared at pH 3, 5, 7.4, and 9.
CS scaffolds were shown to be the most homogeneous throughout the whole structure with highly
dense struts resulting in small pore sizes (Fig. 6.7). The CRG scaffold formed a thin skin on the outside
due to the dissolution of the CRG material during KCl crosslinking. However, overall, the CRG scaffold
was porous with large pore sizes. The PECs prepared at pH 7.4 and 9 showed a relatively homogeneous
porous structure with high interconnectivity and inter-crosslinking.

Chapter 6 – Polyelectrolyte Complex Scaffolds
111
Figure 6.7 – X-ray microtomography images of carrageenan (CRG), chitosan (CS) and PEC scaffolds prepared at pH 3, 5, 7.4, and 9. The scaffolds with cross-section and transverse section are displayed on top and bottom, respectively.
The average pore sizes of the individual PE scaffolds (85 µm) was shown to be lower than those found
in the PEC scaffolds (150 µm) (Fig. 6.8). The PEs also presented narrower pore size distribution with
more pores present in the smaller range. However, the CRG scaffolds contained more pores in the
larger range. On the other hand, the PEC scaffolds exhibited a more wide-ranging pore size
distribution. The histograms of the PEC scaffolds prepared at pH 3 and 5 were similar. The same was
true for the PEC scaffolds prepared at pH 7.4 and 9 (Fig. 6.9). The porosity of the scaffolds was also
measured and it appears to show that the PECs exhibited higher porosity than the individual PEs with
the highest porosity in PECs pH 7.4 and 9 (Fig. 6.9).
Figure 6.8 – Average pore size and pore size distribution of carrageenan (CRG), chitosan (CS) and PEC scaffolds prepared at pH 3, 5, 7.4, and 9.
0
50
100
150
200
250
300
CRG pH 3 pH 5 pH 7.4 pH 9 CS
Po
re S
ize,
µm
Material

Chapter 6 – Polyelectrolyte Complex Scaffolds
112
Figure 6.9 - Histogram illustrating the pore size distribution and porosity of carrageenan (CRG), chitosan (CS) and PEC scaffolds prepared at pH 3, 5, 7.4, and 9. Pore sizes are presented in micrometres.
Porosity = 72.6 %
Porosity = 90.3 % Porosity = 86.2 %
Porosity = 88.4 %
Porosity = 83.0 % Porosity = 90.2 %

Chapter 6 – Polyelectrolyte Complex Scaffolds
113
6.3.4 Mechanical Compression Testing
Compression tests were carried out on scaffolds to predict the behaviour of the materials in wet
conditions. The compression stress-strain curves of swollen scaffolds are shown in Figure 6.10 (a).
These curves represent one of the replicate measurements for each scaffold material.
Figure 6.10 (a) – Stress-strain curves of carrageenan (CRG), chitosan (CS) and PEC scaffolds prepared at pH 3, 4, 5, 6, 7, 7.4, 8 and 9. The scaffolds were swollen in ultrapure type 1 water for 14 h and tested under uniaxial compression.
The tangent of the curve for the Young’s Modulus calculation in compression is drawn below in Figure
6.10 (b). The Young’s modulus of the scaffolds was taken from the initial part of the slope. The initial
part of the curve is magnified to separate the overlapping of the stress-strain curves. All Young’s
moduli measurements were taken below 10 % strain which follows with the standard porous materials
stress-strain curves.
0
0.5
1
1.5
2
2.5
3
3.5
4
0 5 10 15 20
Stre
ss, k
Pa
Strain, %
CRG
pH 3
pH 5
pH 6
pH 7
pH 7.4
pH 9
CS

Chapter 6 – Polyelectrolyte Complex Scaffolds
114
Figure 6.10 (b) - Expanded region of the initial part of the compressive-strain curves of scaffolds adapted from Fig. 6.10 (a).
The tangent of the initial part of the slope is used to measure the Young’s modulus.
The stiffness of the PE scaffolds was found to be lower than the PEC scaffolds (Fig. 6.11). The maximum
stiffness in PEC scaffolds was found to be at pH 7 (20.6 kPa), and the lowest stiffness was at pH 6
(10.17 kPa). The stiffness of the CS and CRG scaffold was at 8.7 kPa and 6.38 kPa, respectively.
Figure 6.11 – The stiffness of carrageenan (CRG), chitosan (CS) and PEC scaffolds prepared at pH 3, 4, 5, 6, 7, 7.4, 8 and 9. Testing was carried out under uniaxial compression.
The compressive stress of the scaffolds at 5 % strain was in the range of 0.5-1 MPa for all the scaffold
materials. However, at higher strain (20 %) the PEC pH 7 scaffold was among the strongest (4.36 MPa).
The compressive stress of the PEC scaffolds prepared at pH 3, 4, 5, 6, 8 and 9 was lower than the
individual CS scaffold (Fig. 6.12). However, the PECs prepared at pH 7 and 7.4 were the strongest and
most stable.
0
0.2
0.4
0.6
0.8
1
0 0.5 1 1.5 2 2.5 3 3.5 4 4.5 5
Stre
ss, k
Pa
Strain, %
CRG
pH 3
pH 5
pH 6
pH 7
pH 7.4
pH 9
CS
0
5
10
15
20
25
30
CRG pH 3 pH 4 pH 5 pH 6 pH 7 pH 7.4 pH 8 pH 9 CS
You
ng'
s M
od
ulu
s, k
Pa
Material

Chapter 6 – Polyelectrolyte Complex Scaffolds
115
Figure 6.12 – The compressive stress of carrageenan (CRG), chitosan (CS) and PEC scaffolds prepared at pH 3, 4, 5, 6, 7, 7.4, 8 and 9. Testing was carried out under uniaxial compression at a strain of 5 and 20 %.
0
1
2
3
4
5
6
CRG pH 3 pH 4 pH 5 pH 6 pH 7 pH 7.4 pH 8 pH 9 CS
Stre
ss, k
Pa
Material
5 % Strain
20 % Strain

Chapter 6 – Polyelectrolyte Complex Scaffolds
116
6.4 Discussion
6.4.1 Stability and Swelling
6.4.1.1 Crosslinking of Scaffold
As discussed in Chapter 5, the reason for the lower stability in PECs prepared at low pH was because
the PECs were mainly intra-crosslinked while PECs prepared at high pH were mainly inter-crosslinked
which provided the higher stability. The stability is formed by the entanglements and secondary forces
such as van der Waals, hydrogen bonds and hydrophobic interactions between adjacent PEC particles.
6.4.1.2 Water Absorption and Stability of Scaffolds
The amount of water taken up by the scaffold depends on the material hydrophilicity and on the
capability of pores to retain fluid. In fact, on average the pores in the scaffold were taking up six times
more water than the PEC strut materials. Therefore, scaffolds with higher porosity exhibit higher water
uptake. It can be pointed out from the struts and the pores that the PEC prepared at pH 9 absorbed
the highest amount of water of all the materials used. This was likely to be due to a more rigid pore
structure that could hold higher amounts of water which made the scaffold structure more
mechanically resistant. In addition, the porosity was high because the freeze-dried PEC prepared at
pH 9 contained the lowest amount of solid content of all the PEC materials (Chapter 4). The lower
amount of solid content means that more water was present per gram of gel during freeze-drying.
Therefore, the higher water content meant that more water is crystallised during freezing which
results in a more porous structure after sublimation. The CRG scaffolds exhibited lower swelling than
the CS scaffolds because the CRG started to dissolve and form a thin skin on the outside of the scaffold
which lowered the diffusion and absorption of water into the scaffold.
6.4.2 Pore Structure and Pore Size Analysis
6.4.2.1 PECs Prepared at Higher pH were more Inter-Crosslinked
For cell migration and nutrient/oxygen transport to occur, scaffolds need to be highly porous 15.
Moreover, the pores should be interconnected to promote the homogeneous regeneration of the
tissue in a 3-D manner 257. CS and PECs prepared at higher pH appear to possess these properties and
are therefore expected to be more suitable for tissue engineering applications.

Chapter 6 – Polyelectrolyte Complex Scaffolds
117
6.4.2.2 Freeze-Drying Scaffolds and Scaffold Topography
It is well established that phase separation occurs after freezing a water-soluble polymer 14. When the
CS and CRG solutions are freeze-dried, the water freezes and nucleates into ice crystals 13. This pushes
any polymer to the side resulting in phase separation. After lowering the pressure to 80 mTorr, a
porous scaffold is obtained due to the sublimation of the ice 258,259. This forms an inter-crosslinked
scaffold that is highly porous and interconnected. For a PEC scaffold, however, this does not always
occur, because PEC gels can be a precipitate rather than complex coacervates. Precipitation occurs
particularly when the solid content of the PEC gel is high (> 2 wt. %). The PEC precipitates produced at
low pH (< pH 7) were mainly intra-crosslinked. The significant gaps in PEC pH 3 and pH 5 scaffolds
suggest that the micro and macrostructure of the struts were not inter-crosslinked. Thus, when the
electrostatic interaction between PEs was stronger; denser complex precipitates were produced
which were harder to control during freeze-drying 199. This corroborates the results previously
obtained for the high swelling and low stability found in PEC films prepared at pH 3 and 5 (Chapter 5).
The low pH range PECs are comparable to the micrographs found by Rajkumar et al. (2013) 260 which
show a typical densely packed powder like scaffold which may have been crushed when the scaffold
was mildly pressed onto the carbon black tape during SEM preparation. This proves that the scaffolds
were only intra-crosslinked and not inter-crosslinked at low pH production.
6.4.2.3 PECs Prepared at Higher pH were more Stable
On the other hand, the PECs prepared at a high pH range are both inter and intra-crosslinked, creating
a more stable scaffold. The structure of the PECs prepared at higher pH range was found to be similar
to the CS-CRG PECs obtained by Araujo et al. (2014) 6. Araujo investigated scaffolds produced at
different molar ratios but only at pH 7.4. On the other hand, Li et al. (2013) 23 investigated bovine
serum albumin (BSA) loaded CS-CRG PECs and showed a similar dense heterogeneous pore structure
to the PECs produced in this study in the low pH range.
6.4.2.4 Average Pore Size and Porosity of PEC Scaffolds
The average pore sizes of the CS-CRG PEC scaffolds were found to be higher than 100 µm, which
according to previous research would make the scaffolds suitable for cartilage tissue engineering 261.
The individual CS and CRG scaffolds have higher porosity because they have a larger number of small
pores which have a greater surface-to-volume ratio than large pores.

Chapter 6 – Polyelectrolyte Complex Scaffolds
118
6.4.3 Mechanical Properties
6.4.3.1 Stress-Strain Curve Explanation
A typical compression stress-strain curve of wet porous scaffolds with low density, open-cell foams,
with an interconnected network of struts consists of three distinct stages (Fig. 6.13) 226,262. The stages
are explained in more detail by Gibson and Ashby (1999) 262. In brief, the linear elastic zone is
controlled by the struts bending and this is the regime where the Young’s modulus of the hydrated
scaffold is measured. The collapse plateau and the densification regime are the beginning and the
completion of pore collapse within the scaffold, respectively 262. The stresses of the scaffolds were
found at 5 % and 20 % strain.
Figure 6.13 –Typical compressive stress-strain curves for scaffolds when hydrated. 1 - Linear elastic zone, 2 - Collapse plateau, 3 - Densification regime. Adapted from Gibson and Ashby (1999) 262.
For clarity, the initial portion of the loading curve is expanded to distinguish the overlapping of the
curves (Fig. 6.10 (b)). The accuracy of the results (linear regression) was determined by successively
adding the points in the data to make sure the squared R values was > 0.95. The mechanical properties
of scaffolds depend highly on the density of the material and on the porosity of scaffolds. For the
mechanical properties of the scaffolds to be compared directly, it would be necessary to measure the
pore content of each scaffold material. The porosity of the PEC scaffolds was approximately the same.
However, the porosity of CS and CRG were much lower than the PEC scaffolds porosity (Fig. 6.9).

Chapter 6 – Polyelectrolyte Complex Scaffolds
119
6.4.3.2 The Effect of Inter-Crosslinking, Composition, Pore Size Distribution on E and UTS
The inter-crosslinking and pore size distribution of the scaffolds seemed to have a greater impact on
the mechanical properties of the materials than the composition. This can be supported by the lower
stress and stiffness of PECs prepared at pH 9 compared to the PECs produced at pH 7.4 (Fig. 6.11 and
6.12) which contained more CS as was observed from Chapter 4 (Fig. 4.12). Conflicting conclusions
were made in previous research by Araujo et al. (2014) 6; they found that CS or CRG content had a
greater impact on the mechanical properties compared to the porosity and pore size of scaffolds. This
may have been because the composition was changed directly by adding different molar ratios of CS
and CRG and by keeping the pH constant at pH 7.4 which did not affect the inter-crosslinking. The E of
the PECs measured in this study is comparable to the E of PECs found in Araujo’s study. However,
there was no clear pattern of the stiffness and stress measured in the present study, indicating that
there may be more parameters responsible for the mechanical properties of scaffolds, such as the
solid content of the PEC gels that were freeze-dried into scaffolds. Then PEC films have been formed
by diluting the solid content of the PEC gels to 2 wt. %. This was not the case with the scaffolds, in
which the PEC gels were freeze-dried in their native solid contents, because the PEC coacervate or
most likely the PEC precipitate formed at lower pH is very dense and sediments when diluted which
creates a heterogeneous scaffold that is very dense at the bottom and thin at the top. The pH 7 and
pH 7.4 PECs were shown to be the most stable with the highest stiffness and elasticity which makes
them suitable for soft tissue engineering applications.
6.4.3.3 The Effect of pH Preparation Conditions on Scaffold Pore Sizes
The PECs prepared at low pH contained a greater number of pores that are of larger size. This can
make the structure of the scaffold less stable as was shown for PEC pH 3 and pH 5 compared to PEC
pH 7.4 and pH 9. The pH 5 PEC pore sizes are shown to be higher than pH 9, solely because the former
was freeze-dried at a solid content of 5 wt. % whereas the latter was formed at 1 wt. %. The larger
pore structure in PECs prepared at low pH can be observed in the micro-CT images (Fig. 6.7) and the
pore-size distributions (Fig. 6.9).
The PECs prepared at low pH (pH 3 and 5) possessed a high solid content of 4.5 and 5.5 wt. %
respectively, whereas the PEC gels prepared at pH 7.4 and 9 possessed a solid content of 2.2 % and
1 %, respectively. Nonetheless, the PEC scaffold prepared pH 7.4 was high in stiffness and stress due
to the higher inter-crosslinking of the scaffold.

Chapter 6 – Polyelectrolyte Complex Scaffolds
120
6.4.3.4 Comparison of PEC Scaffolds to Collagen Scaffolds
The PEC scaffolds were found to have a higher Young’s modulus than the collagen and collagen-
hyaluronic acid scaffolds prepared for adipose tissue engineering by 2-5 folds 226. This may be because
the collagen scaffolds were prepared at 1 wt. % whereas the PEC scaffolds where between 1 wt. %
and 3 wt. %.
6.4.3.5 Stiffness of Biological Tissues
An ideal scaffold should present similar mechanical properties (stiffness, strength, and extensibility)
to the native tissues that are intended to be repaired. The mechanical properties of the scaffold can
be sensed by the mechanical sensors of the cells and can, therefore, be essential to the guidance and
stimulation of cells 255,263,264. The stiffness of some soft tissues has been measured before by other
researchers and shown to be in the range of 0.16-949 kPa (Table 6.2). It was also previously found that
neurons/epithelial cells, myoblasts and chondrocytes grew best on gel surfaces with the stiffness of
0.1, 1 and 10 kPa, respectively 245. From the perspective of the stiffness of the tissues, the stable PEC
scaffolds prepared at pH 7 and above may be used as implants for neural, adipose and skeletal muscle
applications.
Table 6.2 – Compression stiffness values of some soft tissues.
Soft Tissue Type Stiffness, kPa Reference
Mammary Gland 0.167 265
Brain 3.2 266
Adipose 6.6 267
Thyroid 9 268
Skeletal Muscle 12 269
Liver 640 270
Articular Cartilage 949 271
6.4.3.6 Critical pH Conditions on Scaffold Physicochemical Properties – A Summary
As was observed previously with the mechanical properties of PEC films, it can be suggested that there
is a critical pH value between pH 6 and 7 where the mechanical properties of the scaffolds change
significantly (Figure 6.14). This can be related to the high SEI and solid content in PECs prepared at pH
3-6 and abruptly changes at pH 7-9. The graph shows that the SEI and solid content of PECs can
dramatically affect the Young’s modulus of PEC scaffolds. There may be a critical SEI value at around
1000 mV2, where the interaction switches from intra-crosslinking to inter-crosslinking.

Chapter 6 – Polyelectrolyte Complex Scaffolds
121
Figure 6.14 - The interrelationship between the stiffness of scaffolds with the solid content and strength of electrostatic interaction (SEI) of PECs.
6.4.3.7 Interrelationship of PEC Films and Scaffolds Stiffness
Figure 6.15 illustrates the interrelationship of the Young’s moduli of PEC films (as presented in Chapter
5) and PEC scaffolds. Since the PEC films were prepared at the same solid content, it is likely that only
the inter-crosslinking was predominantly affecting the stiffness of films (Fig. 6.16). On the other hand,
the scaffolds were prepared at the native solid content, and the Young’s modulus was therefore
affected not only by the composition but also by the pore structure and solid content. Hence, it would
be difficult to compare the mechanical properties of films with those of scaffolds. Nevertheless, a
trend exists that the PECs prepared at higher pH were more stable than those prepared at low pH for
both films and scaffolds.

Chapter 6 – Polyelectrolyte Complex Scaffolds
122
Figure 6.15 – A comparison between the Young’s modulus of films and scaffolds obtained using tensile and compressive testing, respectively.
Figure 6.16 – The proposed molecular structure of the scaffolds. The stiffness of the scaffolds was found to be lower at lower PEC preparation pH. The molecular structure of the PEC units prepared at higher pH is intertwined, forming an entangled network which results in higher overall scaffold stability.
0
5
10
15
20
25
30
35
40
CRG pH 3 pH 4 pH 5 pH 6 pH 7 pH 7.4 pH 8 pH 9 CS
0.0
10.0
20.0
30.0
40.0
50.0
60.0
Scaf
fold
Yo
un
g's
Mo
du
lus,
kP
a
Material
Film
Yo
un
g's
Mo
du
lus,
MP
a
Film Young's Modulus, MPa Scaffold Young's Modulus, kPa

Chapter 6 – Polyelectrolyte Complex Scaffolds
123
6.5 Conclusions
This chapter described the production and characterisation of PEC scaffolds without the need for a
crosslinking agent. It was found that the PEC scaffolds prepared at high pH exhibited higher inter-
crosslinking and homogeneity. Thus, the scaffolds were more stable with more uniform pore size
distribution. The composition influenced the properties of scaffolds, but other factors played a greater
role in scaffolds such as the inter-crosslinking, PEC solid content, and pore size distribution of the
scaffold. These factors can dramatically change the final properties of scaffolds which make the
interpretation of the factors on the intrinsic properties of PEC scaffold materials more difficult than in
PEC films. The PECs prepared at higher pH contained more pores that were of a smaller size inducing
more water uptake. The scaffolds prepared at low pH were more densely packed and less inter-
crosslinked than the high pH PECs. It can be concluded that the stress of scaffolds increased with the
increase in the preparation pH of PEC gels. The mechanical properties alone cannot be used to draw
a conclusion on the potential of the materials as implants. Therefore, the next chapter will present
the biological properties of the materials tested in the form of 2-D films.

Chapter 7 – Biological Response of Polyelectrolyte Complexes
124
Chapter 7 – Biological Response of Polyelectrolyte
Complexes
7.1 Introduction
At present, there is no clear consensus on the cell-binding properties of CS and CRG materials. While
some researchers have found that polysaccharides are cell-compatible 272, others have found them to
be non-biofouling as presented in the review by Junter et al. (2016) 27. Therefore, this chapter
addresses the question of whether the CS, CRG and PEC materials support the adhesion of cells
(fibroblasts, fibrosarcoma and chondrosarcoma cells) and a highly adhesive protein (tropoelastin).
There are two opposing strategies for modulating material interactions 273. The first is aimed at
enhancing the cell-material interaction and in doing so promoting the attachment, migration,
proliferation and differentiation of cells. Example applications include controlled drug delivery
systems 274 and the regeneration of various tissues 272 such as peripheral nerves 61, liver 275, skin 16,
cartilage 72 and bone 276. The second strategy involves creating non-adhesive surfaces for proteins and
cells to prevent the activation of the immune response, blood coagulation (thrombosis), bacterial
biofilm or extracellular matrix deposition. Examples of applications for this strategy can include
coatings for catheters (urinary 277 and intravascular 278), mechanical heart valves 279, pacemakers 280,
coronary stents 281, glucose sensors 282 and contact lenses 27,81,283,284.
When materials are implanted into the body, they are likely to come in contact with connective
tissues. The most common cell type present in the connective tissue are fibroblasts. The main
functions of fibroblasts are the production of the extracellular matrix (ECM) and wound closure 285.
The ECM is a network of extracellular molecules such as collagens, proteoglycans, glycosaminoglycans,
elastin, fibronectin, laminin, and several other glycoproteins secreted by cells that provide structural
(three-dimensional) and biochemical support to the surrounding cells 286,287. Fibroblasts are
anchorage-dependent cells in that they require integrin-mediated interactions to ECM molecules for
their survival 288. Such interactions are linked to a wide range of cellular processes such as
proliferation, differentiation and apoptosis. In some instances, the fibroblasts can differentiate into
contractile myofibroblasts 285. This transition can be observed by the expression of alpha-smooth
muscle actin and large focal adhesion points within the cell 289. Cell differentiation of fibroblasts into
myofibroblasts is dependent on cytokines, the most potent of which is the transforming growth factor
beta (TGF-β), adhesiveness and stiffness of the underlying material 290. When fibroblasts differentiate
Chapter 7 – Biological Response of Polyelectrolyte Complexes
125
into myofibroblasts, they excrete excessive ECM which can result in fibrotic diseases and host
responses including the fibrous encapsulation of implants 291.
In this work, three different cell lines (fibrosarcoma, fibroblasts and chondrosarcoma) have been
examined to elucidate the biological properties of CS and CRG complexes. Preliminary cell studies
were conducted with HT1080 human fibrosarcoma cells as this cell line is simple to grow and is widely
used to study the in vitro adhesive properties of collagen due to its well characterised collagen-binding
integrin, α2β1 to the GFOGER motif in collagen 292. Further work was conducted with primary human
dermal fibroblasts to confirm whether these cells can adhere to CS, CRG and their complexes in a non-
specific manner. These cells were chosen as they are highly prolific and adhere to a wide range of
surfaces. Furthermore, they act as a model cell line to probe the potential for scar tissue formation
which can be minimised when collagen-I and collagen-III forming fibroblasts cannot attach to the
material’s surfaces 293,294. Chondrosarcoma (SW1353) cells are derived from a malignant bone
neoplasm which form hyaline cartilaginous ECM 295. As such, chondrosarcomas were used here as a
model line for chondrocyte function due to their highly proliferative activity and the ability to keep a
consistent phenotype 296. The serum may bridge between the cell and the surface and this is integrin-
mediated binding. In addition, GAG-like mediated signalling from the surface may provide non-integrin
mediated cell adhesion. It is known that the primary integrin utilised by chondrocytes is α5β1 which
binds to fibronectin (FN) that could adsorb onto the surface of a material from the surrounding blood
serum 297. For the SW1353 chondrosarcoma line, this may be different, as they express integrin α5β3,
the receptor for vitronectin 298, which is important for cell adhesion and migration 299. It was also
previously shown that blocking integrin α6β1 binding to laminin 300,301 can reduce the adhesion of
SW1353 302, demonstrating that they utilise this integrin for adhesion.

Chapter 7 – Biological Response of Polyelectrolyte Complexes
126
7.2 Literature Review
7.2.1 Factors Affecting Cell Adhesion
7.2.1.1 Parameters Affecting Cell attachment
Cell attachment is a complex process as cells can respond to a variety of material properties such as
the composition and the availability of charged side groups and the physical properties such as
stiffness 303 and roughness 213. Other parameters such as hydrophilicity/hydrophobicity 304 and pore
architecture 31 (micropore, microfibre and nanofibre scaffold) can also play a significant role in cell
binding. Biochemical factors such as cell types, genes regulation/expression, protein deposition, the
presence of integrin recognition motifs and growth factors are fundamental to the fate of the cell 305.
7.2.1.2 Hydrophilicity/Hydrophobicity Effect on Cell Attachment
Hydrophobicity is complex with many contributions from chemical groups, both polar and non-polar,
surface roughness and surface swelling. Similarly, cell adhesion is complex, sharing many of the
influences as hydrophobicity such as surface roughness, charged and polar groups, topography and
surface swelling and mobility. Despite this complexity, some general trends can be observed, however,
these are often specific to the cell type being studied. It has been previously shown that surfaces with
a moderate hydrophilicity can be beneficial to cell attachment with decreased attachment on strongly
hydrophilic or hydrophobic materials 304. For example, extreme hydrophobicity and hydrophilicity can
inhibit the adhesion of some cells. This is exemplified by unmodified polytetrafluoroethylene (PTFE)
surfaces that are too hydrophobic 306 while polyethylene glycol (PEG) surfaces that are too hydrophilic
to allow direct cell adhesion 216. Murine fibroblasts have maximum adhesion on surfaces with a contact
angle of around 70o which decreased significantly at higher and lower contact angles 307. However, it
should be noted that for many studies, the change in hydrophobicity was controlled by using different
materials such as PTFE for the most hydrophobic surface (116 ± 3°), PS for a hydrophobic/hydrophilic
surface (75 ± 2°) and cellulose for a hydrophilic surface (18 ± 5°) 307. Other materials including but not
limited to polypropylene (PP) (92 ± 3°), polyvinyl alcohol (PVA) (42 ± 5°) and glass (SiO2) (30 ± 2°) were
used to fill the contact angle gap. It is clear that these samples do not solely differ in their
hydrophobicity as they possess differing chemistry, topography, surface swelling and mobility. As such
attributing cell adhesion to contact angle in isolation is often meaningless. Despite this, a general
pattern could be found between fibroblast adhesion and contact angle using the materials above.
Even here, the relationship between water contact angle and cell adhesion is not complete as the
adhesion of the fibroblasts on glass was as high as the PS surface while the PVA surface exhibited

Chapter 7 – Biological Response of Polyelectrolyte Complexes
127
lower cell adhesion than the cellulose surface all of which do not correlate with the water contact
angle/cell adhesion theory. Accordingly, it is clear that other factors, such as surface chemical groups,
roughness, charge and swelling are important for the adhesion of cells and that hydrophilicity or
hydrophobicity alone cannot be used to predict cell attachment fully. To add further complexity,
materials surfaces can adhere to active cell-adhesive molecules such as peptides and proteins. These
possess specific sequences, for example, RGD that tether cells. Often the display of these sequences
is influenced by the underlying material properties and so the cellular effect may be “indirect” via such
molecules.
7.2.1.3 Hydrophilicity/Hydrophobicity Effect on Protein Attachment
Tamada & Ikada (1993) 307 have also found that maximal protein (bovine serum albumin (BSA), bovine-
y-globulin and fibronectin) adsorption was observed on different material surfaces with a contact
angle of approximately 70 °. They also found that preadsorption of BSA and FN, prevented and
enhanced fibroblast adhesion to substrates, respectively. Similarly, according to Xu & Siedlecki (2007),
308 proteins like BSA, fibrinogen and human factor XII adhere preferentially to surfaces with contact
angles above 60° compared to surfaces with a contact angle below 60°. Here the wettability of the
low-density polyethylene (LDPE) surfaces was controlled by glow discharge plasma which introduces
surface chemical groups when exposed to air (oxidised to make it hydrophilic) 308.
7.2.1.4 Preadsorption of Biomolecules (Proteins and Sugars) on Films
The preadsorption of protein onto a material surface is a major factor in determining the nature of
cell interaction. For this reason, researchers have modified the surface of PEC samples with proteins
such as collagen, fibronectin and laminin or cell adhesive motifs such as arginyl-glycyl-aspartic acid
(RGD) to improve the viability and attachment of cells 309,310. In a previous study, chitosan-alginate (CS-
Alg) PEC scaffolds were surface modified with specific peptides and proteins to enhance liver repair
as measured by the production of albumin 309. It was shown that albumin release was increased in the
following order when using the coatings RGD > collagen > fibronectin or laminin > unmodified scaffolds
> tissue culture plate polystyrene. Other biologically active non-protein materials have been surface
tethered to enhance the interaction between the cells and the surfaces. These include the attachment
of sugar molecules including mannose, lactose and galactose molecules which bind to the lectins in
cells and allow cell-cell interactions in hepatocytes 311. The active adhesion of cells through integrin-
peptide binding sites can be distinguished from the passive cell adhesion where cells are adsorbed on
surfaces through hydrophobic, Coulombic, and van der Waals forces 312. This passive adhesion usually
occurs through multiple weak bonds and is generally lower in strength than the active adhesion found
between cell-ECM ligands or peptides derived from ECM proteins e.g. RGD 313.

Chapter 7 – Biological Response of Polyelectrolyte Complexes
128
7.2.1.5 Effect of Surface Roughness on Cell Adhesion
Surface roughness is another important parameter that can influence the adhesion of cells 314. The
roughness can be divided into macroroughness (> 100 um), microroughness (100 nm – 100 um), and
nanoroughness (< 100 nm) 315. The response of cells to roughness has been found to depend on the
cell type. For example, neural cells were more viable when cultured on nanoscale rough surfaces (6.25-
49.37 nm) compared to microscale rough surfaces (87.2-200 nm) 316. The neurons were less developed
on the micro-rough surface with a round-shaped soma and poorly branched processes. Additionally,
when MG63 osteoblast cells were cultured on polycarbonate surfaces with different roughness
(micropore sizes ranging from 0.2 – 8 µm), higher cell adhesion and proliferation was noted with lower
scale roughness 317. On the other hand, it has also been demonstrated that non-regularly patterned
surfaces with defined nanoroughness were shown to decrease cell adhesion 318. In a previous study by
Carneiro et al. (2013) 147 3T3 fibroblasts were found to have lower cell adhesion on rougher CS-CRG
complexes compared to the smooth individual CS and CRG surfaces. However, it is not clear whether
the increase in roughness resulted in the lower cell adhesion or if this is also due to the charges on
these molecules that may provide steric hindrance to the cells on the molecular scale. However, the
hydrophilicity was unlikely to be the main cause of lower cell adhesion on the CS-CRG PECs, since the
CRG surface is more hydrophilic than the CS-CRG PECs and the number of cells adhering is relatively
good. Nonetheless, the adsorption of fibrinogen was found to be higher on the PEC surfaces than on
the individual PE surfaces. Moreover, the literature does not provide a consistent picture of the effect
of roughness on cell adhesion because of the different definitions of surface topography at different
length scale used by different authors. It is therefore difficult to determine or compare the effect of
roughness on cell adhesion directly.
7.2.1.6 Effect of Substrate Structure on Cell Adhesion
Araujo et al. (2013) 28 showed that osteoblasts could be successfully cultivated in CS-CRG PEC scaffolds
both with and without hydroxyapatite and dexamethasone addition. However, such scaffold
structures may enhance cell adhesion over flat 2-D films since these three-dimensional structures
more closely mimic the native environment of the tissue due to the macro, micro and nanofibre
scaffold structures that were observed. These factors potentially provide more contact points with
the cells 31 and a close match to the complex multi-variant structure of native tissues 319. In addition,
scaffolds can also entrap the cells making it difficult to remove them through washing steps. As such,
their complex three-dimensional (3-D) structures can result in ambiguous consequences such as
entrapment of the cells that were not specifically bound to the surface which can be washed away on
2-D films 30. Therefore, films allow the measurement of cell adhesion in the absence of complex

Chapter 7 – Biological Response of Polyelectrolyte Complexes
129
multivariance of 3-D scaffolds. Also, the different physical properties (e.g. pore sizes and
interconnectivity) of different materials can make the comparison of their intrinsic properties more
complicated. For these reasons, in this thesis the scaffold struts have been modelled as thin films. In
this way, the fundamental interaction of cells with the material can be investigated while avoiding the
effects of structural parameters found in scaffolds.
7.2.2 Biological Properties of CS, CRG and PECs
7.2.2.1 Analogous Structure of CS and CRG to GAGs
The analogous structure of CS and CRG to the native tissue glycosaminoglycans (GAGs) may make the
CS-CRG PECs potentially suitable as temporary tissue substitutes 320. The CRG structure was previously
found to mimic the bioactivity of tissue-derived chondroitin-4-sulfate (C-4-S) and dermatan sulfate
(DS) 321 while the N-acetyl-glucosamine group in CS was found to interact with certain growth factors,
receptors and adhesion proteins 322,323.
7.2.2.2 Biological Properties of CS
In vitro studies have shown that CS is non-cytotoxic towards myocardial endothelial cells 324, human
microvascular endothelial cells 158, neurones 61,325, hepatocytes 275, chondrocytes 194, fibroblasts 147,326
and keratinocytes 194,326. In vivo studies have also shown that CS possessed low cytotoxicity in human
tissues 327 such as skin 328 and cartilage 329. It was previously found that low molecular weight (MW) CS
exhibited a higher viability of L929 mouse connective tissue fibroblasts compared with the high MW
CS 323. This was thought to be due to the synergistic effect created by the interaction between low-
MW CS and the proteins secreted by the cells which maintain an optimal environment for cell growth.
In addition, a high degree of deacetylation (DDA) enhanced attachment and proliferation of
keratinocytes and attachment of fibroblasts 326. At high DDA, cells like the dorsal root ganglion and
neurones attached and proliferated 61,325. This may have been due to the higher amino content in the
higher DDA sample which results in a higher electrostatic interaction between the positive CS and the
native negative surface charge of the cells which is due to the cell membrane phosphatidylcholine
liposomes content 330. However, when the DDA of CS was around 50 %, the dorsal root ganglion (DRG)
did not attach and proliferate on the surface of the material 61. Instead, the DRG rearranged into cell
clusters, through cell-cell rather than cell-material interaction. This may have been due to the high
swelling of the CS at 50 % DDA, which potentially makes the surfaces very hydrophilic, rough and with
a high degree of surface mobility that could affect cell adhesion. Human microvascular endothelial
cells (HMEC) were found to adhere well to CS and CS-heparin surface. The CS-Hep material could
simultaneously prevent the adhesion of platelets, making them suitable for blood-contacting

Chapter 7 – Biological Response of Polyelectrolyte Complexes
130
applications 158. Ultra-thin anti-fouling, anticoagulant and antibacterial coatings were also produced
by using simultaneously positively-charged chitosan and negatively-charged sulfated chitosan through
a layer-by-layer approach 81. It was shown that these coatings on glass or silicon were resistant to non-
specific adsorption of proteins such as negatively-charged bovine serum albumin and positively-
charged TGF-β1, and to the coagulation of human blood. The same coatings were also resistant to the
formation of bacterial (Staphylococcus aureus) biofilm which is known to adhere and grow on
polystyrene (PS), glass, Teflon and other materials 81.
7.2.2.3 Biological Properties of CRG
It was previously found that CRG gels were non-toxic to L929 cells 88 and that no inflammatory
response was observed after subcutaneous implantation in rats for one and two weeks 24. Similarly,
McKim et al. (2016) have recently found that CRG does not induce cytotoxicity, or the expression of
proinflammatory genes and does not increase cellular oxidative stress 331. CRG has also been shown
to improve cell adhesion and viability 25,88, but its high water solubility renders it impractical for use as
a cell substrate without crosslinking. Previous work on chondrocyte encapsulation using CRG
hydrogels showed good cellular viability and proliferation for 21 days, and human adipose-derived
stem cells (hASCs) were found to proliferate rapidly and express high levels of cartilage-specific
markers 25. These results indicate that CRG may be a suitable substitute for cartilage repair 25.
Photocrosslinkable CRG was also used to encapsulate NIH-3T3 fibroblast cells, MC3T3 E1-4
preosteoblast cells, and human mesenchymal stem cells (hMSCs) 36. Preliminary results indicated that
these encapsulated cells possessed high cell viability (∼ 75 %) within the CRG gel for long periods (up
to 21 days).
7.2.2.4 Biological Properties of PECs
The biological properties of the CS-CRG complexes have also been determined 28,147. It has been
previously shown that CS-CRG complexes impose no cytotoxic effects in vitro and they offer potential
as medical materials 6,28,147. Carneiro et al. (2013) 147 have demonstrated that fibroblasts were more
adherent on the individual CS and CRG surfaces compared to the CS-CRG PEC surfaces. This was
thought to be due to some loss of interaction and non-specific binding sites at the PEC-cell surfaces.
This was corroborated by another study where 3T3 mouse fibroblast cell attachment was higher on
CS and CRG compared to the CS-CRG PECs 44. Normal human keratinocytes were found to adhere and
spread preferentially on the CS surface as opposed to the chitosan-hyaluronic acid (CS-HyA) or
chitosan-chondroitin sulfate (CS-ChS) surfaces 215. The biocompatibility of CS-CRG films has also been
studied by Corvaglia et al. (2016) 332 using a model tumour cell line (HeLa). These showed poor cell
adhesion, as highlighted by the spheroid shape of the cells and cell cluster formation as opposed to

Chapter 7 – Biological Response of Polyelectrolyte Complexes
131
the flattened cell shape typically observed on bioadhesive surfaces such as a PS (polystyrene) control.
Nonetheless, the matrices were not detrimental to the viability of the cells. The reason for such results
was thought to be due to the superficial charge (complexing of the charged groups between CS and
CRG), surface morphology (steric hindrance) and matrix super hydrophilicity (reducing protein
adhesion). Because of these properties, tumour selective cell growth was proposed as a potential
application, since some tumours are anchorage-independent cells and can proliferate as cell clusters.
7.2.3 Biofouling and Anti-Adhesive Surfaces
7.2.3.1 Biofouling and Examples of Applications
In this thesis, the term "biofouling" is used for the non-specific attachment of unwanted proteins and
cells on biomaterial surfaces that impair their function. The problems include associated implant
rejection, malfunction of biosensors and the spread of infectious diseases 283. The most widely
reported infections are in applications where the medical device's bridge between the inside and the
outside of the body 283. Examples include the urinary catheter which is the most commonly used
medical device and the second highest cause of infections after ventilator-associated infections.
7.2.3.2 Biofouling Process
Proteins responsible for cell attachment can adsorb onto the surface of materials through physical or
chemical means such as wettability, electrical charge, surface roughness, pH and chemical groups such
as carbon, amine and oxygen 310. The modes of protein and cell attachment to a surface are shown
below in Figure 7.1 333. Cells normally require protein adhesion before they can attach to the
surface 334. In an ionic solution, such as cell media, first an electric double layer is established at the
surface of the material which in turn modulates the adsorption and conformation of proteins. These
proteins, such as fibronectin, once attached to the surface can mediate cell adhesion through integrins
in the cell membrane. When a cell is bound to the surface, extracellular matrix can be produced which
provides further cues for cell spreading and proliferation. In other cases, the adhesion of a small
amount of protein on a surface can reduce unwanted fouling 335. For example, platelet adhesion was
inhibited by surfaces that were coated with small amounts (5 ng/cm2) of fibrinogen that provides
biomaterials with anti-thrombogenic properties for good blood compatibility 336.

Chapter 7 – Biological Response of Polyelectrolyte Complexes
132
Figure 7.1 - Schematic representation of the dynamic proliferative fouling process which takes place over many length scales. Adapted from Magin et al. (2010) 333. The adhesion mechanism of protein and cell is annotated in the figure.
7.2.3.3 Anti-Adhesive Surface as a Non-Biofouling Strategy
Various strategies have been employed to control biofouling on materials surfaces. The main strategy
used to control biofouling is through anti-adhesive surfaces 337. Often these anti-adhesive strategies
involve the steric repulsion and the formation of a hydration layer which resist biofouling 338. During
steric repulsion, the foulant (e.g. protein) compresses the polymer chains on the surface, which
restrains the polymer chains. This creates unfavourable entropic loss which makes the adsorption of
the protein entropically unfavourable 339. The formation of hydration layers is demonstrated by the
highly organised surface-water (hydration layer) created in polyethylene glycol (PEG) via hydrogen
bonding. The disruption of this bound water layer by protein association is energetically and kinetically
unfavourable which in turn prevents protein adhesion 340. Zwitterionic molecules attract a thicker
hydration layer (more water molecules per monomer unit) compared to PEG 341. This is due to the
strong attraction of electrostatic interactions and the greater mobility of the water molecules in the
hydration layer. Hence, zwitterionic molecules such as carboxybetaine (CB) or sulfobetaine (SB) are
more fouling-resistant compared to PEG 335,342. These anti-fouling zwitterionic coatings have been
applied to silicone urinary catheters to reduce biofilm formation by about 80 % when compared to

Chapter 7 – Biological Response of Polyelectrolyte Complexes
133
that of unmodified silicone catheters 277. It is likely that PEs and PECs utilise the same mechanism that
zwitterionic molecules use due to their large macromolecular and oppositely-charged chains.
7.2.3.4 Polysaccharides as Anti-Adhesive Surfaces
In a manner that is similar to PEG, anionic polysaccharides possess potential anti-adhesive
characteristics due to their surface topography (roughness), physiochemistry (surface free energy,
hydrophilic or hydrophobic, cationic or anionic behaviour), polysaccharide molecular weights and
experimental immobilisation conditions 27. In addition, negatively-charged polysaccharides have been
considered to be important for the electrostatic repulsion of cells due to the negatively-charged cell
surface glycosaminoglycans such as hyaluronic acid present around the cell membranes 343. Hyaluronic
acid coatings on glass slides have been successfully used to reduce the adhesion of S. epidermidis and
E. coli by several orders of magnitude compared to unmodified glass slide 344. Commercial products of
hyaluronic acid coatings are currently used to minimise post-surgery adhesion (tissue attachments on
implants) include Hydak® from Biocoat Inc, Horsham, Pa. and Incert-S® from Anika Therapeutics Inc.,
Bedford, Mass. Heparin is another widely-used polysaccharide for the coating of coronary stents,
however to date this has not been found to reduce thrombosis and restenosis over non-coated
coronary stents 345. Heparin has been blended with CS to form films with antithrombotic properties
that prevent platelet adhesion and thrombosis 158. Commercial products of heparin as antithrombotic
coatings include Bioline Coating® from Maquet Cardiopulmonary GmbH, Rastatt, Germany, Bioactive
Surface CBAS® from Carmeda AB, Upplands Väsby, and Trillium® biosurface from Medtronic, Inc.,
Minneapolis, Minn. Dermatan sulfate has been polymerised with polyurethane at different degrees of
substitution and was found to reduce the in vitro adhesion of platelets, red blood cells, macrophages
and bacterial cells (E. coli) on all copolymer films compared to the unmodified polyurethane 346. An
interesting study carried out by Bratskaya et al. (2007) 347 showed the antibacterial and anti-adhesive
properties of CS-CRG-based coatings against two Enterococcus faecalis strains that were isolated from
infected biliary stents. The results showed that the multilayers were better at reducing bacterial
deposition in comparison with the glass control and covalently grafted CS. The adhesion of negatively-
charged bacteria was higher on CS terminated multilayers compared to the CRG terminated
multilayers. However, the CRG terminated multilayers showed no antibacterial activity.

Chapter 7 – Biological Response of Polyelectrolyte Complexes
134
7.2.4 Aim and Objectives
In this chapter, the bioactivity of PECs was determined using three different types of cells and the
highly adhesive protein tropoelastin. The effect of pH preparation on the biological properties of PECs
is discussed. The overall aim is to examine the cell and protein interactive properties of CS, CRG and
PECs. The objectives of this chapter were to investigate:
1. The cytotoxicity of the materials (CS, CRG and PECs) on the human fibrosarcoma (HT1080) cell
line.
2. How the composition of CS, CRG and PEC film coatings can affect the adhesion and spreading
of fibrosarcoma (HT1080), human dermal fibroblast and chondrosarcoma (SW1353) cells.
3. The adhesion of proteins using the model molecule tropoelastin to CS, CRG and PEC films.

Chapter 7 – Biological Response of Polyelectrolyte Complexes
135
7.3 Materials and Methods
7.3.1 Materials
All chemicals were of analytical grade and purchased from Sigma-Aldrich, UK unless stated otherwise.
Low molecular weight chitosan powder with a 93.1 % degree of deacetylation, κ-carrageenan and type
I collagen from bovine Achilles tendon were purchased for making the films. Glutaraldehyde (GA) was
purchased for fixing the cells in films. DAPI (4′,6-diamidino-2-phenylindole) and rhodamine phalloidin
(Thermo Fisher Scientific, USA) were obtained to stain the cells. Dulbecco's modified Eagle’s medium
(DMEM), ethylenediaminetetraacetic acid (EDTA), foetal bovine serum (FBS) and 100 units penicillin
and 0.1 mg streptomycin per 1 ml of media were used for the cell studies. CytoOne treated tissue
culture plate polystyrene (TCPP) of 24, 48, 96-well plate sizes were purchased from Star lab and were
used for cell studies. Tropoelastin was kindly provided by Professor AS Weiss at the University of
Sydney for the protein adhesion study.
7.3.2 Film Preparation for Cell Culture
The PEC gels fabricated at various pH values (3, 5, 7.4 and 9) in Chapter 4 were homogenised and
diluted with type 1 water to a concentration of 0.5 % w/v. For each sample, 200 µl of the diluted PEC
suspension was added to each well in a 48-well plate and dried at room temperature in a laminar flow
hood for 24 hours. Similarly, 200 µl of CS and CRG solutions prepared at 0.5 % w/v were solvent-cast
in a 48-well plate for 24 hours. The dried CS films were then neutralised with 1 ml of 1 M NaOH
overnight while shaken at 100 rpm using a rotating flatbed (TiMix, Labortechnik, Germany). The CS
films were then washed twice with 1 ml of type 1 water followed by soaking in water for 1 hour to
remove any excess acid or alkali remaining from the preparation process. For the cell studies on
HT1080 cells, a positive control was prepared by adding 300 µl of soluble bovine type 1 collagen to
the wells at a concentration of 10 µg/ml and incubated overnight in the fridge to form a collagen
monolayer on the surface of the wells. Bovine serum albumin (BSA) was used as a negative control
since it prevents the adhesion of the HT1080 cells onto the well surface during short-term (2 h) culture.
Non-specific binding to the well surface not covered by the collagen monolayer was blocked with BSA
by adding a volume of 300 µl BSA (1 % w/v) solution for 1 h then washing gently twice with 300 µl
phosphate buffer solution (PBS) prior to cell/media addition. For long-term cell studies (2.5 d), the
materials were pre-sterilised by spraying with 70 % ethanol (EtOH) followed by drying overnight in a
sterile laminar flow hood.

Chapter 7 – Biological Response of Polyelectrolyte Complexes
136
7.3.3 Fibrosarcoma Cells
7.3.3.1 Cell Culture
Human fibrosarcoma (HT1080) cells were obtained from the European Collection of Animal Cell
Cultures (ECACC), Porton Down, UK. Cells were seeded at a density of 2.5 x 10⁵ cells per 75 cm2 tissue
culture flask in DMEM supplemented with 10 % (v/v) FBS and 100 units penicillin and 0.1 mg
streptomycin per 1 ml of media. The cells were grown at 37 °C in a humidified incubator with 5 % CO2
and 95 % air. The cells were passaged every 2-3 days before reaching 80 % confluency. For passaging,
the medium was removed, and the cells were rinsed with PBS, followed by incubation in 5 ml of 0.5 g
trypsin/0.2 g EDTA in PBS at 37 °C for 3 min until cells started to detach from the tissue culture flask.
DMEM culture medium containing 10 % (v/v) FBS was added to inactivate the trypsin. After
centrifugation at 1000 rpm for 3 min (Hermle Z300K, Germany), the supernatant solution was
removed, and the cell pellet was resuspended in fresh medium supplemented with 10 % FBS and
added at the required dilution to new flasks containing 18 ml of media.
7.3.3.2 Cytotoxicity Study
The CS, CRG, CS-CRG PECs prepared at pH 3, 5, 7.4 and 9, PTFE and PP films with a diameter of 8 mm
and an approximate weight of 8.6 mg were pre-sterilised with 0.5 ml of 70 % v/v ethanol and left
overnight in a sterilised laminar flow hood for the ethanol to evaporate. The films were then incubated
in 1 ml of media supplemented with 10 % FBS for 3 days. Simultaneously, a 24-well plate was seeded
with 1.5 x 10⁵ HT1080 cells in 1 ml of media supplemented with 10 % FBS and 100 units penicillin and
0.1 mg streptomycin per 1 ml of media. The cells were incubated at 37 °C for 24 hours in a humidified
incubator with 5 % CO2 and 95 % air to form a cell monolayer. Subsequently, the media present in the
cell culture wells was replaced with the film medium extract cultured for an additional 3 days. Ethanol
was used as the positive (cytotoxic) control by adding 200 µl of 70 % v/v ethanol to each well to a final
ethanol concentration of 12.7 % v/v. PP samples obtained from Falcon tubes were used as the negative
controls due to their high inertness and non-cytotoxicity towards the cells. The media were removed
at the end of the incubation period, and the cells were rinsed gently with PBS. Phase-contrast
micrographs of the bound cells were taken for each material as detailed in Section 7.3.3.3. The cell
number was determined using the pNPP assay as described in Section 7.3.3.3. The pH is important for
cell viability, and it is therefore crucial to measure this change in the media since the PECs were
prepared at different pH conditions. The pH of the medium was also found by using the absorbance
values at 550 nm of phenol red present in the cell media and calibrating against a standard curve
concluded from the absorbance values at 550 nm of phenol red against pH in the range of 4 – 8. All

Chapter 7 – Biological Response of Polyelectrolyte Complexes
137
sample measurements were carried out in triplicate and values were reported as mean ± standard
deviation.
7.3.3.3 Short-Term Adhesion Study
Before cell adhesion analysis, HT1080s were detached from the cell culture flask with
0.5 g trypsin/0.2 g EDTA for 2 min, centrifuged and resuspended to a density of 2.5 x 10⁵ cells/ml in
DMEM without FBS. Then 200 µl of HT1080 cell suspension was added to each film for 90 min in DMEM
either in the presence or absence of 10 % FBS. The cells were fixed with 5 % glutaraldehyde then
viewed using an inverted phase-contrast microscope (ZEISS observer Z1, Germany) fitted with a ZEISS
camera (Axiocam 503 mono, Germany).
Identification of the cells followed the same protocol except that loosely bound cells were removed
with 2 x 200 µl DMEM washes. Bound cells were detected using the p-nitrophenyl phosphate (pNPP)
substrate (Sigma) by adding 300 µl of lysis buffer containing 81 mM trisodium citrate, 31 mM citric
acid, 0.1 % v/v Triton X-100, 1.85 mg/ml pNPP substrate (pH 5.4) to each well containing the cells for
24 hours at 4 °C. Subsequently, 200 µl of 2 M NaOH was added. A separate 96-well plate was used for
the absorbance reading at a wavelength of 405 nm using a SpectroStar Nano microplate reader (BMG
Labtech, Germany). The fibrosarcoma cell adhesion assays were performed in quintuplicate, and the
values were reported as a means ± standard deviation.
7.3.3.4 Long-Term Adhesion Study
As for short-term cell analysis, the cells were imaged using microscopy and separately quantified with
the pNPP assay. HT1080 cells were prepared as for short-term analysis except that they were
resuspended at a density of 1.5 x 10⁵ cells/ml in DMEM with 10 % (v/v) FBS. Then 200 µl of cells were
added per well for 2.5 days at 37 °C, 5 % CO2 and 95 % air. A separate well plate was used for the
quantitative measure of cell viability using the pNPP assay as described in Section 7.3.3.3. All sample
measurements were carried out in quintuplicate and values were reported as mean ± standard
deviation. In addition to phase-contrast microscopy, the cells were stained and viewed using
fluorescence microscopy. The cells were fixed by adding 50 µl of 25 % (w/v) glutaraldehyde directly to
the cells to a final concentration of 5 % (v/v). After fixing the cells with glutaraldehyde, the cells were
permeabilized in 200 µl 0.5 % w/v Triton X-100 in PBS for 5 min and washed three times with 1 ml of
PBS. The cells were fluorescently stained to make them visible against the swollen rough film surfaces.
Rhodamine conjugated to phalloidin was diluted 1:10000 (i.e. 2 µl rhodamine-phalloidin (stock 200
units, 6.6 µM/ml) in 20 ml in PBS) and added at 200 µl per well for 45 min. The samples were
subsequently washed three times with 1 ml of PBS. The cells were also stained with 1:5000 diluted

Chapter 7 – Biological Response of Polyelectrolyte Complexes
138
4',6-diamidino-2-phenylindole (DAPI) in water using 200 µl of DAPI per well for 5 min. The samples
were then washed three times with 1 ml of water. The wells were then viewed using an inverted
fluorescent microscope (ZEISS Axio Observer, Germany) fitted with a ZEISS Axio cam 503 mono
camera. DAPI stains the DNA in the nuclei of the cells showing as blue and the rhodamine phalloidin
stains the actin in the cytoskeleton of the cells showing as red.
7.3.4 Primary Human Dermal Fibroblast Cells
7.3.4.1 Cell Culture
Primary human dermal fibroblast cells were obtained from ECACC, Porton Down, UK. Cells were
seeded at a density of 2 x 10⁶ cells per 75 cm2 tissue culture flask in DMEM supplemented with 10 %
FBS and 100 units penicillin and 0.1 mg streptomycin per 1 ml of media. The cells were grown at 37 °C
in a humidified incubator with 5 % CO2 and 95 % air. The cells were passaged to a ratio of 1:3 every 4-
5 d before reaching 80 % confluency. The cells were subcultured as detailed for fibrosarcoma cells in
Section 7.3.3.1.
7.3.4.2 Long-Term Adhesion Study
Before cell adhesion/spreading experiments, fibroblasts were detached from the cell culture flasks
centrifuged and resuspended as for HT1080 cells. After film preparation, 200 µl of fibroblast cells were
added to the wells at a density of 0.5 x 10⁵ cells/ml per well for 3 days. The positive and negative
controls were TCPP and 12.7 % ethanol, respectively. The viable cells were quantified using the pNPP
assay and the cell morphology/structure imaged using fluorescent microscopy as described in Section
7.3.3.3 and 7.3.3.4, respectively. All sample measurements were carried out in quadruplicate and
values were reported as means ± standard deviations.
7.3.5 Chondrosarcoma Cells
7.3.5.1 Cell Culture
Human chondrosarcoma (SW1353) cells from the American Type Culture Collection (ATCC) were
grown in Dulbecco's Modified Eagle Medium/Nutrient Mixture F-12 GlutaMAX™ supplement with
10 % (v/v) foetal bovine serum and 100 units penicillin and 0.1 mg streptomycin per 1 ml of media.
Cells were seeded at a density of 3.75 x 10⁵ per 75 cm2 tissue culture flask. The cells were grown at 37
°C in a humidified incubator with 5 % CO2 and 95 % air. The cells were passaged every 3-4 days before
reaching 80-90 % confluency. For passaging, the same method was used as presented earlier in Section
7.3.3.1.

Chapter 7 – Biological Response of Polyelectrolyte Complexes
139
7.3.5.2 Long-Term Cell Adhesion
The films were sterilised with several sprays of 70 % ethanol and left to evaporate for 1 hour, then
washed with PBS and hydrated overnight using 0.5 ml of media containing 10 % (v/v) FBS. 200 µl of
cells were seeded onto each sample at 5 x 10³ cells/cm2 in a 48-well plate. Cells were maintained under
standard cell culture conditions (5 % CO2, 95 % humidity and 37 °C) for 4 days. After culturing the cells,
the media from the wells was removed, and the wells were washed twice with 1 ml of PBS to remove
any loosely bound or non-attached cells. The cells were lysed by adding 100 μl of buffer containing
2 % v/v Triton X-100 in distilled water per well for 90 min at RT. Subsequently, 100 μl of LDH detection
substrate (Sigma) prepared according to manufacturer instruction was added and incubated for 20
min until colour had developed. From each well, 100 µl was transferred to a new 96-well plate before
the absorbance was read at 490 nm using a SpectroStar Nano microplate reader (BMG Labtech). Cell
adhesion on films was performed in triplicate and values were reported as mean ± standard deviation.
7.3.6 Protein Adhesion
7.3.6.1 ELISA of Tropoelastin
The method was modified from Bax et al. (2011) 310. Briefly, discs of 8 mm diameter of CS, CRG, PECs
(prepared at pH 3, 5, 7.4 and 9), PTFE and PS were placed in a 48-well plate. A 1 mg/ml stock solution
of tropoelastin solution was diluted with PBS to a concentration of 20 µl/ml, and 1 ml of the diluted
solution was added to each well for 1 h at RT. Unbound tropoelastin was removed by aspiration, and
the samples were washed with 3 x 0.4 ml aliquots of wash buffer (PBS with 0.1 % w/v BSA). Non-
specific antibody binding to the samples was blocked with 5 % (w/v) BSA in PBS for 1 h at RT. Following
BSA blocking the samples were washed twice with 2 x 0.4 ml wash buffer, followed by incubation with
0.3 ml of 1:1500 diluted mouse anti-elastin antibody (BA-4) in wash buffer for 1 h at RT. The antibody
solution was removed and the samples were washed 3 x with wash buffer before incubation with
0.3 ml of 1:5000 diluted goat anti-mouse secondary antibody coupled to horseradish peroxidase (HRP)
(DAKO, UK) for 30 min at RT. The secondary antibody solution was removed and samples were washed
with 3 x 0.4 ml wash buffer for 5 min per wash and then 3 x 0.4 ml wash buffer for 15 min. The samples
were transferred to a new 48-well plate and 0.3 ml 3,3’,5,5’-tetramethylbenzidine (TMB)
(ThermoFischer Scientific) solution added. After 30 min, the plates were agitated to develop a blue
colour. Aliquots of 0.2 ml were transferred to a 96-well plate before the absorbances were read at
652 nm. A negative control that did not include tropoelastin coating was included. All sample
measurements were carried out in triplicate and values were reported as mean ± standard deviation.

Chapter 7 – Biological Response of Polyelectrolyte Complexes
140
7.4 Results
7.4.1 Fibrosarcoma Cells
7.4.1.1 Cytotoxicity
In this study, the cytotoxicity towards HT1080 cells of media incubated with film materials was
investigated. It was shown that all polysaccharide films did not adversely affect the viability of a
preformed cell monolayer (Fig. 7.2). The media incubated with the negative control PP was within the
standard error of the toxicity of the polysaccharide materials. In contrast, the positive control
including 12 % EtOH clearly reduced the cell number due to its cytotoxic effect.
Figure 7.2 – Cytotoxicity of media pre-incubated with films towards an HT1080 monolayer. The materials studied include carrageenan (CRG), chitosan (CS), the negative control (non-toxic) polypropylene (PP), the positive control (toxic) ethanol (EtOH) and polyelectrolyte complexes (PECs) prepared at pH 3, 5, 7.4 and 9.
It is possible that the resultant PEC film pH may alter the pH of the DMEM which in turn could adversely
affect the cell viability. As such, the change in pH of the cell-media was measured using the change in
the absorbance of the phenol red present in the DMEM. The pH of the medium films extracts ranged
from 7.6 to 8.1 for the materials tested (Table 7.1).
Table 7.1 – Phenol red absorbance at 550 nm of DMEM incubated with the disc materials. These were used to calculate the
pH of the film medium extract used in the cytotoxicity study.
Material CRG pH 3 pH 5 pH 7.4 pH 9 CS PP EtOH
pH 7.84 7.6 7.7 7.8 7.84 8 8.1 8.1
0
0.1
0.2
0.3
0.4
0.5
0.6
0.7
0.8
CRG pH 3 pH 5 pH 7.4 pH 9 CS PP (-) EtOH (+) NoSample
Cel
l-D
eriv
ed A
bso
rban
ce (
55
0 n
m),
AU
Material

Chapter 7 – Biological Response of Polyelectrolyte Complexes
141
7.4.1.2 Adhesion Analysis
Cell adhesion analysis showed no significant cell attachment to both the PEC and individual PE films.
In fact, the cell adhesion on the polysaccharides was lower than the cell adhesion on the negative
control film surface (BSA) (Fig. 7.3). Phase-contrast optical microscopy images of films showed that
cells spread readily to both collagen (positive control) and TCPP after 90 min showing phase dark cells
(Fig. 7.4). Conversely, no spreading was observed on any of the films composed of CS, CRG, PECs and
BSA with rounded phase bright cells present.
Figure 7.3 – Attachment of HT1080 cells as measured using a pNPP assay. The materials studied include carrageenan (CRG), chitosan (CS), the positive control collagen (Coll), the negative control bovine serum albumin (BSA), tissue culture plate polystyrene (TCPP) and polyelectrolyte complexes (PECs) prepared at pH 3, 5, 7.4 and 9. The cells were cultured on the films for 90 min (short-term cell study).
0.0
0.2
0.4
0.6
0.8
1.0
1.2
1.4
CRG pH 3 pH 5 pH 7.4 pH 9 CS Coll (+) BSA (-) TCPP No Cells
Cel
l-D
eriv
ed A
bso
rban
ce (
40
5 n
m),
AU
Material

Chapter 7 – Biological Response of Polyelectrolyte Complexes
142
Figure 7.4 – Phase-contrast optical micrographs of HT1080 cells at a magnification of 200 x. The cells were cultured on the films for 90 min (short-term cell study).

Chapter 7 – Biological Response of Polyelectrolyte Complexes
143
Cell analysis was also conducted after long-term culture (2.5 d) (Fig. 7.5). The cell-derived absorbance
in the long-term study also matches to the results found for the cells in the short-term study presented
in Figure 7.3. Indeed after 2.5 days there was still minimal cell adhesion to all PECs, CS and CRG. The
only difference is that in the long-term study, the cells exhibited a similar cell-derived absorbance on
the collagen, BSA and TCPP surfaces. Low cell-derived absorbance was measured on CS, CRG and all
PECs compared with the positive controls (Coll. and TCPP). Some cell-derived absorbance was noted
on pH 7.4 and pH 9 but is much lower than the positive controls.
Figure 7.5 - Measurement of HT1080 cells using the pNPP assay after 2.5 days (long-term cell study) in culture.
The surface morphology of the cells and films are shown in the phase-contrast micrographs presented
in Figure 7.6. It can be observed that the films tested in the long-term adhesion study were rough
which can make it more difficult to distinguish between the cells and the material. To improve the
resolution of the cells they were stained using fluorescent dyes (Fig. 7.7).
0
0.5
1
1.5
2
2.5
CRG pH 3 pH 5 pH 7.4 pH 9 CS Coll (+) BSA (-) TCPP No Cells
Cel
l-D
eriv
ed A
bso
rban
ce (
40
5 n
m),
AU
Materials

Chapter 7 – Biological Response of Polyelectrolyte Complexes
144
Figure 7.6 – Optical micrographs of HT1080 cells on films at a magnification of 100 x. The cells were cultured on the films for a duration of 2.5 d (long-term cell study). Arrows in red are pointing towards cells present on rough surfaces.

Chapter 7 – Biological Response of Polyelectrolyte Complexes
145
Figure 7.7 presents the fluorescent micrographs of DAPI stained nuclei of the cell. It was observed that
the cells were distributed homogeneously on the collagen, TCPP and BSA surfaces. Conversely, the
cells were clustered together on the CS, CRG and PEC films formed at all pHs.
Figure 7.7 – Fluorescent micrographs of DAPI stained HT1080 cells. The cells were magnified at 100 x. The cells were cultured on the films for 2.5 d (long-term cell study. Representative photos from three replicates are shown for each material.

Chapter 7 – Biological Response of Polyelectrolyte Complexes
146
Figure 7.8 presents the fluorescent micrograph of DAPI (stains the nuclei of the cell blue) and
rhodamine phalloidin (stains the cytoskeleton of the cell orange). The staining of the nuclei can show
that a cell is present, but it will not show the cell morphology. Therefore, the staining of the
cytoskeleton can indicate the extent of cell spreading. It was noted that the cells cultured on the
collagen, TCPP and BSA surfaces were more spread with cellular projections compared with the
accumulation of rounded cells on the polysaccharide films.
Figure 7.8 – Fluorescent micrographs of HT1080 cells labelled with DAPI (blue) and rhodamine phalloidin (orange) at 100 x magnification. The cells were cultured on the films for a duration of 2.5 d (long-term cell study).

Chapter 7 – Biological Response of Polyelectrolyte Complexes
147
7.4.2 Primary Human Dermal Fibroblast Cells
7.4.2.1 Adhesion Analysis
Primary human dermal fibroblast cells were cultured for 4 days on CRG, PEC pH (3, 5, 7.4 and 9), CS,
TCPP and TCPP containing 12 % ethanol were quantified using a pNPP assay (Figure 7.9). The CS, CRG
and PEC films prepared at pH 3 and 5 exhibited slightly higher cell number than the PEC films prepared
at pH 7.4 and 9. However, the cell-derived absorbance of all PEC films were approximately within
experimental error of the cell-derived absorbance of ethanol (yellow line). The positive control (TCPP)
exhibited approximately twice as many cells than on the polysaccharide films. The cell media without
the cells was used to provide a background absorbance value (red line).
Figure 7.9 – Cell-derived absorbance of primary human dermal fibroblasts was determined using the pNPP assay. The materials studied include carrageenan (CRG), chitosan (CS), the positive control tissue culture plate polystyrene (TCPP), the negative control ethanol (EtOH) and polyelectrolyte complexes (PECs) prepared at pH 3, 5, 7.4 and 9. The cells were cultured on the films for a duration of 4 d (long-term cell study). The red dotted line is the baseline for cell-derived absorbance. The yellow dotted line is the baseline for cell-derived absorbance of positive (toxic) control.
When stained with DAPI and rhodamine phalloidin, the cells found on the polysaccharide surfaces
were exhibiting a clustered round morphology presumably due to greater cell-cell affinity compared
to the cell-surface affinity (Fig. 7.10). The cells were small and round in the negative control wells. In
contrast, the cells on the TCPP surfaces were flattened and possessed an extensive cytoskeleton.
0
0.05
0.1
0.15
0.2
0.25
CRG pH 3 pH 5 pH 7.4 pH 9 CS TCPP (+) EtOH (-) Media
Cel
l-D
eriv
ed A
bso
rban
ce (
55
0 n
m),
AU
Material

Chapter 7 – Biological Response of Polyelectrolyte Complexes
148
Figure 7.10 – Fluorescent micrographs of primary human dermal fibroblasts labelled with DAPI (blue) and rhodamine phalloidin (orange) at 100 x magnification. The cells were cultured on the films for a duration of 4 d (long-term cell study).

Chapter 7 – Biological Response of Polyelectrolyte Complexes
149
7.4.3 Chondrosarcoma Cells
7.4.3.1 Adhesion Analysis
Unlike other cell-line experiments used in this thesis, the films used for the chondrosarcoma study
were preincubated with serum prior to cell incubation.
Figure 7.11 clearly shows a low number of chondrosarcoma on the polysaccharide surfaces after 4
days in culture. There were approximately 20 x more cells present on the TCPP surface compared to
the PECs. The addition of ethanol reduced the cell-derived absorbance to background (no cell) levels.
Figure 7.11 – Cell-derived absorbance of SW1353 cells (chondrosarcoma) was determined using an LDH detection assay. The materials studied include carrageenan (CRG), chitosan (CS), the positive control tissue culture plate polystyrene (TCPP), the negative control ethanol 20 % v/v (EtOH) and polyelectrolyte complexes (PECs) prepared at pH 3, 5, 7.4 and 9. The cells were cultured on the films for a duration of 4 d (long-term cell study).
Optical micrographs of the chondrosarcoma are consistent with the absorbance values. The cells on
the CRG films were found to be completely spherical and clustered. As shown before in Figure 7.6, the
PEC films swell in the media in the long-term studies which make the cells difficult to distinguish from
the surfaces of the films. Nevertheless, the cells on the PEC films were also found to be spherical and
clustered with little spreading evident. The cells on the CS films were phase dark and spread although
far fewer cells were present compared to the TCPP surface. The cells on the positive control (TCPP)
were phase dark and spread, whereas the cells on the negative control (TCPP/ethanol) surface were
small, round and phase bright.
0
0.5
1
1.5
2
2.5
CRG pH3 pH5 PH7.4 pH9 CS TCPP EtOH No Cells
Cel
l-D
eriv
ed A
bso
rban
ce (
49
0 n
m),
AU
Materials

Chapter 7 – Biological Response of Polyelectrolyte Complexes
150
Figure 7.12 – Phase-contrast micrographs of chondrosarcoma cells cultured for 4 d (long-term cell study) on films and viewed at a magnification of 100 x. Arrows in red are pointing towards cells present on the rough surfaces.

Chapter 7 – Biological Response of Polyelectrolyte Complexes
151
7.4.4 Protein Adhesion
7.4.4.1 ELISA of Tropoelastin
As cell adhesion to the PECs was low in the presence of serum, the ability of these materials to adsorb
proteins was examined. To this end, enzyme-linked immunosorbent assays (ELISA) are used to detect
the presence of the adhesive protein tropoelastin bound to the materials surfaces. Figure 7.13 shows
that the PEC materials display limited physisorption of tropoelastin when compared to the individual
PEs, PTFE and PS controls. The positive and negative controls include and exclude the presence of
tropoelastin, respectively. However, in both controls, the secondary anti-mouse antibody and TMB
substrate are included. Therefore, absorbance in the absence of tropoelastin indicates non-specific
absorption to the material by either the primary or secondary antibody. The PECs showed the lowest
tropoelastin adsorption compared with the rest of the materials tested (Fig. 7.14). The CRG material
exhibited around twice as much absorbance compared to the CS and PTFE materials in the presence
of tropoelastin, however this persisted in the absence of tropoelastin. Presumably, this is due to the
swelling and disintegration of the CRG, which allows the diffusion of the tropoelastin, secondary anti-
mouse antibody and TMB substrate into the material. This is particularly evident from Figure 7.14 and
Figure 7.15 showing a pronounced blue colouration of the CRG film under the positive and negative
conditions. The PS material exhibited the highest level of specific tropoelastin adsorption followed by
CS and PTFE (Fig. 7.13). The PECs prepared at pH 5, 7.4 and 9 absorbed more tropoelastin through
diffusion than the pH 3 PEC and CS discs as shown by higher absorbance values in the positive
compared with negative condition (Fig. 7.13 and 7.15). This may be due to the higher swelling that
was observed in PECs prepared at high pH within the first hour compared with the PECs prepared at
low pH (Fig. 5.1). The negative controls (without tropoelastin) gave absorbances that were similar to
the empty wells for almost all the materials except for CRG. It can be concluded that the tropoelastin
strongly adhered to the CS, PTFE and PS surfaces but not on the PEC surfaces, showing that these are
highly non-biofouling for this protein, particularly evident in the pH 3 PEC material.

Chapter 7 – Biological Response of Polyelectrolyte Complexes
152
Figure 7.13 – The absorbance of TMB on materials with tropoelastin (positive control) and without tropoelastin coating (negative control). The materials tested for tropoelastin adhesion include carrageenan (CRG), chitosan (CS), polytetrafluoroethylene (PTFE), polystyrene (PS), polyelectrolyte complexes (PECs) prepared at pH 3, 5, 7.4 and 9 and empty (no sample).
Figure 7.14 – Image of the 48-well plate with the films and substrates inside the wells. The top half of the plate contains materials coated with tropoelastin (positive control) and the bottom half was not coated with tropoelastin (negative control).
0.0
0.2
0.4
0.6
0.8
1.0
1.2
CS pH 3 pH 5 pH 7.4 pH 9 CRG PTFE PS Empty
Ab
sorb
ance
[6
52
nm
], A
U
+ Control - Control
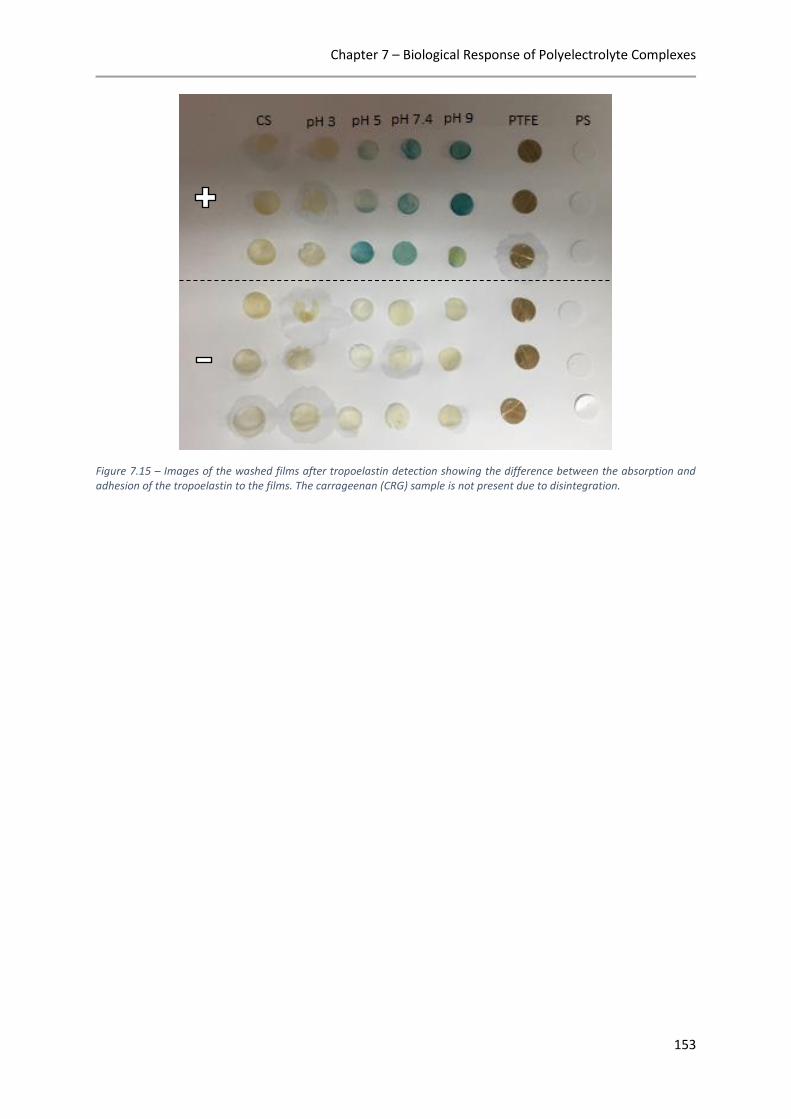
Chapter 7 – Biological Response of Polyelectrolyte Complexes
153
Figure 7.15 – Images of the washed films after tropoelastin detection showing the difference between the absorption and adhesion of the tropoelastin to the films. The carrageenan (CRG) sample is not present due to disintegration.

Chapter 7 – Biological Response of Polyelectrolyte Complexes
154
7.5 Discussion
7.5.1 Cell Studies
7.5.1.1 Cytotoxicity
Before conducting cell adhesion studies the cytotoxicity of the materials was first established using
the fibrosarcoma cell line. Using PEC conditioned media, the materials were found to be non-toxic
towards fibrosarcoma cells. This agrees with a previous study, where CS-CRG complexes ranging from
0.1 and 3 mg/ml was shown to be non-cytotoxic to the 3T3 fibroblast cell line 147. By comparison, a CS-
CRG PEC concentration of around 9 mg was used in the current study. Therefore, given that this
elevated concentration of PECs did not exhibit a cytotoxic effect on the fibrosarcoma cell line, it can
be concluded that CS-CRG PECs are non-toxic at the concentration studied.
7.5.1.2 pH Measurements
The cytotoxicity results also showed that the film extract media did not reach extremely low pH values
that could be potentially detrimental to the cells. By using the phenol red as the pH indicator that is
present in DMEM, the media incubated with PECs prepared at pH 3-9 were within the pH range of 7.6
to 8.1 (Table 7.1). This appears relatively high compared to the DMEM pH of 7.4-7.7 but may reflect
the increase in pH when the well plate was removed from the incubator. The incubator contains 5 %
CO2 compared to the 0.04 % CO2 in normal atmosphere. Therefore, it is possible that the CO2 was
released from the media, resulting in an increase in pH prior to the absorbance reading. Despite this
limitation, it was shown that the PECs did not fundamentally alter the pH of the media and so this
should not influence cell behaviour.
7.5.1.3 Fibrosarcoma and Fibroblast Adhesion
Cell adhesion analysis was conducted to establish whether CS, CRG and CS-CRG PEC films could
support cell attachment. In this study fibrosarcoma cells from connective tissue and fibroblast cells
from human dermal tissue were used to test the surface compatibility of CS, CRG and CS-CRG PEC
films. Fibrosarcoma and fibroblasts possess a wide variety of receptors and attach to a variety of
materials. Therefore, these cells were chosen as an initial test platform. Unlike many matrix proteins,
such as collagen, CS and CRG are devoid of specific amino acid sequences (motifs) that interact with
specific integrins on the above-mentioned cells. For example, there are no specific motifs such as
GFOGER on the film surface that interact with integrin α2β1 that is present on HT1080 cells 292 or RGD
motif that interact with integrins α5β1 and α5β3 that are present on fibroblast cells 348. However, cells

Chapter 7 – Biological Response of Polyelectrolyte Complexes
155
can bind through “passive” interactions, that is through multiple weak non-specific bonds such as van
der Waals, salt bridges, water exclusion, right surface roughness, topography, atoms or chemical
functional groups such as carbon, amine or oxygen groups, hydrophobic and Coulombic forces 273,349.
To compare this potential ‘passive’ interactions and ‘active’ interaction, BSA and collagen were used
as a negative and positive control surface, respectively. Collagen is a structural protein in human
tissues and is widely used in tissue engineering applications because of it's excellent mechanical and
cell-adhesive function 350,351, while BSA is a serum protein that prevents the adhesion of cells to the
substrates 352. These controls allow comparison to native matrix interactions with those on the
polysaccharide films.
7.5.1.4 Short-Term Study of Fibrosarcoma (HT1080 cells) with and without Serum Proteins
Present in Media
In the short-term HT1080 cell study, the cell-derived absorbance was low (Fig. 7.3), with the cells also
exhibiting a spherical cell morphology (Fig. 7.4). These data indicate that the cells bind weakly to the
surfaces of the polysaccharide materials. The experiment was conducted both in the presence and
absence of 10 % FBS present in the cell media showing that surface adsorption of serum proteins did
not influence the adhesion of these cells. Many sera-derived proteins for example fibronectin and
vitronectin are involved in the adhesion and proliferation of cells 353. Therefore, the lack of cell binding
suggests that the proteins present in FBS did not adsorb onto the surfaces and therefore could not act
as intermediary adhesion molecules that bridge between the surface of the materials and the cells.
7.5.1.5 Long-Term Study of HT1080 Cells
In the longer-term HT1080 cell study, the films absorbed some of the cell media resulting in a rough
surface (Fig. 7.6). This roughness was likely to have been caused by the fibrous PEC gel precipitates
owing to the strong intra-crosslinking and high CRG content. A similar observation was found by
Carneiro et al. (2013) 147, where they concluded that the higher roughness in PEC films was caused by
the increased heterogeneous fraction of CRG in the PEC. This surface roughness meant that the cell
morphology could not be distinguished from the surface of the material using phase-contrast
microscopy. Instead, fluorescent markers were used to visualise the cells against the rough surface
(Figs. 7.7 and 7.8). This showed that HT1080 cells accumulated in cell clusters with little cell spreading
on the PECs. The rounded cell morphology could be due to the critical dependence on adhesion for
these anchorage-dependent cells 61. Therefore, the affinity of cell-cell interaction may have been
greater than the cell-surface interaction, which resulted in cell cluster formation. This is indicative of
surfaces that are non-adherent to the cells as was previously shown with CS-CRG films using HeLa
model tumour cell lines 332. Interestingly in the long-term adhesion assay using HT1080 cells (Fig. 7.5),

Chapter 7 – Biological Response of Polyelectrolyte Complexes
156
the BSA showed extensive cell interaction. The high cell adhesion to BSA coated surfaces after long-
term culture could be due to the enzymatic degradation of the BSA by the cells which ultimately
exposes the underlying TCPP surface 354,355. In addition, small amounts of fibronectin and vitronectin
present in the serum can displace the albumin due to their larger surface areas, which also contributes
to higher cell adhesion 356. Therefore, ethanol was used instead of BSA as the negative control. In
summary, the cells were capable of binding to the positive controls, confirming that the
polysaccharide surfaces were non-adhesive substrates.
7.5.1.6 Roughness Affecting Cell Adhesion
Although the roughness of the PEC films in the current study was not measured in either dry or wet
condition with AFM, the macro-roughness was visually observed with the naked eye, and it was found
that the PEC films produced at lower pH (pH 3 and 5) were rougher at the macroscale than those
prepared at higher pH (pH 7.4 and 9). Others have found that HeLa (human cervical cancer cell line)
cell adhesion was limited on the rough CS-CRG PEC surfaces (227 ± 26 to 309 ± 34 nm) compared with
the smooth CRG films (140 ± 8 nm) 332. Therefore it is possible that the macro-roughness of the PECs
produced at lower pH may have reduced the adhesion of fibrosarcoma cells. Alternatively, this
reduction in cell adhesion may have been due to the higher steric hindrance and/or high hydrophilic
nature of PEC films (Fig. 5.1).
7.5.1.7 Chondrosarcoma Cell Adhesion
Chondrosarcoma cells were chosen as a model for chondrocytes as they occupy highly glycosylated
cell niche in vivo 357. As such it was hypothesised that the similarities of CS and CRG to chondroitin
sulfates and hyaluronic acid might provide the chondrosarcoma cells with similar receptor sites for
adhesion and proliferation. However, like the other previous cell lines, chondrosarcoma cells showed
very low adhesion to the polysaccharide surfaces when compared with the TCPP surfaces. Lower cell
numbers were observed on the PECs than the CS or CRG films which may be due to the neutral charge
and zwitterionic nature which provides a highly hydrophilic environment that may be entropically
unfavourable for adhesion 335,339. Another potential explanation for the low adhesion on the
polysaccharide films is the steric and electrostatic repulsion between the cell surface macromolecules
and the macromolecules on the surface of the film 358. Previous reports show that chondrocyte cells
bind to collagen but not hyaluronic acid (HyA) substrates. Chondrocytes synthesise their own
hyaluronic acid (HyA), and it was found that only the cells on the collagen films produced their own
extracellular matrix 359. For this reason, collagen is widely used as a cell adhesion enhancer 350,351.
These authors proposed that the inhibition of adhesion and spreading of the chondrosarcoma cells on
HyA coated surfaces was due to the excess HyA which results in steric exclusion and/or electrostatic

Chapter 7 – Biological Response of Polyelectrolyte Complexes
157
repulsion between the two hydrated layers (HyA from the cell membrane and the HyA present on the
surface). This is consistent with the adhesion study of A6 frog kidney epithelial cells on a HyA film
surface 343. Like CS and CRG, HyA is a large, linear glycosaminoglycan polyelectrolyte composed of
repeating disaccharide units (glucuronic acid and N-acetylglucosamine) with molecular weights
ranging from 106 to 107 Da and extended lengths of 2-25 µm 360. When HyA is present on the surface
in large amounts, it was proposed that a layer of flexible molecule extending in the solution becomes
repulsive. Therefore, interactions between the membrane of the cell and the surface can occur at a
considerable distance from the adhesive surface (> 100-fold larger than the integrin-mediated focal
adhesions) 343. Due to the similarity between the PECs and HyA it may be that the same mechanism is
taking place between the CS, CRG and CS-CRG surfaces and the glycosaminoglycans from the cells.
Another study concluded that the HCS-2/8 human chondrosarcoma cells could not adhere to anti-
adhesive poly-L-lysine-hyaluronic acid (PLL-HyA) films prepared by a layer-by-layer method 361. The
anti-adhesive properties of the films to the cells were thought to be attributed to the low rigidity, high
water content and the gel-like character of PLL and HyA materials. This is consistent with the PECs
produced in this study where the CS-CRG PECs were found to be soft, swollen and gel-like in character
(Chapter 5). Therefore it appears that the PECs produced in this thesis are non-cell adhesive in a similar
manner to native glycosaminoglycan molecules.
7.5.2 Protein Study
7.5.2.1 Tropoelastin Functions and Structure
Tropoelastin was used for protein binding assays due to its strong surface binding abilities 310,362–364.
Tropoelastin is a major elastic constituent of elastic tissues such as skin, vocal fold, lung, and elastic
cartilage 310. Tropoelastin is known to adhere very strongly to various surfaces due to the presence of
both hydrophobic and hydrophilic domains within the same protein 365. The hydrophobic domains
consist of non-polar residues glycine, valine and proline, whereas the hydrophilic domains consist of
lysine and alanine 366. Tropoelastin is an asymmetric protein with an appended C-terminus cell binding
foot and a long spring-like N-terminal open to intermolecular crosslinking 367.

Chapter 7 – Biological Response of Polyelectrolyte Complexes
158
7.5.2.2 Measurement of Tropoelastin Adhesion
The amount of tropoelastin adsorbed on the surfaces can be measured spectrophotometrically by
using an ELISA assay (Fig. 7.13). These are well established being extensively used to measure protein
deposition onto surfaces. During this assay, when tropoelastin adheres to the surface, the primary
antibody couples to the tropoelastin, followed by a coupling of the secondary antibody (Fig. 7.16). This
secondary antibody is conjugated to the enzyme HRP which catalyses a TMB substrate to a coloured
product. Elisa analysis showed that very little tropoelastin was adsorbed to the surfaces of the PEC
materials.
Figure 7.16 – A schematic diagram of the detection of tropoelastin when adsorbed onto surfaces showing the substrate and the mechanism for colour change when tropoelastin is present.
This supports the cell adhesion analysis in the presence of serum where it was concluded that the PEC
materials are highly non-biofouling. This is particularly so since tropoelastin is known to be highly
surface adhesive 362. Indeed, tropoelastin obtained from the same supplier was previously shown to
adhere to a wide range of surfaces 362, such as PTFE 310, PS 363 and stainless steel 364. Hence the inability
of tropoelastin to adhere to the polysaccharide surfaces indicates that the PEC materials are
potentially non-adhesive to a wide range of protein-based biomolecules. Nonetheless, the slight
colour change observed in the tropoelastin coated PEC films prepared at pH 5, 7.4 and 9 after the
washing (Fig. 7.15) indicates that some tropoelastin may have adhered to or diffused into the films
specifically as is schematically drawn in Figure 7.17. No colour change was observed in the absence of
tropoelastin coating. CRG films differed from the other materials as they swelled and disintegrated
significantly thereby entrapping the proteins and antibodies, resulting in a large colour change that
was independent of tropoelastin adhesion. Tropoelastin was found to adhere to the surfaces of CS,
PTFE and PS.
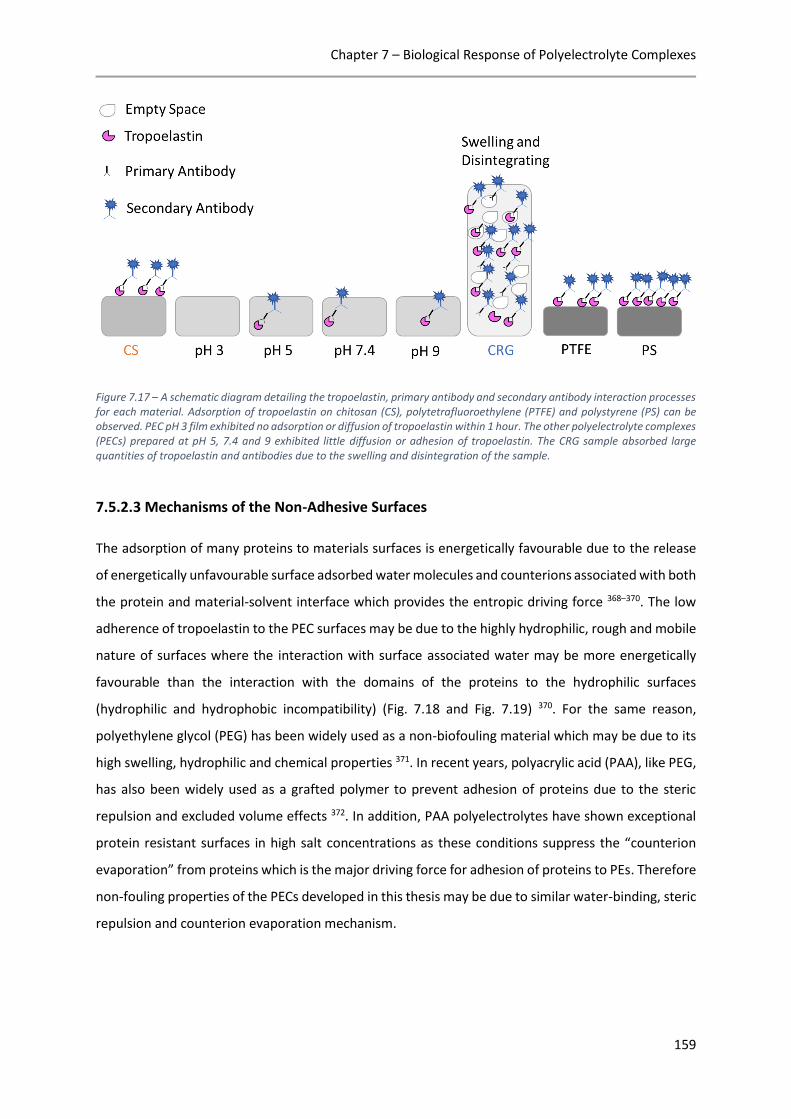
Chapter 7 – Biological Response of Polyelectrolyte Complexes
159
Figure 7.17 – A schematic diagram detailing the tropoelastin, primary antibody and secondary antibody interaction processes for each material. Adsorption of tropoelastin on chitosan (CS), polytetrafluoroethylene (PTFE) and polystyrene (PS) can be observed. PEC pH 3 film exhibited no adsorption or diffusion of tropoelastin within 1 hour. The other polyelectrolyte complexes (PECs) prepared at pH 5, 7.4 and 9 exhibited little diffusion or adhesion of tropoelastin. The CRG sample absorbed large quantities of tropoelastin and antibodies due to the swelling and disintegration of the sample.
7.5.2.3 Mechanisms of the Non-Adhesive Surfaces
The adsorption of many proteins to materials surfaces is energetically favourable due to the release
of energetically unfavourable surface adsorbed water molecules and counterions associated with both
the protein and material-solvent interface which provides the entropic driving force 368–370. The low
adherence of tropoelastin to the PEC surfaces may be due to the highly hydrophilic, rough and mobile
nature of surfaces where the interaction with surface associated water may be more energetically
favourable than the interaction with the domains of the proteins to the hydrophilic surfaces
(hydrophilic and hydrophobic incompatibility) (Fig. 7.18 and Fig. 7.19) 370. For the same reason,
polyethylene glycol (PEG) has been widely used as a non-biofouling material which may be due to its
high swelling, hydrophilic and chemical properties 371. In recent years, polyacrylic acid (PAA), like PEG,
has also been widely used as a grafted polymer to prevent adhesion of proteins due to the steric
repulsion and excluded volume effects 372. In addition, PAA polyelectrolytes have shown exceptional
protein resistant surfaces in high salt concentrations as these conditions suppress the “counterion
evaporation” from proteins which is the major driving force for adhesion of proteins to PEs. Therefore
non-fouling properties of the PECs developed in this thesis may be due to similar water-binding, steric
repulsion and counterion evaporation mechanism.

Chapter 7 – Biological Response of Polyelectrolyte Complexes
160
Figure 7.18 – Schematic illustration of the mechanism of protein desorption and protein adsorption on a hydrophilic and hydrophobic surface, respectively.
7.5.2.4 Complete Summary of the Non-Adhesive Surface of PEC
Figure 7.19 summarises the current potential non-biofouling mechanisms of the CS-CRG PECs
schematically. The reason for the highly anti-adhesive surfaces of CS-CRG PECs is potentially caused
by one or more of the factors i.e. hydrophilicity, steric repulsion, excluded volume effects and charge
repulsion.
Figure 7.19 – A schematic diagram representing the non-biofouling mechanisms that may be involved in CS-CRG PECs. The blue arrow represents the desorption of cells and proteins.

Chapter 7 – Biological Response of Polyelectrolyte Complexes
161
7.5.2.5 Potential Applications
The strong anti-adhesive properties of PECs has good potential for a wide variety of applications such
as the prevention of bacterial adhesion and the prevention of platelet adhesion to biomaterials which
is the cause of undesirable biofilm formation and blood clotting, respectively. Other researchers have
also investigated the adhesion of plasmatic (globular) proteins such as fibrinogen and bovine serum
albumin on CS, CRG and CS-CRG PEC films 20,147. These proteins were tested because they are known
to be involved in the first event of the adsorption process that occurs when a material comes into
contact with blood. Both studies mentioned above have shown that heparin or sulfonated chitosan
can reduce the attachment of the plasma proteins when compared to the unmodified chitosan
surface. Plasma proteins are known to attach to the CS surfaces during thrombosis 158. This is
consistent with the protein binding properties of CS films in this study as evidenced by adsorbing
tropoelastin from the solution (Fig. 7.14). Highly sulfated heparin or molecules with negatively-
charged groups that are similar to CRG are known to provide a repulsive force to the negatively-
charged proteins which can reduce the adsorption of proteins due to electrostatic interactions with
the material 373. Other researchers have also shown that sulfated CS and CRG decrease the adsorption
of proteins and were thought to be useful as anti-thrombogenic materials for blood contacting
applications 20,147,158. Therefore, further study to examine biofilm and thrombus formation on the
materials produced in this study represents an exciting area of future research.
7.6 Conclusions
Overall, the materials were found to be non-toxic towards the fibrosarcoma cells. The pH of the cell
medium was not significantly affected by the PEC films produced at lower pH range. Thus, the PEC
films prepared at various pH values were non-adherent rather than cytotoxic. Three general cells
(fibrosarcoma, fibroblasts and chondrosarcoma cells) showed little cell adhesion on all polysaccharide
materials. Cell clusters were formed on all the polysaccharide films with many cells exhibiting
characteristics of apoptosis with a round cell morphology. The use of three different types of cells
showing the same effect means that the low adhesion observed was not due to a one-off outcome
but instead appear to be a general effect. Finally, the PEC films were highly non-adherent to the
adhesive tropoelastin which indicates the potential for a wide variety of non-biofouling applications.

Chapter 8 – Overall Conclusions and Future Work
162
Chapter 8 – Overall Conclusions and Future Work
8.1 General Conclusions
The aim of this thesis was to explore the effect of pH on polyelectrolyte complex formation to control
the degree of self-crosslinking of materials by avoiding the use of toxic chemical crosslinkers. The pH
was found to have a significant influence on the viscoelastic properties of PEC gels and the mechanical
properties of PEC films and scaffolds. The physicochemical properties of PEC gels were mainly affected
by the strength of electrostatic interaction (SEI) whereas dry PEC films were mainly affected by the
inter/intra-crosslinking (to some extent reliant on SEI) and composition. In addition to the composition
and inter/intra-crosslinking, the mechanical properties of PEC scaffolds were also affected by the pore
sizes.
The preparation pH controlled the degree of electrostatic interaction in the PEC gel formation. At
lower pH ranges (2-6) the SEI in PEC gels was higher than the SEI of PECs prepared at higher pH ranges
(7-12). This resulted in stronger self-crosslinking in the PEC gels prepared at pH 2-6. The strong
interactions led to the formation of higher yield, solid content, viscosity and fibre content in PEC gels.
The high fibre content in PEC gel precipitates prepared at low pH led to a rougher PEC film surface.
The strong electrostatic bond interaction between NH3+ and OSO3
- was confirmed for pH 3-7.4 with
FTIR at wavenumber, 1529 cm-1. The FTIR wavenumber band was absent at higher pH due to the
weaker electrostatic interaction caused by the deprotonation of CS. As measured with nitrogen,
carbon and sulfur (NCS) elemental analysis, the PECs prepared at pH range 3-8 contained a higher
fraction of CRG than the PECs prepared at pH range 9-12. The higher CRG content resulted in an
increase in the hydrophilicity of the PEC films, inducing greater swelling in films prepared at lower pH.
In addition, the strong electrostatic interaction at pH 3 and 5 resulted in the formation of strong intra-
crosslinked and weakly inter-crosslinked PEC films and scaffolds. Therefore the PEC films prepared at
lower pH range were less connected as a network, exhibiting lower strength and stiffness and, greater
mass loss and swelling. A summary of the physicochemical properties of PECs produced at low pH is
presented schematically in Figure 8.1.

Chapter 8 – Overall Conclusions and Future Work
163
Figure 8.1 – A summary of the effect of low pH on the production and physicochemical characterisation of CS-CRG PEC gels, films and scaffolds. The diagram can be followed from top to bottom tracing the arrows. Blue arrows indicate the link between the influence of parameter change on physicochemical properties. Green and red arrows indicate the increase and decrease of the parameter and resultant effects, respectively.
The biological properties of the materials were tested in the form of films. The results show that the
CS, CRG, CS-CRG PEC films exhibited highly non-biofouling properties. All polysaccharide materials
used were found to be non-cytotoxic when tested with fibrosarcoma cells. However the low cell
viability, round cell morphology and cluster formation of all the cells (fibrosarcoma, fibroblast and
chondrosarcoma) on the polysaccharide films, indicated that the materials were highly non-adhesive.
Nonetheless, the lower adhesion of tropoelastin on the PEC films compared with the CS and CRG films
shows that the PEC materials may possess high non-biofouling properties. The highly non-adhesive
surface of PECs may have been caused due to several factors including high hydrophilicity, swelling,
roughness, surface mobility and chemical groups which made it energetically unfavourable for both
hydrophobic and hydrophilic molecules to attach readily to the surface.
The main advantage of the PEC system lies in its ability to control the physicochemical properties of
materials by changing a broad range of reaction parameters. Furthermore, no auxiliary chemicals are
used which may be beneficial to both the environment and the long-term effects upon the body. In
addition, covalently crosslinked materials may be too stiff for some soft tissues, where the adhesion
of cells is not desired. Examples of applications may be to use the PEC materials in the form of film or
coating in brain, adipose, skin or articular cartilage implants due to their appropriate mechanical
properties. It is, therefore, envisaged that the self-crosslinked CS-CRG PEC gels, films, and scaffolds
would have high potential as crosslinker-free anti-fouling biomaterials.

Chapter 8 – Overall Conclusions and Future Work
164
8.2 Recommendations for Future Work
Further research upon PEs might extend their characterisation by using gel permeation
chromatography/size exclusion chromatography-multi-angle light scattering detection (GPC/SEC-
MALS) to find the molecular weights (MW) of CS and CRG. Circular dichroism (CD) and small angle X-
ray diffraction and spectroscopy (SAXS) could be used to determine the structural conformation of PEs
and PECs. The enthalpic and entropic change during complexation of CS and CRG may also be
measured using isothermal titration calorimetry (ITC). Finally, atomic force microscopy (AFM) can be
used to show the nanoscale surface roughness of films in both dry and wet conditions.
An interesting study may be to test the drug releasing properties of the PEC films prepared at different
pHs. This is because the materials are self-crosslinked and the viability of the drug may not be affected
as much as in the systems that require chemical crosslinking. Also many drugs are sensitive to elevated
temperatures and PEC systems do not require heat during preparation; except when the
concentration of the PEs is high which makes it less soluble. Furthermore, the electrostatic
environment may be suitable for the slow and controlled release of charged drugs. However, the
hypothesis is that the PECs produced at lower pH might elicit higher drug delivery rates due to the
lower inter-crosslinking.
The potential anti-fouling properties of the materials may require further biological characterisation.
It would be interesting to study the adhesion of different proteins (fibrinogen, laminin, vitronectin,
albumin) and cells (muscle cells, neural cells, monocytes and neutrophils) on the surface of PEC films.
This may provide a complete picture of the non-biofouling properties of the PEC materials.
Experiments may be conducted on bacterial adhesion, using Gram-positive and Gram-negative
bacteria for applications such as urinary catheters. Platelet adhesion and whole blood clotting studies
may also be carried out to find applications for blood contacting devices such as arterial stents.
The materials may also be used for tissue engineering applications as blank slates. These blank slate
PEC materials may be surface modified by incorporating signalling molecules such as peptides, arginyl-
glycyl-aspartic acid (RGD) or collagen which can alter the interaction between the material and cell
surface. Other functionalisation techniques have included layer-by-layer using heparin (Hep) and
hyaluronic acid (HyA) to specifically target integrin binding sites present on cells, to encourage the
growth of the desired cells, and discourage the growth of unwanted cells. It would also be interesting
to make PECs from proteins (polyampholytes) such as collagen, fibronectin, gelatin, silk fibroins,
soybean-based materials or a combination of those with CS and other polysaccharides. Finally,
blending proteins such as collagen to the PEC materials without covalent crosslinking may be used to

Chapter 8 – Overall Conclusions and Future Work
165
improve the initial attachment of cells. It is envisaged that the future work would potentially be of
great usability to treat targeted diseases such as skin ulcers (hard to heal chronic open wounds) and
degenerative joint diseases (deteriorated articular cartilage). Clinically, the PEC materials may be used
in one form or a combination of the forms such as PECs gels, film and scaffolds for wound healing
applications (Fig. 8.2).
Figure 8.2 – Creating versatile, application tailored systems for wound healing applications. The medical device may be used as a form of gel, film, scaffold or in the combination of the mentioned forms.
In the future, it may be worth investigating the biological properties of PEC scaffolds. There may be a
different response between cell attachment on films and scaffolds due to the different surface and
structural parameters.
In the search for effective, sustainable and economical biomaterials it is anticipated that these future
studies will enable the properties and functions of CS-CRG PEC gels, films and scaffolds to be fully
characterised for both non-biofouling and tissue engineering applications.

References
166
References
1. Rinaudo, M. Main properties and current applications of some polysaccharides as biomaterials. Polym. Int. 57, 397–430 (2008).
2. Gupta, G. G., De, S., Franco, A., Balu, A. & Luque, R. Sustainable biomaterials: Current trends, challenges and applications. Molecules 21, 48 (2015).
3. Berger, J., Reist, M., Mayer, J. M., Felt, O., Peppas, N. A. & Gurny, R. Structure and interactions in covalently and ionically crosslinked chitosan hydrogels for biomedical applications. Eur. J. Pharm. Biopharm. 57, 19–34 (2004).
4. Carreño-Gómez, B. & Duncan, R. Evaluation of the biological properties of soluble chitosan and chitosan microspheres. Int. J. Pharm. 148, 231–240 (1997).
5. Berger, J., Reist, M., Mayer, J. M., Felt, O. & Gurny, R. Structure and interactions in chitosan hydrogels formed by complexation or aggregation for biomedical applications. Eur. J. Pharm. Biopharm. 57, 35–52 (2004).
6. Araujo, J. V., Davidenko, N., Danner, M., Cameron, R. E. & Best, S. M. Novel porous scaffolds of pH responsive chitosan/carrageenan-based polyelectrolyte complexes for tissue engineering. J. Biomed. Mater. Res. - Part A 102, 4415–4426 (2014).
7. Mitsumata, T., Suemitsu, Y., Fujii, K., Fujii, T., Taniguchi, T. & Koyama, K. pH-response of chitosan, k-carrageenan, carboxymethyl cellulose sodium salt complex hydrogels. Polymer (Guildf). 44, 7103–7111 (2003).
8. Sakiyama, T., Chu, C.-H., Fujii, T. & Yano, T. Preparation of a polyelectrolyte complex gel from chitosan and κ-carrageenan and its pH-sensitive swelling. J. Appl. Polym. Sci. 50, 2021–2025 (1993).
9. Baldwin, A. D. & Kiick, K. L. Polysaccharide-modified synthetic polymeric biomaterials. Biopolymers 94, 128–40 (2010).
10. Yan, N. & Chen, X. Sustainability: Don’t waste seafood waste. Nature 524, 155–157 (2015).
11. Dennis, J. M. A guide to the seaweed industry. FAO Fish. Tech. Pap. 441 - Food Agric. Organ. United Nations 441, 1–105 (2003).
12. El-Hefian, E. A., Elgannoudi, E. S., Mainal, A. & Yahaya, A. H. Characterization of chitosan in acetic acid: Rheological and thermal studies. Turkish J. Chem. 34, 47–56 (2010).
13. Zhang, M., Li, X. H., Gong, Y. D., Zhao, N. M. & Zhang, X. F. Properties and biocompatibility of chitosan films modified by blending with PEG. Biomaterials 23, 2641–2648 (2002).
14. D’Ayala, G. G., Malinconico, M. & Laurienzo, P. Marine derived polysaccharides for biomedical applications: chemical modification approaches. Molecules 13, 2069–2106 (2008).
15. Griffon, D. J., Sedighi, M. R., Schaeffer, D. V, Eurell, J. A. & Johnson, A. L. Chitosan scaffolds: interconnective pore size and cartilage engineering. Acta Biomater. 2, 313–20 (2006).
16. Khan, T., Peh, K. & Ch’ng, H. Mechanical, bioadhesive strength and biological evaluations of chitosan films for wound dressing. J. Pharm. Pharm. Sci. 3, 303–311 (2000).
17. Nagahama, H., Nwe, N., Jayakumar, R., Koiwa, S., Furuike, T. & Tamura, H. Novel biodegradable chitin membranes for tissue engineering applications. Carbohydr. Polym. 73,

References
167
295–302 (2008).
18. He, P., Davis, S. S. & Illum, L. In vitro evaluation of the mucoadhesive properties of chitosan microspheres. Int. J. Pharm. 166, 75–88 (1998).
19. Fei Liu, X., Lin Guan, Y., Zhi Yang, D., Li, Z. & De Yao, K. Antibacterial action of chitosan and carboxymethylated chitosan. J. Appl. Polym. Sci. 79, 1324–1335 (2001).
20. Lima, P. H. L., Pereira, S. V. a, Rabello, R. B., Rodriguez-Castellón, E., Beppu, M. M., Chevallier, P., Mantovani, D. & Vieira, R. S. Blood protein adsorption on sulfonated chitosan and κ-carrageenan films. Colloids Surfaces B Biointerfaces 111, 719–725 (2013).
21. Shumilina, E. V & Shchipunov, Y. A. Chitosan-carrageenan gels. Kolloidn. Zhurnal 64, 413–420 (2002).
22. Satyam, A., Kumar, P., Fan, X., Gorelov, A., Rochev, Y., Joshi, L., Peinado, H., Lyden, D., Thomas, B., Rodriguez, B., Raghunath, M., Pandit, A. & Zeugolis, D. Macromolecular crowding meets tissue engineering by self-assembly: A paradigm shift in regenerative medicine. Adv. Mater. 26, 3024–3034 (2014).
23. Li, C., Hein, S. & Wang, K. Chitosan-carrageenan polyelectrolyte complex for the delivery of protein drugs. ISRN Biomater. 2013, 1–6 (2013).
24. Popa, E. G., Carvalho, P. P., Dias, A. F., Santos, T. C., Santo, V. E., Marques, A. P., Viegas, C. A., Dias, I. R., Gomes, M. E. & Reis, R. L. Evaluation of the in vitro and in vivo biocompatibility of carrageenan-based hydrogels. J. Biomed. Mater. Res. Part A 102, 4087–4097 (2014).
25. Popa, E., Reis, R. & Gomes, M. Chondrogenic phenotype of different cells encapsulated in κ-carrageenan hydrogels for cartilage regeneration strategies. Biotechnol. Appl. Biochem. 59, 132–141 (2012).
26. Liu, J., Willför, S. & Xu, C. A review of bioactive plant polysaccharides: Biological activities, functionalizatison, and biomedical applications. Bioact. Carbohydrates Diet. Fibre 5, 31–61 (2014).
27. Junter, G. A., Thébault, P. & Lebrun, L. Polysaccharide-based antibiofilm surfaces. Acta Biomater. 30, 13–25 (2016).
28. Araujo, J. V. Chitosan/carrageenan-based polyelectrolyte complexes and their composites with calcium phosphate for bone tissue engineering. (2013).
29. Bratskaya, S., Marinin, D., Simon, F., Synytska, A., Zschoche, S., Busscher, H. J., Jager, D. & van der Mei, H. C. Adhesion and viability of two enterococcal strains on covalently grafted chitosan and chitosan/κ-carrageenan multilayers. Biomacromolecules 8, 2960–2968 (2007).
30. Davidenko, N., Schuster, C. F., Bax, D. V, Farndale, R. W., Hamaia, S., Best, S. M. & Cameron, R. E. Evaluation of cell binding to collagen and gelatin: a study of the effect of 2D and 3D architecture and surface chemistry. J. Mater. Sci. Mater. Med. 27, 1–14 (2016).
31. Stevens, M. M. Exploring and engineering the cell-surface interface. Science (80-. ). 310, 1135–1138 (2005).
32. Yan, X. L., Khor, E. & Lim, L. Y. Chitosan-alginate films prepared with chitosans of different molecular weights. J. Biomed. Mater. Res. 58, 358–365 (2001).
33. Luppi, B., Bigucci, F., Abruzzo, A., Corace, G., Cerchiara, T. & Zecchi, V. Freeze-dried chitosan/pectin nasal inserts for antipsychotic drug delivery. Eur. J. Pharm. Biopharm. 75, 381–387 (2010).

References
168
34. Silva, C. L., Pereira, J. C., Ramalho, A., Pais, A. A. C. C. & Sousa, J. J. S. Films based on chitosan polyelectrolyte complexes for skin drug delivery: Development and characterization. J. Memb. Sci. 320, 268–279 (2008).
35. Wang, Q. Z., Chen, X. G., Liu, N., Wang, S. X., Liu, C. S., Meng, X. H. & Liu, C. G. Protonation constants of chitosan with different molecular weight and degree of deacetylation. Carbohydr. Polym. 65, 194–201 (2006).
36. Mihaila, S. M., Gaharwar, A. K., Reis, R. L., Marques, A. P., Gomes, M. E. & Khademhosseini, A. Photocrosslinkable kappa-carrageenan hydrogels for tissue engineering applications. Adv. Healthc. Mater. 2, 895–907 (2013).
37. Araujo, J. V, Davidenko, N., Danner, M., Cameron, R. E. & Best, S. M. Novel porous scaffolds of pH responsive Chitosan/carrageenan-based polyelectrolyte complexes for tissue engineering. J. Biomed. Mater. Res. A 102, 4415–26 (2014).
38. Espinosa-Andrews, H., Enríquez-Ramírez, K. E., García-Márquez, E., Ramírez-Santiago, C., Lobato-Calleros, C. & Vernon-Carter, J. Interrelationship between the zeta potential and viscoelastic properties in coacervates complexes. Carbohydr. Polym. 95, 161–166 (2013).
39. Jenkins, A. D., Kratochvíl, P., Stepto, R. F. T. & Suter, U. W. Glossary of basic terms in polymer science (IUPAC Recommendations 1996). Pure Appl. Chem. 68, 2287–2311 (1996).
40. Dobrynin, A. V. & Rubinstein, M. Theory of polyelectrolytes in solutions and at surfaces. Prog. Polym. Sci. 30, 1049–1118 (2005).
41. De Dardel, F. & Arden, T. V. Ion Exchangers. Ullmann’s Encycl. Ind. Chem. (Wiley-VCH Verlag GmbH & Co. KGaA, 2000).
42. Ou, Z. & Muthukumar, M. Entropy and enthalpy of polyelectrolyte complexation: Langevin dynamics simulations. J. Chem. Phys. 124, 154902 (2006).
43. De Kruif, C. G., Weinbreck, F. & De Vries, R. Complex coacervation of proteins and anionic polysaccharides. Curr. Opin. Colloid Interface Sci. 9, 340–349 (2004).
44. Carneiro-Da-Cunha, M. G., Cerqueira, M. A., Souza, B. W. S., Teixeira, J. A. & Vicente, A. A. Influence of concentration, ionic strength and pH on zeta potential and mean hydrodynamic diameter of edible polysaccharide solutions envisaged for multinanolayered films production. Carbohydr. Polym. 85, 522–528 (2011).
45. Förster, S. & Schmidt, M. Static and dynamic light scattering by aqueous polyelectrolyte solutions: effect of molecular weight, charge density and added salt. Polymer (Guildf). 31, 781–792 (1989).
46. Drogoz, A., David, L., Rochas, C., Domard, A. & Delair, T. Polyelectrolyte complexes from polysaccharides: Formation and stoichiometry monitoring. Langmuir 23, 10950–10958 (2007).
47. Wang, L., Wang, Z., Jiang, R., Yin, Y. & Li, B. Conformation transitions of a single polyelectrolyte chain in a poor solvent: a replica-exchange lattice Monte-Carlo study. Soft Matter 13, 2216–2227 (2017).
48. Vishalakshi, B., Ghosh, S. & Kalpagam, V. The effects of charge density and concentration on the composition of polyelectrolyte complexes. Polymer (Guildf). 34, 3270–3275 (1993).
49. Tang, H., Liao, Q. & Zhang, P. Conformation of polyelectrolytes in poor solvents: Variational approach and quantitative comparison with scaling predictions. J. Chem. Phys. 140, (2014).

References
169
50. Araki, T. Conformational changes of polyelectrolyte chains in solvent mixtures. Soft Matter 12, 6111–6119 (2016).
51. Ru, Q., Wang, Y., Lee, J., Ding, Y. & Huang, Q. Turbidity and rheological properties of bovine serum albumin/pectin coacervates: Effect of salt concentration and initial protein/polysaccharide ratio. Carbohydr. Polym. 88, 838–846 (2012).
52. Dautzenberg, H., Rother, G. & Hartmann, J. Light scattering studies of polyelectrolyte complex formation-effect of polymer concentration. Macro-ion characterization: from dilute solutions to complex fluids. (American Chemical Society (ACS), 1994).
53. Dautzenberg, H., Rother, G. & Hartmann, J. Light-scattering studies of polyelectrolyte complex formation. Effect of polymer concentration. (American Chemical Society (ACS), 1994).
54. Becker, A. L., Henzler, K., Welsch, N., Ballauff, M. & Borisov, O. Proteins and polyelectrolytes: A charged relationship. Curr. Opin. Colloid Interface Sci. 17, 90–96 (2012).
55. Saecker, R. M. Protein–DNA Interactions: Polyelectrolyte Effects. Encycl. life Sci. 1–6 (2007).
56. Cranford, S. W., Ortiz, C. & Buehler, M. J. Mechanomutable properties of a PAA/PAH polyelectrolyte complex: Rate dependence and ionization effects on tunable adhesion strength. Soft Matter 6, 4175–4188 (2010).
57. Mortimer, D. A. Synthetic polyelectrolytes - A review. Polym. Int. 25, 29–41 (1991).
58. Krayukhina, M. A., Samoilova, N. A. & Yamskov, I. A. Polyelectrolyte complexes of chitosan: formation, properties and applications. Russ. Chem. Rev. 77, 799–813 (2008).
59. Carriers, P. D., Čalija, B., Nebojša, C., Jela, M. & Bojan Calija, Nebojsa Cekic, J. M. Chitosan-based polyelectrolyte complexes: Characteristics and application in formulation of particulate drug carriers. Part. Drug Carriers (2015).
60. Serban, M. A., Scott, A. & Prestwich, G. D. Use of hyaluronan-derived hydrogels for three-dimensional cell culture and tumor xenografts. Curent Protoc. cell Biol. 1–30 (2008).
61. Freier, T., Koh, H. S., Kazazian, K. & Shoichet, M. S. Controlling cell adhesion and degradation of chitosan films by N-acetylation. Biomaterials 26, 5872–8 (2005).
62. Kim, I.-Y., Seo, S.-J., Moon, H.-S., Yoo, M.-K., Park, I.-Y., Kim, B.-C. & Cho, C.-S. Chitosan and its derivatives for tissue engineering applications. Biotechnol. Adv. 26, 1–21 (2008).
63. Dutta, P. K., Dutta, J. & Tripathi, V. S. Chitin and chitosan: Chemistry, properties and applications. J. Sci. Ind. Res. 63, 20–31 (2004).
64. Younes, I. & Rinaudo, M. Chitin and chitosan preparation from marine sources. Structure, properties and applications. Mar. Drugs 13, 1133–1174 (2015).
65. Malafaya, P. B., Silva, G. A. & Reis, R. L. Natural-origin polymers as carriers and scaffolds for biomolecules and cell delivery in tissue engineering applications. Adv. Drug Deliv. Rev. 59, 207–233 (2007).
66. Gartner, C. Chitosan scaffolds for tissue engineering: relationship of structure and properties. Soc. Plast. Eng. 1–2 (2012).
67. Yang, T.-L. L. Chitin-based materials in tissue engineering: Applications in soft tissue and epithelial organ. Int. J. Mol. Sci. 12, 1936–63 (2011).
68. Felt, O., Furrer, P., Mayer, J. M., Plazonnet, B., Buri, P. & Gurny, R. Topical use of chitosan in ophthalmology: Tolerance assessment and evaluation of precorneal retention. Int. J. Pharm.

References
170
180, 185–193 (1999).
69. Berger, J., Reist, M., Mayer, J. M., Felt, O., Peppas, N. A. & Gurny, R. Structure and interactions in covalently and ionically crosslinked chitosan hydrogels for biomedical applications. Eur. J. Pharm. Biopharm. 57, 19–34 (2004).
70. Muzzarelli, R. A. A. Human enzymatic activities related to the therapeutic administration of chitin derivatives. Cell. Mol. Life Sci. 53, 267–276 (1997).
71. Suh, J. K. & Matthew, H. W. Application of chitosan-based polysaccharide biomaterials in cartilage tissue engineering: a review. Biomaterials 21, 2589–2598 (2000).
72. Muzzarelli, R. A. A., Greco, F., Busilacchi, A., Sollazzo, V. & Gigante, A. Chitosan, hyaluronan and chondroitin sulfate in tissue engineering for cartilage regeneration: A review. Carbohydr. Polym. 89, 723–739 (2012).
73. Mhurchu, C. N., Poppitt, S. D., McGill, A.-T., Leahy, F. E., Bennett, D. A., Lin, R. B., Ormrod, D., Ward, L., Strik, C. & Rodgers, A. The effect of the dietary supplement, chitosan, on body weight: a randomised controlled trial in 250 overweight and obese adults. Int. J. Obes. 28, 1149–1156 (2004).
74. Gades, M. D. & Stern, J. S. Chitosan supplementation does not affect fat absorption in healthy males fed a high-fat diet, a pilot study. Int. J. Obes. Relat. Metab. Disord. 26, 119–22 (2002).
75. Muzzarelli, R. A. A. Chitins and chitosans for the repair of wounded skin, nerve, cartilage and bone. Carbohydr. Polym. 76, 167–182 (2009).
76. Carmona-Ribeiro, A. M. & de Melo Carrasco, L. D. Cationic antimicrobial polymers and their assemblies. Int. J. Mol. Sci. 14, 9906–46 (2013).
77. Aziz, M. A., Cabral, J. D., Brooks, H. J. L., Moratti, S. C. & Hanton, L. R. Antimicrobial properties of a chitosan dextran-based hydrogel for surgical use. Antimicrob. Agents Chemother. 56, 280–287 (2012).
78. Raafat, D. & Sahl, H. G. Chitosan and its antimicrobial potential - A critical literature survey. Microb. Biotechnol. 2, 186–201 (2009).
79. Junginger, H. E. & Verhoef, J. C. Macromolecules as safe penetration enhancers for hydrophilic drugs—a fiction? Pharm. Sci. Technolo. Today 1, 370–376 (1998).
80. Millner, R., Lockhart, A. S. & Marr, R. Chitosan arrests bleeding in major hepatic injuries with clotting dysfunction: An in vivo experimental study in a model of hepatic injury in the presence of moderate systemic heparinisation. Ann. R. Coll. Surg. Engl. 92, 559–561 (2010).
81. Bulwan, M., Wójcik, K., Zapotoczny, S., Nowakowska, M., Bulwan, M., Wójcik, K., Zapotoczny, S. & Nowakowska, M. Chitosan-based ultrathin films as antifouling, anticoagulant and antibacterial protective coatings. J. Biomater. Sci. 23, 1963–1980 (2012).
82. Il’ina, A. V. & Varlamov, V. P. Chitosan-based polyelectrolyte complexes: A review. Appl. Biochem. Microbiol. 41, 9–16 (2005).
83. Prajapati, V. D., Maheriya, P. M., Jani, G. K. & Solanki, H. K. Carrageenan: A natural seaweed polysaccharide and its applications. Carbohydr. Polym. 105, 97–112 (2014).
84. Manuhara, G. J., Praseptiangga, D. & Riyanto, R. A. Extraction and characterization of refined k-carrageenan of red algae [Kappaphycus Alvarezii (Doty ex P.C. Silva, 1996)] originated from Karimun Jawa Islands. Aquat. Procedia 7, 106–111 (2016).

References
171
85. Campo, V. L., Kawano, D. F., Silva Jr., D. B. Da & Carvalho, I. Carrageenans: Biological properties, chemical modifications and structural analysis – A review. Carbohydr. Polym. 77, 167–180 (2009).
86. Gu, Y. S., Decker, E. A. & McClements, D. J. Influence of pH and carrageenan type on properties of β-lactoglobulin stabilized oil-in-water emulsions. Food Hydrocoll. 19, 83–91 (2005).
87. Velde, F. van de, Antipova, A. S., Rollema, H. S., Burova, T. V., Grinberg, N. V., Pereira, L., Gilsenan, P. M., Tromp, R. H., Rudolph, B. & Grinberg, V. Y. The structure of k/i-hybrid carrageenans II. Coil-helix transition as a function of chain composition. Carbohydr. Res. 340, 1113–1129 (2005).
88. Santo, V. E., Frias, A. M., Carida, M., Cancedda, R., Gomes, M. E., Mano, J. F. & Reis, R. L. Carrageenan-based hydrogels for the controlled delivery of PDGF-BB in bone tissue engineering applications. Biomacromolecules 10, 1392–1401 (2009).
89. Briones, A. V, Sato, T. & Bigol, U. G. Antibacterial activity of polyethylenimine/carrageenan multilayer against pathogenic bacteria. Adv. Chem. Eng. Sci. 4, 233–241 (2014).
90. Sukhishvili, S. A., Kharlampieva, E. & Izumrudov, V. Where polyelectrolyte multilayers and polyelectrolyte complexes meet. Macromolecules 39, 8873–8881 (2006).
91. Teng, Y. D., Lavik, E. B., Qu, X., Park, K. I., Ourednik, J., Zurakowski, D., Langer, R. & Snyder, E. Y. Functional recovery following traumatic spinal cord injury mediated by a unique polymer scaffold seeded with neural stem cells. Proc. Natl. Acad. Sci. U. S. A. 99, 3024–9 (2002).
92. Hoffman, A. S. Hydrogels for biomedical applications. Adv. Drug Deliv. Rev. 64, 18–23 (2012).
93. Luo, Y. & Wang, Q. Recent development of chitosan-based polyelectrolyte complexes with natural polysaccharides for drug delivery. Int. J. Biol. Macromol. 64, 353–67 (2014).
94. Long, D. D. & Luyen, D. V. Chitosan-carboxymethylcellulose hydrogels as supports for cell immobilization. J. Macromol. Sci. Appl. Chem. A33, 1875–1884 (1996).
95. Hamman, J. H. Chitosan based polyelectrolyte complexes as potential carrier materials in drug delivery systems. Mar. Drugs 8, 1305–22 (2010).
96. Tsuchida, E., Osada, Y. & Ohno, H. Formation of interpolymer complexes. J. Macromol. Sci. Part B Phys. 17, 683–714 (1980).
97. Zezin, A. B. & Kabanov, V. A. A new class of complex water-soluble polyelectrolytes. Russ. Chem. Rev. 51, 833–855 (1982).
98. Pergushov, D. V., Müller, A. H. E. & Schacher, F. H. Micellar interpolyelectrolyte complexes. Chem. Soc. Rev. 41, 6888–901 (2012).
99. Guzey, D. & McClements, D. J. Characterization of beta-lactoglobulin-chitosan interactions in aqueous solutions: A calorimetry, light scattering, electrophoretic mobility and solubility study. Food Hydrocoll. 20, 124–131 (2006).
100. Gu, Y. S., Decker, E. A. & McClements, D. J. Influence of pH and iota-carrageenan concentration on physicochemical properties and stability of beta-lactoglobulin-stabilized oil-in-water emulsions. J. Agric. Food Chem. 52, 3626–32 (2004).
101. Kulkarni, A. D., Vanjari, Y. H., Sancheti, K. H., Patel, H. M., Belgamwar, V. S., Surana, S. J. & Pardeshi, C. V. Polyelectrolyte complexes: mechanisms, critical experimental aspects, and applications. Artif. cells, nanomedicine, Biotechnol. 44, 1615–1625 (2016).

References
172
102. Espinosa-Andrews, H., Sandoval-Castilla, O., Vázquez-Torres, H., Vernon-Carter, E. J. & Lobato-Calleros, C. Determination of the gum arabic-chitosan interactions by fourier transform infrared spectroscopy and characterization of the microstructure and rheological features of their coacervates. Carbohydr. Polym. 79, 541–546 (2010).
103. Xu, J., Cai, N., Xu, W., Xue, Y., Wang, Z., Dai, Q. & Yu, F. Mechanical enhancement of nanofibrous scaffolds through polyelectrolyte complexation. Nanotechnology 24, 25701 (2013).
104. Nath, S. D., Abueva, C., Kim, B. & Lee, B. T. Chitosan-hyaluronic acid polyelectrolyte complex scaffold crosslinked with genipin for immobilization and controlled release of BMP-2. Carbohydr. Polym. 115, 160–169 (2015).
105. Moschakis, T., Murray, B. S. & Biliaderis, C. G. Modifications in stability and structure of whey protein-coated o/w emulsions by interacting chitosan and gum arabic mixed dispersions. Food Hydrocoll. 24, 8–17 (2010).
106. Shinde, U. A. & Nagarsenker, M. S. Characterization of gelatin-sodium alginate complex coacervation system. Indian J. Pharm. Sci. 71, 313–317 (2009).
107. Rosca, C., Popa, M. I., Lisa, G. & Chitanu, G. C. Interaction of chitosan with natural or synthetic anionic polyelectrolytes. 1. The chitosan-carboxymethylcellulose complex. Carbohydr. Polym. 62, 35–41 (2005).
108. Webster, L., Webster, L., Huglin, M. B., Huglin, M. B., Robb, I. D. & Robb, I. D. Complex formation between polyelectrolytes in dilute aqueous solution. Polymer (Guildf). 38, 1373–1380 (1997).
109. Hernández-Rodríguez, L., Lobato-Calleros, C., Pimentel-González, D. J. & Vernon-Carter, E. J. Lactobacillus plantarum protection by entrapment in whey protein isolate: κ-carrageenan complex coacervates. Food Hydrocoll. 36, 181–188 (2014).
110. Schatz, C., Lucas, J.-M., Viton, C., Domard, A., Pichot, C. & Delair, T. Formation and properties of positively charged colloids based on polyelectrolyte complexes of biopolymers. Langmuir 20, 7766–7778 (2004).
111. Yang, Y., Anvari, M., Pan, C. H. & Chung, D. Characterisation of interactions between fish gelatin and gum arabic in aqueous solutions. Food Chem. 135, 555–561 (2012).
112. Lee, E. J. & Lim, K.-H. Relative charge density model on chitosan–fucoidan electrostatic interaction: Qualitative approach with element analysis. J. Biosci. Bioeng. 119, 237–246 (2014).
113. Bungenberg de Jong, H. B. & Kruyt, H. R. Coacervation (partial miscibility in colloid systems). Proc. Sect. Sci, Koninkijke Ned. Akad. van Wet. 32, 849–856 (1929).
114. Kizilay, E., Kayitmazer, A. B. & Dubin, P. L. Complexation and coacervation of polyelectrolytes with oppositely charged colloids. Adv. Colloid Interface Sci. 167, 24–37 (2011).
115. Weinbreck, F., Tromp, R. & Kruif, C. De. Composition and structure of whey protein/gum-arabic coacervates. Biomacromolecules 5, 87–108 (2004).
116. Cooper, C. L., Dubin, P. L., Kayitmazer, A. B. & Turksen, S. Polyelectrolyte–protein complexes. Curr. Opin. Colloid Interface Sci. 10, 52–78 (2005).
117. Alvarez-Lorenzo, C., Blanco-Fernandez, B., Puga, A. M. & Concheiro, A. Crosslinked ionic polysaccharides for stimuli-sensitive drug delivery. Adv. Drug Deliv. Rev. 65, 1148–1171 (2013).

References
173
118. Mangione, M. R., Giacomazza, D., Bulone, D., Martorana, V., Cavallaro, G. & San Biagio, P. L. K+ and Na+ effects on the gelation properties of k-carrageenan. Biophys. Chem. 113, 129–35 (2005).
119. Wang, Z., Cai, N., Dai, Q., Li, C., Hou, D., Luo, X., Xue, Y. & Yu, F. Effect of thermal annealing on mechanical properties of polyelectrolyte complex nanofiber membranes. 15, 1406–1413 (2014).
120. Philipp, B., Dautzenberg, H., Linow, K.-J., Kötz, J. & Dawydoff, W. Polyelectrolyte complexes — recent developments and open problems. Prog. Polym. Sci. 14, 91–172 (1989).
121. Sæther, H. V., Holme, H. K., Maurstad, G., Smidsrød, O. & Stokke, B. T. Polyelectrolyte complex formation using alginate and chitosan. Carbohydr. Polym. 74, 813–821 (2008).
122. Tsuchida, E. Formation of polyelectrolyte complexes and their structures. J. Macromol. Sci. Part A 31, 1–15 (1994).
123. Thünemann, A. F., Müller, M., Dautzenberg, H., Joanny, J.-F. & Löwen, H. Polyelectrolyte Complexes. Adv. Polym. Sci. Sci. 166, 113–171 (2004).
124. Dumitriu, S., Chornet, E., Dumitriu, S. & Chornet, E. Inclusion and release of proteins from polysaccharide-based polyion complexes. Adv. Drug Deliv. Rev. 31, 223–246 (1998).
125. Turgeon, S. L., Schmitt, C. & Sanchez, C. Protein-polysaccharide complexes and coacervates. Curr. Opin. Colloid Interface Sci. 12, 166–178 (2007).
126. Schmitt, C. & Turgeon, S. L. Protein/polysaccharide complexes and coacervates in food systems. Adv. Colloid Interface Sci. 167, 63–70 (2011).
127. Bertrand, P., Jonas, A., Laschewsky, A. & Legras, R. Ultrathin polymer coatings by complexation of polyelectrolytes at interfaces: suitable materials, structure and properties. Macromol. Rapid Commun. 21, 319–348 (2000).
128. Etrych, T., Leclercq, L., Boustta, M. & Vert, M. Polyelectrolyte complex formation and stability when mixing polyanions and polycations in salted media: A model study related to the case of body fluids. Eur. J. Pharm. Sci. 25, 281–288 (2005).
129. Gärdlund, L., Wågberg, L. & Norgren, M. New insights into the structure of polyelectrolyte complexes. J. Colloid Interface Sci. 312, 237–246 (2007).
130. Kramarenko, E. Y. & Khokhlov, A. R. Stoichiometric polyelectrolyte complexes of ionic block copolymers and oppositely charged polyions. J. Chem. Phys. 125, 194902–194910 (2006).
131. Dakhara, S. L. & Anajwala, C. C. Polyelectrolyte complex: A pharmaceutical review. Syst. Rev. Pharm. 1, 121 (2010).
132. Bhise, K. S., Dhumal, R. S., Paradkar, A. R. & Kadam, S. S. Effect of drying methods on swelling, erosion and drug release from chitosan-naproxen sodium complexes. Am. Assoc. Pharm. Sci. 9, 1–12 (2008).
133. Harnsilawat, T., Pongsawatmanit, R. & McClements, D. J. Characterization of β-lactoglobulin-sodium alginate interactions in aqueous solutions: A calorimetry, light scattering, electrophoretic mobility and solubility study. Food Hydrocoll. 20, 577–585 (2006).
134. Huang, G.-Q., Xiao, J.-X., Jia, L. & Yang, J. Complex coacervation of O-carboxymethylated chitosan and gum arabic. Int. J. Polym. Mater. Polym. Biomater. 64, 198–204 (2014).
135. Borue, V. Y. & Erukhimovich, I. Y. A statistical-theory of globular polyelectrolyte complexes.

References
174
Macromolecules 23, 3625–3632 (1990).
136. Kudlay, A., Ermoshkin, A. V & Olvera de la Cruz, M. Complexation of oppositely charged polyelectrolytes: Effect of ion pair formation. Macromolecules 37, 9231–9241 (2004).
137. Fredheim, G. E. & Christensen, B. E. Polyelectrolyte complexes: Interactions between lignosulfonate and chitosan. Biomacromolecules 4, 232–9 (2003).
138. Chieng, Y. Y. & Chen, S. B. Complexation of cationic polyelectrolyte with anionic phospholipid vesicles: Concentration, molecular weight and salt effects. J. Colloid Interface Sci. 354, 226–233 (2011).
139. Gåserød, O., Smidsrød, O. & Skjåk-Bræk, G. Microcapsules of alginate-chitosan – I. Biomaterials 19, 1815–1825 (1998).
140. Polk, A., Amsden, B., De Yao, K., Peng, T. & Goosen, M. F. A. Controlled release of albumin from chitosan—alginate microcapsules. J. Pharm. Sci. 83, 178–185 (1994).
141. Aksungur, P., Sungur, A., Unal, S., Iskit, A. B., Squier, C. A. & Senel, S. Chitosan delivery systems for the treatment of oral mucositis: in vitro and in vivo studies. J. Control. Release 98, 269–79 (2004).
142. El-Gibaly, I. Development and in vitro evaluation of novel floating chitosan microcapsules for oral use: comparison with non-floating chitosan microspheres. Int. J. Pharm. 249, 7–21 (2002).
143. Hugerth, A., Caram-Lelham, N. & Sundelöf, L.-O. The effect of charge density and conformation on the polyelectrolyte complex formation between carrageenan and chitosan. Carbohydr. Polym. 34, 149–156 (1997).
144. Martins, A. F., Pereira, A. G. B., Fajardo, A. R., Rubira, A. F. & Muniz, E. C. Characterization of polyelectrolytes complexes based on N,N,N-trimethyl chitosan/heparin prepared at different pH conditions. Carbohydr. Polym. 86, 1266–1272 (2011).
145. Sakiyama, T., Chu, C.-H., Fujii, T. & Yano, T. Preparation of a polyelectrolyte complex gel from chitosan and κ-carrageenan and its pH-sensitive swelling. J. Appl. Polym. Sci. 50, 2021–2025 (1993).
146. Volod′ko, A. V, Davydova, V. N., Barabanova, A. O., Solov′eva, T. F. & Ermak, I. M. Formation of soluble chitosan–carrageenan polyelectrolyte complexes. Chem. Nat. Compd. 48, 353–357 (2012).
147. Carneiro, T. N., Novaes, D. S., Rabelo, R. B., Celebi, B., Chevallier, P., Mantovani, D., Beppu, M. M. & Vieira, R. S. BSA and fibrinogen adsorption on chitosan/κ-carrageenan polyelectrolyte complexes. Macromol. Biosci. 13, 1072–1083 (2013).
148. Park, S. Y., Lee, B. I., Jung, S. T. & Park, H. J. Biopolymer composite films based on κ-carrageenan and chitosan. Mater. Res. Bull. 36, 511–519 (2001).
149. Rosca, C., Novac, O., Lisa, G. & Popa, M. I. Polyelectrolyte complexes of chitosan with dextran sulphate. Synthesis and characterization. Cellul. Chem. Technol. 45, 185–189 (2011).
150. Abruzzo, A., Bigucci, F., Cerchiara, T., Saladini, B., Gallucci, M. C., Cruciani, F., Vitali, B. & Luppi, B. Chitosan/alginate complexes for vaginal delivery of chlorhexidine digluconate. Carbohydr. Polym. 91, 651–658 (2013).
151. Li, X., Xie, H., Lin, J., Xie, W. & Ma, X. Characterization and biodegradation of chitosan-alginate polyelectrolyte complexes. Polym. Degrad. Stab. 94, 1–6 (2009).

References
175
152. Florczyk, S. J., Wang, K., Jana, S., Wood, D. L., Sytsma, S. K., Sham, J. G., Kievit, F. M. & Zhang, M. Porous chitosan-hyaluronic acid scaffolds as a mimic of glioblastoma microenvironment ECM. Biomaterials 34, 10143–10150 (2013).
153. Bhardwaj, N. & Kundu, S. C. Silk fibroin protein and chitosan polyelectrolyte complex porous scaffolds for tissue engineering applications. Carbohydr. Polym. 85, 325–333 (2011).
154. Ma, G., Wang, Z., Chen, J., Yin, R., Chen, B. & Nie, J. Freeze-dried chitosan–sodium hyaluronate polyelectrolyte complex fibers as tissue engineering scaffolds. New J. Chem. 38, 1211–1217 (2014).
155. Assaad, E., Wang, Y. J., Zhu, X. X. & Mateescu, M. A. Polyelectrolyte complex of carboxymethyl starch and chitosan as drug carrier for oral administration. Carbohydr. Polym. 84, 1399–1407 (2011).
156. Takahashi, T., Takayama, K., Machida, Y. & Nagai, T. Characteristics of polyion complexes of chitosan with sodium alginate and sodium polyacrylate. Int. J. Pharm. 61, 35–41 (1990).
157. Schatz, C., Domard, A., Viton, C., Pichot, C. & Delair, T. Versatile and efficient formation of colloids of biopolymer-based polyelectrolyte complexes. Biomacromolecules 5, 1882–92 (2004).
158. He, Q., Ao, Q., Gong, K., Zhang, L., Hu, M., Gong, Y. & Zhang, X. Preparation and characterization of chitosan-heparin composite matrices for blood contacting tissue engineering. Biomed. Mater. 5, 1–16 (2010).
159. Chen, W.-B., Wang, L.-F., Chen, J.-S. & Fan, S.-Y. Characterization of polyelectrolyte complexes between chondroitin sulfate and chitosan in the solid state. J. Biomed. Mater. Res. A 75, 128–137 (2005).
160. Coimbra, P., Ferreira, P., de Sousa, H. C., Batista, P., Rodrigues, M. a, Correia, I. J. & Gil, M. H. Preparation and chemical and biological characterization of a pectin/chitosan polyelectrolyte complex scaffold for possible bone tissue engineering applications. Int. J. Biol. Macromol. 48, 112–118 (2011).
161. Espinosa-Andrews, H., Lobato-Calleros, C., Loeza-Corte, J. M., Beristain, C. I., Rodríguez-Huezo, M. E. & Vernon-Carter, E. J. Quantification of the composition of gum arabic-chitosan coacervates by HPLC. Rev. Mex. Ing. Química 7, 293–298 (2008).
162. Muzzarelli, R. A. Colorimetric determination of chitosan. Anal. Biochem. 260, 255–7 (1998).
163. Wischke, C. & Borchert, H.-H. Increased sensitivity of chitosan determination by a dye binding method. Carbohydr. Res. 341, 2978–9 (2006).
164. Tojo, E. & Prado, J. A simple 1H NMR method for the quantification of carrageenans in blends. Carbohydr. Polym. 53, 325–329 (2003).
165. Badawy, M. E. I. A new rapid and sensitive spectrophotometric method for determination of a biopolymer chitosan. Int. J. Carbohydr. Chem. 2012, 1–7 (2012).
166. Neugebauer, W. A., Neugebauer, E. & Brzezinski, R. Determination of the degree of N-acetylation of chitin-chitosan with picric acid. Carbohydr. Res. 189, 363–367 (1989).
167. Prochazkova, S., Vårum, K. M. & Ostgaard, K. Quantitative determination of chitosans by ninhydrin. Carbohydr. Polym. 38, 115–122 (1999).
168. Curotto, E. & Aros, F. Quantitative determination of chitosan and the percentage of free amino groups. Anal. Biochem. 211, 240–241 (1993).

References
176
169. Larionova, N. I., Zubaerova, D. K., Guranda, D. T., Pechyonkin, M. A. & Balabushevich, N. G. Colorimetric assay of chitosan in presence of proteins and polyelectrolytes by using o-phthalaldehyde. Carbohydr. Polym. 75, 724–727 (2009).
170. Bodnar, M., Minko, T., Hartmann, J. F. & Borbely, J. Fluorescent nanoparticles based on chitosan. NSTI-Nanotech 2, 279–282 (2007).
171. Chen, Y. & Zhang, Y. Fluorescent quantification of amino groups on silica nanoparticle surfaces. Anal. Bioanal. Chem. 399, 2503–2509 (2011).
172. Hoffmann, S., Fuenzalida Werner, J. P., Moreno-Villoslada, I. & Goycoolea, F. M. New insights into the nature of the cibacron brilliant red 3B-A – chitosan interaction. Pure Appl. Chem. 88, 891–904 (2016).
173. Yabe, Y., Ninomiya, T., Tatsuno, T. & Okad, A. Simple colorimetric determination of carrageenan in jellies and salad dressings. J. Assoc. Off. Anal. Chem. 74, 1019–1022 (1991).
174. Michon, C., Konaté, K., Cuvelier, G. & Launay, B. Gelatin/carrageenan interactions in coil and ordered conformations followed by a methylene blue spectrophotometric method. Food Hydrocoll. 16, 613–618 (2002).
175. Soedjak, H. S. Colorimetric determination of carrageenans and other anionic hydrocolloids with methylene blue. Anal. Chem. 66, 4514–4518 (1994).
176. Michon, C. Gelatin/iota-carrageenan interactions in non-gelling conditions. Food Hydrocoll. 14, 203–208 (2000).
177. Schoenberg, M. D. & Moore, R. D. The conformation of hyaluronic acid and chondroitin sulfate C: The metachromatic reaction. Biochim. Biophys. Acta 83, 42–51 (1964).
178. Swinehart, D. F. The Beer-Lambert Law. J. Chem. Educ. 39, 333–335 (1962).
179. Adamaikova, L., Pavlikova, K. & Sevaik, P. The decay of methylene blue in alkaline solution. React. Kinet. Catal. Lett. 69, 91–94 (2000).
180. Oster, G. & Wotherspoon, N. Photoreduction of methylene blue by ethylenediaminetetraacetic acid. J. Am. Chem. Soc. 79, 4836–4838 (1957).
181. Vernille, J. & Williams, S. Lightfast properties of azo and polycyclic aromatic imaging dyes. in Digit. Solid State Cameras Des. Appl. 3302, 130–137 (1998).
182. Girod, S., Boissière, M., Longchambon, K., Begu, S., Tourne-Pétheil, C. & Devoisselle, J. M. Polyelectrolyte complex formation between iota-carrageenan and poly(l-lysine) in dilute aqueous solutions: a spectroscopic and conformational study. Carbohydr. Polym. 55, 37–45 (2004).
183. Paradossi, G., Chiessi, E. & Malovıkova, A. Study of the interactions of D- and L-polylysine enantiomers with pectate in aqueous solutions. Biopolymers 50, 201–209 (1999).
184. Peppas, N. A. Hydrogels in medicine and pharmacy. Br. Polym. J. 21, 184 (1989).
185. Walstra, P. Physical Chemistry of Foods. Eur. J. Pharm. Biopharm. 57, (Marcel Dekker, 2004).
186. Huang, G. Q., Xiao, J. X., Wang, S. Q. & Qiu, H. W. Rheological properties of O-carboxymethyl chitosan – gum arabic coacervates as a function of coacervation pH. Food Hydrocoll. 43, 436–441 (2015).
187. De Britto, D. & Campana-Filho, S. P. A kinetic study on the thermal degradation of N,N,N-trimethylchitosan. Polym. Degrad. Stab. 84, 353–361 (2004).

References
177
188. Yen, M. T., Yang, J. H. & Mau, J. L. Physicochemical characterization of chitin and chitosan from crab shells. Carbohydr. Polym. 75, 15–21 (2009).
189. Fajardo, A. R., Piai, J. F., Rubira, A. F. & Muniz, E. C. Time- and pH-dependent self-rearrangement of a swollen polymer network based on polyelectrolytes complexes of chitosan/chondroitin sulfate. Carbohydr. Polym. 80, 934–943 (2010).
190. Chang, K. L. B., Tsai, G., Lee, J. & Fu, W. R. Heterogeneous N-deacetylation of chitin in alkaline solution. Carbohydr. Res. 303, 327–332 (1997).
191. Choi, J. & Rubner, M. F. Influence of the degree of ionization on weak polyelectrolyte multilayer assembly. Macromolecules 38, 116–124 (2005).
192. Fu, J., Ji, J., Yuan, W. & Shen, J. Construction of anti-adhesive and antibacterial multilayer films via layer-by-layer assembly of heparin and chitosan. Biomaterials 26, 6684–92 (2005).
193. Iijima, M., Takahashi, M., Hatakeyama, T. & Hatakeyama, H. Detailed investigation of gel-sol transition temperature of k-carrageenan studied by DSC, TMA and FBM. J. Therm. Anal. Calorim. 114, 895–901 (2013).
194. Denuziere, A., Ferrief, D. & Domardb, A. Chitosan-chondroitin sulfate and chitosan-hyaluronate polyelectrolyte complexes. Physico-chemical aspects. Carbohydr. Polym. 29, 317–323 (1996).
195. Tapia, C., Escobar, Z., Costa, E., Sapag-Hagar, J., Valenzuela, F., Basualto, C., Nella Gai, M. & Yazdani-Pedram, M. Comparative studies on polyelectrolyte complexes and mixtures of chitosan–alginate and chitosan–carrageenan as prolonged diltiazem clorhydrate release systems. Eur. J. Pharm. Biopharm. 57, 65–75 (2004).
196. Holme, H. K., Foros, H., Pettersen, H., Dornish, M. & Smidsrød, O. Thermal depolymerization of chitosan chloride. Carbohydr. Polym. 46, 287–294 (2001).
197. Singh, S. K. & Jacobsson, S. P. Kinetics of acid hydrolysis of k-carrageenan as determined by molecular weight (SEC-MALLSRI), gel breaking strength, and viscosity measurements. Carbohydr. Polym. 23, 89–103 (1994).
198. Yuguchi, Y., Thu Thuy, T. T., Urakawa, H. & Kajiwara, K. Structural characteristics of carrageenan gels: Temperature and concentration dependence. Food Hydrocoll. 16, 515–522 (2002).
199. Weinbreck, F., Wientjes, R. H. W., Nieuwenhuijse, H., Robijn, G. W. & de Kruif, C. G. Rheological properties of whey protein/gum arabic coacervates. J. Rheol. (N. Y. N. Y). 48, 109–125 (2004).
200. Espinosa-Andrews, H., Ba, J. G., Cruz-Sosa, F. & Vernon-carter, E. J. Gum arabic-chitosan complex coacervation. Biomacromolecules 8, 1313–1318 (2007).
201. Silva, S. M. L., Braga, C. R. C., Fook, M. V. L., Raposo, C. M. O., Carvalho, L. H. & Canedo, E. L. Application of infrared spectroscopy to analysis of chitosan/clay nanocomposites (Chapter 2). Infrared Spectrosc. - Mater. Sci. Eng. Technol. (2012).
202. Pawlak, A. & Mucha, M. Thermogravimetric and FTIR studies of chitosan blends. Thermochim. Acta 396, 153–166 (2003).
203. Volery, P., Besson, R. & Schaffer-Lequart, C. Characterization of commercial carrageenans by fourier transform infrared spectroscopy using single-reflection attenuated total reflection. J. Agric. Food Chem. 52, 7457–7463 (2004).

References
178
204. Abad, L. V., Relleve, L. S., Aranilla, C. T. & Dela Rosa, A. M. Properties of radiation synthesized PVP-kappa carrageenan hydrogel blends. Radiat. Phys. Chem. 68, 901–908 (2003).
205. Samuels, R. J. Solid state characterization of the structure of chitosan films. J. Polym. Sci. Polym. Phys. Ed. 19, 1081–1105 (1981).
206. Chen, Q., Xu, A., Li, Z., Wang, J. & Zhang, S. Influence of anionic structure on the dissolution of chitosan in 1-butyl-3-methylimidazolium-based ionic liquids. Green Chem. 13, 3446–3452 (2011).
207. Yan, S., Zhang, K., Liu, Z., Zhang, X., Gan, L., Cao, B., Chen, X., Cui, L. & Yin, J. Fabrication of poly(l-glutamic acid)/chitosan polyelectrolyte complex porous scaffolds for tissue engineering. J. Mater. Chem. B 1, 1541–1551 (2013).
208. Ratto, J. A., Chen, C. C. & Blumstein, R. B. Phase behavior study of chitosan polyamide blends. J. Appl. Polym. Sci. 59, 1451–1461 (1996).
209. McClements, D. J. Food Emulsions: Principles, Practice and Techniques. (CRC Press - Taylor & Francis Group, 2016).
210. Kayitmazer, A. B., Strand, S. P., Tribet, C., Jaeger, W. & Dubin, P. L. Effect of polyelectrolyte structure on protein-polyelectrolyte coacervates: Coacervates of bovine serum albumin with poly(diallyldimethylammonium chloride) versus chitosan. Biomacromolecules 8, 3568–3577 (2007).
211. Florczyk, S. J., Kim, D. J., Wood, D. L. & Zhang, M. Influence of processing parameters on pore structure of 3D porous chitosan-alginate polyelectrolyte complex scaffolds. J. Biomed. Mater. Res. - Part A 98 A, 614–620 (2011).
212. Tsao, C. T., Chang, C. H., Lin, Y. Y., Wu, M. F., Wang, J. L., Young, T. H., Han, J. L. & Hsieh, K. H. Evaluation of chitosan/γ-poly(glutamic acid) polyelectrolyte complex for wound dressing materials. Carbohydr. Polym. 84, 812–819 (2011).
213. Grover, C. N., Gwynne, J. H., Pugh, N., Hamaia, S., Farndale, R. W., Best, S. M. & Cameron, R. E. Crosslinking and composition influence the surface properties, mechanical stiffness and cell reactivity of collagen-based films. Acta Biomater. 8, 3080–90 (2012).
214. Davidenko, N., Schuster, C. F., Bax, D. V., Raynal, N., Farndale, R. W., Best, S. M. & Cameron, R. E. Control of crosslinking for tailoring collagen-based scaffolds stability and mechanics. Acta Biomater. 25, 131–142 (2015).
215. Denuziere, A., Ferrier, D., Damour, O. & Domard, A. Polyelectrolyte complexes: biological properties. Biomaterials 19, 1275–1285 (1998).
216. Yao, X., Peng, R. & Ding, J. Cell-material interactions revealed via material techniques of surface patterning. Adv. Mater. 25, 5257–5286 (2013).
217. Detzel, C. J., Larkin, A. L. & Rajagopalan, P. Polyelectrolyte multilayers in tissue engineering. Tissue Eng. Part B. Rev. 17, 101–13 (2011).
218. Grover, C. N., Farndale, R. W., Best, S. M. & Cameron, R. E. The interplay between physical and chemical properties of protein films affects their bioactivity. J. Biomed. Mater. Res. - Part A 100 A, 2401–2411 (2012).
219. Porstmann, B., Jung, K., Schmechta, H., Evers, U., Pergande, M., Porstmann, T., Kramm, H. J. & Krause, H. Measurement of lysozyme in human body fluids: Comparison of various enzyme immunoassay techniques and their diagnostic application. Clin. Biochem. 22, 349–355 (1989).

References
179
220. Aly, A. S. Self-dissolving chitosan, I. Preparation, characterization and evaluation for drug delivery system. Die Angew. Makromol. Chemie 259, 13–18 (1998).
221. Guarino, V., Caputo, T., Altobelli, R. & Ambrosio, L. Degradation properties and metabolic activity of alginate and chitosan polyelectrolytes for drug delivery and tissue engineering applications. 2, 497–502 (2015).
222. Schoenberg, M. D. & Moore, R. D. The conformation of hyaluronic acid and chondroitin sulphate c: The metachromatic reaction. Biochim. Biophyr. Acta 83, 42–51 (1964).
223. Shahbazi, M., Rajabzadeh, G., Ettelaie, R. & Rafe, A. Kinetic study of k-carrageenan degradation and its impact on mechanical and structural properties of chitosan/k-carrageenan film. Carbohydr. Polym. 142, 167–176 (2016).
224. Butler, B. L., Vergano, P. J., Testin, R. F., Bunn, J. M. & Wiles, J. L. Mechanical and barrier properties of edible chitosan films as affected by composition and storage. J. Food Sci. 61, 953–956 (1996).
225. Michaels, A. S. & Miekka, R. G. Polycation-polyanion complexes: Preparation and properties of poly-(vinylbenzyltrimethylammonium) poly-(styrenesulfonate). Phys. Chem. 65, 1765–1773 (1961).
226. Davidenko, N., Campbell, J. J., Thian, E. S., Watson, C. J. & Cameron, R. E. Collagen-hyaluronic acid scaffolds for adipose tissue engineering. Acta Biomater. 6, 3957–68 (2010).
227. Distantina, S., Fadilah, F., Kaavessina, M. & Material, A. Swelling behaviour of kappa carrageenan hydrogel in neutral salt solution. Int. J. Chem. Mol. Nucl. Mater. Metall. Eng. 10, 917–920 (2016).
228. Smidsrod, O., Larsen, B., Pernas, J. A. & Haug, A. The effect of alkali treatment on the chemical heterogeneity and physical properties of some carrageenans. Acta Chem. Scand. 21, 2585–2598 (1967).
229. Renate Forch, H. S. and T. A. J. Appendix C: Contact angle goniometry. Surf. Des. Appl. Biosci. Nanotechnol. 471–473 (2009).
230. Garric, X., Molès, J. P., Garreau, H., Guilhou, J. J. & Vert, M. Human skin cell cultures onto PLA50 (PDLLA) bioresorbable polymers: Influence of chemical and morphological surface modifications. J. Biomed. Mater. Res. - Part A 72, 180–189 (2005).
231. Tong, W. L., Tan, M. K., Chin, J. K., Ong, K. S. & Hung, Y. M. Coupled effects of hydrophobic layer and vibration on thermal efficiency of two-phase closed thermosyphons. RSC Adv. 5, 10332–10340 (2015).
232. Wang, L., Porter, R. S. & Science, P. The surface orientation of polystyrene measured by liquid contact angle. J. Appl. Sci. 28, 1439–1445 (1983).
233. Farris, S., Introzzi, L., Biagioni, P., Holz, T., Schiraldi, A. & Piergiovanni, L. Wetting of biopolymer coatings: Contact angle kinetics and image analysis investigation. Langmuir 27, 7563–7574 (2011).
234. Pinheiro, A. C., Bourbon, A. I., Medeiros, B. G. D. S., Da Silva, L. H. M., Da Silva, M. C. H., Carneiro-Da-Cunha, M. G., Coimbra, M. A. & Vicente, A. A. Interactions between κ-carrageenan and chitosan in nanolayered coatings - Structural and transport properties. Carbohydr. Polym. 87, 1081–1090 (2012).
235. Vårum, K. M., Ottøy, M. H. & Smidsrød, O. Water-solubility of partially N-acetylated chitosans as a function of pH: Effect of chemical composition and depolymerisation. Carbohydr. Polym.

References
180
25, 65–70 (1994).
236. Sannan, T., Kurita, K. & Iwakura, Y. Studies on chitin. J. Agric. Chem. Soc. Japan 30, 36–41 (1956).
237. Pangburn, S. H. H., Trescony, P. V. V. & Heller, J. Lysozyme degradation of partially deacetylated chitin, its films and hydrogels. Biomaterials 3, 105–108 (1982).
238. Nordtveit RJ, Varum KM, S. O. Degradation of fully water soluble partially N-acetylated chitosan with lysozyme. Carbohydr. Polym. 23, 253–260 (1994).
239. Amin, K. A. M. Polyelectrolyte complex materials from chitosan and gellan gum. (2011). doi:10.1016/j.carbpol.2011.04.035
240. Park, S. Y., Marsh, K. S. & Rhim, J. W. Characteristics of different molecular weight chitosan films affected by the type of solvents. J. Food Sci. 67, 194–197 (2002).
241. Yin, Y. J., Yao, K. D., Cheng, G. X. & Ma, J. B. Properties of polyelectrolyte complex films of chitosan and gelatin. Polym. Int. 433, 429–432 (1999).
242. Hwang, K. T., Kim, J. T., Jung, S. T., Cho, G. S. & Park, H. J. Properties of chitosan-based biopolymer films with various degrees of deacetylation and molecular weights. J. Appl. Polym. Sci. 89, 3476–3484 (2003).
243. Chahine, N. O., Wang, C. C. B., Hung, C. T. & Ateshian, G. A. Anisotropic strain-dependent material properties of bovine articular cartilage in the transitional range from tension to compression. J. Biomech. 37, 1251–1261 (2004).
244. Pal, S. Design of artificial human joints & organs: Chapter 2 - Mechanical properties of biological materials. (Springer, 2014).
245. Georges, P. C. & Janmey, P. A. Soft biological materials and their impact on cell function. Soft Matter 3, 299–306 (2007).
246. Alkhouli, N., Mansfield, J., Green, E., Bell, J., Knight, B., Liversedge, N., Tham, J. C., Welbourn, R., Shore, A. C., Kos, K. & Winlove, C. P. The mechanical properties of human adipose tissues and their relationships to the structure and composition of the extracellular matrix. Am. J. Physiol. Endocrinol. Metab. 305, E1427-35 (2013).
247. Janmey, P. A. & Miller, R. T. Mechanisms of mechanical signalling in development and disease. J. Cell Sci. 124, 9–18 (2011).
248. Engler, A. J., Carag-krieger, C., Johnson, C. P., Raab, M., Tang, H., Speicher, D. W., Sanger, J. W., Sanger, J. M. & Discher, E. Embryonic cardiomyocytes beat best on a matrix with heart-like elasticity: Scar-like rigidity inhibits beating. J. Cell Sci. 121, 3794–3802 (2008).
249. Butler, D. L., Kay, M. D. & Stouffer, D. C. Comparison of material properties in fascicle-bone units from human patellar tendon and knee ligaments. J. Biomech. 19, 425–432 (1986).
250. Reilly, D. T. & Burstein, A. H. The elastic and ultimate properties of compact bone tissue. J. Biomech. 8, 393–405 (1975).
251. Hutmacher, D. W. Scaffolds in tissue engineering bone and cartilage. Biomaterials 21, 2529–43 (2000).
252. Tai, B. C. U., Du, C., Gao, S., Wan, A. C. A. & Ying, J. Y. The use of a polyelectrolyte fibrous scaffold to deliver differentiated hMSCs to the liver. Biomaterials 31, 48–57 (2010).
253. Han, J., Zhou, Z., Yin, R., Yang, D. & Nie, J. Alginate-chitosan/hydroxyapatite polyelectrolyte

References
181
complex porous scaffolds: Preparation and characterization. Int. J. Biol. Macromol. 46, 199–205 (2010).
254. Lee, S. H., Chung, H. Y., Shin, H.-I. I., Park, D.-J. J. & Choi, J. H. Osteogenic activity of chitosan-based hybrid scaffold prepared by polyelectrolyte complex formation with alginate. Tissue Eng. Regen. Med. 11, 106–112 (2014).
255. Ceccaldi, C., Bushkalova, R., Alfarano, C., Lairez, O., Calise, D., Bourin, P., Frugier, C., Rouzaud-Laborde, C., Cussac, D., Parini, A., Sallerin, B. & Fullana, S. G. Evaluation of polyelectrolyte complex-based scaffolds for mesenchymal stem cell therapy in cardiac ischemia treatment. Acta Biomater. 10, 901–11 (2014).
256. Correia, V. G., Coelho, M., Barroso, T., Raje, V. P., Bonifácio, V. D. B., Casimiro, T., Pinho, M. G. & Aguiar-Ricardo, A. Anti-biofouling 3D porous systems: the blend effect of oxazoline-based oligomers on chitosan scaffolds. Biofouling 29, 273–282 (2013).
257. Salgado, A. J., Coutinho, O. P. & Reis, R. L. Bone tissue engineering: state of the art and future trends. Macromol. Biosci. 4, 743–765 (2004).
258. Haugh, M. G., Murphy, C. M. & O’Brien, F. J. Novel freeze-drying methods to produce a range of collagen-glycosaminoglycan scaffolds with tailored mean pore sizes. Tissue Eng. Part C. Methods 16, 887–894 (2010).
259. Nam, Y. S. & Park, T. G. Porous biodegradable polymeric scaffolds prepared by thermally induced phase separation. J. Biomed. Mater. Res. 47, 8–17 (1999).
260. Rajkumar, M., Kavitha, K., Prabhu, M., Meenakshisundaram, N. & Rajendran, V. Nanohydroxyapatite-chitosan-gelatin polyelectrolyte complex with enhanced mechanical and bioactivity. Mater. Sci. Eng. C 33, 3237–3244 (2013).
261. Yamane, S., Iwasaki, N., Kasahara, Y., Harada, K., Majima, T., Monde, K., Nishimura, S. & Minami, A. Effect of pore size on in vitro cartilage formation using chitosan-based hyaluronic acid hybrid polymer fibers. J. Biomed. Mater. Res. Part A 81, 586–593 (2006).
262. Gibson, L. J. & Ashby, M. F. Cellular Solids: Structure and Properties. (Cambridge University Press, 1999).
263. Freyman, T. M., Yannas, I. V., Yokoo, R. & Gibson, L. J. Fibroblast contraction of a collagen-GAG matrix. Biomaterials 22, 2883–2891 (2001).
264. Yuan, Y., Chesnutt, B. M., Haggard, W. O. & Bumgardner, J. D. Deacetylation of chitosan: Material characterization and in vitro evaluation via albumin adsorption and pre-osteoblastic cell cultures. Materials (Basel). 4, 1399–1416 (2011).
265. Paszek, M. J., Zahir, N., Johnson, K. R., Lakins, J. N., Rozenberg, G. I., Gefen, A., Reinhart-king, C. A., Margulies, S. S., Dembo, M., Boettiger, D., Hammer, D. A. & Weaver, V. M. Tensional homeostasis and the malignant phenotype. 8, 241–254 (2005).
266. Miller, K., Chinzei, K., Orssengo, G. & Bednarz, P. Mechanical properties of brain tissue in-vivo: experiment and computer simulation. J. Biomech. 33, 1369–1376 (2000).
267. Wellman, P. S., Howe, R. D., Dalton, E. & Kern, K. A. Breast Tissue Stiffness in Compression is Correlated to Histological Diagnosis. J. Biomech. 1–15 (1999).
268. Lyshchik, A., Higashi, T., Asato, R., Tanaka, S., Ito, J., Hiraoka, H., Brill, A., Saga, T. & Togashi, K. Elastic moduli of thyroid tissues under compression. Ultrason. Imaging 27, 101–10 (2005).
269. Engler, A. J., Griffin, M. A., Sen, S., Bönnemann, C. G., Sweeney, H. L. & Discher, D. E.

References
182
Myotubes differentiate optimally on substrates with tissue-like stiffness: pathological implications for soft or stiff microenvironments. J. Cell Biol. 166, 877–887 (2004).
270. Yeh, W.-C., Li, P.-C., Jeng, Y.-M., Hsu, H.-C., Po-Ling, K., Li, M.-L., Yang, P.-M. & Lee, P. H. Elastic modulus measurements of human liver and correlation with pathology. Ultrasound Med. Biol. 28, 467–474 (2002).
271. Freed, L. E., Langer, R., Martin, I., Pellis, N. R. & Vunjak-Novakovic, G. Tissue engineering of cartilage in space. Proc. Natl. Acad. Sci. U. S. A. 94, 13885–13890 (1997).
272. Khan, F. & Ahmad, S. R. Polysaccharides and their derivatives for versatile tissue engineering application. Macromol. Biosci. 13, 395–421 (2013).
273. Bačáková, L., Filová, E., Rypáček, F., Švorčík, V. & Starý, V. Cell adhesion on artificial materials for tissue engineering. Physiol. Res. 53, 35–45 (2004).
274. Ho, Y.-C., Mi, F.-L., Sung, H.-W. & Kuo, P.-L. Heparin-functionalized chitosan-alginate scaffolds for controlled release of growth factor. Int. J. Pharm. 376, 69–75 (2009).
275. Elcin, Y. M., Dixit, V., Lewin, K. & Gitnick, G. Xenotransplantation of fetal porcine hepatocytes in rats using a tissue engineering approach. Artif. Organs 23, 146–152 (1999).
276. Levengood, S. L. & Zhang, M. Chitosan-based scaffolds for bone tissue engineering. J. Mater. Chem. B. Mater. Biol. Med. 2, 3161–3184 (2014).
277. Blanco, C. D., Ortner, A., Dimitrov, R., Navarro, A., Mendoza, E. & Tzanov, T. Building an antifouling zwitterionic coating on urinary catheters using an enzymatically triggered bottom-up approach. ACS Appl. Mater. Interfaces 6, 11385−11393 (2014).
278. Martinez, L. R., Mihu, R., Tar, M., Cordero, R. J. B., Han, G., Friedman, A. J., Friedman, J. M. & Nosanchuk, J. D. Demonstration of antibiofilm and antifungal efficacy of chitosan against candidal biofilms, using an in vivo central venous catheter model. J. Infect. Dis. 201, 1436–1440 (2010).
279. Bernacca, G. M., Straub, I. & Wheatley, D. J. Mechanical and morphological study of biostable polyurethane heart valve leaflets explanted from sheep. J. Biomed. Mater. Res. 61, 138–145 (2002).
280. Tamenishi, A., Usui, A., Oshima, H. & Ueda, Y. Entirely polytetrafluoroethylene coating for pacemaker system contact dermatitis. Interact. Cardiovasc. Thorac. Surg. 7, 275–7 (2008).
281. Strohbach, A. & Busch, R. Polymers for cardiovascular stent coatings. Int. J. Polym. Sci. 2015, 1–11 (2015).
282. Koschwanez, H. E., Yap, F. Y., Klitzman, B. & Reichert, W. M. In vitro and in vivo characterization of porous poly-L-lactic acid coatings for subcutaneously implanted glucose sensors. J. Biomed. Mater. Res. A 87, 792–807 (2008).
283. Bixler, G. D. & Bhushan, B. Biofouling: Lessons from nature. Philos. Trans. R. Soc. 370, 2381–2417 (2012).
284. Darouiche, R. O. Treatment of infections associated with surgical implants. N. Engl. J. Med. 350, 1422–1429 (2004).
285. Hinz, B. Formation and function of the myofibroblast during tissue repair. J. Invest. Dermatol. 127, 526–37 (2007).
286. Theocharis, A. D., Skandalis, S. S., Gialeli, C. & Karamanos, N. K. Extracellular matrix structure.

References
183
Adv. Drug Deliv. Rev. 97, 4–27 (2016).
287. Tracy, L. E., Minasian, R. A. & Caterson, E. J. Extracellular matrix and dermal fibroblast function in the healing wound. Adv. wound care 5, 119–136 (2016).
288. Greiling, D. & Clark, R. A. Fibronectin provides a conduit for fibroblast transmigration from collagenous stroma into fibrin clot provisional matrix. J. Cell Sci. 110, 861–870 (1997).
289. Hinz, B., Celetta, G., Tomasek, J. J., Gabbiani, G. & Chaponnier, C. Alpha-smooth muscle actin expression upregulates fibroblast contractile activity. Mol. Biol. Cell 12, 2730–2741 (2001).
290. Wipff, P. J., Rifkin, D. B., Meister, J. J. & Hinz, B. Myofibroblast contraction activates latent TGF-β1 from the extracellular matrix. J. Cell Biol. 179, 1311–1323 (2007).
291. Hinz, B., Phan, S. H., Thannickal, V. J., Galli, A., Bochaton-Piallat, M.-L. & Gabbiani, G. The myofibroblast. Am. J. Pathol. 170, 1807–1816 (2007).
292. Malcor, J. D., Bax, D., Hamaia, S. W., Davidenko, N., Best, S. M., Cameron, R. E., Farndale, R. W. & Bihan, D. The synthesis and coupling of photoreactive collagen-based peptides to restore integrin reactivity to an inert substrate, chemically-crosslinked collagen. Biomaterials 85, 65–77 (2016).
293. Zeplin, P. H., Larena-Avellaneda, A. & Schmidt, K. Surface modification of silicone breast implants by binding the antifibrotic drug halofuginone reduces capsular fibrosis. Plast. Reconstr. Surg. 126, 266–74 (2010).
294. Fan, D., Takawale, A., Lee, J. & Kassiri, Z. Cardiac fibroblasts, fibrosis and extracellular matrix remodeling in heart disease. Fibrogenesis Tissue Repair 5, 1–13 (2012).
295. van Oosterwijk, J. G., de Jong, D., van Ruler, M. A. J. H., Hogendoorn, P. C. W., Dijkstra, P. D. S., van Rijswijk, C. S. P., Machado, I., Llombart-Bosch, A., Szuhai, K. & Bovée, J. V. M. G. Three new chondrosarcoma cell lines: one grade III conventional central chondrosarcoma and two dedifferentiated chondrosarcomas of bone. BMC Cancer 12, 1–10 (2012).
296. Gebauer, M., Saas, J., Sohler, F., Haag, J., Söder, S., Pieper, M., Bartnik, E., Beninga, J., Zimmer, R. & Aigner, T. Comparison of the chondrosarcoma cell line SW1353 with primary human adult articular chondrocytes with regard to their gene expression profile and reactivity to IL-1beta. Osteoarthr. Cartil. 13, 697–708 (2005).
297. Loeser, R. F. Integrins and cell signaling in chondrocytes. Biorheology 39, 119–124 (2002).
298. Hermann, P., Armant, M., Brown, E., Rubio, M., Ishihara, H., Ulrich, D., Caspary, R. G., Lindberg, F. P., Armitage, R., Maliszewski, C., Delespesse, G. & Sarfati, M. The vitronectin receptor and its associated CD47 molecule mediates proinflammatory cytokine synthesis in human monocytes by interaction with soluble CD23. J. Cell Biol. 144, 767–775 (1999).
299. Hou, C. H., Yang, R. Sen, Hou, S. M. & Tang, C. H. TNF-alpha increases alpha5beta3 integrin expression and migration in human chondrosarcoma cells. J. Cell. Physiol. 226, 792–799 (2011).
300. Torimura, T., Ueno, T., Kin, M., Ogata, R., Inuzuka, S., Sugawara, H., Kurotatsu, R., Shimada, M., Yano, H., Kojiro, M., Tanikawa, K. & Sata, M. Integrin alpha6beta1 plays a significant role in the attachment of hepatoma cells to laminin. J Hepatol 31, 734–740 (1999).
301. Le Bellego, F., Pisselet, C., Huet, C., Monget, P. & Monniaux, D. Laminin-α6β1 integrin interaction enhances survival and proliferation and modulates steroidogenesis of ovine granulosa cells. J. Endocrinol. 172, 45–59 (2002).

References
184
302. Chen, J.-C., Chen, Y.-J., Lin, C.-Y., Fong, Y.-C., Hsu, C.-J., Tsai, C.-H., Su, J.-L. & Tang, C.-H. Amphiregulin enhances alpha6beta1 integrin expression and cell motility in human chondrosarcoma cells through Ras/Raf/MEK/ERK/AP-1 pathway. Oncotarget 6, 11434–11446 (2015).
303. Engler, A. J., Sen, S., Sweeney, H. L. & Discher, D. E. Matrix elasticity directs stem cell lineage specification. Cell 126, 677–689 (2006).
304. Horbett, T. A., Waldburger, J. J., Ratner, B. D. & Hoffman, A. S. Cell adhesion to a series of hydrophilic-hydrophobic copolymers studied with a spinning disc apparatus. J. Biomed. Mater. Res. 22, 383–404 (1988).
305. Hynes, R. O. Integrins: Versatility, modulation, and signaling in cell adhesion. Cell 69, 11–25 (1992).
306. Walachova, K., Švorčık, V., Bačáková, L. & Hnatowicz, V. Colonization of ion-modified polyethylene with vascular smooth muscle cells in vitro. Biomaterials 23, 2989–2996 (2002).
307. Tamada, Y. & Ikada, Y. Effect of preadsorbed proteins on cell adhesion to polymer surfaces. J. Colloid Interface Sci. 155, 334–9 (1993).
308. Xu, L. C. & Siedlecki, C. A. Effects of surface wettability and contact time on protein adhesion to biomaterial surfaces. Biomaterials 28, 3273–3283 (2007).
309. Tai, B. C. U., Wan, A. C. A. & Ying, J. Y. Modified polyelectrolyte complex fibrous scaffold as a matrix for 3D cell culture. Biomaterials 31, 5927–35 (2010).
310. Bax, D. V., Wang, Y., Li, Z., Maitz, P. K. M., McKenzie, D. R., Bilek, M. M. M. & Weiss, A. S. Binding of the cell adhesive protein tropoelastin to PTFE through plasma immersion ion implantation treatment. Biomaterials 32, 5100–5111 (2011).
311. Varki, A. Biological roles of oligosaccharides: all of the theories are correct. Glycobiology 3, 97–130 (1993).
312. Chung, C. M., Kim, M. S., Kim, J. G. & Jang, D. O. Adhesion and growth of endothelial cell on amphiphilic PU/PS IPN surface: Effect of amphiphilic balance and immobilized collagen. J. Biomed. Mater. Res. 62, 613–621 (2002).
313. Hersel, U., Dahmen, C. & Kessler, H. RGD modified polymers: biomaterials for stimulated cell adhesion and beyond. Biomaterials 24, 4385–4415 (2003).
314. Thakral, G. K., Thakral, R., Sharma, N., Seth, J. & Vashisht, P. Nanosurface-the future of implants. J. Clin. Diagnostic Res. 8, 7–10 (2014).
315. Vagaská, B., Bačáková, L., Filová, E. & Balík, K. Osteogenic cells on bio-inspired materials for bone tissue engineering. Physiol. Res. 59, 309–322 (2010).
316. De Bartolo, L., Rende, M., Morelli, S., Giusi, G., Salerno, S., Piscioneri, A., Gordano, A., Di Vito, A., Canonaco, M. & Drioli, E. Influence of membrane surface properties on the growth of neuronal cells isolated from hippocampus. J. Memb. Sci. 325, 139–149 (2008).
317. Lee, S. J., Choi, J. S., Park, K. S., Khang, G., Lee, Y. M. & Lee, H. B. Response of MG63 osteoblast-like cells onto polycarbonate membrane surfaces with different micropore sizes. Biomaterials 25, 4699–4707 (2004).
318. Genzer, J. & Efimenko, K. Recent developments in superhydrophobic surfaces and their relevance to marine fouling: a review. Biofouling 22, 339–360 (2006).

References
185
319. Edmondson, R., Broglie, J. J., Adcock, A. F. & Yang, L. Three-dimensional cell culture systems and their applications in drug discovery and cell-based biosensors. Assay Drug Dev. Technol. 12, 207–18 (2014).
320. Khor, E. & Lim, L. Y. Implantable applications of chitin and chitosan. Biomaterials 24, 2339–2349 (2003).
321. Bhattacharyya, S. & Tobacman, J. K. Molecular signature of kappa-carrageenan mimics chondroitin-4-sulfate and dermatan sulfate and enables interaction with arylsulfatase B. J. Nutr. Biochem. 23, 1058–1063 (2012).
322. Peluso, G., Petillo, O., Ranieri, M., Santin, M., Ambrosic, L., Calabró, D., Avallone, B. & Balsamo, G. Chitosan-mediated stimulation of macrophage function. Biomaterials 15, 1215–1220 (1994).
323. Tangsadthakun, C., Kanokpanont, S., Sanchavanakit, N., Pichyangkura, R., Banaprasert, T., Tabata, Y. & Damrongsakkul, S. The influence of molecular weight of chitosan on the physical and biological properties of collagen/chitosan scaffolds. J. Biomater. Sci. Polym. Ed. 18, 147–63 (2007).
324. Hasan, A., Khattab, A., Islam, M. A., Hweij, K. A., Zeitouny, J., Waters, R., Sayegh, M., Hossain, M. M. & Paul, A. Injectable hydrogels for cardiac tissue repair after myocardial infarction. Adv. Sci. 2, 1–18 (2015).
325. Martín-López, E., Nieto-Díaz, M. & Nieto-Sampedro, M. Differential adhesiveness and neurite-promoting activity for neural cells of chitosan, gelatin, and poly-L-lysine films. J. Biomater. Appl. 26, 791–809 (2012).
326. Chatelet, C., Damour, O. & Domard, A. Influence of the degree of acetylation on some biological properties of chitosan films. Biomaterials 22, 261–268 (2001).
327. Rodríguez-vázquez, M., Vega-Ruiz, B., Ramos-zúñiga, R., Saldaña-Koppel, D. A. & Quiñones-Olvera, L. F. Chitosan and its potential use as a scaffold for tissue engineering in regenerative medicine. Biomed Res. Int. 2015, 1–15 (2015).
328. Scalia, S., Trotta, V., Iannuccelli, V. & Bianchi, A. Enhancement of in vivo human skin penetration of resveratrol by chitosan-coated lipid microparticles. Colloids Surfaces B Biointerfaces 135, 42–49 (2015).
329. Spiller, K. L., Maher, S. A. & Lowman, A. M. Hydrogels for the repair of articular cartilage defects. Tissue Eng. Part B. Rev. 17, 281–99 (2011).
330. Bondar, O. V, Saifullina, D. V, Shakhmaeva, I. I., Mavlyutova, I. I. & Abdullin, T. I. Monitoring of the zeta potential of human cells upon reduction in their viability and interaction with polymers. Acta Naturae 4, 78–81 (2012).
331. McKim, J. M., Baas, H., Rice, G. P., Willoughby, J. A., Weiner, M. L. & Blakemore, W. Effects of carrageenan on cell permeability, cytotoxicity, and cytokine gene expression in human intestinal and hepatic cell lines. Food Chem. Toxicol. 96, 1–10 (2016).
332. Corvaglia, S., Rodriguez, S., Bardi, G., Torres, F. G. & Lopez, D. Chitin whiskers reinforced carrageenan films as low adhesion cell substrates. Int. J. Polym. Mater. Polym. Biomater. 65, 574–580 (2016).
333. Magin, C. M., Cooper, S. P. & Brennan, A. B. Non-toxic antifouling strategies. Mater. Today 13, 36–44 (2010).
334. Horbett, T. A. The role of adsorbed proteins in animal cell adhesion. Colloids Surfaces B

References
186
Biointerfaces 2, 225–240 (1994).
335. Jiang, S. Y. & Cao, Z. Q. Ultralow-fouling, functionalizable, and hydrolyzable zwitterionic materials and their derivatives for biological applications. Adv. Mater. 22, 920–932 (2010).
336. Tsai, W. B., Grunkemeier, J. M. & Horbett, T. A. Human plasma fibrinogen adsorption and platelet adhesion to polystyrene. J. Biomed. Mater. Res. 44, 130–139 (1999).
337. Lichter, J. A., Van Vlietpa, K. J. & Rubner, M. F. Design of antibacterial surfaces and interfaces: Polyelectrolyte multilayers as a multifunctional platform. Macromolecules 42, 8573–8586 (2009).
338. Zhang, R., Liu, Y., He, M., Su, Y., Zhao, X., Elimelech, M. & Jiang, Z. Antifouling membranes for sustainable water purification: strategies and mechanisms. Chem. Soc. Rev. 45, 5888–5924 (2016).
339. Jeon, S. I., Lee, J. H., Andrade, J. D. & De Gennes, P. G. Protein—surface interactions in the presence of polyethylene oxide. J. Colloid Interface Sci. 142, 149–158 (1991).
340. Krishnan, S., Weinman, C. J. & Ober, C. K. Advances in polymers for anti-biofouling surfaces. J. Mater. Chem. 18, 3405–3413 (2008).
341. Liu, J. & Zhou, J. Hydrolysis-controlled protein adsorption and antifouling behaviors of mixed charged self-assembled monolayer: A molecular simulation study. Acta Biomater. 40, 23–30 (2016).
342. Wu, J. & Chen, S. Investigation of the hydration of nonfouling material poly(ethylene glycol) by low-field nuclear magnetic resonance. Langmuir 28, 2137–2144 (2012).
343. Zimmerman, E., Geiger, B. & Addadi, L. Initial stages of cell-matrix adhesion can be mediated and modulated by cell-surface hyaluronan. Biophys. J. 82, 1848–1857 (2002).
344. Morra, M. & Cassineli, C. Non-fouling properties of polysaccharide-coated surfaces. J. Biomater. Sci. Polym. Ed. 10, 1107–1124 (1999).
345. Wöhrle, J., Al-Khayer, E., Grötzinger, U., Schindler, C., Kochs, M., Hombach, V. & Höher, M. Comparison of the heparin coated vs the uncoated Jostent® - No influence on restenosis or clinical outcome. Eur. Heart J. 22, 1808–1816 (2001).
346. Xu, F., Flanagan, C. E., Ruiz, A., Crone, W. C. & Masters, K. S. Polyurethane/dermatan sulfate copolymers as hemocompatible, non-biofouling materials. Macromol. Biosci. 11, 257–266 (2011).
347. Bratskaya, S., Marinin, D., Simon, F., Synytska, A., Zschoche, S., Busscher, H. J., Jager, D. & van der Mei, H. C. Adhesion and viability of two enterococcal strains on covalently grafted chitosan and chitosan/k-carrageenan multilayers. Biomacromolecules 8, 2960–2968 (2007).
348. Sutherland, J., Denyer, M. & Britland, S. Motogenic substrata and chemokinetic growth factors for human skin cells. J. Anat. 207, 67–78 (2005).
349. Garcia, A. J., Vega, M. D. & Boettiger, D. Modulation of cell proliferation and differentiation through substrate dependent changes in fibronectin conformation. Mol. Biol. Cell 10, 785–798 (1999).
350. Heino, J. The collagen family members as cell adhesion proteins. Bioessays 29, 1001–10 (2007).
351. Lee, C. H., Singla, A. & Lee, Y. Biomedical applications of collagen. Int. J. Pharm. 221, 1–22

References
187
(2001).
352. Davidenko, N., Bax, D. V., Schuster, C. F., Farndale, R. W., Hamaia, S. W., Best, S. M. & Cameron, R. E. Optimisation of UV irradiation as a binding site conserving method for crosslinking collagen-based scaffolds. J. Mater. Sci. Mater. Med. 27, 1–17 (2016).
353. Shah, G. Why do we still use serum in the production of biopharmaceuticals? Dev. Biol. Stand. 99, 17–22 (1999).
354. Nelson, C. M., Raghavan, S., Tan, J. L. & Chen, C. S. Degradation of micropatterned surfaces by cell-dependent and -independent processes. Langmuir 19, 1493–1499 (2003).
355. Buktenica, S., Olenick, S. J., Salgia, R. & Frankfater, A. Degradation and regurgitation of extracellular proteins by cultured mouse peritoneal macrophages and baby hamster kidney fibroblas. J. Biol. Chem. 262, 9469–9476 (1967).
356. Steele, J. G., Johnson, G. & Underwood, P. A. Role of serum vitronectin and fibronectin in adhesion of fibroblasts following seeding onto tissue culture polystyrene. J. Biomed. Mater. Res. 26, 861–884 (1992).
357. Hakala, B. E., White, C. & Recklies, A. D. Human cartilage gp-39, a major secretory product of articular chondrocytes and synovial cells, is a mammalian member of a chitinase protein family. J. Biol. Chem. 268, 25803–25810 (1993).
358. Zhang, J., Senger, B., Vautier, D., Picart, C., Schaaf, P., Voegel, J.-C. & Lavalle, P. Natural polyelectrolyte films based on layer-by-layer deposition of collagen and hyaluronic acid. Biomaterials 26, 3353–61 (2005).
359. Ishida, O., Tanaka, Y., Morimoto, I., Takigawa, M. & Eto, S. Chondrocytes are regulated by cellular adhesion through CD44 and hyaluronic acid pathway. J. Bone Miner. Res. 12, 1657–63 (1997).
360. Toole, B. P. Hyaluronan in morphogenesis. Semin. Cell Dev. Biol. 12, 79–87 (2001).
361. Richert, L., Boulmedais, F., Lavalle, P., Ferreux, E., Decher, G., Schaaf, P., Voegel, J. & Picart, C. Improvement of stability and cell adhesion properties of polyelectrolyte multilayer films by chemical crosslinking. Biomacromolecules 5, 284–294 (2004).
362. Almine, J. F., Bax, D. V, Mithieux, S. M., Nivison-Smith, L., Rnjak, J., Waterhouse, A., Wise, S. G. & Weiss, A. S. Elastin-based materials. Chem. Soc. Rev. 39, 3371–9 (2010).
363. Bax, D. V., McKenzie, D. R., Weiss, A. S. & Bilek, M. M. M. Linker-free covalent attachment of the extracellular matrix protein tropoelastin to a polymer surface for directed cell spreading. Acta Biomater. 5, 3371–3381 (2009).
364. Bilek, M. M. M., Bax, D. V, Kondyurin, A., Yin, Y., Nosworthy, N. J. & Fisher, K. Free radical functionalization of surfaces to prevent adverse responses to biomedical devices. Proc. Natl. Acad. Sci. 108, 14405–14410 (2011).
365. Fibres, E. Biochemistry of tropoelastin. Eur. J. Biochem. 258, 1–18 (1998).
366. Wise, S. G. & Weiss, A. S. Tropoelastin. Int. J. Biochem. Cell Biol. 41, 494–497 (2009).
367. Mithieux, S. M., Wise, S. G. & Weiss, A. S. Tropoelastin - A multifaceted naturally smart material. Adv. Drug Deliv. Rev. 65, 421–428 (2013).
368. Norde, W. Driving forces for protein adsorption at solid surfaces. Macromol. Symp. 103, 5–18 (1996).

References
188
369. Kayitmazer, A. B., Seeman, D., Minsky, B. B., Dubin, P. L. & Xu, Y. Protein–polyelectrolyte interactions. Soft Matter 9, 2553–2583 (2013).
370. Rabe, M., Verdes, D. & Seeger, S. Understanding protein adsorption phenomena at solid surfaces. Adv. Colloid Interface Sci. 162, 87–106 (2011).
371. Peppas, N. A., Hilt, J. Z., Khademhosseini, A. & Langer, R. Hydrogels in biology and medicine: from molecular principles to bionanotechnology. Adv. Mater. 18, 1345–1360 (2006).
372. Rosenfeldt, S., Wittemann, A., Ballauff, M., Breininger, E., Bolze, J. & Dingenouts, N. Interaction of proteins with spherical polyelectrolyte brushes in solution as studied by small-angle x-ray scattering. Phys. Rev. E 70, 61403 (2004).
373. Hak, F., Rodahl, M., Kasemo, B. & Brzezinski, P. Structural changes in hemoglobin during adsorption to solid surfaces: Effects of pH, ionic strength, and ligand binding. Proc. Natl. Acad. Sci. U. S. A. 95, 12271–12276 (1998).