production, characterization, and applications of
TRANSCRIPT

Production, Characterization, and Applications of Activated Carbon
A Thesis
presented to
the Faculty of the Graduate School
University of Missouri
________________________________________________________
In Partial Fulfillment
of the Requirements for the Degree
Master of Science
________________________________________________________
by
Eric Paul Leimkuehler
Dr. Galen J. Suppes Thesis Supervisor
May 2010

© Copyright by Eric Leimkuehler 2010
All Rights Reserved

The undersigned, appointed by the Dean of the Graduate School, have
examined the thesis entitled
PRODUCTION, CHARACTERIZATION, AND
APPLICATIONS OF ACTIVATED CARBON
presented by Eric Paul Leimkuehler
a candidate for the degree of Master of Science
and hereby certify that in their opinion it is worthy of acceptance.
___________________________________
Dr. Galen Suppes
___________________________________
Dr. Peter Pfeifer
___________________________________
Dr. Thomas Marrero

ii
Acknowledgements
I would like to take this opportunity to thank Dr. Suppes for granting me the opportunity
to participate in his research group, advising me throughout my graduate studies, and
exposing me to an exciting field of research. Additionally, I would like to acknowledge
my fellow researchers Ali Tekeei, Bryan Sawyer, Michael Gordon, Michelle Ji, Ashley
Ulrich, Alex Hunter, Erik Nordwald, Matthias Young, and Matt Wavada, who were
involved in the research group and contributed to the completion of this work.
I would also like to express my gratitude towards my parents Bill and Cherie, my brother
Kurt, and my friends Adriane, Adam, Matt, Steve, and Tommy who encouraged me and
supported me along the way.

iii
Thesis Format
This thesis is a four chapter series detailing the production and characterization of
activated carbon. The first chapter gives an introduction to the history, production
processes, and applications of activated carbon. The second chapter introduces a
production process used to generate activated carbons with proven characteristics and
details a mass balance on this process. The third chapter explores variations on the
process used in the second chapter and the use of screening methods to analyze
different activated carbons produced using varying conditions and materials. The fourth
chapter summarizes the conclusions made in the first three chapters and gives
suggestions for future research. The first and fourth chapters are overview sections
while the second and third chapters each have their own abstract, introduction,
methods and materials, and results and discussion sections as well as figures and tables.

iv
Table of Contents
Acknowledgements ..........................................................................................................................ii
Thesis Format .................................................................................................................................. iii
Table of Contents ............................................................................................................................ iv
List of Tables ................................................................................................................................... vi
List of Figures ................................................................................................................................. vii
Chapter 1: Introduction .................................................................................................................. 1
1.1: Introduction and Definition ........................................................................................ 1
1.2: History of Activated Carbon and Present Day Applications ....................................... 2
1.3: Activated Carbon Production Processes ..................................................................... 3
1.4: Activated Carbon from Different Raw Materials ........................................................ 4
1.5: Analysis of the Petroleum Industry and its Flaws ....................................................... 6
1.6: The Natural Gas Industry, a Viable Alternative .......................................................... 8
1.7: Activated Carbon for the Adsorption of Natural Gas ................................................. 9
1.8: Previous Activated Carbon Research at the University of Missouri ........................... 9
Chapter 2: Production of Activated Carbon from Corn Cobs; Mass Balance and Process
Description .................................................................................................................................... 11
2.1: ABSTRACT .................................................................................................................. 11
2.2: INTRODUCTION ......................................................................................................... 11

v
2.3: EXPERIMENTAL ......................................................................................................... 15
2.3.1: Materials and Equipment ...................................................................................... 15
2.3.2: Sample Preparation ............................................................................................... 15
2.4: RESULTS ..................................................................................................................... 17
2.5: DISCUSSION ............................................................................................................... 21
2.6: CONCLUSION ............................................................................................................. 23
CHAPTER 3: Use of Screening Methods to Analyze Activated Carbon Produced Using
Various Process Conditions, Chemical Activating Agents, and Carbon Precursor Materials ....... 24
3.1: ABSTRACT .................................................................................................................. 24
3.2 INTRODUCTION…………………………………………………………………………………………25
3.3: EXPERIMENTAL ......................................................................................................... 27
3.3.1: Materials and Equipment ...................................................................................... 27
3.3.2: Sample Preparation ............................................................................................... 28
3.4: RESULTS ..................................................................................................................... 30
3.4.1: Effects of Process Temperature ............................................................................. 30
3.4.2: Effects of Process Hold Time .................................................................................. 33
3.4.3: Use of Different Activating Agents ........................................................................ 37
3.4.4: Use of Different Carbon Precursors ....................................................................... 40
3.5: DISCUSSION ............................................................................................................... 46

vi
3.5.1: Effects of Process Hold Time and Process Temperature ....................................... 46
3.5.2: Use of Different Activating Agents ........................................................................ 47
3.5.3: Use of Different Carbon Precursors ....................................................................... 48
3.6: CONCLUSION ............................................................................................................. 50
CHAPTER 4: CONCLUSION ............................................................................................................. 52
4.1: Activated Carbon from Corncobs Using Phosphoric Acid and KOH ......................... 52
4.2: Analysis of Varying Precursors, Process Conditions, and Activating Agents
Using Screening Techniques ............................................................................................. 52
4.3: Recommendations for Further Research .................................................................. 54
REFERENCES .................................................................................................................................. 55
List of Tables
Table 1: Sample BET measurements for ALL-CRAFT carbons…………………………………….….13
Table 2: Large Scale Mass Balance on ALL-CRAFT Activated Carbon Process……………….18
Table 3: Elemental Analysis of Char ………………………………………………………………..………...21
Table 4: Summary of Species Mass Loss Percentages in Phosphoric Acid Carbonization22
Table 5: Sources of Mass Loss in KOH Activation ............................................................ 23
Table 6: Summary of ALL-CRAFT Activated Carbon Synthesis Process: Parameters and
Results ............................................................................................................................... 26

vii
Table 7: Comparison of Properties Generated from Varying Process Temperatures and
Hold Times ........................................................................................................................ 46
List of Figures
Figure 1: Summary of ALL-CRAFT Activated Carbon Production Process ........................ 13
Figure 2: Percent Sample Mass Loss in 3K Carbon Activation as a function of Activation
Temperature ..................................................................................................................... 18
Figure 3: Percent Carbon Mass Loss in 3K Carbon Activation as a Function of Activation
Temperature ..................................................................................................................... 19
Figure 4: Percent Sample Mass Loss in KOH Activation at 790°C at Different KOH:C
Ratios ................................................................................................................................ 20
Figure 5: Percent Carbon Mass Loss in KOH Activation at 790°C at Different KOH:C
Ratios ................................................................................................................................ 20
Figure 6: Diagram of Rapid Uptake System ...................................................................... 28
Figure 7: Effect of Process Temperature on Carbon Bulk Density ................................... 30
Figure 9: Effect of Process Temperature on Carbon Mass Loss % ................................... 32
Figure 10: Effect of Process Hold time on Carbon Bulk Density at 790°C ....................... 33
Figure 11: Effect of Process Hold Time on Carbon Bulk Density at 750 °C ...................... 34
Figure 12: Effect of Process Hold Time on Carbon Mass Loss for 3K Carbon .................. 34
Figure 13: Effect of Process Hold Time on Carbon Mass Loss % for 2K Carbon .............. 35
Figure 14: Effect of Process Hold Time on Carbon Mass Loss % for 1K Carbon .............. 35
Figure 15: Effect of Process Hold Time on Methane Uptake at 790°C ........................... 36

viii
Figure 16: Effect of Process Hold Time on Methane Uptake at 750°C ............................ 37
Figure 17: Effect of Activating Agent on Reaction Sample Mass Loss % at 790°C........... 38
Figure 18: Effect of Activating Agent on Carbon Mass Loss % at 790°C .......................... 38
Figure 19: Effect of Activating Agent on Carbon Bulk Density at 790°C ......................... 39
Figure 20: Effect of Activating Agent on Methane Uptake at 790°C ............................... 40
Figure 21: Mass Loss in Phosphoric Acid Carbonization for Different Carbon Precursors
........................................................................................................................................... 41
Figure 22: Bulk Density of Phosphoric Acid Activated Char for Different Carbon
Precursors ....................................................................................................................... 42
Figure 23: Methane Uptake of Phosphoric Acid Activated Char for Different Carbon
Precursors ....................................................................................................................... 42
Figure 24: KOH Reaction Sample Mass Loss % at 790°C for Different Carbon Precursors
........................................................................................................................................... 43
Figure 25: KOH Reaction Carbon Mass Loss % at 790°C for Different Carbon Precursors
........................................................................................................................................... 44
Figure 26: KOH Reaction Carbon Bulk Densities at 790°C for Different Carbon Precursors
........................................................................................................................................... 45
Figure 27: KOH Reaction Rapid Uptake at 790°C for Different Carbon Precursors ......... 45

1
Chapter 1: Introduction
1.1: Introduction and Definition
The following thesis investigates the production of activated carbon, an environmentally
friendly adsorbent which is used in many industries. Activated carbon can be derived
from many different sources and produced in varying production processes. The raw
materials used, activation process, and process parameters determine the physical
properties and performance characteristics of the resulting carbon. Modifying these
activation properties determines the porosity and pore volume distribution in the
carbon. The goal of this thesis is to detail a mass balance on the production of activated
carbon and develop quick screening methods to observe and compare the effects of
different precursor materials, chemical reagents, and process variables on this
production process.
Activated carbon is defined as a carbonaceous material with a large internal surface
area and highly developed porous structure resulting from the processing of raw
materials under high temperature reactions. It is composed of 87% to 97% carbon but
also contains other elements depending on the processing method used and raw
material it is derived from. Activated carbon’s porous structure allows it to adsorb
materials from the liquid and gas phase.[1] Its pore volume typically ranges from 0.20
to 0.60 cm3/g, and has been found to be as large as 1 cm3/g. Its surface area ranges
typically from 800 to 1500 m2/g [2] but has been found to be in excess of 3,000 m2/ g.
The surface area contains mostly micropores with pore diameters smaller than 2 nm.[3]

2
These favorable properties make activated carbon a popular adsorbent for many
applications.
1.2: History of Activated Carbon and Present Day Applications
The useful properties of activated carbon have been known since ancient times. This
traces back to 1500 BC when Egyptians used charcoal as an adsorbent for medicinal
purposes and a purifying agent. Around 420 BC it was observed that Hippocrates dusted
wounds with powdered charcoal to remove their odor. Ancient Hindu societies purified
their water by filtration through charcoal. [2] In 1773, the Swedish chemist Karl Wilhelm
Scheele was the first to observe adsorption of gases on charcoal. A few years later
activated carbons began being used in the sugar industry as a decolorizing agent for
syrup.
In the early 20th century the first plant to produce activated carbon industrially was built
for use in sugar refining industry in Germany. Many other plants emerged in the early
1900’s to make activated carbons primarily for decolorization. During World War I
activated carbon was used in gas masks for protection against hazardous gases and
vapors. Today, activated carbons are used to remove color from pharmaceutical and
food products, as air pollution control devices for industrial and automobile exhaust, for
chemical purification, and as electrodes in batteries. 500,000 tons per year of activated
carbon are produced globally. [1] 80% of this is used for liquid phase applications, and
20% is used for solid phase applications. [2] This paper will focus on activated carbons

3
applications as a natural gas adsorbent with the intentions of using the stored natural
gas as an alternative fuel to petroleum.
1.3: Activated Carbon Production Processes
The procedure for processing activated carbon typically consists of a carbonization
followed by an activation of carbonaceous material from vegetable origin.
Carbonization is a heat treatment at 400-800°C which converts raw materials to carbon
by minimizing the content of volatile matter and increasing the carbon content of the
material. This increases the materials strength and creates an initial porous structure
which is necessary if the carbon is to be activated.
Adjusting the conditions of carbonization can affect the final product significantly. An
increased carbonization temperature increases reactivity, but at the same time
decreases the volume of pores present. This decreased volume of pores is due to an
increase in the condensation of the material at higher temperatures of carbonization
which yields an increase in mechanical strength. Therefore, it becomes important to
choose the correct process temperature based on the desired product of
carbonization.[1]
After the initial porous structure has been created by carbonization, an oxidation,
referred to as activation, is carried out in order to create micropores. [3] Typically, these
micropores have a width of less than 2 nanometers and are the pores where the
majority of adsorption occurs. Activation can be carried out as activation by oxidizing
gases or a chemical activation.

4
In activation by oxidizing gases, such as steam activation, carbon reacts with the
oxidizing agent producing oxides of carbon. These oxides diffuse out of the carbon
resulting in a partial gasification which opens pores that were previous closed and
further develops the carbons internal porous structure.
In chemical activation, the carbon is reacted at high temperatures with a dehydrating
agent that eliminates the majority of hydrogen and oxygen from the carbon structure.
Chemical activation often combines the carbonization and activation step, but these two
steps may still occur separately depending on the process. [1] High surface areas in
excess of 3,000 m2/g have been found when using KOH as a chemical activating agent.
[3]
A significant amount of carbon mass loss occurs during the activation which generally
correlates to an increase in porosity. Therefore, quick estimates of porosity can be
made by a gravimetric measurement. These gravimetric measurements can be used to
compare carbons made using different process parameters and raw materials. [1]
1.4: Activated Carbon from Different Raw Materials
In addition to being an adsorbent used for many different purposes, activated carbon
can be produced from a wealth of different raw materials, making it an incredibly
versatile product that can be produced in many different areas depending on what raw
material is available. Some of these materials include shells of plants, the stones of
fruits, woody materials, asphalt, metal carbides, carbon blacks, scrap waste deposits
from sewage, and polymer scraps. Different types of coal, which already exist in a

5
carbonaceous form with a developed pore structure, can be further processed to create
activated carbon.
Although activated carbon can be produced from almost any raw material, it is most
cost effective and environmentally conscious to produce activated carbon from waste
materials. Activated carbons produced from coconut shells have been shown to have
high volumes of micropores, making them the most commonly used raw material for
applications where high adsorption capacity is needed. Sawdust and other woody scrap
materials also contain strongly developed microporous structures which are good for
adsorption from the gas phase. Producing activated carbon from olive, plum, apricot,
and peach stones yields highly homogenous adsorbents with significant hardness,
resistance to abrasion and high micropore volume. PVC scrap can be activated if HCl is
removed beforehand, and results in an activated carbon which is a good adsorbent for
methylene blue. Activated carbons have even been produced from tire scrap.
In order to distinguish between the wide range of possible precursors, it becomes
necessary to evaluate the resulting physical properties after activation. When choosing
a precursor the following properties are of importance: specific surface area of the
pores, pore volume and pore volume distribution, composition and size of granules, and
chemical structure/character of the carbon surface. [1]
Choosing the correct precursor for the right application is very important because
variation of precursor materials allows for controlling the carbons pore structure.
Different precursors contain varying amounts of macropores (> 50 nm,) which

6
determine their reactivity. These macropores are not effective for adsorption, but their
presence allows more channels for creation of micropores during activation.
Additionally, the macropores provide more paths for adsorbate molecules to reach the
micropores during adsorption. [3] Precursors which contain a greater amount of volatile
substances yield a proportional increase in the reactivity of the activated substance. If
the reactivity is too high, the degree of activation can be lowered. Achieving the correct
of amount of reactivity is of the utmost importance, since the extent of reaction
occurring determines the carbons internal structure. [1]
1.5: Analysis of the Petroleum Industry and its Flaws
As mentioned before, this work focuses on using activated carbon to store natural gas.
This research is being conducted with the intent of making the use of natural gas more
cost-effective as an alternative fuel to petroleum. Petroleum has historically been the
most popular source of energy due to its high energy content and cheap price. Modern
society is heavily dependent on oil and would most likely collapse if a sudden mass oil
shortage occurred. [4] Gasoline accounts for about 17% of the energy consumed in the
U.S., and is delivered from oil refineries through pipelines to a massive distribution chain
serving 176,000 retail gas outlets, making the U.S. highly dependent on this
infrastructure.
On top of the dangerous fact that the world is highly dependent on the petroleum
industry, there are also several negative factors. To start, 31% of the world’s oil is
produced in the Middle East, which is an incredibly unstable area. This is a very large

7
amount compared to the U.S., which only produces 9% while consuming 25.6% of the
world’s oil. A diplomatic issue between the U.S. and the Middle East could cause a
shortage of oil which would be catastrophic to the U.S. economy.
Oil also has many negative effects on the environment. The combustion of oil produces
carbon monoxide, oxides of sulfur, and oxides of nitrogen which are harmful to humans
and nature. In addition, the production of oil emits smog, carbon dioxide, ozone,
methane, and nitrous oxides. Oil based carbon dioxides emissions count for slightly less
than one half of the world total. Emissions from oil are roughly equivalent to those
from coal and natural gas added together. 3,297 Million Metric Tons of carbon
equivalent are emitted from burning oil compared to 2,507 from coal and 1,512 from
natural gas.
Land based oil exploration, refining, and transportation causes damage to wildlife
preserves and interferes with animal migration routes in addition to releasing a large
amount of atmospheric emissions and creating extra amounts of work to rehabilitate
land after mining or pipe laying. One fourth of world production of oil is from offshore
fields. Large scale spills from oil tankers are a giant problem and are devastating to the
environment. [5] In the year 2006 it was estimated that the present worldwide oil
reserves contain about 1200 billion barrels of oil, and 900 billion barrels have been
consumed to date.
It is estimated that the world is forming about 7,000 barrels of oil per year, but 30 billion
barrels per year are being consumed. From these calculations, the world only has 40.6

8
years left of oil supply. Combining this fact with all the other negative factors, it seems
obvious that alternatives to petroleum need to be pursued. [4]
1.6: The Natural Gas Industry, a Viable Alternative
One of the most readily available alternatives to petroleum is natural gas. Natural gas is
composed of mostly methane (70-90 %), but also ethane (5-15%), and propane/butane
(<5%). [4] Three major types of natural gas are associated gas, non-associated gas, and
synthetic gas. Natural gas derived from organic matter by thermal degradation and
natural degasification of coal deposited at great depths of the earth at high
temperatures is referred to as non-associated gas, while natural gas occurring in
association with oil reserves is deemed associated gas. Synthetic Natural gas is derived
from processing of coal.
Natural gas burns cleaner and more efficiently than coal or oil and is almost free of
harmful contaminants, making it an environmentally friendly alternative which
contributes less to air pollution. Additionally, known reserves of natural gas are well
distributed across the world, so being overly dependent on one area is not an issue. The
U.S. accounts for 22.9% of the world’s production of natural gas(while consuming
27.2%); the biggest producer is the former Soviet Union at 27.8%. [5]
The biggest problem with natural gas is that it has a lower energy density than oil. One
liter of petroleum produces about 3.5X10⁴ KJ of energy compared to 40 KJ of energy
produced by natural gas upon combustion. Fortunately there are three options to
enhance the energy density of natural gas: Liquefied Natural Gas (LNG), Compressed

9
Natural Gas (CNG) and Adsorbed Natural Gas (ANG). LNG has an energy density close to
gasoline but is costly to produce. CNG must be compressed to 25 mPa or greater, which
requires thick and heavy storage tanks. ANG is the most attractive option. It takes less
energy to store and utilize AGN than CNG and LNG while maintaining a light weight and
storage stability. [2]
1.7: Activated Carbon for the Adsorption of Natural Gas
Activated carbon’s excellent gas adsorption properties make it a perfect candidate for
ANG. Additionally, adsorption can occur at ambient temperatures and low pressures, so
it is relatively safe. A storage vessel is filled with activated carbon and vacuumed to
pressures around 6X10⁻² Pa. Shortly after the vessel is completely evacuated,
pressurized methane is introduced to the vessel causing physisorption to occur. [2] This
physisorption is fully reversible and is driven by attractive dispersion forces. Most of
the adsorption occurs in the micropores; the amount of adsorption in macropores is
negligible. The micropores are tailored to have the correct dimensions to allow optimal
methane storage while remaining large enough that adsorption is not limited. [2]
1.8: Previous Activated Carbon Research at the University of
Missouri
At the University of Missouri activated carbon research is conducted under the ALL-
CRAFT (Alliance for Collaborative research in Alternative Fuel Technology) project. The
project is driven by a collaboration between the chemical engineering, physics, and
chemistry departments, and also the MU research reactor (MURR.) After the initial

10
production process of activated carbon was developed, samples were pressed into
monoliths and sent to Midwest Research Institute in Kansas City for testing as a natural
gas adsorbent; a test tank was created and used to fuel a Ford F150 pickup.
The current focus of the ALL-CRAFT project is to increase the storage capacity of its
activated carbons by doping the samples with boron and creating fission tracks on the
carbons surface by neutron irradiation performed at MURR. Increased storage capacity
is also being pursued by optimizing the production of activated carbon.

11
Chapter 2: Production of Activated Carbon from
Corn Cobs; Mass Balance and Process
Description
2.1: ABSTRACT
Highly nanoporous carbon with surface areas in excess of 3,000 m2/g were produced
from the potassium hydroxide (KOH) activation of a high nominal surface area (700
m2/g) carbon intermediate. These materials have exhibited favorable methane and
hydrogen storage capabilities with interest toward commercial production. In
preparation for commercial production, detailed mass balances are needed to quantify
yield, quantify the masses of waste streams, understand the propensity to recycle the
KOH, and to provide a benchmark for further optimization. A mass balance on the
reaction of phosphoric acid and KOH with carbon is detailed in this chapter.
2.2: INTRODUCTION
Activated carbon is a proven, high-performance material for a range of applications
from water purification to catalyst supports. A key indicator of performance in many of
these applications is the carbon’s BET surface area as reported in m2/g. Surface areas of
300 m2/g are considered good for many materials. However, under the ALL-CRAFT
(Alliance for Collaborative Research in Alternative Fuel Technology) project at the
University of Missouri, BET surface areas in excess of 3,000 m2/g have been achieved
(see Table 1)[6-7]. An activation temperature between 750°C and 800°C [8-9]and a

12
KOH:C ratio between 3 and 4 [10-11]have been shown to produce the highest surface
area carbons.
Table 3: Sample BET measurements for ALL-CRAFT carbons. 3K Surface Area σ= 200,
3K Porosity σ=0.025
Sample #
KOH Ratio
Process
Temperature
(°C)
Process Hold
Time
(hrs)
Specific
Surface Area
(m2/g)
Porosity from
Isotherm
1 0 480 1 1150 0.59
2 2 790 1 1880 0.69
3 3 790 1 2670 0.78
4 4 790 1 2600 0.81
A primary reason for the lack of commercialization of the higher surface area activated
carbons is the increased complexity and costs of their synthesis. In particular, high
surface areas often have low yields (kg of activated carbon divided by the kg of biomass
feed stock). Also, the use of reagents like KOH can simultaneously increase reagent and
waste disposal costs. Optimum methane storage occurs at activation temperatures
ranging from 700°C to 800°C [12]. Storage capability also increases as BET surface area
increases[13]. In addition, it has been shown that experimental methane delivery is
maximized at a KOH:C ratio of 3:1 [14].
Carbon can be produced from a wide range of biomass and fossil fuels. Corncobs are
the preferred feedstock for the ALL-CRAFT project because they are abundant in the
Midwest, are composed mainly of woody resources, contain a low amount of minerals,
and produce a carbon with high densities of 1-3 nm pores. Analysis from The

13
Anderson’s Inc. (Maumee, OH) shows a 43.5% carbon content in corncob feedstock,
which makes it a promising precursor for the production of nanoporous carbon. The
corncobs also contain 48.4% oxygen, 7.9% Hydrogen, and 0.21% Nitrogen. If it is
assumed that half the oxygen leaves as water and the other half as carbon dioxide, a
theoretical yield of 43.5% should be obtainable from pyrolysis of the corncobs[7].
As stated in chapter 1, the properties of activated carbon can vary depending on the
initial carbon source as well as the method of activation. In this study, activated carbon
is produced from corncob feedstock in two chemical activation steps: a phosphoric acid
carbonization, deemed charring, and KOH activation. Figure 1 summarizes this process,
which will be referred to as the ALL-CRAFT synthesis process in this study.
Figure 1: Summary of ALL-CRAFT Activated Carbon Production Process

14
During phosphoric acid carbonization, the carbon is pyrolyzed at 480°C after being
soaked in phosphoric acid. The acid soak hydrolyzes carbohydrate components in the
system making them water soluble and isolates the carbon containing components.
Pyrolyzing the hydrolytic solid leaves only carbon and water soluble components. These
products are washed to eliminate all water soluble and non-carbon constituents and
isolate the carbon [15-16]. BET surface area measurements of up to 1350 m2/g have
been reported for carbons which have undergone phosphoric acid carbonization [15, 17-
18].
During the KOH activation at higher temperatures (700-800 C) KOH is believed to
penetrate the carbon and exfoliate the carbon matrix into groupings of graphene layers.
For the mass balance in this study, an activation temperature of 790°C and a KOH:C ratio
of 3:1 will be used, since carbons activated at these conditions have shown the most
favorable characteristics for adsorption. [7]
The chemical activation can be described by these two reactions [19]
2C + 6KOH 2K + 3H2 + 2K2CO3 (1)
yK2CO3 + zC 2yK + (y + z) COx (2)
Similar reaction mechanisms have been proposed by Tay et al. [20] and Lillo-Rodenas et
al. [21]
After the activation process, the KOH is washed from the crevices creating spaces
suitable for gas adsorption. For y = 2 and x = 2 (carbon dioxide), the equations 1 and 2
reaction scheme consumes three moles of carbon (MW=12) for each six moles of KOH

15
(MW =56). This suggests a mass ratio of 1:9.3 for carbon dioxide formation and 1:4.7 for
carbon monoxide formation
2.3: EXPERIMENTAL
2.3.1: Materials and Equipment
Corncob feedstock (14 mesh) was obtained from The Andersons’ Inc. (Maumee,
Ohio).This material is from the middle pith layer of the corncob. Phosphoric acid (85%)
was obtained from Fisher Scientific. KOH (>90%) was obtained from Sigma Aldrich.
Nitrogen (99.99%) and methane were supplied by PraxAir Inc. Samples were ball-milled
using a United Nuclear Ball Mill. A 750 series model 126 Isotemp Programmable
Muffle furnace obtained from Fischer Scientific was used for charring and large scale
activation. A model FD1545M Furnace from ThermoScientific was used to perform the
activation for small scale samples. A nitrogen purge was directed at the reactor in the
oven with a purge rate of 5 L/min and adequate ventilation. 8 quart stainless steel
reactors obtained from Cole Parmer were used for charring and large scale activation.
50 mL Aluminum Oxide Crucibles from Cole Parmer were used to perform activation for
small scale samples. Carbon washing was carried out on in a Buchner Funnel.
2.3.2: Sample Preparation
The activated carbon was synthesized using the process of Figure 1 with details as
follows: A phosphoric acid/ water mixture was prepared in the ratio 63:37 phosphoric
acid: water. This mixture was mixed thoroughly in a 40/60 ratio with corncob feedstock
and allowed to undergo hydrolysis overnight at 45 degrees Celsius. The hydrolytic solid

16
was pyrolized at 350°C for half an hour followed by 480 °C for one hour to produce
carbon char. The resulting char was then washed with distilled water. Similar
phosphoric acid processes were employed in [18] and [15] The char stock was kept in a
vacuum oven at 140 °C to ensure that it did not adsorb moisture from the air. The
char/chemical activating agent mixture was prepared to fill roughly 15 percent of the
stainless steel reactor by volume. For large scale activation conducted to obtain the
mass balance, the activating agent was added to the char in a 3:1 char: activating agent
ratio (this is referred to as 3K.) The resulting mixture was mixed in the stainless steel
reactor with a mass of distilled water less than or equal to the mass of the carbon char
until a paste like mixture was formed. The reactor was then placed in the high
temperature furnace and heated using the single setpoint mode. The samples were
kept in the furnace for a process hold time of 1 hour at a process temperature of 790°C.
A similar KOH activation process was used in [22]. The activated mixtures were
transferred to and washed in a Buchner funnel in order to remove the potassium from
the carbon. Each sample was washed with 14 L of tap water with a 0.15% concentration
of formic acid followed by 14 L of tap water. The carbon was then kept in a vacuum
oven overnight at 140 °C to dry. After the carbon was dried its mass was measured to
determine the process yield. For the parametric study used to determine process
standard deviations, one gram of char was used for each sample. The activating agent
was then added to the carbon (in a ratio of 2:1, 3:1, or 4:1 by mass (2K, 3K, 4K)) and ball
milled for 2.5 hours. Each individual ball milled sample was added to a 50 mL alumina
crucible and placed in a small high temperature oven using the single setpoint mode.

17
Each small scale sample was washed in a Buchner funnel with 200 mL of tap water with
a 0.15% concentration of formic acid followed by 100 mL of tap water. Parameters of
investigation included the ratio of activating agent to carbon, activation temperature,
and activation time. The charring step (carbonization) was the same for both large scale
and small scale activation.
2.4: RESULTS
Table 4: Large Scale Mass Balance on ALL-CRAFT Activated Carbon Process: 3K Ratio,
790°C Process Temperature, 1 hour Process Hold Time
Mass Corncob Feedstock 751 g
Mass Carbon Char After Phosphoric Acid Carbonization, Washing, Drying 447 g
Yield in Phosphoric Acid Carbonization (Corncob to Char) 59.6%
Mass Carbon Char Used in KOH Activation 437 g
Mass 3K Carbon after KOH Activation, Washing, Drying 140 g
Carbon Yield in KOH Activation (Char to 3K Carbon) 31.9%
Overall Process Yield (Corncob to 3K Carbon) 18.6%
Table 2 shows a mass balance on the ALL-CRAFT process for producing activated carbon
from corncobs (see figure 1 for block flow diagram.) A 40.4 % mass loss (59.6% yield) is
observed in the phosphoric acid carbonization. Similar phosphoric acid carbonization
yields were achieved in [17] and [15]. A 68.1 % overall carbon mass loss is observed in
the KOH activation, while an 11.1% sample mass loss was observed in the activation
reaction. Figures 2-5 show the results of the parametric study conducted to determine
process standard deviations. Each point represents the average of four carbon samples.

18
The significance of these temperature and KOH: C ratio trends will be discussed further
in chapter 3.
Figure 2: Percent Sample Mass Loss in 3K Carbon Activation as a function of Activation
Temperature
Figure 2 shows sample mass loss increasing with increasing temperature. This indicates
that more intense reactions occur at higher temperatures. At 700, 750, and 800 °C the
standard deviations are ± 1.53, 1.08, and 1.16 % respectively.
4%
6%
8%
10%
12%
14%
16%
18%
20%
680 700 720 740 760 780 800 820
Sam
ple
Mas
s Lo
ss
Temperature (°C)

19
Figure 3: Percent Carbon Mass Loss in 3K Carbon Activation as a Function of Activation
Temperature
At varying temperatures, the standard deviations for the percent mass loss of carbon at
700, 750, and 800 °C are as follows: ± 1.98, 2.91, and 3.40 % respectively. Figure 4
shows the percent sample mass loss at varying KOH:C ratios. For 2K, 3K, and 4K the
standard deviations are ± 1.22, 1.38, and 2.08%.
45%
50%
55%
60%
65%
70%
75%
80%
85%
90%
680 700 720 740 760 780 800 820
Car
bo
n M
ass
Loss
Temperature (°C)

20
Figure 4: Percent Sample Mass Loss in KOH Activation at 790°C at Different KOH:C
Ratios
Figure 5: Percent Carbon Mass Loss in KOH Activation at 790°C at Different KOH:C
Ratios
The standard deviations for the total carbon mass loss at 790°C for 2K, 3K, and 4K
carbon are ± 4.01, 5.22, and 5.13 %. The standard deviations for different process
temperatures and different KOH: C ratios can be averaged to determine a typical
standard deviation for the carbon production process.
0%
2%
4%
6%
8%
10%
12%
14%
16%
18%
1.5 2 2.5 3 3.5 4 4.5
Sam
ple
Mas
s Lo
ss
KOH:C Ratio
45%
55%
65%
75%
85%
1.5 2 2.5 3 3.5 4 4.5
Car
bo
n M
ass
Loss
KOH:C Ratio

21
2.5: DISCUSSION
The phosphoric acid carbonization had a process yield of 59.6%, which is analogous to a
40.4% mass loss. This accounts for any volatile substances that were present in the
precursor before activation. Table 3 shows an elemental analysis of the char.
Table 5: Elemental Analysis of Char
Element Wt. % in Char
Carbon 72.2
Hydrogen 1.69
Nitrogen 1.04
Oxygen 21.5
Sodium 1.03
Potassium 0.55
Phosphorus 2.47
From the composition of corncobs given earlier, the initial 751 grams of corncob
feedstock theoretically contains 326 g carbon, 363 g oxygen, 59.3 g hydrogen, and 1.60
g nitrogen. After phosphoric acid carbonization, the elemental analysis percentages
show that the 447 grams of char 323 g carbon, 96.2 grams oxygen, 7.51 grams
hydrogen, and 6.26 grams of nitrogen. In other words, 267 grams of oxygen were lost,
3.60 grams of carbon were lost, and 51.8 grams of hydrogen were lost. Adding these
numbers together gives an estimated mass loss of around 323 grams, which is close to
the 303 grams of mass loss experimentally. Table 4 provides a summary of these

22
results. These numbers are slightly off because the elemental analysis was conducted
on a different batch of char, and every batch is slightly different. Nonetheless, these
numbers support the claim that the majority of mass loss in the carbonization step is
due to the loss of volatile components in the precursor such as hydrogen and oxygen.
[1] The increase in mass of nitrogen is due to the nitrogen purge.
Table 6: Summary of Species Mass Loss Percentages in Phosphoric Acid Carbonization
Species
Mass Species Present Before
Carbonization (g)
Mass Species Present After Carbonization
(g)
Mass Loss of Species in
Carbonization (%)
Carbon 327 323 1.08
Oxygen 363 96.2 73.5
Hydrogen 59.3 7.51 87.3
The 437 grams of carbon char used for activation contained 316 g carbon, 7.39 g
hydrogen, and 93.9 g hydrogen. The 68.1% overall carbon mass loss is due to the KOH
acting as a dehydrating agent to drive off the majority of the oxygen and hydrogen, as
well as the KOH reacting corrosively with the carbon surface. As hydrogen and oxygen
diffuse out of the carbon they create more paths to help develop a more porous
structure with increased tortuosity. [1] Driving off the 94 grams of oxygen and 7.30
grams of hydrogen from the 437 grams of carbon leaves a mass of 336 grams. This is
mostly carbon, but may also contain small amounts of sodium potassium and
phosphorus. The remaining 196 grams of mass loss can be attributed to the KOH
reacting with the surface to produce K2CO3 and CO2.[23] CO2 leaves the system as a gas

23
and K2CO3 is removed in the washing step along with any unreacted KOH. Table 5
provides a summary of this data.
Table 7: Sources of Mass Loss in KOH Activation
Mass of Carbon Before
Activation
Mass Loss due to Hydrogen and Oxygen
Leaving System
Mass of Carbon After Oxygen and Hydrogen are Driven off
Final Mass of Carbon
After Activation
Mass Loss due to
Reaction with KOH
Mass Loss due to Other
Species
437 g 23.2 % 336 g 140 g 41.6 % 3.33 %
From the standard deviation data in figures 4-5, it can be concluded that the activation
reaction sample mass loss has an average standard deviation of ± 1.41%, while the
average standard deviation for carbon mass loss is ± 3.78 %. Since these standard
deviations are obtained from such a large volume of samples, all carbons produced
under the optimized ALL-CRAFT process and presented in chapter 3 will be assumed to
possess these statistics.
2.6: CONCLUSION
Under the ALL-CRAFT project high performance activated carbon was produced from
corncob feedstock through a two step phosphoric acid carbonization and KOH
activation. The phosphoric acid carbonization exhibited a 59.6% yield while the 3K KOH
activation had a yield of 31.9%. Combining these values gives an overall process yield of
18.6% corncobs to 3K carbon. It was determined that there is an average standard
deviation of ± 1.41 % in reaction sample mass loss, and ± 3.78 % in overall carbon mass
loss.

24
CHAPTER 3: Use of Screening Methods to
Analyze Activated Carbon Produced Using
Various Process Conditions, Chemical Activating
Agents, and Carbon Precursor Materials
3.1: ABSTRACT
The following paper proposes several screening procedures for the production of
activated carbon. Analyzing carbons can be expensive and time consuming, making it
important to identify physical properties which indicate that a carbon may have
favorable performance characteristics. The following paper proposes three ways of
screening carbons: observing the mass loss in the chemical activation process,
measuring the density of the carbon, and testing the methane uptake of the carbon in a
rapid uptake fixture. Carbons made from different precursors, reacted with different
activating agents, and heated at different process temperatures for different process
hold times were analyzed. Previous analysis has shown that carbon activated at 790°C
for one hour at a ratio of 3:1 KOH to carbon exhibits exceptional methane storage
capabilities and physical properties. The goal of this paper is to propose alternatives
that emulate the sample mass loss, density, and methane uptake of this carbon by using
different materials, process temperatures, and process hold times.
3.2: INTRODUCTION
As stated before, activated carbon is a widely used adsorbent in many industries. For
each different application of activated carbon, different pore structures, types of
granules, and carbon surfaces are needed. In order to control these properties different

25
carbon precursors, different activating methods, and varying conditions of activation are
used.
One method to identify a carbon for a certain application is to conduct a parametric
study varying process conditions, precursor materials, and activating agents. Normally
analysis of carbon is conducted by running adsorption isotherms, calculating the BET
surface area, and measuring pore volume among other procedures. [2] However, these
tests are time consuming, and a parametric study conducted with many parameters will
yield a wide array of different samples which need to be tested. In order to deal with
this problem, it becomes necessary to develop several different screening methods in
order to eliminate certain samples which do not display performance characteristics
needed for the given application of interest. In this study, screening methods are
developed in order to identify desirable properties for activated carbons being used as a
natural gas adsorbent.

26
Table 8: Summary of ALL-CRAFT Activated Carbon Synthesis Process: Parameters and
Results
Carbon Precursor Corncobs
Precursor: Phosphoric Acid +Water Ratio 40:60
Phosphoric Acid: Water Ratio 63:37
Mass Loss in Phosphoric Acid Carbonization 40.4 %
Activating Agent KOH
Activating Agent:Char Ratio 3:1 (3K)
Process Temperature 790 °C
Process Hold Time 1hour
Mass Loss In Charring 40.4 %
Sample Mass Loss in Activation (σ= ±1.41%) 11.1 %
Carbon Loss in Activation (σ= ±3.78%) 68.1 %
Density 0.136 g/mL
Methane Uptake Pressure Drop 175 PSI
Table 6 shows the process parameters and properties of carbon made using the ALL-
CRAFT synthesis process. The percent sample loss in carbonization, percent carbon loss
in activation, carbon density, and methane uptake are target values for the present
study and can be used to screen samples created with different activating agents,
carbon precursors, activating agent:char ratios, process temperatures, and process hold
times. The target values can be compared to experimental results in order to determine
if different combinations of parameters are effective in creating a carbon which will

27
perform similar to 3K carbon reacted at a process temperature of 790°C and a process
hold time of 1 hour.
3.3: EXPERIMENTAL
3.3.1: Materials and Equipment
Corncob feedstock (14 mesh) was obtained from The Andersons’ Inc. (Maumee, Ohio).
This material is from the middle pith layer of the corncob. Walnut Shells and Red Oak
Sawdust were obtained from Leimkuehler farms. Phosphoric acid (85%) was obtained
from Fisher Scientific. KOH (>90%), Lithium Hydroxide (>98), and Sodium Hydroxide
(>97%) were obtained from Sigma Aldrich. Nitrogen (99.99%) and methane were
supplied by PraxAir Inc. Samples were ball-milled using a United Nuclear Ball Mill. A
model 126 750 series Isotemp Programmable Muffle Furnace obtained from Fischer
Scientific was used for charring. A model FD1545M Furnace from ThermoScientific was
used to perform the activation. A nitrogen purge was directed at the reactor in the oven
with a purge rate of 5 L/min and adequate ventilation. 8 quart stainless steel reactors
from Cole Parmer were used for charring. Aluminum oxide crucibles (100 mL) from
Cole Parmer were used for activation. Carbon washing was carried out on in a Buchner
Funnel. The rapid uptake fixture was constructed from Swagelock supplies.

28
Figure 6: Diagram of Rapid Uptake System (Empty Vessel Pressure Drop = 125PSI)
3.3.2: Sample Preparation
The activated carbon was synthesized using the process described in Chapter 2 with the
following variations. Phosphoric acid was reacted with three different carbon precursor
feedstocks: corncobs, red oak sawdust, and walnut shells. Additionally, three different
activating agents were used: KOH, NaOH, and LiOH. The activating agent was added to
the char in varying char: activating agent ratios. (1:1, 2:1, 3:1, these will be referred to
as 1K, 2K, 3K) The resulting mixture was ball milled for 2.5 hours.
Each individual ball milled sample was added to a 100 mL alumina crucible and placed in
a high temperature oven using the single setpoint mode. The samples were kept in the
high temperature oven for varying process hold times (1, 2, 3 hours) and process
temperatures (750, 790°C.) When the oven temperature cooled to 100 °C the samples
were removed and weighed. The activated mixtures were transferred to and washed in

29
a Buchner funnel in order to remove the potassium from the carbon. Each sample was
washed with 200 mL of tap water with a 0.15% concentration of formic acid followed by
100 mL of tap water.
The Bulk density of the carbon was measured in a graduated cylinder. The methane
uptake was measured in the rapid uptake system depicted in figure 2. 5 mL of carbon
was added to a 5 mL manifold. Around 0.3 g of glass wool was used as a plug to keep
the carbon from being vacuumed into the system. The manifold was vacuumed for one
hour before closing the right valve to keep the sample at vacuum and isolated from the
gas reservoir. The gas reservoir was charged to 750 PSI creating a pressure gradient
between the gas reservoir and the vacuumed sample. The methane was then released
into the sample and the system was allowed to equilibrate. The pressure drop was
recorded between the equilibrium pressure and the initial manifold pressure of 750 PSI.

30
3.4: RESULTS
3.4.1: Effects of Process Temperature
Figure 7: Effect of Process Temperature on Carbon Bulk Density (σ=±0.0177 g/mL)
Figure 7 shows that a higher process temperature correlates to a lower density carbon.
Also, it shows that as the KOH:C ratio decreases, the density increases.
Kinetic reaction theories predict that as temperature increases, both the rate of reaction
increases and new, more aggressive, reactions may become possible (a manifestation of
increasing reaction rates with increasing temperature). These trends are consistent
with the increased mass loss with increasing temperature of Figures 8 and 9. Evans et al
[24] reported similar trends in yields.
0.10
0.12
0.14
0.16
0.18
0.20
0.22
0.24
0.26
0.28
0 1 2 3 4
Car
bo
n D
en
sity
(g/
mL)
KOH:C Ratio
790 degC
750 degC

31
Figure 8: Effect of Process Temperature on Reaction Sample Mass Loss % (σ=±1.41%)
Figure 8 illustrates how increasing temperatures lead to increasing loss of mass during
chemical activation. The mass loss is from the evolution of gases from the mixture of
KOH and char. The lower mass loss of 3K carbon is a result of the higher loading of
potassium which is not significantly volatile in any of its possible derivatives at 750 or
790°C. Figure 8 shows the reaction mass loss decreasing with temperature. 1K and 2K
carbons show an increase in sample mass loss with increasing temperature, which
supports the argument that a more vigorous reaction is occurring at higher
temperatures.
0
5
10
15
20
25
30
35
40
0 1 2 3 4
Sam
ple
Mas
s Lo
ss (
%)
KOH:C Ratio
790 degC
750 degC

32
Figure 9: Effect of Process Temperature on Carbon Mass Loss % (σ=±3.78%)
Figure 9 further supports the claims of the previous figure by showing that as
temperature increases, there is a higher amount of mass lost in the system, signifying
that more reaction is occurring. However, a higher % mass loss is synonymous with a
lower process yield, so if a higher process yield is desirable, a lower temperature
reaction could be a feasible route. The yield of carbon is typically of greater interest
than the loss of mass from the mixture of KOH and char during activation. However the
sample mass loss during reaction can be a good screening tool to determine if the
carbon will perform well if alternative activating agents, different precursors, or
different process variables are being tested. Tseng reported a somewhat similar trend
as that of Figure 9 where increasing loadings of KOH resulted in slightly reduced loss of
carbon [13]. Others [24] [22] have observed increased carbon loss with increasing KOH
loadings. Multiple competing phenomena impact the rate of carbon loss which requires
a more in-depth discussion.
50
55
60
65
70
75
0 1 2 3 4
Car
bo
n M
ass
Loss
(%
)
KOH:C Ratio
790 degC
750 degC

33
3.4.2: Effects of Process Hold Time
Figure 10: Effect of Process Hold time on Carbon Bulk Density at 790°C (σ=±0.0177
g/mL)
Figures 10 and 11 show the effect of process hold time on the density of carbons
activated at 750 and 790°C. As process hold time increases, density decreases. This
suggests that continuous reaction is occurring for the entire process hold time, and the
surfaces of the carbon become increasingly etched as time goes on.
0.05
0.07
0.09
0.11
0.13
0.15
0.17
0.19
0.21
0.23
0.25
0 1 2 3 4
Car
bo
n D
en
sity
(g/
mL)
Process Hold Time(hrs)
1K
2K
3K

34
Figure 11: Effect of Process Hold Time on Carbon Bulk Density at 750 °C (σ=±0.0177
g/mL)
Figure 12: Effect of Process Hold Time on Carbon Mass Loss for 3K Carbon (σ=±3.78%)
0.1
0.12
0.14
0.16
0.18
0.2
0.22
0.24
0.26
0 1 2 3 4
Car
bo
n D
en
sity
(g/
mL)
Process Hold Time (hrs)
1K
2K
3K
55
60
65
70
75
80
0 0.5 1 1.5 2 2.5 3 3.5
Car
bo
n M
ass
Loss
(%
)
Process Hold Time (hrs)
790 degC
750 degC

35
Figure 13: Effect of Process Hold Time on Carbon Mass Loss % for 2K Carbon
(σ=±3.78%)
Figure 14: Effect of Process Hold Time on Carbon Mass Loss % for 1K Carbon
(σ=±3.78%)
Figures 12, 13, and 14 show the effects of process hold time on Carbon Mass Loss % for
1K, 2K, and 3K carbon. All three figures show an increase in mass loss% for increasing
55
60
65
70
75
80
0 1 2 3 4
Car
bo
n M
ass
Loss
(%
)
Process Hold Time (hrs)
790 degC
750 degC
60
65
70
75
80
85
0 0.5 1 1.5 2 2.5 3 3.5
Car
bo
n M
ass
Loss
(%
)
Process Hold Time (hrs)
790 degC
750 degC

36
process hold time. Comparing the three figures shows that for 1K, 2K, and 3K carbon a 3
hour process hold time at 750°C can produce similar process yield results as a process
hold time of 1 hour at 790°C
Figure 15: Effect of Process Hold Time on Methane Uptake at 790°C (σ=±2.5PSI)
Figures 15 and 16 show the effects of process hold time on methane uptake at 750 and
790°C. As process hold time increases, the methane uptake of the carbon also
increases. In addition, as KOH:C ratio increases, methane uptake increases. However,
there is not an appreciable difference in methane uptake from 750 to 790°C.
158
160
162
164
166
168
170
172
174
176
178
0 1 2 3 4
Pre
ssu
re D
rop
(P
SI)
Process Hold Time (hrs)
1K
2K
3K
37
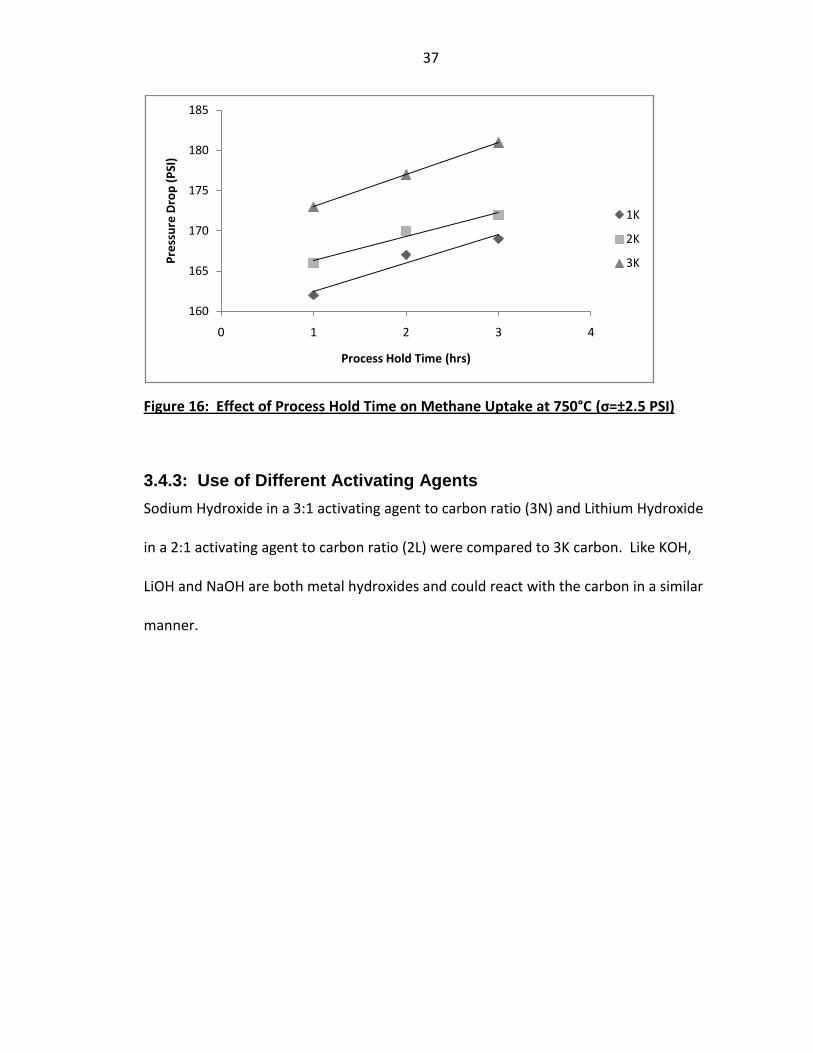
Figure 16: Effect of Process Hold Time on Methane Uptake at 750°C (σ=±2.5 PSI)
3.4.3: Use of Different Activating Agents
Sodium Hydroxide in a 3:1 activating agent to carbon ratio (3N) and Lithium Hydroxide
in a 2:1 activating agent to carbon ratio (2L) were compared to 3K carbon. Like KOH,
LiOH and NaOH are both metal hydroxides and could react with the carbon in a similar
manner.
160
165
170
175
180
185
0 1 2 3 4
Pre
ssu
re D
rop
(P
SI)
Process Hold Time (hrs)
1K
2K
3K

38
Figure 17: Effect of Activating Agent on Reaction Sample Mass Loss % at 790°C
(σ=±1.41%)
Figure 18: Effect of Activating Agent on Carbon Mass Loss % at 790°C (σ=±3.78%)
3K carbon and 3N carbon show similar sample mass loss and carbon mass loss
percentages. However, 2L carbon shows a much higher percentage loss in both
0
5
10
15
20
25
Sam
ple
Mas
s Lo
ss (
%)
3K Carbon 3N Carbon 2L Carbon
60
62
64
66
68
70
72
74
76
78
Car
bo
n M
ass
Loss
(%
)
3K Carbon 3N Carbon 2L Carbon
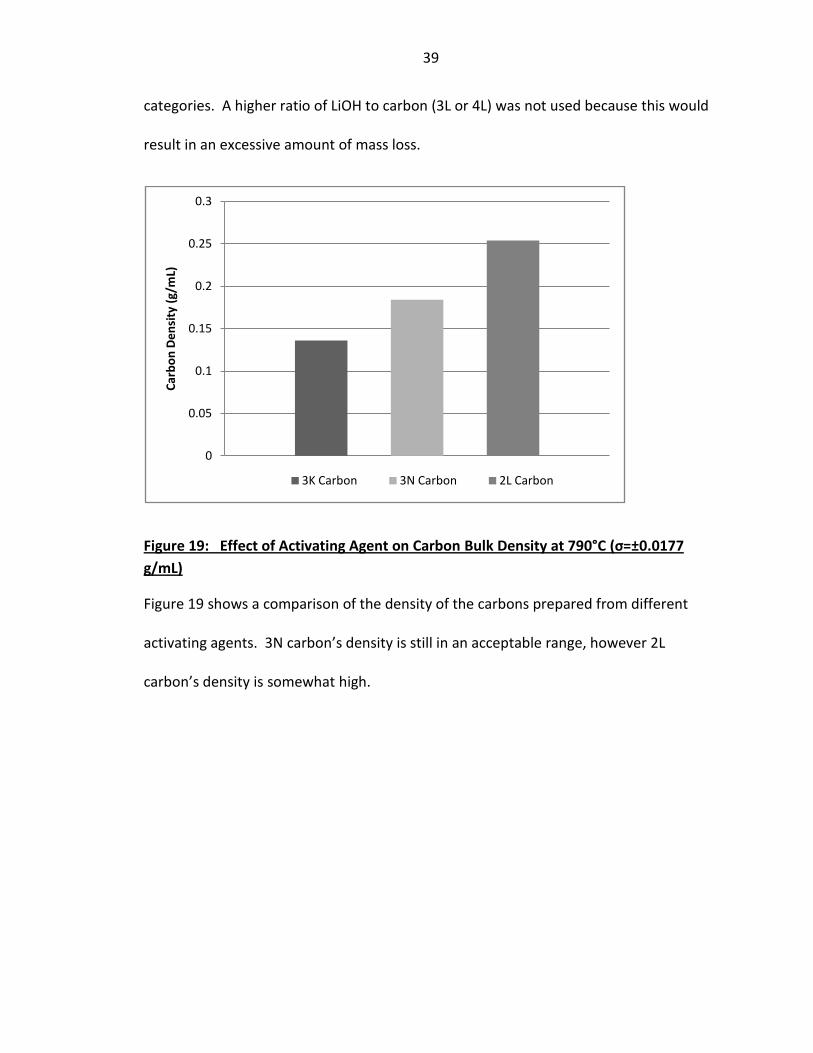
39
categories. A higher ratio of LiOH to carbon (3L or 4L) was not used because this would
result in an excessive amount of mass loss.
Figure 19: Effect of Activating Agent on Carbon Bulk Density at 790°C (σ=±0.0177
g/mL)
Figure 19 shows a comparison of the density of the carbons prepared from different
activating agents. 3N carbon’s density is still in an acceptable range, however 2L
carbon’s density is somewhat high.
0
0.05
0.1
0.15
0.2
0.25
0.3
Car
bo
n D
en
sity
(g/
mL)
3K Carbon 3N Carbon 2L Carbon

40
Figure 20: Effect of Activating Agent on Methane Uptake at 790°C (σ=±2.25 PSI)
Figure 20 shows the effect of activating agent on samples methane uptake at 790°C.
Even though 3N carbon has a higher density than 3K carbon, it performs better on the
methane uptake screening test.
3.4.4: Use of Different Carbon Precursors
Three different carbon precursors were evaluated: Corncobs, walnut shells, and red oak
sawdust. Analysis was performed on the phosphoric acid carbonization reaction and the
KOH activation reaction. The phosphoric acid carbonization consisted of a ½ hour
process hold time at 350°C and a 1 hour process hold time at 480°C. The KOH activation
reaction consisted of a 1 hour process hold time at 790°C.
140
145
150
155
160
165
170
175
180
185
190
Pre
ssu
re D
rop
(P
SI)
3K Carbon 3N Carbon 2L Carbon

41
Figure 21: Mass Loss in Phosphoric Acid Carbonization for Different Carbon
Precursors (σ=±3.78%)
Figure 21 shows a comparison of the amount of mass lost between the three precursors
in the phosphoric acid carbonization. Red oak sawdust and walnut shells show a greater
amount of mass lost than corncobs. Figure 18 shows the densities of the resulting
carbon chars. Red oak sawdust and Corncobs have similar densities while walnut shell
char has a slightly higher density. This may be attributed to the fact that walnut shells
are denser than sawdust and corncobs.
0
10
20
30
40
50
60
70
Mas
s Lo
ss in
Ch
arri
ng
(%)
Corncob Char Walnut Shell Char Red Oak Char

42
Figure 22: Bulk Density of Phosphoric Acid Activated Char for Different Carbon
Precursors (σ=±0.0177 g/mL)
Figure 23: Methane Uptake of Phosphoric Acid Activated Char for Different Carbon
Precursors (σ=±2.50 PSI)
0
0.1
0.2
0.3
0.4
0.5
0.6
0.7
Ch
ar D
en
sity
(g/
mL)
Corncob Char Walnut Shell Char Red Oak Char
120
125
130
135
140
145
150
155
160
Pre
ssu
re D
rop
(P
SI)
Corncob Char Walnut Shell Char Red Oak Char

43
Figure 23 shows the methane uptake of the resulting chars from phosphoric acid
carbonization. Red oak char displays a much higher methane uptake than that of walnut
shells and corncobs. In fact, the uptake of the red oak sawdust is almost as high as that
of 1K carbon with a process temperature of 790°C and a process hold time of one hour.
Figure 24: KOH Reaction Sample Mass Loss % at 790°C for Different Carbon Precursors
(σ=±1.41%)
0
2
4
6
8
10
12
14
16
18
20
Sam
ple
Mas
s Lo
ss (
%)
3K Corncob 3K Walnut Shells 3K Red Oak

44
Figure 25: KOH Reaction Carbon Mass Loss % at 790°C for Different Carbon Precursors
(σ=±3.78%)
Figure 24 shows that the sample mass loss of carbons derived from walnut shells and
red oak sawdust is slightly higher than that of carbons from a corncob precursor.
Conversely, the overall carbon mass loss of carbons from walnut shells and red oak
sawdust displayed in figure 25 is slightly lower than that of carbons from corncobs.
Figure 26 shows that the densities of carbon from the two alternate precursors are also
higher than the density of carbon made from corncobs.
52
54
56
58
60
62
64
66
68
70
Car
bo
n M
ass
Loss
(%
)
3K Corncob 3K Walnut Shells 3K Red Oak

45
Figure 26: KOH Reaction Carbon Bulk Densities at 790°C for Different Carbon
Precursors (σ=±0.01774 g/mL)
Figure 27: KOH Reaction Rapid Uptake at 790°C for Different Carbon Precursors (σ=±
2.5 PSI)
0
0.02
0.04
0.06
0.08
0.1
0.12
0.14
0.16
0.18
0.2
Car
bo
n D
en
sity
(g/
mL)
3K Corncob 3K Walnut Shells 3K Red Oak
160
165
170
175
180
185
190
195
200
205
Pre
ssu
re D
rop
(P
SI)
3K Corncob 3K Walnut Shells 3K Red Oak

46
Figure 27 shows the methane uptake of carbons activated with KOH and derived from
different precursors. Carbon from Red Oak and Walnut Shells outperform carbon made
from corncobs, despite the fact that carbon from walnut shells and red oak has a higher
density.
3.5: DISCUSSION
3.5.1: Effects of Process Hold Time and Process Temperature
Table 9: Comparison of Properties Generated from Varying Process Temperatures and
Hold Times
KOH:C
Ratio
Process
Temperature
(°C)
Process
Hold
Time
(hrs)
Sample
Mass
Loss
(%)
Carbon
Mass
Loss
(%)
Carbon
Bulk
Density
(g/mL)
Methane
Uptake
Pressure Drop
(PSI)
3 790 1 11.1 67.8 0.136 175
1 790 2 38.4 80.1 0.178 164
2 790 2 18.4 71.7 0.154 167
2 750 2 11.4 55.3 0.181 170
3 750 2 14.4 60.9 0.148 177
1 790 3 40.3 81.3 0.163 165
2 790 3 20.9 74.4 0.118 169
2 750 3 14.7 69.1 0.156 172
3 750 3 12.8 74.7 0.137 181
Table 7 shows that several properties of 3K carbon at 790°C can be emulated by using
lower process temperatures and longer process hold times. Densities within close

47
range of the target density of 0.136 g/mL can be achieved by heating 2K carbon at 790°C
for 2 hours, and 2K and 3K carbon at 750°C for 3 hours. However, all of the densities in
Table 7 are within reasonable distance of the target density.
1K carbon heated at 790°C for 3 hours is also of high interest because there is an
appreciable decrease in density with increased process hold time, and a low amount of
KOH is being used. Methane uptake readings similar to the target reading of 750 psi can
be achieved by heating 2K carbon at 790°C for 2 and 3 hours, 3K carbon at 750°C for 2
hours and heating 2K and 3K carbon at 750°C for 3 hours. Heating 2K and 3K Carbon at
750°C for 3 hours produces carbon mass loss percentages similar to the target carbon
mass loss of 67.8%. 2K and 3K carbon heated at 750°C for 2 and 3 hours produce similar
sample mass losses to the target mass loss of 11.1%. Judging from this data, the highest
samples of interest are 2K carbon heated at 790°C for 2 hours, 1K carbon heated at
790°C for 3 hours, 3K carbon heated at 750°C for 2 hours, and 2K carbon heated at
750°C for 3 hours.
A unexpected trend is noticed that samples prepared at a lower temperature have a
slightly higher methane uptake. It has been cited [2] that this may be due to a higher
density and smaller micropore size in carbons prepared at a slightly lower temperature.
A combination of these two properties could yield a higher methane uptake.
3.5.2: Use of Different Activating Agents
At a ratio of 3:1 activating agent to carbon, KOH and NaOH have similar mass losses and
densities at a process temperature of 790°C and a process hold time of one hour. NaOH

48
even outperforms KOH in the rapid methane uptake test. From the data collected in
this paper, it appears that NaOH could be a good substitute for KOH.
However LiOH at a 2:1 activating agent to carbon ratio has a higher mass loss and lower
density than KOH. Higher activating agent to carbon ratios would have unfavorable
process yields, while lower temperature activations or lower activating agent:carbon
ratios would yield a carbon with a higher density and lower methane uptake capability.
The mass loss in LiOH activate carbon and KOH activated carbon may seem comparable,
but mass loss values are calculated gravimetrically and high density LiOH activated
carbon produces a very low volume of product, making it an unfavorable activating
agent when compared to KOH and NaOH.
3.5.3: Use of Different Carbon Precursors
Carbon prepared from red oak sawdust and walnut shells exhibited a greater mass loss
in phosphoric acid carbonization than carbon derived from corncobs. This may indicate
that the phosphoric acid/ water mixture reacts more vigorously with red oak sawdust
and walnut shells than with corncobs, which could be caused by a higher amount of
volatile substances in the sawdust and walnut shells than in the corncobs.
This increased mass lost may suggests that the walnut shells and sawdust have a greater
amount of micropores, which would yield increased adsorptivity. [1] However, only the
char from red oak sawdust shows an increase in methane uptake performance over char
from corncobs; walnut shell char performs nearly the same as corncob char. This may

49
suggest that the walnut shell carbon has the same amount of micropores as the carbon
from sawdust, but a portion of the internal pore structure remains closed.
Since the red oak sawdust was more affected by the phosphoric acid carbonization, one
would also expect that it would have superior methane uptake to walnut shell char and
corncob char after being reacted with KOH. However, this is not the case. 3K walnut
shell carbon and 3K Red Oak sawdust carbon both have a greater methane uptake than
3K corncob carbon. Methane uptake of 3K walnut shell carbon and 3K red oak sawdust
carbon is nearly the same. Since the walnut shell and red oak sawdust carbons are
assumed to have the same amount of micropores, this suggests that the chemical
activation with KOH may have opened up pores in the walnut shell carbon that were
previously closed, causing it to perform the same as the red oak sawdust carbon.
In addition, walnut shells may be a more carbonaceous material than sawdust, leading
to a more intense reaction with KOH and a greater increase in adsorption capacity.[1]
The sample mass loss of 3K carbon was lower than that of 3K sawdust and 3K walnut
shells, but at the same time the carbon mass loss of 3K carbon was higher than that of
3K sawdust and 3K walnut shells. The lower sample mass loss of 3K corncob carbon
suggests that more byproducts and salts are formed in the 3K corncob reaction than in
the 3K walnut shell and 3K sawdust reactions. The overall carbon mass loss displays the
mass of carbon remaining after excess salts are removed during washing. More carbon
remains in 3K walnut shell carbon and 3K sawdust carbon than 3K corncob carbon,

50
which is supported by the higher carbon mass loss of 3K corncob carbon and lower
carbon mass loss of 3K sawdust carbon and 3K walnut shell carbon.
The fact that the density of red oak and walnut shell carbons is higher than that of
corncob carbons even though corncob carbons have a lower methane uptake
contradicts an earlier trend observed in carbons activated exclusively from corncobs
where lower densities yielded higher methane uptake. However, it was also observed
that carbons from red oak sawdust and walnut shell carbon may have a larger amount
of micropores, higher carbon content, and greater mechanical strength, giving them a
higher density. This may suggest that density is only a valid screening device when
comparing carbons created from the same precursor, since a slight increase in density
could be a positive sign depending on the precursor used. The higher process yields and
increased methane uptake of red oak sawdust and walnut shell carbons suggests that
these two precursors are viable alternatives to corncobs, and may even generate
carbons that outperform activated carbons derived from corncob biomass.
3.6: CONCLUSION
Activated carbon samples were produced varying the process hold time, process
temperature, activating agent, activating agent: carbon char ratio, and carbon
precursor. These samples were then analyzed using the following screening methods:
observing the mass loss in chemical reaction, measuring carbon density, and measuring
methane uptake.

51
It was observed that increasing the process hold time while decreasing the process
temperature and activating agent:carbon char ratio could produce carbons with similar
methane uptake, mass loss, and density as carbons reacted at lower process hold times
with higher temperatures and higher activating agent: char ratios. Chemical reaction
with NaOH produced carbons with similar mass loss, densities, and methane uptake to
carbons reacted with KOH.
However, chemical reaction with LiOH produced carbons which were inferior to carbons
produced from KOH reaction. Carbons derived from both walnut shells and red oak
sawdust outperformed carbons derived from corncobs on the rapid methane uptake
test, despite the fact that their final carbon density was slightly higher and their carbon
mass loss was slightly lower. These observations show that carbons produced from
reaction with NaOH, and carbons with walnut shells and red oak sawdust as a precursor
are all practical and possibly superior alternatives to carbons derived from corncobs and
reacted with KOH.

52
CHAPTER 4: CONCLUSION
4.1: Activated Carbon from Corncobs Using Phosphoric Acid and KOH
The production of activated carbon from waste materials for use as a natural gas
adsorbent provides an environmentally friendly source of alternative energy. Activated
carbon with surface areas above 2500 m2/g and 80% internal porosities can be
produced from corncobs by utilizing the two step ALL-CRAFT activation process. The
phosphoric acid carbonization gives a 59.6% yield of carbon char and develops the initial
porous structure of the carbon while eliminating volatile substances in the corncob. The
KOH activation further develops this porous structure; KOH etches the carbon surface
through vigorous reaction while acting as a dehydrating agent to force all hydrogen and
oxygen out of the carbon structure, increasing its tortuosity. These effects create a
68.9% mass loss in the KOH activation, which leads to an overall process yield of 18.6%
(corncob to 3K carbon.) This yield may be batch size dependent with larger batch sizes
producing increased yields.
4.2: Analysis of Varying Precursors, Process Conditions, and Activating Agents Using Screening Techniques
A parametric study was conducted in order to produce a variety of samples using
different process hold times and process temperatures, activating agent: carbon ratios,
carbon precursors, and activating agents. The goal of this study was to find activated
carbon samples which possessed similar physical characteristics to samples produced
from corncobs. The samples were compared by observing the mass loss in the charring
53
and activation processes, density of the resulting carbon samples, and volumetric
methane uptake of the resulting samples.
Optimizing process conditions can be very important in industry where spending the
least amount of money is of interest. Samples heated for longer process hold times
with lower process temperatures and KOH: C ratios performed similarly to samples with
shorter process hold times, higher process temperatures, and higher KOH: C ratios.
It was found that using NaOH as an activating agent produced similar results as using
KOH. However, when LiOH was used as an activating agent, a high density carbon was
obtained with a lower process yield. This leads to a very low yield of carbon
volumetrically. Carbons activated with NaOH had a slightly better methane uptake than
carbons activated with KOH; carbons activated with LiOH had a significantly lower
methane uptake than both of these. Two carbon precursors from waste products were
investigated as alternatives to corncobs: Red oak sawdust and walnut shells. Both
sawdust and walnut shells showed a greater amount of mass loss in phosphoric acid
carbonization; this suggests that these carbons contain a greater amount of volatile
substances and react more vigorously with phosphoric acid to produce a more defined
initial internal porous structure.
Conversely, carbon produced from corncobs shows a greater mass loss in the KOH
activation than carbon produced from walnut shells and sawdust, suggesting that KOH
has a greater effect on corncob carbon. Despite this fact, activated carbon derived from

54
walnut shells and sawdust still had a slightly better methane uptake than carbon from
corncobs.
4.3: Recommendations for Further Research
A positive point of this research is that a wide variety of different samples were
evaluated. However, due to the high volume of samples, the only examinations
performed were simple screening procedures; no surface area analyses were
performed. Value would be added to the present study if adsorption isotherms, pore
volume estimates, SAXS, SEM images, and other relevant analysis was conducted on
each sample in this study that performed well on screening tests. Gravimetric analysis
to estimate porosity and volumetric methane uptake could be a good indicator of
carbon properties, but carbon’s exact physical characteristics are unknown without
more in-depth analysis.
More in-depth analysis of NaOH as an activating agent, walnut shells or red oak sawdust
as a precursor, a longer process hold time, 750°C activation temperatures, and an
activating agent : carbon ratio of 4:1 could produce an activated carbon that
outperforms 3K carbon at 790°C and 1 hour.

55
REFERENCES
1. Jankowska, H., A. Swiatkowski, and J. Choma, Active Carbon. 1991: Ellis Horwood Limited.
2. Bansal, R.C. and M. Goyal, Activated Carbon Adsorption. 2005, Boca Raton, FL: CRC Press.
3. Beguin, F. and E. Frackowiak, Carbons for Electrochemical Energy Storage and Conversion Systems. 2010: CRC Press.
4. McElroy, M., Energy Perspectives, Problems, & Prospects. 2010, New York: Oxford University Press.
5. Shepherd, W. and D.W. Shepherd, Energy Studies. 2003, London: Imperial College Press.
6. Burress, J., Gas Adsorption in Engineered Carbon Nanospaces, in Physics. 2009, University of Missouri: Columbia.
7. Shah, P., Nanoporous Carbon from Corncobs and its Applications, in Chemical Engineering. 2007, University of Missouri: Columbia.
8. Pfeifer, P., et al., Biomass Derived High Surface Area Carbon Materials with Large Micropores. 2008: United States.
9. Lua, A.C. and T. Yang, Effect of activation temperature on the textural and chemical properties of potassium hydroxide activated carbon prepared from pistachio-nut shell. Journal of Colloid and Interface Science, 2004. 274(2): p. 594-601.
10. Ubago-Pérez, R., et al., Granular and monolithic activated carbons from KOH-activation of olive stones. Microporous and Mesoporous Materials, 2006. 92(1-3): p. 64-70.
11. Lozano-Castelló, D., et al., Preparation of activated carbons from Spanish anthracite: I. Activation by KOH. Carbon, 2001. 39(5): p. 741-749.
12. Perrin, A., et al., NaOH activation of anthracites: effect of temperature on pore textures and methane storage ability. Carbon, 2004. 42(14): p. 2855-2866.
13. Tseng, R.-L., Physical and chemical properties and adsorption type of activated carbon prepared from plum kernels by NaOH activation. Journal of Hazardous Materials, 2007. 147(3): p. 1020-1027.
14. Lozano-Castelló, D., et al., Influence of pore size distribution on methane storage at relatively low pressure: preparation of activated carbon with optimum pore size. Carbon, 2002. 40(7): p. 989-1002.
15. Gómez-Serrano, V., et al., Preparation of activated carbons from chestnut wood by phosphoric acid-chemical activation. Study of microporosity and fractal dimension. Materials Letters, 2005. 59(7): p. 846-853.
16. Cheng, F., et al., Biomass Waste-Derived Microporous Carbons with Controlled Texture and Enhanced Hydrogen Uptake. Chemistry of Materials, 2008. 20(5): p. 1889-1895.
17. Rosas, J.M., et al., HEMP-derived activated carbon fibers by chemical activation with phosphoric acid. Fuel, 2009. 88(1): p. 19-26.

56
18. Vernersson, T., et al., Arundo donax cane as a precursor for activated carbons preparation by phosphoric acid activation. Bioresource Technology, 2002. 83(2): p. 95-104.
19. H. Marsh, F.R.-R., Activated Carbon. 1 ed. 2006, Amsterdam: London: Elsevier. 20. Tay, T., S. Ucar, and S. Karagöz, Preparation and characterization of activated
carbon from waste biomass. Journal of Hazardous Materials, 2009. 165(1-3): p. 481-485.
21. Lillo-Ródenas, M.A., D. Cazorla-Amorós, and A. Linares-Solano, Understanding chemical reactions between carbons and NaOH and KOH: An insight into the chemical activation mechanism. Carbon, 2003. 41(2): p. 267-275.
22. Wu, F.-C., R.-L. Tseng, and R.-S. Juang, Preparation of highly microporous carbons from fir wood by KOH activation for adsorption of dyes and phenols from water. Separation and Purification Technology, 2005. 47(1-2): p. 10-19.
23. Marsh, H. and F. Rodriguez-Reinoso, Activated Carbon. 2006: Elsevier Science and Technology Books.
24. Evans, M.J.B., E. Halliop, and J.A.F. MacDonald, The production of chemically-activated carbon. Carbon, 1999. 37(2): p. 269-274.