production of activated carbons from illinois coals. archive/files/merge/vol-41... · production of...
TRANSCRIPT
PRODUCTION OF ACTIVATED CARBONS FROM ILLINOIS COALS
Edwin J. Hippo AND William S. O’Brien Department of Mechanical Engineering and Energy Processes
southern Illinois University at Carbondale Carbondale, IL 62901-6603
Jian Sun Department of Civil Engineering
University of Illinois Champaign, IL 61802
Keywords: Activated Carbons from Coal, Preoxidation, Surface Area of Chars
INTRODUCTION Although the predominant use of coal is for combustion applications, more beneficial, reasonable and profitable uses may be as a resource for the production of chemicals, and materials, including activated carbon. Activated carbons represent a family of carbonaceous substances manufactured by processes that develop the carbon’s adsorptive properties (1). They are highly disorganized, aromatic lamellae which stack in 3-dimensional space to form porous solids (2-4). They normal- ly have a high surface area, high adsorption capacities, and high surface reactivities. They are widely used in waste water treatment processes and are gaining increasing popularity for adsorb- ing vaporous organic molecules from gnses and liquid phases. They are often the material of choice for many environmental applications and can also be used as a catalysts support.
Coals are a popular parent material for the production of activated carbons. Many workers have reported the production of high grade activated carbons from coal (5-17).
Several problems have kept coals from becoming dominant parent materials. One problem is the inherent mineral content of coals. Second, high and low rank coals are thermosetting solids which means that the microstructure of the activated carbon produced from these coals is relatively fixed. Only minor changes in microstructure can be made by controlling the weight loss during the activation process. This phenomena allows for consistency in the product but the quality of the product is not optimal. The opposite problem exists for bituminous coals. Bitumi- nous coals melt during pyrolysis and the inherent pore structure collapses. The char must be heavily activated in order to produce a high grade of product. This can be circumvented by oxidation in air prior to the devolatilization step. However, the preoxidation step is difficult to control and the consistency of the end product is poor. Thus, bituminous coals give higher grade product than the lower or higher rank coals but the product consistency is poorer for the bitumi- nous rank coals. Other chemical methods have also been used to prevent pore collapse. All of these processes are costly. Besides these problems, little is understood in terms of the basic fundamentals that produce a carbon of desired microstructure from a given parent coal. Thus, for a given feedstock many tests must be conducted to properly optimize both yield and product quality. This paper discusses the production of activated carbon from an Illinois coal with a two- and a three-step process.
EXPERIMENTAL The primary objective of this study was to demonstrate that an activated carbon with acceptable commercial properties could be made from a -20x100 mesh fraction of an Illinois Basin coal (IBC 106). This sample was chosen for its low ash yield and represents a major coal producing seam in Illinois. The analysis of the whole coal can be found elsewhere (1 8). Pretreatment time and temperature, devolatilization temperature, and activation time and temperature were studied as production variables. The carbon products were characterized by C02 single point BET, helium density, bulk density, pore volume, and a dynamic toluene adsorption test.
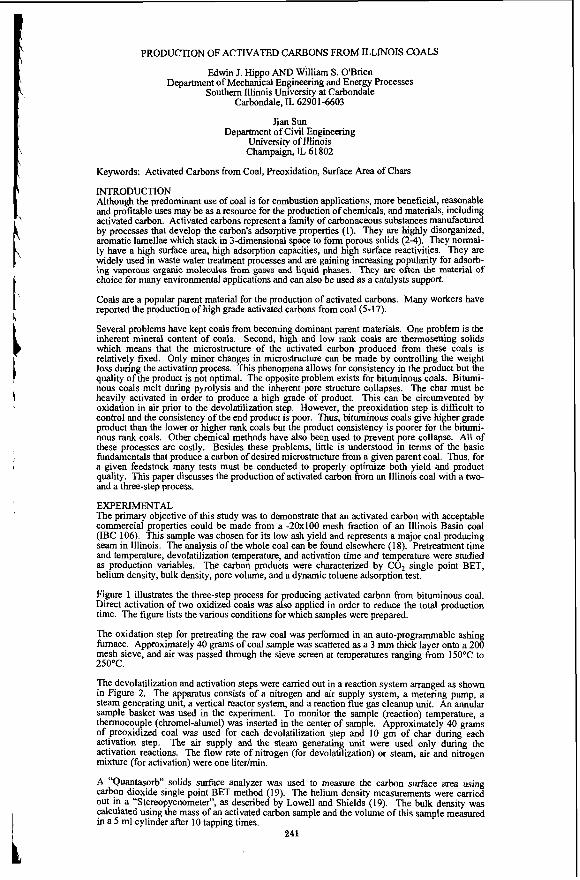
Figure 1 illustrates the three-step process for producing activated carbon from bituminous coal. Direct activation of two oxidized coals was also applied in order to reduce the total production time. The figure lists the various conditions for which samples were prepared.
The oxidation step for pretreating the raw coal was performed in an auto-programmable ashing furnace. Approximately 40 grams of coal sample was scattered as a 3 mm thick layer onto a 200 mesh sieve, and air was passed through the sieve screen at temperatures ranging from 1 50°C to 250°C.
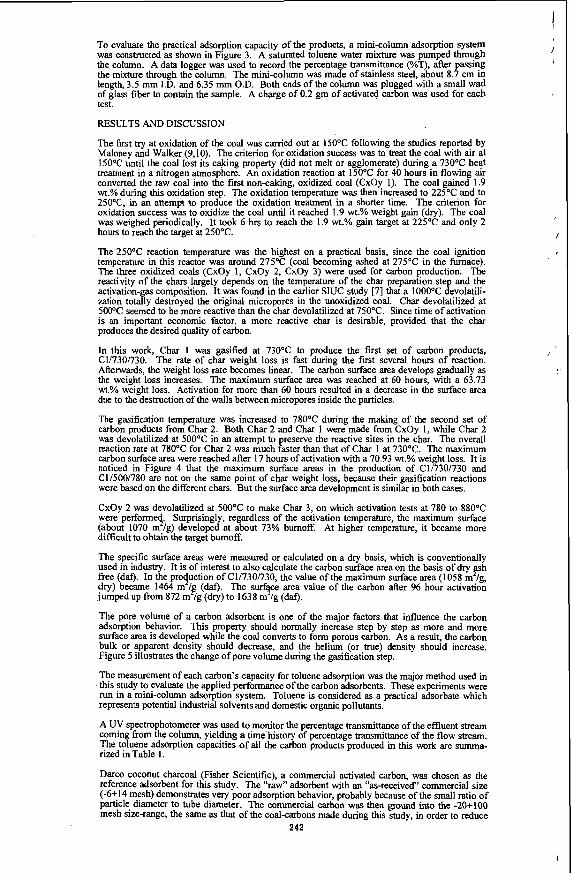
The devolatilization and activation steps were carried out in a reaction system arranged as shown in Figure 2. The apparatus consists of a nitrogen and air supply system, a metering pump, a steam generating unit, a vertical reactor system, and a reaction flue gas cleanup unit. An annular sample basket was used in the experiment. To monitor the sample (reaction) temperature, a thermocouple (chromel-alumel) was inserted in the center of sample. Approximately 40 grams of preoxidized coal was used for each devolatilization step and 10 gm of char during each activation step. The air supply and the steam generating unit were used only during the activation reactions. The flow rate of nitrogen (for devolatilization) or steam, air and nitrogen mixture (for activation) were one literhin.
A ‘‘Quantasorb’’ solids surface analyzer was used to measure the carbon surface area using carbon dioxide single point BET method (19). The helium density measurements were carried out in a “Stereopycnometer”, as described by Lowell and Shields (19). The bulk density was calculated using the mass of an activated carbon sample and the volume of this sample measured in a 5 ml cylinder after 10 tapping times.
241
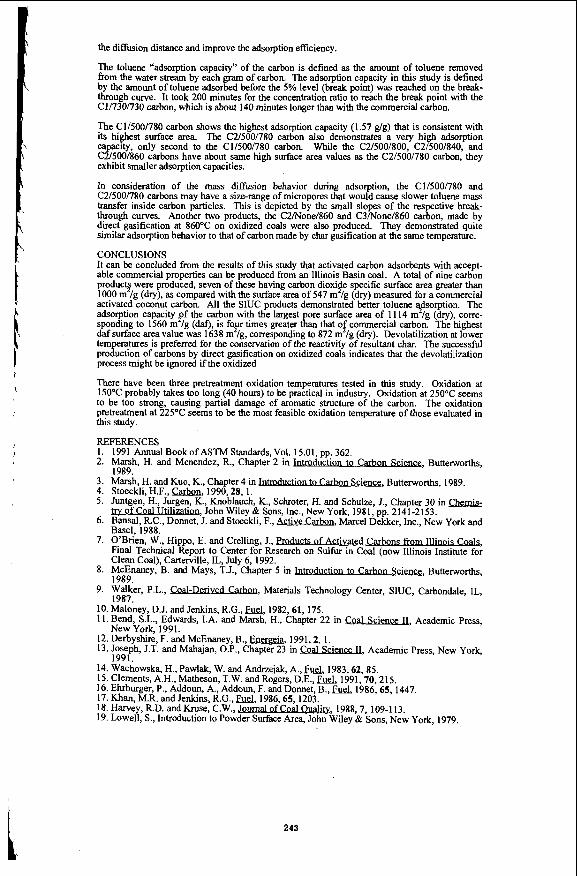
To evaluate the practical adsorption capacity of the products, a mini-column adsorption system was constructed as shown in Figure 3. A saturated toluene water mixture was pumped through the column. A data logger was used to record the percentage transmittance (%T), after passing the mixture through the column. The mini-column was made of stainless steel, about 8.7 cm in length, 3.5 mm I.D. and 6.35 mm O.D. Both ends of the column was plugged with a small wad of glass fiber to contain the sample. A charge of 0.2 gm of activated carbon was used for each test.
RESULTS AND DISCUSSION
The fust try at oxidation of the coal was carried out at 150°C following the studies reported by Maloney and Walker (9,lO). The criterion for oxidation success was to treat the coal with air at 150°C until the coal lost its caking property (did not melt or agglomerate) during a 730°C heat treatment in a nitrogen atmosphere. An oxidation reaction at 150°C for 40 hours in flowing mr converted the raw coal into the first non-caking, oxidized coal (CxOy 1). The coal gained 1.9 wt.% during this oxidation step. The oxidation temperature was then increased to 225°C and to 25OoC, in an attempt to produce the oxidation treatment in a shorter time. The criterion for oxidation success was to oxidize the coal until it reached 1.9 wt.?? weight gain (dry). The coal was weighed periodically. It took 6 hrs to reach the 1.9 wt.% gain target at 225°C and only 2 hours to reach the target at 250°C.
The 250°C reaction temperature was the highest on a practical basis, since the coal ignition temperature in this reactor was around 275°C (coal becoming ashed at 275T in the furnace). The three oxidized coals (CxOy 1, CxOy 2, CxOy 3) were used for carbon production. The reactivity of the chars largely depends on the temperature of the char preparation step and the activation-gas composition. It was found in the earlier SIUC study [7] that a 1000°C devolatili- zation totally destroyed the original micropores in the unoxidized coal. Char devolatilized at 500°C seemed to be more reactive than the char devolatilized at 750°C. Since time of activation is an important economic factor, a more reactive char is desirable, provided that the char produces the desired quality of carbon.
I
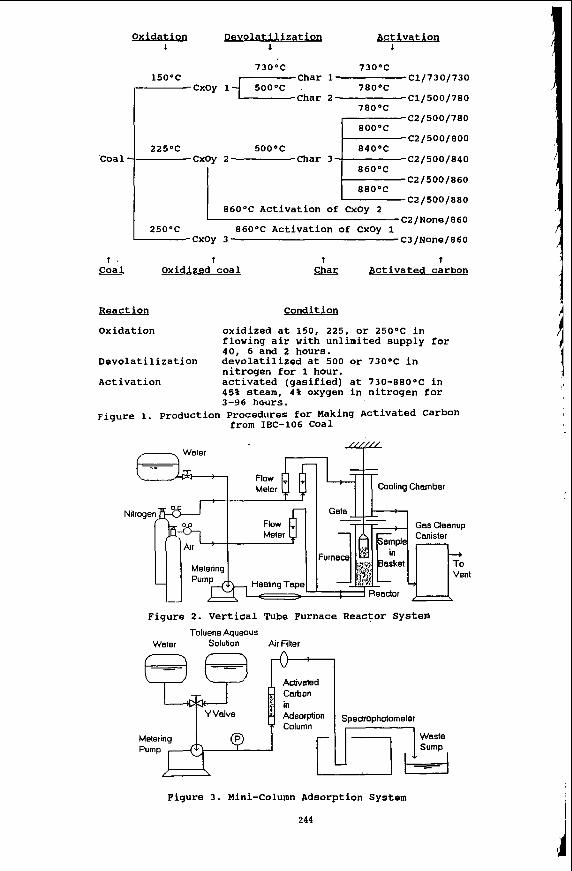
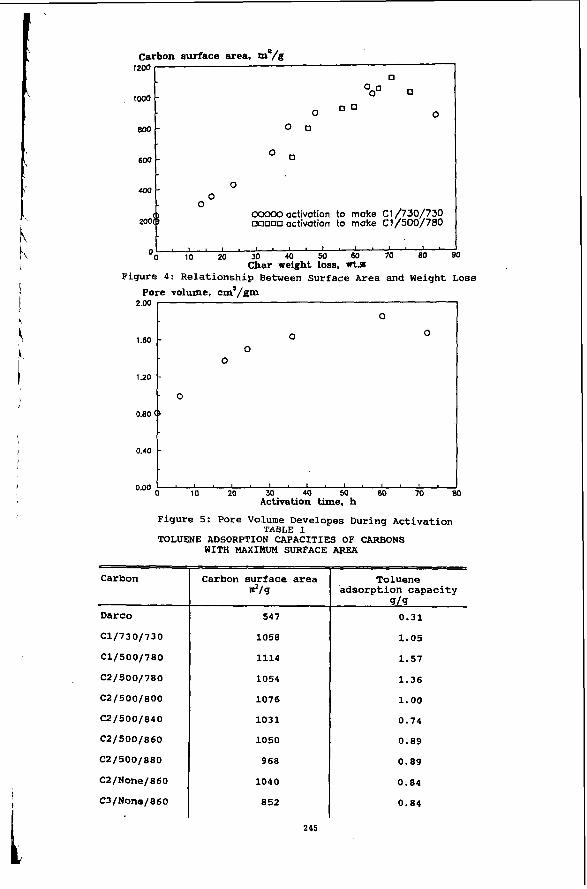
In this work, Char 1 was gasified at 73OoC to produce the first set of carbon products, C1/730/730. The rate of char weight loss is fast during the first several hours of reaction. Afterwards, the weight loss rate becomes linear. The carbon surface area develops gradually as the weight loss increases. The maximum surface area was reached at 60 hours, with a 63.73 wt.% weight loss. Activation for more than 60 hours resulted in a decrease in the surface area due to the destruction of the walls between micropores inside the particles.
The gasification temperature was increased to 780°C during the making of the second set of carbon products from Char 2. Both Char 2 and Char 1 were made from CxOy 1, while Char 2 was devolatilized at 500°C in an attempt to preserve the reactive sites in the char. The overall reaction rate at 780°C for Char 2 was much faster than that of Char 1 at 730°C. The maximum carbon surface area were reached after 17 hours of activation with a 70.93 wt.% weight loss. It is noticed in Figure 4 that the maximum surface areas in the production of C1/730/730 and C1/500/780 are not on the same point of char weight loss, because their gasification reactions were based on the different chars. But the surface area development is similar in both cases.
CxOy 2 was devolatilized at 500°C to make Char 3, on which activation tests at 780 to 880°C were performe$. Surprisingly, regardless of the activation temperature, the maximum surface (about 1070 m /g) developed at about 73% bumoff. At higher temperature, it became more difficult to obtain the target bumoff.
The specific surface areas were measured or calculated on a dry basis, which is conventionally used in industry. It is of interest to also calculate the carbon surface area on the basis of dry p h free (daf). In the proquction of C1/730/730, the value of the maximum surface area (1058 m /g, dry) became 1464 m /# (daf). The surfye area value of the carbon after 96 hour activation jumped up from 872 m /g (dry) to 1638 m /g (daf).
The pore volume of a carbon adsorbent is one of the major factors that influence the carbon adsorption behavior. This property should normally increase step by step as more and more surface area is developed while the coal converts to form porous carbon. As a result, the carbon bulk or apparent density should decrease, and the helium (or true) density should increase. Figure 5 illustrates the change of pore volume during the gasification step.
The measurement of each carbon’s capacity for toluene adsorption was the major method used in this study to evaluate the applied performance of the carbon adsorbents. These experiments were run in a mini-column adsorption system. Toluene is considered as a practical adsorbate which represents potential industrial solvents and domestic organic pollutants.
A UV spectrophotometer was used to monitor the percentage transmittance of the effluent stream coming from the column, yielding a time history of percentage transmittance of the flow stream. The toluene adsorption capacities of all the carbon products produced in this work are summa- rized in Table 1.
Darco coconut charcoal (Fisher Scientific), a commercial activated carbon, was chosen as the reference adsorbent for this study. The “raw” adsorbent with an “as-received” commercial size (-6+14 mesh) demonstrates very poor adsorption behavior, probably because of the small ratio of particle diameter to tube diameter. The commercial carbon was then ground into the -20+100 mesh size-range, the same as that of the coal-carbons made during this study, in order to reduce
242
I
I
I
1
the diffusion distance and improve the adsorption efficiency.
The toluene “adsorption capacity” of the carbon is defined as the amount of toluene removed from the water stream by each gram of carbon. The adsorption capacity in this study is defined by the amount of toluene adsorbed before the 5% level (break point) was reached on the break- through curve. it took 200 minutes for the concentration ratio to reach the break point with the C1/730/730 carbon, which is about 140 minutes longer than with the commercial carbon.
The C1/500/780 carbon shows the highest adsorption capacity (1.57 g/g) that is consistent with its highest surface area. The C2/500/780 carbon also demonstrates a very high adsorption capacity, only second to the C1/500/780 carbon. While the C2/500/800, C2/500/840, and C2/500/860 carbons have about same high surface area values as the C2/500/780 carbon, they exhibit smaller adsorption capacities.
In consideration of the mass diffusion behavior during adsorption, the C1/500/780 and C2/500/780 carbons may have a size-range of micropores that would cause slower toluene mass transfer inside carbon particles. This is depicted by the small slopes of the respective break- through curves. Another two products, the C2/None/860 and C3Mone/860 carbon, made by direct gasification at 860°C on oxidized coals were also produced. They demonstrated quite similar adsorption behavior to that of carbon made by char gasification at the same temperature.
CONCLUSIONS It can be concluded from the results of this study that activated carbon adsorbents with accept- able commercial properties can be produced from an Illinois Basin coal. A total of nine carbon produc9 were produced, seven of these having carbon dioxife specific surface area greater than 1000 m /g (dry), as compared with the surface area of 547 m /g (dry) measured for a commercial activated coconut carbon. All the SIUC products demonstrated better toluene 3dsorption. The adsorption capacity of the carbon with the largest pore surface area of 11 14 m /g (dry), corre- sponding to 1560 m2/g (daf), is four times greater than that of commercial carbon. The highest dafsurface area value was 1638 m2/g, corresponding to 872 m /g (dry). Devolatilization at lower temperatures is preferred for the conservation of the reactivity of resultant char. The successful production of carbons by direct gasification on oxidized coals indicates that the devolatilization process might be ignored if the oxidized
There have been three pretreatment oxidation temperatures tested in this study. Oxidation at 150°C probably takes too long (40 hours) to be practical in industry. Oxidation at 2SOoC seems to be too strong, causing partial damage of aromatic structure of the carbon. The oxidation pretreatment at 225°C seems to be the most feasible oxidation temperature of those evaluated in this study.
REFERENCES 1. 1991 Annual Book of ASTM Standards, Vol. 15.01, pp: 362. 2. Marsh, H. and Menendez, R., Chapter 2 in Introduction to C- ’ , Buttenvorths,
1989. 3. Marsh, H. and Kuo, K., Chapter 4 in ‘ , Butterworths, 1989. 4. Stoeckli, H.F., m, 1990,28, 1. 5. Juntgen, H., Jurgen, K., Knoblauch, K., Schroter, H. and Schulze, J., Chapter 30 in
try of Coal Utlllzatlon, John Wiley & Sons, Inc.,New York, 1981, pp. 2141-2153. 6. Bansal, R.C., Donnet, J. and Stoeckli, F., b e CarbQn , Marcel Dekker, Inc., New York and
Basel, 1988. 7. O’Brien, W., Hippo, E. and Crelling, J.,
Final Technical Report to Center for R e E % % o % m i Clean Coal), Carterville, IL, July 6, 1992.
8. McEnaney, B. and Mays, T.J., Chapter 5 in , Buttenvorths, 1989.
9. Walker, P.L., w e r i v e d a , Materials Technology Center, SIUC, Carbondale, IL, 1987.
10. Maloney, D.J. and Jenkins, R.G., E&, 1982,61,175. 11. Bend, S.L., Edwards, LA. and Marsh, H., Chapter 22 in , Academic Press,
New York, 1991. 12. Derbyshire, F. and McEnaney, B., 13. Joseph, J.T. and Mahajan, O.P., Chapter 23 in , Academic Press, New York,
1991. 14. Wachowska, H., Pawlak, W. and Andrzejak, A., U, 1983,62,85. 15. Clements, A.H.,Matheson,T.W. andRogers, D.E., m, 1991,70,215. 16. Ehburger, P., Addoun, A., Addoun, F. and Donnet, B., M, 1986,65,1447. 17. Khan, M.R. and Jenkins, R.G., M, 1986,65,1203.
19. Lowell, S., Introduction to Powder Surface Area, John Wiley & Sons, New York, 1979.
. .
1991,2, 1..
18. Harvey, R.D. and Kruse, C. W., Journal ’ , 1988,7, 109-113.
243
'Coal
m a t e d 'i Carbon A ii in YVdve AdsoPbon
Column
Oxidat ion Devolatilizatioq Activation 1 1 1
73O0C 73OoC
78OOC
78OOC
80OoC
225OC 5OO0C 84OOC
Char 1 -c1/730/730
Char 2- C1/500/780 cxoy l f 5 o o o c
15OoC
C2/500/780
C2/500/800
C2/500/840
C2/500/860
C2/500/880 86OoC Activation of CxOy 2
C2/None/860
cxoy 3 C3/None/860 25OOC 86OoC Activation of CxOy 1
Spectrophotometer
Waste
t . t - Coal Oxidized coal t t
Char Activated carbon
React ion Condition
Oxidat ion oxidized at 150, 225, or 25OoC in flowing air with unlimited supply for 40, 6 and 2 hours.
Devolatilization devolatilized at 500 or 730°C in nitrogen for 1 hour.
Activation activated (gasified) at 73O-88O0C in 45% steam, 4% oxygen in nitrogen for 3-96 hours.
Figure 1. Production Procedures for Making Activated Carbon from IBC-106 Coal
,-----, Water ,"i" Cooling Chamber
Flow Meter
Nilroge Gas Cleanup Canister
nt
- 0
00000 activation to make C1/730/730 ooooo activation to make C1/500/700 200
2.00
1.60
1.20
0.80
0
0 0 - 0
0 -
- 0
(L
I
i
Carbon
0.40 1
Carbon surface area Toluene dlg adsorption capacity
419 Darco
C1/730/730
c1/500/700
C2/500/700
c2/500/000
c2/500/040
C2 / 500/0 60
C2/500/000
C2/None/060
C3/None/860
547
1050
1114
1054
1076
1031
1050
968
1040
852
0.31
1.05
1.57
1.36
1.00
0.74
0.89
0.89
0.04
0.04
245
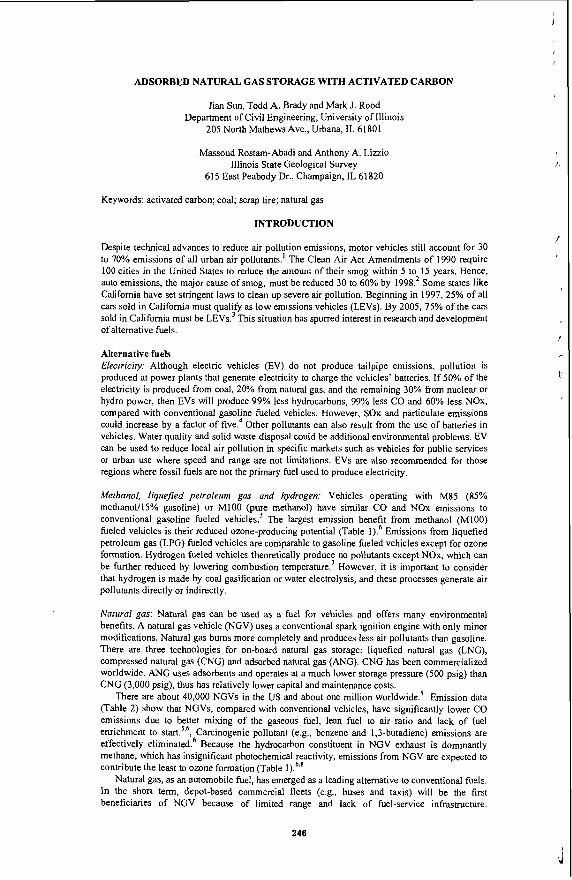
ADSORBED NATURAL GAS STORAGE WITH ACTIVATED CARBON
Jian Sun, Todd A. Brady and Mark J. Rood Department of Civil Engineering, University of Illinois
205 North Mathews Ave., Urbana, IL 61801
Massoud Rostam-Abadi and Anthony A. Lizzio Illinois State Geological Survey
615 East Peabody Dr., Champaign, IL 61820
Keywords: activated carbon; coal; scrap tire; natural gas
INTRODUCTION
Despite technical advances to reduce air pollution emissions, motor vehicles still account for 30 to 70% emissions of all urban air pollutants.’ The Clean Air Act Amendments of 1990 require 100 cities in the United States to reduce the amount of their smog within 5 to 15 years. Hence, auto emissions, the major cause of smog, must be reduced 30 to 60% by 1998.2 Some states like California have set stringent laws to clean up severe air pollution. Beginning in 1997, 25% of all cars sold in California must qualify as low emissions vehicles (LEVs). By 2005, 75% of the cars sold in California must be LEVS.~ This situation has spurred interest in research and development of alternative fuels.
Alternative fuels Electricily: Although electric vehicles (EV) do not produce tailpipe emissions, pollution is produced at power plants that generate electricity to charge the vehicles’ batteries. If 50% of the electricity is produced from coal, 20% from natural gas, and the remaining 30% from nuclear or hydro power, then EVs will produce 99% less hydrocarbons, 99% less CO and 60% less NOx, compared with conventional gasoline fueled vehicles. However, SOX and particulate emissions could increase by a factor of five.4 Other pollutants can also result from the use of batteries in vehicles. Water quality and solid waste disposal could be additional environmental problems. EV can be used to reduce local air pollution in specific markets such as vehicles for public services or urban use where speed and range are not limitations. EVs are also recommended for those regions where fossil fuels are not the primary fuel used to produce electricity.
Methanol, liquefied petroleum gas and hydrogen: Vehicles operating with M85 (85% methanoV15% gasoline) or MlOO (pure methanol) have similar CO and NOx emissions to conventional gasoline fueled vehicles.’ The largest emission benefit from methanol (MI 00) fueled vehicles is their reduced ozone-producing potential (Table 1).6 Emissions from liquefied petroleum gas (LPG) fueled vehicles are comparable to gasoline fueled vehicles except for ozone formation. Hydrogen fueled vehicles theoretically produce no pollutants except NOx, which can be further reduced by lowering combustion tem~erature.~ However, it is important to consider that hydrogen is made by coal gasification or water electrolysis, and these processes generate air pollutants directly or indirectly.
Nafural gas: Natural gas can be used as a fuel for vehicles and offers many environmental benefits. A natural gas vehicle (NGV) uses a conventional spark ignition engine with only minor modifications. Natural gas bums more completely and produces less air pollutants than gasoline. There are three technologies for on-board natural gas storage: liquefied natural gas (LNG), compressed natural gas (CNG) and adsorbed natural gas (ANG). CNG has been commercialized worldwide. ANG uses adsorbents and operates at a much lower storage pressure (500 psig) than CNG (3,000 psig), thus has relatively lower capital and maintenance costs.
There are about 40,000 NGVs in the US and about one million worldwide.’ Emission data (Table 2) show that NGVs, compared with conventional vehicles, have significantly lower CO emissions due to better mixing of the gaseous fuel, lean fuel to air ratio and lack of fuel enrichment to start.’,6, Carcinogenic pollutant (e.g., benzene and 1,3-butadiene) emissions are effectively eliminated.6 Because the hydrocarbon constituent in NGV exhaust is dominantly methane, which has insignificant photochemical reactivity, emissions from NGV are expected to contribute the least to ozone formation (Table
Natural gas, as an automobile fuel, has emerged as a leading alternative to conventional fuels. In the short term, depot-based commercial fleets (e.g., buses and taxis) will be the first beneficiaries of NGV because of limited range and lack of fuel-service infrastructure.
246
Improvement in the technologies for adsorbed natural as (ANG) storage will offer significant opportunities for reducing capital and operating COS~S.~'~''
Adsorbed natural gas The key ingredient for successful commercialization of ANG is the adsorbent. The natural gas storage capacity of an adsorbent is usually evaluated in terms of its volumetric methane storage capacity (VmfVs), where Vm is the volume of stored methane at standard temperature and pressure, and Vs is the volume of the storage container. Commercial development of ANG requires adsorbents with low costs (< $2.00/lb) and high gas stora e capacities (> 150 V ~ N S ) . ~ Activated carbons have the most favorable gas storage den~ity.''~ This paper describes some methods for producing adsorbent carbon from an Illinois bituminous coal and scrap tires. The potential application of these low cost adsorbents in low pressure ANG vehicles is also evaluated.
Coal and scrap tire as parent materials Because combustion of Illinois coals is increasingly restricted due to their higher sulfur contents, they are being studied as potential precursors for commercial activated carbon prod~ct ion. '~ The US has large stockpiles of waste tires, growing at a rate of approximately 280 million tires per year." Currently over 80% are landfilled, constituting a loss of significant resources and creating environmental problems. If some of these tires are converted into activated carbons, millions of tires would be diverted from the nation's landfills. Carbons from these sources may meet the cost and adsorption capacity requirements for ANG adsorbents.
EXPERIMENTAL
Sample preparation Adsorbent carbons were produced from an Illinois coal, IBC-106 (Free Swelling Index: 4.5"). The raw coal, provided by the Illinois Basin Coal Sample Pr~gram'~ , was ground and sieved from -8 mesh to -20+100 mesh and to -100 mesh. The -20+100 mesh portion was used as feedstock for physical activation and the -100 mesh portion was used for chemical activation. Shredded automotive tires used in this study were obtained from three vendors: Atlas (Los Angeles, CA), National Tire Services (Chicago, IL), and Baker Rubber (South Bend, IN). Their nominal particle diameters were 3, I and 0.4 mm, respectively. Results from proximate and ultimate analyses of the IBC-106 coal and a typical tire sample are listed in Table 3 .
Adsorbent production Carbon adsorbent production by both physical and chemical activation techniques was carried out in a bench scale tubular reactor with a horizontal tube furnace (Lindberg; Type 54232). For physical activation, a three-step process was applied: coal oxidation in air at 225°C for 2 or 4 h; devolatilization of oxidized coal in nitrogen at 400°C for 1 h; and steam activation of the resulting char in 50% steam in nitrogen at 800-850°C for 0.5-5.5 h. The air oxidation step was performed in an auto-programmable ashing furnace (Fisher Scientific, Model 49SA) with unlimited air supply. About 12 g of sample was used during oxidation and devolatilization while 1 to 2 g of sample was used during steam activation. The gas flow rate during devolatilization and steam activation was 1 L/min. For chemical activation, about 2 g of the coal (-100 mesh) was mixed with granular KOH (coalKOH mass ratio 1: I ) and ground into a gel-like solid using a mortar and pestle. This mixture was then activated at 800°C in 100% nitrogen for 0.5 and 1.25 h. After chemical activation, the sample was immediately submerged in deionized water, filtered, crushed, and then washed again in deionized water to remove KOH derivatives which may have been on the surface of the particles.
Physical activation of the tires was carried out by a two-step process: devolatilization of about 5 g sample tire in nitrogen at 600°C for 45 min; and then steam activation of the resulting char in 50% steam in nitrogen at 850-900°C for 0.5-3 h. Chemical activation of the tires with KOH was performed in a similar manner to that of coal, except tires were chemically activated at 900°C for 0.5 to 1.5 h.
Adsorbent characterization BET surface areas and t-plot micropore volumes (micropore volume is defined as the volume of pores < I7 A) were calculated based on the nitrogen adsorption isotherms (relative pressure PP6 0.001 -1) measured with a volumetric adsorption apparatus (Micromentics ASAP2400). Methane adsorption capacity, on a mass basis (g/g), at pressures up to 500 psig was determined with a pressurized thermogravimetric analyzer (Spectrum Research and Engineering Model TL-TGA
247
1900/600 PTGA). Buoyancy correction was performed for coal-derived carbon when calculating the methane adsorption capacity (glq). The true density of activated carbons produced from Illinois coal was taken as 2.2 g/cm .I4 VmNs values (cm3/cm') were determined from the experimental data obtained with a custom built 4.92 cm' pressurized vessel at 500 psig.
Pelletization Select tire-derived carbons were made into pellets using a 1/4 in. (6.35 mm) diameter cylindrical die and manual press. Samples of 100-200 mg were prepared by mixing the carbon with a liquid I-step phenolic resin (Durez 7347A, Occidental Chemical) binder. The resin was used at a mass ratio of 5-20%. The mixture was then placed in the die and compressed. The die and pellet were subsequently heated at 165°C in an oven (Precision Scientific, Model 17) for 5 min to insure proper setting of the binder. The die was then removed from the oven and allowed to cool to room temperature before removing the pellet.
RESULTS AND DISCUSSION
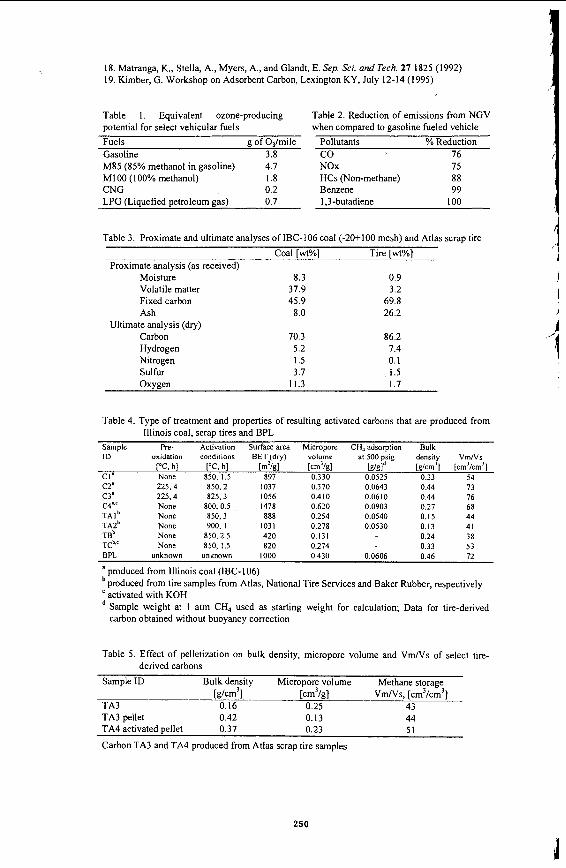
Physical activation Properties of several carbon samples produced by physical activation of the IBC-106 coal are presented in Table 4. Properties of a commercial activated carbon, BPL manufactured by Calgon Carbon Corp., are included in the table for comparative purposes. V m N s values of coal-derived carbons range from 54 to 76 cm3/cm3. These values are comparable to that of BPL. The measured VmNs value for BPL is consistent with values reported by other researchers.15'" Select sample products were then ground to minimize their inter-particle space and increase their bulk density. Bulk densities of select carbons with initial VmNs values of 70 cm3/cm3 increased by 35% when the -20+100 mesh granular products were ground to -325 mesh. Using this revised bulk density and a VmNs value of 76 cm3/cm3 provides a VmNs value of 103 cm3/cm3.
Tire-derived carbons were produced from each of the parent tire samples. The tire samples from Atlas and National Tire Services were activated with steam. Production conditions and properties of tire-derived carbons are also listed in Table 4. Tire-derived carbons have lower micropore volumes and methane storage capacities than coal-derived carbons, possibly due to their lower bulk densities. For the highly activated samples (TA2), 10% by mass of the original tire sample remains. Steam activation probably leads to broadening of pores in the tire-derived carbons. Theoretical models have predicted an optimum pore width of 11.4 A for methane storage. Even deviations of 2-3 A from this optimal pore size significantly reduces the ability of the pore to adsorb methane." Therefore, it is possible that the highly activated tire carbons have micropores which have broadened so that many pores are larger than ideal. Pore size distributions of sample products have yet to be determined.
Chemical activation with KOH BET surface areas and micropore volumes of the chemically activated carbons from coal (0.5 h activation) are significantly higher than those of physically activated carbons. However, the V m N s value for the KOH-activated carbon is lower (Table 4). This is attributed to the resulting lower bulk density. Chemical activation of the coal appears to be an effective method for producing carbon adsorbents for gas storage, provided that the carbon's bulk density can be increased. The methane adsorption capacity (g/g) for KOH-activated carbon is 50% higher than that of BPL at 500 psig (Table 4). Carbon sample CI was prepared from the coal without pre- oxidation. Its methane adsorption capacity (g/g) is 15% lower than that of BPL at 500 psig. This is most likely due to its lower micropore volume. Carbon sample C2 was prepared by pre- oxidation for 4 h resulting in a surface area of 1037 m2/g. Pre-oxidation of the coal causes increased methane adsorption capacity at 500 psig when compared to BPL or the activated carbons prepared without pre-oxidation.
Tire samples from Baker Rubber were chemically activated since it was closest in size (0.4 mm) to the crushed KOH. It is desirable to have as much direct contact as possible between the KOH and the tire since the reaction involves two solid materials. KOH-activated tire-derived carbons have much higher bulk densities than the steam-activated tire-derived carbons, most likely due to the chemical reaction between the two solids resulting in the realignment of carbon structure. As a result of their increased bulk density, methane storage capacities of the KOH- activated carbons are 40-50% higher than the physically activated carbons.
Pelletization Pellets were formed from select tire-derived carbons and chars. In all cases, the bulk density of the material increased over 100%. The changes of adsorbent bulk density, micropore volume and
248
\
i I
V m N s values are summarized in Table 5. Efforts to make pellets with < 10% binder were unsuccessful, The unactivated char was mixed with binder at a mass ratio of 5% (of the char). Although pelletization of the TA3 carbon increased bulk density by about 160%, the micropore volume was reduced by 50%, resulting in no effective change in VmNs values (Table 5). The loss of micropore volume is most likely due to the large amount of binder (1 1%) required to make the pellet. The binder may block access to the micropores by covering or filling the pores. A micropore volume reduction of about 20% has been reported.'' Micropore volume did not seem to be impeded when making a pellet from the TA4 char prior to activation. This result cannot be attributed to the amount of binder used with the char. Since significant mass loss occurs during activation, the amount of binder in the final activated pellet is roughly the same as the TA3 pellet. Instead, the binder does not limit micropore development during activation and may actually contribute to the total micropore volume by developing micropores during activation. Similar results were observed for the KOH-activated tire-derived carbons.
CONCLUSIONS
Activated carbons for natural gas storage were produced by physical and chemical activation of an Illinois coal and scrap tires. Volumetric methane storage capacities (VmNs) were measured at pressures up to 500 psig. VmNs values of 76 cm3/cm3 are achievable when physically activating the coal. This value is comparable to that of 70 cm3/cm3 for BPL, a commercial granular activated carbon. V m N s values exceeding 100 cm3/cm3 were achieved by grinding the granular coal-derived products. The increase in V m N s is due to the increase in bulk density. KOH- activated coal-derived carbons have higher surface area, micropore volume, and methane adsorption capacity (g/g), but lower volumetric methane storage capacity, than the physically activated carbons. The lower volumetric methane storage capacity is due to the lower bulk density of KOH activated carbon. Tire-derived carbons have lower methane storage capacity due to their lower bulk density, when compared to the coal-derived carbons. Forming pellets from tire-derived carbons increases bulk density by as much as 160%. However, this increase was offset by a decrease in the micropore volume of the pelletized materials due to the amount of binder required in the process. As a result, VmNs values were about the same for granular and pelletized tire-derived carbons. Carbon obtained by activating a pelletized tire-derived char increased storage capacity by about 20 %.
ACKNOWLEDGMENTS This research is sponsored by the Illinois Clean Coal Institute through a grant (DE-FC22-92PC9252 1) from the Illinois Department of Natural Resources and its Coal Development Board and by US DOE, and by the Office of Solid Waste Research (OSWR) at the University of Illinois at Urbana-Champaign (OSWR12-7GS) and by the Ford Motor Company.
REFERENCES
I , DeLuchi, M.A. and Ogden, J.M. Transpn. Res. 27 255 (1 989) 2. USA Today Oct. 23 (1990) 3. Keller, M.N. Cars pp.59 March (1992) 4. Johannson, L. ENVIRO 13 11 (1992) 5. Alson, J.A., Adler, J.M. and Baines, T.M. in Alternative Transportation Fuels Quorum
Books, New York (1989) 6 . Carslaw, D.C. and Fricker, N. Chemistry & Industry August 7 (1995) 7. Golovoy, A. Proceedings: Compressed Natural Gas SOC. Auto. Eng., Pittsburgh PA (1983) 8. Seinfeld, J.H. Air Pollution: Physical and Chemical Fundamentals McGraw Hill (1975) 9. Nelson, C.R. "Physical Sciences NGV Gas Storage Research," Gas Research Institute,
Chicago IL (1 993) 10. Wegrzyn, J., Weismann, H. and Lee, T. Proceedings: Annual Automotive Tech. Develop.
Dearbom MI (1992) 11. Quinn, D.F., McDonald, J.A. and Sosin, K. 207th ACS National Mtg, San Diego CA (1994) 12. New York Times p. DI May 9 (1990) 13. Harvey, R.D. and Kruse, C.W. Journal of Coal Quality 7 109 (1988) 14. Sun, J. MS thesis, Southern Illinois University, Carbondale IL (1993) 15. Innes, R.A., Lutinski, F.E., Occelli, M.L. and Kennedy, J.V. Reporl AC 01-84CE50071
16. Parkyns, N.D. and Quinn, D.F. in Porosity in Carbons John Wiley & Sons, Inc. (1995) 17. Quinn, D.F. and McDonald, J.A. Carbon 30 1097 (1992)
Washington, DC: US DOE (1984)
249
18. Matranga, K., Stella, A,, Myers, A,, and Glandt, E. Sep. Sci. and Tech. 27 1825 (1992) 19. Kimber, G. Workshop on Adsorbent Carbon, Lexington KY, July 12-14 (1995)
Table 1, Equivalent ozone-producing Table 2 . Reduction of emissions from NGV potential for select vehicular fuels when compared to gasoline fueled vehicle Fuels g of 03/mile Pollutants % Reduction Gasoline 3.8 co 76 M85 (85% methanol in gasoline) 4.7 NOx 75 M 1 00 ( 100% methanol) 1.8 HCs @on-methane) 88
LPG (Liquefied petroleum gas) 0.7 1,3-butadiene 100 CNG 0.2 Benzene 99
Table 3. Proximate and ultimate analyses of IBC-106 coal (-20+100 mesh) and Atlas scrap tire Coal [wt%] Tire [wt%]
Proximate analysis (as received) Moisture Volatile matter Fixed carbon Ash
Ultimate analysis (dry) Carbon Hydrogen Nitrogen Sulfur Oxveen
8.3 37.9 45.9
8.0
70.3 5.2 1.5 3.7
11.3
0.9 3.2
69.8 26.2
86.2 7.4 0.1 1.5 1.7
Table 4. Type of treatment and properties of resulting activated carbons that are produced from
Sample Pre- Activation Surface area Micropore CH, adsorption Bulk ID oxidation conditions BET (dry) volume at 500 psig density Vm/Vs
Illinois coal, scrap tires and BPL
K h l K. hl Imz/gl [cm’/gl Wsld [g/cm’] [cm’/cm’] C I ’ None 850, 1.5 897 0.330 0.0525 0.33 54 C2. 225,4 850.2 1037 0.370 0.0643 0.44 73
T A I ~ None 850.3 888 0.254 0.0540 0.15 44
TCb.‘ None 850, 1.5 820 0.274 0.33 53
C3‘ 225.4 825.3 1056 0.410 0.0610 0.44 76 C4“C None 800, 0.5 1478 0.620 0.0903 0.27 68
TA2b None 900, I 1031 0.278 0.0530 0.13 41 T B ~ None 850.2.5 420 0.131 0.24 38
BPL unknown unknown 1000 0.430 0.0606 0.46 72
a produced from Illinois coal (IBC-106) produced from tire samples from Atlas, National Tire Services and Baker Rubber, respectively activated with KOH Sample weight at 1 atm CH, used as starting weight for calculation; Data for tire-derived carbon obtained without buoyancy correction
Table 5. Effect of pelletization on bulk density, micropore volume and Vm/Vs of select tire- derived carbons
Sample ID Bulk density Micropore volume Methane storage
TA3 0.16 0.25 43 TA3 pellet 0.42 0.13 44 TA4 activated uellet 0.37 0.23 5 1
w m 3 1 [cm’kl V ~ N S , [cm’/cm’]
Carbon TA3 and TA4 produced from Atlas scrap tire samples
250
L
i' \
TION OF 7 OF A -RANGE OF P p
W.G. Tramposch Calgon Carbon Corporation
P.O. Box 717 Pittsburgh, PA 15230
Keywords: Adsorption, Isotherm, Isobar - Several standard methodologies are employed to determine the adsorptive properties of
activated carbon.' These methodologies have, as a common goal, the generation of isotherm data. The isotherm data collected, in concert with any of the methodologies, can be used to calculate pore radius distributions using the Kelvin Equation: surface areas using B.E.T. and Langmuir Theories, ' spreading pressures from the Gibb's Equation,' and adsorption potential distributions using Polanyi Theory.6
Gas phase isotherm data is typically collected by either of two methods.' In the first, the concentration of the adsorbate is varied while maintaining the temperature and total pressure of the system constant. This method is limited by dificulties in controlling both temperature and adsorbate concentration over the time period required to reach equilibrium. In the second method, the pressure of the adsorbate is varied while maintaining the temperature of the system constant. This method is limited mainly by the achievable system pressures and diffusional constraints.
Carbon capacities can also be measured by maintaining the adsorbate pressure at some constant value and varying the temperature to several known values.' Such isobaric data can easily be collected if the system pressure is selected at some convenient value such as atmospheric pressure. Using the undiluted adsorbate gas at atmospheric pressure, mass transfer is rapid, especially at high temperatures, and equilibrium is quickly achieved. The isobaric data can then be converted into the more useful isothermal result using Polanyi Adsorption Theory. Alternatively,' the Dubinin-Radushkevich Equation' can be used for the same purpose. In the following sections a method is presented which provides a fast, convenient means for collection of isobaric carbon adsorption data. The isobaric data is correlated with isothermal data using Polanyi Adsorption Theory.'
EXPERIMENTAL
Isobars were determined using a customized instrument fabricated by George Associates (Berkeley, Ca.). The instrument was able to attain temperatures of -150°C to 600°C with positive and negative temperature ramping capabilities.
Frocedures - All isobars were performed at atmospheric pressure. Gravimetric determinations were
performed once the system had reached both thermal and mass equilibria as indicated by no more than a 0.1 "C change in temperature over one minuta and no more than a 0.2 mg weight change over the same period. Samples were conditioned at 250°C in nitrogen prior to the determinations. Pure methane or ethane was adsorbed onto the sample in a series of 10 individual steps which were accomplished by incrementally decreasing and holding the temperature at each'of several levels. After completing the adsorptive process, the methane or ethane was desorbed in a similar manner by increasing the temperature step-wise to the starting value. The amount of adsorbate loading was dculated as the mass difference between the equilibrated and the conditioned sample after making corrections for buoyancy effects.
251 I
Isotherms - Ethane isotherms were determined using granular material that had been previously dried in air at 150°C for three hours. Isotherms were performed at 25.0 * 0.1"C in a water bath. The adsorbate gas was passed through a copper heat exchanger prior to contacting the carbon which w88 contained in a glass u-tube in the water bath. Gas flow was maintained until the mass change of the sample was less than 5 mg over an eight-hour period.
Methane isotherms were performed by the volumetric expansion method. A known volume and pressure of methane was allowed to expand into a vessel containing the activated carbon under vacuum. The amount of methane adsorbed was determined from the change in pressure of the system taking into account the void volume of the vessel containing the activated carbon. Void volumes were determined using helium expansion. The system was thermostatted at 25.0 * 0.1"C. Sarnples were conditioned at 100'C under vacuum for 6 hours. No difference in adsorption capacity was observed when the samples were conditioned at 2SO'C.
Methane and ethane were chosen as the adsorbate compounds. These molecules lack any significant dipole or induced dipole characteristics9 such that only van der Waals interactions with the carbon are important. Within the temperature bounds of the isobars, both methane and ethane are stable with the exclusion of oxygen and the avoidance of catalytic metals.
Isobars can be presented as a plot of adsorbate capacity versus adsorption energies by employing Polanyi Theory. Following Polanyi Theory, the energy of adsorption, E, is equal to the work required to take a molecule from the bulk phase to the adsorbed phase according to the following relationship:
wheref, is the saturation pressure fugacity of the zdsorbate at temperature T("K),j is the vapor fugacity of the adsorbate, and R is the gas constant. For isotherms, T is hild constant while f is varied either by changing the concenmtion of the component in a diluent stream or by varying the absolute pressure of the adsorbate. For isobars, the temperature of the adsorbate or probe gas is varied thereby changing the value off..
can be calculated at any temperature below the critical temperature by use of the Antoine Equation and Peng-Robinson EOS. Above the critical temperature, the following expression was used to calculate the saturation pressure:"
Adsorbed phase densities were calculated according to the following equations:"*"
n = To - T
252
(4)
Where V, and V, are the adsorbed phase molar volume and molar volume of the adsorbate liquid at the normal boiling point temperature, respectively. b is the van der Waals volume.
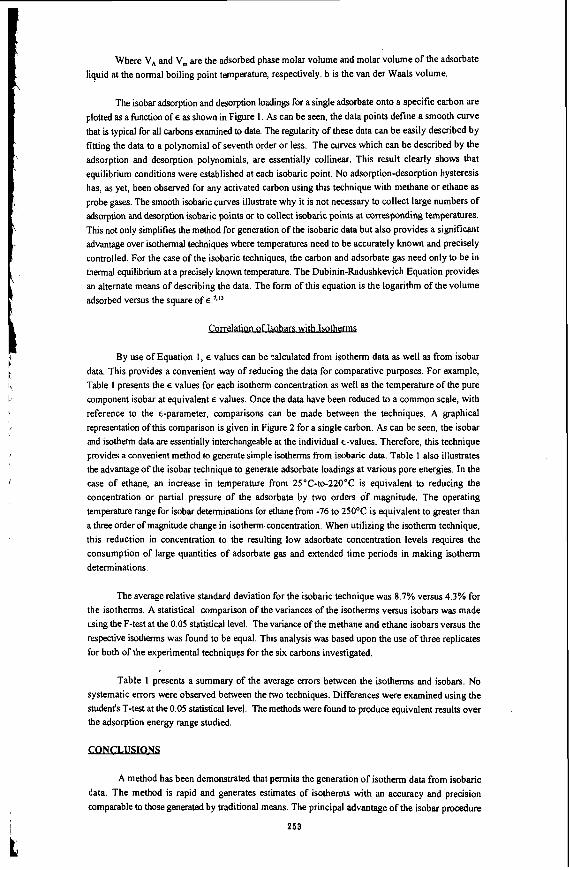
The isobar adsorption and desorption loadings for a single adsorbate onto a specific carbon are plotted as a function of E as shown in Figure 1, As can be seen, the data points define a smooth curve that is typical for all carbons examined to date. The regularity of these data can be easily described by fitting the data to a polynomial of seventh order or less. The curves which can be described by the adsorption and desorption polynomials, are essentially collinear. This result clearly shows that equilibrium conditions were established at each isobaric point. No adsorption-desorption hysteresis has, as yet, been observed for any activated carbon using this technique with methane or ethane as probe gases. The smooth isobaric curves illustrate why it is not necessary to collect large numbers of adsorption and desorption isobaric points or to collect isobaric points at corresponding temperatures. This not only simplifies the method for generation of the isobaric data but also provides a significant advantage over isothermal techniques where temperatures need to be accurately known and precisely controlled. For the case of the isobaric techniques, the carbon and adsorbate gas need only to be in thermal equilibrium at a precisely known temperature. The Dubinin-Radushkevich Equation provides an alternate means of describing the data. The form of this equation is the logarithm of the volume adsorbed versus the square of E.', '~
By use of Equation 1, E values can be calculated from isotherm data as well as from isobar data. This provides a convenient way of reducing the data for comparative purposes. For example, Table 1 presents the E values for each isotherm concentration as well as the temperature of the pure component isobar at equivalent E values. Once the data have been reduced to a common scale, with reference to the E-parameter, comparisons can be made between the techniques. A graphical representation of this comparison is given in Figure 2 for a single carbon. As can bc seen, the isobar and isotherm data are essentially interchangeable at the individual ~-values. Therefore, this technique provides a convenient method to generate simple isotherms from isobaric data. Table 1 also illustrates the advantage of the isobar technique to generate adsorbate loadings at various pore energies. In the case of ethane, an increase in temperature from 25"C-to-22O0C is equivalent to reducing the concentration or partial pressure of the adsorbate by two orders of' magnitude. The operating temperature range for isobar determinations for ethane from -76 to 250°C is equivalent to greater than a three order of magnitude change in isotherm concentration. When utilizing the isotherm technique, this reduction in concentration to the resulting low adsorbate concentration levels requires the consumption of large quantities of adsorbate gas and extended time periods in making isotherm determinations.
The average relative standard deviation for the isobaric technique was 8.7% versus 4.3% for the isotherms. A statistical comparison of the variances of the isotherms versus isobars was made using the F-test at the 0.05 statistical level. The variance of the methane and ethane isobars versus the respective isotherms was found to be equal. This analysis was based upon the use of three replicates for both of the experimental techniqup for the six carbons investigated.
Table 1 presents a summary of the average errors between the isotherms and isobars. No systematic errors were observed between the two techniques. Differences were examined using the student's T-test at the 0.05 statistical level. The methods were found to produce equivalent results over the adsorption energy range studied.
A method has been demonstrated that permits the generation of isotherm data from isobaric data. The method is rapid and generates estimates of isotherms with an accuracy and precision comparable to those generated by traditional means. The principal advantage of the isobar procedure
253
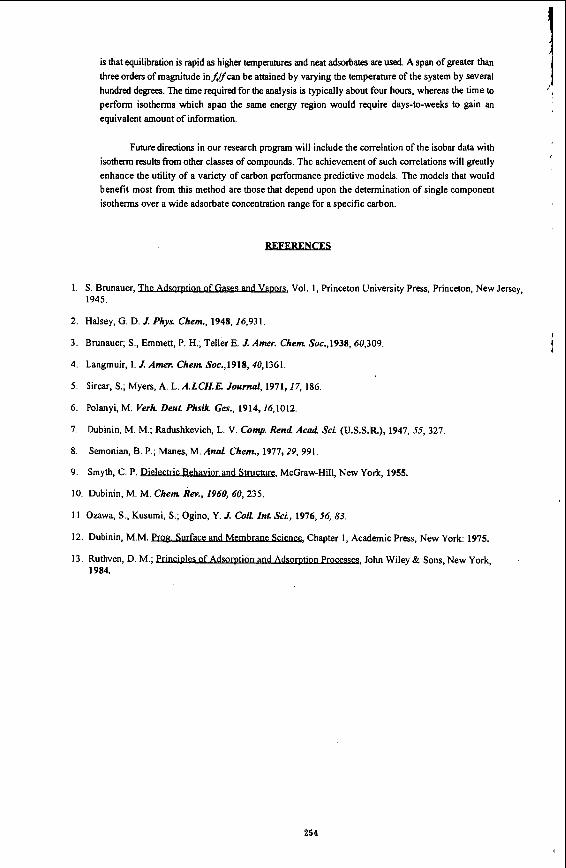
1 is that equilibration is rapid as higher temperatures and neat adsorbates are used. A span of greater than three orders of magnitude infJfcan be attained by varying the temperature of the system by several hundred degrees. The time required for the analysis is typically about four hours, whereas the time to perform isotherms which span the same energy region would require days-to-weeks to gain an
'I I 1
equivalent amount of information.
Future directions in our research program will include the correlation of the isobar data with isotherm results from other classes of compounds. The achievement of such correlations will greatly enhance the utility of a variety of carbon performance predictive models. The models that would benefit most from this method are those that depend upon the determination of single component isotherms over a wide adsorbate concentration range for a specific carbon. I
REFERENCES
1. S. Brunauer, , Vol. 1, Princeton University Press, Princeton, New Jersey, 1945.
2. Halsey, G. D. J. Phys Chem., 1948, I6,931.
3. Brunauer; S., Emmett, P. H.; Teller E. J. Amer. Chem Soc.,1938, 60,309.
4. Langmuir, I. J. Amer. Chem Soc.,1918, 40,1361
5. Sircar, S.; Myers, A. L. A.I.CH.E. Journal, 1971,17, 186.
6. Polanyi, M. V . h . Deut Phsik Ges., 1914,16,1012.
7 . Dubinin, M. M.; Radushkevich, L. V. C o w . Rend Acad Sci (U.S.S.R.), 1947, 55, 327.
8.
9. Smyth, C. P. , McGraw-Hill, New York, 1955.
10. Dubinin, M. M. Chem Rev., 1960, 60, 235.
11. Ozawa, S.; Kusumi, S.; Ogino, Y. J. COIL Int Sei, 1976,56, 83.
12. Dubinin, M.M. , Chapter 1, Academic Press, New York: 1975.
13. Ruthven, D. M.; ~ , John Wiley & Sons, New York,
Semonian, B. P.; Manes, M. A n d Chem., 1977,29,991.
1984.
254
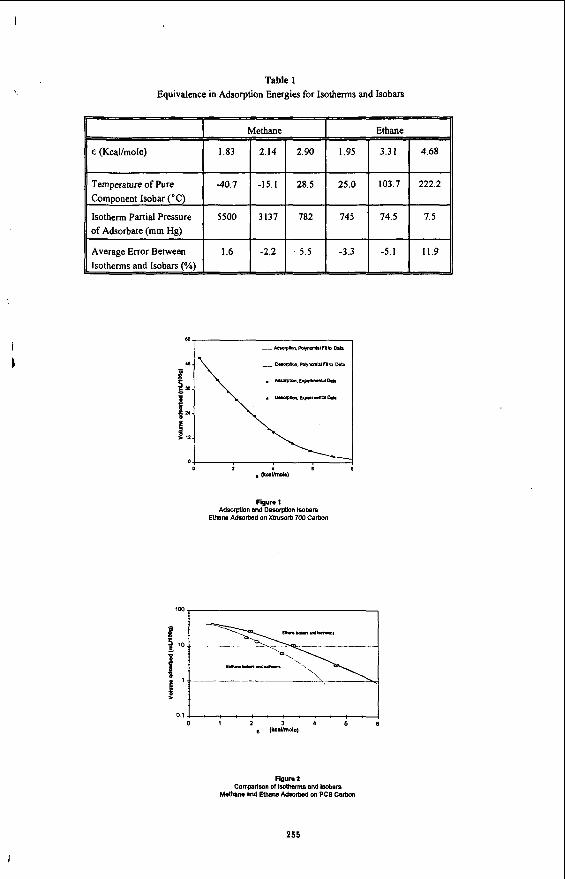
Table 1 Equivalence in Adsorption Energies for Isotherms and Isobars
I
Average Error Between
-n -3.3 -5.1
i i I
Figure I Adsorption and Desorption Iwbars
Ethane Adsorbed on Xbusorb 700 Carbon
0 . 1 4 : : . : . : . : . : . I 0 1 2 3 4 5 8
e lkC.umol.1
Figure 2 Cornprlson of ibotherms and Isobars
Methane and E t h a ~ Adsorbed on PCB Carton
255
GASSOLID EQUILIBRIA IN POROUS MATERIALS: A NEW MODEL
Russell S. Drago, J. Michael McGilvray, and Wm. Scott Kassel D e m e n t of Chemistry, University of Florida
Gainesville, FL 3261 1-7200
Keywords: Adsorption, Carbonaceous Adsorbents, Gas-Solid Equilibria
INTRODUCTION A new model for analyzing gas-solid equilibria in porous materials has been developed.
Adsorption experiments with several probe gases and a commercial carbonaceous adsorbent have been analyzed using a multiple process adsorption model in which the capacity of each process, i, is calculated in millimoles per gram of adsorbent (ni,+) and the equilibrium adsorption constant for each process i is given as Kid. The associated enthalpies of adsorption (-AHw) were determined from adsorption measurements conducted at multiple temperatures via the van't Hoff equation. Since the values of ni- for each process are temperature independent, adsorption at other temperatures introduces only new Ki,ad, values.
The effects of porosity and surface area on the adsorptive properties of porous materials should be considered when selecting a porous material as an adsorbent. Work in our laboratory 1
4 ' ,' has shown that in catalyst doped adsorbents, small pores tend to concentrate reagents providing for better catalytic activity. An understanding of the pore size distribution and accessible surface area of solids is useful in selecting a suitable porous material for the adsorption of gaseous and liquid substrates. The BET equation has been the standard for many years in the determination of the surface area of porous materials. Although generally accepted, the BET equation has limitations, and as a result, has received some criticism in recent years. Our research efforts have been focused on developing a new gas-solid equilibrium model which is capable of providing information into the adsorption capacity of porous materials as well as thermodynamic data corresponding to the enthalpies of adsorption and equilibrium constants for adsorption of various sorptives.
EXPERIMENTAL Approximately 0.3g of Ambersorb"572, a commercially available carbonaceous
adsorbent, was degassed (<IO4 torr) for a minimum of 8 hours at 200°C prior to each adsorption experiment. The sorptives chosen were selected to encompass a wide range of properties. Nitrogen, CO, and CH, are non-condensible adsorptives at the temperatures examined and are non-polar, polar and polarizable sorptives, respectively. Propane, SO2, and NH3 are condensible sorptives at the temperatures studied and are polarizable, acidic, and basic, respectively. All gases were of 99.99% purity and required no further purification. Gaseous uptake measurements were performed on a Micromeretics ASAP 2000 analyzer using a 36 point pressure table ranging from 1 torr to 760 torr. Low temperature adsorption measurements were performed with the aid of solvent /liquid N1 baths to give the desired temperature.
RESULTS AND DISCUSSION Adsorption measurements to determine porosity and surface area of porous materials have
long been evaluated by the BET equation 4(Equation 1)
(1) x - 1 (C-l)X ---+-
n(l-x) CNm CNm
where n = moles of gas adsorbed, N, = total moles adsorbed, and x = P/P" with P = equilibrium pressure in torr and Po = 760 torr. The values N, and C are obtained from a linear plot of x/n( 1-x) vs x. The equation is only applicable in a pressure range of 0.05 to 0.3 torr. The BET C constant (Equation 2) is a complex quantity related to the equilibrium constant for monolayer adsorption (Ki,&) and multilayer adsorption (K,d) along with
contributions from the enthalpy of adsorption of the monolayer (Q-,,) and multilayer (Qdti). The components of Equation 2 are not resolved, so C is difficult to interpret.'*'
256
I
Our research has focused on the development of a multiple process adsorption model’ which is applicable over a wider pressure range and is presented in Equation 3. The adsorption isotherm is resolved into individual adsorption processes (n,) and equilibrium constants for adsorption (K,+,j.J for those processes using Equation 3.
‘1
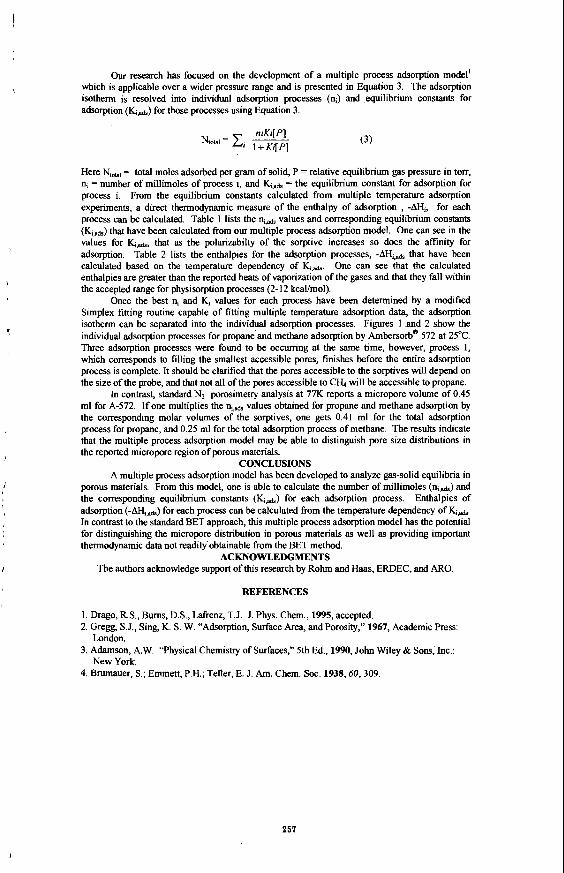
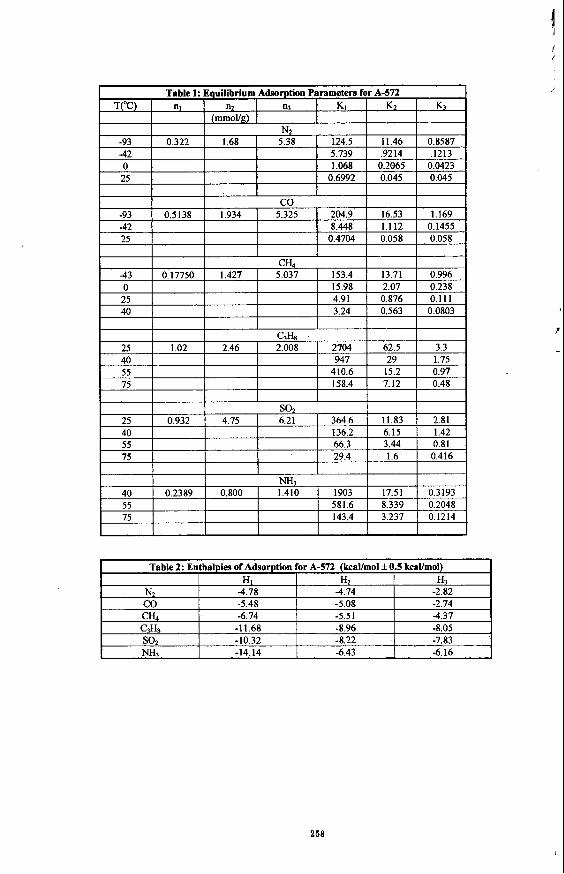
Here Ntal = total moles adsorbed per gram of solid, P = relative equilibrium gas pressure in torr, n; = number of millimoles of process i, and K;,+& = the equilibrium constant for adsorption for process i. From the equilibrium constants calculated from multiple temperature adsorption experiments, a direct thermodynamic measure of the enthalpy of adsorption , -AH;, for each process can be calculated. Table 1 lists the nlads values and corresponding equilibrium constants (K,,&*) that have been calculated from our multiple process adsorption model. One can see in the values for K;,.&, that as the polarizabilty of the sorptive increases so does the affinity for adsorption, Table 2 lists the enthalpies for the adsorpOon processes, -Mi,& that have been calculated based on the temperahue dependency of Ki& One can see that the calculated enthalpies are greater than the reported heats of vaporization of the gases and that they fall within the accepted range for physisorption processes (2-12 kcaYmol).
Once the best n, and Ki values for each process have been determined by a modified Simplex fitting routine capable of fitting multiple temperature adsorption data, the adsorption isotherm can be separated into the individual adsorption processes. Figures 1 and 2 show the individual adsorption processes for propane and methane adsorption by Ambersorb@’ 572 at 25°C. Three adsorption processes were found to be occurring at the same time, however, process 1, which corresponds to filling the smallest accessible pores, finishes before the entire adsorption process is complete. It should be clarified that the pores accessible to the sorptives will depend on the size of the probe, and that not all of the pores accessible to C& will be accessible to propane.
In contrast, standard N2 porosimetry analysis at 77K reports a micropore volume of 0.45 ml for A-572. If one multiplies the ni,sds values obtained for propane and methane adsorption by the corresponding molar volumes of the sorptives, one gets 0.41 ml for the total adsorption process for propane, and 0.25 ml for the total adsorption process of methane. The results indicate that the multiple process adsorption model may be able to distinguish pore size distributions in the reported micropore region of porous materials.
CONCLUSIONS A multiple process adsorption model has been developed to analyze gas-solid equilibria in
porous materials. From this model, one is able to calculate the number of millimoles (nd) and the corresponding equilibrium constants (K!gtir) for each adsorption process. Enthalpies of adsorption for each process can be calculated from the temperature dependency of K i d . In contrast to the standard BET approach, this multiple process adsorption model has the potential for distinguishing the micropore distribution in porous materials as well as providing important thermodynamic data not readily obtainable from the BET method.
ACKNOWLEDGMENTS
J
I
I The authors acknowledge support of this research by Rohm and Haas, ERDEC, and ARO.
REFERENCES
1. Drago, R.S., Bums, D.S., hfrenz, T.J. J. Phys. Chem., 1995, accepted. 2. Gregg, S.J., Sing, K. S. W. “Adsorption, Surface Area, and Porosity,” 1967, Academic Press:
3. Adamson, A.W. “Physical Chemistry of Surfaces,” 5th Ed., 1990, John Wiley & Sons, Inc.:
4. Brumauer, S.; Emmett, P.H.; Teller, E. J. Am. Chem. Soc. 1938,613,309,
London.
New York.
257
I I I I I I I I
258
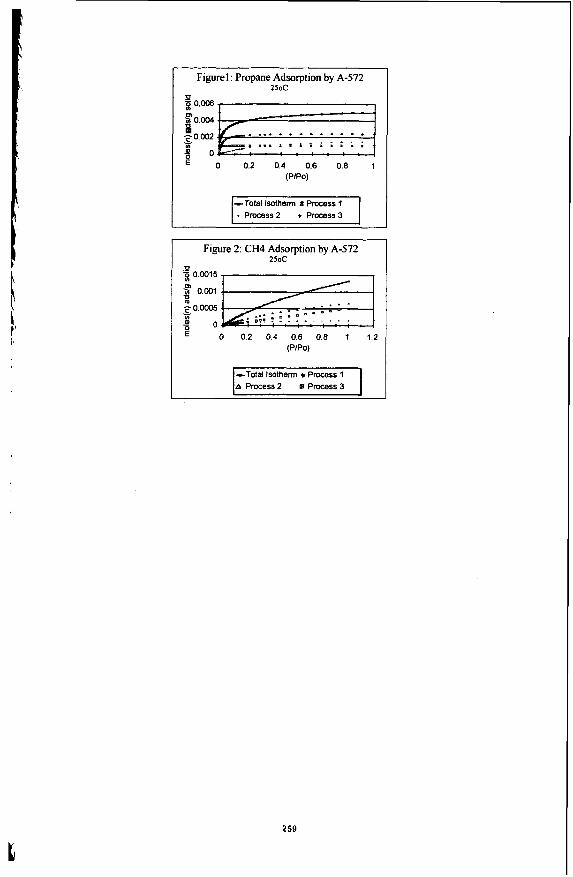
Figure1 : Propane Adsorption by A-572 250C
0 p 0.006
g 0.002 g 0.004 Lo 2 0 ' 0 0.2 0.4 0.6 0.8 1
(P/PO)
Process2 i process3
I Figure 2: CH4 Adsorption by A-572 ZSOC
0.0005
0 0.2 0.4 0.6 0.8 1 1.2 (PIPO)
A Process 2 m Process 3
259
PRODUCI'ION AND CHARACTERIZATION OF ACTIVATED CARBONS FROM CEREAL GRAINS A. Venkatraman, W. P. Walawender, andL. T. Fan
Department of Chemical Engineering, Kansas State University, Manhattan, KS 66506-5102
Keywords: Activated Carbons, Cereal Grains, Surface Fractal Dimension, Small-Angle X-ray Scattering
INTRODUCTION The term, activated carbon, is a generic name for a family of carbonaceous materials with well-developed
porosities and consequently, large adsorptive capacities. Activated carbons are increasingiy being consumed worldwide for environmental applications such as separation of volatiles from bulk gases and purification of water and waste-water streams. The global annual production is estimated to be around 300 million kiIogramS, with a rate of increase of 7% each year [l].
Activated carbons can be prepared from a variety of raw materials. Approximately, 60% of the activated carbons generated in the United States is produced from coal; 20%. from coconut shells; and the remaining 20% from wood and other sources of biomass 121. The pore structnre and properties of activated carbons are influenced by the nature of the starting material and the initial physical and chemical conditioning as well as the process conditions involved in its manufacture 131.
The conventional method of manufacturing activated carbons involves two steps. In the first step, the raw material, usually of lignocellulosic origin, is carbonized in an inert atmosphere. The second step entails the physical activation of the resulting char of a low adsorptive capacity with either steam or carbon dioxide at a temperature usually exceeding 8Wo C 141. The significance of these two steps have been described in detail elsewhere [SJ.
Although the general two-step procedure for generating activated carbons from lignocellulosic precursors has been well documented in the Literature, knowledge of the specific variables involved is essential for a particular feedstock for developing the porosity and adsorptive capacity sought in a given application. In this sense, the current work investigates the evolution of the porosity of activated carbons generated from the pyrolysiis and physical activation of novel feedstocks with a very low content of ash - kernels of cereal grains such as corn and hard red winter wheat (HRW). These grain kernels, either edible or off-grade are abundant and relatively inexpensive. The porous structures of both non-graphitizable charcoals obtained by tbe carbonization of the kernels and those of the resulting activated carbons have been characterized by the methods of physisorption. Specifically, the total micropore volumes and skface areas have been determined at various temperatures of carbonization and degrees of activatioa Furthermore, an investigation of the probable fractal nature of the pore interfaces of a representative sample of HRW charcoal has been conducted through small-angle X-ray scattering.
THEORETICAL Small Angle X-ray Scattering
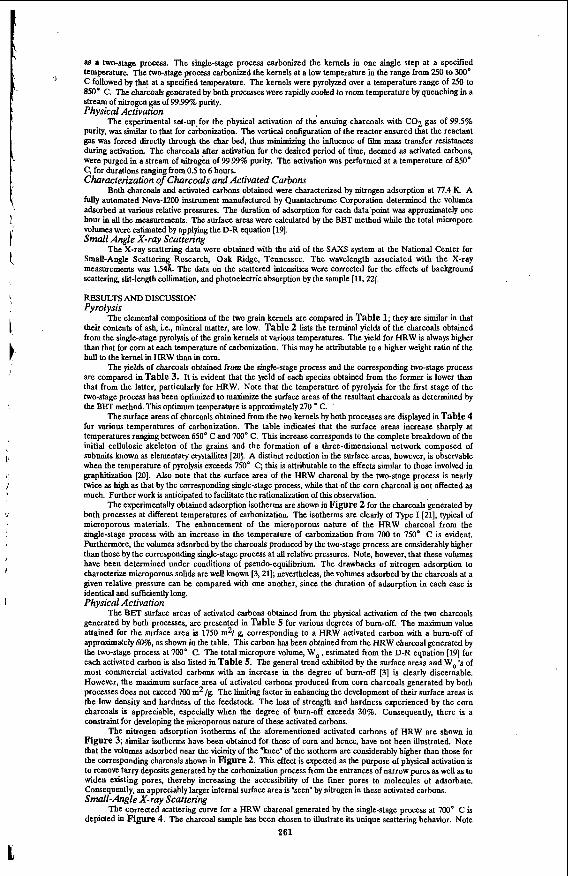
X-rays are scattered primarily by the electrons of an irradiated material. The distribution of electrons throughout the material is not homogeneous, and the electronic density (number of electrons I unit volume) vanes in different regions of the sample. Small-angle X-ray scattering (SAXS) by a material occurs as a consequence of this inhomogeneity in the electron density existing on length scales appreciably larger than the normal distances between atoms 16, 7J. As a result, the structures of various disordered materials can be investigated by SAXS over length scales varying from 5 to 4Mx) A [SI. A schematic of a typical SAXS system is shown in Figure 1. Conventionally, small angles imply that the values of the scattering angle, 28, are no greater than 6 degrees.
The relationship between the intensity of the scattered X-rays, I(q), and the scattering wave-vector, q, for a porous material has been described in detail elsewhere [9, lo]. Of relevance to this work is the scattering from systems of isotropic, i.e., randomly oriented, independent scatterers, with an average particle or pore dimension, d, wherein I(q) can be approximated by the Guinier equation
for values of qd not appreciably greater than 1.0 161. The mean radii of gyration of the scatterers, R , can be evaluated in this regime from the slope of a plot of the natural logarithm of I(q) versusgq2. A n order-of-magnitude estimate of d is obtainable from R if the shape and charge distribution of the scatterers are known; usually, 2R -= d 4 3.5 R 1111. Specifically, f the system of scatterers can be assumed to be composed of identical, spheri% pores of radkr,, , then the relation, r,, = 1.3 R , can be plied to obtain r, 16).
The scattered intensity has been shown to be proportional to i-4 or €+-T[6, 121 when the boundaries of the pores can be considered as smooth, ie., free from irregularities. When the surfaces of the pores are fractal [13 -151, the scattered intensity takes cognizance of the surface irregularities, and can be described by the following relationship for values of qd far greater than 1.0 110, 161
I ( d = exp I - (qRg) / 3 1 (1)
I(q) =I 1, 6 ' No r (5-dsF) Sin I 0.5 7( (dsF1) I/ q (6-dSF) (2)
(3) or equivalently,
where I, is a constant, and dSF is the surface fractal dimension. Since dSF is bounded in the interval between 2.0 and 3.0. it is obvious from Ea. 3 that R can take on values between 3.0 and 4.0. When dcc amroaches 3.0.
I(q) = I , q - a ; a = 6 - d ~ ~
ar '1
however, I(q) vanishes according to Eq. 2; this apparent dilemma has been discussed at length elsewher; [9,10,17].
EXPERIMENTAL, Treatment of Raw Material
Whole grain kernels of corn and hard red winter wheat (HRW) were procured from a local source. The hull, i.e., the outer portion or the pericarp, constitutes a very small fraction of the total weight of the kernel, especially for corn. The moisture content in the grains, as determined by air-drying, was around 10%. The kernels were carbonized batchwise in 2-3 gram lots in an inert atmosphere of nitrogen flowing within a bench-scale tubular furnace [lS]. Each batch of kernels was placed in a vertical, cylindrical wire-guaze reactor suspended inside the tubular reactor. The retention time of the kernels in the reactor was sufficient to allow complete devolatilization at a specified temperature of carbonization or pyrolysis; hence, the resultant charcoals were deemed terminal. These charcoals were obtained from the pyrolysis of the kernels in a single-stage as well
260
I
I
as a two-stage process. The single-stage process carbonized the kernels in one single step at a specified temperature. The twc-stage process carbonized the kernels at a low temperature in the range from 250 to 300" C followed by that at a specified temperature. The kernels were pyrolyzed over a temperature range of 250 to 8 W C. The charcoals generated by both procwses were rapidly cooled to room temperature by quenching in a stream of nitrogen gas of 99.99% purity. Physical Activation
The experimental set-up-for the physical activation of the ensuing charcoals with CO2 gas of 99.5% purity, was similar to that for carbonization. The vertical configuration of the reactor ensured that the reactant gas was forced directly through the char bed, thus minimiang the influence of tilm mass transfer resistances during activation. The charcoals after activation for the desired period of time, deemed as activated carbons, were purged in a stream of nitrogen of 99.99% purity. The activation was performed at a temperature of 850" C, for durations ranging from 0.5 to 6 hours.
J
Characterization of Charcoals and Activated Carbons Both charcoals and activated carbons obtained were characterized by nitrogen adsorption at 77.4 K A
fuUy automated Nova-1200 instrument mannfachued by Quantachrome Corporation determined the volumes adsorbed at various relative pressures. The duration of adsorption for each data'point was approximately one hour in all the measurements. The surface areas were calculated by the BET method while the total micropore volumes were estihlated by applying the D-R equation (191. Small Angle X-ray Scattering
The X-ray scattering data were obtained with the aid of the S A X S system at the National Center for Small-Angle Scattering Research, Oak Ridge, Tennessee. The wavelength associated with the X-ray measurements was 1.54&. The data on the scattered intensities were corrected for the effects of background scattering, slit-length coIlimation, and photoelectric absorption by the sample [11,22].
RESULTS AND DISCUSSION Pyrolysis
The elemental compositions of the two grain kernels are compared in Table 1; they are similar in that their contents of ash, is., mineral matter, are low. Table 2 lists the terminal yields of the charcoals obtained hom the single-stage pyrolysis of the grain kernels at various temperatures. The yield for HRW is always higher than that for corn at each temperature of carbonization. This may be attributable to a higher weight ratio of the hull to the kernel in HRW than in corn.
The yields of charcoals obtained from the single-stage process and the corresponding two-stage process are compared in Table 3. It is evident that the yield of each species obtained from the former is lower than that from the latter, particularly for HRW. Note that the temperature of pyrolysis for the first stage of the two-stage process has been optimized to maximkc the surface areas of the resultant charcoals as determined by the BET method. This optimum temperature is approximately 270 C. '
The surface areas of charcoals obtained from the two kernels by both processes are displayed in Table 4 for various temperatures of carbonization. The table indicates that the surface areas increase sharply at temperatures ranging between 650' C and 7M)' C. This increase corresponds to the complete breakdown of the initial cellulosic skeleton of the grains and the formation of a three-dimensional network composed of subunits known as elementary crystallites [XI]. A distinct reduction in the surface areas, however, is observable when the temperature of pyrolysis exceeds 750' C; this is attributable to the effects similar to those involved in graphitization 1201. Also note that the surface area of the HRW charcoal by the two-stage process is nearly twice as high as that by the corresponding single-stage process, while that of the corn charcoal is not affected as much. Further work is anticipated to facilitate the rationalization of this observation.
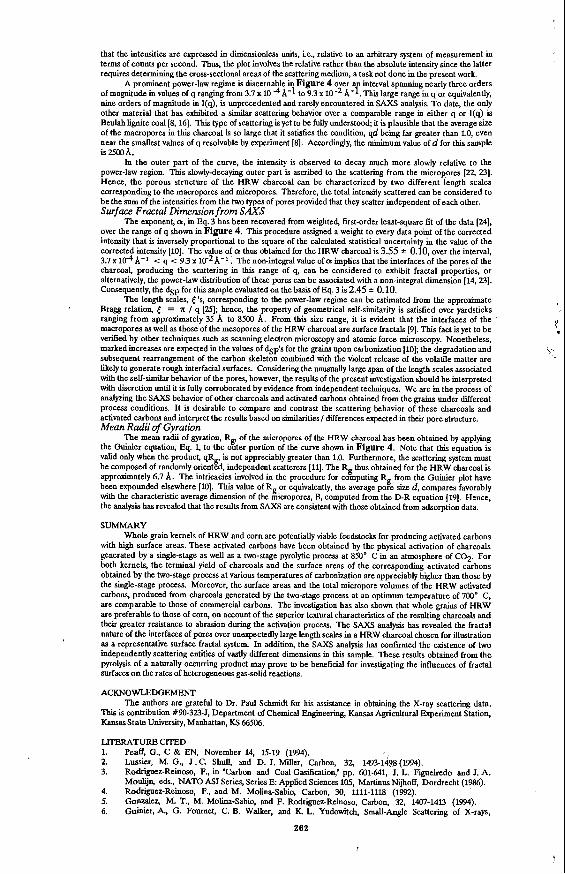
The experimentally obtained adsorption isotherms are shown in Figure 2 for the charcoals generated by both processes at different temperatures of carbonization. The isotherms are clearly of Type I 1211, typical of microporous materials. The enhancement of the microporous nature of the HRW charcoal from the single-stage process with an increase in the temperature of carbonization from 700 to 750' C is evident. Furthermore, the volumes adsorbed by the charcoals produced by the two-stage process are considerably higher than those by the corresponding single-stage process at all relative pressures. Note, however, that these volumes have been determined under conditions of pseudo-equilibrium. The drawbacks of nitrogen adsorption to characterize microporous solids are well known 13,211; nevertheless, the volumes adsorbed by the charcoals at a given relative pressure can be compared with one another, since the duration of adsorption in each case is identical and sufficiently long. Physical Activation
The BET surface areas of activated carbons obtained from the physical activation of the two charcoals generated by both processes, are presented in Table 5 for various degrees of bum-off. The maximum value attained for the surface area is 1750 m2/ g, corresponding to a HRW activated carbon with a burn-off of approximately 60%, as shown in the table. This carbon has been obtained from the HRW charcoal generated by the two-stage process at 7W0 C. The total micropore volume, W,, estimated from the D-R equation [19) for each activated carbon is also listed in Table 5. The general trend exhibited by the surface areas and W,'s of most commercial activated carbons with an increase in the degree of burn-off 131 is clearly discernable. However, the maximum surface area of activated carbons produced from corn charcoals generated by both processes does not exceed 700 mz /g. The limiting factor in enhancing the development of their surface areas is the low density and hardness of the feedstock. The loss of strength and hardness experienced by the corn charcoals is appreciable, especially when the degree of burn-off exceeds 30%. Consequently, there is a constraint for developing the microporous nature of these activated carbons.
The nitrogen adsorption isotherms of the aforementioned activated carbons of HRW are shown in Figure 3; similar isotherm have been obtained for those of corn and hence, have not been illustrated. Note that the volumes adsorbed near the vicinity of the "knee" of the isotherm are considerably higher than those for the corresponding charcoals shown in Figure 2. This effect is expected as the purpose of physical activation is to remove tarry deposits generated by the carbonization process from the entrances of narrow pores as well as to widen &sting pores, thereby increasing the accessibility of the finer pores to molecules of adsorbate. Consequently, an appreciably larger internal surface area is "seen" by nitrogen in these activated carbons. Small-Angle X-ray Scattering
The corrected scattering curve for a HRW charcoal generated by the single-stage process at 700' C is depicted in Figure 4. The charcoal sample has been chosen to illustrate its unique scattering behavior. Note
261
that the intensities are expressed in dimensionless Units, is., relative to an arbitrary system of measurement in terms of counts per second. Thus, the plot involves the relative rather than the absolute intensity since the latter requires determining the cross-sectional areas of the scattering medium, a task not done in the present work.
interval spanning nearly three orders of magnitude in values of q ranging from 3.7 x 10 -4 A3 to 9.3 x 10 -2 A? This large range in q or equivalently, nine orders of magnitude in I(q), is unprecedented and rarely encountered in SAXS analysis. To date, the only other material that has exhibited a similar scattering behavior over a comparable range in either q or I(q) is Beulah lignite coal [E, 161. This type of scattering is yet to be fuUy understood; it is plausible that the average size of the macropores in this charcoal is so large that it satisfies the condition, qd being far greater than 1.0, even near the smallest values of q resolvable by experiment [E]. Accordmgly, the minimum value of d for this sample is25WA.
In the outer part of the curve, the intensity is observed to decay much more slowly relative to the power-law repion. This slowly-decaying outer part is ascribed to the scattering from the micropores [22, 231. Hence, the porous structure of the HRW charcoal can be characterized by two different length scales corresponding to the macropores and micropores. Therefore, the total intensity scattered can be considered to be the sum of the intensities from the two types of pores provided that they scatter independent of each other.
A prominent power-law regime is discernable . Figure 4 over
Surface Fractal Dimension from SAXS The exponent, a, in Eq. 3 has been recovered from weighted, fist-order least-square fit of the data [%I,
over the range of q shown in Figure 4. This procedure assigned a weight to every data point of the corrected intensity that is inversely proportional to the square of the calculated statistical uncertainty in the value of the corrected intensity [lo]. The value of a thns obtained for the HRW charcoal is 3.55 t 0.10, over the interval, 3.7~ A-' c q -= 9.3 x 10⁻²A-' . The non-integral value of a implies that the interfaces of the pores of the charcoal, producing the scattering in this range of q. can be considered to exhibit fractal properties, or alternatively, the power-law distribution of these pores can be associated with a non-integral dimension (14,231. Consequently, the dsF for this sample evalnated on the basis of Eq. 3 is 2.45 f 0.10.
The length scales, E ' s , corresponding to the power-law regime can be estimated from the approximate Bragg relation, E = n / q [U]; hence, the property of geometrical self-similarity is satisfied over yardsticks ranging from approximately 35 A to 8500 A. From this size range, it is evident that the interfaces of the macropores as well as those of the mesopores of the HRW charcoal are surface fractals [9]. This fact is yet to be verified by other techniques such as scanning electron microscopy and atomic force microscopy. Nonetheless, marked increases are expected in the values of dSp'S for the grains upon carbonization [lo]; the degradation and subsequent rearrangement of the carbon skeleton combined with the violent release of the volatile matter are likely to generate rough interfacial surfaces. Considering the unusually large span of the length scales associated with the self-similar behavior of the pores, however, the results of the present investigation should be interpreted with discretion until it is fnlly corroborated by evidence from independent techniques. We are in the process of analyzing the SAXS behavior of other charcoals and activated carbons obtained from the grains under different process conditions. It is desirable to compare and contrast the scattering behavior of these charcoals and activated carbons and interpret the results based on similarities / differences expected in their pore structure. Mean Radii of Gyration
The mean radii of gyration, R , of the micropores of the HRW charcoal has been obtained by applying the Guinier equation, Eq. 1, to the k t e r portion of the cnrve shown in Figure 4. Note that this equation is valid only when the product, qR is not appreciably greater than 1.0. Furthermore, the scattering system must be composed of randomly oriengd, independent scatterers [ll]. The R thus obtained for the HRW charcoal is approximately 6.7 A. The intricacies involved in the procedure for cofnputing R from the Guinier plot have been expounded elsewhere [lo]. This value of R or equivalently, the average p o k size d, compares favorably with the characteristic average dimension of the kcropores, B, computed from the D-R equation (191. Hence, the analysis has revealed that the results from SAXS are consistent with those obtained from adsorption data.
SUMMARY Whole grain kernels of HRW and corn are potentially viable feedstocks for producing activated carbons
with high surface areas. These activated carbons have been obtained by the physical activation of charcoals generated by a single-stage as well as a two-stage pyrolytic process at 850" C in an atmosphere of C02 For both kernels, the terminal yield of charcoals and the surface areas of the corresponding activated carbons obtained by the two-stage process at various temperatures of carbonization are appreciably higher than those by the single-stage process. Moreover, the surface areas and the total micropore volumes of the HRW activated carbons, produced from charcoals generated by the two-stage process at an optimum temperature of 700" C, are comparable to those of commercial carbons. The investigation has also shown that whole grains of HRW are preferable to those of corn, on account of the superior textural characteristics of the resulting charcoals and their greater resistance to abrasion during the activation process. The SAXS analysis has revealed the fractal nature of the interfaces of pores over unexpectedly large length scales in a HRW charcoal chosen for illustration as a representative surface fractal system. In addition, the SAXS analysis has contirmed the existence of two independently scattering entities of vastly different dimensions in this sample. These results obtained from the pyrolysis of a naturally occurring product may prove to be beneficial for investigating the influences of fractal surfaces on the rates of heterogeneous gas-solid reactions.
ACKNOWLEDGEMENT The authors are grateful to Dr. Paul Schmidt for his assistance in obtaining the X-ray scattering data.
This is contribution #90-323-J, Department of Chemical Engineering, Kansas Agricultural Experiment Station, Kansas State University, Manhattan, KS 66506.
LITERATURECITED 1. Peaff, G., C & EN, November 14, 15-19 (1994). 2. 3.
4. 5. 6.
Lussier, M. G., J . C. Shull, and D. J. Miller, Carbon, 32, 1493-1&8 (1994). Rodriguez-Reinoso, F., in "Carbon and Coal Gdcation," pp. 601-641, J. L. Figueiredo and J. A. Moulijn, eds., NATO AS1 Series, Series E Applied Sciences 105, Marhus Nijhoff, Dordrecht (1986). Rodriguez-Reinoso, F., and M. Molina-Sahio, Carbon, 30, 1111-1118 (1992). G o d e z , M. T., M. Molina-Sabio, and F. Rodriguez-Reinoso, Carbon, 32, 1407-1413 (1994). Guinier, A., G. Fournet, C. B. Walker, and K. L. Yudowitch, Small-Angle Scattering of X-rays,
262
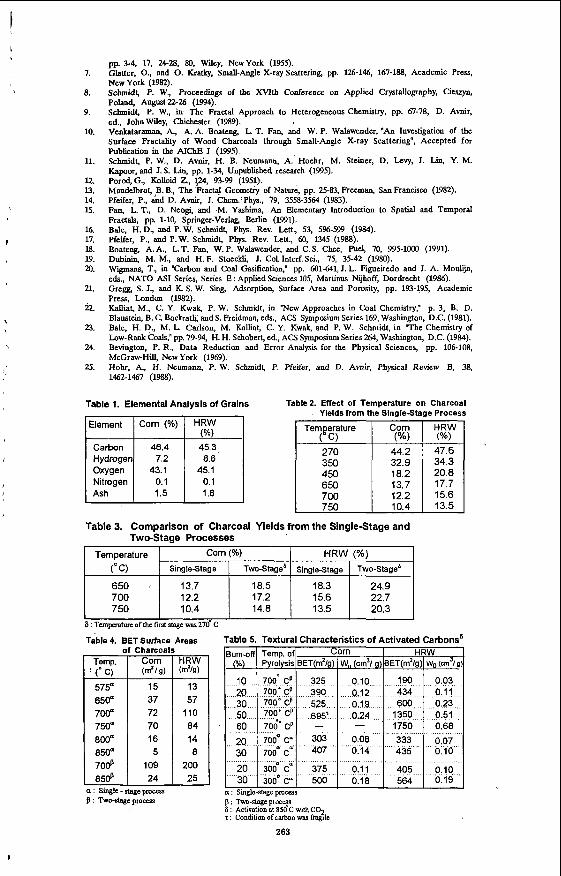
7.
8.
9.
10.
Element
I
Corn (%) HRW (%)
11.
12. u. 14. 15.
16. 17. 18. 19. 20.
21.
22.
73.
24.
25.
of Charcoals
700" 750"
pp. 3-4, 17, 24-28, 80, Wiley, NewYork (1955). Glatter, O., and 0. Kratky, Small-Angle X-ray Scattering, pp. 126-146, 167-188, Academic Press, New York (1982). Schmidt, P. W., Proceedings of the XYIth Conference on Applied Crystallography, Cieszyn,
Burn-off Temp of Corn HRW (%)
10 700' Cp 325 010 190 . 003 20 700'Cp 390 0.12 434 011 30 700" Cp 525 019 600 023 50 700' cp 695' 024 1350 0.51
1750 068 60 7 0 2 Cp - 20 700: c: 303 008 333 007 30 700 c 407 014 435 010
Pyrolysis BET(rn2/g) W, (cm3/ g) BET(m2/g) w,, (cm3/ g)
-
Poland, August22-26 (1994); Schmidt, P. W., in The Fractal Approach to Heterogeneous Chemistry, pp. 67-78, D. Avnir, ed. John Wilev. Chichater (1989).
I 70# 1 1:; 1 2:; 1 85#
V&taraman,'k, A. A. B o & , L. T. Fan, and W. P. Walawender, "An Investigation of the Surface Fractality of Wood Charcoals through Small-Angle X-ray Scattering", Accepted for Publication in the AI- J (1995). Schmidt, P. W., D. Avnir, H. B. Nenmann, A: Hoehr, M. Steiner, D. Levy, J. Lin, Y. M. Kapoor, and J. S. Lin, pp. 1-34, Unpublished research (1995). Porod,G., Kolloid Z., l?4, 93-99 (1951). Mandelbrot, B. B., The Fractal Geomch of Nature, pp. 25-83, Freeman, San Francisco (1982). Pfeifer, P., ahd D. Avnir, J. Chem. Phys., 79, 3558-3564 (1983). Fan, L.T., D. Neogi, and M. Yasliima, An Elementary Introduction to Spatial and Temporal Fractals, pp. 1-10, Springer-Verlag, Berlin (1991). Bale, H.D., and P. W. Schmidt, Phys. Rev. Lett., 53, 596-599 (1984). Pfeifer, P., and P.W. Schmidt, Phys. Rev. Lett., 60, I345 (1988). Boateng, A.A., L.T. Fan, W. P. Walawender, and C. S. Chee, Fuel, 70, 995-1000 (1991). Dubinin, M. M., and H. F. Stoeckli, J. CoL Interf.Sci., 75, 35-42 (1980). Wigmans, T., in "Carbon and Coal Gasification," pp. 601-641, J. L. Figueiredo and J. A. Moulijn, e&., NATO AS1 Series, Series E :Applied Sciences 105, Martinns Nijhoff, Dordrecht (1986). Gregg, S. J., and K. S. W. Sip, Adsorption, Surface Area and Porosity, pp. 193-195, Academic Press, London (1982). KaUiat, M., C. Y. Kwak, P. W. Schmidt, in "New Approaches in Coal Chemistry," p. 3, B. D. Blaustein, B. C. Bockrath; and S. Freidman, eds., ACS Symposium Series 169, Washington, D.C. (1981). Bale, H. D., M. L. Carlson, M. Kalliat, C. Y. Kwak, and P. W. Schmidt, in T h e Chemistry of Low-Rank Coals," pp. 79-94, H. H. Schobert, ed., ACS Symposium Series 264, Washington, D.C. (1984). Bevington, P. R., Data Reduction and Error Analysis for the Physical Sciences, pp. 106-108, McGraw-Hill, New York (1969). Hohr, A,, H. Neumann, P. W. Schmidt, P. Pfeifer, and D. Avnir, Physical Renew B, 36, 1462-1467 (1988).
20 3000 C" 375 0.11 405 0 10 30 300'C" 500 018 564 019
Table I. Elemental Analysis of Grains
Nitrogen Ash 1.5 1.6
Table?. Effect of Temperature , Yields from the SingleSl
450 18.2 650 13.7
12.2 750 10.4
Charcoal le Proce:
HRW (Yo) 47.6 34.3 20.8 17.7 15.6 13.5 -
6 : Two-stageprocess 6 : Activation at SSdC With CO 1 : condition ofcarbon was h ? ~ e
263
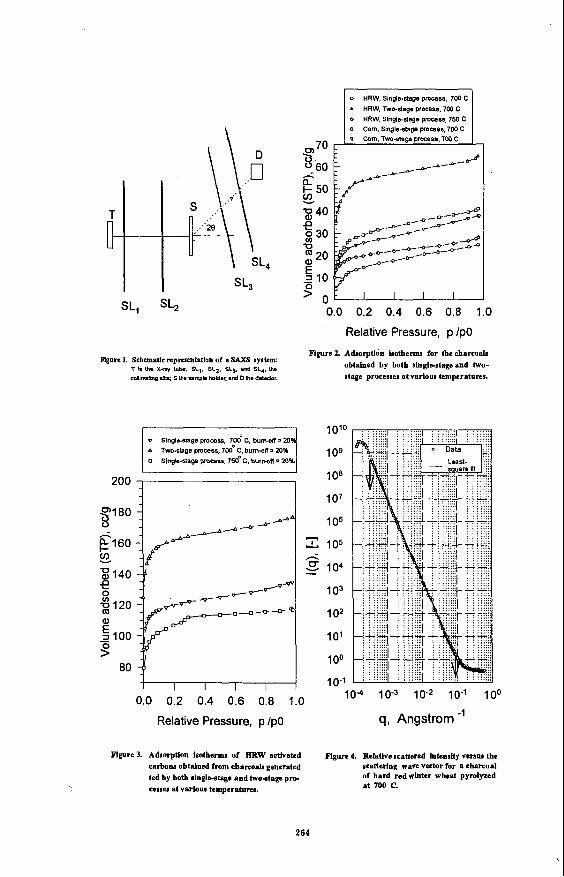
SL, SL,
Plgurc 1. Schemalic representation of a SAXS aystem: T h t b x-m, tub.; SL,. SL2. SL3. and sq. UlB
collimlhg .ut.: S the mwla holder: and D VI. doledor.
0
6
HRW. Slngls-&age pmcess. 700 C HRW, Two-stage process. 700 C
070 3-60
5 30
; 20
- 5 10
3 0
K- k 50 5
40
U
0.0 0.2 0.4 0.6 0.8 1.0
Relative Pressure, p /PO
Figure 2 Adsorption isotherms for the charrods obtalned by both aingle-stage and two- atage processes at various temperatures.
1010
I O e
108
2oo ‘7 I O 7
Slnglo-sIdgn process. 700 C. bumoff= 20 Twoatage promsr, 7W’ C. burn-On= 20% Singla-stage pramss. 7 d C . burn-aff = 2Q%
PI 80
C I S 0
140
8
5 n b 0 120 Q)
- 5 100 9
0.0 0.2 0.4 0.6 0.8 1.0
Relative Pressure, p /PO
Figure 3. Adsorption Isotherm8 of HRW activated carbons obtalned from charcoal8 generated ted by both iinglbstage and two-stage pro- c~sses at varlous temperaturu.
106
Z 105
g 104
103
h
1 02
10’
100
IO- ’ 10-4 10-3 10-2 10-1 100
q, Angstrom -’ Fignre 4. Relatlve mattered intensity verm the
acatterlng wave vector for a charcod of bard red rioter wheat pyrolyzed at 700 C.
264
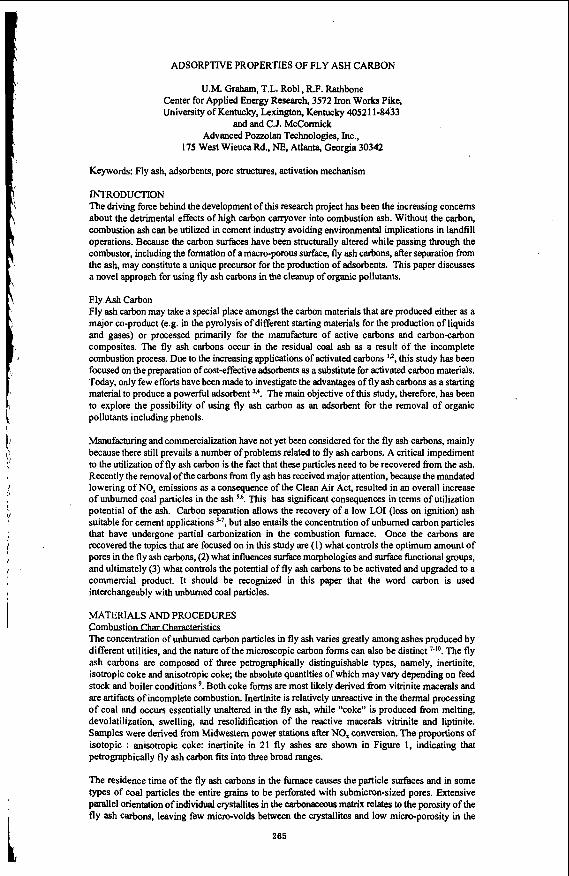
ADSORPTIVE PROPERTIES OF FLY ASH CARBON
U.M. Graham, T.L. Robl, R.F. Rathbone Center for Applied Energy Research, 3572 Iron Works Pike, University of Kentucky, Lexington, Kentucky 40521 1-8433
and and C.J. McCormick Advanced Pozzolan Technologies, Inc.,
175 West Wieuca Rd., NE, Atlanta, Georgia 30342
Keywords: Fly ash, adsorbents, pore structures, activation mechanism
INTRODUCTION The driving force behind the development of this research project has been the increasing concerns about the detrimental effects of high carbon carryover into combustion ash. Without the carbon, combustion ash can be utilized in cement industry avoiding environmental implications in landfill operations. Because the carbon surfaces have been structurally altered while passing through the combustor, including the formation of amacro-porous surface, fly ash carbons, after separation from the ash, may constitute a unique precursor for the production of adsorbents. This paper discusses a novel approwh for using fly ash carbons in the cleanup of organic pollutants.
Fly Ash Carbon Fly ash carbon may take a special place amongst the carbon materials that are produced either as a major co-product (e.g. in the pyrolysis of different starting materials for the production of liquids and gases) or processed primarily for the manufacture of active carbons and carbontarbon composites. The fly ash carbons occur in the residual coal ash as a result of the incomplete combustion process. Due to the increasing applications of activated carbons 11, this study has been focused on the preparation of cost-effective adsorbents as a substitute for activated carbon materials. Today, only few efforts have been made to investigate the advantages of fly ash carbons as a starting material to produce a powerful adsorbent I*‘. The main objective of this study, therefore, has been to explore the possibility of using fly ash carbon as an adsorbent for the removal of organic pollutants including phenols.
Manufacturing and commercialization have not yet been considered for the fly ash carbons, mainly because there still prevails a number of problems related to fly ash carbons. A critical impediment to the utilization of fly ash carbon is the fact that these particles need to be recovered from the ash. Recently the removal of the carbons from fly ash has received major attention, because the mandated lowering of NO, emissions as a consequence of the Clean Air Act, resulted in an overall increase of unburned coal particles in the ash 56. This has significant consequences in terms of utilization potential of the ash. Carbon separation allows the recovery of a low LO1 (loss on ignition) ash suitable for cement applications >’, but also entails the concentration of unburned carbon particles that have undergone partial carbonization in the combustion furnace. Once the carbons are recovered the topics that are focused on in this study are (1) what controls the optimum amount of pores in the fly ash carbons, (2) what influences surface morphologies and surface functional groups, and ultimately (3) what controls the potential of fly ash carbons to be activated and upgraded to a commercial product. It should be recognized in this paper that the word carbon is used interchangeably with unburned coal particles.
MATERIALS AND PROCEDURES C P The concentration of unburned carbon particles in fly ash varies greatly among ashes produced by different utilities, and the nature of the microscopic carbon forms can also be distinct ’-lo. The fly ash carbons are composed of three petrographically distinguishable types, namely, inertinite, isotropic coke and anisotropic coke; the absolute quantities of which may vary depending on feed stock and boiler conditions ’. Both coke forms are most likely derived from vitrinite macerals and are artifacts of incomplete combustion. Inertinite is relatively unreactive in the thermal processing of coal and occurs essentially unaltered in the fly ash, while “coke” is produced from melting, devolatilization, swelling, and resolidification of the reactive macerals vitrinite and liptinite. Samples were derived from Midwestern power stations after NO, conversion. The proportions of isotopic : anisotropic coke: inertinite in 21 fly ashes are shown in Figure 1, indicating that petrographically fly ash carbon fits into three broad ranges.
The residence time of the fly ash carbons in the h e causes the particle surfaces and in some types of coal particles the entire grains to be perforated with submicron-sized pores. Extensive parallel Orientation of individual crystallites in the carbonaceous matrix relates to the porosity of the fly ash carbons, leaving few micro-voids between the crystallites and low micro-porosity in the
. .
265
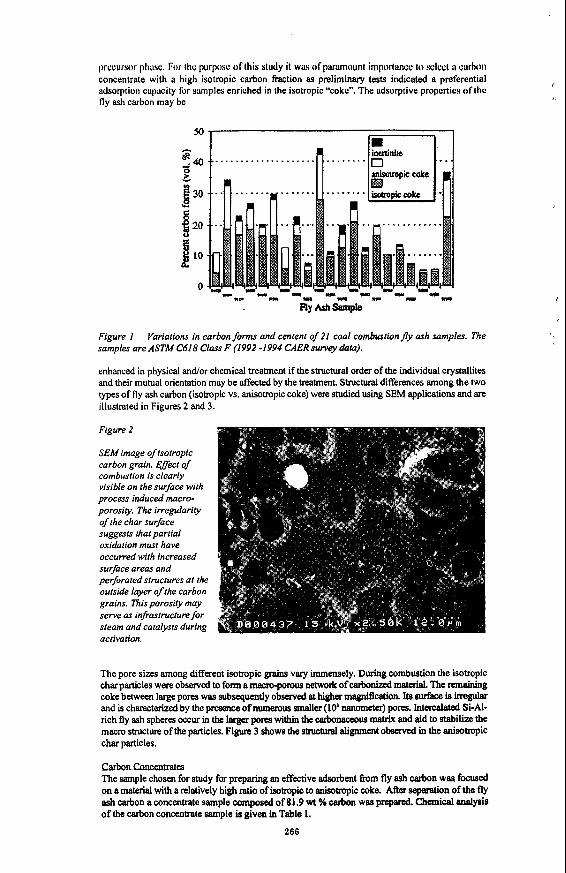
precursor pliiisc. For thc purposc or this study it was of paramount importancc to sclcct ii carbon concentrate with a high isotropic carbon fraction as preliminary tests indicated a preferential adsorption capacity for samples enriched in the isotropic “cokd’. The adsorptive propcrtics ofthc fly ash carbon may be
tp, ............................ fi F1.- J -7 - .~ 0 L
c 8 30 1 2”
1 1 0
............
- 1 - 0
Figure I samples are ASTM C618 Class F (1992 -1994 CAER sum data).
enhanced in physical and/or chemical treatment if the structural order of the individual crystallites and their mutual orientation may be affected by the treatment. Structural differences among the two types of fly ash carbon (isotropic vs. anisotropic coke) were studied using SEM applications and are illustrated in Figures 2 and 3.
Figure 2
SEM image of isotropic carbon grain. Effect of combustion is clearly visible on the surface with process induced macro- porosity. The irregularity of the char surface suggests that partial oxidation must have occurred with increased surface areas and perjrated structures at the outside layer of the carbon grains. This porosiw may serve as infrastructure fo r steam and catalysts during activation.
Variations in carbon forms and centent of 21 coal combustion jly ash samples. The
The pore sizes among different isotropic grains vary immensely. During combustion the isotropic char particles were observed to form a macro-pomus network of cah0nizm.I material. The reddng coke between large pores was subsequently obsared at higher magnification. Its sulfate is h g u h and is characterized by the presence of numerous d e r (10’ nanometex) pores. Intercalated Si-AI- rich fly ash spheres OCCUT in the larger pores within the carbonacarus matrix and aid to stabilize the macro structure of the particles. Figure 3 shows the struchval alignment observed in the anisotropic char particles.
-Concentrates
The sample chosen for study for preparing an effective adsorbent from fly ash carbon wag focused on a material with a relatively high ratio of isotropic to &tropic coke. Afta separation of the fly ash carbon a concentrate sample composed of 81.9 wt K carbon was prepared. Chemical analyeis of the carbon concentrate sample is given in Table 1.
266
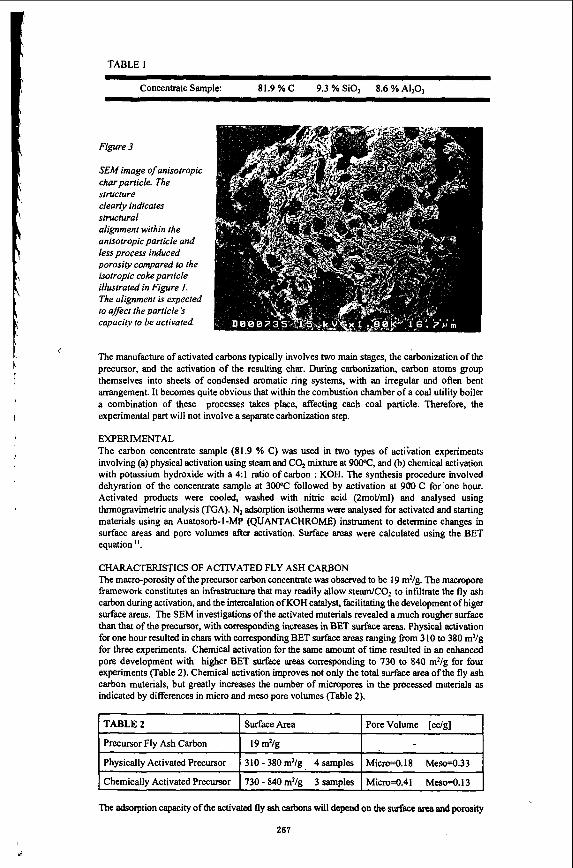
TABLE I
Precursor Fly Ash Carbon
Physically Activated Precursor I 310 - 380 mz/g 4 samples
I 19 m2/g
Concentrate Sample: 81.9 % C 9.3 % SiO, 8.6 % AI,O,
Micro4.18 M e s d . 3 3
Figure 3
SEM image of anisotropic char particle. The structure clearly indicates structural alignment within the anisotropic particle and less process induced porosity compared to the isotropic coke particle illustrated in Figure 1. The alignment is expected to afect the particle's capaciry to be activated.
< The manufacture of activated carbons typically involves two main stages, the carbonization of the precursor, and the activation of the resulting char. During carbonization, carbon atoms group themselves into sheets of condensed aromatic ring systems, with an irregular and often bent arrangement. It becomes quite obvious that within the combustion chamber of a coal utility boiler a combination of these processes takes place, affecting each coal particle. Therefore, the experimental part will not involve a separate carbonization step.
EXPERIMENTAL The carbon concentrate sample (81.9 % C) was used in two types of actication experiments involving (a) physical activation using steam and CO, mixture at 900°C. and @) chemical activation with potassium hydroxide with a 4 1 ratio of carbon : KOH. The synthesis procedure involved dehyration of the concentrate sample at 300°C followed by activation at 900 C for 'one hour. Activated products were cooled, washed with nitric acid (2moVml) and analysed using thrmogravimetric analysis (TGA). N2 adsorption isotherms were analysed for activated and starting materials using an Auatosorb-1-MP (QUANTACHROME) instrument to determine changes in surface areas and pore volumes after activation. Surface areas were calculated using the BET equation 'I.
CHARACTERISTICS OF ACTIVATED FLY ASH CARBON The macro-porosity of the precursor carbon concentrate was observed to be 19 m2/g. The macropore framework constitutes an infrastructure that may readily allow steam/CO, to infiltrate the fly ash carbon during activation, and the intercalation ofKOH catalyst, facilitating the development of higer surface areas. The SEM investigations of the activated materials revealed a much rougher surface than that of the precursor, with corresponding increases in BET surface areas. Physical activation for one hour resulted in chars with corresponding BET surface areas ranging from 3 10 to 380 m2/g for three experiments. Chemical activation for the same amount of time resulted in an enhanced pore development with higher BET surface areas corresponding to 730 to 840 m2/g for four experiments (Table 2). Chemical activation improves not only the total surface area of the fly ash carbon materials, but greatly increases the number of micropores in the processed materials as indicated by differences in micro and mew pore volumes (Table 2).
TABLE 2 I Surfacehea I Pore Volume [cc/gl
I Chemically Activated Precursor I 730 - 840 m2/g 3 samules I Micn~0.41 M e s d . 1 3 I ~ ~~
The adsorption capacity of the activated fly ash carbons will depend on the surface area and porosity
267
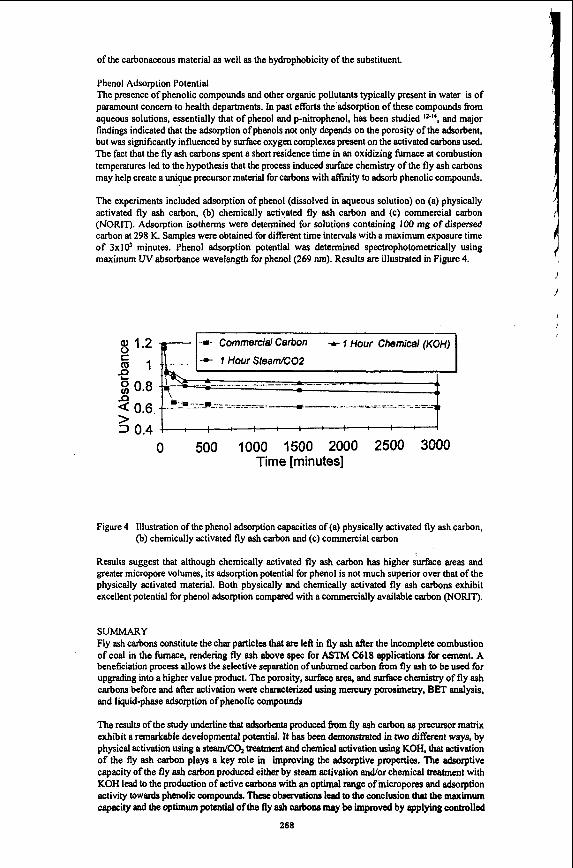
of the carbonaceous material as well as the hydrophobicity of the substituent.
Phenol Adsorption Potential The presence of phenolic compounds and other organic pollutants typically present in water is of paramount concern to health departments. In past efforts the adsorption of these compounds from aqueous solutions, essentially that of phenol and p-nitrophenol, has been studied i2-1', and major findings indicated that the adsorption of phenols not only depends on the porosity of the adsorbent, but was significantly influenced by surface oxygen complexes pnscnt on the activated carbons used. The fact that the fly ash carbons spent a short residence time in an oxidizing firnace at combustion temperatures led to the hypothesis that the process induced surface chemistry of the fly ash carbons may help create a unique precursor material for carbons with & i t y to adsorb phenolic compounds.
The experiments included adsorption of phenol (dissolved in aqueous solution) on (a) physically activated fly ash carbon, (b) chemically activated fly ash carbon and (c) commercial carbon (NORIT). Adsorption isotherms were determined for solutions containing 100 mg of dispersed carbon at 298 K. Samples were obtained for different time intervals with a maximum exposure time of 3x10' minutes. Phenol adsorption potential was determined spectrophotometrically using maximum UV absorbance wavelength for phenol (269 nm). Results are illustrated in Figure 4.
.-I- Commercial Carbon - I HourSteaMOZ -t 1 our Chemical (KOH)
?.~--Z-A- __ - - _-_ _-==-.. -_- - - - - , .__-
7
0 500 1000 1500 2000 2500 3000 Time [minutes]
Figure 4 Illustration of the phenol adsorption capacities of (a) physically activated fly ash carbon, (b) chemically activated fly ash carbon and (c) commercial carbon
Results suggest that although chemically activated fly ash carbon has higher surface areas and greater micropore volumes, its adsorption potential for phenol is not much superior over that of the physically activated material. Both physically and chemically activated fly ash carbons exhibit excellent potential for phenol adsorption compared with a commercially available carbon (NORIT).
SUMMARY Fly ash carbons constitute the char particles that are left in fly ash after the incomplete combustion of coal in the h a c e , rendering fly ash above speo for ASTM C618 applications for cement. A beneficiation process allows the selective separation of unburned carbon fiom fly ash to be used for upgradlng into a higher value product. The porosity, surface area, and surface chemistry of fly ash carbons before and after activation wen characterid using mercury porosimetry, BET analysis, and liquid-phase adsorption of phenolic compounds
The results of the study underline that adsorbents produced h m fly ash carbon as precursor matrix exhibit a remarkable developmental potential. It has been demonstrated in two different ways, by physical activation using a steam/C4 treatment and chemical activation using KOH, that activation of the fly ash carbon plays a key role in improving the adsorptive properties. The adsorptive capacity of the fly ash carbon produced either by steam activation and/or chemical treatment with KOH lead to the production of active carbons with an optimal range of micropores and adsorption activity towanis phenolic compounds. These obsewations lced to the conclusion chat the maximum capacity and the opthum poteatial of the fly ssb may be improved by applying controlled
268
experiments that help evaluate the optimum activation temperature, activation time and activation environment. In practical manufacturing and commercialization have not yet been considered for the fly ash carbons, mainly because there still remains a number of problems related to carbonaceous fly ash particles that must be solved in order to achieve high enough performance.
ACKNOWLEDGMENTS This work was supported in in part by funds from East Kentucky Power Cooperative and Advanced Pozzolan Technologies, Inc. The authors would like to thank John Groppo for separating and concentrating the fly ash carbon material and James Hower and Diane Milbum for assistance with analyses.
REFERENCES
1 2 3 4
5
6
7 8 9
R i I i 10
, 11
\ 12
13
14 ,
/
Juntgen, H., Carbon, 15,273,1977 Peaf€, G., C&EN, Nov. 14, 15-19,1994 Zhonghua, H. and Vansant, E.F., Carbon, 33 (9), 1293-1300, 1995 Zhonghua, H., Zhu, H. and Vansant, E.F., Separation Technology (Edited by E.F. Vansant) p. 895, Elsevier Science B.V., Amsterdam (1994). Groppo, J.G., Robl. T.L. and McCormick, C.J., Proceedings of 1995 International Ash Utilization Symposium, Lexington, Kentucky, October 1995 Robl, T.L., Hower, J.C., Graham, U.M., Rathbone, R.F., and Medina, S.S., Proceedings of 12th Annual International Pittsburgh Coal Conference, 121, 1995 Hurt, R.H. and Gibbins, J.R., Fuel, 74 (4). 471, 1995 Bailey, J.G., Tate, A,, Diessel C.F.K., and Wall, T.F., Fuel, 69,225, 1990 Hower, J.C., Rathbone, R.F., Graham, U.M., Groppo, J.G., Brooks, S.M., and Robl., T.L., 1 lth International Coal Testing Conference, p. 49, 1995 Vleeskens, J.M., Haasteren van, T.W.M.B., Roos M., and Gerrita, J., Fuel, 67 (3). 427, 1988. Brunauer, S., Emmett, P.H. and Teller, E., J. h e r . Chem. Soc., 60,309, 1938 Moreno-Castilla C., Rivera-Utrilla, J., Lopex-Ramon, M.V., and Carrasco-Marin, F., Carbon, Vol33 (6) 845, 1995. Mattson J.S. and Mark, H.B., Activated Carbon, Surface Chemistry and Adsorption form Solution, Marcel Dekker, New York (1971). Moreno-Castilla, C., Carrasco-Marin, F., and Lopez-Ramon, M.V., Langmuir 11,247, 1995.
269
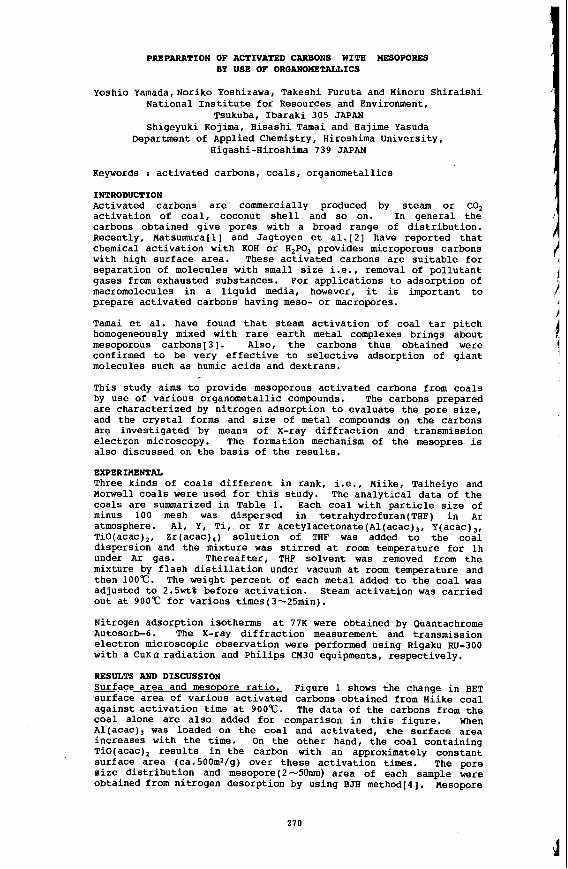
PREPARATION OF ACTIVATED CARBONS WITH MESOPORES BY USE OF ORGANOMETALLICS
Yoshio Yamada,Noriko Yoshizawa, Takeshi Furuta and Minoru Shiraishi National Institute for Resources and Environment,
Tsukuba, Ibaraki 305 JAPAN Shigeyuki Kojima, Hisashi Tamai and Hajime Yasuda
Department of Applied Chemistry, Hiroshima University, Higashi-Hiroshima 739 JAPAN
Keywords : activated carbons, coals, organometallics
INTRODUCTION Activated carbons are commercially produced by steam or CO, activation of coal, coconut shell and so on. In general the carbons obtained give pores with a broad range of distribution. Recently, Matsumura[l] and Jagtoyen et a1.[2] have reported that chemical activation with KOH or H,PO, provides microporous carbons with high surface area. These activated carbons are suitable for separation of molecules with small size i.e., removal of pollutant gases from exhausted substances. For applications to adsorption of macromolecules in a liquid media, however, it is important to prepare activated carbons having meso- or macropores.
Tamai et al. have found that steam activation of coal tar pitch homogeneously mixed with rare earth metal complexes brings about mesoporous carbons[3]. Also, the carbons thus obtained were confirmed to be very effective to selective adsorption of giant molecules such as humic acids and dextrans.
This study aims to provide mesoporous activated carbons from coals by use of various organometallic compounds. The carbons prepared are characterized by nitrogen adsorption to evaluate the pore size, and the crystal forms and size of metal compounds on the carbons are investigated by means of x-ray diffraction and transmission electron microscopy. The formation mechanism of the mesopres is also discussed on the basis of the results.
EXPERIMENTAL Three kinds of coals different in rank, i.e., Miike, Taiheiyo and Morwell coals were used for this study. The analytical data of the coals are summarized in Table 1. Each coal with particle size of minus 100 mesh was dispersed in tetrahydrofuran(THF) in Ar atmosphere. Al, Y, Ti, or Zr acetylacetonate(Al(acac),, Y(acac),, TiO(acac),, zr(acac),) solution of THF was added to the coal dispersion and the mixture was stirred at room temperature for lh under Ar gas. Thereafter, THF solvent was removed from the mixture by flash distillation under vacuum at room temperature and then 100°C. The weight percent of each metal added to the coal was adjusted to 2.5wt% before activation. Steam activation was carried out at 900°C for various times(3-25min).
Nitrogen adsorption isotherms at IIK were obtained by Quantachrome Autosorb-6. The X-ray diffraction measurement and transmission electron microscopic observation were performed using Rigaku Ru-300 with a CuKa radiation and Philips CM30 equipments, respectively.
Surface area and mesouore ratio. Figure 1 shows the change in BET surface area of various activated carbons obtained from Miike coal against activation time at 9OOr. The data of the carbons from the coal alone are also added for comparison in this figure. When Al(acac), was loaded on the coal and activated, the surface area increases with the time. On the other hand, the coal containing TiO(acac), results in the carbon with an approximately constant surface area (Ca.500m2/g) over these activation times. The pore size distribution and mesopore( 2 - 5 h ) area of each sample were obtained from nitrogen desorption by using BJH method[4]. Mesopore
RESULTS AND DISCUSSION
I
270

ratio is given by dividing the mesopore area by the BET one. The ratios obtained were plotted against activation time(Fig. 2). The result shows that the mesopore ratios in the carbons increase with activation time. It is noteworthy that addition of the Ti chelate enhances mesopore ratio. The similar behavior was observed in the case of Taiheiyo and Morwell Coal. The results are summarized in Table 2 and 3. The TiO(acac), compound promotes to develop mesopores also in both cases and, especially in the activated carbons from Taiheiyo coal ca. 90% of total pores are consisted of mesopore structures, as can be seen in Table 2. Brown coals such as Morwell easily produce micropore structures with heat-treatment. Therefore, the mesopore ratio of the activated carbons from Morwell coal with or without metal is not so high compared with those from other coals, but it is obvious that the Ti complex contributes to the development of mesopore.
X-ray diffraction and TEM observation. As described above, it was found that TiO(acac), dispersed ,on coals enhances the formation of mesopores. In order to understand the formation mechanism of these carbons, it is necessary to examine the form and size of Ti compounds on the activated carbons. Thus, the species of the compounds on the carbons were determined by X-ray diffraction. A profile of the carbon from Taiheiyo coal with TiO(acac), is given in Fig. 3, together with that from the coal without metal. Several strong peaks due to metal compounds in Taiheiyo coal which contains a high amount of ash(Tab1e 1) appear in Fig.3(a). When TiO(acac), loaded on the coal was activated with steam, the chelate is considered to decompose and form the cluster of the Ti oxides. The TiO, crystals with rutile and brucite structures can be evidently identified from the lattice constants of the profile indicated in Fig. 3(b). The same results were obtained in the case of Miike and Morwell coal.
The transmission electron photomicrographs of the activated carbons from Taiheiyo coal are shown in Fig. 4. Whereas a typical amorphous structure due to carbon layers was observed in the activated carbon from the coal alone, there are some voids and TiO, crystals with the size of few nm in the carbon with the metal(Fig. 4(b)) and at the same time these are closely present each other. Such a morphology was seen also in the carbons from the other coals. The particle size distribution of the crystals was estimated by an image analyzing technique(Fig. 5). Although the distribution is somewhat different in coal rank, most of the particles are rgnging from 2 to 12 nm in diameter. Taking into account that the size of the mesopores in the activated carbons is comparable to that of TiO, crystals, the behaviors of the metal oxides, such as migration or lacking may cause the generation of these mesopores.
CONCLUSION Mesoporous carbons were prepared by steam activation of metal acetylacetonates dispersed on Miike, Taiheiyo and Morwell coal. The TiO(acac), complex was effective for the occurrence of these carbons. The surface areas and mesopore ratios were evaluated by analyzing the nitrogen adsorption isotherms. In addition, the size distribution of TiO, crystals present on the carbons was examined by transmission electron microscopic observation. As a result it was found that the development of the mesopores is associated with the formation of TiO, crystals on the carbons.
REFERENCES 1. Matsumura,Y., Chem. 6 Chem. Ind.,1990,43(3),358-360. 2. Jagtoyen,M.,Thwaites,M.,Stencel,J.,MacEnaney,B.and
3. Tamai,H.,Kakii,T.,Hirota,Y.,Kumamoto,T. and Yasuda H.,
4. Barrett,E.P.,Joyner,L.G. and Halenda,P.P., J.Am.Chem.Soc., 1951,
Derbyshire,F., Carbon,1992,30(7),1089-1096.
Chem.Mater., in press.
73,373-380.
271
t
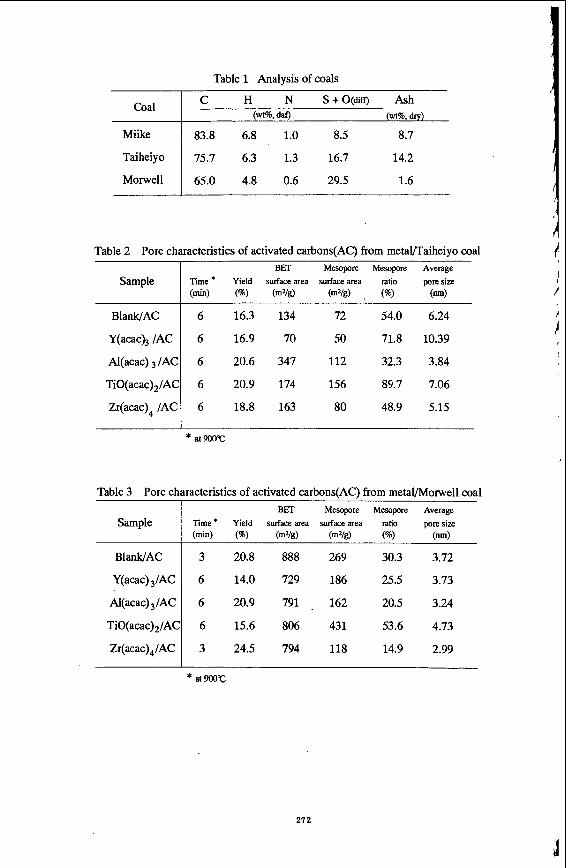
Table 1 Analysis of coals
Coal
Mike
Taiheiyo
Morwell
C H N S+O(d@ Ash (w% w (M%, dry)
83.8 6.8 1.0 8.5 8.7
75.7 6.3 1.3 16.7 14.2
65.0 4.8 0.6 29.5 1.6
Table 2 Pore characteristics of activated carbons(AC) from metanaiheiyo coal /
Sample
Blank/AC
Y(acac)3/AC
Al(acac)3/AC
TiO(aca~)~/Ac
Sample
Blan WAC
Y(acac), /AC
BET Mesopre Mesopre Average Time' Yield surface area surfacearea ratio poresize (min) (%) (mz/g) (mz/g) (%) (nm)
3 20.8 888 269 30.3 3.72
6 14.0 729 186 25.5 3.73
6 20.9 791 . 162 20.5 3.24
6 15.6 806 431 53.6 4.73
I BET Mesopore Mesopre Average
Time * Yield surfacearea surfacearea ratio poresize (&) (%) ( m W (mZM (%) (4 I
6 16.3 134 72 54.0 6.24 I
I 6 16.9 70 50 71.8 10.39
Al(acac) 3 /AC
TiO(acac)2/AC, :::: :i! ::\ i::: :::: Zr(acac), /AC 18.8 48.9 5.15
* a t m T
Table 3 Pore characteristics of activated carbons(AC) from metal/Morwell coal
Zr(acac),/AC 3 24.5 794 118 14.9 2.99
272
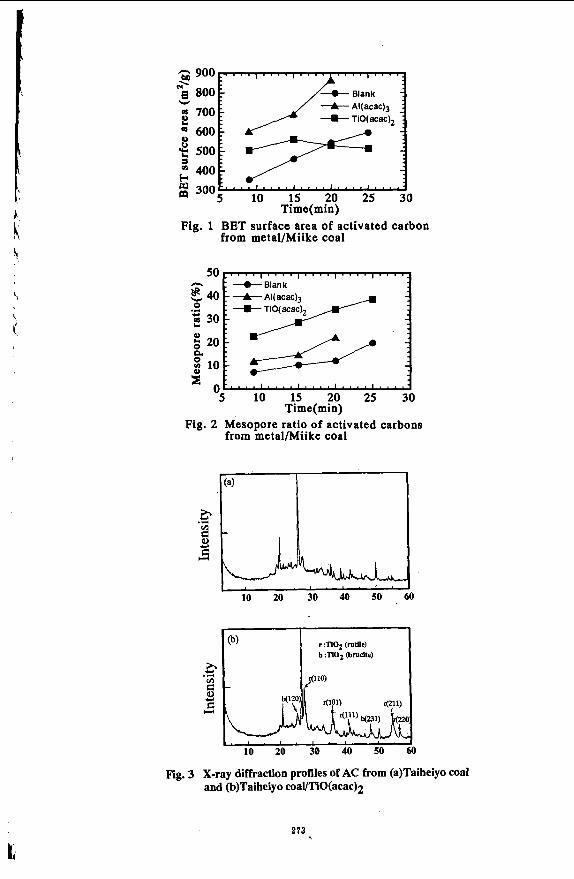
r;l a 800
* 700 e 600
500 ’ 400
U
3005”‘ 10 !S 20 25””30 Time(min)
Fig. 1 BET surface area of activated carbon from metal/Miike coal
S O L . . . I I . 1 . . , . . . . 1 , . . . I . . . . _
Time(min) Fig. 2
s s .3 v) C
c H
Mesopore ratio of activated carbons from meta lMike coal
J 10 20 30 40 50 60
@) r :‘NO, (rutUe) b :‘NO, (brucfte)
E .3 .n C -
10 20 30 40 50
Fig. 3 X-ray diffraction profiles of AC from (a)Taiheiyo coal and (b)Taiheiyo coaVTiO(acac)2
273,
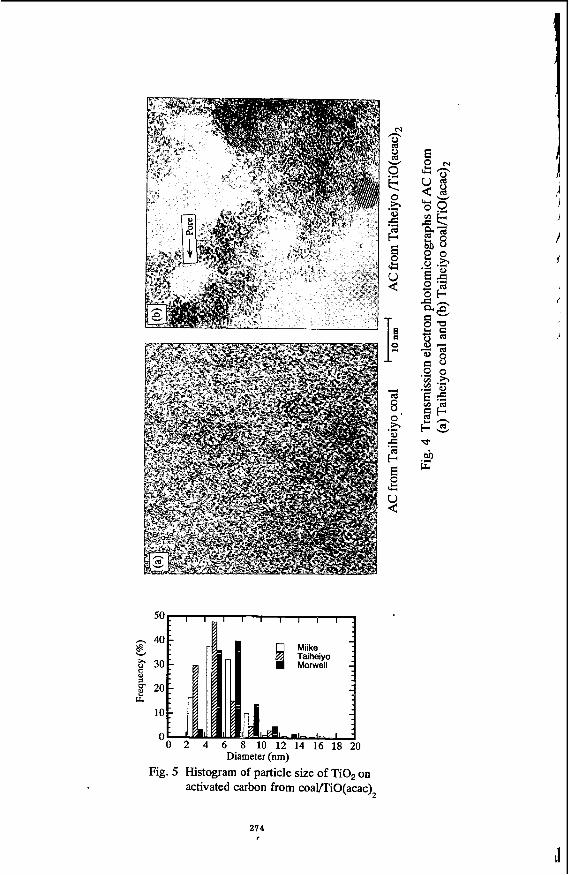
N n s s W
0 F 0 h 0 E .e
.- F 6 0 &
Y
0’
B h 0 .r(
F E 8 Y
50
- 40 E. 3 30 3 f 20 r&
10
0 0 2 4 6 8 10 12 14 16 18 20
d
Diameter (nm) Fig. 5 Histogram of particle size of TiOp on
activated carbon from coal/riO(acac)2
274
CASlFlCATION CEIARACTERISTICS OF AN ACTIVATED CARBON CATALYST DURING TEE DECOMPOSITION OF HAZARDOUS WASTE MATERIAL
IN SUPERCRITICAL WATER
Yukihiko Matsumura, Frederick W. Nuessle, and Michael J. Antal, Jr Hawaii Natural Energy Institute
University of Hawaii at Manoa, Honolulu, HI 96822
Key Words -- Carbon gasification, activated carbon, supercritical water
INTRODUCTION Recently, carbonaceous materials including activated carbon were proven to be effective
catalysts for hazardous waste gasification in supercritical water [I] . Using coconut shell activated carbon catalyst, complete decomposition of industrial organic wastes including methanol and acetic acid was achieved. During this process, the total mass of the activated carbon catalyst changes by two competing processes: a decrease in weight via gasification of the carbon by supercritical water, or an increase in weight by deposition of carbonaceous materials generated by incomplete gasification of the biomass feedstocks. The deposition of carbonaceous materials does not occur when complete gasification is realized Gasification of the activated carbon in supercritical water is often favored, resulting in changes in the quality and quantity of the catalyst. To thoroughly understand the hazardous waste decomposition process, a more complete understanding of the behavior of activated carbon in pure supercritical water is needed.
The gasification rate of carbon by water vapor at subcritical pressures was studied in relation to both coal gasification and generating activated carbon [2 ] It is known that carbon reacts with water vapor via:
C + H2O + C O T H2
CO + H20 + C02 7 H2
(1)
(2)
A reaction mechanism which considers the competitive adsorption of water and hydrogen molecules to the same active sites was proposed [)-SI:
H 2 0 Z (0H)O-I) 2 (O)gr2) (3)
HZ 2 (H2) (4)
c + (0) --f co, ( 5 )
in which parentheses indicate the adsorbed species. Long and Sykes [ 5 ] assumed a steady state for the adsorbed molecules and succeeded in explaining results for subatmospheric conditions, using the rate equation:
where ki, kZ, and k3 denote reaction rate constants, and p m o and p m are the partial pessure of water and hydrogen, respestively. This equation correctly predicts the inhibition by hydrogen observed inthe experiment.
At elevated pressures, the generation of methane becomes more important. Gasification at steam pressures as high as 4.7 MPa was conducted by Blackwood and McGrory [6] . They proposed that the reaction between adsorbed hydrogen and water vapor for ,methane formation shwld be included with the reactions given by Eqs. 3 to 5 , and correspondingly obtained the following rate equations:
where r c ~ 4 denotes the methane generation rate. These rate equations satisfactorily explained their results. Later, Van Heek et al. [7] found two mechanisms of methane generation: pyrolysis
275
1
coal at higher temperatures (higher than 600OC) for coal gasification in steam up to 7.1 MPa. Methane formation by pyrolysis was not intensified by pressure, but the rate of reaction between steam and char was clearly increased with pressure.
In spite ofthis accumulation of reaction data, we were unable to find measurements of the gasification rate of carbon in supercritical water. Data of this kind is needed to predict the lifetime of the catalyst and its contribution to the gas yields observed during biomass gasification. Consequently, the effects of temperature and pressure on the gasification rate and g@ composition were measured and interpreted in relation to the previous research on carbon gasification under subcritical conditions. The change in iodine number of the carbon catalyst during supercritical water treatment was also measured.
EXPERIMENTAL Experiments were conducted using a packed bed reactor [ l ] as shown in Fig. 1. The
reactor was fabricated from Inconel 625 tubing, with a 9.53 mm O D and a 4.75 nun ID. Granular activated carbon (coconut shell based, 14-30 US mesh) was packed with a length of 406 nun in the reactor. Water was pressurized by an HF'LC pump (Waters, Model 510) and fed to the reactor at 1.0 g/min. The temperature of the water flow was rapidly raised to the desired value by an entrance heater. The reactor was maintained at isothermal conditions by the &mace and a down-stream heater. The axial temperature profile along the reactor wall was measured using 11 type K thermocouples; another retractable type K thermocouple was placed inside the annulus of the reactor at the entrance of the packed bed. The pressure in the reactor system was measured by a pressure transducer. The reactor temperature was set at 600°C or 650°C, and the pressure was set at 25.5 Ma, 29.9 MPa, or 34.5 MPa.
After being cooled, the reactor effluent was sent to a sampling system principally composed of two three-way valves and a sampling loop. The effluent was discharged into the sampling loop for a defined duration, after which the contents were released into a pre-evacuated sampling tube. In the actual system, these two three-way valves were incorporated into one ten- port valve, enabling simultaneous switching of these valves. Effluent bypassing the sampling loop was delivered to an accumulator, where liquid and gas were separated and the gas was released through a pressure regulator, thus maintaining constant system pressure.
The gas generation rate was calculated from the pressure rise in the sampling tube, using the equation of state for an ideal gas. The change in gasification conversion with time was calculated using this measured gas generation rate and gas composition as determined by a gas chromatograph. Iodine tests (ASME D4607) were conducted to estimate the specific surface area of the residual carbons. BET surface area analysis was also conducted for a limited number of samples.
The iodine number of the virgin activated carbon was 1050. The ultimate analysis of this carbon showed the presence of hydrogen at 0.88 wt%.
RESULTS AND DISCUSSIONS 1. Total gasification rate
The composition of the product gas was similar for all the experimental conditions: hydrogen, 64%; carbon dioxide, 33%. methane, 2%; and carbon monoxide, 1% by mole. This composition was steady throughout the gasification. The ratio of hydrogen to carbon dioxide is close to 2, which is expected from the reactions shown in Eqs. 1 and 2.
It is known that the curves of carbon gasification conversion versus time can be often expressed by a single cubic equation in a normalized dimensionless plot using reduced time based on the time to attain a gasikcation conversion of 0.5 [8]. Although activated carbon i i a partly gasified carbonaceous material, the normalized plot was drawn using conversion based on the mtial activated carbon weight. In this work, the normalized plot was drawn using the reduced time T based on the time needed for increasing conversion from 0.075 to 0.1 because the highest conversion was 0.25.
Here, t, b.07~. and b.1 denote the f i e to be reduced, and times at which conversions of 0.075 and 0.1 were attained, respectively. The plots shown in Fig. 2 show good agreement for all the gasification experiments. This agreement indicates the possibility of using a single cubic equation to express the reaction rate change during gasification. It is also to be noted that the relation between conversion and reduced time is basically expressed by a linear hnction for the conversion range observed in this work.
From this graph of generalized conversion change, the dimensionless gasification rate at zero conversion is 0.0278. Dividing this value by the time needed to change conversion from
276
0.075 to 0.1 for each experiment gives the gasification rate at zero conversion for each experiment. These zero conversion values are used for the following data analysis, because they are not affected by the surface area change which occurs during gasification.
No clear trend with pressure was established, in agreement with the results from Long and Sykes [SI. (See Eq. 6, which shows that the effect of water vapor pressure becomes negligible at high pressures.) On the other hand, the earlier experiments by Blackwood and McGrory [6] predict a 20% increase in reaction rate with increasing pressure from 25.5 to 34.5 MPa at 600'C. Thus, the extrapolation of the results of Blackwood and McGrory [6] does not predict the effect of pressure within this pressure range.
The effect of temperature is shown in Fig. 3 in the form of an Arrhenius plot. Carbon gasification rates at 34.5 MPa, projected using the rate equations of earlier workers, are also shown in the figure. Extrapolation of the results from Long and Sykes [SI predicts our result accurately. From the results of our work, the activation energy was found to be 166 kJ/mol, which is in good agreement with 176 kJ/mol observed by Long and Sykes [5]. This agreement suggests that the fundamental mechanism of gasification does not change under high pressures such as the supercritical condition. The prediction using the rate equation by Blackwood and McGrory [6] presents a quite different dependence of the reaction rate on temperature.
2. Methane generahbn rate No clear dependence of the methane generation rate on total pressure is observed, which
suggests that methane generation occurs by pyrolysis [7]. The ratio of the methane generation rate to the total gasification rate is thus constant, showing a value around 3%. Assuming that all hydrogen in the original activated carbon turns into methane by pyrolysis, the ratio should be 2.8%, in agreement with the observed value. The prediction of this value using the rate coefficients determined by Blackwood and McGrory [6] gives 0.03%, which indicates reaction of steam with carbon at this temperature is very slow. Thus, it should be concluded that the methane generation observed here is due to pyrolysis ofactivated carbon.
3. Iodine number The iodine number is a crude measure of the surface area of an activated carbon, obtained
by analyzing its capacity for iodine adsorption. The relation between the iodine number and the conversion (see Fig. 4) shows at first an increase in the iodine number with increasing conversion, then maximum iodine number from 0.05 to 0.2, and finally a decrease in the iodine number at conversions above 0.2. The early increase in the iodine number is because of gasification accompanied with the development of the microporous structure. In the middle flat region, the microporous structure is maximized, and there is a equilibrium between creation of new pores and destruction of the walls between them. The decrease at high conversion indicates when the bum- off of the walls between the pores dominates over creation of new pores. Thus, short-term treatment in supercritical water effectively develops the microporous structure of the carbon. BET analysis showed a similar increase in surface area from 809 mz/g to 101 1 m2/g after 6-hour reaction in supercritical water at 600°C and 34.5 m a . No significant iduence of pressure on the iodine number after a 6-hour treatment was observed.
4. Activated carbon production in supercritical water This increase in the iodine number of carbon by treatment in supercritical water w1 be
utilized for activated carbon production. A series of experiments were conducted to activate charcoals in supercritical water. Charcoals produced in-house (14-30 US mesh) were packed in the reactor in place of activated carbon, and after treatment in supercritical water at 65O0C, 34.5 MPa, the iedine numbers of the product activated carbon were measured. Table 1 shows the results of these iodine tests. Large increases in the iodine number from the initial values of less than 50 are observed for each treatment. Thus, treatment of carbonaceous materials in supercritical water can be a novel approach for producing activated carbon production at lower temperatures than conventional activation methods.
CONCLUSION The gasification rate of activated carbon in supercritical water is unaffected by variations
in total pressure above the critical pressure of water, and is predictable by previous gasification measurements made at subatmospheric pressure, indicating the same gasification reaction mechanism. The methane generation characteristics indicate that methane is produced by the pyrolysis of the activated carbon itself. Short-term gasification in supercritical water increases the specific surface area of activated carbon, and thus its adsorbent capabilities. Supercritical water treatment can be a novel technique of activated carbon production at lower temperature than conventional activation methods.
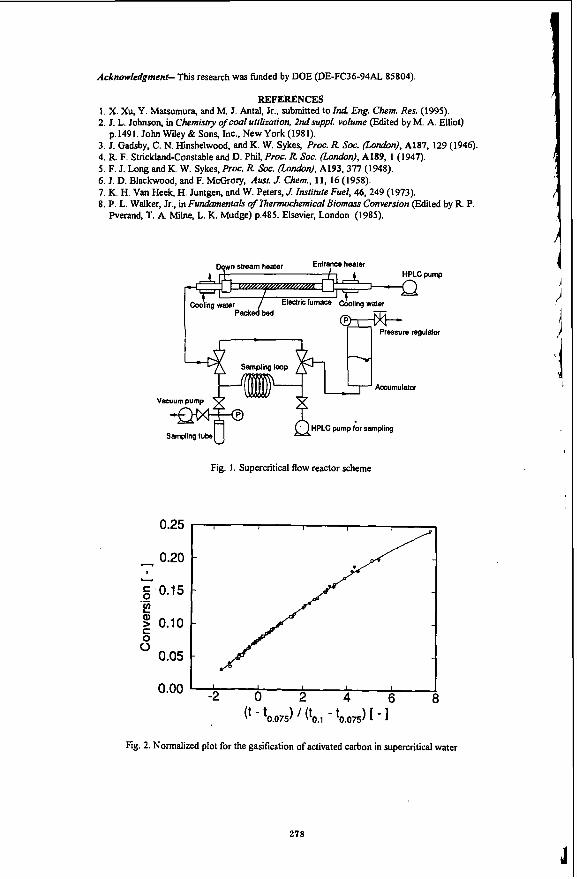
Acknowledgment- This research was finded by DOE (DE-FC36-94AL 85804).
REFERENCES 1, X. Xu, Y. Matsumura, and M. J. Antal, Jr., submitted to Ind hg. Chem. Res. (1995). 2. J. L. Johnson, in Chemishy of coal ufilization, 2ndsuppl. volume (Edited by M. A. Elliot)
3. J. Gadsby, C. N. Hinshelwood, and K. W. Sykes, Proc. R Soc. (zondon, A187, 129 (1946). 4. R. F. Strickland-Constable and D. Phil, Proc. R Soc. (zondon), A189, 1 (1947). 5 . F. J. Long and K. W. Sykes, Proc. R SOC. &nabn), A193,377 (1948). 6. J. D. Blackwood, and F. McGrory, Ausf. J. Chem., 11, 16 (1958). 7. K. H. Van He& H. Juntgen, and W. Peters, J. Imtitufe Fuel, 46,249 (1973). 8. P. L. Walker, Jr., in FundmnentaZs of Thennochemical Biomass Conversion (Edited by R. P.
p.1491. John Wdey & Sons, Inc., New York (1981).
Pverand, T. A. Milne, L. K. Mudge) p.485. Elsevier, London (1985).
Aefumulator
Fig. 1. Supercritical flow reactor scheme
0.25
0.20 - 5'0.15 .-
F 0.10 C
0.05 s
0.00
(t - '0.075) ' - t0.075) [ 1 Fig. 2. Normalized plot for the gasification of activated carbon in supercritical water
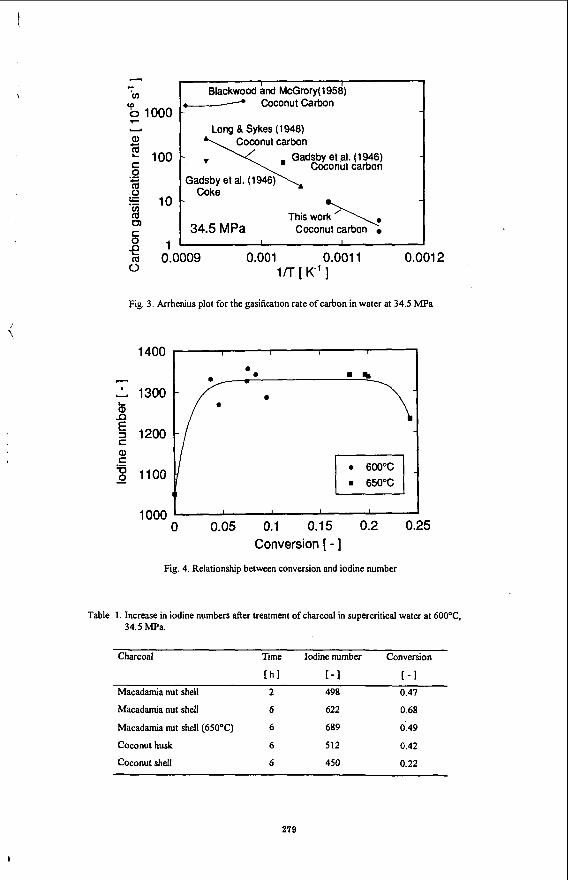
\
C
O 1
c - 'In
0 1000 (0
v- Y
1400 I I 1 I
e -
El- 1000 I I I I
a - 100
C 0 .- c E 10 VI a 0
Blackwood h d McGrory(l958) +---A Coconut Carbon
Long & Sykes (1948) Coconut carbon
, Gadsby et al. (1946) Coconut carbon
Coke
This wo&\D 34.5 MPa Coconut carbon
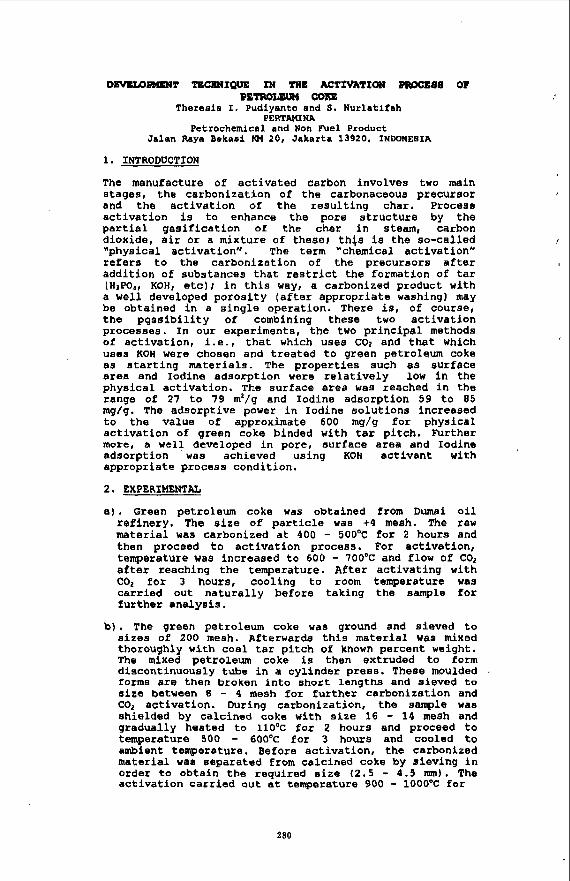
DEVHX)-T TZHNIQUE IN RIE hCTXVATION PROCESS 08 RETRLyIJDIlH COIF&
Thekesie I. Pudiyanto and 8 . Nurlatifah PERTAUSNA
Petrochemical. end Non Fuel Product Jalen Raya Bekaei KM 20, Jakarta 13920. INDONESIA
1. INTRODUCTION
The manufacture of activated carbon involves two main stages, the carbonization of the carbonaceoue precursor and the activation of the resulting char. Procese activation is to enhance the pore structure by the partial gasification of the char in steam, carbon dioxide, air or a mixture of these; thJs is the so-called ”physical activation”. The term “chemical activation’’ refers to the carbonization of the precursors after addition of substances that restrict the formation of tar (HaPo , , KOH, etc)r in this way, a carbonized product with a well developed porosity (after appropriate washing) may be obtained in a single operation. There is, of course, the pessibility of combining these two activation processes. In our experiments, the two principal methods of activation, i.e., that which uses CO2 and that which uses KOH were chosen and treatecl to green petroleum coke as atarting materials. The properties such as surface area and Iodine adsorption were relatively low in the physical activation. The surface area was reached in the range of 27 to 79 m2/g and Iodine adsorption 59 to 85 mg/g. The adsorptive power in Iodine solutions increased to the value of approximate 600 mg/g for physical activation of green coke binded with tar pitch. Further more, a well developed in pore, surface area and Iodine adsorption was achieved using KOH activant with appropriate process condition.
2. EXPERIMENTAL
a). Green petroleum coke was obtained from Dumai oil refinery. The size o f particle was +4 mesh. The raw material was carbonized at 400 - 5OO0C for 2 hours and then proceed to activation process. For activetion, temperature was increased to 600 - 700% and flow of C02 after reaching the temperature. After activating with CQ2 for 3 hours, cooling to room temperature was carried out naturally before taking the sample for further analysis.
b). The green petroleum coke was ground and sieved to sizes of 200 mesh. Afterwards this material was mixed thoroughly with coal tar pitch of known percent weight. The mixed petroleum coke is then extruded to form discontinuously tube in a cylinder press. Them moulded forms are then broken into short lengths and sieved to aize between 8 - 4 mesh for further Carbonization and C02 activation. During carbonization, the sample was shielded by calcined coke with size 16 - 14 mesh and gradually heated to llO0c for 2 hours and proceed to temperature 500 - 606OC for 3 hours and cooled to ambient temperature. Before activation, the carbonized material was separated from calcined coke by sieving in order to obtain the required size (2.5 - 4.5 m m ) . The activation cart ied out at temperature 900 - 1000°C for
280
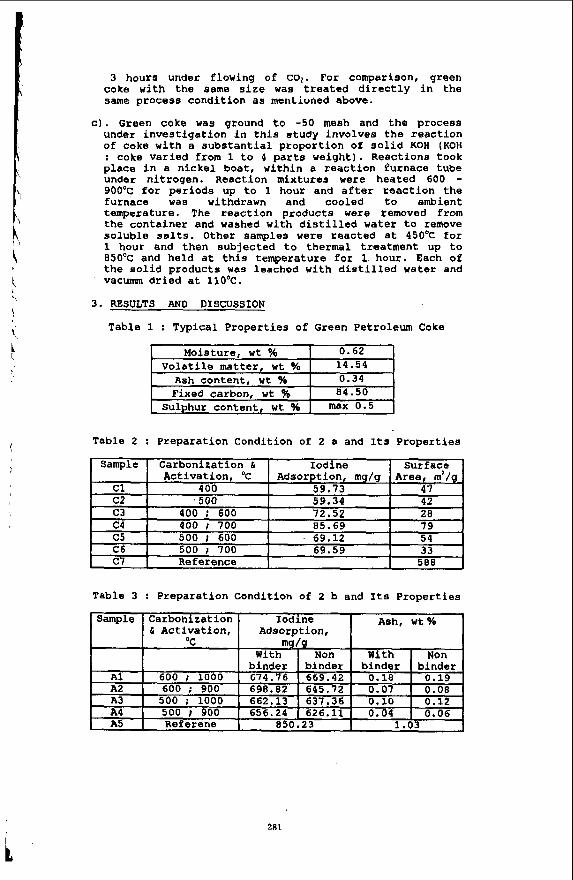
3 hours under flowing of Cot. For comparison, green coke with the same size was treated directly in the same process condition as meriLivfied above.
c). Green coke was ground t o -50 mesh and the process under investigation in this etudy involves the reaction of coke with a substantial proportion of solid KOH (KOH : coke varied from 1 to 4 parts weight). Reactions took place in a nickel boat, within a reaction furnace tube under nitrogen. Reaction mixtures were heated 600 - 900°c for periods up to 1 hour and after reaction the furnace was withdrawn and cooled to ambient temperature. The reaction products were removed from the container and washed with distilled water to remove soluble salts. Other samples were reacted at 45OoC for 1 hour and then subjected to thermal treatment up to 85OoC and held at t h i s temperature for 1. hour. Each of the solid products was leached with distilled water and
' v a c m dried at l l O ° C .
3. RESULTS AND DISCUSSION
Table 1 : Typicel Properties of Green Petroleum Coke
Sample Carbonization & Activation,
Moisture, wt W volatile matter wt % 1 4 . 5 4
Ash content, ut % Fixed carbon, w t 96 84.50
Sul hur content wt % max 0.5
Iodine Ash, wt% Adsorption,
Table 2 : Preparation Condition of 2 a and Its Properties
2R1 I t
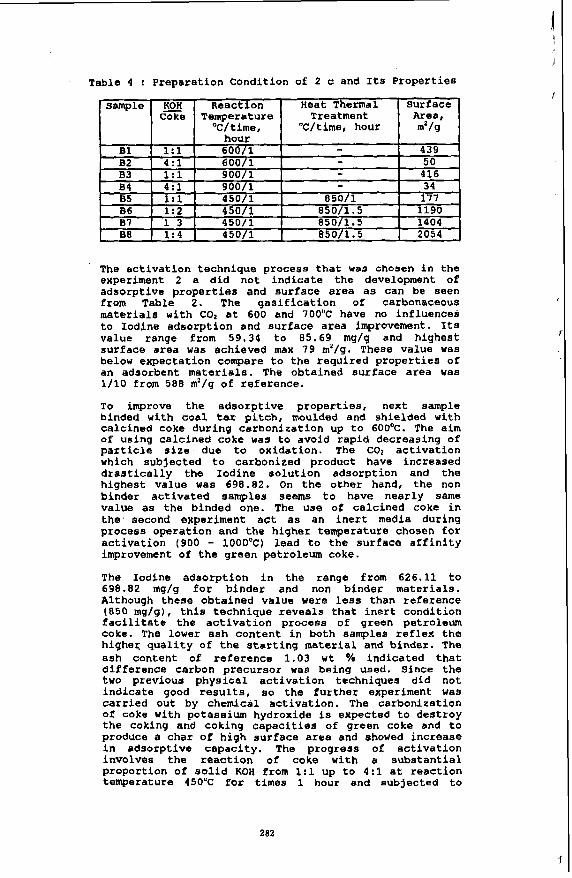
Table 4 : Preparation Condition of 2 c and Its Properties
The activation technique process that was chosen in the experiment 2 a did not indicate the development of adsorptive properties and surface area as can be seen from Table 2. The gasification of carbonaceous materials with CO, at 600 and 700°C heve no influences to Iodine adsorption and surface area improvement. Its value range from 59.34 to 65.69 mg/g and highest surface area was achieved max I 9 m'/g. These value was below expectation compare to the required properties o f an adsorbent materials. The obtained surface area was 1/10 from 588 d / q of reference.
TO improve the adsorptive properties, next sample binded with coal tar pitch, moulded and shielded with calcined coke during carbonization up to 600%. The aim of using calcined coke was to avoid rapid decreasing of particle size due to oxidation. The C02 activation which subjected to carbonized product heve increased drastically the Iodine solution adsorption and the highest value was 698.82. On the other hand, the non binder activated samples seems to heve nearly same value as the binded one. The use of calcined coke in the second experiment act as an inert m d i 8 during process operation and the higher temperature chosen for activation (900 - 1000°C) lead to the surface affinity improvement of the green petroleum coke.
The Iodine adsorption in the renge from 626.11 to 698.82 mg/g for binder and non binder materials. Although these obtained value were less than reference (850 mg/g), this technique reveals that inert condition facilitate the activation process of green petroleum coke. The lower ash content in both samples reflex the higheq quality of the starting material and binder. The ash content of reference 1.03 wt % indicated that difference carbon precursor was being used. Since the two previous physical activetion techniques did not indicate good results, so the further experiment was carried out by chemical activation. The carbonization of coke with potassium hydroxide is expected to destroy the coking and coking capacities of green coke and to produce a char of high surface area and showed increase i n adsorptive capacity. The progress of activation Involves the reaction of coke with a substantial proportion of solid KOH from lrl up to 4:l at reaction temperature 450°C for times 1 hour and subjected to
282
\
heat treatment at 650°C for times of 1 hour to 1.5 hours could produce an active carbon Of high surface area up to 2054 m2/g es can be seen from Table 4 and suitable for further application analysis.
The reaction temperature carried out at 600 and 900'C results pearly same surface area namely 439 and 416 m2/g. On- the other hand, the least introduce reactant tend to decrease the surface area of activated carbon to value 34 - 50 m2/g. The process conditions and amount of KOH have influenced the surface area formation of carbon, en important property for adsorbent,
4. Conclusions
Different preparation technique of activation were greatly influence the pore structure enhancement of green petroleum coke . Formation of high surface area active carbon from green petroleum coke was obtained effectively by using KOH activant.
1
I
283