production of fish and benthos on georges bank estimates of benthic biomass and production...
TRANSCRIPT

Production of Fish and Benthos on Georges Bank
• Estimates of benthic biomass and production• Preliminary estimates of energy flow• Dynamic fish population models
Jeremy Collie, Allison DeLong, and Richard Bell
Graduate School of Oceanography
University of Rhode Island

Benthivorous Fish
Pelagic Invertebrate
Predators
Micro-Phytoplankton
(>20m)
Seabirds
Deposit-feedingBenthos
Suspension- feeding Benthos
Detritus Ammonia
Fishing
R
Micro-Zooplankton(2-200m)
Meso-Zooplankton
(>200m)
Nitrate
Nano-Phytoplankton
(<20m)
PlanktivorousFish
Piscivorous Fish
Pre-recruits Pre-recruits Pre-recruits
MarineMammals
spawning
recruitment

Time period Location Biomass P:B Production
1960s Entire Bank
Suspension 19 0.9 16
Deposit 64 1.5 86
Total 83 1.2 102
1977Southern Flank
Suspension 54 1.0 54
Deposit 20 1.7 39
Total 74 1.3 93
1983Southern Flank
Suspension 30 1.0 30
Deposit 31 2.0 56
Total 61 1.4 86
1990sNorthern Edge
Suspension 113 0.5 45
Deposit 89 0.7 60
Total 202 0.5 105
Benthic macrofaunal biomass (kcal m-2) and production (kcal m-2 yr-1) on Georges Bank
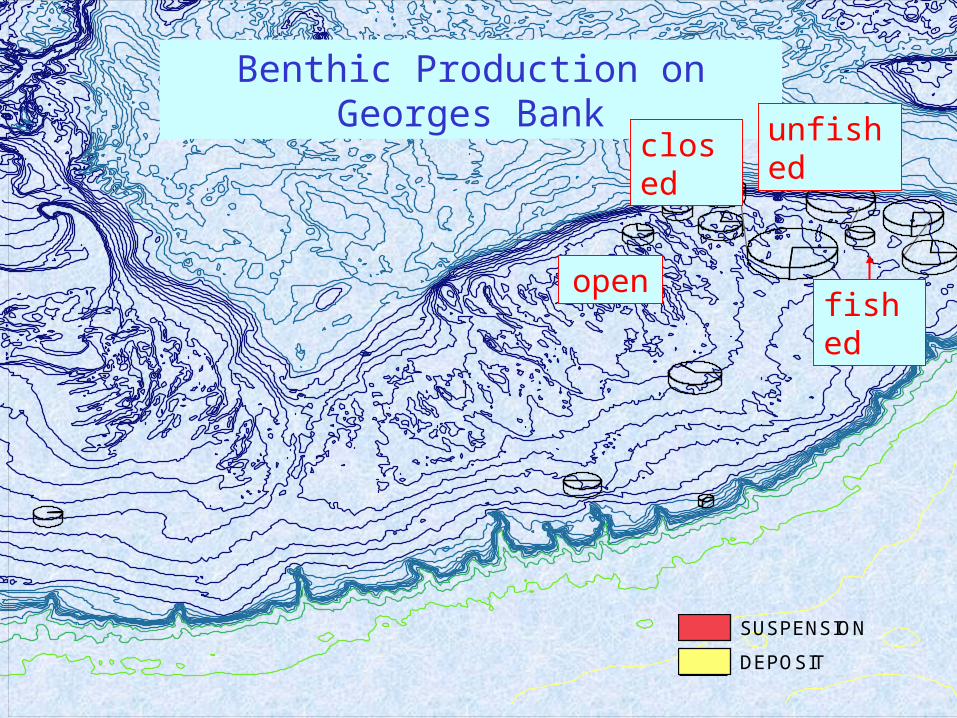
Benthic Production on Georges Bank
DEPOSIT
SUSPENSION
unfished
fished
closed
open

0
50
100
150
200
250
300
1994 1997 1998 1999
kcal
m-2
yr-1
Suspension feeders
Deposit feeders
0
50
100
150
200
250
300
1994 1997 1998 1999
kcal
m-2
yr-1
Benthic production on the northern edge of Georges Bank is significantly lower in fished areas compared with unfished areas at the same depth
Fished area, depth 79 m
Unfished area, depth 84 m
From Hermsen et al. 2003, MEPS 260:97-108

0
50
100
150
200
250
1994 1995 1996 1997 1998 1999 2000
kcal
m-2
yr-1
Suspension feeders
Deposit feeders
0
50
100
150
200
250
1994 1995 1996 1997 1998 1999 2000
kca
l m
-2 y
r-1
Suspension feeders
Deposit feeders
Benthic production has increased in the northern part of Closed Area II relative to an area just outside the closed area that remains open to fishing
Inside closed area, depth 48 m
Outside closed area, depth 47 m
From Hermsen et al. 2003, MEPS 260:97-108
Area closed
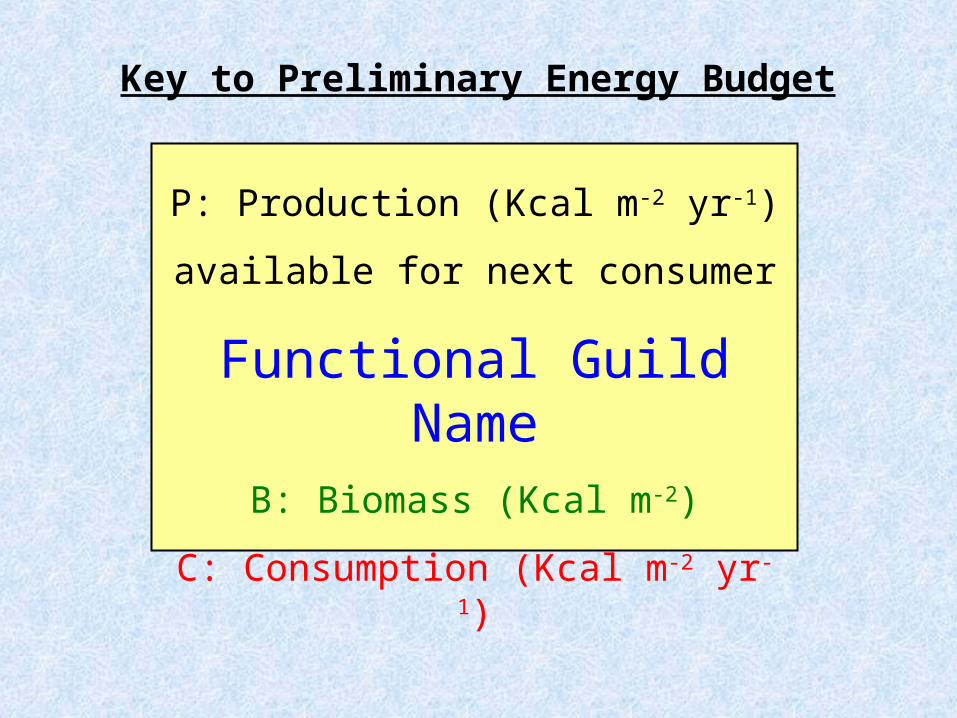
P: Production (Kcal m-2 yr-1)
available for next consumer
Functional Guild NameB: Biomass (Kcal m-2)
C: Consumption (Kcal m-2 yr-1)
Key to Preliminary Energy Budget
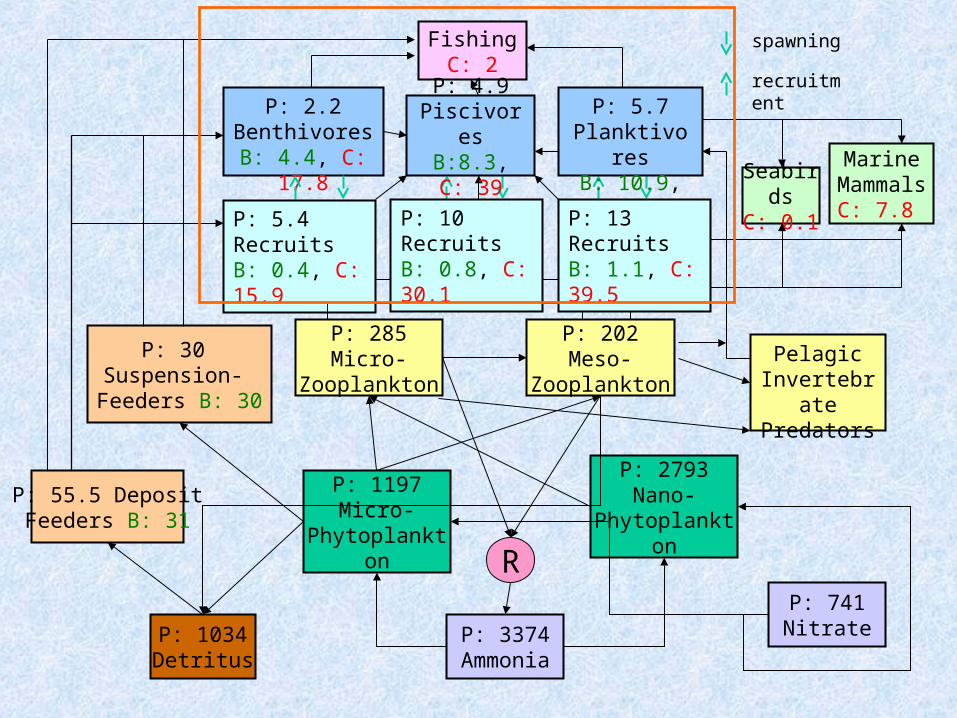
MarineMammals
C: 7.8
P: 2.2Benthivores
B: 4.4, C: 17.8
Pelagic Invertebrate
Predators
P: 1197Micro-
Phytoplankton
SeabirdsC: 0.1
P: 55.5 DepositFeeders B: 31
P: 30 Suspension- Feeders B: 30
P: 1034Detritus
P: 3374Ammonia
FishingC: 2
R
P: 285Micro-
Zooplankton
P: 202Meso-
Zooplankton
P: 741Nitrate
P: 2793Nano-
Phytoplankton
P: 5.7Planktivores
B: 10.9, C: 54
P: 4.9Piscivores
B:8.3, C: 39
P: 5.4 RecruitsB: 0.4, C: 15.9
spawning
recruitment
P: 10 RecruitsB: 0.8, C: 30.1
P: 13 RecruitsB: 1.1, C: 39.5

Dynamic models of the upper trophic levels
Fishing
Benthivorous Fish
Piscivorous Fish
Planktivorous Fish
Pre-recruits
Pre-recruits
Pre-recruits
BenthosZooplankto
n
rB
rb
rh
rP
rp
FB FH FP
cP
cpcbdb dpgb gp
predationspawningrecruitment
bottom-up forcing
Top-down control
)()()()()(1)(
)()()()()(1)(
tptHctPgtpdKtprtp
dtdp
tPFtPtHctpdKtPrtP
dtdP
Ppp
p
PPpP
P
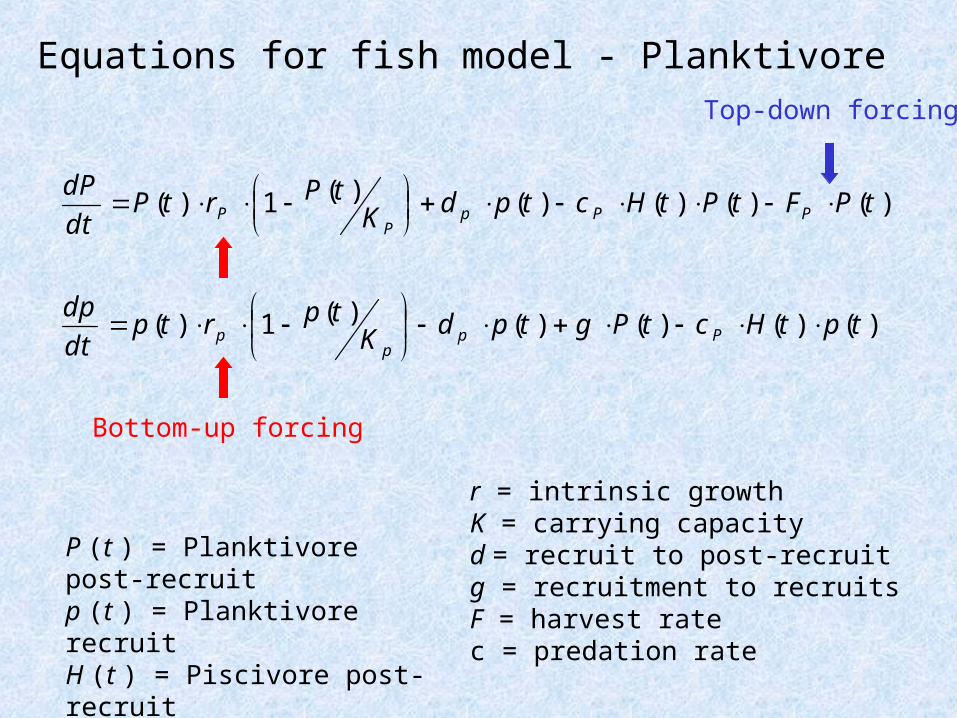
Equations for fish model - Planktivore
P (t ) = Planktivore post-recruitp (t ) = Planktivore recruitH (t ) = Piscivore post-recruit
r = intrinsic growth K = carrying capacityd = recruit to post-recruitg = recruitment to recruitsF = harvest ratec = predation rate
Bottom-up forcing
Top-down forcing

Deterministic Simulation
0 10 20 30 40
0100
200300
400
BenthivoresPiscivoresPlanktivores
Year
Bio
mass
(K
T)
1960’s biomass
1990’sbiomass

Planktivore Bottom-up ForcingSimulate autocorrelated growth rates
0 20 40 60 80 100
0100
300
500
BenthivoresPiscivoresPlanktivores
Year
Bio
mass
(K
T)
Bio
mass (
KT)
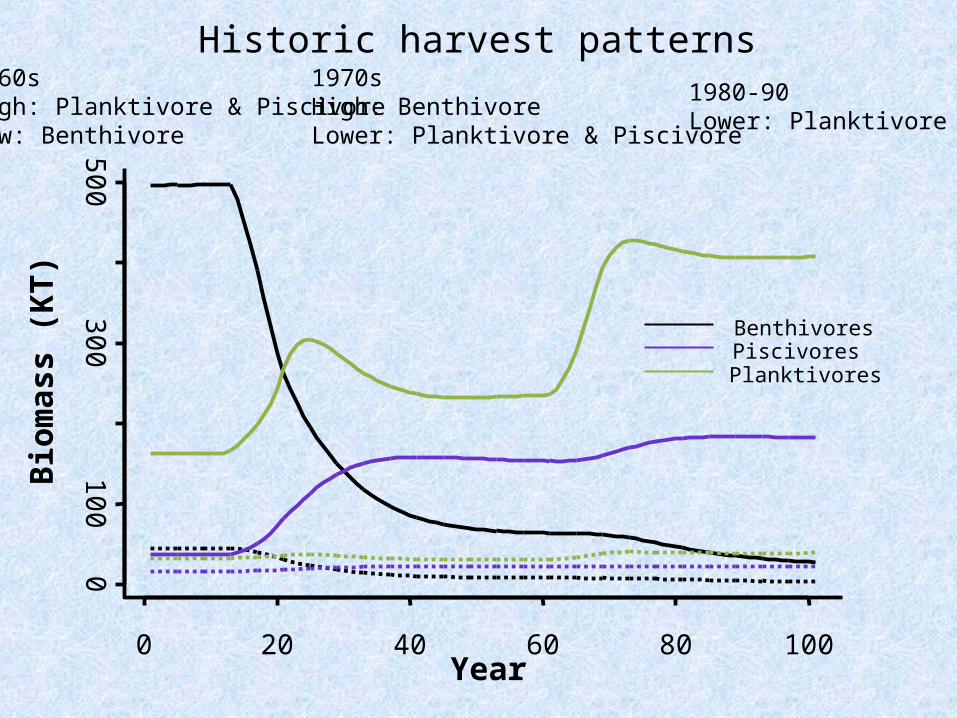
Historic harvest patterns1960sHigh: Planktivore & PiscivoreLow: Benthivore
0 20 40 60 80 100
0100
300500
BenthivoresPiscivoresPlanktivores
Year
1970sHigh: BenthivoreLower: Planktivore & Piscivore
1980-90Lower: Planktivore

On-going work
• Refine estimates of benthic production• Balance the entire energy budget• Account for energy imports and exports• Statistical parameter estimation of
multispecies biomass-dynamics models