production of spray-dried honey powder and its application
TRANSCRIPT
Louisiana State UniversityLSU Digital Commons
LSU Master's Theses Graduate School
2011
Production of spray-dried honey powder and itsapplication in breadAhalya Kosal RamLouisiana State University and Agricultural and Mechanical College
Follow this and additional works at: https://digitalcommons.lsu.edu/gradschool_theses
Part of the Life Sciences Commons
This Thesis is brought to you for free and open access by the Graduate School at LSU Digital Commons. It has been accepted for inclusion in LSUMaster's Theses by an authorized graduate school editor of LSU Digital Commons. For more information, please contact [email protected].
Recommended CitationKosal Ram, Ahalya, "Production of spray-dried honey powder and its application in bread" (2011). LSU Master's Theses. 1743.https://digitalcommons.lsu.edu/gradschool_theses/1743
PRODUCTION OF SPRAY-DRIED HONEY POWDER AND ITS APPLICATION IN
BREAD
A Thesis
Submitted to the Graduate Faculty of the
Louisiana State University and
Agricultural and Mechanical College
in partial fulfillment of the
requirements for the degree of
Master of Science
In
The Department of Food Science
by
Ahalya Kosal Ram
B.Tech., Vellore Institute of Technology University, 2009
August, 2011

ii
Dedicated to
Amma, Appa and Thangamal paatti
iii
ACKNOWLEDGEMENTS
I would sincerely like to thank:
Dr. Subramaniam Sathivel (Major advisor) for giving me the opportunity to pursue my masters
and his unending support and advice during the entire course of my project. Dr. Joan King for
not only guiding me through my project and allowing me to use the HPLC and RVA machines
in her lab but also for giving me a completely new and unforgettable outlook to the field of food
chemistry. Dr. Paul Wilson and Dr. David Bankston for their valuable suggestions and
perspectives which have been of immense help. Dr. Alfredo Prudente for his patience in helping
me with the HPLC as well as reiterating the importance of dedication and hard work in one‘s
field. Dr. Witoon Prinyawiwatkul for kindly allowing me to use the TA Texture Analyzer. Dr.
Rafael Cueto for his generosity in helping me understand, learn and use the DSC machine in his
lab. Dr. Bob Xiang for assisting me in operating the rheometer and spray dryer.
I would like to thank my lab mates and friends Jianing, Yuting, Kevin, Jie, Juan, particularly Eva
and Luis E. for taking me under their wing and being my support system at LSU; Janani,
Waheeda, Daniel, Luis A., Miguel, Ashley, Karen, Wannita and Alisa for all their help, support
and most importantly for the unforgettable memories and good times.
I am deeply grateful to my friends Atulya, Santosh, Priyanka, Niharika, Harshal, Joshua, Anuj,
Shruti, Aditi, Avinash, Krishna, Arun, Mridhula, Puneeth and Nikhil whose presence in my life
has only changed it for the better.
Above all, I would like to thank my parents for their unwavering faith in all my endeavors, their
mental and moral support and most of all for their love and patience, without which I would not
be the person I am today. And also my grandmother who I know would have been proud to see
me graduate.
iv
TABLE OF CONTENTS
ACKNOWLEDGEMENTS………………………………………………………………............iii
LIST OF TABLES…………………………………………………………………………..........vi
LIST OF FIGURES……………………………………………………………………………...vii
ABSTRACT…………………………………………………………………………………….viii
CHAPTER 1 LITERATURE REVIEW…………………………………………………………..1
1.1 Honey: General Introduction………………………………………………………….1
1.1.1 Honey Composition and Characteristics……………...…………………...2
1.1.2 Honey Beneficial Properties…………………………...………………….6
1.2 Resistant Starch: Properties and Benefits………………………………………..........8
1.3 Spray Drying………...……………………………………………………………….11
1.3.1 Principle………………………………………………………………….12
1.3.2 Working…………………………………………………………….........12
1.4 Bread: General Introduction…………………………………………………………14
1.4.1 Bread Ingredients and Function…………………………………….........14
1.4.2 Bread Baking…………………………………………………….............16
1.4.3 Staling……………………………………………………………………17
CHAPTER 2 CHARACTERIZATION OF LOUISIANA HONEY AND PRODUCTION OF
SPRAY-DRIED HONEY POWDER…………………………………………………………....20
2.1 Introduction……………………………………………………………………..........20
2.2 Materials and Methods………………………………………………………….........23
2.2.1 Physico-chemical Characterization of Liquid Honey.…………………...24
2.2.1.1 pH, °Brix, Moisture, Specific Gravity and Color.…………..........24
2.2.1.2 HPLC Analysis for Sugar Content…………………………….....25
2.2.1.3 Rheological Study………………………………………………..25
2.2.2 Spray Drying of Liquid Honey Using Retrograded Starch as Drying
Agent...……………………………………………………………….......26
2.2.3 Characterization of Spray-dried Honey Powder………….……………...27
2.2.3.1 Color………………………………………………………..........27
2.2.3.2 Moisture Content...……………………………………………....27
2.2.3.3 HPLC Analysis for Sugar Content.……………………….….......27
2.2.3.4 SEM Analysis for Particle Morphology……..…………………..28
2.3 Results and Discussion…………………………………………………………........28
2.3.1 Physico-chemical Characterization of Louisiana honey………………...28
2.3.2 Characterization of Spray-dried Honey Powder…………………............34
2.4 Conclusion…………………………………………………………………………...38
CHAPTER 3 DEVELOPMENT OF A BREAD FORMULATION WITH HONEY POWDER
AND ITS CHARACTERIZATION……………………………………………………………..39
3.1 Introduction……………………………………………………………………..........39
v
3.2 Materials and Methods………………………………………………………….........40
3.2.1 Bread Formulation……………………………………...…………..........40
3.2.2 Characterization of Flour Mixture….………………..…………………..41
3.2.2.1 Rapid Visco Analyzer (RVA)………………………………........41
3.2.3 Bread Preparation………………………………………………………...42
3.2.4 Bread Characterization and Storage Study………..……………………..42
3.2.4.1 Loaf volume, Specific volume and Density …………………......42
3.2.4.2 Weight Loss………………………………………..……….........43
3.2.4.3 Crumb and Crust Color……………………………..……………43
3.2.4.4 Crumb and Crust Moisture…………………………...…………..44
3.2.4.5 Analysis of Texture……………………………………...…….....44
3.2.4.6 Condition for Ageing Tests and Model Used to Describe
Staling………………………………………………………..…..44
3.2.4.7 Differential Scanning Calorimetry (DSC)...……………………..45
3.3 Results and Discussion……………………………………………………………....45
3.3.1 Physico-chemical Characterization of Bread…………………………….45
3.3.2 Study of Staling During Storage..………………………………………..56
3.4 Conclusion…………………………………………………………………………...61
CHAPTER 4 SUMMARY AND CONCLUSION………………………………………………62
REFERENCES…………………………………………………………………………………..64
APPENDIX 1:RVA GRAPH AND RESULTS OF TEXTURE PROFILE ANALYSIS……….75
APPENDIX 2: RESULTS OF DSC ANALYSIS………………………………………………..79
APPENDIX 3: SAMPLE GRAPHS OF DSC CURVES………………………………………..81
VITA……………………………………………………………………………………………..83
vi
LIST OF TABLES
Table 2.2.1 USDA color designation………………………………………………….………....23
Table 2.3.1 pH, °Brix, %moisture and specific gravity of liquid honey…………………...........29
Table 2.3.2 Color…………………………………………………………………………...........30
Table 2.3.3 Sugar Content (20°C)……………………………………………………………….31
Table 2.3.4 Apparent viscosity values of honey samples at different temperatures
(20-60°C)…………………………………………………………….……………....32
Table 2.3.5 Consistency index,K (Pa sn)and flow behavior index, n (dimensionless)
values for Power law model……………………………………………………….…33
Table 2.3.6 Activation energy values of honey samples at different temperatures
(20-60°C)……………………………………………………………………………..34
Table 2.3.7 Color values of honey powder samples………………………………………..........35
Table 2.3.8 %Moisture content of honey powder samples…………………………....................36
Table 2.3.9 Sugar content of honey powder samples by HPLC………………………………....37
Table 3.2.1 Bread formulations…………………………………………………………….........41
Table 3.3.1 RVA analysis for flour samples………………………………………………..........46
Table 3.3.2 Loaf volume, Density, Specific density and %Weight loss of bread samples
(Day 0)……………………………………………………………………………....48
Table 3.3.3 Crumb color L*, a* and b* values of bread during storage…………………………49
Table 3.3.4 Crust color L*, a* and b* values of bread during storage……………………..........50
Table 3.3.5 Moisture content (%) values of bread crumb…………………………………..........51
Table 3.3.6 Moisture content (%) values of bread crust…………………………………………51
Table 3.3.7 Time constant values of bread samples………………………………………..........57
vii
LIST OF FIGURES
Figure 1.1 Structure of monosaccharides, glucose and fructose…………………………………..3
Figure 2.1 Graphical representation of Arrhenius equation……………………………………...33
Figure 2.2 SEM images at 1000X magnification of (A) HP1 (B) HP2 (C) HP3 (D) HP4............37
Figure 3.1 Firmness changes during 12 day storage of control, HNY, SHP and HP breads.........53
Figure 3.2 Resilience changes during 12 day storage of control, HNY, SHP and HP
breads……...................................................................................................................53
Figure 3.3 Cohesiveness changes during 12 day storage of control, HNY, SHP and HP
breads….......................................................................................................................54
Figure 3.4 Springiness changes during 12 day storage of control, HNY, SHP and HP
breads……………........................................................................................................55
Figure 3.5 Chewiness changes during 12 day storage of control, HNY, SHP and HP
breads……..................................................................................................................55
Figure 3.6 Evolution of Young‘s modulus of bread samples during storage………………........56
Figure 3.7 Changes in onset temperature (To) of bread samples over 12 days storage
period…...…………………………………………………………….……………...58
Figure 3.8 Changes in peak temperature (Tp) of bread samples over 12 days storage
period……...…………………………………………………………………………58
Figure 3.9 Changes in conclusion temperature (Tc) of bread samples over 12 days storage
period…...……………...………………………………………………………….…59
Figure 3.10 Changes in glass transition temperature (Tg) of bread samples over 12 day storage
period………………..…...…………………………………………………………..59
Figure 3.11 Changes in enthalpy (ΔH) of bread samples over 12 days storage
period…..……………………………………………………………….……………60
Figure 3.12 Changes in freezable water content (FW) of bread samples over 12 days storage
period…………………..…………………………………………………………….60
viii
ABSTRACT
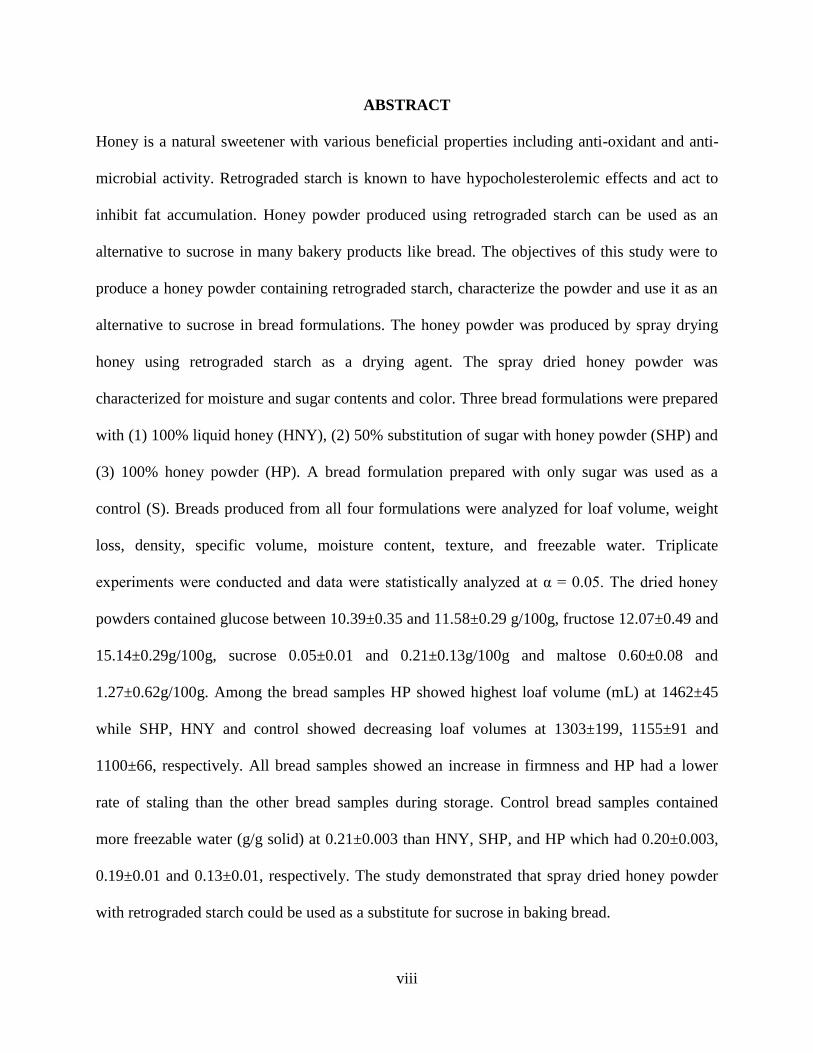
Honey is a natural sweetener with various beneficial properties including anti-oxidant and anti-
microbial activity. Retrograded starch is known to have hypocholesterolemic effects and act to
inhibit fat accumulation. Honey powder produced using retrograded starch can be used as an
alternative to sucrose in many bakery products like bread. The objectives of this study were to
produce a honey powder containing retrograded starch, characterize the powder and use it as an
alternative to sucrose in bread formulations. The honey powder was produced by spray drying
honey using retrograded starch as a drying agent. The spray dried honey powder was
characterized for moisture and sugar contents and color. Three bread formulations were prepared
with (1) 100% liquid honey (HNY), (2) 50% substitution of sugar with honey powder (SHP) and
(3) 100% honey powder (HP). A bread formulation prepared with only sugar was used as a
control (S). Breads produced from all four formulations were analyzed for loaf volume, weight
loss, density, specific volume, moisture content, texture, and freezable water. Triplicate
experiments were conducted and data were statistically analyzed at α = 0.05. The dried honey
powders contained glucose between 10.39±0.35 and 11.58±0.29 g/100g, fructose 12.07±0.49 and
15.14±0.29g/100g, sucrose 0.05±0.01 and 0.21±0.13g/100g and maltose 0.60±0.08 and
1.27±0.62g/100g. Among the bread samples HP showed highest loaf volume (mL) at 1462±45
while SHP, HNY and control showed decreasing loaf volumes at 1303±199, 1155±91 and
1100±66, respectively. All bread samples showed an increase in firmness and HP had a lower
rate of staling than the other bread samples during storage. Control bread samples contained
more freezable water (g/g solid) at 0.21±0.003 than HNY, SHP, and HP which had 0.20±0.003,
0.19±0.01 and 0.13±0.01, respectively. The study demonstrated that spray dried honey powder
with retrograded starch could be used as a substitute for sucrose in baking bread.
1
CHAPTER 1 LITERATURE REVIEW
1.1 Honey: General Introduction
The Codex Alimentarius Commission (1981) defines honey as ‗‗the natural sweet substance
produced by honey bees from nectar of blossoms or from secretions of living parts of plants or
excretions of plant sucking insects on the living part of plants, which honey bees collect,
transform and combine with specific substances of their own, store and leave in the honey comb
to ripen and mature‘‘. Honey is the oldest and only available unique natural sweetener to
mankind and is the last of natural unprocessed food to be consumed (Bogdanov and others 2008;
Ouchemoukh and others 2010). The mention of honey dates back to as long as 2100-2000 B.C in
a Sumerian tablet which proclaims the use of honey as a drug and ointment. The Bible also
mentions King Solomon‘s words ―Eat honey my son, because it is good‖ (Old Testament,
proverb 24:13). Bee honey has significant nutritional and prophylactic-medicinal value (Juszczak
and Fortuna 2006). Honey can be produced from the nectar of flowers or from honeydew and in
some cases can even be a combination of both (Juszczak and Fortuna 2006). When derived from
the nectar of flowers honey is known as nectar or blossom honey and can be further categorized
as mono/unifloral honey and multifloral honey whereas honey produced from honeydew is
known as honeydew honey (Ouchemoukh and others 2007). Nectar honeys are classified as
monofloral and multifloral based on the pollen content analyzed by microscopic analysis which
is known as mellisopalynological studies. Monofloral honeys are those whose pollen frequency
from a single plant species is above 45% unless the pollen grains are ―under- or over-
represented‖ in which case around 10-46% is accepted as in Lavender, Citrus and Rosemary
honeys (Felsner and others 2004). Honey produced from Eucalyptus, Castanea and Myosotis the
pollen content is over-represented for a monofloral honey (Ouchemoukh and others 2007).
2
Honeydew honeys on the other hand are produced when bees ingest honeydew which is a sugar
containing substance that is excreted by other insects which feed on plants (Ouchemoukh and
others 2007).
The annual production of honey globally in the year 2008 was 1.2 million tons which was less
than 1% of the sugar production. China is the largest producer of honey though its consumption
is not the highest. The European Union countries have the largest per capita consumption of
honey with Germany, Austria, Switzerland, and Poland (1 – 1.8 kg) leading within the continent
where as Italy, France, and Great Britain have a moderate (0.3 – 0.4 kg) per capita consumption.
USA, Canada and Australia have a per capita consumption of 0.8-0.9 kg (Bogdanov and others
2008). In the year 2009 144.1 million pounds of honey was produced in the United States of
America with Louisiana producing 3.8 million pounds, an increase of 24% from 2008 (NASS,
USDA 2011).
1.1.1 Honey Composition and Characteristics
Honey is an extremely complex mixture of carbohydrates that is found naturally (Swallow and
Low 1990) with almost 70-80% sugars, 10-20% water and other minor constituents such as
organic acids, mineral salts, vitamins, proteins, phenolic compounds, lipids and free amino acids
(Gomes and others 2010; Ouchemoukh and others 2007). Honey maturity, the manner of
production, processing and storage climatic conditions of the region of production and the nectar
source have a substantial influence on the quality, composition and biochemical properties of
honey (Guler and others 2007; Anupama and others 2003). The composition of honey in turn
influences its physicochemical properties such as viscosity, hydroscopicity and granulation
(Lazaridou and others 2004).
3
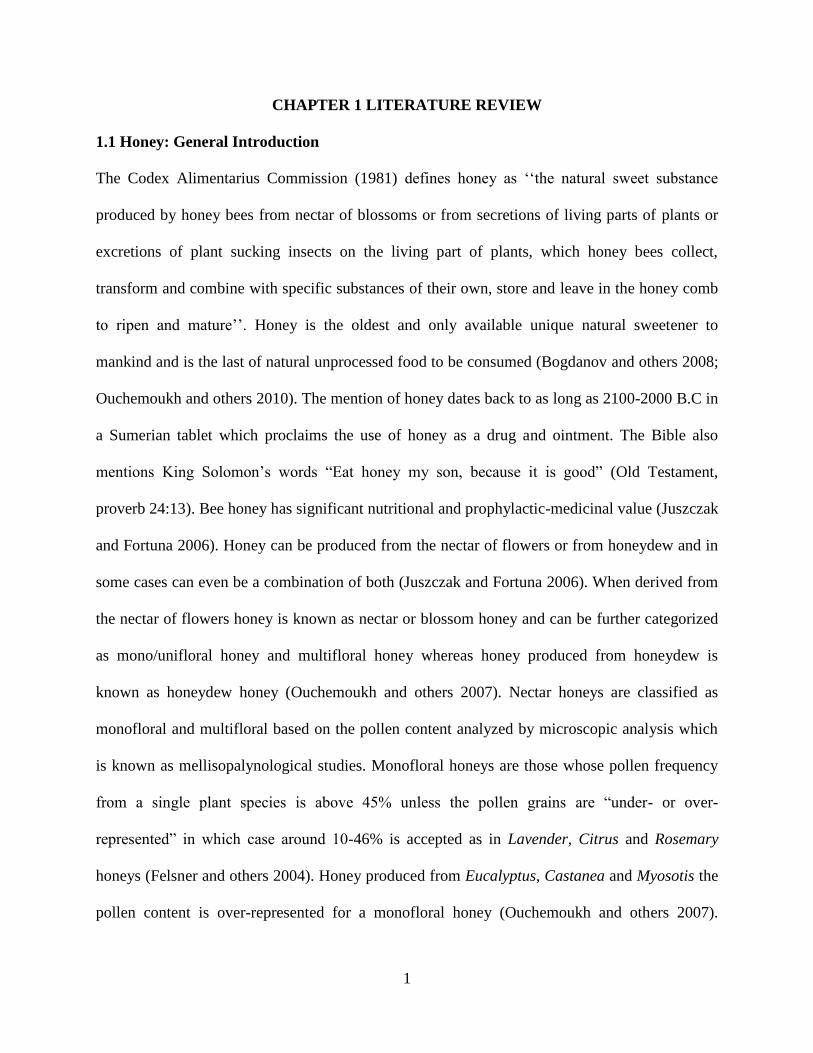
Figure 1.1 Structure of monosaccharides, glucose and fructose
(Source: http://www.lewrockwell.com/orig5/mercola31.1.html)
Sugars predominate the composition of honey and among them glucose and fructose are the
prominent monosaccharides (60-85% of honey solids) which account for 85-95% of the honey
carbohydrates (Swallow and Low 1990; Lazaridou and others 2004). Generally fructose is
present in higher concentrations than glucose with the exception of honeys produced from plants
like rape (Brassica napus), dandelion (Taraxacum officinale) and blue curls (Trichostema
lanceolatum) (White 1976). The ratio of fructose to glucose on an average is 1.2:1 (Rodriguez
and others 2004). Granulation of honey occurs due to spontaneous crystallization of the
predominant sugars with glucose crystallizing first due to its lower solubility in water thus
producing nucleation seeds in the form of glucose monohydrate (Venir and others 2009;
Lazaridou and others 2004). Crystallization leads to an increase in the water content of the honey
which causes an increase in the water activity, sometime over 0.60 which is the critical threshold
for microbial stability (Venir and others 2009). This change in water activity allows the
osmophylic yeasts present in honey to multiply thereby causing fermentation of honey and a
decrease in its shelf life (Cui and others 2008). Crystallization affects the quality and textural
properties of honey making it undesirable and in some cases could also cause corrosion of metal
containers in which honey is stored (Lazaridou and others 2004; Cui and others 2008). The
4
important disaccharides present are maltose and sucrose (7-10%) (Cui and others 2008). An
increase in sucrose content in the honey can occur when bees are over fed with sucrose by bee
keepers (Anklam 1998). Azeredo and others (2003) reported that sucrose content also increased
when the honey is harvested very early in fall thereby not giving the enzyme invertase enough
time to convert sucrose to fructose and glucose. Honey also contains other low molecular weight
oligosaccahrides like melezitose, trehalose panose and turanose (Cui and others 2008; Bogdanov
2008).
Proteins account for 0.5-1% of the honey composition with proline constituting 50-80% of the
total amino acids (Ouchemoukh and others 2007). Proline is produced during the conversion of
nectar to honey by the honeybee and serves as an indicator of honey ripeness, and saccharose
and glucose oxidase activities (Hermosin and others 2003). There are 26 other amino acids
present in honey whose concentrations depend on the floral source in case of nectar honey and
also if the honey is of honeydew origin (Hermosin and others 2003). The important enzymes
present in honey are diastase (amylase), invertase (α-glucosidase) and glucose oxidase while
catalase and acid phosphatase are present in lower amounts (National Honey Board 2005).
Estevinho and others (2008) reported that the phenolic compounds present in honey are
flavonoids and phenolic acids which can also serve as markers for determining the botanical
origin of honey. They also reported that the phenolic acids were divided into two subclasses:
substituted benzoic acids and cinnamic acids while the flavoids were divided into three classes
with structural similarity namely flavonols, flavones and flavanones. The phenolic compounds
contribute to the beneficial properties of honey due to their anti-oxidant nature (Estevinho and
others 2008).
5
By international legislation the moisture content of honey should be less than 20-21% (Silva and
others 2009; Mendes and others 1998) and generally average moisture content of honeys from
different parts of the world ranges between 16-19% (Yanniotis and others 2006; Al-Khalifa and
Al-Arify 1999; Juszczak and Fortuna 2006). The low moisture of honey causes a decrease in its
water activity as water activity shows a linear dependency on water content (Abramovic and
others 2008). Generally water activity of honey is within the range of 0.5-0.65 which is very low
for most micro-organisms to grow since molds need around 0.70, yeast around 0.80 and bacteria
0.90 to grow (Gleiter and others 2006). Natural micro-flora of honey includes osmophillic yeasts
of which the Sacchromyces ssp. are dominant, and have the ability to grow at low water activities
of around 0.61-0.62 (Zamora and others 2005). When the water content of honey increases
during storage due to granulation, the yeasts start fermenting the honey by acting on the glucose
and fructose to produce ethanol and carbon dioxide (Zamora and others 2005; Gleiter and others
2006). The pH of acids is also a limiting factor to the growth of micro-organisms since generally
honeys are of acidic pH in the range of 3.6-5 (Al-Khalifa and Al-Arify 1999; Ahmed and others
2007; Gomes and others 2010). The acidity of honey is contributed to the presence of organic
acids, mostly gluconic acid and inorganic acids ions such as phosphate and chloride
(Ouchemoukh and others 2007). However honey does have several sources of microbial
contamination, primarily pollen, the digestive tract of honey bees, dust, air, and secondary
sources maybe during handling and processing of honey (Snowdon and Cliver 1996). These
micro-organisms include fungi such as Penicillium and Mucor, yeasts such as Saccahromyces,
Schizosaccharomyces and Torula, molds and spores of Bacillus spp. and Clostridium spp.
(Migdal and others 2000). Not many studies are devoted to the microbial contamination of
honeys and most of them concentrate on Clostridium botulinum (Gomes and others 2010) since
6
the presence of Clostridium spores pose a risk of contracting botulism in infants who consume
the honey (Finola and others 2007).
Viscosity of honeys is an important property that has been studied by various researchers
(Sopade and others 2002; Junzheng and Changying 1998; Yoo 2004; Yanniotis and others 2006;
Bhandari and others 1999; Lazaridou and others 2004). Viscosity has an influence on the
physico-chemical and sensory properties of honey (Juszczak and Fortuna 2006) and knowledge
about the rheological properties of honey is useful in its processing, handling and storage
(Ahmed and others 2007). Viscosity of honey depends on factors such as temperature, water
content, chemical constitution, amount and size of crystals, and types of colloids present in it
(Juszczak and Fortuna 2006; Yoo 2004). Effect of temperature on viscosity is generally
documented since a variety of temperature ranges are encountered during the processing, storage
and handling of honey (Yoo 2004). Generally honey is considered to exhibit Newtonian behavior
(Al-Malah and others 2001; Sopade and others 2002; Bhandari and others 1999; Zaitoun and
others 2001) but there are a few reports about non-Newtonian behavior of honey (Ahmed and
others 2007; Juszczak and Fortuna 2006).
1.1.2 Honey Beneficial Properties
The benefits of honey are many and it has been long used both as a source of nutrients and also
as a medicine (Bogdanov and others 2008). A branch of medicine known as apitherapy has
developed in recent years which utilize honey and its product in stimulation of wounds and burn
healing and also in gastric and ulcers treatment (Bogdanov and others 2008; Ouchemoukh and
others 2007). Anti-oxidant properties of honey are due to the presence of compounds such as
pinocembrin, pinobanksin, chrysin and galagin (Cui and others 2008). Anti-oxidants are believed
to protect against oxidation which is important for the prevention of chronic diseases (Ames and
7
others 1993). Studies conducted by Schramm and others (2003) and Al-Waili (2003) showed that
consumption of honey increased antioxidant levels and decreased serum levels and they also
increased Vitamin C concentration by 47%, β-carotene by 3%, uric acid by 12% and glutathione
reductase by 7%. However even the antioxidant activity of honeys is heavily influenced by the
botanical origin of honey (Al-Mamary and others 2002).
Glycemic index (GI) is an important indicator of the carbohydrate level in a food which bears a
relation with the blood glucose level (Bogdanov and others 2008). A lower value of glycemic
index is indicative of the ability to induce only a small increase in blood glucose level and vice
versa. The only available data on honey GI is that of Australian honeys which was determined to
be an average of 58 (Brand-Miller 1995). However this was of blended honeys (nectar and
honeydew honey) rather than individual honeys from floral sources. Arcot and Brand Miller
(2005) carried out studies to determine the GI of nectar honeys and reported that most nectar
honeys were within the low GI range (55 or less) or intermediate GI range (56-69). However
some blend honeys were in the high GI range (70 and above). The study also reported that the GI
value of a honey was negatively correlated to its fructose content and hence honeys with higher
fructose showed lower GI values. Fructose is absorbed more slowly than glucose from the
gastrointestinal tract which causes only a minimal rise in the blood sugar levels (Jeffrey and
Echazarreta 1996). Also the glycemic index of fructose is 19 which is very low when compared
to that of sucrose which is 68 (Bogdanov 2010). Studies conducted by various researchers have
shown that honey could be tolerated by patients afflicted with either types of diabetes i.e. type I
and type II (Katsilambros and others 1988; Samanta and others 1985).
Honey also exhibits antimicrobial, antiviral, antiparasitic, antimutagenic and anti-inflammatory
properties (Bogdanov 2008). Honey was seen to affect the levels of antibodies produced against

8
thymus dependent antigens in mice and sheep (Al-Waili and Haq 2004). Al-Waili 2003 reported
that consumption of honey by humans on a 1.2g/kg body weight daily showed an increase of the
following in their blood serum: monocytes (50%), iron (20%), copper(33%), and a slight
increase in lymphocytes, eosinophils, zinc, magnesium, and hemoglobin. The study also reported
a reduction in ferritin (11%), immunoglobulin E (34%), aspartate transaminase (22%), alanine
transaminase (18%), lactic acid dehydrogenase (41%), creatine kinase (33%) and fasting sugar
(5%).
Application of honey in food products is attributed to its properties such as antimicrobial and
antioxidant nature. They prevent the spoilage of meat due to microbial growth or lipid oxidation
as in the case of meats (Antony and others 2000; Nagai and others 2006). Honey also has the
ability to prevent enzymatic browning of sliced fruits such as apple (Oszmianski and Lee 1990),
in raisins (Mclellan and others 1995) and in vegetables (Chen and others 2000) too. They are
used for clearing fruit juices and fruit drinks (Lee and others 1990; Oszmianski and Lee 1990).
Shin and Ustunol (2005) reported that the presence of honey in yogurt not only enhanced the
growth of indigenous bifidobacteria in the GI tract but also inhibited the growth of C.perfringes
and E. aerofaciens. Honey has a diverse application in the bakery, cereal and confectionary
industry (Bogdanov 2010). It is assumed that the advantages of adding honey to a product
include moisture retention, good texture, improved baking, flavor and sensory properties
(Bogdanov 2010).
1.2 Resistant Starch: Properties and Benefits
Resistant starch (RS) was first recognized due to the complication that it rendered during the
determination of total dietary fiber levels by the Prosky method since it was clear that any starch
that interfered with the assay was not a traditional fiber (Englyst and others 1987). Resistant
9
starch maybe defined as the non-digestible fraction of starch and starch products which are not
hydrolyzed to D-glucose in the small intestine within 120 minutes of ingestion but instead
ferments in the colon (Fuentes-Zaragoza and others 2010). RS is a linear chain molecule of α-
1,4-D-glucan which is derived from retrograded amylase fraction and has low molecular weight
of around 1.2x10⁵Da (Tharanathan 2002). RS has a low water holding capacity which helps
processing and it enhances organoleptic qualities of food (Sozer and others 2002). Due to its
increased expansion, enhanced crispiness and reduced oil pick up in deep fried foods
(Tharanathan 2002) when used as a replacement for or as a complement to natural fiber in which
case it would be labeled ‗dietary fiber‘ (Sozer and others 2007). RS does not have a discernible
effect generally on the sensory properties of the final product which is an added advantage when
it comes to consumer acceptability of the product (Perez-Alvarez 2008a). The inability of RS to
be digested is due to various factors and is dependent on these factors that resulting in the
following categories:
i. RS1: the compact molecular structure of RS1 restricts the digestive enzymes from
reaching and digesting them (Haralampu 2000).
ii. RS2: the starch granules are so structured that digestive enzymes are prevented from
catabolizing them in the ungelatinized form (Nugent 2005). The high density and partial
crystallinity render them resistant to enzyme degradation (Gallant and others 1992)
iii. RS3: the starch granules are first disrupted by heating during gelatinization during which
stage they are accessible for digestion by enzymes. Then by rapid cooling the gels form
starch crystals which are indigestible by the enzyme and these starches are known as
retrograded starches (Fuentes-Zaragoza and others 2010).
10
iv. RS4: certain starches are resistant to digestion due to chemical modification by various
processes such as etherization, esterization or cross-bonding (Lunn and Buttris 2007).
RS3 is studied more due to its thermal stability which allows it to be applied in a wide range of
cooked products at varying temperatures in conventional foods (Haralampu 2000). RS3
comprises retrograded amlyose whose prolonged intake improves fasting triglyceride and
cholesterol levels as opposed to a parallel amylopectin-rich diet (Mikulikova and others 2008).
RS3 can form B-type crystalline structure when wheat starch is gelatinized fast at 68°C and then
retrograded, while a slower crystallization at 100°C yielded A-type RS3 (Eerlingen and others
1993). Since RS3 is composed mainly of amylose its melting temperature would correspond to
that of high molecular weight crystalline amylose which is around 150°C (Shamai and others
2003). This is the reason RS3 is an extremely heat stable pre-biotic starch that can be used in
baked or high temperature cooked foods.
RS is physiologically beneficial to human health due to its pre-biotic nature. Prebiotics are non-
digestible food ingredients that help selectively stimulate the growth of one or more micro-
organisms in the gastro-intestinal tract thereby conferring beneficial health effects to the host
(Marteau 2001). Studies have shown that when the fermentation occurs in the colon the starch
produces short chain fatty acids including acetate, propionate and butyrate and results in the
increase in fecal bulk and lowers colonic pH (Casterline and others 1997; Silvester and others
1995; Philips and others 1995). The butyrate produced can reduce the risk of malignant changes
in cells as they have been shown to arrest one of the phases of the cell cycle (G1) (Sharma and
others 2008). Studies conducted by Liu and Xu (2008) have shown that the presence of RS
during the promotion phase in the middle and distal colon can retard the growth or development
of neoplastic lesions in the colon thus re-emphasizing the benefits of RS as a preventive measure
11
for colonic cancer. RS is also being studied to verify its ability to inhibit the accumulation of fat
and have hypocholesterolemic effects in humans since in rats it is known to raise the cecal size
and absorption of short-chain fatty acids, lower plasma cholesterol and triglyceride levels. There
was also a lower concentration of cholesterol in the lipoprotein fraction as well as decreased
triglyceride concentration in the triglyceride rich lipoprotein fraction (Sajilata and others 2006;
Nugent 2005). RS also has a low glycemic response which can help in decreasing overall
glycemic load of a food if it is replacing the existing carbohydrate (Nugent 2005). RS must be
consumed at a concentration of at least 14% of total starch intake in order to have the glycemic
and insulinaemic responses in the host (Brown and others 2003; Higgins 2004).
1.3 Spray Drying
Spray drying is a method for convective drying of liquids (Strumillo and Kudra 1986) which has
been in operation for over a century but is still an active field of interest for continuous
innovation given the demand for better quality product (Vehring and others 2007). Spray drying
was first recorded in a patent by Samuel Perry in 1872 (Bhandari and others 2008). The process
involves the transformation of feed slurry into a dried particulate form by spraying in a hot
drying medium which is generally air (Goula and Adamopoulos 2005). This technology has
application in varied fields including food and dairy industries, pharmaceutical, agrochemical,
light and heavy chemicals, detergent, pigment, biotechnology and ceramics (Vehring and others
2007). Masters 1996 reported that there were more than 15000 industrial size spray dryers in the
world and almost double of that number in pilot plants and laboratories. According to Bhandari
and others (2008) some of the key advantages of spray drying are
i. Particles of predetermined characteristics (moisture, size, density etc) and type (particles,
granules and agglomerates) can be produced.
12
ii. Heat spoilage is relatively small in the product due to the extremely short exposure time,
the cooling effects in a critical drying period and also due to evaporation of solvent phase
at a temperature lower than its normal boiling point. Thus heat sensitive and heat resistive
products can be spray dried using the machine.
iii. The process is versatile with the ability to use the same equipment for a variety of
different products.
iv. Spray drying is a continuous process with high production rates which makes it
economical and also the product is produced in the desired powdered form thereby
requiring no additional grinding.
The disadvantages of the process includes high cost of sophisticated atomizing and dust
collecting devices and large dimensions of installment.
1.3.1 Principle
Masters (1972) stated that the basic physical principle of spray drying can be summed in the
phrase ―evaporation causes cooling‖. The homogeneity of the spray followed by atomization and
high rate of moisture evaporation enable the dried product to be at a temperature that is
significantly lower than that of the air that leaves the drying temperature. Thus the product does
not undergo extremely high heating temperatures and when it separates from the drying air it
leaves so without any heat degradation. Dryer design and operation along with chemical and
physical characteristics of food determine the characteristics of the final product.
1.3.2 Working
The process of spray drying consists of the following four fundamental steps (Gharsallaoui and
others 2007):
i. Atomization
13
ii. Droplet-hot air contact
iii. Evaporation of droplet water
iv. Dry product–humid air separation
Atomization involves the formation of a spray due to pressure or centrifugal force and
establishing contact between the spray and the drying air. The next stage can occur in two
different ways: co-current or counter current. In co-current the spray and hot air have the same
direction of flow which results in powders being exposed to moderate temperatures. However in
counter current the flow of spray and hot air are in the opposite directions which causes the
powder to be exposed to higher temperatures which limits the application of this method to heat
stable products. However the latter is more economic in terms of energy consumption when
compared to the former. The third stage is the critical stage where the actual drying takes place.
Initially moisture from the surface gets lost due to heat and moisture from the inside of the
droplet moving towards the surface to make up for the lost moisture. This continues till no more
moisture can be lost from the surface and drying starts occurring with a crust formation. Then
moisture moves along this crust and dries the droplet as it does so. Finally a dried powder is
obtained. This powder gets separated in the final step into two collection points. The first point is
right below the drying chamber where the particles settle down and the next collecting point is
below a cyclone separator where the lighter particles get separated from the dust and settle down.
Spray dryers are also fitted with filters known as ―bag houses‖ that remove the finest powders
and chemical scrubbers that remove any remaining powders or volatile pollutants. (Masters
1972; Strumillo and Kudra 1986).
14
1.4 Bread: General Introduction
Bread is an essential basic dietary product that dates back to the Neolithic era with the first bread
being made around 10,000 BC or over 12,000 years in the past (Mondal and Datta 2008). The
importance of bread is due to its contribution to a well balanced diet given its starch and complex
carbohydrate content (Altamirano-Fortoul and Rosell 2011). Bread has been used to exercise
political influence for at least 2000 years and even in modern times a shortage of bread is
synonymous with difficult times whereas a promise of bread is used as an indication for an
enriched life (Scanlon and Zghal 2001). Bread plays an important role in different countries for
both cultural and dietary reasons; for example 30% of the daily requirement of calories and
proteins is provided by bread in the Russian diet (Samsonov and Petrasov 1993) while in Ghana
bread is eaten daily as part of the cultural practice (Ellis and others 1997).
1.4.1. Bread Ingredients and Function
Bread is a solid that is ―soft‖ by nature (Scanlon and others 2000) and comprises two main
phases at the macroscopic level – air (fluid) and cell wall material (solid) (Scanlon and Zghal
2001). Water and flour affect the texture and crumb the most in bread and hence are considered
the most important ingredients (Mondal and Datta 2008). The flour is always 100% and all other
ingredients are added on a percentage weight basis of that amount by weight. Flour
characteristics is an important parameter that affects bread type and though this largely depends
on the type of wheat crop, the flour should possess certain characteristics to be considered good
for baking bread. Flour contains two proteins which when they come into contact with water that
help in formation of gluten. There should be at least 11% of gluten to make bread with good
baking quality. Water used for making dough should be of medium hardness as soft water gives
sticky doughs with poor gas retention and should constitute at least 50% of the flour amount.
15
Most artisan bread formulas have 60% to 75% of water added to them. An increase in the water
percentage also leads to an increase in the levels of CO2 produced in yeast breads and also a
coarser bread crumb.
Other ingredients added to bread are leavening agent yeast (2%), sugar (4%), salt (2%), and a
shortening agent such as margarine or butter (3%). The yeast which is a commercial baker‘s
yeast Saccharomyces cerevisiae causes fermentation of the sugar in the dough and converts it to
moisture and CO2 (Mondal and Datta 2008). The moisture and CO2 is incorporated into the
gluten structure of the dough and during the final proofing (rising of dough) the dough increases
in volume and gives a porous and light product. The expansion of water and CO2 occurs due to
high temperatures and this acts as an insulating agent and prevents a high rate of temperature
increase in the bread crumb thus preventing excessive loss of moisture from occurring. Sugar in
some cases is added for sweetening but usually it is present in order to provide a substrate for the
yeast to act upon. However if large volumes of sugar is added it causes the yeast cells to
dehydrate and reduce dough volume (Vaclavik and Christian 2003). Addition of salt besides
contributing to flavor also causes dehydration of yeast cells which in turn controls their growth
and CO2 production (Vaclavik and Christian 2003). The shortening agent helps increase the
slicability of the final bread product (Mondal and Datta 2008). Fresh bread is characterized by an
appealing brownish and crunchy crust with a pleasant aroma, good slicing characters and a soft
and moist crumb texture (Giannou and others 2003).
Milk is also added in some bread formulations due to its ability to enrich and improve the
nutritional value of food. Other ingredients that maybe added are certain emulsifiers, enzymes,
soy flour, oxidants and reductants (Kent and Evers 1994) due to an increase in consumer demand
for high quality and longer shelf life baked product with added health benefits (Stampfli and
16
Nersten 1995). These ingredients improve the machinability, rate of hydration, crumb structure,
gas holding capacity and keeping quality of bread (Mondal and Datta 2008; Leon and others
2002).
1.4.2 Bread Baking
Baking is a complex physicochemical process that involves a set of processes which must be
carried out in a specific period of time and in a specific sequence (Fu 2006). It begins with the
mixing and kneading of the dough, followed by fermentation of the dough which allows
biochemical and chemical modifications to occur to the polymers in dough. During fermentation
the CO2 produced causes leavening (Scanlon and Zghal 2001). This is then followed by the
moulding and proofing step where the dough is allowed to rise and expand in volume (Kent and
Evers 1994). This is followed by baking where a lot of reactions and changes occur
simultaneously. The proteins present in the flour and any other ingredient aggregate causing
them to harden (Scanlon and Zghal 2001) while simultaneously gelatinization of the starch
molecules occurs due to moisture absorption (Vaclavik and Christian 2003). Evaporation of
water occurs while creating an outer crust which turns brown due to the Maillard browning
reaction (Vaclavik and Christian 2003).
Mondal and Datta (2008) reported in their review 3 methods by which baked products including
bread is produced:
1. Straight dough method: in this method all the ingredients are mixed in a single step and
kneaded together in the dough.
2. Sponge and dough method: in this method the ingredients of the dough are mixed in two
different steps where in the first step only the leavening agent in mixed into the flour
17
along with a certain amount of water and the dough is left to rise and develop for a couple
of hours. In the second step the rest of the ingredients are mixed into the flour.
3. Chorleywood method: in this method all the ingredients are mixed together in a single
step but the mixing is done for a few minutes using an ultrahigh mixer.
The process of making dough and baking bread have received attention since it is believed that
modifications in these processes may affect the keeping quality of bread and delay its staling
while simultaneously exploring the relationships between bread quality and temperature and
holding time (Giannou and others 2003).
1.4.3 Staling
Staling is the collective physical, chemical and sensory changes that occur after baking during
the storage period which is characterized by the change in flavor, an increasing ―stale‖ odor and
crumb firming (Gellynck and others 2009; Altamirano-Fortoul and Rosell 2011). Contrary to
other food products, in bread, staling is of major concern rather than spoilage due to micro-
organisms or endogeneous enzyme activity (Barcenas and Rosell 2005). Staling represents one
of the primary reasons for economic losses in the bread industry due to consumer apprehension
in using such products. It is estimated that in a market where 20 billions of bread is produced
annually at least 600million (3%) is lost due to staling problems (Lai and Lin 2006). The
phenomenon of staling has been under investigation for around 150 years (Gerrard and others
1996) and yet its complex mechanism hasn‘t been fully understood and remains a subject of
intensive study (Lodi and others 2007; Ribotta and Bail 2007; Curti and others 2011; Le-Bail and
others 2009).
Crumb firming is the major indicator of staling from a consumer‘s perception. However staling
occurs both, at the crust and crumb. Crust staling is characterized by a soft leathery appearance
18
due to moisture migration from the crumb to crust (Lai and Lin 2006). Crumb staling is also
characterized by the loss of suppleness and increased opaqueness. The crumb becomes more
granular and grainy to touch with the ability to crumble easily and a decreased tendency to be
pleasant to chew given the fact that it is less easily moistened (Calvel and others 2001). Bread
staling is attributed to many factors with the major ones including starch retrogradation
specifically amylopectin, water migration and interaction between starch gluten and gluten
proteins (Lai and Lin 2006). Starch retrogradation is only partially responsible for staling with
water distribution playing a major role both at the macroscopic and microscopic level. At the
macroscopic level it involves the migration of water from the crumb to the crust whereas at the
molecular level it may be integrated into the retrograded amylopectin matrix or may be the
decreasing freezable water content (as determined by DSC), or migrate from the gluten to starch
which causes elasticity loss in the bread crumb (Curti and others 2011). A uniform water
distribution in the bread matrix has been shown to decrease staling rate and could have an impact
on slowing the amylopectin retrogradation rate as the process requires water (Lodi and others
2007). Understanding this phenomenon is important and many techniques have been used to try
explain it like DSC (Ribotta and Bail 2007), NMR (Curti and others 2011), and MRI (Lodi and
others 2007).
Numerous studies have been devoted to the retardation of staling bread and prolonging its
keeping quality with the addition of anti-staling agents being central to most of the studies
(Altamirano-Fortou and Rosell 2011; Mandala and others 2007; Moayedallaie and others 2010;
Stampfli and Nersten 1995). Anti-staling agents include lipids and emulsifiers (sodium stearoyl-
2-lactylate and diacetyl tartaric acid esters of monoglycerides), pentosans, alcohol (ethanol) and
sugars (Pateras 2007). However rather than adding additives it is advisable to adjust the bread-

19
making process by studying the role of each ingredient and their interaction with each other thus
leading to an improved baking performance (Schiraldi and Dimitrios 2000).
20
CHAPTER 2 CHARACTERIZATION OF LOUISIANA HONEY AND PRODUCTION
OF SPRAY-DRIED HONEY POWDER
2.1 Introduction
Honey is a natural food product sweet to taste, with a yellowish or brown color, and a viscous
nature (Ahmed and others 2007; Abu-Jdayil and others 2002). Honey is known for both its
nutritional value and medicinal properties (Juszczak and Fortuna 2006). Honey is produced
either from the nectars of flowers or from honeydew. When obtained from a floral source honey
can be categorized as mono-floral or multi-floral depending on the species of flowers from where
the nectar was collected. It can also be categorized depending on its color. Honey is a complex
mixture of carbohydrates and contains organic acids and some amino acids, as well as certain
micro- and macro-elements, and it is a rich source of many biologically active compounds
(Gomes and others 2010; Juszczak and Fortuna 2006; Ahmed and others 2007). These bioactive
compounds include phenols such as flavonoids and phenolic acids which in some research has
shown to be a more potent anti-oxidant than vitamin C or E (Cao and others 1997). The anti-
oxidant activity of honey is due to the abundance of both enzymatic and non-enzymatic anti-
oxidants such as glucose-oxidase, catalase, flavonoids, ascorbic acid, phenolic acids and
carotenoids (Liviu Al and others 2009). Though the carbohydrate content may vary depending
on the floral source the major sugars in honey are always monosaccharides, namely glucose and
fructose. Additionally, small amounts of disaccharides like maltose, sucrose, trechalose,
isomaltose, nigerose, turanose, kojibiose and other are present (Bhandari and others 1999).
Characterization of honey in terms of its chemical, rheological and sensory properties has
received a lot of attention with numerous publications being released in a single year over the
same topic in different countries (Corbella and Cozzolino 2006; Juszczak and Fortuna 2006;
21
Ouchemoukh and others 2007; Yanniotis and others 2006). All of these properties are inter-
related and vary with plant species type, climate, region of collection, and honey maturity.
(Anupama and others 2003). Of these, the rheological properties of honey are very important as
they play an influential role in handling, processing, storage and quality control (Yoo 2004;
Kayacier and Karaman 2008). The rheological properties of honey also serve as an important
factor in providing information about the structural organization of food and also about its fluid
and heat transfer properties (Ahmed and others 2007). The rheological properties of honey
depend on 3 major factors — temperature, composition and water content (Abu-Jdayil and others
2002; Ahmed and others 2007). Viscosity of honey is seen to decrease with an increase in
temperature and in most literature has been reported as a liquid exhibiting Newtonian behavior
when steady shear viscosimetry is applied (Abu-Jdayil and others 2002; Juszczak and Fortuna
2006; Recondo and others 2006). However certain studies have been published wherein the
higher sensitivity of the rheometer has led to the detection of some amount of yield stress being
present in those foods previously accepted as Newtonian in nature (Ahmed and others 2007).
Commonly, the Arrhenius equation is used to describe the temperature dependency in honey
samples.
Liquid honey poses multiple problems in handling during processes involving mass production
due to its viscous and sticky nature thereby leading to a growing demand for dried honey powder
by both consumers and the food industry. Honey powder with its low moisture content has the
ability to be easily blended with other ingredients apart from other advantages including
convenience, ease of handling, reduced storage space, sanitation and storage for a longer period.
Various methods of drying honey have been used such as tunnel drying, vacuum drying, spray
drying and solidification into blocks by crystallization (Cui and others 2008). Drying of honey
22
however poses many problems such as low recovery rates due to its high sugar content (Wang
and Langrish 2009) and also utilization of at least 50-70% of additives to obtain a dried powder
(Cui and others 2008). Spray drying is a unit operation (Gharsallaoui and others 2007) that is
gaining popularity due to its application in a variety of fields such as food and dairy industries,
pharmaceutical, agrochemical, light and heavy chemicals, detergent, pigment, biotechnology and
ceramics (Vehring and others 2007). Spray drying of high sugar content liquids such as juices
and honey involves the use of additives that serve as drying agents such as maltodextrin and gum
Arabic (Cano-Chauca and others 2005; Wang and Langrish 2009). However commercially
available honey powders have up to 63% of maltodextrin which can cause an alteration in flavor
and texture which may be undesirable to consumers (Wang and Langrish 2009). Sahu (2008)
used three different drying aids - maltodextrin, glycerol monostearate (emulsifier) and tricalcium
phosphate (anti-caking agent) to produce honey powder from each by vacuum drying. Resistant
starch type 3, i.e. retrograded starches, in comparison to the above mentioned drying aids confer
health benefits and have the added advantage of being able to withstand high cooking
temperatures. Retrograded starch causes malabsorption of starches from the food thereby leading
to a lower rise in blood glucose level which could prove beneficial for diabetic patients.this
malabsorption of starch also implies a long-term benefit in controlling hyperlipaemia
(Haralampu 2000). Therefore utilization of such a starch as an additive for drying may be an
interesting area to explore.
Louisiana is one of the leading producers of honey in the United States yet, except for its
melissopalynological studies (Lieux 1972), there is little information about its properties in
literature. The objectives of this study were to: 1) characterize Louisiana honey based on it
physic-chemical properties and study its flow behavior 2) spray dry the honey so characterized
23
using retrograded starch as the drying agent to produce honey powder 3) characterize the spray-
dried honey powder.
2.2 Materials and Methods
Four honey samples were purchased in batches of three from local honey producers based in
Denham Springs, Bossier city, St.Marksville and Breaux bridge respectively. the samples were
of multi-floral origin with tallow and willow being among the major sources of pollen. USDA
color designation was determined for each sample using a honey color analyzer (Hannah
Instruments, HI 83221, RI, USA). The color was designated by measuring the optical density and
expressing it in terms of millimeters (Pfund scale). The corresponding grade was then read from
the manual provided with the instrument and the honey samples were labeled based on the Pfund
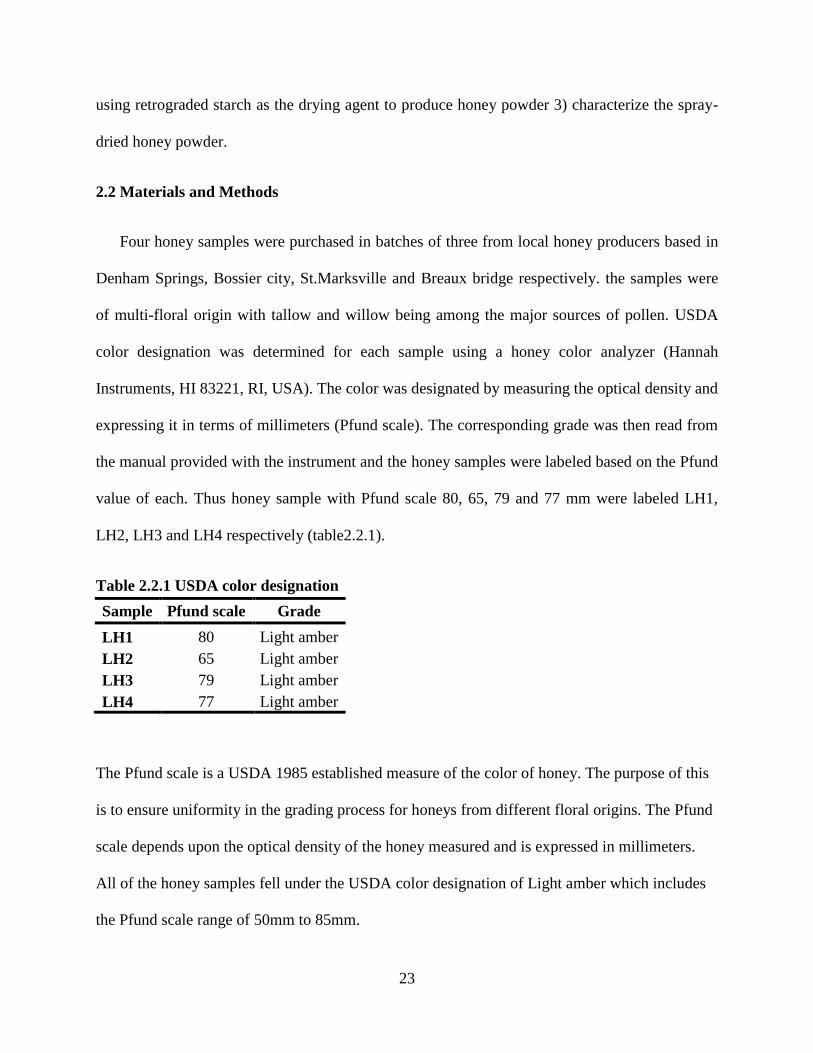
value of each. Thus honey sample with Pfund scale 80, 65, 79 and 77 mm were labeled LH1,
LH2, LH3 and LH4 respectively (table2.2.1).
Table 2.2.1 USDA color designation
Sample Pfund scale Grade
LH1 80 Light amber
LH2 65 Light amber
LH3 79 Light amber
LH4 77 Light amber
The Pfund scale is a USDA 1985 established measure of the color of honey. The purpose of this
is to ensure uniformity in the grading process for honeys from different floral origins. The Pfund
scale depends upon the optical density of the honey measured and is expressed in millimeters.
All of the honey samples fell under the USDA color designation of Light amber which includes
the Pfund scale range of 50mm to 85mm.
24
2.2.1 Physico-chemical Characterization of Liquid Honey
2.2.1.1 pH, ºBrix, Moisture, Specific gravity and Color
The pH was measured by dissolving 10 g of honey in 75 mL of water (Gomes and others 2010),
using a digital pH meter (SB70P, Symphony™, VMR Inc., Beverly, MA, USA) .
The °Brix was measured using a digital handheld refractometer (AR200, Reichert Inc., Depew,
NY, USA). The readings were taken at 20°C in triplicate and were reported as the mean value
along with the standard deviation.
The moisture content was determined using AOAC 969.38b, 1995 method using a forced air
convection oven. Three grams of each sample were weighed in triplicate and then left in the oven
at 105°C for 24 h. The results were reported as the mean of the triplicate measurements along
with standard deviations.
Specific gravity was determined by calculating the ratio of the mass of honey to the mass of an
equal volume (25 mL) of distilled water measured in a volumetric flask.
Results were reported as the mean of triplicate measurements along with standard deviations.
The color was measured using the HunterLab Labscan XE colorimeter (Labscan XE, Hunter
Associates laboratory Inc., Reston, Virginia, USA) in triplicate of samples weighing 8grams
each. The colorimeter was standardized using black and white tiles. The results were reported as
L* (lightness), a*(redness and greenness), and b* (yellowness and blueness). The measurements
were made in triplicate and the means and standard deviations were reported.
25
2.2.1.2 HPLC Analysis for Sugar Content
The sugar content of the honeys was determined using an HPLC technique. HPLC equipment
was composed of a solvent delivery system (Waters 600, Waters, Milford, MA, USA), work
station (M32, Waters Corporation.). One percent solution of the honey samples was prepared by
dissolving 1 g of honey powder in 100g of distilled water, and 15 L of the dilute honey was
injected into HPLC column (Waters). For analysis of the glucose and fructose, the CarboPac
PA10 column (4 x 250 mm) was used with 112mMNaOH as the mobile phase at ambient room
temperature. They were detected using an EC detector system. The contents of glucose, fructose,
sucrose and maltose in liquid honey were calculated based on the ratio of integrated peak areas
using commercial glucose, fructose, sucrose and maltose (Sigma–Aldrich, St. Loius, MO, USA)
as the standard compounds. Triplicate analysis was conducted for each sample and results
reported as the mean along with the standard deviation.
2.2.1.3 Rheological Study
The rheological measurements were performed using a controlled shear stress rheometer (AR
2000ex, TA Instruments, New Castle, DE) with computer control. A parallel plate geometry with
a plate radius of 40mm was used and the gap was set at 500 µm. The temperature was
maintained by the Peltier temperature control system. The viscosity was measured at the shear
rate 100s-1
for 20, 30, 40, 50 and 60°C. The measurements were done in triplicate for each
temperature and the data was obtained from the company supplied software, Advantage
software, Version 2.3.
The Power law was used to fit the stress-shear data and is given by the following equation:
26
Where σ is the shear stress (Pa), γ is the shear rate (s-1
), K is the consistency coefficient (Pasn)
and n is the flow behavior index (dimensionless).
The Arrhenius equation was used to study the effect of temperature on viscosity of the honey
samples which is given as follows
Where µ is the viscosity (Pas), µ0 the Arrhenius constant, Ea the activation energy (kJ/mol), R is
gas constant (8.314 J/mol K), and T is the temperature (Kelvin). A linear graph of ln(µ) versus
(1/T) was plotted and activation energy was obtained from it. Results were reported as the mean
along with the standard deviation of triplicate measurements.
2.2.2 Spray Drying of Liquid Honey Using Retrograded Starch as Drying Agent
A solution comprising 20% honey, 30% retrograded corn starch and 50% water (by weight)
was prepared (at room temperature). The proportions were determined based on preliminary
studies. The solution was prepared by mixing continuously using a magnetic stirrer until the
honey dissolved completely in the solution (10 mins). The mixture was then sonicated using a
laboratory scale ultrasonic processor (Model Model CPX 500, Cole-Parmer Inc., Vernon Hills,
IL, USA) for 5 minutes at 80% amplitude (pulse on 2 and pulse off 1). The solution was placed
in an ice bath to prevent any temperature rise in the solution. Sonication was done to ensure that
the particles were smaller in size and well dispersed in the solution. The honey solution was
spray dried into dry powder using the FT80 tall form spray dryer (Armfiled Limited, Ringwood,
Hampshire, England). The honey solution was pumped at a flow rate of 9 mL/min and spray
dried at 200 C. The spray dried honey powder was stored at 4 C until analyzed. All data were
obtained by triplicate experiments.
27
2.2.3 Characterization of Spray-dried Honey Powder
The spray-dried honey powders were labeled based on the honey they were spray-dried from
Thus honey powder produced was labeled HP1, HP2, HP3 and HP4 to signify its production
from LH1, LH2, LH3 and LH4 honey samples respectively.
2.2.3.1 Color
The color of the honey powder was measured as per mentioned in Section 2.2.1.2. The
measurements were made in triplicate and the means and standard deviations were reported.
2.2.3.2 Moisture Content
The moisture of the honey powders was measured using a Moisture analyzer (System 5, CEM
Corporation Ltd., Matthews, NC, U.S.A) and reported as the means of the triplicate
measurements along with the standard deviations.
2.2.3.3 HPLC Analysis for Sugar Content
The sugar content of the honey powders was determined using an HPLC technique. HPLC
equipment was composed of a solvent delivery system (Waters 600, Waters, Milford, MA,
USA), work station (M32, Waters Corporation.). Half percent solution of the honey powder
samples was prepared by dissolving 0.5 g of honey powder in 100g of distilled water. Of this
solution, 15 L was injected into HPLC column (Waters). For analysis of the glucose and
fructose, the CarboPac PA10 column (4 x 250 mm) was used with 112mMNaOH as the mobile
phase at ambient room temperature. They were detected using an EC detector system. The
contents of glucose, fructose, sucrose and maltose in liquid honey were calculated based on the
ratio of integrated peak areas using commercial glucose, fructose, sucrose and maltose (Sigma–
28
Aldrich, St. Loius, MO, USA) as the standard compounds. Triplicate analysis was conducted for
each sample and results reported as the mean along with the standard deviation.
2.2.3.4 SEM Analysis for Particle Morphology
The morphology of honey powders was determined using Scanning Electron Microscopy (SEM)
(JSM-6610LV, JEOL Ltd., Japan) using an acceleration voltage of 5 kV. The honey powder
samples were mounted on aluminum SEM stubs and coated with gold: palladium (60:40) in an
Edwards S150 sputter coater (Edwards High Vacuum International, Wilmington, MA). The
mounted powders were then imaged with the SEM and particle diameter was also determined.
The statistical significance of observed differences among formulation means was evaluated by
analysis of variance (ANOVA) (SAS, Version 9.2, SAS Institute Inc., Cary, NC., USA) followed
by the post-hoc Tukey‘s studentized range test (SAS 2002).
2.3 Results and Discussion
2.3.1 Physico-chemical Characterization of Louisiana Honey
All of the honey samples were acidic in nature with the pH ranging between 3.89 and 4.10
(Table 2.3.1). Similar results have been observed in honey from different parts of the world
including Algeria (3.49 - 4.43) (Ouchemoukh and others 2007), India (3.8 – 5.0) (Ahmed and
others 2007), and Brazil (3.56 – 4.00) (Azeredo and others 2003). The acidity of honey has been
attributed to the presence of organic acids especially gluconic acid as well as inorganic ions such
as phosphate and chloride (Ouchemoukh and others 2007). Gluconic acid is a mild organic acid
and is found naturally in fruit juices (0.25%) as well as in honey (1%). It is used in the pickling
of foods as well as in baking (component of leavening agent) and sherbets (flavoring)
29
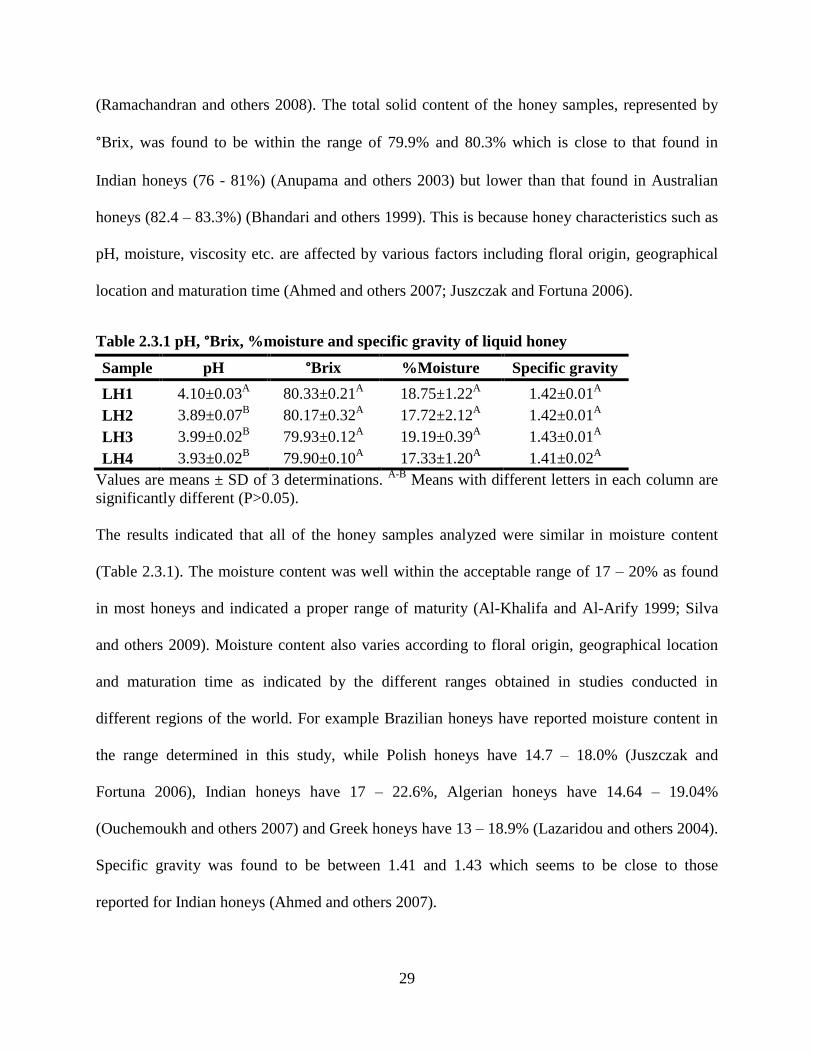
(Ramachandran and others 2008). The total solid content of the honey samples, represented by
°Brix, was found to be within the range of 79.9% and 80.3% which is close to that found in
Indian honeys (76 - 81%) (Anupama and others 2003) but lower than that found in Australian
honeys (82.4 – 83.3%) (Bhandari and others 1999). This is because honey characteristics such as
pH, moisture, viscosity etc. are affected by various factors including floral origin, geographical
location and maturation time (Ahmed and others 2007; Juszczak and Fortuna 2006).
Table 2.3.1 pH, °Brix, %moisture and specific gravity of liquid honey
Sample pH °Brix %Moisture Specific gravity
LH1 4.10±0.03A 80.33±0.21
A 18.75±1.22
A 1.42±0.01
A
LH2 3.89±0.07B 80.17±0.32
A 17.72±2.12
A 1.42±0.01
A
LH3 3.99±0.02B 79.93±0.12
A 19.19±0.39
A 1.43±0.01
A
LH4 3.93±0.02B 79.90±0.10
A 17.33±1.20
A 1.41±0.02
A
Values are means ± SD of 3 determinations. A-B
Means with different letters in each column are
significantly different (P>0.05).
The results indicated that all of the honey samples analyzed were similar in moisture content
(Table 2.3.1). The moisture content was well within the acceptable range of 17 – 20% as found
in most honeys and indicated a proper range of maturity (Al-Khalifa and Al-Arify 1999; Silva
and others 2009). Moisture content also varies according to floral origin, geographical location
and maturation time as indicated by the different ranges obtained in studies conducted in
different regions of the world. For example Brazilian honeys have reported moisture content in
the range determined in this study, while Polish honeys have 14.7 – 18.0% (Juszczak and
Fortuna 2006), Indian honeys have 17 – 22.6%, Algerian honeys have 14.64 – 19.04%
(Ouchemoukh and others 2007) and Greek honeys have 13 – 18.9% (Lazaridou and others 2004).
Specific gravity was found to be between 1.41 and 1.43 which seems to be close to those
reported for Indian honeys (Ahmed and others 2007).
30
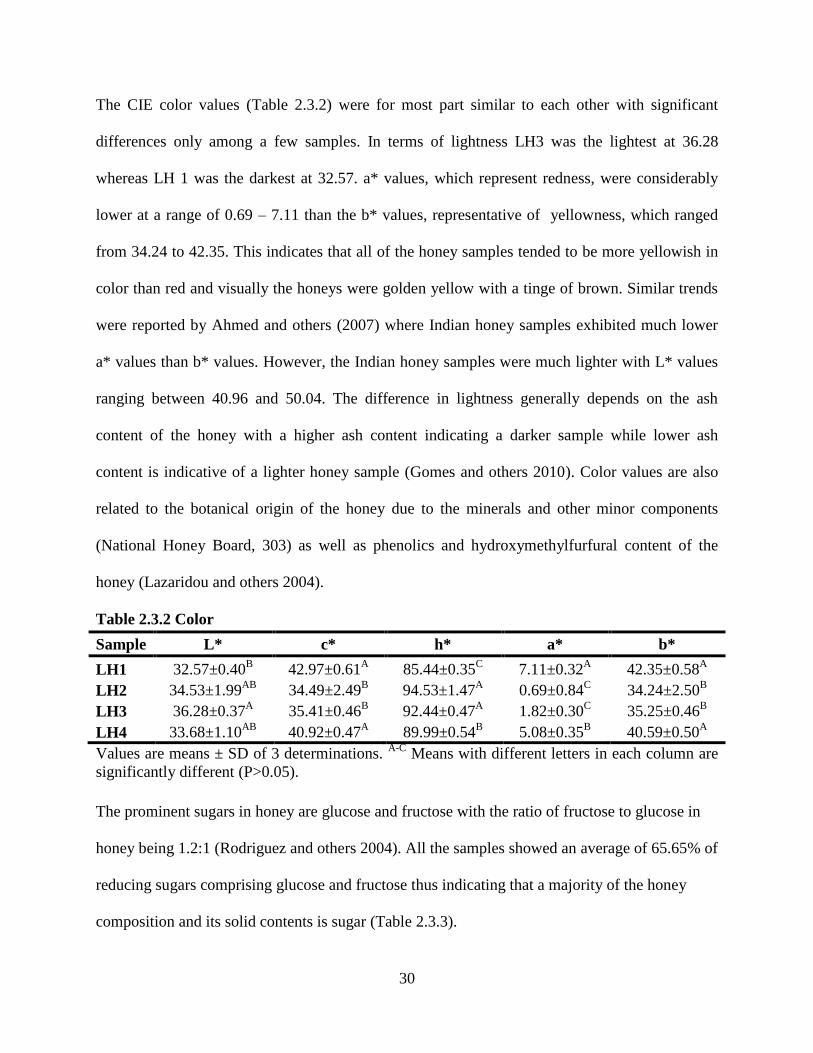
The CIE color values (Table 2.3.2) were for most part similar to each other with significant
differences only among a few samples. In terms of lightness LH3 was the lightest at 36.28
whereas LH 1 was the darkest at 32.57. a* values, which represent redness, were considerably
lower at a range of 0.69 – 7.11 than the b* values, representative of yellowness, which ranged
from 34.24 to 42.35. This indicates that all of the honey samples tended to be more yellowish in
color than red and visually the honeys were golden yellow with a tinge of brown. Similar trends
were reported by Ahmed and others (2007) where Indian honey samples exhibited much lower
a* values than b* values. However, the Indian honey samples were much lighter with L* values
ranging between 40.96 and 50.04. The difference in lightness generally depends on the ash
content of the honey with a higher ash content indicating a darker sample while lower ash
content is indicative of a lighter honey sample (Gomes and others 2010). Color values are also
related to the botanical origin of the honey due to the minerals and other minor components
(National Honey Board, 303) as well as phenolics and hydroxymethylfurfural content of the
honey (Lazaridou and others 2004).
Table 2.3.2 Color
Sample L* c* h* a* b*
LH1 32.57±0.40B 42.97±0.61
A 85.44±0.35
C 7.11±0.32
A 42.35±0.58
A
LH2 34.53±1.99AB
34.49±2.49B 94.53±1.47
A 0.69±0.84
C 34.24±2.50
B
LH3 36.28±0.37A 35.41±0.46
B 92.44±0.47
A 1.82±0.30
C 35.25±0.46
B
LH4 33.68±1.10AB
40.92±0.47A 89.99±0.54
B 5.08±0.35
B 40.59±0.50
A
Values are means ± SD of 3 determinations. A-C
Means with different letters in each column are
significantly different (P>0.05).
The prominent sugars in honey are glucose and fructose with the ratio of fructose to glucose in
honey being 1.2:1 (Rodriguez and others 2004). All the samples showed an average of 65.65% of
reducing sugars comprising glucose and fructose thus indicating that a majority of the honey
composition and its solid contents is sugar (Table 2.3.3).
31
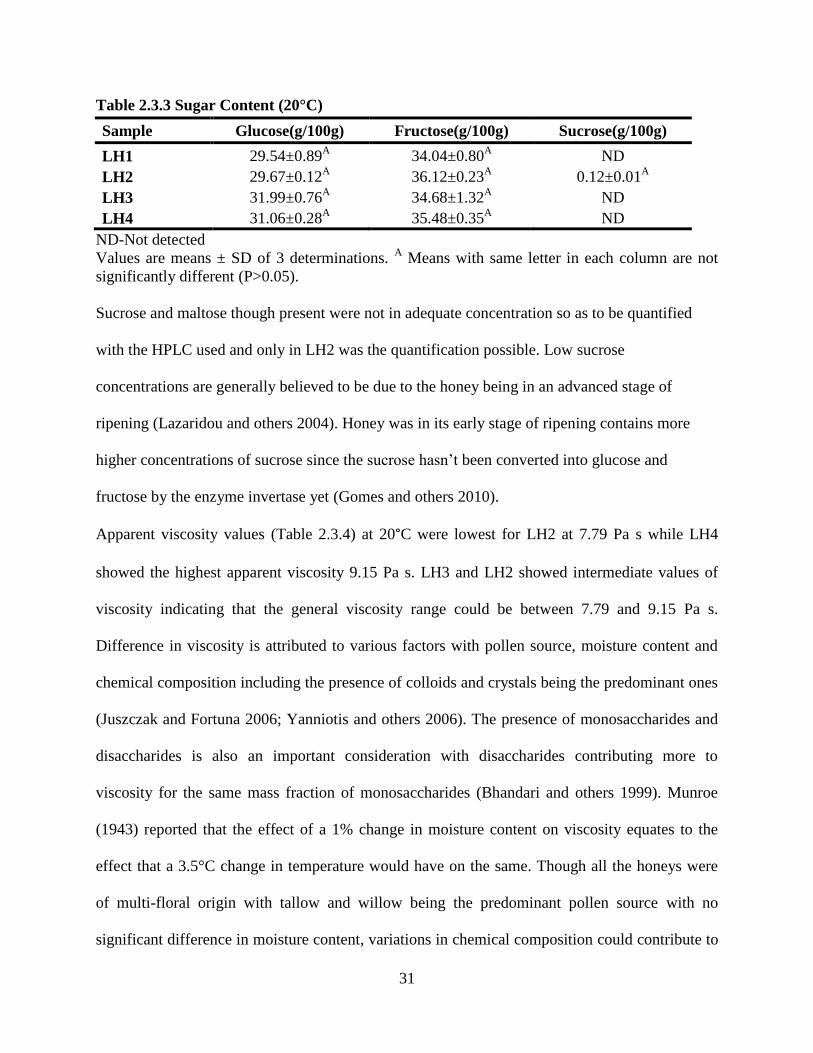
Table 2.3.3 Sugar Content (20°C)
Sample Glucose(g/100g) Fructose(g/100g) Sucrose(g/100g)
LH1 29.54±0.89A 34.04±0.80
A ND
LH2 29.67±0.12A 36.12±0.23
A 0.12±0.01
A
LH3 31.99±0.76A 34.68±1.32
A ND
LH4 31.06±0.28A 35.48±0.35
A ND
ND-Not detected
Values are means ± SD of 3 determinations. A Means with same letter in each column are not
significantly different (P>0.05).
Sucrose and maltose though present were not in adequate concentration so as to be quantified
with the HPLC used and only in LH2 was the quantification possible. Low sucrose
concentrations are generally believed to be due to the honey being in an advanced stage of
ripening (Lazaridou and others 2004). Honey was in its early stage of ripening contains more
higher concentrations of sucrose since the sucrose hasn‘t been converted into glucose and
fructose by the enzyme invertase yet (Gomes and others 2010).
Apparent viscosity values (Table 2.3.4) at 20°C were lowest for LH2 at 7.79 Pa s while LH4
showed the highest apparent viscosity 9.15 Pa s. LH3 and LH2 showed intermediate values of
viscosity indicating that the general viscosity range could be between 7.79 and 9.15 Pa s.
Difference in viscosity is attributed to various factors with pollen source, moisture content and
chemical composition including the presence of colloids and crystals being the predominant ones
(Juszczak and Fortuna 2006; Yanniotis and others 2006). The presence of monosaccharides and
disaccharides is also an important consideration with disaccharides contributing more to
viscosity for the same mass fraction of monosaccharides (Bhandari and others 1999). Munroe
(1943) reported that the effect of a 1% change in moisture content on viscosity equates to the
effect that a 3.5°C change in temperature would have on the same. Though all the honeys were
of multi-floral origin with tallow and willow being the predominant pollen source with no
significant difference in moisture content, variations in chemical composition could contribute to
32
the difference in viscosity values. This is well established by the studies on Australian honeys
with the viscosity values reported by Sopade and others (2002) being different from those
reported in earlier studies by Bhandari and others (1999) even though the floral source of the
honeys were the same.
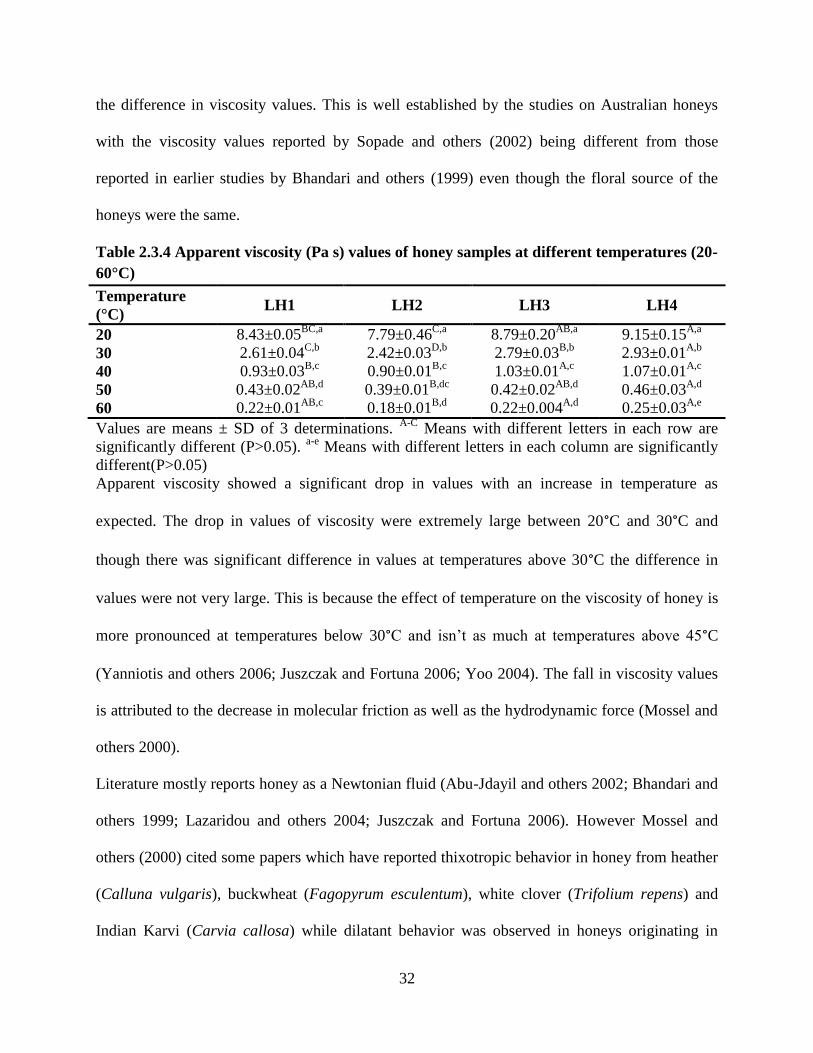
Table 2.3.4 Apparent viscosity (Pa s) values of honey samples at different temperatures (20-
60°C)
Temperature
(°C) LH1 LH2 LH3 LH4
20 8.43±0.05BC,a
7.79±0.46C,a
8.79±0.20AB,a
9.15±0.15A,a
30 2.61±0.04C,b
2.42±0.03D,b
2.79±0.03B,b
2.93±0.01A,b
40 0.93±0.03B,c
0.90±0.01B,c
1.03±0.01A,c
1.07±0.01A,c
50 0.43±0.02AB,d
0.39±0.01B,dc
0.42±0.02AB,d
0.46±0.03A,d
60 0.22±0.01AB,c
0.18±0.01B,d
0.22±0.004A,d
0.25±0.03A,e
Values are means ± SD of 3 determinations. A-C
Means with different letters in each row are
significantly different (P>0.05). a-e
Means with different letters in each column are significantly
different(P>0.05)
Apparent viscosity showed a significant drop in values with an increase in temperature as
expected. The drop in values of viscosity were extremely large between 20°C and 30°C and
though there was significant difference in values at temperatures above 30°C the difference in
values were not very large. This is because the effect of temperature on the viscosity of honey is
more pronounced at temperatures below 30°C and isn‘t as much at temperatures above 45°C
(Yanniotis and others 2006; Juszczak and Fortuna 2006; Yoo 2004). The fall in viscosity values
is attributed to the decrease in molecular friction as well as the hydrodynamic force (Mossel and
others 2000).
Literature mostly reports honey as a Newtonian fluid (Abu-Jdayil and others 2002; Bhandari and
others 1999; Lazaridou and others 2004; Juszczak and Fortuna 2006). However Mossel and
others (2000) cited some papers which have reported thixotropic behavior in honey from heather
(Calluna vulgaris), buckwheat (Fagopyrum esculentum), white clover (Trifolium repens) and
Indian Karvi (Carvia callosa) while dilatant behavior was observed in honeys originating in
33
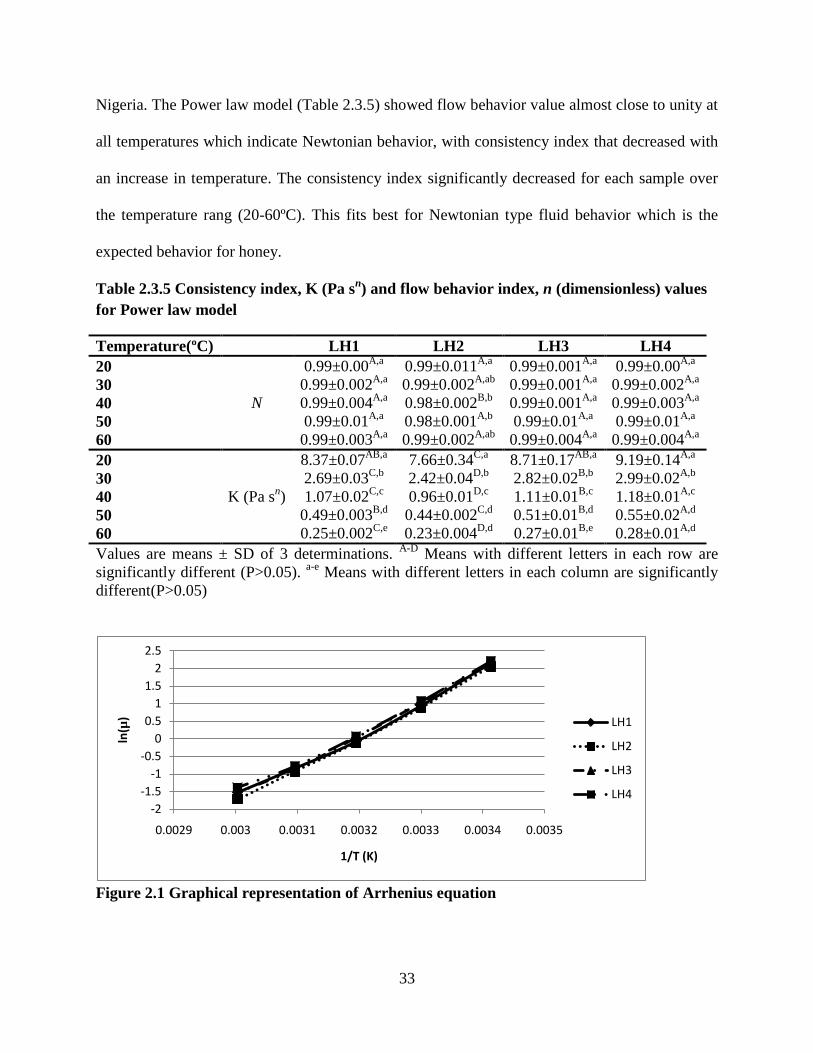
Nigeria. The Power law model (Table 2.3.5) showed flow behavior value almost close to unity at
all temperatures which indicate Newtonian behavior, with consistency index that decreased with
an increase in temperature. The consistency index significantly decreased for each sample over
the temperature rang (20-60ºC). This fits best for Newtonian type fluid behavior which is the
expected behavior for honey.
Table 2.3.5 Consistency index, K (Pa sn) and flow behavior index, n (dimensionless) values
for Power law model
Temperature(ºC) LH1 LH2 LH3 LH4
20
N
0.99±0.00A,a
0.99±0.011A,a
0.99±0.001A,a
0.99±0.00A,a
30 0.99±0.002A,a
0.99±0.002A,ab
0.99±0.001A,a
0.99±0.002A,a
40 0.99±0.004A,a
0.98±0.002B,b
0.99±0.001A,a
0.99±0.003A,a
50 0.99±0.01A,a
0.98±0.001A,b
0.99±0.01A,a
0.99±0.01A,a
60 0.99±0.003A,a
0.99±0.002A,ab
0.99±0.004A,a
0.99±0.004A,a
20
K (Pa sn)
8.37±0.07AB,a
7.66±0.34C,a
8.71±0.17AB,a
9.19±0.14A,a
30 2.69±0.03C,b
2.42±0.04D,b
2.82±0.02B,b
2.99±0.02A,b
40 1.07±0.02C,c
0.96±0.01D,c
1.11±0.01B,c
1.18±0.01A,c
50 0.49±0.003B,d
0.44±0.002C,d
0.51±0.01B,d
0.55±0.02A,d
60 0.25±0.002C,e
0.23±0.004D,d
0.27±0.01B,e
0.28±0.01A,d
Values are means ± SD of 3 determinations. A-D
Means with different letters in each row are
significantly different (P>0.05). a-e
Means with different letters in each column are significantly
different(P>0.05)
Figure 2.1 Graphical representation of Arrhenius equation
-2
-1.5
-1
-0.5
0
0.5
1
1.5
2
2.5
0.0029 0.003 0.0031 0.0032 0.0033 0.0034 0.0035
ln(µ
)
1/T (K)
LH1
LH2
LH3
LH4
34
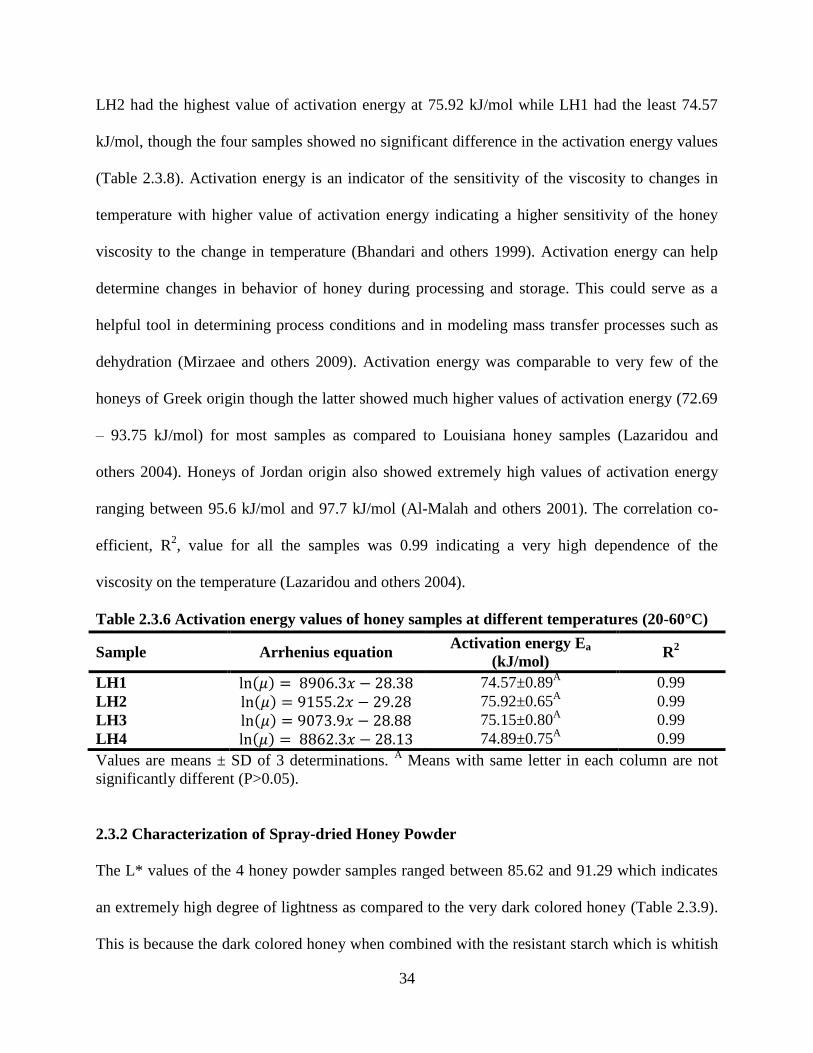
LH2 had the highest value of activation energy at 75.92 kJ/mol while LH1 had the least 74.57
kJ/mol, though the four samples showed no significant difference in the activation energy values
(Table 2.3.8). Activation energy is an indicator of the sensitivity of the viscosity to changes in
temperature with higher value of activation energy indicating a higher sensitivity of the honey
viscosity to the change in temperature (Bhandari and others 1999). Activation energy can help
determine changes in behavior of honey during processing and storage. This could serve as a
helpful tool in determining process conditions and in modeling mass transfer processes such as
dehydration (Mirzaee and others 2009). Activation energy was comparable to very few of the
honeys of Greek origin though the latter showed much higher values of activation energy (72.69
– 93.75 kJ/mol) for most samples as compared to Louisiana honey samples (Lazaridou and
others 2004). Honeys of Jordan origin also showed extremely high values of activation energy
ranging between 95.6 kJ/mol and 97.7 kJ/mol (Al-Malah and others 2001). The correlation co-
efficient, R2, value for all the samples was 0.99 indicating a very high dependence of the
viscosity on the temperature (Lazaridou and others 2004).
Table 2.3.6 Activation energy values of honey samples at different temperatures (20-60°C)
Sample Arrhenius equation Activation energy Ea
(kJ/mol) R
2
LH1 74.57±0.89A 0.99
LH2 75.92±0.65A 0.99
LH3 75.15±0.80A 0.99
LH4 74.89±0.75A 0.99
Values are means ± SD of 3 determinations. A Means with same letter in each column are not
significantly different (P>0.05).
2.3.2 Characterization of Spray-dried Honey Powder
The L* values of the 4 honey powder samples ranged between 85.62 and 91.29 which indicates
an extremely high degree of lightness as compared to the very dark colored honey (Table 2.3.9).
This is because the dark colored honey when combined with the resistant starch which is whitish
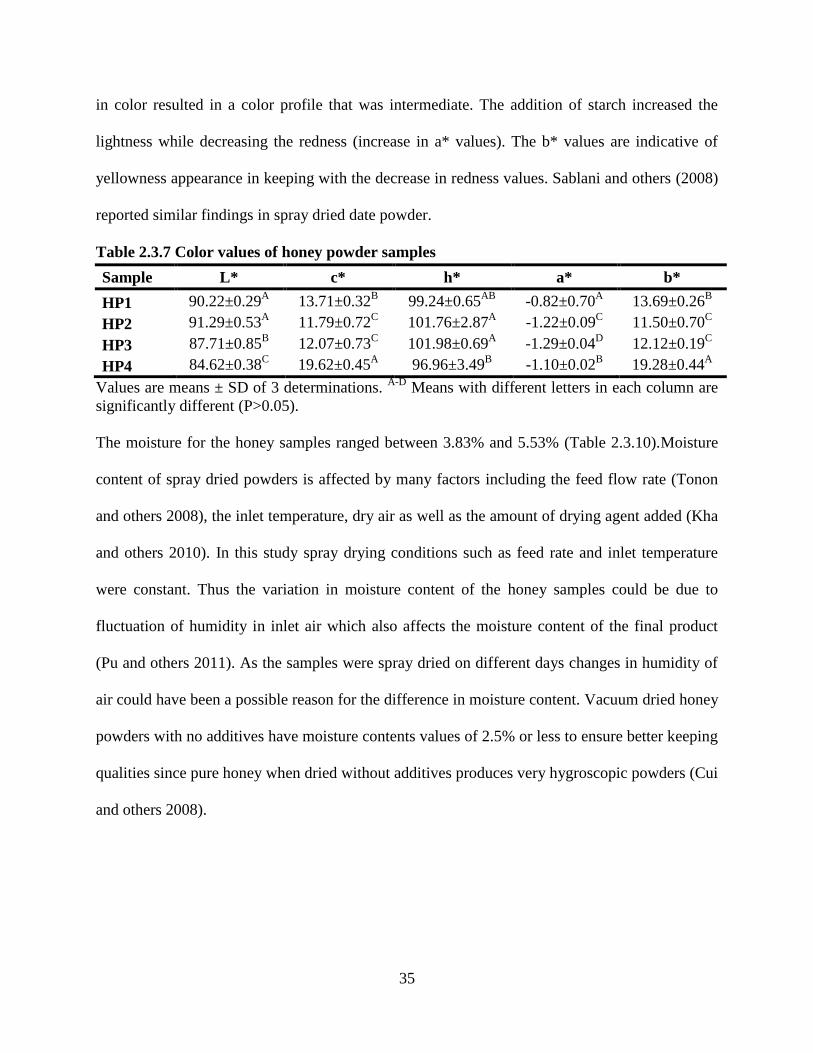
35
in color resulted in a color profile that was intermediate. The addition of starch increased the
lightness while decreasing the redness (increase in a* values). The b* values are indicative of
yellowness appearance in keeping with the decrease in redness values. Sablani and others (2008)
reported similar findings in spray dried date powder.
Table 2.3.7 Color values of honey powder samples
Sample L* c* h* a* b*
HP1 90.22±0.29A 13.71±0.32
B 99.24±0.65
AB -0.82±0.70
A 13.69±0.26
B
HP2 91.29±0.53A 11.79±0.72
C 101.76±2.87
A -1.22±0.09
C 11.50±0.70
C
HP3 87.71±0.85B 12.07±0.73
C 101.98±0.69
A -1.29±0.04
D 12.12±0.19
C
HP4 84.62±0.38C 19.62±0.45
A 96.96±3.49
B -1.10±0.02
B 19.28±0.44
A
Values are means ± SD of 3 determinations. A-D
Means with different letters in each column are
significantly different (P>0.05).
The moisture for the honey samples ranged between 3.83% and 5.53% (Table 2.3.10).Moisture
content of spray dried powders is affected by many factors including the feed flow rate (Tonon
and others 2008), the inlet temperature, dry air as well as the amount of drying agent added (Kha
and others 2010). In this study spray drying conditions such as feed rate and inlet temperature
were constant. Thus the variation in moisture content of the honey samples could be due to
fluctuation of humidity in inlet air which also affects the moisture content of the final product
(Pu and others 2011). As the samples were spray dried on different days changes in humidity of
air could have been a possible reason for the difference in moisture content. Vacuum dried honey
powders with no additives have moisture contents values of 2.5% or less to ensure better keeping
qualities since pure honey when dried without additives produces very hygroscopic powders (Cui
and others 2008).
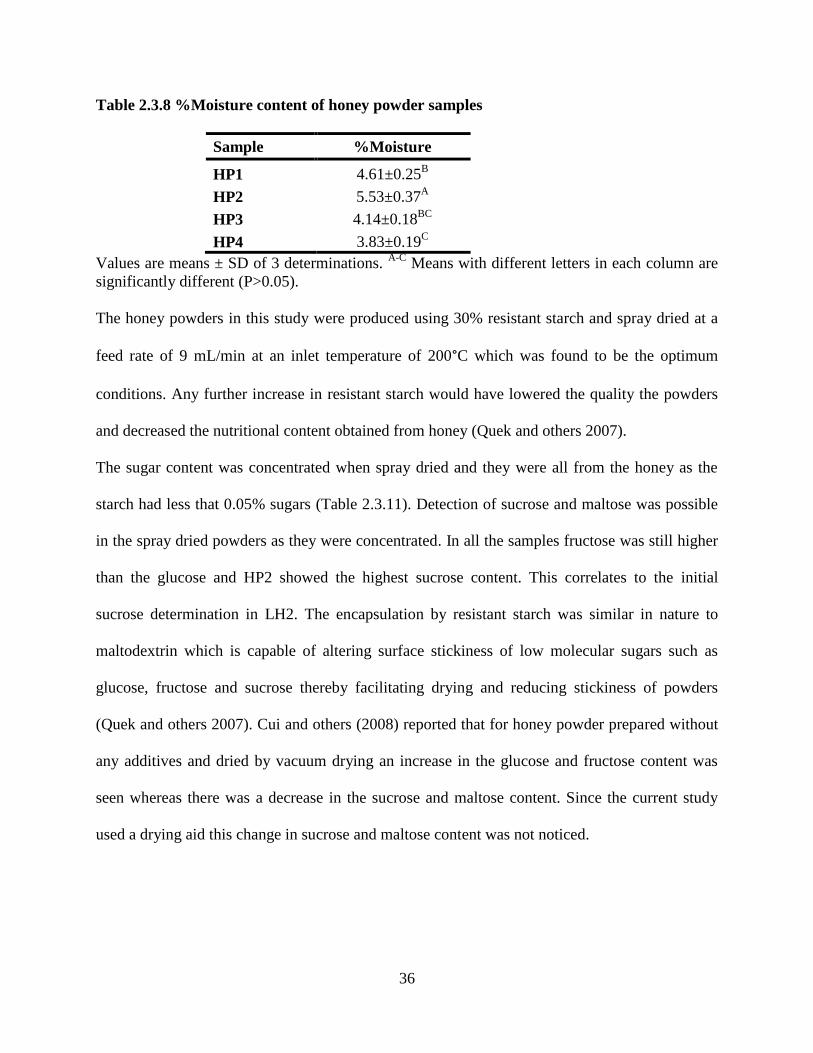
36
Table 2.3.8 %Moisture content of honey powder samples
Sample %Moisture
HP1 4.61±0.25B
HP2 5.53±0.37A
HP3 4.14±0.18BC
HP4 3.83±0.19C
Values are means ± SD of 3 determinations. A-C
Means with different letters in each column are
significantly different (P>0.05).
The honey powders in this study were produced using 30% resistant starch and spray dried at a
feed rate of 9 mL/min at an inlet temperature of 200°C which was found to be the optimum
conditions. Any further increase in resistant starch would have lowered the quality the powders
and decreased the nutritional content obtained from honey (Quek and others 2007).
The sugar content was concentrated when spray dried and they were all from the honey as the
starch had less that 0.05% sugars (Table 2.3.11). Detection of sucrose and maltose was possible
in the spray dried powders as they were concentrated. In all the samples fructose was still higher
than the glucose and HP2 showed the highest sucrose content. This correlates to the initial
sucrose determination in LH2. The encapsulation by resistant starch was similar in nature to
maltodextrin which is capable of altering surface stickiness of low molecular sugars such as
glucose, fructose and sucrose thereby facilitating drying and reducing stickiness of powders
(Quek and others 2007). Cui and others (2008) reported that for honey powder prepared without
any additives and dried by vacuum drying an increase in the glucose and fructose content was
seen whereas there was a decrease in the sucrose and maltose content. Since the current study
used a drying aid this change in sucrose and maltose content was not noticed.
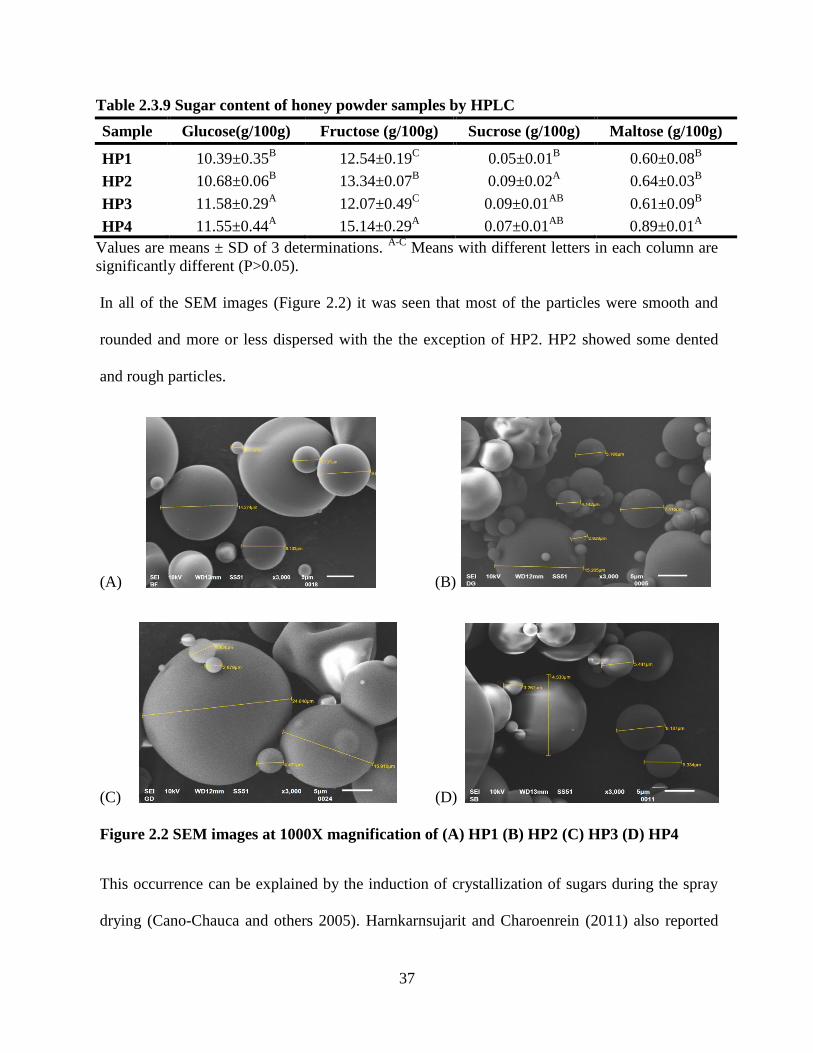
37
Table 2.3.9 Sugar content of honey powder samples by HPLC
Sample Glucose(g/100g) Fructose (g/100g) Sucrose (g/100g) Maltose (g/100g)
HP1 10.39±0.35B 12.54±0.19
C 0.05±0.01
B 0.60±0.08
B
HP2 10.68±0.06B 13.34±0.07
B 0.09±0.02
A 0.64±0.03
B
HP3 11.58±0.29A 12.07±0.49
C 0.09±0.01
AB 0.61±0.09
B
HP4 11.55±0.44A 15.14±0.29
A 0.07±0.01
AB 0.89±0.01
A
Values are means ± SD of 3 determinations. A-C
Means with different letters in each column are
significantly different (P>0.05).
In all of the SEM images (Figure 2.2) it was seen that most of the particles were smooth and
rounded and more or less dispersed with the the exception of HP2. HP2 showed some dented
and rough particles.
(A) (B)
(C) (D)
Figure 2.2 SEM images at 1000X magnification of (A) HP1 (B) HP2 (C) HP3 (D) HP4
This occurrence can be explained by the induction of crystallization of sugars during the spray
drying (Cano-Chauca and others 2005). Harnkarnsujarit and Charoenrein (2011) also reported
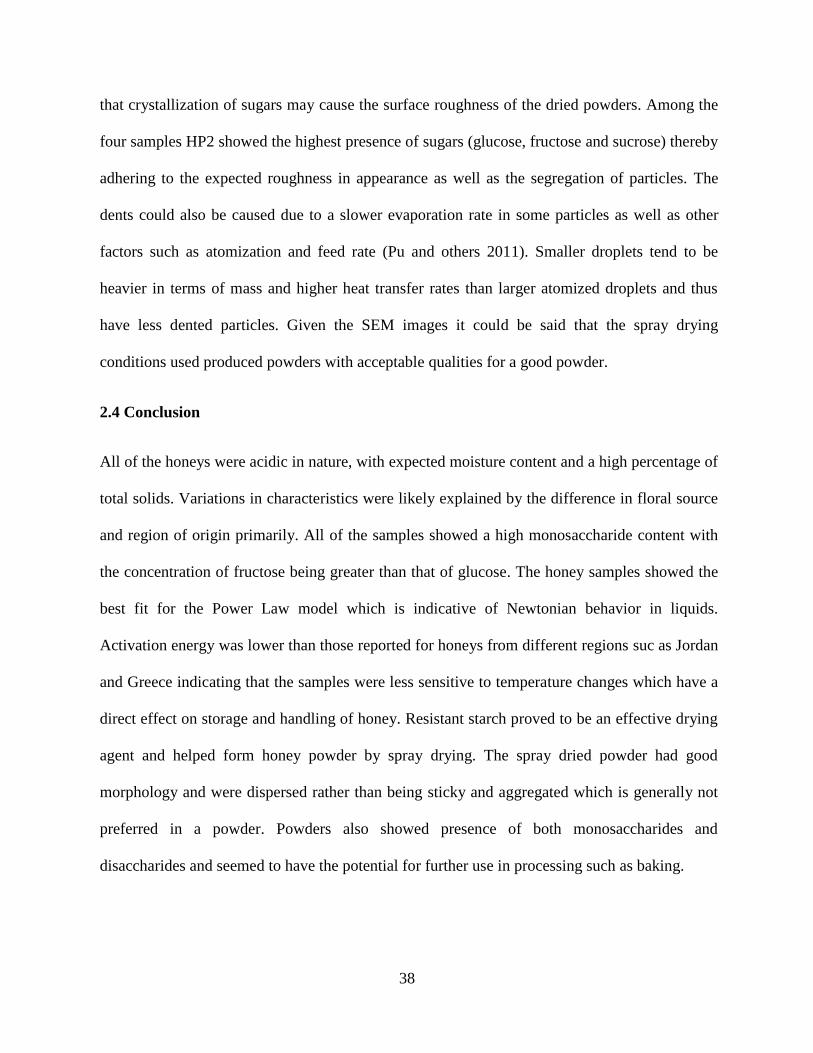
38
that crystallization of sugars may cause the surface roughness of the dried powders. Among the
four samples HP2 showed the highest presence of sugars (glucose, fructose and sucrose) thereby
adhering to the expected roughness in appearance as well as the segregation of particles. The
dents could also be caused due to a slower evaporation rate in some particles as well as other
factors such as atomization and feed rate (Pu and others 2011). Smaller droplets tend to be
heavier in terms of mass and higher heat transfer rates than larger atomized droplets and thus
have less dented particles. Given the SEM images it could be said that the spray drying
conditions used produced powders with acceptable qualities for a good powder.
2.4 Conclusion
All of the honeys were acidic in nature, with expected moisture content and a high percentage of
total solids. Variations in characteristics were likely explained by the difference in floral source
and region of origin primarily. All of the samples showed a high monosaccharide content with
the concentration of fructose being greater than that of glucose. The honey samples showed the
best fit for the Power Law model which is indicative of Newtonian behavior in liquids.
Activation energy was lower than those reported for honeys from different regions suc as Jordan
and Greece indicating that the samples were less sensitive to temperature changes which have a
direct effect on storage and handling of honey. Resistant starch proved to be an effective drying
agent and helped form honey powder by spray drying. The spray dried powder had good
morphology and were dispersed rather than being sticky and aggregated which is generally not
preferred in a powder. Powders also showed presence of both monosaccharides and
disaccharides and seemed to have the potential for further use in processing such as baking.
39
CHAPTER 3 DEVELOPMENT OF A BREAD FORMULATION WITH HONEY
POWDER AND ITS CHARACTERIZATION
3.1 Introduction
Bread is a globally consumed baked product and is a central constituent of many well balanced
diets because of its rich starch and complex carbohydrate content (Altamirano-Fortoul and Rosell
2011; Hathorn and others 2008). The baking industry has been dynamically changing in the past
150 years (Mondal and Datta 2008) in an attempt to optimize the technology so as to cope with
various issues that stem from various reasons such as socioeconomics, market competition,
changing consumer preferences, needs and attitudes, and changes in the production and quality
of the basic ingredients (Hathorn and others 2008). Health authorities worldwide recommend an
increase in cereal intake as it is an important source of dietary fiber. This has lead to the
development of several types of bread whose flour composition is substituted with soy flour,
potato flour etc. (Wang and others 2002). Whole grain breads with non-traditional cereals in
them have shown an increasing demand due to their nutritional benefits (Svec and Hruskova
2010). Sucrose in bread serves as substrate to yeasts primarily for fermentation purposes and
contributes to the calorie content of the product with no added nutritional benefits. They also
affect texture of bread. Honey contains fructose which is more hygroscopic than sucrose and thus
bread baked with honey is expected to be moister (Vaclavik and Christian 2003). However
adding honey or honey powder may affect the quality of bread. The primary two attributes that
consumers look for to determine quality of bread are its appearance and physical texture
(Scanlon and Zghal 2001). However after baking, the freshness of bread begins to deteriorate
rapidly due to various physical and chemical reactions which all together are called staling
(Stampfli and Nersten 1995; Barcenas and Rosell 2005).
40
As opposed to other food products, staling in bread is of major concern rather than spoilage due
to micro-organisms or endogeneous enzyme activity (Barcenas and Rosell 2005). It is estimated
that in a market where 20 billion pounds of bread are produced annually at least 600 million
(3%) is lost due to staling problems (Lai and Lin 2006). Though a lot of literature has been
published regarding staling, the process itself remains complex and is not fully understood
(Ribotta and Bail 2007). Crumb firming is the most important parameter that is linked by
consumers to staling (Lai and Lin 2006). Staling is attributed to many reasons with the prominent
ones being starch retrogradation, mainly that of amylopectin (Mandala and others 2007),
interactions between starch and gluten proteins (Patel and others 2005), and the loss and
redistribution of water (Barcenas and Rosell 2005).
Honey is known to be high in sugars such as fructose and glucose (80-90%) which also improve
browning due to Maillard reactions and also retains moisture when used in baked products
(Bogdanov 2010). The bread produced using honey or honey powder in this study is expected to
have qualities similar to those breads baked using sucrose. The objectives of this study were to
use honey or honey powder containing retrograded starch as an alternative to sucrose in bread
formulations and to characterize the bread and study textural changes during a storage period of
12 days.
3.2 Materials and Methods
3.2.1 Bread Formulation
The bread was prepared using the Straight dough method for white pan bread followed by
American Institute of Baking (AIB). The basic bread formulation per 100 g of flour was 62 g
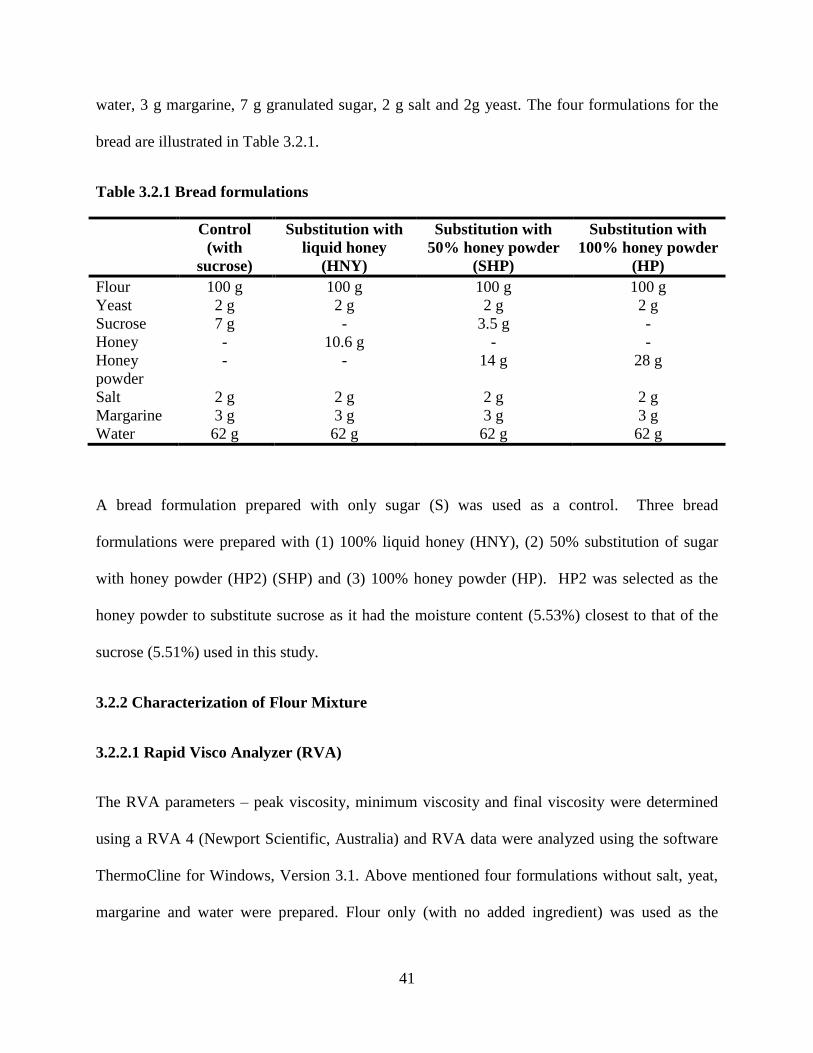
41
water, 3 g margarine, 7 g granulated sugar, 2 g salt and 2g yeast. The four formulations for the
bread are illustrated in Table 3.2.1.
Table 3.2.1 Bread formulations
Control
(with
sucrose)
Substitution with
liquid honey
(HNY)
Substitution with
50% honey powder
(SHP)
Substitution with
100% honey powder
(HP)
Flour 100 g 100 g 100 g 100 g
Yeast 2 g 2 g 2 g 2 g
Sucrose 7 g - 3.5 g -
Honey - 10.6 g - -
Honey
powder
- - 14 g 28 g
Salt 2 g 2 g 2 g 2 g
Margarine 3 g 3 g 3 g 3 g
Water 62 g 62 g 62 g 62 g
A bread formulation prepared with only sugar (S) was used as a control. Three bread
formulations were prepared with (1) 100% liquid honey (HNY), (2) 50% substitution of sugar
with honey powder (HP2) (SHP) and (3) 100% honey powder (HP). HP2 was selected as the
honey powder to substitute sucrose as it had the moisture content (5.53%) closest to that of the
sucrose (5.51%) used in this study.
3.2.2 Characterization of Flour Mixture
3.2.2.1 Rapid Visco Analyzer (RVA)
The RVA parameters – peak viscosity, minimum viscosity and final viscosity were determined
using a RVA 4 (Newport Scientific, Australia) and RVA data were analyzed using the software
ThermoCline for Windows, Version 3.1. Above mentioned four formulations without salt, yeat,
margarine and water were prepared. Flour only (with no added ingredient) was used as the
42
control. Moisture content of each sample as well as the flour was determined using the moisture
analyzer (CEM – 5) and according to the moisture content, 3.5 g of sample was weighed and
mixed with 25 mL of water. Each flour mixture with water was held at 50°C for 1 min and then
heated to 95°C at the rate of 12.2°C/min. The heated suspension was then held at 95°C for
2.5min. The cooling cycle then began at the rate of 11.8°C/min till the temperature of 50°C was
attained after which it was held at the same temperature for 2 min. The values of peak viscosity,
minimum viscosity and final viscosity were obtained from the graph generated and these values
were used to compute the breakdown and total setback values.
3.2.3 Bread Preparation
All of the ingredients were mixed in a Kitchen Aid mixer at speed 2 for 4 minutes. After mixing
the dough was divided into 6 pieces and placed in rectangular pans. Proofing was done for 60
minutes at 81°F and then for 10 minutes at 110°F. The breads were then baked at 440°F for 20
minutes. The breads were individually stored in Ziploc bags at 20°C for further analysis and
storage study.
3.2.4 Bread Characterization and Storage Study
3.2.4.1 Loaf volume, Specific Volume and Density
Loaf volume of bread was determined an hour after baking on day 0 by the bean displacement
method (Greene and Bovell-Benjamin 2004; Wang and others 2002). Beans were poured so as to
cover the bottom of a container of known volume. The bread loaf was then placed and the
43
remainders of the bean seeds were poured into the container. The beans were leveled on the
surface of the container using a spatula. The beans that were not required to fill the container
were measured in a graduated cylinder and represented the volume of the loaf. The results were
expressed as means of triplicate values along with standard deviation.
Specific volume was calculated as the ratio of the loaf volume to the loaf mass determined an
hour after baking according to the method of Penfield and Campbell (1990).
Bread density was calculated as the ratio of the loaf mass to the loaf volume (Shogren and others
2003).
3.2.4.2 Weight Loss
Weight of the dough and the bread baked were measured and the % weight loss was calculated
as follows
3.2.4.3 Crumb and Crust Color
Color values for crust and crumb were measured at three different locations on the same loaf
using the HunterLab Labscan XE colorimeter (Labscan XE, Hunter Associates laboratory Inc.,
Reston, Virginia, USA) in triplicates of samples weighing 8gm each. The results were reported
44
as L* (lightness), a*(redness and greenness), and b* (yellowness and blueness). The
measurements were made in triplicate and the means and standard deviations were reported.
3.2.4.4 Crumb and Crust Moisture
Moisture for the crust and crumb was determined by AOAC 969.38b, 1995 method using a
forced air convection oven. Three grams of crust and crumb each from 3 different locations on
the bread were heated at 105°C for 24hrs. Triplicate measurements were done and values were
reported as means along with standard deviations.
3.2.4.5 Analysis of Texture
Texture was analyzed using a texture analyzer (TA-XT plus) with a 51mm diameter cylindrical
probe at test speed of 10 mm/s and a 5 kg load. Bread slices used for testing were cut from the
center of the loaf and were 25 mm thick. Firmness, cohesiveness, springiness and resilience
values were determined. Chewiness was calculated as follows:
Triplicate measurements were done and results were expressed as means along with standard
deviations.
3.2.4.6 Condition for Ageing Tests and Model Used to Describe Staling
Ageing tests were carried out at 20°C for 12 days according to Le-Bail and others (2009). The
texture analysis was conducted on day 0, 1, 3, 6, 9 and 12. First order kinetic model was used to
model the crumb hardening based on the following equation
45
Where and represent the Young‘s modulus at initial time and final storage respectively.
The characteristic time constant, τ was used to characterize and compare the phenomenon of
crumb hardening.
3.2.4.7 Differential Scanning Calorimetry (DSC)
A 10 mg of the core of the bread samples was placed in the hermetically sealed aluminum pans
and analyzed using the DSC (TA Advantage). The samples were first cooled from 25°C to -50°C
and then slowly heated at a ramp of 2°C/min from -50°C to 100°C. Condensation in the
measurement cell was minimized using dry nitrogen gas flow. The onset (T0), peak (Tp) and
conclusion (Te) temperatures are obtained. The amount of freezable water was determined from
the relationship between transition enthalpy of ice melting and latent heat of ice melting (334J/g)
(Ribotta and Le Bail 2007). The measurements were done in duplicate.
The statistical significance of observed differences among formulation means was evaluated by
analysis of variance (ANOVA) (SAS, Version 9.2, SAS Institute Inc., Cary, NC., USA) followed
by the post-hoc Tukey‘s studentized range test (SAS 2002).
3.3 Results and Discussion
3.3.1 Physico-chemical Characterization of read
The peak viscosity values (Table 3.3.1) of all of the flour mixture samples were lower than the
peak viscosity value of the flour alone. This held true for minimum viscosity, final viscosity,
breakdown and TSB values. This is attributed to the fact that any added ingredient to a flour base
always depreciates its gluten forming characteristics due to the absence of proteins in starch
which are required for binding especially in the case of SHP and HP flour samples due to the
presence of added resistant starch. Lei and others (2008) studied specifically the impact of
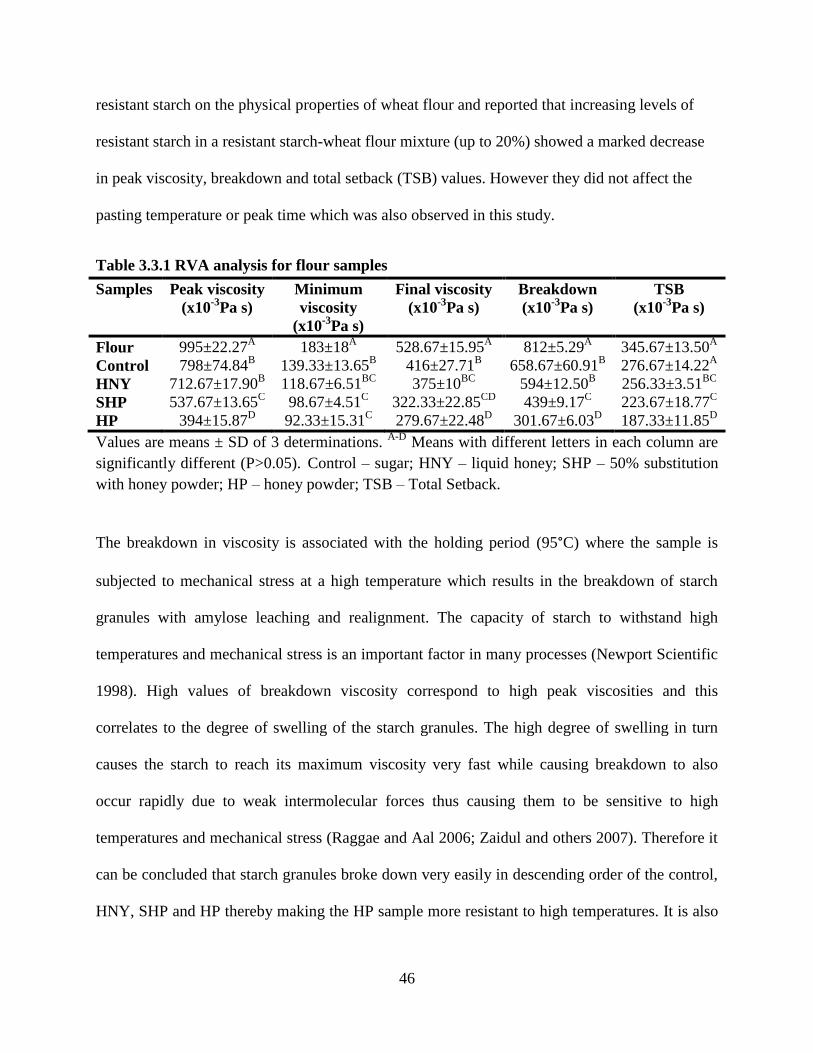
46
resistant starch on the physical properties of wheat flour and reported that increasing levels of
resistant starch in a resistant starch-wheat flour mixture (up to 20%) showed a marked decrease
in peak viscosity, breakdown and total setback (TSB) values. However they did not affect the
pasting temperature or peak time which was also observed in this study.
Table 3.3.1 RVA analysis for flour samples
Samples Peak viscosity
(x10-3
Pa s)
Minimum
viscosity
(x10-3
Pa s)
Final viscosity
(x10-3
Pa s)
Breakdown
(x10-3
Pa s)
TSB
(x10-3
Pa s)
Flour 995±22.27A 183±18
A 528.67±15.95
A 812±5.29
A 345.67±13.50
A
Control 798±74.84B 139.33±13.65
B 416±27.71
B 658.67±60.91
B 276.67±14.22
A
HNY 712.67±17.90B 118.67±6.51
BC 375±10
BC 594±12.50
B 256.33±3.51
BC
SHP 537.67±13.65C 98.67±4.51
C 322.33±22.85
CD 439±9.17
C 223.67±18.77
C
HP 394±15.87D 92.33±15.31
C 279.67±22.48
D 301.67±6.03
D 187.33±11.85
D
Values are means ± SD of 3 determinations. A-D
Means with different letters in each column are
significantly different (P>0.05). Control – sugar; HNY – liquid honey; SHP – 50% substitution
with honey powder; HP – honey powder; TSB – Total Setback.
The breakdown in viscosity is associated with the holding period (95°C) where the sample is
subjected to mechanical stress at a high temperature which results in the breakdown of starch
granules with amylose leaching and realignment. The capacity of starch to withstand high
temperatures and mechanical stress is an important factor in many processes (Newport Scientific
1998). High values of breakdown viscosity correspond to high peak viscosities and this
correlates to the degree of swelling of the starch granules. The high degree of swelling in turn
causes the starch to reach its maximum viscosity very fast while causing breakdown to also
occur rapidly due to weak intermolecular forces thus causing them to be sensitive to high
temperatures and mechanical stress (Raggae and Aal 2006; Zaidul and others 2007). Therefore it
can be concluded that starch granules broke down very easily in descending order of the control,
HNY, SHP and HP thereby making the HP sample more resistant to high temperatures. It is also
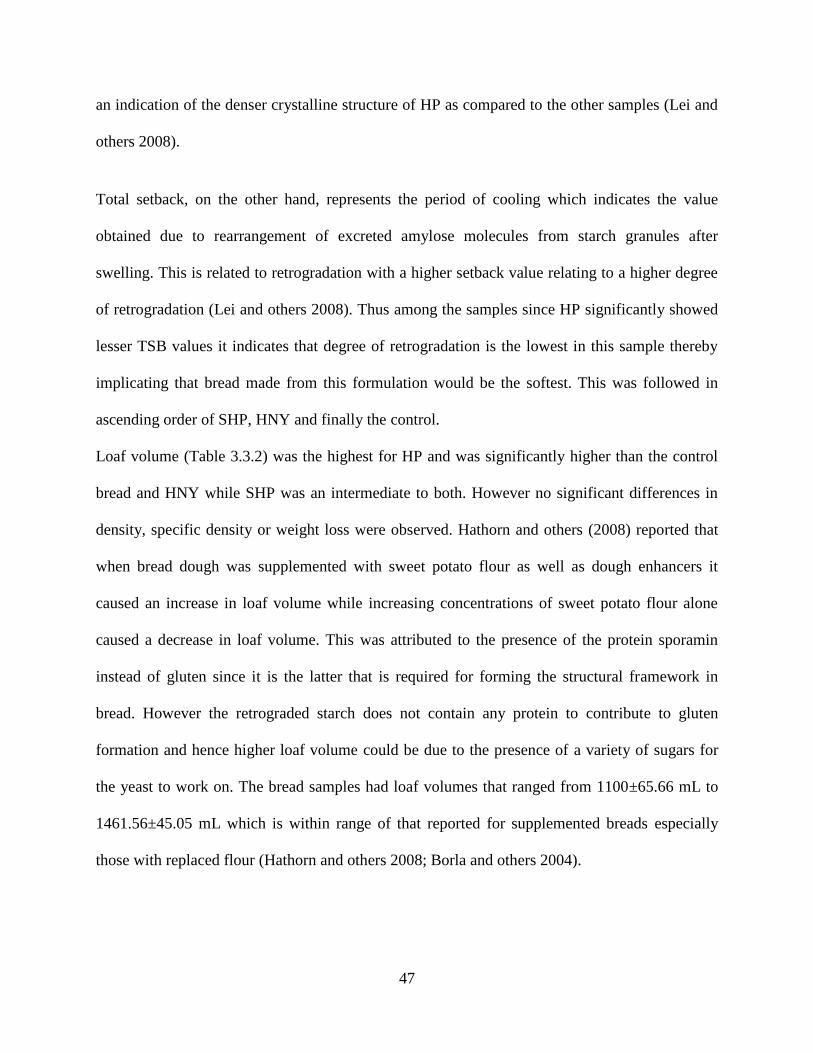
47
an indication of the denser crystalline structure of HP as compared to the other samples (Lei and
others 2008).
Total setback, on the other hand, represents the period of cooling which indicates the value
obtained due to rearrangement of excreted amylose molecules from starch granules after
swelling. This is related to retrogradation with a higher setback value relating to a higher degree
of retrogradation (Lei and others 2008). Thus among the samples since HP significantly showed
lesser TSB values it indicates that degree of retrogradation is the lowest in this sample thereby
implicating that bread made from this formulation would be the softest. This was followed in
ascending order of SHP, HNY and finally the control.
Loaf volume (Table 3.3.2) was the highest for HP and was significantly higher than the control
bread and HNY while SHP was an intermediate to both. However no significant differences in
density, specific density or weight loss were observed. Hathorn and others (2008) reported that
when bread dough was supplemented with sweet potato flour as well as dough enhancers it
caused an increase in loaf volume while increasing concentrations of sweet potato flour alone
caused a decrease in loaf volume. This was attributed to the presence of the protein sporamin
instead of gluten since it is the latter that is required for forming the structural framework in
bread. However the retrograded starch does not contain any protein to contribute to gluten
formation and hence higher loaf volume could be due to the presence of a variety of sugars for
the yeast to work on. The bread samples had loaf volumes that ranged from 1100±65.66 mL to
1461.56±45.05 mL which is within range of that reported for supplemented breads especially
those with replaced flour (Hathorn and others 2008; Borla and others 2004).
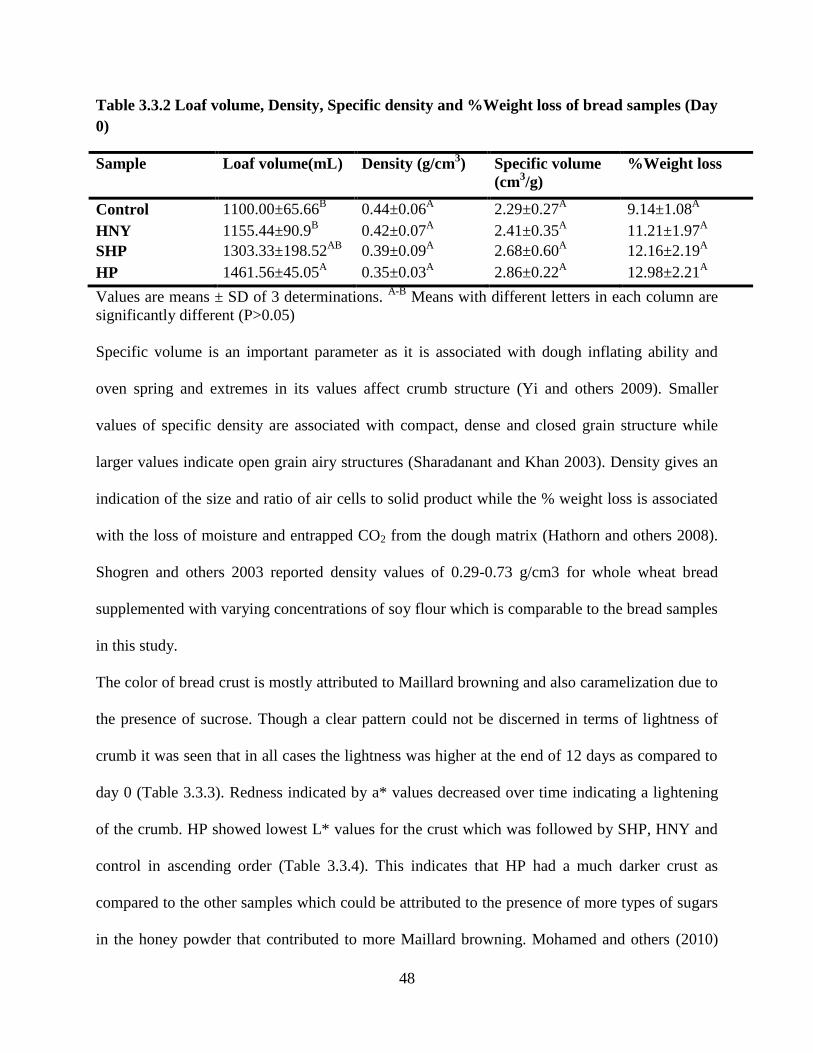
48
Table 3.3.2 Loaf volume, Density, Specific density and %Weight loss of bread samples (Day
0)
Sample Loaf volume(mL) Density (g/cm3) Specific volume
(cm3/g)
%Weight loss
Control 1100.00±65.66B 0.44±0.06
A 2.29±0.27
A 9.14±1.08
A
HNY 1155.44±90.9B 0.42±0.07
A 2.41±0.35
A 11.21±1.97
A
SHP 1303.33±198.52AB
0.39±0.09A 2.68±0.60
A 12.16±2.19
A
HP 1461.56±45.05A 0.35±0.03
A 2.86±0.22
A 12.98±2.21
A
Values are means ± SD of 3 determinations. A-B
Means with different letters in each column are
significantly different (P>0.05)
Specific volume is an important parameter as it is associated with dough inflating ability and
oven spring and extremes in its values affect crumb structure (Yi and others 2009). Smaller
values of specific density are associated with compact, dense and closed grain structure while
larger values indicate open grain airy structures (Sharadanant and Khan 2003). Density gives an
indication of the size and ratio of air cells to solid product while the % weight loss is associated
with the loss of moisture and entrapped CO2 from the dough matrix (Hathorn and others 2008).
Shogren and others 2003 reported density values of 0.29-0.73 g/cm3 for whole wheat bread
supplemented with varying concentrations of soy flour which is comparable to the bread samples
in this study.
The color of bread crust is mostly attributed to Maillard browning and also caramelization due to
the presence of sucrose. Though a clear pattern could not be discerned in terms of lightness of
crumb it was seen that in all cases the lightness was higher at the end of 12 days as compared to
day 0 (Table 3.3.3). Redness indicated by a* values decreased over time indicating a lightening
of the crumb. HP showed lowest L* values for the crust which was followed by SHP, HNY and
control in ascending order (Table 3.3.4). This indicates that HP had a much darker crust as
compared to the other samples which could be attributed to the presence of more types of sugars
in the honey powder that contributed to more Maillard browning. Mohamed and others (2010)
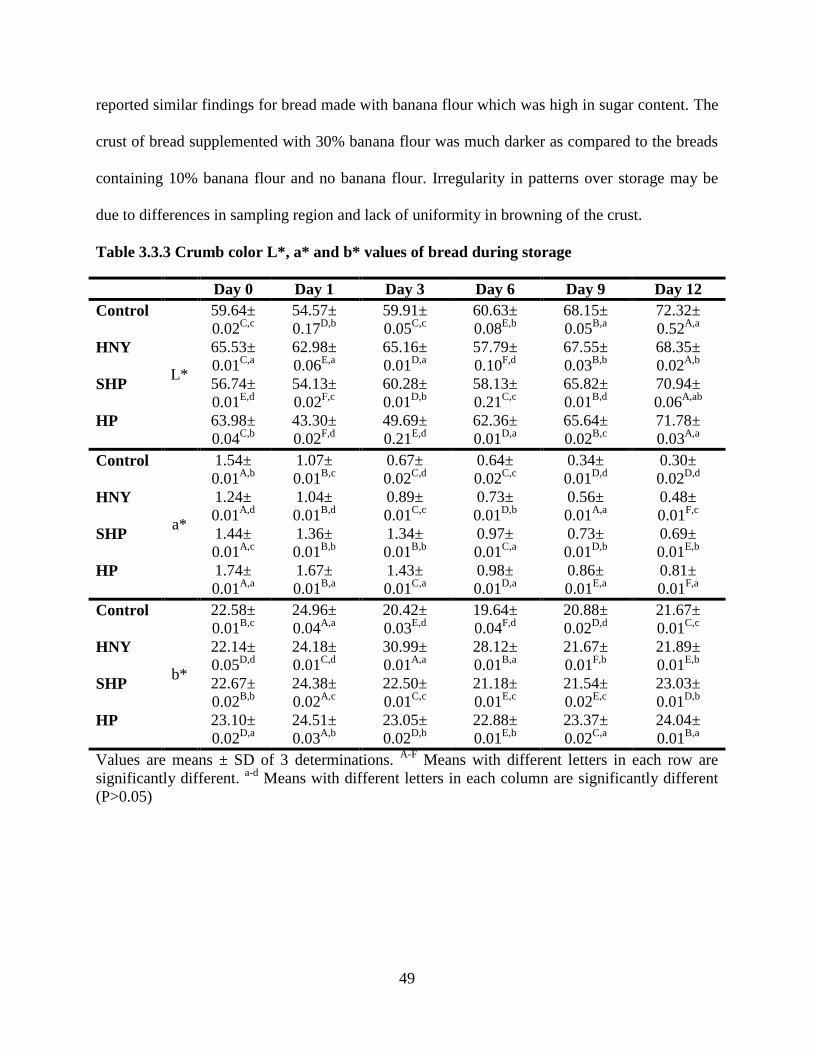
49
reported similar findings for bread made with banana flour which was high in sugar content. The
crust of bread supplemented with 30% banana flour was much darker as compared to the breads
containing 10% banana flour and no banana flour. Irregularity in patterns over storage may be
due to differences in sampling region and lack of uniformity in browning of the crust.
Table 3.3.3 Crumb color L*, a* and b* values of bread during storage
Day 0 Day 1 Day 3 Day 6 Day 9 Day 12
Control
L*
59.64±
0.02C,c
54.57±
0.17D,b
59.91±
0.05C,c
60.63±
0.08E,b
68.15±
0.05B,a
72.32±
0.52A,a
HNY 65.53±
0.01C,a
62.98±
0.06E,a
65.16±
0.01D,a
57.79±
0.10F,d
67.55±
0.03B,b
68.35±
0.02A,b
SHP 56.74±
0.01E,d
54.13±
0.02F,c
60.28±
0.01D,b
58.13±
0.21C,c
65.82±
0.01B,d
70.94±
0.06A,ab
HP 63.98±
0.04C,b
43.30±
0.02F,d
49.69±
0.21E,d
62.36±
0.01D,a
65.64±
0.02B,c
71.78±
0.03A,a
Control
a*
1.54±
0.01A,b
1.07±
0.01B,c
0.67±
0.02C,d
0.64±
0.02C,c
0.34±
0.01D,d
0.30±
0.02D,d
HNY 1.24±
0.01A,d
1.04±
0.01B,d
0.89±
0.01C,c
0.73±
0.01D,b
0.56±
0.01A,a
0.48±
0.01F,c
SHP 1.44±
0.01A,c
1.36±
0.01B,b
1.34±
0.01B,b
0.97±
0.01C,a
0.73±
0.01D,b
0.69±
0.01E,b
HP 1.74±
0.01A,a
1.67±
0.01B,a
1.43±
0.01C,a
0.98±
0.01D,a
0.86±
0.01E,a
0.81±
0.01F,a
Control
b*
22.58±
0.01B,c
24.96±
0.04A,a
20.42±
0.03E,d
19.64±
0.04F,d
20.88±
0.02D,d
21.67±
0.01C,c
HNY 22.14±
0.05D,d
24.18±
0.01C,d
30.99±
0.01A,a
28.12±
0.01B,a
21.67±
0.01F,b
21.89±
0.01E,b
SHP 22.67±
0.02B,b
24.38±
0.02A,c
22.50±
0.01C,c
21.18±
0.01E,c
21.54±
0.02E,c
23.03±
0.01D,b
HP 23.10±
0.02D,a
24.51±
0.03A,b
23.05±
0.02D,b
22.88±
0.01E,b
23.37±
0.02C,a
24.04±
0.01B,a
Values are means ± SD of 3 determinations. A-F
Means with different letters in each row are
significantly different. a-d
Means with different letters in each column are significantly different
(P>0.05)
50
Table 3.3.4 Crust color L*, a* and b* values of bread during storage
Sample Day 0 Day 1 Day 3 Day 6 Day 9 Day 12
Control
L*
72.34±
0.01A,a
55.56±
0.02C,a
54.94±
0.01D,a
42.89±
0.03F,c
49.58±
0.04E,c
60.91±
0.03B,a
HNY 59.69±
0.05B,b
52.6±
0.09D,b
41.03±
0.01F,c
49.76±
0.2E,b
64.21±
0.01A,a
54.73±
0.03C,b
SHP 47.80±
0.04D,c
48.34±
0.01C,c
47.59±
0.02E,b
53.96±
0.02B,a
60.82±
0.01A,b
47.86±
0.03D,c
HP 43.3±
0.02C,d
48.54±
0.02A,d
38.96±
0.02E,d
42.43±
0.15D,c
44.91±
0.01B,d
37.54±
0.01F,d
Control
a*
10.58±
0.01D,b
12.72±
0.02B,c
13.08±
0.01A,c
10.86±
0.02C,b
9.69±
0.01E,b
12.76±
0.01B,c
HNY 14.02±
0.01A,a
11.91±
0.02C,d
12.35±
0.01B,d
7.63±
0.06D,d
6.60±
0.01F,d
6.67±
0.01E,d
SHP 12.13±
0.03D,c
13.33±
0.01C,b
15.46±
0.01A,b
9.52±
0.01E,c
9.52±
0.01E,c
13.93±
0.01B,b
HP 13.71±
0.02D,b
14.33±
0.24C,a
16.33±
0.01A,a
15.06±
0.03B,a
13.77±
0.01D,a
14.59±
0.01C,a
Control
b*
28.45±
0.01A,c
24.18±
0.01C,c
20.42±
0.03E,d
21.77±
0.03D,d
28.23±
0.01B,c
24.21±
0.01C,d
HNY 28.56±
0.04A,b
23.07±
0.01E,d
24.73±
0.01D,b
23.06±
0.10E,c
26.79±
0.03B,d
25.81±
0.03C,c
SHP 28.39±
0.03B,d
26.21±
0.01D,b
22.66±
0.02E,c
28.44±
0.14B,b
33.22±
0.01A,a
27.84±
0.04C,b
HP 28.77±
0.01E,a
29.37±
0.01B,a
27.82±
0.03F,a
30.41±
0.04A,a
29.15±
0.03C,b
28.98±
0.04D,a
Values are means ± SD of 3 determinations. A-F
Means with different letters in each row are
significantly different. a-d
Means with different letters in each column are significantly different
(P>0.05)
Moisture content of food is an indicator of the quality of the product and has a potential impact
on the sensory, physical and microbial properties of bread in particular (Hathorn and others
2008). In terms of crumb moisture it was seen that HP was the highest on day 0 from the other
three samples which were comparable to each other (Table 3.3.5). Higher moisture content as
long as it is in the acceptable range has shown to positively increase the loaf volumes of bread
(Gallagher and others 2003). The four bread samples on all days showed moisture content values
that were comparable to those reported in literature (Mandala and others 2007; Hathorn and
others 2008). All of the breads showed an expected trend of decrease in crumb moisture over the
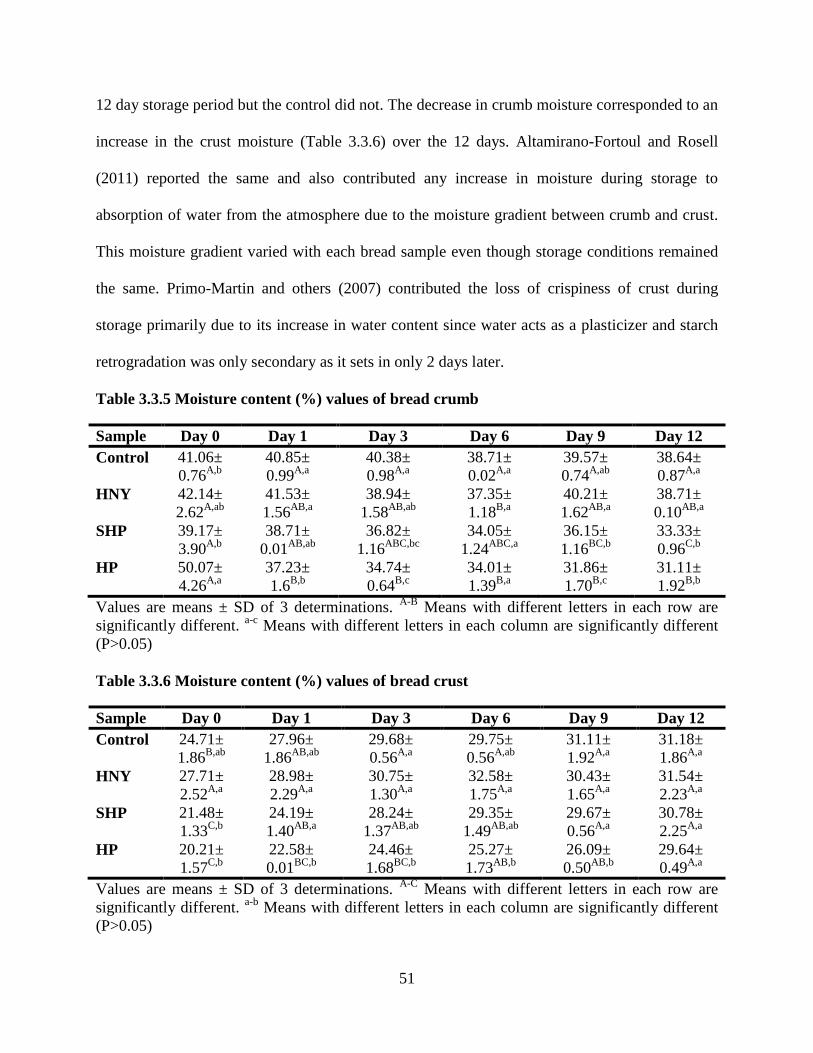
51
12 day storage period but the control did not. The decrease in crumb moisture corresponded to an
increase in the crust moisture (Table 3.3.6) over the 12 days. Altamirano-Fortoul and Rosell
(2011) reported the same and also contributed any increase in moisture during storage to
absorption of water from the atmosphere due to the moisture gradient between crumb and crust.
This moisture gradient varied with each bread sample even though storage conditions remained
the same. Primo-Martin and others (2007) contributed the loss of crispiness of crust during
storage primarily due to its increase in water content since water acts as a plasticizer and starch
retrogradation was only secondary as it sets in only 2 days later.
Table 3.3.5 Moisture content (%) values of bread crumb
Sample Day 0 Day 1 Day 3 Day 6 Day 9 Day 12
Control 41.06±
0.76A,b
40.85±
0.99A,a
40.38±
0.98A,a
38.71±
0.02A,a
39.57±
0.74A,ab
38.64±
0.87A,a
HNY 42.14±
2.62A,ab
41.53±
1.56AB,a
38.94±
1.58AB,ab
37.35±
1.18B,a
40.21±
1.62AB,a
38.71±
0.10AB,a
SHP 39.17±
3.90A,b
38.71±
0.01AB,ab
36.82±
1.16ABC,bc
34.05±
1.24ABC,a
36.15±
1.16BC,b
33.33±
0.96C,b
HP 50.07±
4.26A,a
37.23±
1.6B,b
34.74±
0.64B,c
34.01±
1.39B,a
31.86±
1.70B,c
31.11±
1.92B,b
Values are means ± SD of 3 determinations. A-B
Means with different letters in each row are
significantly different. a-c
Means with different letters in each column are significantly different
(P>0.05)
Table 3.3.6 Moisture content (%) values of bread crust
Sample Day 0 Day 1 Day 3 Day 6 Day 9 Day 12
Control 24.71±
1.86B,ab
27.96±
1.86AB,ab
29.68±
0.56A,a
29.75±
0.56A,ab
31.11±
1.92A,a
31.18±
1.86A,a
HNY 27.71±
2.52A,a
28.98±
2.29A,a
30.75±
1.30A,a
32.58±
1.75A,a
30.43±
1.65A,a
31.54±
2.23A,a
SHP 21.48±
1.33C,b
24.19±
1.40AB,a
28.24±
1.37AB,ab
29.35±
1.49AB,ab
29.67±
0.56A,a
30.78±
2.25A,a
HP 20.21±
1.57C,b
22.58±
0.01BC,b
24.46±
1.68BC,b
25.27±
1.73AB,b
26.09±
0.50AB,b
29.64±
0.49A,a
Values are means ± SD of 3 determinations. A-C
Means with different letters in each row are
significantly different. a-b
Means with different letters in each column are significantly different
(P>0.05)
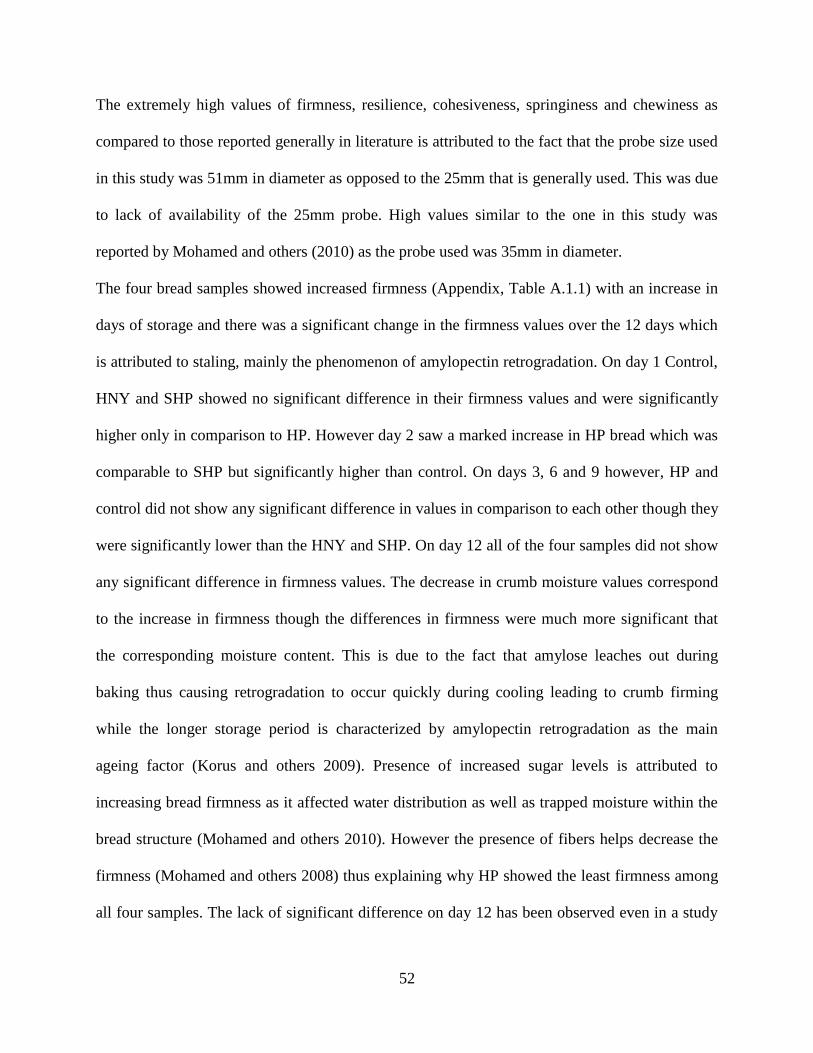
52
The extremely high values of firmness, resilience, cohesiveness, springiness and chewiness as
compared to those reported generally in literature is attributed to the fact that the probe size used
in this study was 51mm in diameter as opposed to the 25mm that is generally used. This was due
to lack of availability of the 25mm probe. High values similar to the one in this study was
reported by Mohamed and others (2010) as the probe used was 35mm in diameter.
The four bread samples showed increased firmness (Appendix, Table A.1.1) with an increase in
days of storage and there was a significant change in the firmness values over the 12 days which
is attributed to staling, mainly the phenomenon of amylopectin retrogradation. On day 1 Control,
HNY and SHP showed no significant difference in their firmness values and were significantly
higher only in comparison to HP. However day 2 saw a marked increase in HP bread which was
comparable to SHP but significantly higher than control. On days 3, 6 and 9 however, HP and
control did not show any significant difference in values in comparison to each other though they
were significantly lower than the HNY and SHP. On day 12 all of the four samples did not show
any significant difference in firmness values. The decrease in crumb moisture values correspond
to the increase in firmness though the differences in firmness were much more significant that
the corresponding moisture content. This is due to the fact that amylose leaches out during
baking thus causing retrogradation to occur quickly during cooling leading to crumb firming
while the longer storage period is characterized by amylopectin retrogradation as the main
ageing factor (Korus and others 2009). Presence of increased sugar levels is attributed to
increasing bread firmness as it affected water distribution as well as trapped moisture within the
bread structure (Mohamed and others 2010). However the presence of fibers helps decrease the
firmness (Mohamed and others 2008) thus explaining why HP showed the least firmness among
all four samples. The lack of significant difference on day 12 has been observed even in a study
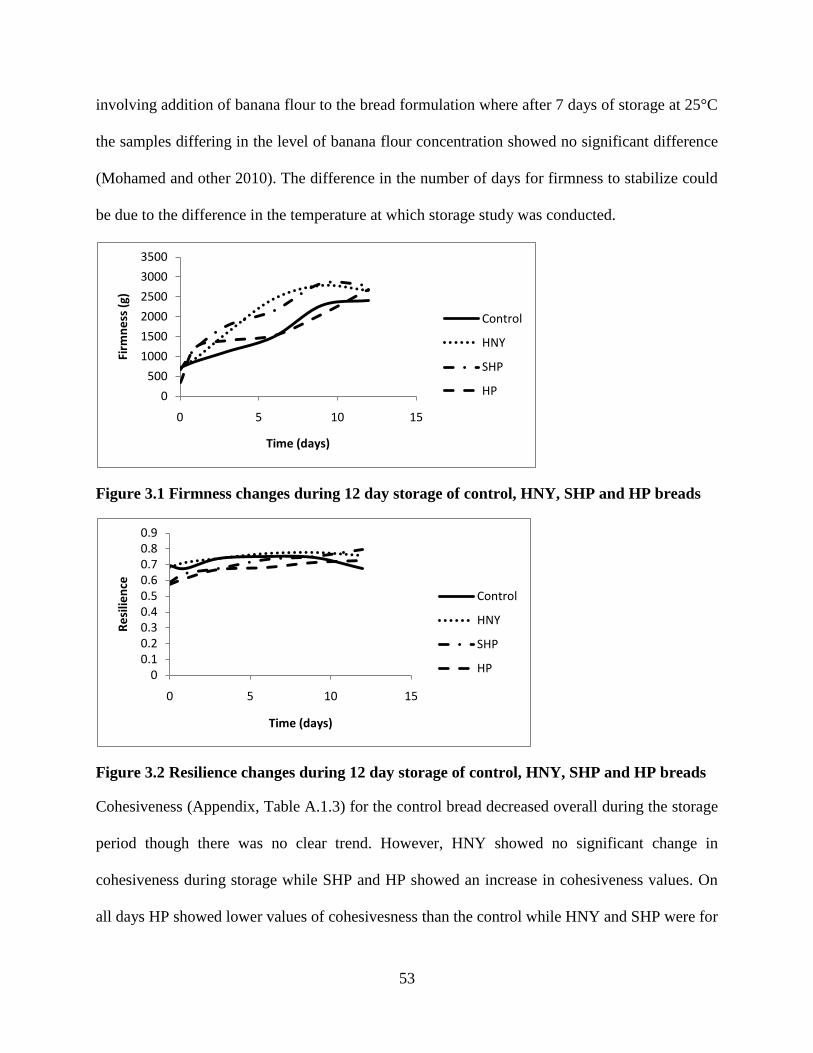
53
involving addition of banana flour to the bread formulation where after 7 days of storage at 25°C
the samples differing in the level of banana flour concentration showed no significant difference
(Mohamed and other 2010). The difference in the number of days for firmness to stabilize could
be due to the difference in the temperature at which storage study was conducted.
Figure 3.1 Firmness changes during 12 day storage of control, HNY, SHP and HP breads
Figure 3.2 Resilience changes during 12 day storage of control, HNY, SHP and HP breads
Cohesiveness (Appendix, Table A.1.3) for the control bread decreased overall during the storage
period though there was no clear trend. However, HNY showed no significant change in
cohesiveness during storage while SHP and HP showed an increase in cohesiveness values. On
all days HP showed lower values of cohesivesness than the control while HNY and SHP were for
0
500
1000
1500
2000
2500
3000
3500
0 5 10 15
Firm
ne
ss (
g)
Time (days)
Control
HNY
SHP
HP
00.10.20.30.40.50.60.70.80.9
0 5 10 15
Re
silie
nce
Time (days)
Control
HNY
SHP
HP
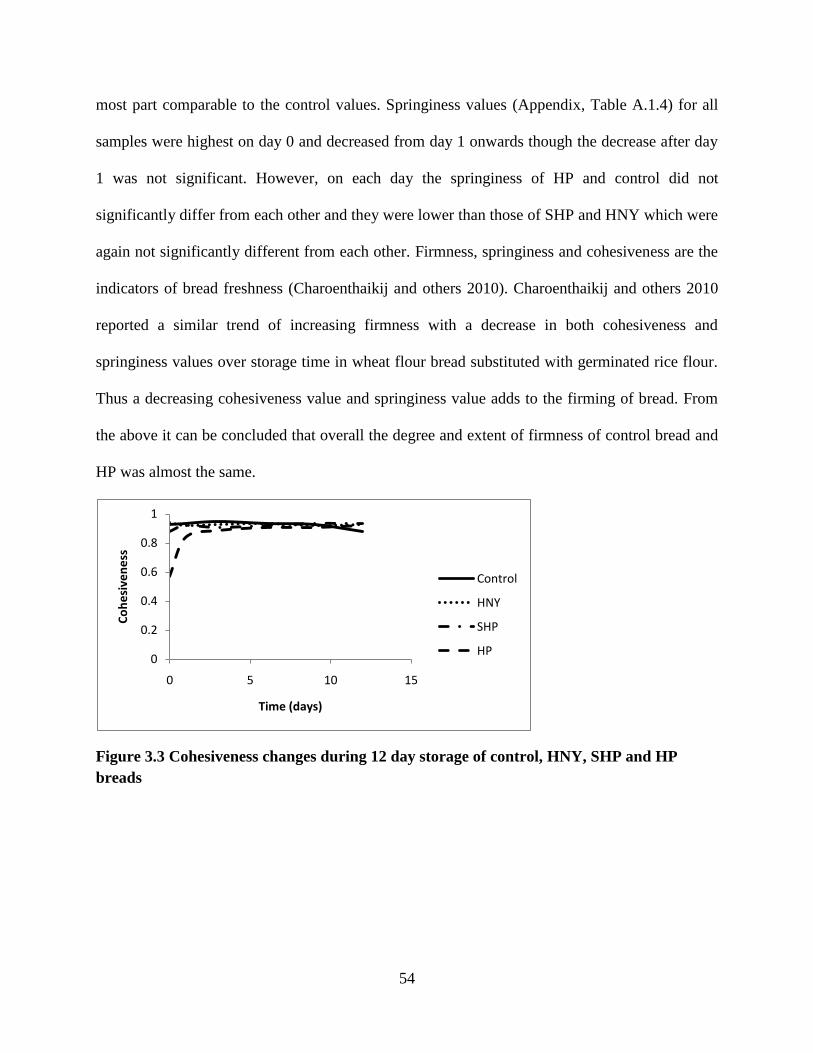
54
most part comparable to the control values. Springiness values (Appendix, Table A.1.4) for all
samples were highest on day 0 and decreased from day 1 onwards though the decrease after day
1 was not significant. However, on each day the springiness of HP and control did not
significantly differ from each other and they were lower than those of SHP and HNY which were
again not significantly different from each other. Firmness, springiness and cohesiveness are the
indicators of bread freshness (Charoenthaikij and others 2010). Charoenthaikij and others 2010
reported a similar trend of increasing firmness with a decrease in both cohesiveness and
springiness values over storage time in wheat flour bread substituted with germinated rice flour.
Thus a decreasing cohesiveness value and springiness value adds to the firming of bread. From
the above it can be concluded that overall the degree and extent of firmness of control bread and
HP was almost the same.
Figure 3.3 Cohesiveness changes during 12 day storage of control, HNY, SHP and HP
breads
0
0.2
0.4
0.6
0.8
1
0 5 10 15
Co
he
sive
ne
ss
Time (days)
Control
HNY
SHP
HP
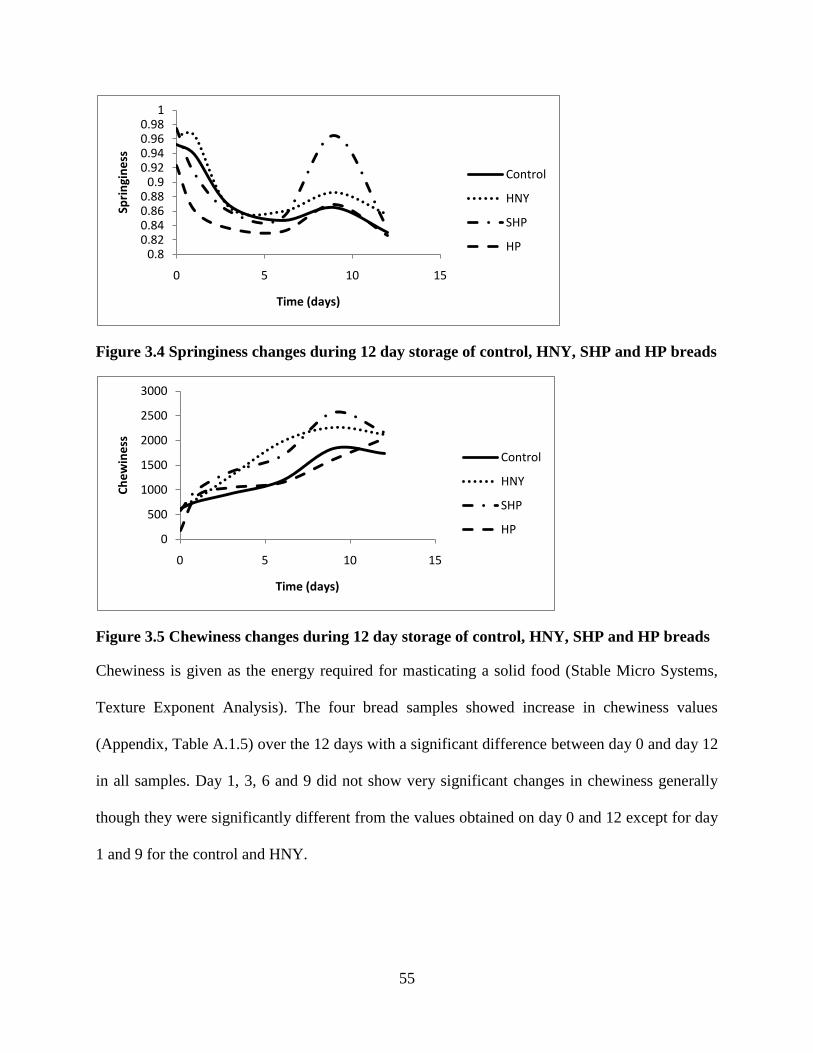
55
Figure 3.4 Springiness changes during 12 day storage of control, HNY, SHP and HP breads
Figure 3.5 Chewiness changes during 12 day storage of control, HNY, SHP and HP breads
Chewiness is given as the energy required for masticating a solid food (Stable Micro Systems,
Texture Exponent Analysis). The four bread samples showed increase in chewiness values
(Appendix, Table A.1.5) over the 12 days with a significant difference between day 0 and day 12
in all samples. Day 1, 3, 6 and 9 did not show very significant changes in chewiness generally
though they were significantly different from the values obtained on day 0 and 12 except for day
1 and 9 for the control and HNY.
0.80.820.840.860.88
0.90.920.940.960.98
1
0 5 10 15
Spri
ngi
ne
ss
Time (days)
Control
HNY
SHP
HP
0
500
1000
1500
2000
2500
3000
0 5 10 15
Ch
ew
ine
ss
Time (days)
Control
HNY
SHP
HP
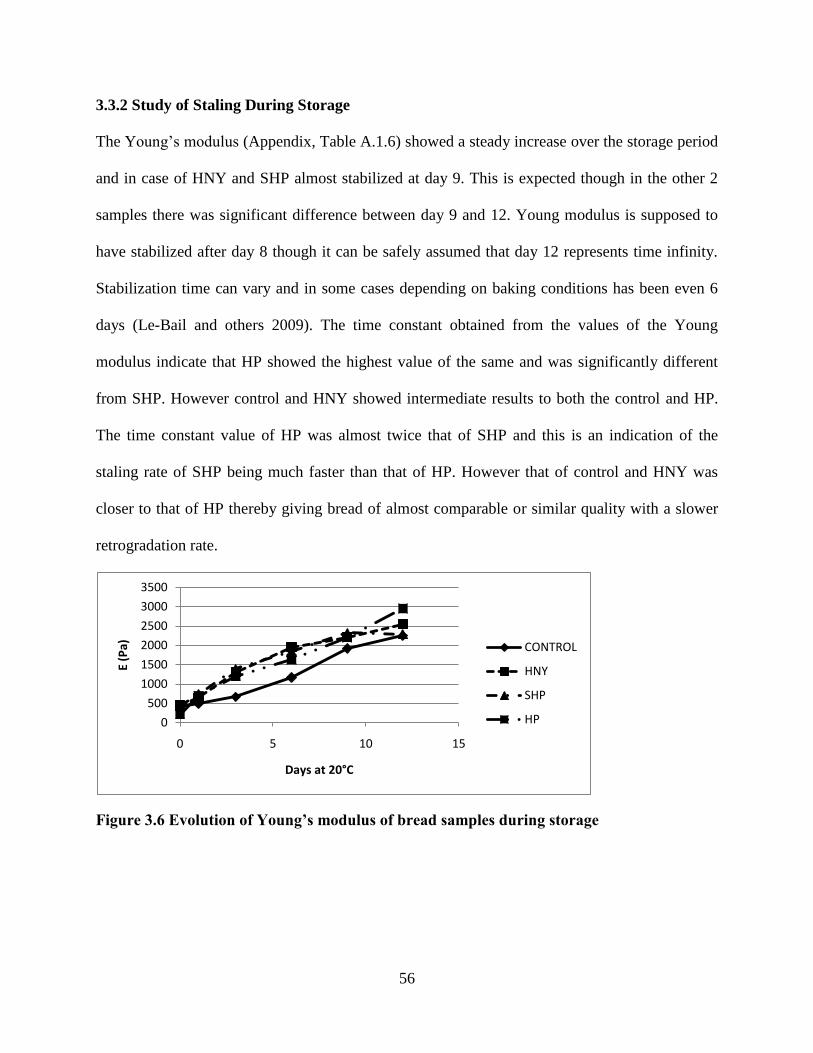
56
3.3.2 Study of Staling During Storage
The Young‘s modulus (Appendix, Table A.1.6) showed a steady increase over the storage period
and in case of HNY and SHP almost stabilized at day 9. This is expected though in the other 2
samples there was significant difference between day 9 and 12. Young modulus is supposed to
have stabilized after day 8 though it can be safely assumed that day 12 represents time infinity.
Stabilization time can vary and in some cases depending on baking conditions has been even 6
days (Le-Bail and others 2009). The time constant obtained from the values of the Young
modulus indicate that HP showed the highest value of the same and was significantly different
from SHP. However control and HNY showed intermediate results to both the control and HP.
The time constant value of HP was almost twice that of SHP and this is an indication of the
staling rate of SHP being much faster than that of HP. However that of control and HNY was
closer to that of HP thereby giving bread of almost comparable or similar quality with a slower
retrogradation rate.
Figure 3.6 Evolution of Young’s modulus of bread samples during storage
0
500
1000
1500
2000
2500
3000
3500
0 5 10 15
E (P
a)
Days at 20°C
CONTROL
HNY
SHP
HP
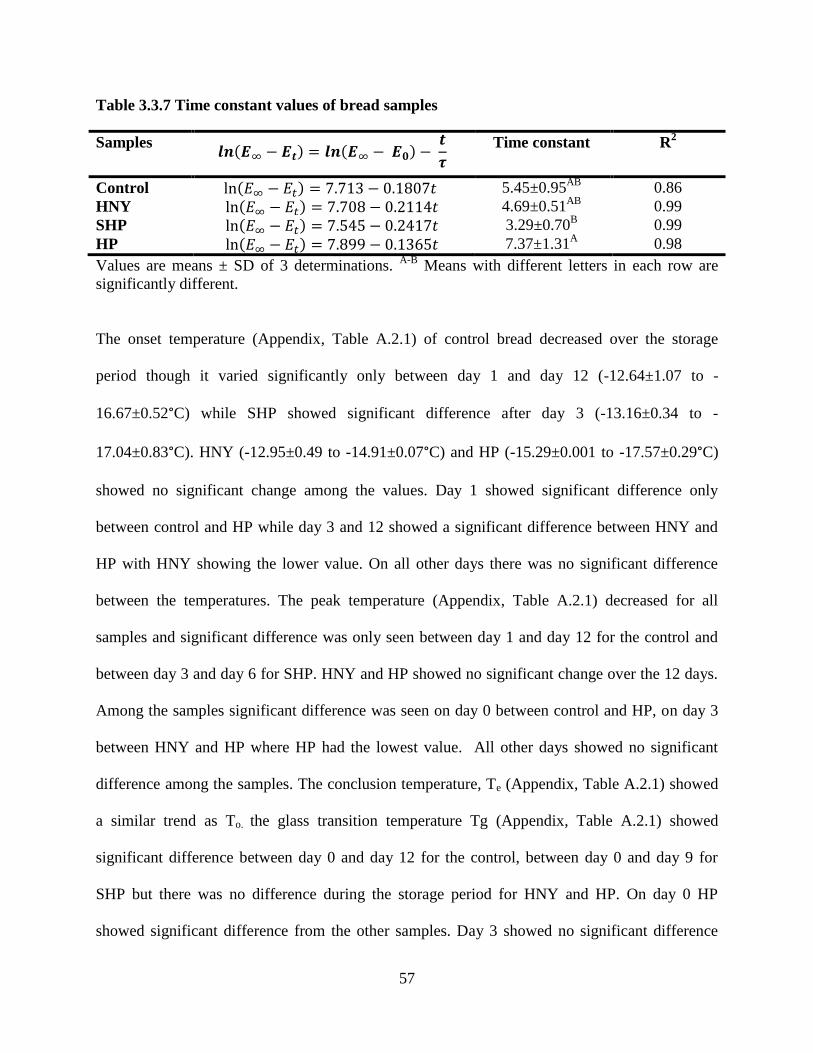
57
Table 3.3.7 Time constant values of bread samples
Samples
Time constant R2
Control 5.45±0.95AB
0.86
HNY 4.69±0.51AB
0.99
SHP 3.29±0.70B 0.99
HP 7.37±1.31A 0.98
Values are means ± SD of 3 determinations. A-B
Means with different letters in each row are
significantly different.
The onset temperature (Appendix, Table A.2.1) of control bread decreased over the storage
period though it varied significantly only between day 1 and day 12 (-12.64±1.07 to -
16.67±0.52°C) while SHP showed significant difference after day 3 (-13.16±0.34 to -
17.04±0.83°C). HNY (-12.95±0.49 to -14.91±0.07°C) and HP (-15.29±0.001 to -17.57±0.29°C)
showed no significant change among the values. Day 1 showed significant difference only
between control and HP while day 3 and 12 showed a significant difference between HNY and
HP with HNY showing the lower value. On all other days there was no significant difference
between the temperatures. The peak temperature (Appendix, Table A.2.1) decreased for all
samples and significant difference was only seen between day 1 and day 12 for the control and
between day 3 and day 6 for SHP. HNY and HP showed no significant change over the 12 days.
Among the samples significant difference was seen on day 0 between control and HP, on day 3
between HNY and HP where HP had the lowest value. All other days showed no significant
difference among the samples. The conclusion temperature, Te (Appendix, Table A.2.1) showed
a similar trend as To. the glass transition temperature Tg (Appendix, Table A.2.1) showed
significant difference between day 0 and day 12 for the control, between day 0 and day 9 for
SHP but there was no difference during the storage period for HNY and HP. On day 0 HP
showed significant difference from the other samples. Day 3 showed no significant difference
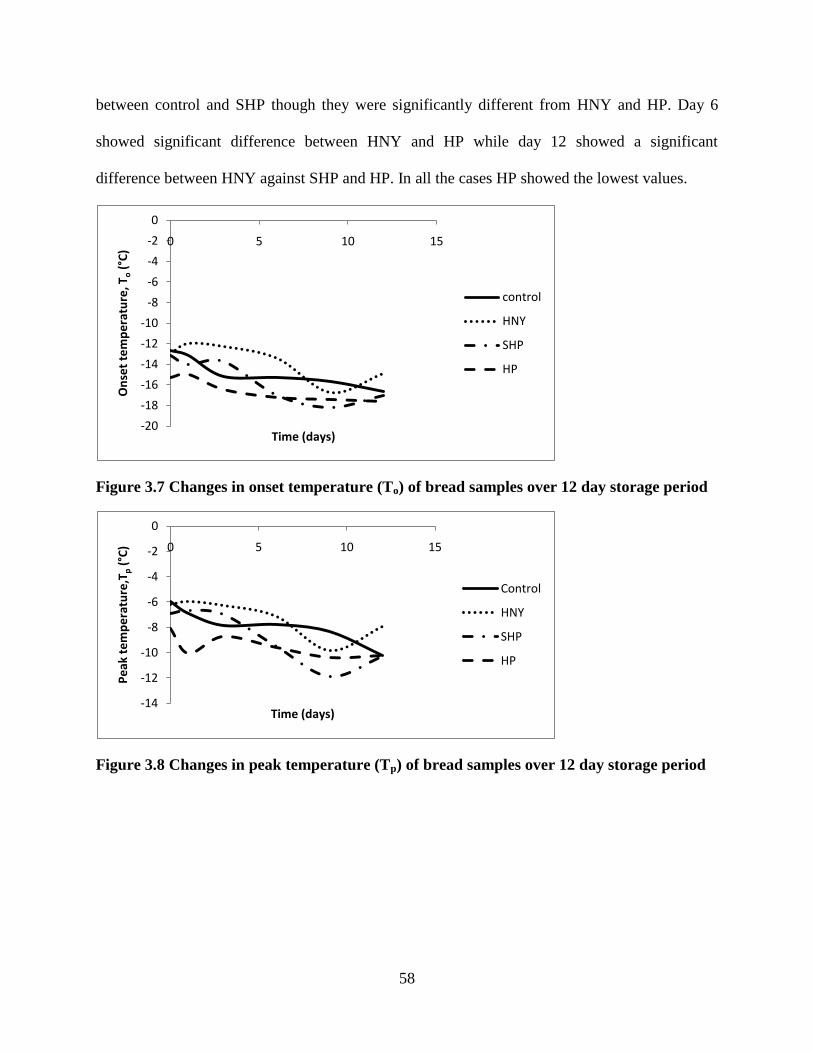
58
between control and SHP though they were significantly different from HNY and HP. Day 6
showed significant difference between HNY and HP while day 12 showed a significant
difference between HNY against SHP and HP. In all the cases HP showed the lowest values.
Figure 3.7 Changes in onset temperature (To) of bread samples over 12 day storage period
Figure 3.8 Changes in peak temperature (Tp) of bread samples over 12 day storage period
-20
-18
-16
-14
-12
-10
-8
-6
-4
-2
0
0 5 10 15
On
set
tem
pe
ratu
re, T
o(°
C)
Time (days)
control
HNY
SHP
HP
-14
-12
-10
-8
-6
-4
-2
0
0 5 10 15
Pe
ak t
em
pe
ratu
re,T
p(°
C)
Time (days)
Control
HNY
SHP
HP
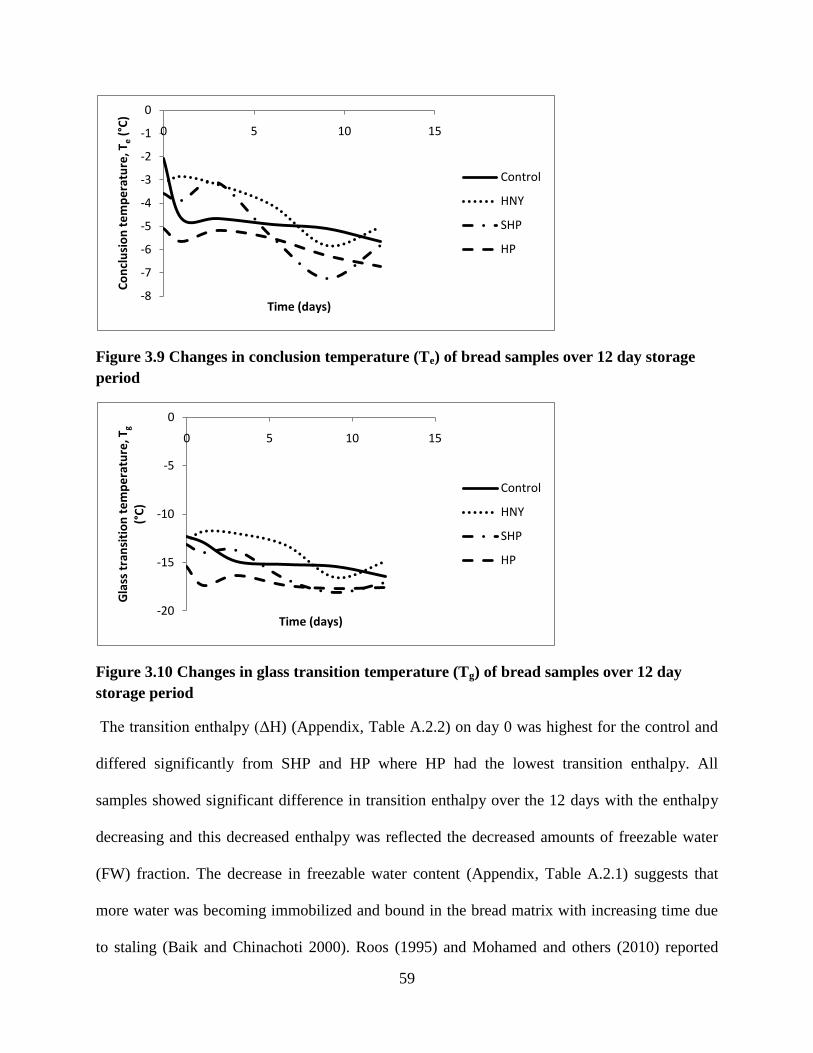
59
Figure 3.9 Changes in conclusion temperature (Te) of bread samples over 12 day storage
period
Figure 3.10 Changes in glass transition temperature (Tg) of bread samples over 12 day
storage period
The transition enthalpy (ΔH) (Appendix, Table A.2.2) on day 0 was highest for the control and
differed significantly from SHP and HP where HP had the lowest transition enthalpy. All
samples showed significant difference in transition enthalpy over the 12 days with the enthalpy
decreasing and this decreased enthalpy was reflected the decreased amounts of freezable water
(FW) fraction. The decrease in freezable water content (Appendix, Table A.2.1) suggests that
more water was becoming immobilized and bound in the bread matrix with increasing time due
to staling (Baik and Chinachoti 2000). Roos (1995) and Mohamed and others (2010) reported
-8
-7
-6
-5
-4
-3
-2
-1
0
0 5 10 15C
on
clu
sio
n t
em
pe
ratu
re, T
e(°
C)
Time (days)
Control
HNY
SHP
HP
-20
-15
-10
-5
0
0 5 10 15
Gla
ss t
ran
siti
on
te
mp
era
ture
, Tg
(°C
)
Time (days)
Control
HNY
SHP
HP
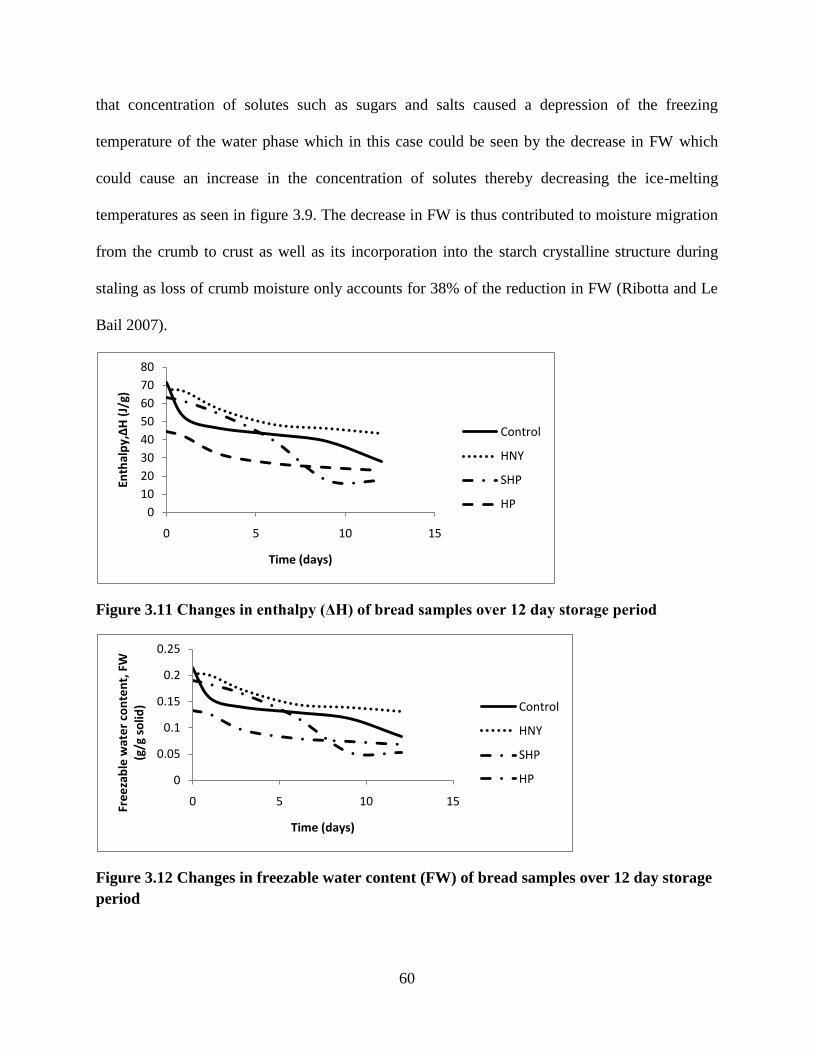
60
that concentration of solutes such as sugars and salts caused a depression of the freezing
temperature of the water phase which in this case could be seen by the decrease in FW which
could cause an increase in the concentration of solutes thereby decreasing the ice-melting
temperatures as seen in figure 3.9. The decrease in FW is thus contributed to moisture migration
from the crumb to crust as well as its incorporation into the starch crystalline structure during
staling as loss of crumb moisture only accounts for 38% of the reduction in FW (Ribotta and Le
Bail 2007).
Figure 3.11 Changes in enthalpy (ΔH) of bread samples over 12 day storage period
Figure 3.12 Changes in freezable water content (FW) of bread samples over 12 day storage
period
0
10
20
30
40
50
60
70
80
0 5 10 15
Enth
alp
y,Δ
H (
J/g)
Time (days)
Control
HNY
SHP
HP
0
0.05
0.1
0.15
0.2
0.25
0 5 10 15
Fre
eza
ble
wat
er
con
ten
t, F
W
(g/g
so
lid)
Time (days)
Control
HNY
SHP
HP
61
3.4 Conclusion
A bread formulation using a 50% and 100% substitution of sugar with honey powder was
developed. Physico-chemical and texture analysis of bread samples over a 12 day storage period
have shown favorable and comparable characteristics of HP to the control bread. Loaf volume of
HP was the highest in comparison with SHP and HNY as well as control. Staling rate was
comparable between HP and control while SHP showed the highest staling rate. In terms of
firmness HP was closer to the control on all days of storage while SHP and HNY showed
extremely high values of firmness on all days. In terms of freezable water content HP had the
least value as compared to the other three samples. More research is needed to understand the
phenomenon of moisture migration. Overall, substitution of sucrose with 100% honey powder
proved to be a viable option given the favorable characteristics it transferred to the bread as well
as due to its characteristics being closest to the control.
62
CHAPTER 4 SUMMARY AND CONCLUSION
In this study honey obtained locally in Louisiana was characterized based on its physico-
chemical characteristics. The characterized honey was further converted to a dried powder by
spray drying using retrograded corn starch as a drying agent. The retrograded starch is a resistant
starch. The honey powder so produced was used as an alternative sweetener to sucrose in a
bakery product – bread. The honeys obtained were found to be acidic in nature, with high levels
of fructose and glucose as expected and with extremely low levels of maltose and sucrose. The
honeys were golden yellow in color and had high amounts of solids. Viscosities of the honey
ranged between 7.79 and 9.15 Pa s and showed the presence of slight amounts of yield stress.
However the honey samples showed Newtonian behavior at higher temperatures with flow
behavior index close to unity. Activation energy of the samples ranged between 74.57 and 75.92
kJ/mol. The samples were spray dried and the powders obtained were studied using SEM as well
as by physico-chemical characterization. Good quality, well dispersed powders were obtained.
A comparison of the breads baked with sucrose (control), liquid honey (HNY), 50% honey
powder (SHP) and 100% honey powder (HP) showed that bread with NHY and SHP showed
faster and greater firming than that of the bread containing sucrose or honey powder. This was
indicated by the higher time constant of the HP and the control compared to SHP. Texture
analysis also revealed a higher firmness of HNY, SHP than the control and HP. RVA analysis of
the flour mixtures also showed that total setback increased in the same order as above indicating
a lower rate of retrogradation for HP as compared to control. Loaf volume was significantly
higher for HP for the same formulation. DSC analysis of the four samples revealed lower
freezable water in HP than the other samples. Overall it is clear that HP showed comparable
characteristics to the control cases and in most cases was better than SHP AND HNY. Thus this

63
study showed that honey powder could be used successfully to replace wholly or partly sucrose
as an alternative sweetener.

64
REFERENCES
Abramovic H, Jamnik M, Burkan L, Kac M. 2008. Water activity and water content in
Slovenian honeys. Food Control 19: 1086-1090.
Abu-Jdayil B, Ghzawi AM, Al-Malah K, Zaitoun S. 2002. Heat effect on rheology of light-
and dark-colored honey. Journal of Food Engineering 51: 33-38.
Ahmed J, Prabhu ST, Raghavan GST, Ngadi M. 2007. Physico-chemical, rheological,
calorimetric and dielectric behavior of selected Indian honeys. Journal of Food Engineering
79: 1207-1213.
Al-Khalifa AS, Al-Arify IA. 1999. Physicochemical characteristics and pollen spectrum of
some Saudi honeys. Food Chemistry 67: 21-25.
Al-Malah KIM, Abu-Jdayil B, Zaitoun S, Al-Majeed Ghazwi A. 2001. Application of WLF
and Arrhenius kinetics to rheology of selected dark-colored honey. Journal of Food Process
Engineering 24: 341-357.
Al-Mamary M, Al-Meeri A, Al-Habori M. 2002. Antioxidant activities and total phenolics of
different types of honey. Nutrition Research 22: 1041-1047.
Altamirano-Fortoul R, Rosell CM. 2011. Physico-chemical changes in breads from bake off
technologies during storage. LWT – Food Science and Technology 44:631-636.
Al-Waili NS, Haq A. 2004. Effect of honey on antibody production against thymus-
dependent and thymus-independent antigens in primary and secondary immune responses.
Journal of Medicinal Food 7: 491-494.
Al-Waili NS. 2003. Effects of daily consumption of honey solution on hematological indices
and blood levels of minerals and enzymes in normal individuals. Journal of Medicinal Food
6: 135-140.
Ames BN, Shigenaga MK, Hagen TM. 1993. Oxidants, antioxidants, and the degenerative
diseases of aging. Proceedings of the National Academy of Sciences of the United States of
America 90:7915-7922.
Anklam E. 1998. A review of the analytical methods to determine the geographical and
botanical origin of honey. Food Chemistry 63: 549-562
Antony S, Rieck JR, Dawson PL. 2000. Effect of dry honey on oxidation in turkey breast
meat. Poultry Science 79: 1846-1850.
Anupama D, Bhat KK, Sapna VK. 2003. Sensory and physico-chemical properties of
commercial samples of honey. Food Research International 36: 183-191.
Arcot J, Brand-Miller J. 2005. A preliminary assesment of the glycemic index of honey.
http://www.rirdc.gov.au/reports/HBE/05-027sum.html 1-24.
65
Azeredo LC, Azeredo MAA, de Souza SR, Dutra VML. 2003. Protein contents and
physicochemical properties in honey samples of Apis mellifera of different floral origins.
Food Chemistry 80: 249-254.
Baik M, Chinachoti P. 2000. Moisture redistribution and phase transitions during bread
staling. Cereal Chemistry 77: 484-488.
Barcenas ME, Rosell CM. 2005. Effect of HPMC addition on the microstructure, quality and
aging of wheat bread. Food Hydrocolloids 19: 1037-1043.
Bhandari B, D‘Aray B, Chow S. 1999. A research note: Rheology of selected Australian
Honeys. Journal of Food Engineering 41: 65-68.
Bhandari BR, Patel KC, Chen XD. 2008. Spray drying of food materials – process and
product characteristics. In Drying Technologies in Food Processing. Chen XD, Mujumdar
AS (eds.) Blackwell Publishing, UK.
Bogdanov S, Jurendic T, Sieber R, Gallmann P. 2008. Honey for Nutrition and Health: A
Review. Journal of the American College of Nutrition 27 (6): 677-689.
Bogdanov S. Honey as a Nutritional and Functional food in Book of honey. 2010.
Borla OP, Motta EL, Saiz AI, Fritz R. 2004. Quality parameters and baking performance of
commercial gluten flours. Lebensmittel-Wissenschaft und-Technologie 30: 178-183.
Brown MA, Storlein LH, Brown IL. 2003. Coking attenuates the ability of high amylose
meals to reduce plasma insulin concentrations in rats. British Journal of Nutrition 90: 823-
827.
Calvel R, Wirtz RL, MacGuire JJ. 2001. Staling. In The taste of bread. Aspen publishers.
Cano-Chauca M, Stringheta PC, Ramos AM, Cal-Vidal J. 2005. Effect of the carriers on the
microstructure of mango powder obtained by spray drying and its functional characterization.
Innovative Food Science and Emerging Technologies 6: 420-428.
Cao G, Sofic E, Prior RL. 1997. Antioxidant and prooxidant behaviour of flavonoids:
structure-activity relationships. Free Radical Biology and Medicine 22: 749-760.
Casterline JL, Oles CJ, Ku Y. 1997. In vitro fermentation of various food fiber fractions.
Journal of Agricultural and Food Chemistry 45: 2463-2467.
Charoenthaikij P, Jangchud K, Jangchud A, Prinyawiwatkul W, No HK, King JM. 2010.
Physicocheical Properties and Consumer Acceptance of Wheat-Germinated Brown Rice
Bread during Storage Time. Journal of Food Science 75: S333-339.
Chen L, Mehta A, Berenbaum M, Zangerl AR, Engeseth NJ. 2000. Honeys from different
floral sources as inhinitors of enzymatic browning in fruit and vegetable homogenates.
Journal of Agricultural and Food Chemistry 48: 4997-5000.
66
Codex Alimentarius Commission-CAC (1981). Vol.II, 1st ed. Codex Stan. 12.
Corbella E, Cozzolino D. 2006. Classification of the floral origin of Uruguayan honeys by
chemical and physical characteristics combined with chemometrics. Lebensmittel-
Wissenschaft und-technologie 39: 534-539.
Cui ZW, Sun LJ, Chen W, Sun DW. 2008. Preparation of dry honey by microwave-vacuum
drying. Journal of Food Engineering 84: 582-590.
Curti E, Bubici S, Carini E, Baroni S, Vittadini E. 2011. Water molecular dynamics during
bread staling by Nuclear Magnetic Resonance. LWT – Food Science and Technology 44:
854-859.
Eerlingen RC, Crombez M, Delacour JA. 1993. Enzyme-resistant starch.I. Quantitative and
qualitative influence of incubation time and temperature of autoclaved starch on resistant
starch formation. Cereal Chemistry 70: 339-344.
Ellis WO, Obubuafo AK, Ofosu-Okyere A, Marfo EK, Osei-Agyemang K, Odame-Darkwah
JK. 1997. A survey of bread defects in Ghana. Food Control 8: 72-77.
Englyst HN, Trowell H, Southgate DAT, Cummings JH. 1987. Dietary fiber and resistant
starch. American Journal of Clinical Nutrition 46: S30-S50.
Estevinho L, Pereira AP, Moreira L, Dias LG, Pereira E. 2008. Antioxidant and antimicrobial
effects of phenolic compounds extracts of Northeast Portugal honey. Food and Chemistry
Toxicology 46: 3774-3779.
Felsner ML, Cano CB, Bruns RE, Watanabe HM, Almeida-Muradian, Matos JR. 2004.
Characterization of monofloral honeys by ash contents through hierarchical design. Journal
of Food Composition and Analysis 17: 737-747.
Finola MS, Lasagno MC, Mariolo JM. 2007. Microbiological and chemical characterization
of honeys from central Argentina. Food Chemistry 100: 1649-1653.
Foster-Powell K, Holt SHA, Brand –Miller JC. 2002. International table of glycemic index
and glycemic load values: 2002. American Journal of Clinical Nutrition 76:5-56.
Fu YC. 2006. Microwave Heating in Food Processing. In Handbook of food science,
technology, and engineering. Hui YH (ed.). Vol 3 CRC Press.
Fuentes-Zaragoza E, Riquelme-Navarrete MJ, Sanchez-Zapata E, Perez-Alvarez JA. 2010.
Resistant starch as a functional ingredient: A review. Food Research International 43: 931-
942.
Gallagher E, Gormley TR, Arendt EK. 2003. Crust and crumb characteristics of gluten free
breads. Journal of Food Engineering 56:153-161.
67
Gallant DJ, Bouchet B, Buleon A, Perez S. 1992. Physical characteristics of starch granules
and susceptibility to enzymatic degradation. European Journal of Clinical Nutrition 46: S3-
S16.
Gellynck X, Kuhne B, Bockstaele FV, Van de Walle D, Dewettinck. 2009. Consumer
perception of bread quality. Appetite 53: 16-23.
Gerrard JA, Every D, Sutton KH, Gilpin MJ. 1997. The Role of Maltodextrins in the Staling
of Bread. Journal of Cereal Science 26: 201-209.
Gharsallaoui A, Roudaut G, Chambin O, Voilley A, Saurel R. 2007. Applications of spray-
drying in microencapsulation of food ingredients: An overview. Food Research International
40:1107-1121.
Giannou V, Kessoglou V, Tzia C. 2003. Quality and safety characteristics of bread made
from frozen dough. Trends in Food Science and Technology 14:99-108.
Gleiter RA, Horn H, Isengard HD. 2006. Influence of type and state of crystallization on the
water activity of honey. Food Chemistry 96: 441-445.
Gomes S, Dias LG, Moreira LL, Rodrigues P, & Estevinho L. 2010. Physicochemical,
microbiological and anti-microbial properties of commercial honeys from Portugal. Food and
Chemical Toxicology 48: 544-548.
Goula AM, Adamopolous KG. 2005. Spray drying of tomato pulp in dehumidified air: II.
The effect on powder properties. Journal of Food Engineering 66: 35-42.
Greene JL, Bovell-Benjamin AC. 2004. Macroscopic and sensory evaluation of bread
supplemented with sweetpotato flour. Journal of Food Science 69: 167-173.
Guler A, Bakan A, Nisbet C, Yavuz O. 2007. Determination of important biochemical
properties of honey to discriminate pure and adultered honey with sucrose (Saccharun
officinarum) syrup. Food Chemistry 105: 1119-1125.
Haralampu SG. 2000. Resistant starch: A review of the physical properties and biological
impact of RS3. Carbohydrate Polymers 41: 285-292.
Harnkarnsujarit N, Charoenrein S. 2011. Effect of water activity on sugar crystallization and
β-carotene stability of freeze-dried mango powder. Journal of Food Engineering doi:
10.1016/j.jfoodeng.2011.03.026.
Hathorn CS, Biswas MA, Gichuhi PN, Bovell-Benjamin AC. 2008. Comparison of chemical,
physical, micro-structural, and microbial properties of breads supplemented with sweetpotato
flour and high gluten dough enhancers. LWT 41: 803-815.
Hermosin I, Chicon RM, Cabezudo MD. 2003. Free amino acid composition and botanical
origin of honey. Food Chemistry 83: 263-268.
68
Higgins JA. 2004. Resistant starch: Metabolic effects and potential health benefits. Journal of
the AOAC International 87: 761-768.
Jeffery AE, Echazarreta CM. 1996. Medical uses of honey. Rev Biomed 7: 43-49.
Junzheng P, Changying J. 1998. General Rheological Model for Natural Honeys in China.
Journal of Food Engineering 36: 165-168.
Juszczak L, Fortuna T. 2006. Rheology of selected Polish honeys. Journal of Food
Engineering 75: 43-49.
Katsilambros NL, Philippides P, Touliatou A, Georgakopoulos K, Kofotzouli L, Frangaki D,
Siskoudis P, Marangos M, Sfikakis P. 1988. Metabolic effects of honey (alone or combined
with other foods) in type II diabetics. Acta Diabetologica Latina 25: 197-203.
Kayacier A, Karaman S. 2008. Rheological and physicochemical characteristics of selected
Turkish honeys. Journal of Texture Studies 39: 17-27.
Kent NL, Evers AD. 1994. Technology of cereals: an introduction for students of food
science and agriculture. Oxford, New York:Pergamon.
Kha TC, Nguyen MH, Roach PD. 2010. Effects of spray drying conditions on the
physicochemical and antioxidant properties of the Gac (Momordica cochinchinensis) fruit
aril powder. Journal of Food Engineering 98: 385-392.
Korus J, Witczak M, Ziobro R, Juszczak L. 2009. The impact of resistant starch on
characteristics of gluten-free dough and bread. Food Hydrocolloids 23: 988-995.
Lai HM, Lin TC. 2006. Bakery Products. IN Handbook of food science, technology, and
engineering, Vol4. Hui YH (ed). CRC press.
Lazaridou A, Biliaderis CG, Bacandritsos N, Sabatini AG. 2004. Composition, thermal and
rheological behaviour of selected Greek honeys. Journal of Food Engineering 64: 9-21.
Le-Bail A, Boumali K, Jury V, Bem-Aissa F, & Zuniga R. 2009. Impact of the baking
kinetics on staling rate and mechanical properties of bread crumb and degassed bread crumb.
Journal of Cereal Science 50: 235-240
Lee CY, Smith NL, Underwood BA, Morse RA. 1990. Honey protein from different bee
species in relation to apple juice clarification activity. American Bee Journal 130: 478-479.
Lei FU, Ji-chun T, Cai-ling S, Chun L. 2008. RVA and Farinograph Properties Study on
Blends of Resistant Starch and Wheat Flour. Agricultural Sciences in China 7: 812-822.
Leon A, Duran E, Benedito De Barber C. 2002. Utilization of enzyme mixture to retard bread
crumb firming. Journal of agricultural and Food Chemistry 50:1416-1419.
Lieux M.H. 1972. A melissopalynological study of 54 Louisiana honeys. Review of
Palaeobotany and Palynology, 95-124.
69
Liu R, Xu G. 2008. Effects of resistant starch on colonic preneoplastic aberrant crypt foci in
rats. Foods and Chemical toxicology 46: 2672-2679.
Liviu Al M, Daniel D, Moise A, Bobis O, Laslo L, Bogdanov S. 2009. Physico-chemical and
bioactive properties of different floral origin honeys from Romania. Food Chemistry 112:
863-867.
Lodi A, Abduljalil AM, Vodovotz Y. 2007. Characterization of water distribution in bread
during storage using magnetic resonance imaging. Magnetic Resonance Imaging 25: 1449-
1458.
Lunn J, Buttriss JL. 2007. Carbohydrates and dietary fibre. Nutrition Bulletin 32: 21-64.
Mandala I, Karabela D, Kostaropoulos A. 2007. Physical properties of breads containing
hydrocolloids stored at low temperature. I. Effect of chilling. Food Hydrocolloids 21: 1397-
1406.
Marteau P. 2001. Prebiotics and probiotics for gastrointestinal health. Clinical Nutrition 20:
41-45.
Masters K. 1972. Spray Drying Fundamentals. In Spray Drying An Introduction to
Principles, Operational Practice and Applications. Chemical and Process Engineering Series,
Leonard Hill Books, UK.
Masters K. 1996. Deposit-free spray drying: Dream or reality. In Proceedings of the 10th
international drying symposium,Vol A : 52-60, IDS‘96, Krakow, Poland.
Mclellan MR, Kime RW, Lee CY, Long TM. 1995. Effect of honey as an antibrowning agent
in light raisin processing. Journal of Food Processing and Preservation 19: 1-8.
Mendes E, Proenca EB, Ferreira IMPLVO, Ferreira MA. 1998. Quality evaluation of
Portugese honey. Carbohydrate polymers 37: 219-223.
Migdal W, Owczarczyk HB, Kedzia B, Holderna-Kedzia E, Madajczyk D. 2000.
Microbiological decontamination of natural honey by irradiation. Radiation Physics and
Chemistry 57: 285-288.
Mikulikova D, Masar S, Kraic J. 2008. Biodiversity of legume health promoting starch.
Starch 60: 426-432.
Mirzaee E, Rafiee S, Keyhani A, Emam-Djomeh Z. 2009. Research in Agricultural
Engineering 55(3): 114-120.
Moayedallaie S, Mirzaei M, Paterson J. 2010. Bread improvers: Comparison of a range of
lipases with a traditional emulsifier. Food Chemistry 122: 495-499.
Mohamed A, Rayas-Duarte P, Xu J. 2008. Hard-red spring wheat/C-TRIM 20 bread:
Formulation, processing and texture analysis. Food Chemistry 107: 516-524.
70
Mohamed A, Xu J, Singh M. 2010. Yeast leavened banana-bread: Formulation, processing,
colour and texture analysis. Food Chemistry 118: 620-626.
Mondal A, Datta AK. 2008. Bread baking - A review. Journal of Food Engineering 86: 465-
474.
Mossel B, Bhandari B, D‘Arcy B, Caffin N. 2000. Use of an Arrhenius Model to Predict
Rheological Behavious in some Australian Honeys. Lebensmittel Wissenchauft und
Technologie 33: 545-552.
Munroe JA. 1943. The viscosity and thixotropy of honey. Journal of Entomology 36: 769-
777.
Nagai T, Inoue R, Kanamori N, Suzuki N, Nagashima T. 2006. Characterization of honey
from different floral sources. Its functional properties and effects of honey species on storage
of meat. Food Chemistry 15: 256-262.
National Agricultural Statistics Service, United States Department of Agriculture 2011.
National Honey Board. 2005. Honey A Reference Guide to Nature‘s Sweetener.
National Honey Board, 303: 776-2337.
Nugent AP. 2005. Health properties of resistant starch. British Nutrition Foundation,
Nutrition Bulletin 30: 27-54.
Oszmianski J, Lee CY. 1990. Inhibition of polyphenol oxidase activity and browning of
honey. Journal of Agricultural and Food Chemistry 38: 1892-1895.
Ouchemoukh S, Louaileche H, Schweitzer P. 2007. Physicochemical characteristics and
pollen spectrum of some Algerian honeys. Food Control 18: 52-58.
Ouchemoukh S, Schweitzer P, Bey MB, Djoudad-Kadji H, Louaileche H. 2010. HPLC sugar
profiles of Algerian honeys. Food Chemistry 121: 561-568.
Patel BK, Waniska RD, Seetharaman K. 2005. Impact of baking processes on bread firmness
and starch properties in breadcrumb. Journal of Cereal Science 42: 173-184.
Pateras IMC. 2007. Bread Spoilage and Staling. In Technology of breadmaking. Cauvain SP,
Young LS (eds). Second edition, Springer.
Penfield MP, & Campbell AM. 1990. Experimental food science (3rd
ed). San Diego, CA:
Academic Press pp. 362-421.
Perez-Alvarez JA. 2008a. Overview of meat products as functional foods. In J Fernandez-
Lopez and JA Perez-Alvarez (Eds.). Technological strategies for functional meat products
development (pp 1-17). Kerala, India: Transworld Research Network.
71
Philips J, Muir JG, Birkett A, Lu ZX, Jones GP, O‘Dea K, Young GP. 1995. Efect of
resistant starch on fecal bulk and fermentation-dependent events in human. American Journal
of Clinical Nutrition 62: 121-130.
Primo-Martin C, van Nieuwenhuijzen NH, Hamer RJ, van Vliet T. 2007. Crystallinity
changes in wheat starch during the bread-making process: Starch crystallinity in the bread
crust. Journal of Cereal Science 45: 219-226.
Pu J, Bankston D, Sathivel S. 2011. Production of Microencapsulated Crawfish
(Procambarus clarkii) Astaxanthin in Oil by Spray Drying Techniology. Drying Technology,
0: 1-11.
Quek SY, Chok NK, Swedlund P. 2007. The physicochemical properties of spray-dried
watermelon powders. Chemical Engineering and Processing 46: 386-392.
Ragaee S, Aal EMA. 2006. Pasting properties of starch and protein in selected cereals and
quality of their food products. Food Chemistry 95: 9-18.
Ramachandran S, Fontanille P, Pandey A, Larroche C. 2006. Gluconic Acid: Properties,
Applications and Microbial Production. Food Technology Biotechnology 44(2): 185-195.
Recondo MP, Elizalde BE, Buera MP. 2006. Modeling temperature dependence of honey
viscosity and of related supersaturated model carbohydrate systems. Journal of Food
Engineering: 77, 126-134.
Ribotta PD, Bail AL. 2007. Thermophysical assessment of bread during staling. LWT 40:
879-884.
Rodriguez GO, Ferrer BS, Ferrer A, Rodriguez B. 2004. Characterization of honey produced
in Venezuela. Food Chemistry 84: 499-502.
Roos YH. 1995. Water and phase transitions. IN Y. Roos (Ed.), Phase transitions in food,
New York, Academic Press.
Sablani SS, Shreshtha AK, Bhandari BR. 2008. A new method of producing date powder
granules: Physicochemical characteristics of powder. Journal of Food Engineering 87: 416-
421.
Sahu JK. 2008. The effect of additives on vacuum dried honey powder properties.
International Journal of Food Engineering, Vol.4, Iss. 8, Art. 9.
Sajilata MG, Singhal RS, Kulkarni PR. 2006. Resistant starch-a review. Comprehensive
Reviews in Food Science and Food Safety 5: 1-17.
Samanta A, Burden AC, Jones GR. 1985. Plasma glucose responses to glucose, sucrose and
honey in patients with diabetes mellitus: an analysis if glycaemic nad peak incremental
indices. Diabetic Medicine 2: 371-373
72
Samsonov M, Petrasov I. 1993. Rational variety of bakery products for nutrition of the
population. Bread Products 2: 38-41.
Scanlon MG, Sapirstein HD, Fahloul D. 2000. Mechanical properties of bread crumb
prepared from flours of different dough strength. Journal of Cereal Science 32: 235-243.
Scanlon MG, Zghal MC. 2001. Bread properties and crumb structure. Food Research
International 34: 841-864.
Schiraldi A, Dimitrios F. 2000. Mechanism of staling: An Overview. In Bread Staling.
Chinachoti P, Vodovotz Y (ed.). CRC Press.
Schramm DD, Karim M, Scrader HR, Holt RR, Cardetti M, Keen CL. 2003. Honey with high
levels of antioxidants can provide protection to healthy human subjects. Journal of
Agricultural and Food Chemistry 51: 1732-1735.
Shamai K, Bianco-Peled H, Shimoni E. 2003. Polymorphism of resistant starch type III.
Carbohydrate Polymers 54: 363-369.
Sharadanant R, Khan K. 2003. Effect of hydrophilic gums on the quality of frozen dough: II.
Bread characteristics. Cereal Chemistry 80: 773-780.
Sharma A, Yadav BS, Ritika. 2008. Resistant starch: physiological roles and food
applications. Food Reviews International 24: 193-234.
Shin HS, Ustunol Z. 2005. Carbohydrate compositon of honey from different floral sources
and their influence on growth of selected intestinal bacteria: An in vitro comparison. Food
Research International 38: 721-728.
Shogren RL, Mohamed AA, Carriere CJ. 2003. Sensory analysis of whole wheat/soy flour
breads. Sensory and Nutritive Quality of Food 68: 2141-2145.
Silva LR, Videira R, Monteiro AP, Valentao P, Andrade PB. 2009. Honey from Luso region
(Portugal): Physicochemical characteristics and mineral contents. Microchemical Journal
93:73-77.
Silvester KR, Englyst HN, Cummings JH. 1995. Ileal recovery of starch from whole diets
containing resistant starch measured in vitro and fermentation of illeal effluent. American
Journal of Clinical Nutrition 62: 403-411.
Snowdon JA, Cliver DO. 1996. Microorganisms in honey. International Journal of Food
Microbiology 31: 1-26.
Sopade PA, Halley P, Bhandari B, D‘Arcy B, Doebler C, Caffin N. 2002. Application of
Williams-Landel-Ferry model to the viscosity-temperature relationship of Australian honeys.
Journal of Food Engineering 56: 67-75.
Sozer N, Dalgic AC, Kaya A. 2007. Thermal, textural and cooking properties of spaghetti
enriched with resistant starch. Journal of Food Engineering 81: 476-484.
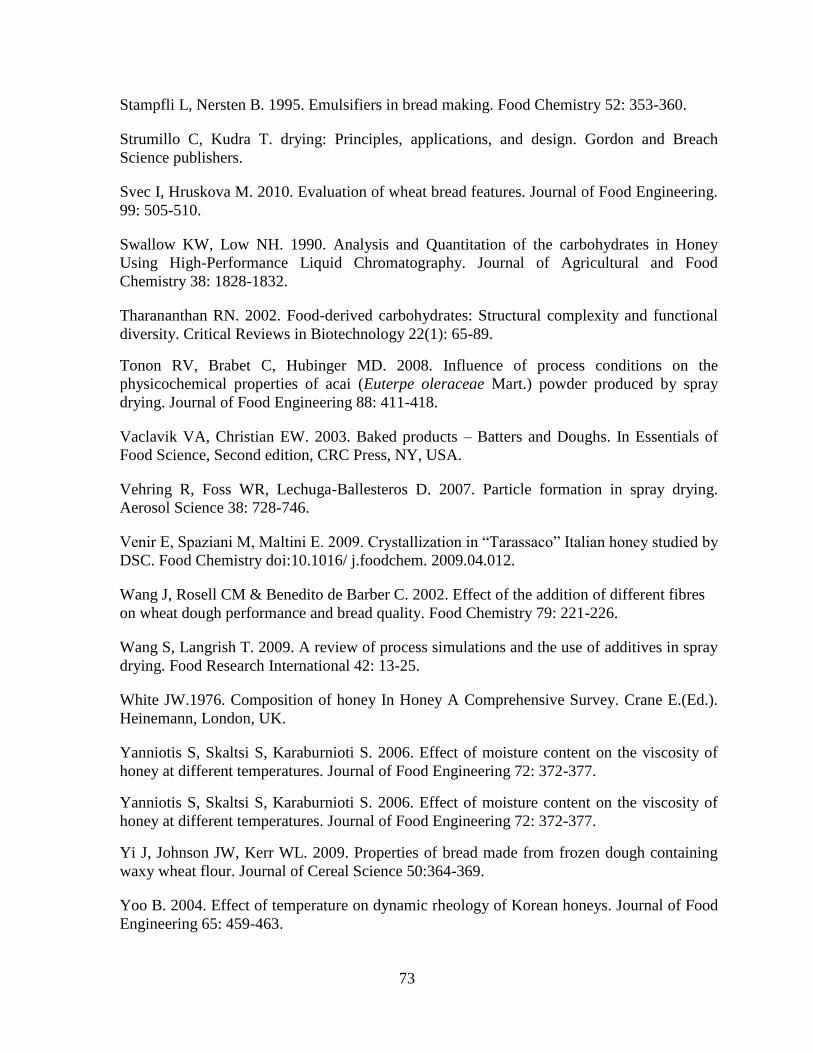
73
Stampfli L, Nersten B. 1995. Emulsifiers in bread making. Food Chemistry 52: 353-360.
Strumillo C, Kudra T. drying: Principles, applications, and design. Gordon and Breach
Science publishers.
Svec I, Hruskova M. 2010. Evaluation of wheat bread features. Journal of Food Engineering.
99: 505-510.
Swallow KW, Low NH. 1990. Analysis and Quantitation of the carbohydrates in Honey
Using High-Performance Liquid Chromatography. Journal of Agricultural and Food
Chemistry 38: 1828-1832.
Tharananthan RN. 2002. Food-derived carbohydrates: Structural complexity and functional
diversity. Critical Reviews in Biotechnology 22(1): 65-89.
Tonon RV, Brabet C, Hubinger MD. 2008. Influence of process conditions on the
physicochemical properties of acai (Euterpe oleraceae Mart.) powder produced by spray
drying. Journal of Food Engineering 88: 411-418.
Vaclavik VA, Christian EW. 2003. Baked products – Batters and Doughs. In Essentials of
Food Science, Second edition, CRC Press, NY, USA.
Vehring R, Foss WR, Lechuga-Ballesteros D. 2007. Particle formation in spray drying.
Aerosol Science 38: 728-746.
Venir E, Spaziani M, Maltini E. 2009. Crystallization in ―Tarassaco‖ Italian honey studied by
DSC. Food Chemistry doi:10.1016/ j.foodchem. 2009.04.012.
Wang J, Rosell CM & Benedito de Barber C. 2002. Effect of the addition of different fibres
on wheat dough performance and bread quality. Food Chemistry 79: 221-226.
Wang S, Langrish T. 2009. A review of process simulations and the use of additives in spray
drying. Food Research International 42: 13-25.
White JW.1976. Composition of honey In Honey A Comprehensive Survey. Crane E.(Ed.).
Heinemann, London, UK.
Yanniotis S, Skaltsi S, Karaburnioti S. 2006. Effect of moisture content on the viscosity of
honey at different temperatures. Journal of Food Engineering 72: 372-377.
Yanniotis S, Skaltsi S, Karaburnioti S. 2006. Effect of moisture content on the viscosity of
honey at different temperatures. Journal of Food Engineering 72: 372-377.
Yi J, Johnson JW, Kerr WL. 2009. Properties of bread made from frozen dough containing
waxy wheat flour. Journal of Cereal Science 50:364-369.
Yoo B. 2004. Effect of temperature on dynamic rheology of Korean honeys. Journal of Food
Engineering 65: 459-463.
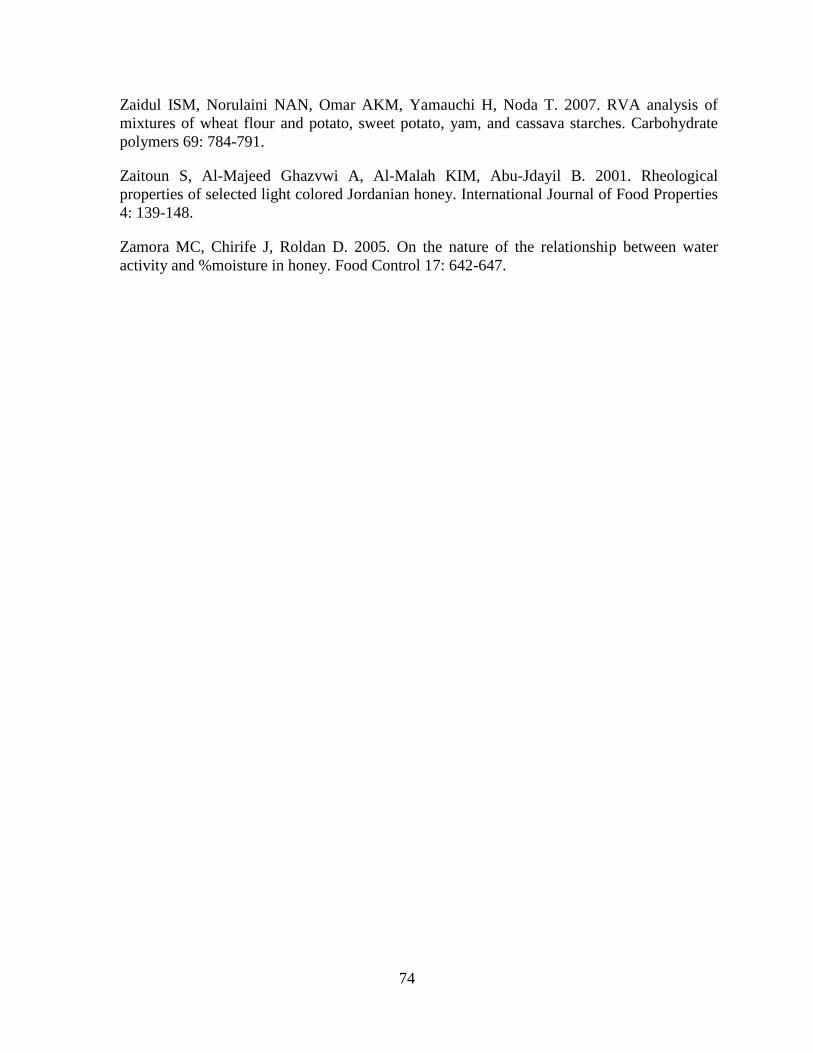
74
Zaidul ISM, Norulaini NAN, Omar AKM, Yamauchi H, Noda T. 2007. RVA analysis of
mixtures of wheat flour and potato, sweet potato, yam, and cassava starches. Carbohydrate
polymers 69: 784-791.
Zaitoun S, Al-Majeed Ghazvwi A, Al-Malah KIM, Abu-Jdayil B. 2001. Rheological
properties of selected light colored Jordanian honey. International Journal of Food Properties
4: 139-148.
Zamora MC, Chirife J, Roldan D. 2005. On the nature of the relationship between water
activity and %moisture in honey. Food Control 17: 642-647.
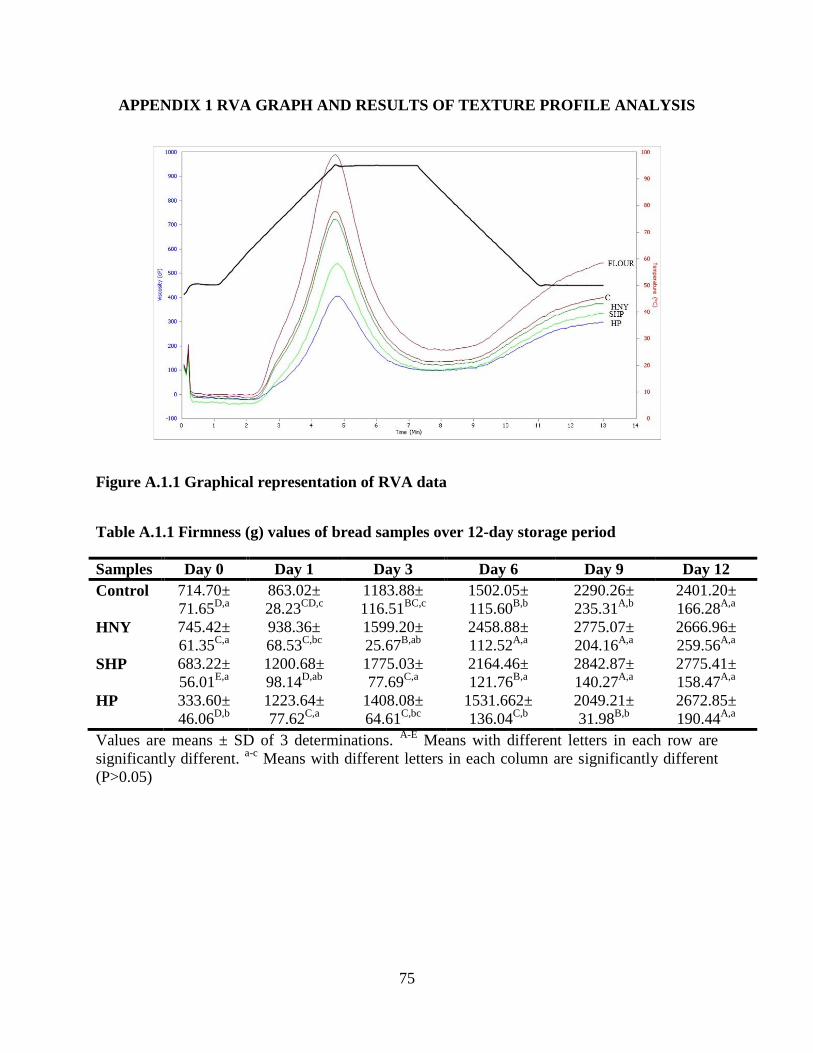
75
APPENDIX 1 RVA GRAPH AND RESULTS OF TEXTURE PROFILE ANALYSIS
Figure A.1.1 Graphical representation of RVA data
Table A.1.1 Firmness (g) values of bread samples over 12-day storage period
Samples Day 0 Day 1 Day 3 Day 6 Day 9 Day 12
Control 714.70±
71.65D,a
863.02±
28.23CD,c
1183.88±
116.51BC,c
1502.05±
115.60B,b
2290.26±
235.31A,b
2401.20±
166.28A,a
HNY 745.42±
61.35C,a
938.36±
68.53C,bc
1599.20±
25.67B,ab
2458.88±
112.52A,a
2775.07±
204.16A,a
2666.96±
259.56A,a
SHP 683.22±
56.01E,a
1200.68±
98.14D,ab
1775.03±
77.69C,a
2164.46±
121.76B,a
2842.87±
140.27A,a
2775.41±
158.47A,a
HP 333.60±
46.06D,b
1223.64±
77.62C,a
1408.08±
64.61C,bc
1531.662±
136.04C,b
2049.21±
31.98B,b
2672.85±
190.44A,a
Values are means ± SD of 3 determinations. A-E
Means with different letters in each row are
significantly different. a-c
Means with different letters in each column are significantly different
(P>0.05)
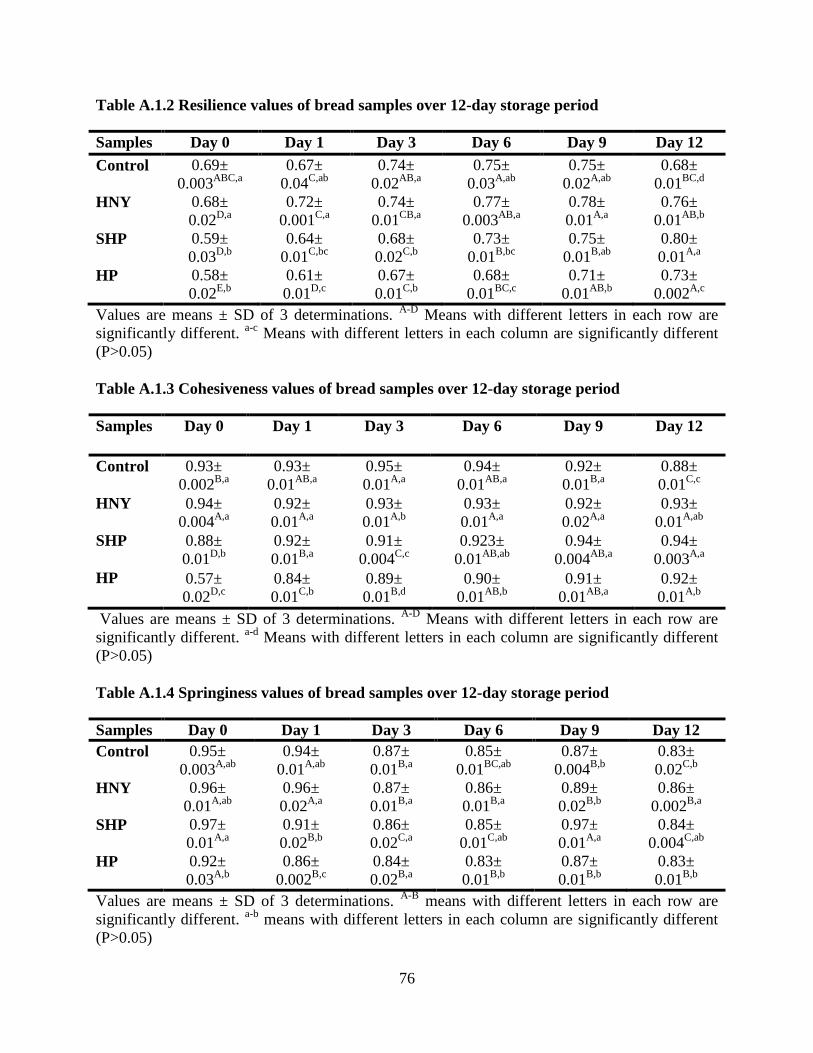
76
Table A.1.2 Resilience values of bread samples over 12-day storage period
Samples Day 0 Day 1 Day 3 Day 6 Day 9 Day 12
Control 0.69±
0.003ABC,a
0.67±
0.04C,ab
0.74±
0.02AB,a
0.75±
0.03A,ab
0.75±
0.02A,ab
0.68±
0.01BC,d
HNY 0.68±
0.02D,a
0.72±
0.001C,a
0.74±
0.01CB,a
0.77±
0.003AB,a
0.78±
0.01A,a
0.76±
0.01AB,b
SHP 0.59±
0.03D,b
0.64±
0.01C,bc
0.68±
0.02C,b
0.73±
0.01B,bc
0.75±
0.01B,ab
0.80±
0.01A,a
HP 0.58±
0.02E,b
0.61±
0.01D,c
0.67±
0.01C,b
0.68±
0.01BC,c
0.71±
0.01AB,b
0.73±
0.002A,c
Values are means ± SD of 3 determinations. A-D
Means with different letters in each row are
significantly different. a-c
Means with different letters in each column are significantly different
(P>0.05)
Table A.1.3 Cohesiveness values of bread samples over 12-day storage period
Samples Day 0 Day 1 Day 3 Day 6 Day 9 Day 12
Control 0.93±
0.002B,a
0.93±
0.01AB,a
0.95±
0.01A,a
0.94±
0.01AB,a
0.92±
0.01B,a
0.88±
0.01C,c
HNY 0.94±
0.004A,a
0.92±
0.01A,a
0.93±
0.01A,b
0.93±
0.01A,a
0.92±
0.02A,a
0.93±
0.01A,ab
SHP 0.88±
0.01D,b
0.92±
0.01B,a
0.91±
0.004C,c
0.923±
0.01AB,ab
0.94±
0.004AB,a
0.94±
0.003A,a
HP 0.57±
0.02D,c
0.84±
0.01C,b
0.89±
0.01B,d
0.90±
0.01AB,b
0.91±
0.01AB,a
0.92±
0.01A,b
Values are means ± SD of 3 determinations. A-D
Means with different letters in each row are
significantly different. a-d
Means with different letters in each column are significantly different
(P>0.05)
Table A.1.4 Springiness values of bread samples over 12-day storage period
Samples Day 0 Day 1 Day 3 Day 6 Day 9 Day 12
Control 0.95±
0.003A,ab
0.94±
0.01A,ab
0.87±
0.01B,a
0.85±
0.01BC,ab
0.87±
0.004B,b
0.83±
0.02C,b
HNY 0.96±
0.01A,ab
0.96±
0.02A,a
0.87±
0.01B,a
0.86±
0.01B,a
0.89±
0.02B,b
0.86±
0.002B,a
SHP 0.97±
0.01A,a
0.91±
0.02B,b
0.86±
0.02C,a
0.85±
0.01C,ab
0.97±
0.01A,a
0.84±
0.004C,ab
HP 0.92±
0.03A,b
0.86±
0.002B,c
0.84±
0.02B,a
0.83±
0.01B,b
0.87±
0.01B,b
0.83±
0.01B,b
Values are means ± SD of 3 determinations. A-B
means with different letters in each row are
significantly different. a-b
means with different letters in each column are significantly different
(P>0.05)
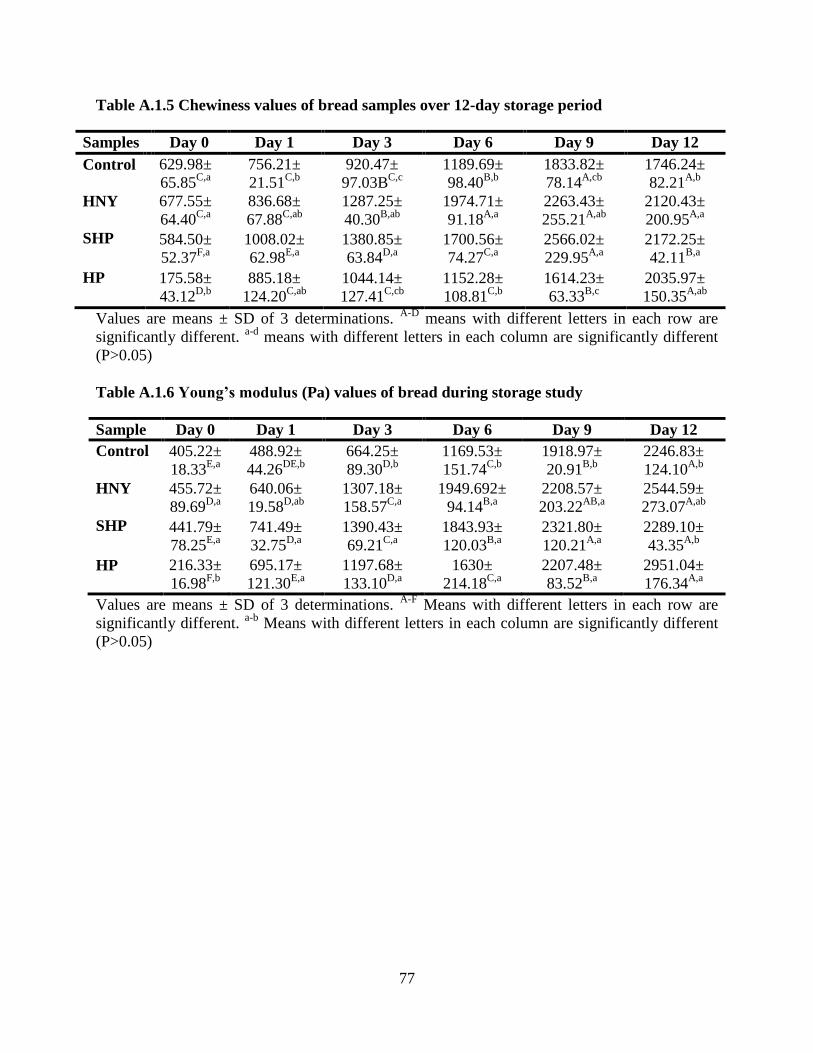
77
Table A.1.5 Chewiness values of bread samples over 12-day storage period
Samples Day 0 Day 1 Day 3 Day 6 Day 9 Day 12
Control 629.98±
65.85C,a
756.21±
21.51C,b
920.47±
97.03BC,c
1189.69±
98.40B,b
1833.82±
78.14A,cb
1746.24±
82.21A,b
HNY 677.55±
64.40C,a
836.68±
67.88C,ab
1287.25±
40.30B,ab
1974.71±
91.18A,a
2263.43±
255.21A,ab
2120.43±
200.95A,a
SHP 584.50±
52.37F,a
1008.02±
62.98E,a
1380.85±
63.84D,a
1700.56±
74.27C,a
2566.02±
229.95A,a
2172.25±
42.11B,a
HP 175.58±
43.12D,b
885.18±
124.20C,ab
1044.14±
127.41C,cb
1152.28±
108.81C,b
1614.23±
63.33B,c
2035.97±
150.35A,ab
Values are means ± SD of 3 determinations. A-D
means with different letters in each row are
significantly different. a-d
means with different letters in each column are significantly different
(P>0.05)
Table A.1.6 Young’s modulus (Pa) values of bread during storage study
Sample Day 0 Day 1 Day 3 Day 6 Day 9 Day 12
Control 405.22±
18.33E,a
488.92±
44.26DE,b
664.25±
89.30D,b
1169.53±
151.74C,b
1918.97±
20.91B,b
2246.83±
124.10A,b
HNY 455.72±
89.69D,a
640.06±
19.58D,ab
1307.18±
158.57C,a
1949.692±
94.14B,a
2208.57±
203.22AB,a
2544.59±
273.07A,ab
SHP 441.79±
78.25E,a
741.49±
32.75D,a
1390.43±
69.21C,a
1843.93±
120.03B,a
2321.80±
120.21A,a
2289.10±
43.35A,b
HP 216.33±
16.98F,b
695.17±
121.30E,a
1197.68±
133.10D,a
1630±
214.18C,a
2207.48±
83.52B,a
2951.04±
176.34A,a
Values are means ± SD of 3 determinations. A-F
Means with different letters in each row are
significantly different. a-b
Means with different letters in each column are significantly different
(P>0.05)
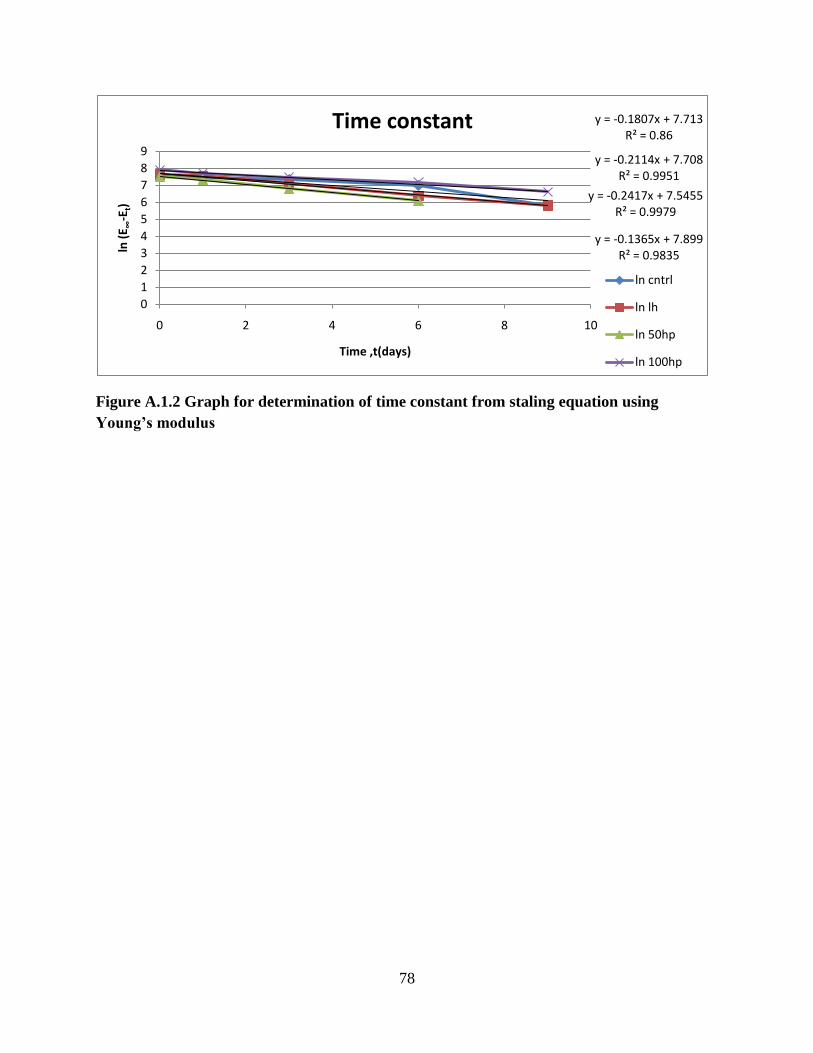
78
Figure A.1.2 Graph for determination of time constant from staling equation using
Young’s modulus
y = -0.1807x + 7.713R² = 0.86
y = -0.2114x + 7.708R² = 0.9951
y = -0.2417x + 7.5455R² = 0.9979
y = -0.1365x + 7.899R² = 0.9835
0
1
2
3
4
5
6
7
8
9
0 2 4 6 8 10
ln (
E ∞-E
t)
Time ,t(days)
Time constant
ln cntrl
ln lh
ln 50hp
ln 100hp
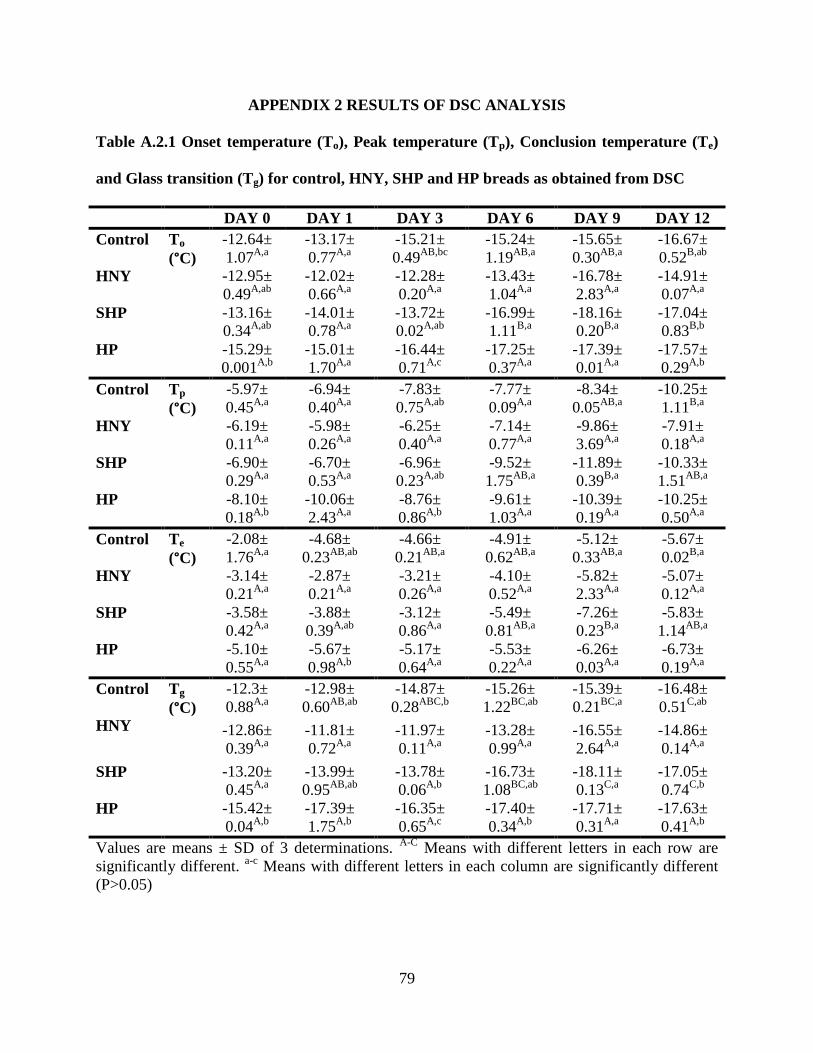
79
APPENDIX 2 RESULTS OF DSC ANALYSIS
Table A.2.1 Onset temperature (To), Peak temperature (Tp), Conclusion temperature (Te)
and Glass transition (Tg) for control, HNY, SHP and HP breads as obtained from DSC
DAY 0 DAY 1 DAY 3 DAY 6 DAY 9 DAY 12
Control To
(°C)
-12.64±
1.07A,a
-13.17±
0.77A,a
-15.21±
0.49AB,bc
-15.24±
1.19AB,a
-15.65±
0.30AB,a
-16.67±
0.52B,ab
HNY -12.95±
0.49A,ab
-12.02±
0.66A,a
-12.28±
0.20A,a
-13.43±
1.04A,a
-16.78±
2.83A,a
-14.91±
0.07A,a
SHP -13.16±
0.34A,ab
-14.01±
0.78A,a
-13.72±
0.02A,ab
-16.99±
1.11B,a
-18.16±
0.20B,a
-17.04±
0.83B,b
HP -15.29±
0.001A,b
-15.01±
1.70A,a
-16.44±
0.71A,c
-17.25±
0.37A,a
-17.39±
0.01A,a
-17.57±
0.29A,b
Control Tp
(°C)
-5.97±
0.45A,a
-6.94±
0.40A,a
-7.83±
0.75A,ab
-7.77±
0.09A,a
-8.34±
0.05AB,a
-10.25±
1.11B,a
HNY -6.19±
0.11A,a
-5.98±
0.26A,a
-6.25±
0.40A,a
-7.14±
0.77A,a
-9.86±
3.69A,a
-7.91±
0.18A,a
SHP -6.90±
0.29A,a
-6.70±
0.53A,a
-6.96±
0.23A,ab
-9.52±
1.75AB,a
-11.89±
0.39B,a
-10.33±
1.51AB,a
HP -8.10±
0.18A,b
-10.06±
2.43A,a
-8.76±
0.86A,b
-9.61±
1.03A,a
-10.39±
0.19A,a
-10.25±
0.50A,a
Control Te
(°C)
-2.08±
1.76A,a
-4.68±
0.23AB,ab
-4.66±
0.21AB,a
-4.91±
0.62AB,a
-5.12±
0.33AB,a
-5.67±
0.02B,a
HNY -3.14±
0.21A,a
-2.87±
0.21A,a
-3.21±
0.26A,a
-4.10±
0.52A,a
-5.82±
2.33A,a
-5.07±
0.12A,a
SHP -3.58±
0.42A,a
-3.88±
0.39A,ab
-3.12±
0.86A,a
-5.49±
0.81AB,a
-7.26±
0.23B,a
-5.83±
1.14AB,a
HP -5.10±
0.55A,a
-5.67±
0.98A,b
-5.17±
0.64A,a
-5.53±
0.22A,a
-6.26±
0.03A,a
-6.73±
0.19A,a
Control Tg
(°C)
-12.3±
0.88A,a
-12.98±
0.60AB,ab
-14.87±
0.28ABC,b
-15.26±
1.22BC,ab
-15.39±
0.21BC,a
-16.48±
0.51C,ab
HNY -12.86±
0.39A,a
-11.81±
0.72A,a
-11.97±
0.11A,a
-13.28±
0.99A,a
-16.55±
2.64A,a
-14.86±
0.14A,a
SHP -13.20±
0.45A,a
-13.99±
0.95AB,ab
-13.78±
0.06A,b
-16.73±
1.08BC,ab
-18.11±
0.13C,a
-17.05±
0.74C,b
HP -15.42±
0.04A,b
-17.39±
1.75A,b
-16.35±
0.65A,c
-17.40±
0.34A,b
-17.71±
0.31A,a
-17.63±
0.41A,b
Values are means ± SD of 3 determinations. A-C
Means with different letters in each row are
significantly different. a-c
Means with different letters in each column are significantly different
(P>0.05)
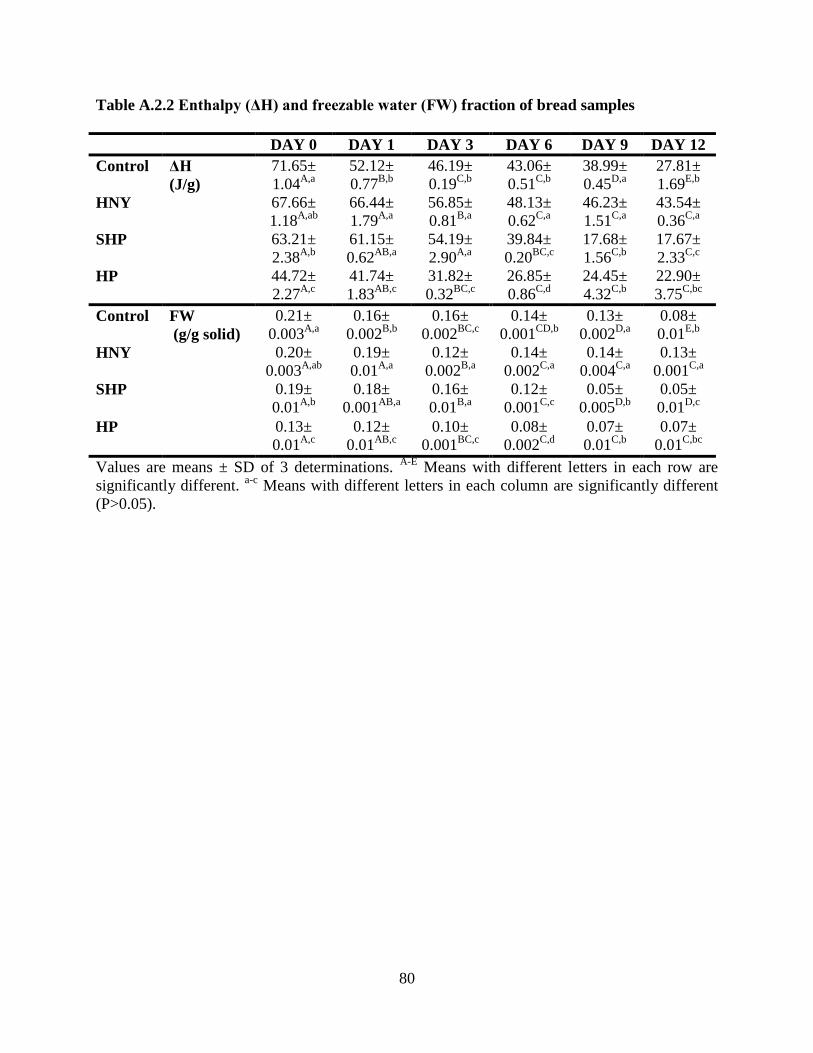
80
Table A.2.2 Enthalpy (ΔH) and freezable water (FW) fraction of bread samples
DAY 0 DAY 1 DAY 3 DAY 6 DAY 9 DAY 12
Control ΔH
(J/g)
71.65±
1.04A,a
52.12±
0.77B,b
46.19±
0.19C,b
43.06±
0.51C,b
38.99±
0.45D,a
27.81±
1.69E,b
HNY 67.66±
1.18A,ab
66.44±
1.79A,a
56.85±
0.81B,a
48.13±
0.62C,a
46.23±
1.51C,a
43.54±
0.36C,a
SHP 63.21±
2.38A,b
61.15±
0.62AB,a
54.19±
2.90A,a
39.84±
0.20BC,c
17.68±
1.56C,b
17.67±
2.33C,c
HP 44.72±
2.27A,c
41.74±
1.83AB,c
31.82±
0.32BC,c
26.85±
0.86C,d
24.45±
4.32C,b
22.90±
3.75C,bc
Control FW
(g/g solid)
0.21±
0.003A,a
0.16±
0.002B,b
0.16±
0.002BC,c
0.14±
0.001CD,b
0.13±
0.002D,a
0.08±
0.01E,b
HNY 0.20±
0.003A,ab
0.19±
0.01A,a
0.12±
0.002B,a
0.14±
0.002C,a
0.14±
0.004C,a
0.13±
0.001C,a
SHP 0.19±
0.01A,b
0.18±
0.001AB,a
0.16±
0.01B,a
0.12±
0.001C,c
0.05±
0.005D,b
0.05±
0.01D,c
HP 0.13±
0.01A,c
0.12±
0.01AB,c
0.10±
0.001BC,c
0.08±
0.002C,d
0.07±
0.01C,b
0.07±
0.01C,bc
Values are means ± SD of 3 determinations. A-E
Means with different letters in each row are
significantly different. a-c
Means with different letters in each column are significantly different
(P>0.05).
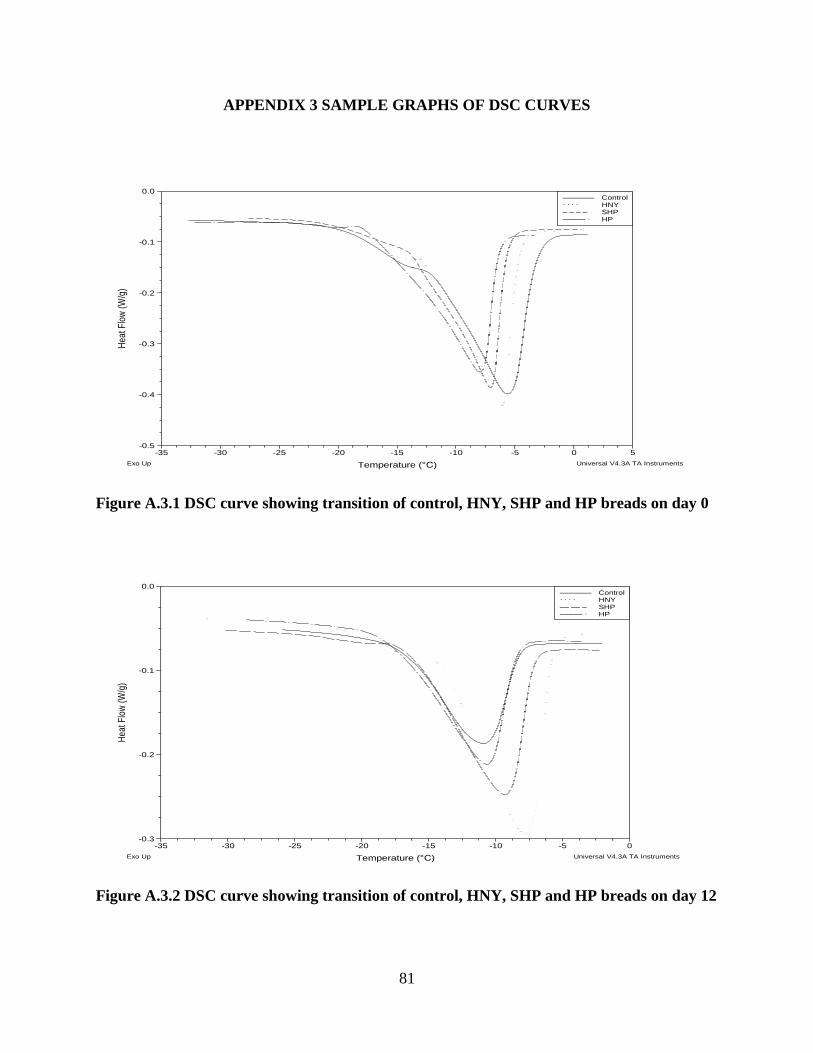
81
APPENDIX 3 SAMPLE GRAPHS OF DSC CURVES
Figure A.3.1 DSC curve showing transition of control, HNY, SHP and HP breads on day 0
Figure A.3.2 DSC curve showing transition of control, HNY, SHP and HP breads on day 12
-0.5
-0.4
-0.3
-0.2
-0.1
0.0
Hea
t Flo
w (
W/g
)
-35
-30
-25
-20
-15
-10
-5
0
5
Temperature (°C)
Control
–––––––
HNY
· · · ·
SHP
– – – –
HP
––––– ·
Exo Up
Universal V4.3A TA Instruments
-0.3
-0.2
-0.1
0.0
Hea
t Flo
w (
W/g
)
-35
-30
-25
-20
-15
-10
-5
0
Temperature (°C)
Control
–––––––
HNY
· · · ·
SHP
–– –– –
HP
––––– ·
Exo Up
Universal V4.3A TA Instruments
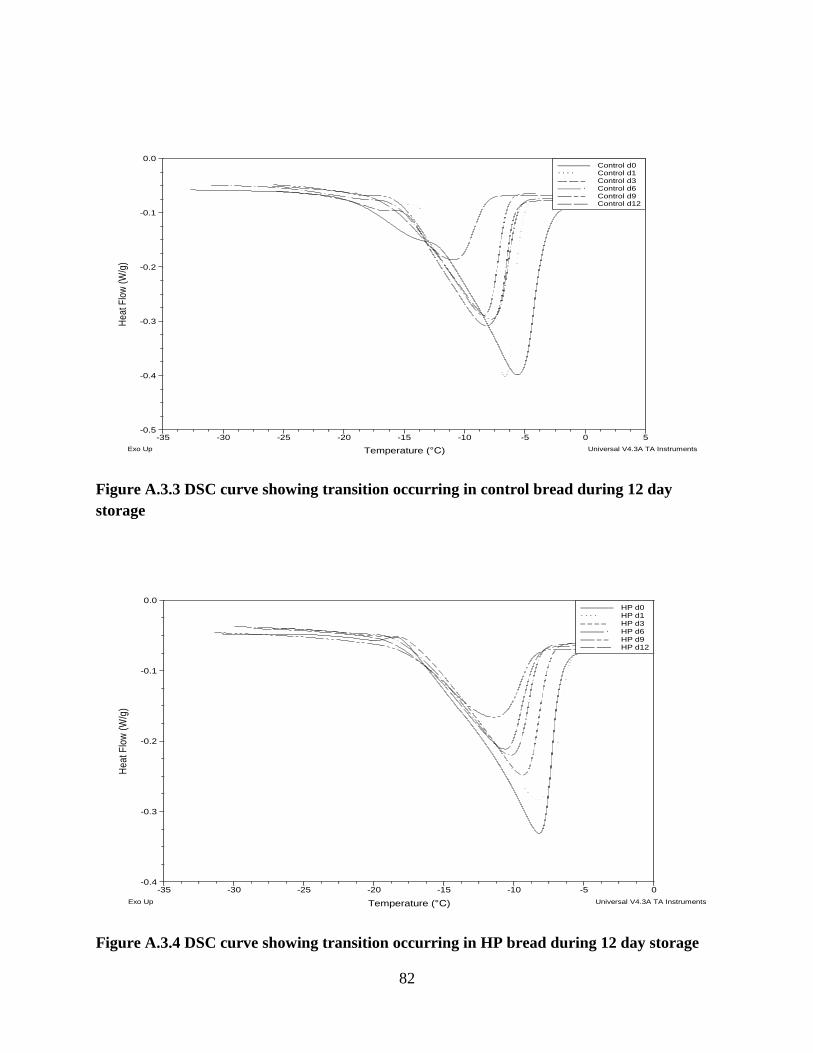
82
Figure A.3.3 DSC curve showing transition occurring in control bread during 12 day
storage
Figure A.3.4 DSC curve showing transition occurring in HP bread during 12 day storage
-0.5
-0.4
-0.3
-0.2
-0.1
0.0
Hea
t Flo
w (
W/g
)
-35
-30
-25
-20
-15
-10
-5
0
5
Temperature (°C)
Control d0
–––––––
Control d1
· · · ·
Control d3
–– –– –
Control d6
––––– ·
Control d9
––– – –
Control d12
––– –––
Exo Up
Universal V4.3A TA Instruments
-0.4
-0.3
-0.2
-0.1
0.0
He
at
Flo
w (
W/g
)
-35
-30
-25
-20
-15
-10
-5
0
Temperature (°C)
HP d0
–––––––
HP d1
· · · ·
HP d3
– – – –
HP d6
––––– ·
HP d9
––– – –
HP d12
––– –––
Exo Up
Universal V4.3A TA Instruments
83
VITA
Ahalya Kosal Ram was born in July 1987 in Tamil Nadu, India. She completed her
undergraduate studies at Vellore Institute of Technology, University in the year 2009 obtaining a
Bachelor of Technology degree in Biotechnology. She enrolled for the master‘s program in the
Department of Food Science at LSU in August 2009. Ahalya is currently a Master‘s degree
candidate and will receive her degree in August 2011.