production of syngas from torrefied short-rotation coppice
TRANSCRIPT
Production of Syngas from Torrefied Short-Rotation Coppice
Willow
A Dissertation Submitted to the College of Graduate and Postdoctoral Studies
in Partial Fulfillment of the Requirements
for the Degree of Doctor of Philosophy
in the Department of Chemical and Biological Engineering
University of Saskatchewan
Saskatoon
By
Kurt Ronald Woytiuk
P.Eng.
© Copyright Kurt Ronald Woytiuk, March 2017. All rights reserved.
i
Permission to Use
In presenting this dissertation in partial fulfillment of the requirements for a Postgraduate degree
from the University of Saskatchewan, I agree that the Libraries of this University may make it
freely available for inspection. I further agree that permission for copying of this dissertation in
any manner, in whole or in part, for scholarly purposes may be granted by the professor or
professors who supervised my dissertation work or, in their absence, by the Head of the
Department of Chemical and Biological Engineering. It is understood that any copying or
publication or use of this dissertation or parts thereof for financial gain shall not be allowed
without my written permission. It is also understood that due recognition shall be given to me
and to the University of Saskatchewan in any scholarly use that may be made of any material in
my dissertation. Requests for permission to copy or to make other uses of materials in this
dissertation, in whole or part, should be addressed to:
Head, Department of Chemical and Biological Engineering
University of Saskatchewan
57 Campus Drive, Saskatoon, Saskatchewan
Canada, S7N 5A9

ii
Disclaimer
Reference in this dissertation to any specific commercial products, process, or service by trade
name, trademark, manufacturer, or otherwise, does not constitute or imply its endorsement,
recommendation, or favouring by the University of Saskatchewan. The views and opinions of the
author expressed herein do not state or reflect those of the University of Saskatchewan, and shall
not be used for advertising or product endorsement purposes.
iii
Abstract
Bioenergy and biofuels are a low-carbon alternative to fossil fuels in Canada. Greenhouse gas
emissions from sectors such as heavy transport with few non-fossil fuel alternatives can be
reduced using land base renewable energy. The proliferation of coppice willow plantations is a
potential reliable and effective source of biomass, particularly in the Canadian Prairies. A
feedback control methodology is proposed for the development of biomass with enhanced
chemical characteristics from short-rotation coppice willow. In particular, torrefaction is
proposed as a pretreatment process for fluidized bed gasification, one thermochemical pathway
for the production of liquid fuels and chemicals from biomass. The thesis shows that syngas
quality from fluidized bed gasification of willow can be improved by torrefaction of the
feedstock. Syngas quality metrics including H2/CO ratio, higher heating value of the syngas,
water vapour in syngas, tar concentration and tar species concentration were used to quantify an
improvement in syngas quality. The extent of torrefaction was evaluated based on the
volatilization of hemicelluloses. Hemicelluloses were found to decrease linearly and significantly
(p<0.05) for five torrefaction temperatures (240-280 °C). During gasification, H2/CO ratio was
increased by torrefaction. The water vapour concentration in syngas was less for torrefied willow
compared to non-torrefied willow. Tar concentration decreased by as much as 47 % as a result of
torrefaction. The decrease in tar concentration occurred when hemicelluloses were reduced to 12
% by torrefaction. The higher heating value of the syngas, however, was lower for syngas from
torrefied versus non-torrefied willow due to the increase in concentration of hydrogen in the
syngas. Finally, greenhouse gas emissions were evaluated on a life-cycle basis for direct and
indirect co-firing of SRC willow with lignite coal in an existing generating station in
Saskatchewan. Indirect co-firing of non-torrefied willow using a circulating fluidized bed
produced the largest emissions reduction. However, the indirect pathway reduced the land use
efficiency of the system. Torrefied willow pellets co-fired with coal used the least land area per
kWh of electricity produced. Evaluating gas composition from the torrefaction process, studying
the yield of soot in syngas, and investigating the fate of alkali metals and their effect on the
process are recommended extensions of this work.
iv
Acknowledgments
There are many people I would like to thank for their support with this project. I would like to
express my gratitude to the organizations who provided financial support; SaskPower, the Prairie
Agricultural Machinery Institute, the Applied Bioenergy Centre, the province of Saskatchewan
Ministry of Agriculture - Agriculture Development Fund (20120072), and the National Sciences
and Engineering Research Council collaborative research and development grant (442436-12).
Technical and financial support was also provided by Michelle Serapiglia (USDA-ARS) and
Raju Soolanayakanahally (Agriculture and Agri-food Canada).
I have worked with and am grateful for the support of many people across campus. Ryan Hangs
and Ken van Rees from the Department of Soil Science were always willing to meet and discuss
biomass issues. From the early days of the FLASK lab, thanks to Shayan Karimipour, Francisco
Sanchez, Ville Rimpiläinen, and Mikhail Granovskiy. From Chemical and Biological
Engineering, Manju Ulaganathan, Amir Abolhassani, Sepi Shahkarami, Mosi Aghbolaghy, and
Tyronne Keep were valuable confidants. I also learned many important lessons while teaching
alongside great engineering instructors; Debbie Rolfes, Terry Fonstad, Denard Lynch, Sean
Maw, Ross Welford, Glyn Kennell, and Rick Retzlaff.
My supervisors, Richard Evitts and Aaron Phoenix were instrumental in ‘picking up the pieces’
and supporting our fledgling group through the process of rebuilding a project after the abrupt
departure of Todd Pugsley. Thanks for your support and foresight.
This project would have looked very different if not for the many contributions of my research
group. I will be forever thankful for the things I learned working with Bill Campbell, Regan
Gerspacher, and David Sanscartier.
My family have been immensely helpful. Ron and Peggy, Jack and Sybil, Mark, Mel, Chris,
Cohen, Quentin, Rachel, Mike, Brayden, Kaleb, and Connor; thank you all for the many years of
support.
Finally, to my wife Emily; your sacrifices have been innumerable and immeasurable. I love you
more than I ever thought I could and can’t wait to find out what comes next knowing you will be
there with me.
v
Table of Contents Permission to Use ............................................................................................................................ i
Disclaimer ....................................................................................................................................... ii
Abstract .......................................................................................................................................... iii
Acknowledgments.......................................................................................................................... iv
Table of Contents ............................................................................................................................ v
List of Tables ................................................................................................................................. ix
List of Figures ................................................................................................................................. x
Nomenclature ................................................................................................................................ xii
1. Introduction ............................................................................................................................. 1
1.1. Research motivation and methodology: feedback control for advanced biomass ........... 2
1.2. Research objectives .......................................................................................................... 3
1.3. Thesis organization .......................................................................................................... 5
1.4. References ........................................................................................................................ 6
2. Literature review ...................................................................................................................... 7
2.1. Short-rotation coppice willow .......................................................................................... 7
2.2. Syngas quality from fluidized bed gasification ................................................................ 8
2.3. Tar measurement of syngas ............................................................................................ 10
2.4. Torrefaction and gasification ......................................................................................... 11
2.5. Life-cycle assessment of energy systems ....................................................................... 11
2.6. Knowledge gaps ............................................................................................................. 12
2.7. References ...................................................................................................................... 13
3. Quantifying the Extent of Torrefaction with Hemicelluloses, Oxygen/Carbon Ratio, Higher
Heating Value, and Carbon Composition ..................................................................................... 17
3.1. Preface ............................................................................................................................ 17
3.2. Abstract .......................................................................................................................... 17
3.3. Introduction .................................................................................................................... 18
3.4. Materials and methods ................................................................................................... 20
3.4.1. Biomass ...................................................................................................................... 20
3.4.2. Torrefaction ................................................................................................................ 21
3.4.3. Characterization .......................................................................................................... 22
vi
3.5. Results and discussion .................................................................................................... 24
3.5.1. Ultimate composition of willow ................................................................................. 24
3.5.2. Lignocelluloses composition of willow ...................................................................... 26
3.5.3. Higher heating value of biomass ................................................................................ 28
3.5.4. Extent of torrefaction .................................................................................................. 29
3.6. Conclusions .................................................................................................................... 31
3.7. References ...................................................................................................................... 33
4. The effect of torrefaction on syngas quality metrics from fluidized bed gasification of SRC
willow ........................................................................................................................................... 36
4.1. Preface ............................................................................................................................ 36
4.2. Abstract .......................................................................................................................... 36
4.3. Introduction .................................................................................................................... 37
4.4. Materials and methods ................................................................................................... 39
4.4.1. SV1 willow ................................................................................................................. 39
4.4.2. Lignocelluloses composition by HR-TGA ................................................................. 40
4.4.3. 75 mm fluidized bed gasifier ...................................................................................... 40
4.4.4. Gasification of torrefied SV1 willow ......................................................................... 42
4.5. Results and discussion .................................................................................................... 44
4.5.1. Torrefaction mass and energy yield............................................................................ 44
4.5.2. Lignocelluloses in torrefied and non-torrefied willow ............................................... 45
4.5.3. Syngas quality metrics ................................................................................................ 46
4.6. Conclusions .................................................................................................................... 51
4.7. References ...................................................................................................................... 52
5. Real-time analysis of syngas tar species for feedback control of temperature during
torrefaction .................................................................................................................................... 55
5.1. Preface ............................................................................................................................ 55
5.2. Abstract .......................................................................................................................... 55
5.3. Introduction .................................................................................................................... 56
5.4. Theory: continuous gas analysis by mass spectrometry ................................................. 58
5.5. Materials and methods ................................................................................................... 59
5.5.1. Ultimate and lignocelluloses composition of willow ................................................. 59
vii
5.5.2. Apparatus: mass spectrometer syngas sampling ........................................................ 60
5.5.3. Syngas sampling sequence and analysis ..................................................................... 62
5.6. Results and discussion .................................................................................................... 63
5.6.1. Syngas yield and energy content ................................................................................ 63
5.6.2. Syngas composition .................................................................................................... 64
5.6.3. Ion intensity of model tar species ............................................................................... 64
5.7. Conclusions .................................................................................................................... 68
5.8. References ...................................................................................................................... 69
6. Life-cycle assessment of torrefied coppice willow co-firing and co-combustion with lignite
coal in an existing pulverized coal boiler ..................................................................................... 71
6.1. Preface ............................................................................................................................ 71
6.2. Abstract .......................................................................................................................... 71
6.3. Introduction .................................................................................................................... 72
6.4. Methodology .................................................................................................................. 76
6.4.1. Overall study description ............................................................................................ 76
6.4.2. Reference coal pathway .............................................................................................. 76
6.4.3. Direct co-firing pathway ............................................................................................. 77
6.4.4. Indirect co-firing pathway .......................................................................................... 78
6.4.5. Willow plantations ...................................................................................................... 80
6.4.6. Life-cycle impact assessment ..................................................................................... 84
6.5. Results and discussion .................................................................................................... 84
6.5.1. Cumulative GHG emissions ....................................................................................... 84
6.5.2. Disaggregated GHG emissions ................................................................................... 86
6.5.3. Limitations and challenges ......................................................................................... 91
6.6. Conclusions .................................................................................................................... 91
7. Summary and Conclusions .................................................................................................... 97
7.1. Summary of findings ...................................................................................................... 97
7.1.1. Syngas quality metrics ................................................................................................ 97
7.1.2. Tar concentration and speciation by mass spectrometry ............................................ 98
7.1.3. Correlation of hemicelluloses with tar concentration and species ............................. 98
viii
7.1.4. Life-cycle greenhouse gas emissions reduction by co-firing torrefied and non-
torrefied willow pellets in Saskatchewan .................................................................................. 99
7.2. Evaluation of research objectives ................................................................................. 100
7.2.1. Syngas for liquid fuels and chemicals ...................................................................... 100
7.2.2. Syngas for electricity generation .............................................................................. 100
7.3. Implications .................................................................................................................. 100
7.3.1. Feedback control using syngas quality correlations ................................................. 100
7.3.2. Mass scanning to evaluate syngas quality ................................................................ 101
7.3.3. Emissions reduction with torrefied willow in Saskatchewan ................................... 101
7.4. Recommendations ........................................................................................................ 101
7.4.1. Torrefaction gas analysis by process mass spectrometry ......................................... 101
7.4.2. Combined water leaching and torrefaction to reduce alkali metals and alkaline earth
elements in agricultural residues ............................................................................................. 101
7.4.3. Soot formation during fluidized bed gasification of torrefied willow ...................... 102
7.5. References .................................................................................................................... 103
ix
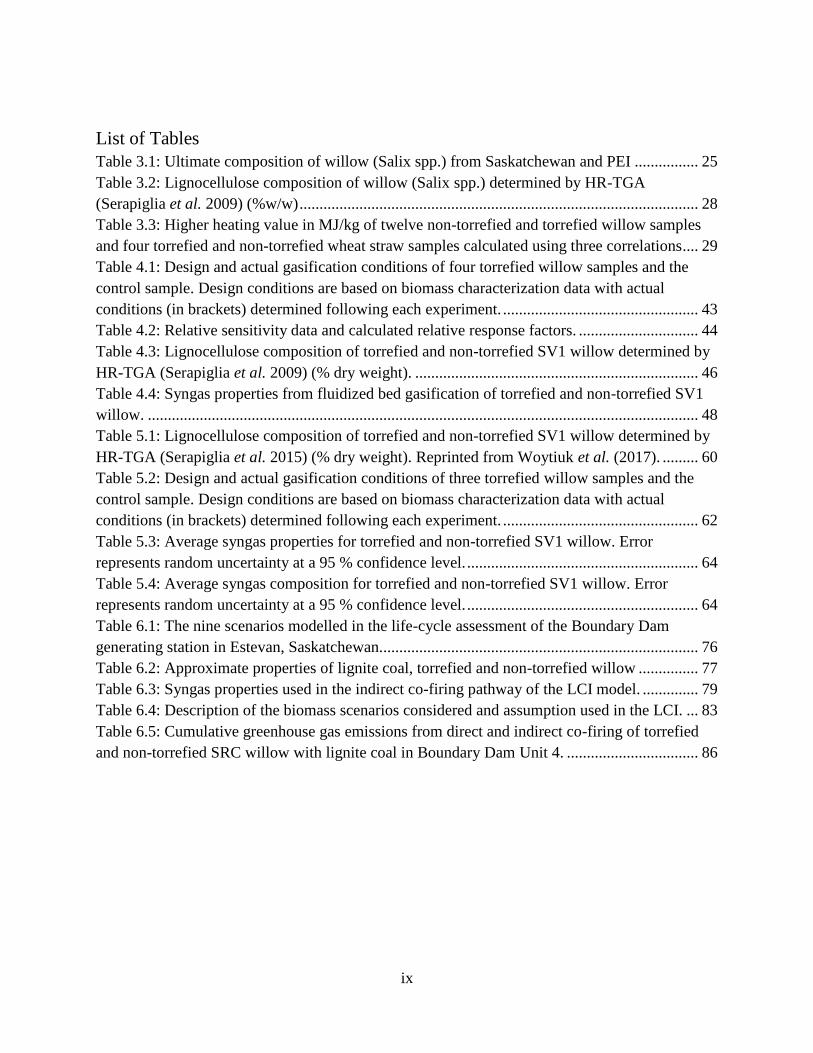
List of Tables
Table 3.1: Ultimate composition of willow (Salix spp.) from Saskatchewan and PEI ................ 25
Table 3.2: Lignocellulose composition of willow (Salix spp.) determined by HR-TGA
(Serapiglia et al. 2009) (%w/w) .................................................................................................... 28
Table 3.3: Higher heating value in MJ/kg of twelve non-torrefied and torrefied willow samples
and four torrefied and non-torrefied wheat straw samples calculated using three correlations .... 29
Table 4.1: Design and actual gasification conditions of four torrefied willow samples and the
control sample. Design conditions are based on biomass characterization data with actual
conditions (in brackets) determined following each experiment. ................................................. 43
Table 4.2: Relative sensitivity data and calculated relative response factors. .............................. 44
Table 4.3: Lignocellulose composition of torrefied and non-torrefied SV1 willow determined by
HR-TGA (Serapiglia et al. 2009) (% dry weight). ....................................................................... 46
Table 4.4: Syngas properties from fluidized bed gasification of torrefied and non-torrefied SV1
willow. .......................................................................................................................................... 48
Table 5.1: Lignocellulose composition of torrefied and non-torrefied SV1 willow determined by
HR-TGA (Serapiglia et al. 2015) (% dry weight). Reprinted from Woytiuk et al. (2017). ......... 60
Table 5.2: Design and actual gasification conditions of three torrefied willow samples and the
control sample. Design conditions are based on biomass characterization data with actual
conditions (in brackets) determined following each experiment. ................................................. 62
Table 5.3: Average syngas properties for torrefied and non-torrefied SV1 willow. Error
represents random uncertainty at a 95 % confidence level. .......................................................... 64
Table 5.4: Average syngas composition for torrefied and non-torrefied SV1 willow. Error
represents random uncertainty at a 95 % confidence level. .......................................................... 64
Table 6.1: The nine scenarios modelled in the life-cycle assessment of the Boundary Dam
generating station in Estevan, Saskatchewan................................................................................ 76
Table 6.2: Approximate properties of lignite coal, torrefied and non-torrefied willow ............... 77
Table 6.3: Syngas properties used in the indirect co-firing pathway of the LCI model. .............. 79
Table 6.4: Description of the biomass scenarios considered and assumption used in the LCI. ... 83
Table 6.5: Cumulative greenhouse gas emissions from direct and indirect co-firing of torrefied
and non-torrefied SRC willow with lignite coal in Boundary Dam Unit 4. ................................. 86
x
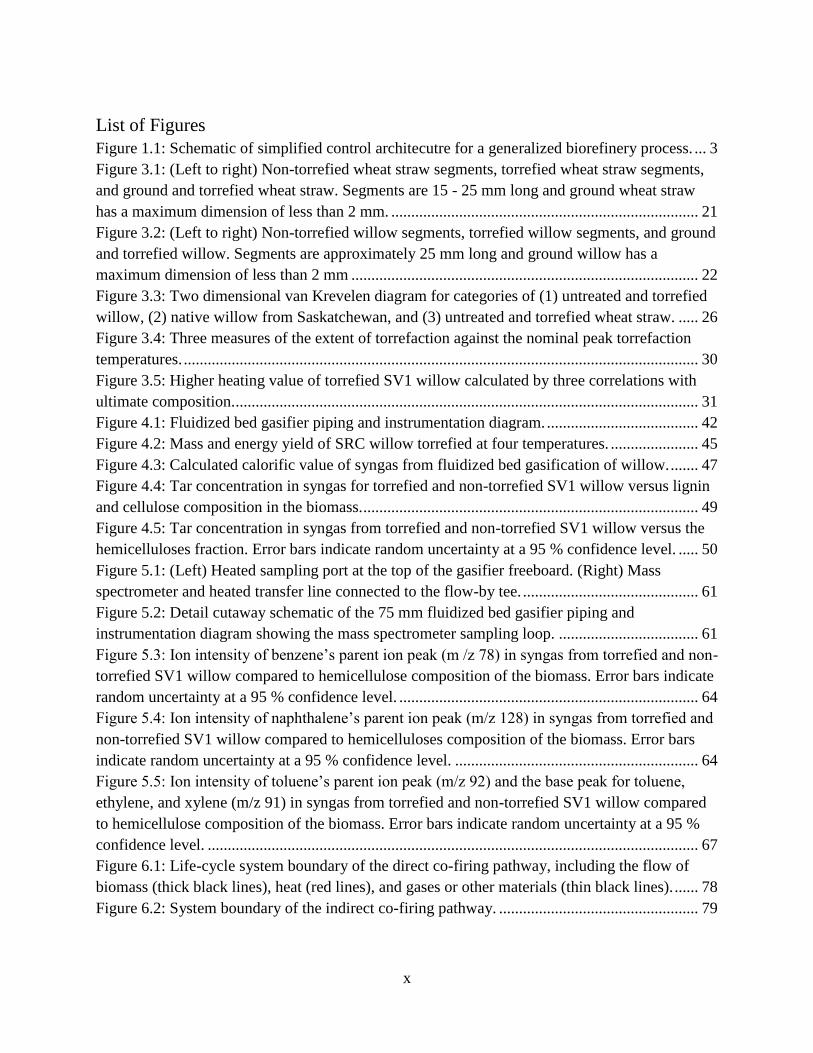
List of Figures
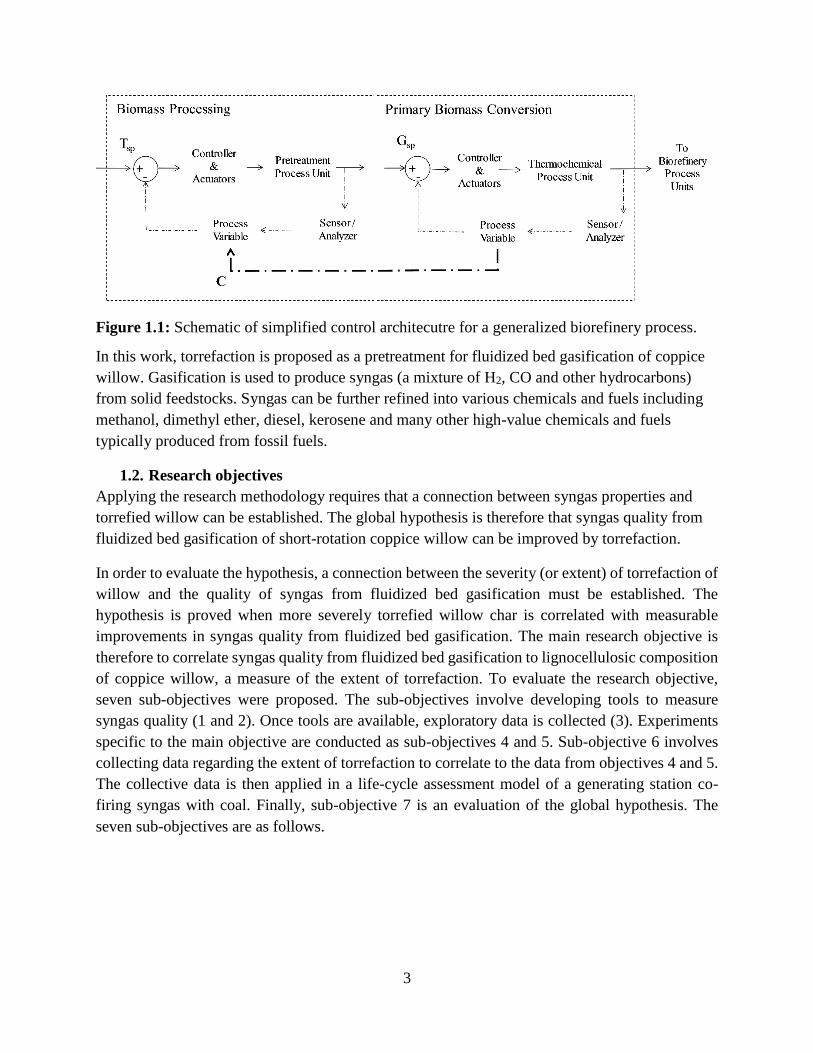
Figure 1.1: Schematic of simplified control architecutre for a generalized biorefinery process. ... 3
Figure 3.1: (Left to right) Non-torrefied wheat straw segments, torrefied wheat straw segments,
and ground and torrefied wheat straw. Segments are 15 - 25 mm long and ground wheat straw
has a maximum dimension of less than 2 mm. ............................................................................. 21
Figure 3.2: (Left to right) Non-torrefied willow segments, torrefied willow segments, and ground
and torrefied willow. Segments are approximately 25 mm long and ground willow has a
maximum dimension of less than 2 mm ....................................................................................... 22
Figure 3.3: Two dimensional van Krevelen diagram for categories of (1) untreated and torrefied
willow, (2) native willow from Saskatchewan, and (3) untreated and torrefied wheat straw. ..... 26
Figure 3.4: Three measures of the extent of torrefaction against the nominal peak torrefaction
temperatures. ................................................................................................................................. 30
Figure 3.5: Higher heating value of torrefied SV1 willow calculated by three correlations with
ultimate composition. .................................................................................................................... 31
Figure 4.1: Fluidized bed gasifier piping and instrumentation diagram. ...................................... 42
Figure 4.2: Mass and energy yield of SRC willow torrefied at four temperatures. ...................... 45
Figure 4.3: Calculated calorific value of syngas from fluidized bed gasification of willow. ....... 47
Figure 4.4: Tar concentration in syngas for torrefied and non-torrefied SV1 willow versus lignin
and cellulose composition in the biomass. .................................................................................... 49
Figure 4.5: Tar concentration in syngas from torrefied and non-torrefied SV1 willow versus the
hemicelluloses fraction. Error bars indicate random uncertainty at a 95 % confidence level. ..... 50
Figure 5.1: (Left) Heated sampling port at the top of the gasifier freeboard. (Right) Mass
spectrometer and heated transfer line connected to the flow-by tee. ............................................ 61
Figure 5.2: Detail cutaway schematic of the 75 mm fluidized bed gasifier piping and
instrumentation diagram showing the mass spectrometer sampling loop. ................................... 61
Figure 5.3: Ion intensity of benzene’s parent ion peak (m /z 78) in syngas from torrefied and non-
torrefied SV1 willow compared to hemicellulose composition of the biomass. Error bars indicate
random uncertainty at a 95 % confidence level. ........................................................................... 64
Figure 5.4: Ion intensity of naphthalene’s parent ion peak (m/z 128) in syngas from torrefied and
non-torrefied SV1 willow compared to hemicelluloses composition of the biomass. Error bars
indicate random uncertainty at a 95 % confidence level. ............................................................. 64
Figure 5.5: Ion intensity of toluene’s parent ion peak (m/z 92) and the base peak for toluene,
ethylene, and xylene (m/z 91) in syngas from torrefied and non-torrefied SV1 willow compared
to hemicellulose composition of the biomass. Error bars indicate random uncertainty at a 95 %
confidence level. ........................................................................................................................... 67
Figure 6.1: Life-cycle system boundary of the direct co-firing pathway, including the flow of
biomass (thick black lines), heat (red lines), and gases or other materials (thin black lines). ...... 78
Figure 6.2: System boundary of the indirect co-firing pathway. .................................................. 79
xi
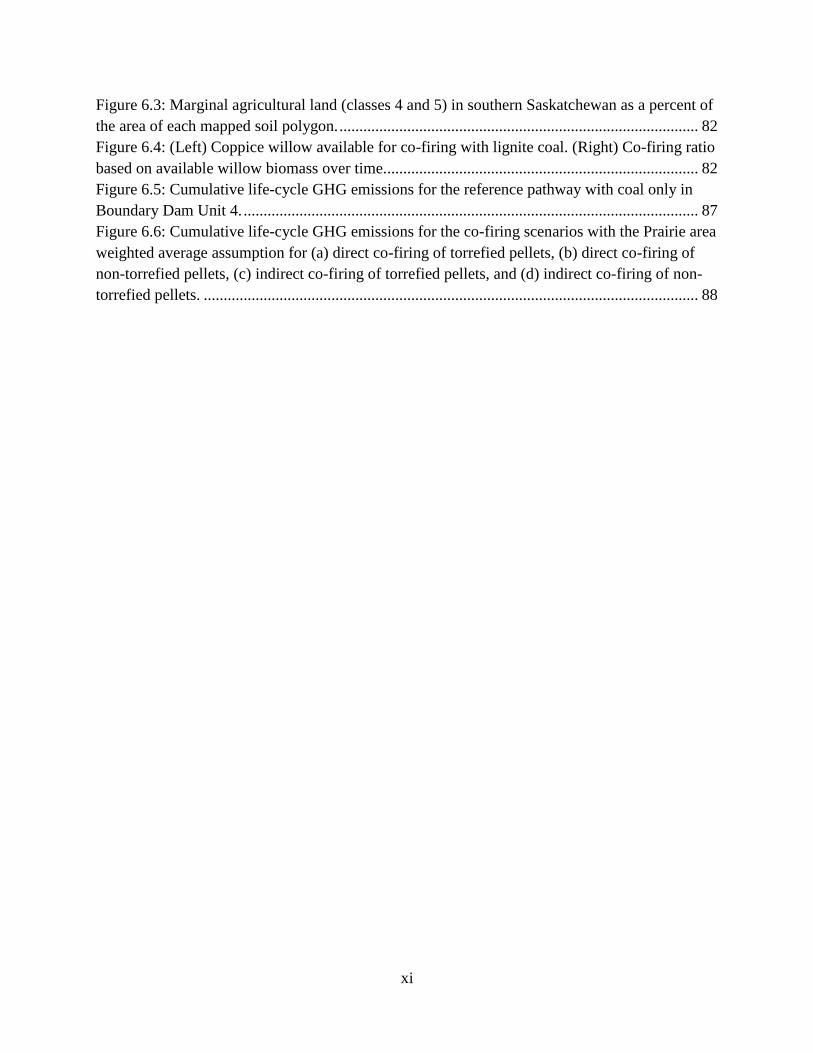
Figure 6.3: Marginal agricultural land (classes 4 and 5) in southern Saskatchewan as a percent of
the area of each mapped soil polygon. .......................................................................................... 82
Figure 6.4: (Left) Coppice willow available for co-firing with lignite coal. (Right) Co-firing ratio
based on available willow biomass over time. .............................................................................. 82
Figure 6.5: Cumulative life-cycle GHG emissions for the reference pathway with coal only in
Boundary Dam Unit 4. .................................................................................................................. 87
Figure 6.6: Cumulative life-cycle GHG emissions for the co-firing scenarios with the Prairie area
weighted average assumption for (a) direct co-firing of torrefied pellets, (b) direct co-firing of
non-torrefied pellets, (c) indirect co-firing of torrefied pellets, and (d) indirect co-firing of non-
torrefied pellets. ............................................................................................................................ 88
xii
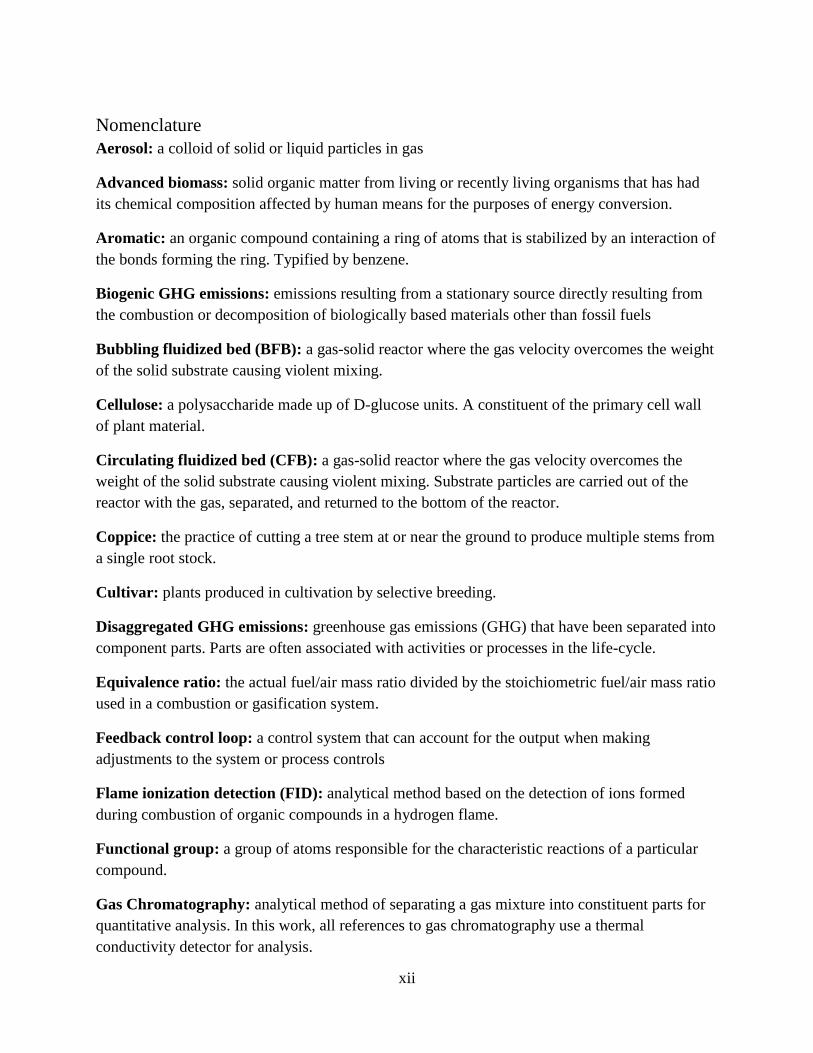
Nomenclature
Aerosol: a colloid of solid or liquid particles in gas
Advanced biomass: solid organic matter from living or recently living organisms that has had
its chemical composition affected by human means for the purposes of energy conversion.
Aromatic: an organic compound containing a ring of atoms that is stabilized by an interaction of
the bonds forming the ring. Typified by benzene.
Biogenic GHG emissions: emissions resulting from a stationary source directly resulting from
the combustion or decomposition of biologically based materials other than fossil fuels
Bubbling fluidized bed (BFB): a gas-solid reactor where the gas velocity overcomes the weight
of the solid substrate causing violent mixing.
Cellulose: a polysaccharide made up of D-glucose units. A constituent of the primary cell wall
of plant material.
Circulating fluidized bed (CFB): a gas-solid reactor where the gas velocity overcomes the
weight of the solid substrate causing violent mixing. Substrate particles are carried out of the
reactor with the gas, separated, and returned to the bottom of the reactor.
Coppice: the practice of cutting a tree stem at or near the ground to produce multiple stems from
a single root stock.
Cultivar: plants produced in cultivation by selective breeding.
Disaggregated GHG emissions: greenhouse gas emissions (GHG) that have been separated into
component parts. Parts are often associated with activities or processes in the life-cycle.
Equivalence ratio: the actual fuel/air mass ratio divided by the stoichiometric fuel/air mass ratio
used in a combustion or gasification system.
Feedback control loop: a control system that can account for the output when making
adjustments to the system or process controls
Flame ionization detection (FID): analytical method based on the detection of ions formed
during combustion of organic compounds in a hydrogen flame.
Functional group: a group of atoms responsible for the characteristic reactions of a particular
compound.
Gas Chromatography: analytical method of separating a gas mixture into constituent parts for
quantitative analysis. In this work, all references to gas chromatography use a thermal
conductivity detector for analysis.

xiii
Gasification: a thermochemical conversion process whereby organic matter is converted into a
mixture of combustible gases without combustion.
Hemicelluloses: several heteropolymers that make up plant cell walls. The amorphous structure
has little strength and is easily broken down.
Higher heating value (calorimetric heating value): the amount of heat that must be removed
when one unit mass of the fuel is completely combusted at constant pressure in order to cool the
combustion products to the initial temperature. Water vapour is assumed to be returned to liquid
state and reference temperature.
Hybrid: plants that are the result of mixing through reproduction of different breeds to produce
desirable traits (cross-breeding).
Levelized GHG emissions: cumulative greenhouse gas emissions that have been normalized to
the electricity produced by the system.
Lignin: cross-linked phenolic polymers that are important support tissues in plants.
Lignocelluloses: plant matter made up of carbohydrate polymers (cellulose and hemicelluloses)
and phenolic polymers (lignin).
Lower heating value (effective heating value): the amount of heat that must be removed when
one unit mass of the fuel is completely combusted at constant pressure in order to cool the
combustion products to the initial temperature. Water vapour is assumed to remain in the vapour
state.
Mass Spectrometry: an analytical technique whereby compounds are ionized and sorted based
on their mass to charge ratio.
Methyl group: an alkyl derived from methane consisting of one carbon atom bonded to three
hydrogen atoms
Normal temperature and pressure (NTP): 20 °C (293.15 K) and 1 atm (101.325 kPa). Gas
volumes are normalized to NTP throughout the dissertation.
Proximate composition: a classification of solid fuel based on the composition of moisture,
volatile matter, fixed carbon, and ash. Reported as a percent weight.
Soot: amorphous particles of carbon resulting from incomplete burning of organic matter,
usually wood.
Tar: a mixture of organic compounds (primarily aromatic, heteroaromatic, and polycylic
aromatic species) produced by partial-oxidation of organic material that condense at or below
450 °C.
xiv
Torrefaction: a low-temperature thermochemical conversion of solid organic matter in the
absence of an oxidant at temperatures less than 300 °C. The main product is solid char with
liquid and gas by-products.
Ultimate composition: the elements of a solid fuel as a fraction of the total weight. Reported
elements consist of carbon, hydrogen, nitrogen, sulphur, and oxygen (balance).
1
1. Introduction
The local and integrated production of energy is critical to both demand side energy management
and the reduction of greenhouse gas emissions. Per capita energy use depends on many factors
including the regional climate, government policies, building practices, regional economy,
politics, and the overall expectations of the populace. Energy systems for heat and power are
developed over a long time-frame in response to these many factors. Changing energy systems in
response to outside influences, such as climate change requires careful integration within the
region in which they are developed. Given the timeline for developing new generating
infrastructure, action on climate change that incorporates technical, financial, social, and political
interests is critical.
In Canada, the need to tackle climate change is paramount. Canada ranks among the highest per-
capita emitters of greenhouse gases globally (20.6 tonnes CO2eq per person in 2013; (Government
of Canada 2015). According to Environment Canada, electricity generation is one of the largest
emitters (12 %), trailing the oil and gas sector (25 %), transportation (23 %), and the buildings
sector (12 %). Emissions decreased between 2005 and 2013 by 3 % and this is attributed primarily
to the change from coal to biomass in Ontario’s electricity generation sector (Government of
Canada 2015). The net reduction is highly dependent on carbon accounting and the timing of that
net reduction has been questioned (Ter-Mikaelian et al. 2015).
For the transport sector, there are few alternatives to fossil fuels where electrification is not
possible (for example, heavy transport, marine, and aviation). Biofuels are seen as a technically
viable means to reduce greenhouse gas emissions from transport fuels without major changes in
infrastructure (Eisentraut et al. 2011). The dependence on conventional crops (primarily corn
based ethanol) is problematic as the world population grows and competition between food and
fuel increases (Hangs 2014). The use of lignocellulosic biomass (second generation biomass) in
biomass to liquids processes to produce fuels was found to reduce GHG emissions compared to
conventional fossil fuels (Zhang et al. 2010). However, the cost of producing clean syngas during
production of synthetic fuels accounts for approximately 70 % of the process capital and operating
costs (Steynberg and Dry 2004).
The purpose of this project is to investigate technically viable bioenergy applications of SRC
willow and tackle the technical hurdles to commercial deployment. Low energy density, high
moisture content, and variability of conventional biomass have impacted the utilization through
much of the prairie regions in Canada. Production of high-value commodity fuels from biomass
resources is one option for development of the industry. Commodity biomass has a high energy
density and can be applied to a biorefinery system (Sherrard 2014; Diacarbon 2016). To this end,
a feedback control methodology is proposed for the development of advanced biomass.
Advanced biomass is defined here as biomass that has undergone treatment to enhance its
chemical characteristics for downstream energy applications. ‘Black pellets’, for example,

2
produced from torrefied and steam treated wood, are considered one of the first commercially
produced forms of advanced biomass (Sherrard 2014).
Despite the prospects of as an energy source and the need for reduction of GHG emissions,
biomass is a low-grade fuel. The fibrous structure is energy intensive to mill. Grinding energy is
as high as 150 kWh/tonne to reach approximately 1000 μm (Esteban and Carrasco 2006). For
comparison, to mill coal to 100 μm requires 36 kWh/tonne. At harvest, fresh biomass is greater
than 50 %w/w moisture (Van Loo and Koppejan 2008). Passive and active drying is often
required. In systems relying on annual harvests, long-term storage is critical. The propensity of
biomass to absorb moisture is therefore also problematic. The calorific value of biomass is
significantly lower than petroleum fuels. Bituminous coal has a 60 % higher energy content
compared to wood (Borman and Ragland 1998). The relatively poor characteristics result in few
economical applications for biomass in landlocked regions of abundant fossil fuel production
such as the Canada prairies. However, the production of advanced biomass can address these
issues.
1.1. Research motivation and methodology: feedback control for advanced biomass
A feedback control methodology is proposed in this work for the development of advanced
biomass. Figure 1.1 shows simplified control architecture for two process blocks; biomass
processing and primary biomass conversion. Biomass processing, in this case is specific to the
production of advanced biomass (i.e. pretreatment of biomass by torrefaction, digestion, steam
treating, etc…). Primary conversion represents pyrolysis, gasification, or combustion as the first
phase in a biorefinery process. The variables Tsp and Gsp could represent a number of process
control setpoints for each process (temperature, feed rate, air flow, pressure, etc…), but are
simplified as a single variable for illustrative purposes. The variable ‘C’ represents correlations
between the pretreatment and primary conversion processes. The interaction between the two
process blocks through the correlation allows for the production of advanced biomass specific to
the biorefinery process. The two processes may be physically separated in which case the
correlation ‘C’ is applied manually. For example, if biomass is treated at the harvest site to
reduce transport costs, the operator inputs the variable. On the other hand, if the processes are
physically connected or otherwise interact, the correlation could be directly applied through the
control system.
3
Figure 1.1: Schematic of simplified control architecutre for a generalized biorefinery process.
In this work, torrefaction is proposed as a pretreatment for fluidized bed gasification of coppice
willow. Gasification is used to produce syngas (a mixture of H2, CO and other hydrocarbons)
from solid feedstocks. Syngas can be further refined into various chemicals and fuels including
methanol, dimethyl ether, diesel, kerosene and many other high-value chemicals and fuels
typically produced from fossil fuels.
1.2. Research objectives
Applying the research methodology requires that a connection between syngas properties and
torrefied willow can be established. The global hypothesis is therefore that syngas quality from
fluidized bed gasification of short-rotation coppice willow can be improved by torrefaction.
In order to evaluate the hypothesis, a connection between the severity (or extent) of torrefaction of
willow and the quality of syngas from fluidized bed gasification must be established. The
hypothesis is proved when more severely torrefied willow char is correlated with measurable
improvements in syngas quality from fluidized bed gasification. The main research objective is
therefore to correlate syngas quality from fluidized bed gasification to lignocellulosic composition
of coppice willow, a measure of the extent of torrefaction. To evaluate the research objective,
seven sub-objectives were proposed. The sub-objectives involve developing tools to measure
syngas quality (1 and 2). Once tools are available, exploratory data is collected (3). Experiments
specific to the main objective are conducted as sub-objectives 4 and 5. Sub-objective 6 involves
collecting data regarding the extent of torrefaction to correlate to the data from objectives 4 and 5.
The collective data is then applied in a life-cycle assessment model of a generating station co-
firing syngas with coal. Finally, sub-objective 7 is an evaluation of the global hypothesis. The
seven sub-objectives are as follows.
4
1. Develop an online, continuous tar concentration measurement apparatus for the 75 mm
fluidized bed reactor.
The overall tar concentration is a critical measure of syngas quality not normally available during
operation. The tool allows online evaluation of syngas quality with a reasonable lag in
measurement time.
2. Integrate a quantitative tar speciation measurement apparatus into the sampling train
on the 75 mm fluidized bed reactor based on mass spectrometry techniques.
Standardized methods of tar species measurement require condensation and offline measurement.
From an engineering perspective, this type of measurement is cumbersome and impractical. The
measurement device will allow trace analysis of syngas (i.e. a measure of syngas quality) to be
correlated to lignocellulose composition in real time.
3. Identify and quantify heavy condensable vapours in the syngas from woody biomass
gasified in the 75 mm reactor using mass spectrometry.
Exploratory experiments were conducted to (a) demonstrate the measurement system and (b) to
determine appropriate species relevant to torrefied willow gasification.
4. Correlate tar concentration in syngas to biomass composition, specifically quantity of
lignin, cellulose and hemicelluloses.
Tar concentration is a measure of syngas quality and macromolecules in biomass are a key measure
of the extent of torrefaction.
5. Correlate problematic and abundant tar species (for example, tertiary, alkyl tertiary
tars) in syngas to biomass composition, specifically the quantity of lignin, cellulose and
hemicelluloses.
This sub-objective is directly related to the overall objective. Categories of tar species can have
different implications in downstream processes. Correlation with macromolecules in torrefaction
char is valuable to the feedback control of the torrefaction process.
6. Quantify the change in composition of woody biomass during torrefaction.
The extent of torrefaction depends on peak temperatures, residence times and contact methods.
The sub-objective evaluates metrics to quantify the extent of torrefaction.
7. Quantify the effect of torrefaction on contaminants in syngas from fluidized bed
gasification of willow.
By quantifying both the extent of torrefaction and the change in contaminants in syngas, a
determination of the improvement in quality of syngas associated with torrefaction can be made.
5
1.3. Thesis organization
The thesis is organized around four manuscripts (chapters 3-6) that demonstrate the potential for
torrefaction as a pretreatment for fluidized bed gasification. Chapter 3 investigates the change in
characteristics of willow by torrefaction demonstrating an effective measurement of the extent of
torrefaction from a continuous reactor (sub-objective 6). Chapter 4 addresses sub-objectives 1
and 4, measuring tar concentration in syngas as a metric for syngas quality. Chapter 5 addresses
sub-objectives 2, 3 and 5 using mass spectrometry to measure syngas quality. Finally, chapter 6
applies the data from chapters 3, 4, and 5 to an existing power station to model the potential
greenhouse gas emissions reduction from co-firing torrefied willow with coal. There is a growing
interest in life-cycle assessment as a tool for effective policy decisions related to reducing
greenhouse gases and modeling GHG emissions is an application of the research methodology.
Prefaces are included with each of the four manuscripts to connect the work to the overall thesis,
describe the author and co-author contributions to each section, and to describe any differences
between the manuscript and thesis chapters. References are listed at the end of each chapter.
Scientific significance and engineering implications of the work are included in chapter 7 along
with recommendations for furthering this work.
6
1.4. References
Bergman, P.C.A., and Kiel, J.H.A. 2005. Torrefaction for biomass upgrading. Paper presented at
the 14th European Biomass Conference and Exhibition, October 17-21, Paris, FR.
Borman, G.L., and Ragland, K.W. 1998. Combustion engineering, McGraw-Hill, New York,
NY.
Chen, W., Peng, J., and Bi, X.T. 2015. A state-of-the-art review of biomass torrefaction,
densification and applications. Renewable and Sustainable Energy Reviews 44: 847-66.
Diacarbon. Biocoal. 2017. Available from http://www.diacarbon.com/biocoal/ (Accessed 01/16
2017).
Eisentraut, A., Brown, A., and Fulton, L. 2011. Technology roadmap: Biofuels for transport.
International Energy Agency.
Esteban, L.S., and Carrasco, J.E. 2006. Evaluation of different strategies for pulverization of
forest biomasses. Powder Technology 166 (3): 139-51.
Government of Canada. 2015. Canada's second biennial report on climate change. 3001
UNFCCC Environment and Climate Change Canada, Gatineau, QC.
Hangs, R. 2014. Biomass production and nutrient cycling in short-rotation coppice willow (Salix
spp.) bioenergy plantations in Saskatchewan, Canada. PhD., University of Saskatchewan.
Sherrard, A. 2014. World's first advanced biomass power plant conversion nears completion.
Bioenergy International. July.
Steynberg, A., and Dry, M. 2004. Fischer-tropsch technology Elsevier. Amsterdam, NL.
Ter-Mikaelian, M.T., Colombo, S.J., Lovekin, D., McKechnie, J., Reynolds, R., Titus, B., et al.
2015. Carbon debt repayment or carbon sequestration parity? Lessons from a forest
bioenergy case study in Ontario, Canada. GCB Bioenergy 7 (4): 704-16.
Van Loo, S., and Koppejan, J. (eds.), 2008. Biomass ash characteristics and behaviour in
combustion systems. In The handbook of biomass combustion and co-firing. 2nd ed.,
Earthscan, London, UK, pp. 249
Zhang, Y., McKechnie, J., Cormier, D., Lyng, R., Mabee, W., Ogino, A., et al. 2010. Life cycle
emissions and cost of producing electricity from coal, natural gas, and wood pellets in
Ontario, Canada. Environmental Science and Technology 44 (1): 538-44.
7
2. Literature review
The thesis covers a wide breadth of engineering and biological science including short-rotation
agroforestry, fluidization, gas-solid reactions, and thermochemical conversion of biomass. The
work therefore, appeals to a large audience. Although chapters include current research related to
each topic, the necessary background may not be obvious to all readers. The following literature
review provides a brief context and background for topics not covered in the subsequent
chapters. These include short-rotation coppice willow, fluidized bed gasification of biomass, tar
measurement techniques, torrefaction as a pretreatment for gasification, and life-cycle
assessment of energy systems. Three main knowledge gaps are identified during the review of
the current literature.
2.1. Short-rotation coppice willow
Willow (Salix spp.) have been utilized for various purposes since the 1800s including as
furniture and as an analgesic (Kuzovkina et al. 2008). Willow have an excellent ability to
colonize newly opened habitats and survive adverse conditions (drought, flood, sediment
deposition, etc...). The ability of the species to produce stems from old stock (stumps or stools)
and utilize light efficiently result in high yields of woody biomass (Kuzovkina et al. 2008;
Cannell et al. 1988). These traits have been advantageous in the cultivation of willow leading to
a protocol for propagation of willow for bioenergy purposes (Abrahamson et al. 2002). Willow
can be planted in a narrow spacing (15,000 stems/ha) and coppiced after the first year of growth.
Coppicing involves the cutting of a single stem with the root stock still intact. Each cut stem will
subsequently produce multiple stems increasing the yield at harvest. Harvest occurs on a 3-year
rotation during the winter to exclude leaves and debris and lasts up to 7 rotations (21 years)
before yields start to decline. Willow are easily cross-pollinated and can be hybridized or
selected for desirable traits such as high biomass yields, pest resistance, drought tolerance, etc...
(Kuzovkina et al. 2008). Willow cultivation is an established source of biomass for bioenergy
purposes.
In addition to the suitability of willow for cultivation, researchers have demonstrated a long list
of social, economic, and environmental benefits associated with willow plantations. Specifically,
Volk et al. (2004) identify six internationally recognized sustainability criteria; conservation of
biodiversity, conservation of soil and water resources, maintenance of the global carbon cycle,
ecosystem productivity and health, socioeconomic benefits, and a policy and legal framework.
SRC willow plantations improve soil quality, reduce nutrient leaching into waterways, and
increase biodiversity (Hangs 2014; Mola-Yudego and Aronsson 2008; Mushanski 2015; Baum et
al. 2012). Furthermore, establishing willow plantations on underutilized or unutilized land results
in carbon sequestration shortly after establishment (Amichev et al. 2012). Relative to herbaceous
bioenergy crops, where removal of all above ground biomass occurs each rotation, willow
biomass experiences low nutrient release (<50 %) as a result of leaf-litter cycles (Hangs et al.
2014).
8
In terms of socioeconomic benefits, willow plantations have experienced a “market failure”
attributed to failure of the system to recognize the external costs and benefits of bioenergy
systems in comparison with other renewable and non-renewable energy pathways (Keoleian and
Volk 2005; Thevathasan et al. 2014). For example, the low energy density of willow and other
biomass limit transport distances. Short transport distances, however, focus the benefits on local
and regional economies (Volk et al. 2004). Some sources have suggested that external costs can
be managed with policy and incentives, particularly during an establishment period when
expenses to farmers are high and regular income is not yet available (Volk et al. 2004; Busch
2012). Increasing the overall quality of post-harvest willow and therefore the market value is an
additional pathway to greater deployment that has received less attention in literature.
2.2. Syngas quality from fluidized bed gasification
Fluidized bed gasification involves exposure of a solid fuel to an oxidant (air or steam) at high
temperatures in an oxygen-lean environment. For gasification of biomass, a bed of sand is
fluidized by maintaining a superficial gas velocity in the reactor sufficient to balance the weight
of the particles (Kunii and Levenspiel 2013). At a certain gas velocity the bed will bubble and
boil behaving much like a fluid. When heated, the fluidized bed of sand has good mixing
characteristics and produces high heat and mass transfer. Fluidized bed gasification involves a
solid fuel exposed to sub-stoichiometric flow of air and a fluidized bed at temperatures between
800 °C and 1100 °C, producing combustible gases (Kurkela 1996; Van Loo and Koppejan 2008).
Although other types of gas-solid contactors are used in gasification, fluidized bed gasifiers offer
scalability to an industrial scale without compromising the heat and mass transfer characteristics
(Cuellar 2012). Therefore, fluidized bed gasification is the only technology considered in this
work.
Combustible gas from gasification called most often either syngas or product gas (syngas in this
work) consists of H2 and CO in abundance, CH4, C2-C6 gaseous hydrocarbons, higher order
hydrocarbons as vapours or aerosols, and soot (carbon particles). Syngas is commonly produced
from fossil fuels (coal and natural gas) in order to remove sulphur, increase the heating value,
increase the ratio of hydrogen to carbon, and remove oxygen (Basu 2013). Production of syngas
from biomass compared to fossil fuels decreases CO2, SO2, and oxides of nitrogen (NOx)
emissions from energy systems, decreases the net energy ratio (units of fossil fuel energy used to
produce a unit of energy), increases regional energy independence, and improves ecosystem
services (related to human health and well being) (Basu 2013; Mann and Spath 2002; Wang et
al. 2014; Holland et al. 2015).
Syngas applications are wide ranging from direct combustion in boilers or gas turbines, to
catalytic processing into liquid fuels and chemicals, to fermentation into ethanol. Globally,
syngas is predominately used to produce H2 for ammonia production (Spath and Dayton 2003).
The syngas properties are dependent upon the conversion technology and the feedstock.
Similarly, the required syngas properties for downstream processes depend upon the synthesis
process. For example, for methanol and DME synthesis, a stoichiometric ratio [(H2-
9
CO)/(CO+CO2)] of 2 is desirable, whereas for Fischer-Tropsch (FT) synthesis a H2/CO ratio of 2
is required (Dybkjaer and Christensen 2001). FT synthesis is the production of liquid
hydrocarbons and oxygenates over an iron catalyst discovered in 1923 that initiated the
development of many chemical processes (Spath and Dayton 2003). In general, steam reforming
of methane can produce a H2/CO ratio of 3:1, whereas coal or biomass gasification produce
ratios of 1 or less.
In addition to bulk syngas composition, most synthesis processes have a very low tolerance for
trace contaminants (Spath and Dayton 2003; Milne et al. 1998). For example, Spath and Dayton
(2003) describe the desulphurization of natural gas to less than 0.5 ppm prior to steam reforming
for the production of H2 in order to extend catalyst life to 3 years. Although woody biomass is
virtually free of sulphur, nitrogen, and ash, the complex structure of lignocelluloses and alkali
metals in biomass ash result in operational challenges in the gasifier and contamination of the
syngas. In fluidized bed gasification, the inorganic content of the feedstock can lead to
agglomeration of the bed material. High mineral ash in biomass results in eutectic mixtures with
very low melting points (McKendry 2002). The mixtures result in the formation of clinker or
slag, large blocks of agglomerated bed material that prevent fluidization.
More problematic than bed agglomeration however, is the prevalence of tars in the syngas from
biomass gasification. Tars are a mixture of organic compounds (primarily aromatic,
heteroaromatic, and polycylic aromatic species) produced by partial-oxidation of organic
material that condense at or below 450 °C (Milne et al. 1998; McKendry 2002; Hernández et al.
2013). Tar is costly to remove from the gas stream and damaging to downstream equipment
surfaces that are below the dewpoint temperature of the vapour mixture.
Considerable research has focused on understanding the mechanisms and kinetics of tar
formation (Jess 1996; Mastral and Callen 2000). The classification of tars into primary,
secondary, and tertiary products by Milne et al. (1998) was important in identifying the
precursors to tar species. The polymer constituents in biomass (cellulose, hemicellulose, and
lignin) breakdown at high temperatures to form primary tar species. Additional vapour phase
reactions subsequently form secondary and tertiary tars consisting of olefins, phenolics, and
aromatic species (Milne et al. 1998; Evans and Milne 1987a; Evans and Milne 1987b). Overall
tar concentration has been reported for the main gasifier types as 100 mg/mN3 in updraft
gasifiers, 10 mg/mN3 in fluidized-bed gasifiers and 1 mg/mN
3 in downdraft gasifiers as a rule of
thumb (Milne et al. 1998). Others report considerably higher tar concentrations in syngas from
biomass gasification ranging from 2 to 58 g/mN3 (Kurkela et al. 1993; Bhattacharya et al. 1999;
van Paasen and Kiel 2004).
Variations in the definition of tars have led some to focus on the composition and properties of
tars rather than the overall concentration (Bergman et al. 2002). For example, benzene has been
included and excluded as a tar component from different studies, resulting in large variations in
measurements of tar concentration (Göransson et al. 2011). In this work, benzene is classified as
10
a tar because of its potential environmental effects and carcinogenicity. In general, the consensus
is that the most abundant tar species are benzene, toluene, and naphthalene (Milne et al. 1998;
Hernández et al. 2013; Kurkela and Ståhlberg 1992).
Mature technologies exist for removal of contaminants in syngas both within and downstream of
the gasifier. Removal of tars within the gasifier (primary methods) include catalytic or thermal
cracking, internal reforming, modified reactor design, and optimized gasification conditions
(Göransson et al. 2011; Devi et al. 2003). Downstream gas cleaning (secondary methods)
include filtration, plasma cracking, scrubbing, electrostatic precipitation, monolith reactors, and
catalytic filters and reactors (Göransson et al. 2011; Rabou et al. 2009). However, gas cleaning is
costly and preventing or reducing the formation of tars during gasification is a priority and is the
focus of this work.
2.3. Tar measurement of syngas
Three tar measurement systems or variations on these techniques are described in literature. These
include the guideline method, solid phase adsorption sampling, and molecular beam mass
spectrometry (Israelsson et al. 2013; Esplin et al. 1985; Carpentar et al. 2007). The techniques and
protocols have been developed over several decades and a description is provided by Milne et al.
(1998).
The European guideline method is an offline tar analysis protocol whereby gas is conditioned,
filtered, condensed in a series of solvent filled impinger bottles, and metered (Li and Suzuki
2009). The clean tar sample is analyzed by gas chromatography (GC). The main benefits are the
ability to sample GC detectable and undetectable tars, gravimetric tars, and concentrations of
organic compounds (van Paasen and Kiel 2004). Also, the method requires no proprietary
equipment and can be assembled cheaply relative to other methods. On the downside, the
solutions of tars have been found to continue to react over time and change the profiles of the
products. Analysis of the solution within an 8-hour time frame has been proposed to correct the
issues with storage life of the samples (Xu et al. 2006).
Solid phase adsorption (SPA) involves extraction of a gas sample using a syringe through a
septum. The sample is then collected on a column with an amino phase sorbent and analyzed by
GC-FID (van Paasen and Kiel 2004). SPA sampling is fast and reliable for measurement of tars
with molecular weights from benzene (78 g/mole) to corenene (300 g/mole).
Molecular beam sampling mass spectrometric methods involve rapid expansion of the gas-jet to
form a collisionless flow of molecules with low internal energy (Carpentar et al. 2007). The low
energy particles no longer react and are analyzed using a quadrupole mass spectrometer. The
ability of the device to provide semi-quantitative mass spectra for complex vapours over a wide
mass-to-charge ratio has proven to be a valuable research application in many fields (Evans and
Milne 1987a; Bläsing and Müller 2010).
11
Milne et al. (1998) list hundreds of studies related to the sampling and analysis of tars from
gasification and hundreds more have been conducted in the years since. This work focuses on
monitoring of tar concentration during operation of fluidized bed gasification. Relatively few
studies address the ongoing measurement of tars for the purposes of process control.
2.4. Torrefaction and gasification
Torrefaction has been shown to improve biomass handling and feeding characteristics, increase
gasification efficiency, produce syngas with higher H2 and CO concentrations, and improve
fluidization in the gasification reactor (Prins et al. 2006; Couhert et al. 2009; Chen et al. 2011).
Several studies have addressed the effect of torrefaction on syngas contamination by tar.
Dudyński et al. (2015) gasified torrefied pellets in an industrial fixed bed gasifier measuring
condensed tars. Gasification of torrefied and non-torrefied pellets was conducted at different
temperatures and a direct comparison could not be made. Sweeney (2012) studied pressurized
fluidized bed gasification of torrefied loblolly pine with a focus on operating conditions and
fluidization. He reported lower tar concentration in syngas from torrefied pine and observed that
syngas from torrefied pine had a greater proportion of heavier tars compared to non-torrefied
pine. Finally, Raut (2014) gasified commercial dowels that had been torrefied and charred. The
work showed a decrease in tar yield during bubbling fluidized bed gasification. Despite this body
of work, a rigorous connection between the extent of torrefaction and syngas contamination has
not been made. Further study of the specific effect of torrefaction on classes of tars and in-situ
measurement of tar in real-time is warranted.
2.5. Life-cycle assessment of energy systems
Life-cycle assessment (LCA) has become a vital tool in the evaluation of environmental impact
to guide production and consumption habits in a more sustainable direction (Baumann and
Tillman 2004). The methodology has been applied to a wide range of products, systems, and
services with an equally wide range of desired outcomes. From waste-management to the 1970’s
energy crisis, the roots of LCA in periods of fierce debate have resulted in a robust and
comprehensive methodology and ultimately international standards for the practice (Baumann
and Tillman 2004; Finkbeiner et al. 2006; BSI).
The phases of LCA include (1) definition of scope, (2) life-cycle inventory, (3) life-cycle impact
assessment, (4) life-cycle interpretation, (5) limitations of the LCA, (6) relationships between
phases, and (7) conditions of use of value choices (ISO 14040:2006). Not all phases are included
depending on the scope of the study. Definition and communication of the “functional unit” are
critical to the interpreting the results. For energy systems analysis, the functional unit is typically
a unit of energy produced by a terminal unit, such as a 40 MW generator or 1 MJ of diesel fuel
produced. The emissions associated with the “cradle-to-grave” production of the unit of energy
are then determined. The functional unit allows for the definition of a reference to which each of
the scenarios are compared. For example, proposed improvements to an electricity generation
pathway are compared to the existing generating station.
12
Many factors influence the outcome of a LCA including data quality, spatial variation, and local
environmental uniqueness (Reap et al. 2008). Data can be acquired from various sources and
databases +/-50% uncertainty in the results attributed to poor data quality (Finnveden and
Lindfors 1998). Spatial considerations relate the emissions with the local receiving environment.
Reap et al. (2008) rank the severity of spatial variations very high compared to other issues and
provide categories of site-generic, site-dependent, and site-specific assessments to differentiate
interpretations of a LCA. Environmental uniqueness is also ranked as a severe problem with
LCA by Reap et al. (2008). When considering biomass willow as an energy resource, the
impacts of regional environmental and spatial sensitivity are particularly acute. Therefore,
applying regionally collected data to existing energy systems can greatly improve the value of
LCA results.
2.6. Knowledge gaps
SRC willow plantations are a suitable candidate for bioenergy applications in the Canadian
prairies. However, the “market failure” of SRC willow plantations, attributed in part to the low-
value of the crop at harvest relative to fossil fuel, is an ongoing concern for researchers. The
most technically viable pathway for the production of high-value liquid fuels and chemicals from
willow is via gasification. Tar contamination of syngas from biomass is problematic and
downstream syngas cleaning is expensive. Two main knowledge gaps have been identified
related to tar contamination of syngas; (1) the real-time, continuous measurement of tar for the
purposes of process control, and (2) the effects of torrefaction on tars formed during gasification
of biomass require additional study. In this thesis, two different tar measurement systems are
proposed in Chapters 4 and 5. The systems are used to study the effects of torrefaction on tar
concentration and tar species in syngas. Chapter 6 addresses the issue of deployment of SRC
willow by proposing the application of the feedstock co-fired with coal in an existing generating
station.
13
2.7. References
Abrahamson, L.P., Volk, T.A., White, E., and Ballard, J.L. 2002. Willow biomass producer's
handbook. Willow Biomass Producer's Handbook.
Amichev, B.Y., Kurz, W.A., Smyth, C., and Rees, K.C. 2012. The carbon implications of large‐
scale afforestation of agriculturally marginal land with short‐rotation willow in
Saskatchewan. GCB Bioenergy 4 (1): 70-87.
Basu, P. 2013. Biomass gasification, pyrolysis and torrefaction. 2nd ed. Elsevier Inc. San Diego,
USA.
Baum, S., Bolte, A., and Weih, M. 2012. Short rotation coppice (SRC) plantations provide
additional habitats for vascular plant species in agricultural mosaic landscapes. BioEnergy
Research 5 (3): 573-83.
Baumann, H., and Tillman, A. 2004. The hitch hiker's guide to LCA (Life Cycle Assessment): an
orientation in Life Cycle Assessment methodology and application. Studentlitteratun, Lund,
Sweden.
Bergman, P.C., van Paasen, S.V., and Boerrigter, H. 2002. The novel “OLGA” technology for
complete tar removal from biomass producer gas. Paper presented at Pyrolysis and
gasification of biomass and waste, expert meeting, Strasbourg, France.
Bhattacharya, S.C., Mizanur Rahman Siddique, A.H., and Pham, H. 1999. A study on wood
gasification for low-tar gas production. Energy 24 (4): 285-96.
Bläsing, M., and Müller, M. 2010. Mass spectrometric investigations on the release of inorganic
species during gasification and combustion of Rhenish lignite. Fuel 89 (9): 2417-24.
BSI, P. 2050: 2011-Specification for the Assessment of the Life Cycle Greenhouse Gas
Emissions of Goods and Services, 2011.
Busch, G. 2012. GIS-based tools for regional assessments and planning processes regarding
potential environmental effects of poplar SRC. BioEnergy Research 5 (3): 584-605.
Cannell, M., Sheppard, L., and Milne, R. 1988. Light use efficiency and woody biomass
production of poplar and willow. Forestry 61 (2): 125-36.
Carpentar, D.L., Deutch, S.P., and French, R.J. 2007. Quantitative measurement of biomass
gasifier tars using a molecular-beam mass spectrometer: Comparison with traditional
impinger sampling. Energy and Fuels 21: 3036.
Chen, Q., Zhou, J.S., Liu, B.J., Mei, Q.F., and Luo, Z.Y. 2011. Influence of torrefaction
pretreatment on biomass gasification technology. Chinese Science Bulletin 56 (14): 1449-56.
Couhert, C., Salvador, S., and Commandré, J. 2009. Impact of torrefaction on syngas production
from wood. Fuel 88 (11): 2286-90.
14
Cuellar, A.D. 2012. Plant power: The cost of using biomass for power generation and potential
for decreased greenhouse gas emissions. Masters of Science in Technology and Policy.,
Massachusetts Institute of Technology.
Devi, L., Ptasinski, K.J., and Janssen, F.J. 2003. A review of the primary measures for tar
elimination in biomass gasification processes. Biomass and Bioenergy 24 (2): 125-40.
Dudyński, M., van Dyk, J.C., Kwiatkowski, K., and Sosnowska, M. 2015. Biomass gasification:
Influence of torrefaction on syngas production and tar formation. Fuel Processing
Technology 131: 203-12.
Dybkjaer, I., and Christensen, T.S. 2001. Syngas for large scale conversion of natural gas to
liquid fuels. Natural Gas Conversion VI: 435.
Esplin, G.J., Fung, D.P.C., and Hsu, C.C. 1985. Development of sampling and analytical
procedures for biomass gasifiers The Canadian Journal of Chemical Engineering 63 (6):
946-53.
Evans, R.J., and Milne, T.A. 1987a. Molecular characterization of the pyrolysis of biomass. 1.
fundamentals. Energy and Fuels 1 (2): 123-37.
Evans, R.J., and Milne, T.A. 1987b. Molecular characterization of the pyrolysis of biomass. 2.
applications Energy and Fuels 1 (4): 311-9.
Finkbeiner, M., Inaba, A., Tan, R., Christiansen, K., and Klüppel, H. 2006. The new
international standards for life cycle assessment: ISO 14040 and ISO 14044. The
International Journal of Life Cycle Assessment 11 (2): 80-5.
Finnveden, G., and Lindfors, L.-. 1998. Data quality of life cycle inventory data—rules of
thumb. The International Journal of Life Cycle Assessment 3 (2): 65-6.
Göransson, K., Söderlind, U., He, J., and Zhang, W. 2011. Review of syngas production via
biomass DFBGs. Renewable and Sustainable Energy Reviews 15 (1): 482-92.
Hangs, R. 2014. Biomass production and nutrient cycling in short-rotation coppice willow (Salix
spp.) bioenergy plantations in Saskatchewan, Canada, PhD., University of Saskatchewan
Hangs, R.D., Schoenau, J.J., Van Rees, K.C., Bélanger, N., and Volk, T. 2014. Leaf litter
decomposition and nutrient-release characteristics of several willow varieties within short-
rotation coppice plantations in Saskatchewan, Canada. BioEnergy Research 7 (4): 1074-90.
Hernández, J., Ballesteros, R., and Aranda, G. 2013. Characterisation of tars from biomass
gasification: Effect of the operating conditions. Energy 50: 333-42.
Holland, R., Eigenbrod, F., Muggeridge, A., Brown, G., Clarke, D., and Taylor, G. 2015. A
synthesis of the ecosystem services impact of second generation bioenergy crop production.
Renewable and Sustainable Energy Reviews 46: 30-40.
ISO 14040:2006, Environmental Management – Life Cycle Assessment – Principles and
Framework, July 2006.
15
Israelsson, M., Seemann, M., and Thunman, H. 2013. Assessment of the solid-phase adsorption
method for sampling biomass-derived tar in industrial environments. Energy and Fuels 27
(12): 7569-78.
Jess, A. 1996. Mechanisms and kinetics of thermal reactions of aromatic hydrocarbons from
pyrolysis of solid fuels. Fuel 75 (12): 1441-8.
Keoleian, G.A., and Volk, T.A. 2005. Renewable energy from willow biomass crops: Life cycle
energy, environmental and economic performance. Critical Reviews in Plant Sciences 24 (5-
6): 385-406.
Kunii, D., and Levenspiel, O. 2013. Fluidization engineering Elsevier.
Kurkela, E., and Ståhlberg, P. 1992. Air gasification of peat, wood and brown coal in a
pressurized fluidized-bed reactor. I. carbon conversion, gas yields and tar formation. Fuel
Processing Technology 31 (1): 1-21.
Kurkela, E., Ståhlberg, P., Laatikainen, J., and Simell, P. 1993. Development of simplified
IGCC-processes for biofuels: Supporting gasification research at VTT. Bioresource
Technology 46 (1-2): 37-47.
Kurkela, E. 1996. Formation and removal of biomass-derived contaminants in fluidized-bed
gasification processes, VTT Publications, vol. 287, VTT, Espoo, Finland.
Kuzovkina, Y.A., Weih, M., Romero, M.A., Charles, J., Hust, S., McIvor, I., et al. 2008. Salix:
Botany and global horticulture. Horticultural Reviews-Westport then New York- 34: 447.
Li, C., and Suzuki, K. 2009. Tar property, analysis, reforming mechanism and model for biomass
gasification—An overview. Renewable and Sustainable Energy Reviews 13 (3): 594-604.
Mann, M.K., and Spath, P.L. 2002. Life cycle assessment comparisons of electricity from
biomass, coal and natural gas. Paper presented at Annual meeting of the American Institute
of Chemical Engineers, November.
Mastral, A.M., and Callen, M.S. 2000. A review on polycyclic aromatic hydrocarbon (PAH)
emissions from energy generation. Environmental Science and Technology 34 (15): 3051-7.
McKendry, P. 2002. Energy production from biomass (part 3): Gasification technologies.
Bioresource Technology 83 (1): 55-63.
Milne, T.A., Abatzoglou, N., and Evans, R.J. 1998. Biomass gasifier "tars": Their nature,
formation and conversion. NREL/TP-570-25357 NREL, Golden, Colorado, USA.
Mola-Yudego, B., and Aronsson, P. 2008. Yield models for commercial willow biomass
plantations in Sweden. Biomass and Bioenergy 32 (9): 829-37.
Mushanski, M.D. 2015. Habitat selection by birds in willow-ringed wetlands: management
implications for harvesting willow biomass. MSc., University of Regina.
Prins, M.J., Ptasinski, K.J., and Janssen, F.J.J.G. 2006. More efficient biomass gasification via
torrefaction. Energy 31 (15): 3458-70.
16
Rabou, L.P., Zwart, R.W., Vreugdenhil, B.J., and Bos, L. 2009. Tar in biomass producer gas, the
Energy Research Centre of the Netherlands (ECN) experience: An enduring challenge.
Energy and Fuels 23 (12): 6189-98.
Raut, M.K. 2014. Studies into the effect of torrefaction on gasification of biomass. MASc.,
Dalhousie University.
Reap, J., Roman, F., Duncan, S., and Bras, B. 2008. A survey of unresolved problems in life
cycle assessment. The International Journal of Life Cycle Assessment 13 (5): 374.
Spath, P.L., and Dayton, D.C. 2003. Preliminary Screening-Technical and Economic Assessment
of Synthesis Gas to Fuels and Chemicals with Emphasis on the Potential for Biomass-
Derived Syngas.
Sweeney, D.J. 2012. Performance of a pilot scale, steam blown, pressurized fluidized bed
biomass gasifier. PhD., University of Utah.
Thevathasan, N., Gordon, A., Simpson, J., Peng, X., Silim, S., Soolanayakanahally, R., et al.
2014. Sustainability indicators of biomass production in agroforestry systems. Open
Agriculture Journal 8: 1-11.
Van Loo, S., and Koppejan, J. 2008. The handbook of biomass combustion and co-firing.
Earthscan, London, UK.
van Paasen, S., and Kiel, J. 2004. Tar formation in a fluidised-bed gasifier: Impact of fuel
properties and operating conditions. ECN-C--04-013 Energy Research Centre of the
Netherlands ECN, Amsterdam, NL.
Volk, T.A., Verwijst, T., Tharakan, P.J., Abrahamson, L.P., and White, E.H. 2004. Growing fuel:
A sustainability assessment of willow biomass crops. Frontiers in Ecology and the
Environment 2 (8): 411-8.
Wang, Y., Winans, K., Shao, Y., Matovic, M., and Whalen, J. 2014. Life cycle assessment of
biomass integrated gasification combined cycle in cement industry. Paper presented at the
seventh international conference on environmental science and technology, Houston, Texas,
USA.
Xu, M., Brown, R.C., and Norton, G. 2006. Effect of sample aging on the accuracy of the
international energy agency's tar measurement protocol. Energy and Fuels 20 (1): 262-4.

17
3. Quantifying the Extent of Torrefaction with Hemicelluloses,
Oxygen/Carbon Ratio, Higher Heating Value, and Carbon Composition
3.1. Preface
This chapter provides characterization data for torrefied and non-torrefied willow (Salix spp.) in
order to evaluate sub-objective 6. The novelty of this work is in the application of rapid
measurement techniques for torrefaction process control. The control system methodology
requires an intermediate measure of the quality of char. To accommodate different torrefaction
scenarios, char quality measurement cannot depend on the biorefinery process. The measurement
must be independent of syngas quality. For example, in the case of field torrefaction (i.e. where
the willow is torrefied at the location and time of harvest), the plant operator may adjust the peak
torrefaction temperature to account for in-situ particle size variation, moisture variation, or
atmospheric conditions in order to produce char of a predetermined quality. Alternatively, for
torrefaction as a pre-treatment for gasification or combustion specifically to improve
downstream metrics (i.e. torrefaction at a centralized site), the plant control system requires a
metric independent of the conditions already mentioned (particle size, atmosphere, feedstock,
etc...). The metric established in this work as a measure of the extent of torrefaction
(hemicelluloses) is subsequently the measure used in chapters 4 and 5 to quantify improvements
in syngas quality as a result of torrefaction.
The assistance of co-authors on the paper is greatly appreciated. The co-authors were William
Campbell MSc, P.Eng. Dr. Aaron Phoenix P.Eng, FEC, and Dr. Richard Evitts P.Eng. Bill
Campbell designed and conducted the torrefaction experiments for wheat straw, provided
manuscript review and assisted with interpretation of higher heating value correlations. Dr.
Aaron Phoenix and Richard Evitts provided manuscript review and methodological assistance.
Finally, Dr. Raju Soolakanahally harvested and supplied willow samples for the work and Dr.
Michelle Serapiglia conducted HR-TGA measurement of lignocellulosic composition. All other
contributions in the paper including quantitative data analysis, literature review, methodology,
torrefaction of willow, and preparation of the manuscript are my unique contributions to this
work.
3.2. Abstract
Easily measured characterization data for torrefied biomass is necessary for the effective control
of torrefaction processing plants. SV1 willow (Salix dasyclados) was torrefied at five
temperatures in a continuous torrefaction system. The resulting char was characterized for
ultimate and lignocellulosic composition. The characteristic data was compared to four native
willow varieties grown in field conditions in Saskatchewan, torrefied and non-torrefied wheat
straw, and two willow varieties grown in Prince Edward Island (SV1 and Salix viminalis). From
the ultimate composition, higher heating value was found to increase linearly with lignin fraction
in torrefied and non-torrefied SV1 willow (r=0.98). The cellulose fractions for field grown

18
willow were lower than SV1 willow grown in experimental plots (p<0.05). Significant
carbonization of SV1 willow as a result of torrefaction occurred only when the peak torrefaction
temperature reached 270 °C (p<0.05). The oxygen to carbon (O/C) ratio (w/w) decreased by 16.9
(+/-1.7) % for SV1 willow torrefied at 270 °C compared to non-torrefied SV1 willow. Finally,
the hemicelluloses fraction decreased monotonically with peak torrefaction temperatures and was
relatively easy to measure. The inverse linear relationship between hemicelluloses and peak
torrefaction temperature (r = 0.98) was measureable at every interval except between 240 °C and
250 °C. Hemicelluloses fraction of willow was found to be the most suitable measure of the
extent of torrefaction compared to the carbon fraction, higher heating value, and the O/C ratio.
3.3. Introduction
Torrefaction is a promising stabilization technology for biomass. Co-firing of torrefied biomass
with coal has been proposed as an option for reducing GHG emissions from coal-fired power
generation in order to meet national emission reduction targets (Amichev et al. 2012; Hangs
2014). The torrefied char requires less energy to mill and is more homogenous in physical
character. It has similar characteristics to coal and is therefore, more suitable than untreated
biomass for combustion in pulverized fuel boilers either co-fired with coal or in a fuel switching
scenario as modeled by Li et al. (2012). Torrefaction has also been shown to improve syngas
properties from biomass gasification (Couhert et al. 2009; Woytiuk et al. 2017). Application of
torrefied biomass to bioenergy processes requires careful examination of the qualities and
characteristics of the char before and after the pretreatment process.
Torrefaction is a thermal process used to change the physical structure of solid biomass. The
process temperature range (240 °C – 300 °C) specifically targets volatilization of hemicelluloses
causing embrittlement, a reduction of oxygen content, and subsequently, an increase in the
carbon fraction of the resulting char (Bergman and Kiel 2005). Torrefied char has a lower
equilibrium moisture content compared to raw biomass and thereby experiences less degradation
during outdoor storage (Yan et al. 2009). Finally, the increase in energy density of the
torrefaction char decreases both the overall cost and emissions of transporting biomass to the
generating station. However, the energy cost of the process must be carefully considered.
Typically, torrefaction yields only 90 % of the total biomass energy input to the process. High
energy use in the process could easily erase the benefits of torrefaction.
A major risk associated with co-firing as a GHG mitigation strategy is the long-term, dedicated
supply of biomass (Berndes et al. 2010). Short-rotation coppice willow plantations are an option
for creating a dedicated supply of lignocellulosic biomass for co-firing in western Canada.
Willow (Salix spp.) is easily propagated and produce high yields in cold climates making them
desirable for bioenergy applications (Keoleian and Volk 2005). The species has a large genetic
base and hybridization has been shown in some cases to result in the willow offspring that out-
performs its parents (Kuzovkina et al. 2008). Finally, the ability of willow to re-grow multiple
stems from a single stool after damage (coppicing) makes it a resilient feedstock for long-term
supply to energy systems (Volk et al. 2004).
19
Many high-yielding varieties of willow have been developed in northern Europe and the north-
eastern United States. Yields around 20 oven dry tonnes / hectare per year have been reported by
many studies on early rotations (Volk et al. 2001; Guidi Nissim et al. 2013). A breeding program
in Saskatchewan was initiated by the Agriculture and Agri-food Canada Agroforestry
Development Centre (AAFC-ADC) in 2005 to produce clones suited to the regional climate and
soil conditions (Schroeder et al. 2009). For example, high soil-salinity affects approximately 10
% of the arable land in the prairies and development of salt-tolerant willow varieties would be
advantageous for the region (Hangs 2014). The use of salt-affected or otherwise marginal lands
for bioenergy purposes has many benefits including significant carbon sequestration (Amichev et
al. 2012). Integration of critical end-use metrics such as higher heating value into a breeding
process could introduce previously unaccounted for GHG reduction potential. Low ash, high
calorific willow varieties could reduce downstream carbon emissions at the power plant.
Wheat straw is a widely available agricultural residue in western Canada. It helps to maintain
soil moisture between crop growing seasons, is considered essential in controlling erosion from
wind and runoff, and is an important component of cattle feed. For the purposes of erosion
mitigation, Sokhansanj et al. (2006) recommend that 1 tonne/hectare-year of wheat straw is
maintained in the field. Canada produces up to 23 million tonnes / year in excess of the quantity
required for erosion control with an average of about 15 million tonnes/ year above the
requirement (Sokhansanj et al. 2006). The abundance and relatively well established supply
chain for wheat straw make it an excellent source of biomass for power generation.
Despite the abundance of available wheat straw in western Canada, high ash and mineral content
are problematic for large scale combustion. The ash content can range from 5-12 % w/w and
consists mainly of oxides of silicon, potassium, and calcium as well as trace amounts of
chlorides (Wilen 1997). Potassium oxides in particular will contribute to an increase in slagging
behavior in boiler bottom-ash. Potassium oxides lower the ash melting temperature and combine
with chlorides that may be present to form potassium chloride, a major contributor to fouling and
corrosion of flue and gas systems (BISYPLAN 2012).
Integration of biomass into the electrical grid in Saskatchewan has many potential economic and
environmental benefits. Torrefaction has the potential to improve the quality of emerging and
existing sources of biomass (for example, coppice willow and wheat straw). A better
understanding of the effects of torrefaction on standard biomass characterization data will
contribute to integration of biomass in power generation.
In this work, torrefaction char is analyzed for ultimate composition, lignocellulose composition,
and ash fraction. Torrefied willow samples are compared to clones from two provinces of
Canada, Saskatchewan and Prince Edward Island (PEI). Wheat straw torrefied at three
temperatures (220 °C, 250 °C, and 280 °C) is compared to a control. Finally, four characteristics
of biomass are compared to one another as measures of the extent of torrefaction. The four
characteristics are (1) hemicelluloses fraction of the char, (2) carbon fraction of the char, (3)
20
oxygen to carbon ratio of the char, and (4) calculated higher heating value of the char. The
variables are evaluated based on their correlation with peak torrefaction temperatures, the
computational or sample analysis time, and the complexity of the measurement. The extent of
torrefaction is defined by an increase in peak torrefaction temperature. Peak torrefaction
temperature has been found to be much more significant than residence time for process control
purposes (Campbell et al. 2012). Characteristics that respond incrementally to peak torrefaction
temperature, can be measured rapidly without laborious analytical work, and require minimal
post-processing or computation after analysis are considered desirable as a measure of the extent
of torrefaction.
3.4. Materials and methods
3.4.1. Biomass
Coppice willow
Four species of willow native to North America were harvested from riparian rings surrounding
small wetlands in the regional municipality of Saskatchewan Landing (UTM 13N 299607
5612136). The samples were taken by Agriculture and Agri-food Canada (AAFC) as part of a
Salix breeding program in 2013 and are considered field-grown. Unlike the other willow
samples, the Saskatchewan field-grown willow samples are not a part of a dedicated bioenergy
plantation. The four willow varieties as identified by researchers with AAFC are Salix discolor,
Salix eriocephala, Salix petiolaris, and Salix interior. Five stems were sampled from each variety
and analyzed individually. The data in Tables 1-3 is the average of the five measurements.
A shrub willow cultivar, Salix dasyclados (‘SV1’) was selected for torrefaction. The SV1willow
used in this work is grown on the campus of the University of Saskatchewan in a plantation of 28
willow varieties for research purposes. The cultivar is disease and pest resistant and has
produced high yields in various soil conditions (Cameron et al. 2007). SV1 was selected because
of its relatively widespread use in North American coppice willow plantations. The samples were
harvested after one year of growth in the second, 3-year rotation of the plantation. Willow stems
were cut to 12.5 mm lengths, vacuum packed, and frozen for later processing and analysis.
An additional two varieties of willow (Salix dasyclados and Salix viminalis) were provided by
the AAFC. The samples were harvested from a purpose grown riparian buffer in the province of
PEI after 3 years of growth. The samples were cut into discs approximately 25 mm thick for
transportation. The discs were ground in a knife mill and stored at 4 °C prior to analysis.
Hard red spring wheat straw
Hard red spring wheat straw was used in the torrefaction investigation. The crop was grown near
the town of Watson, Saskatchewan and the straw was harvested between September and October
of 2015. The straw was air dried indoors to a moisture content of approximately 6-10 % weight
(w/w).
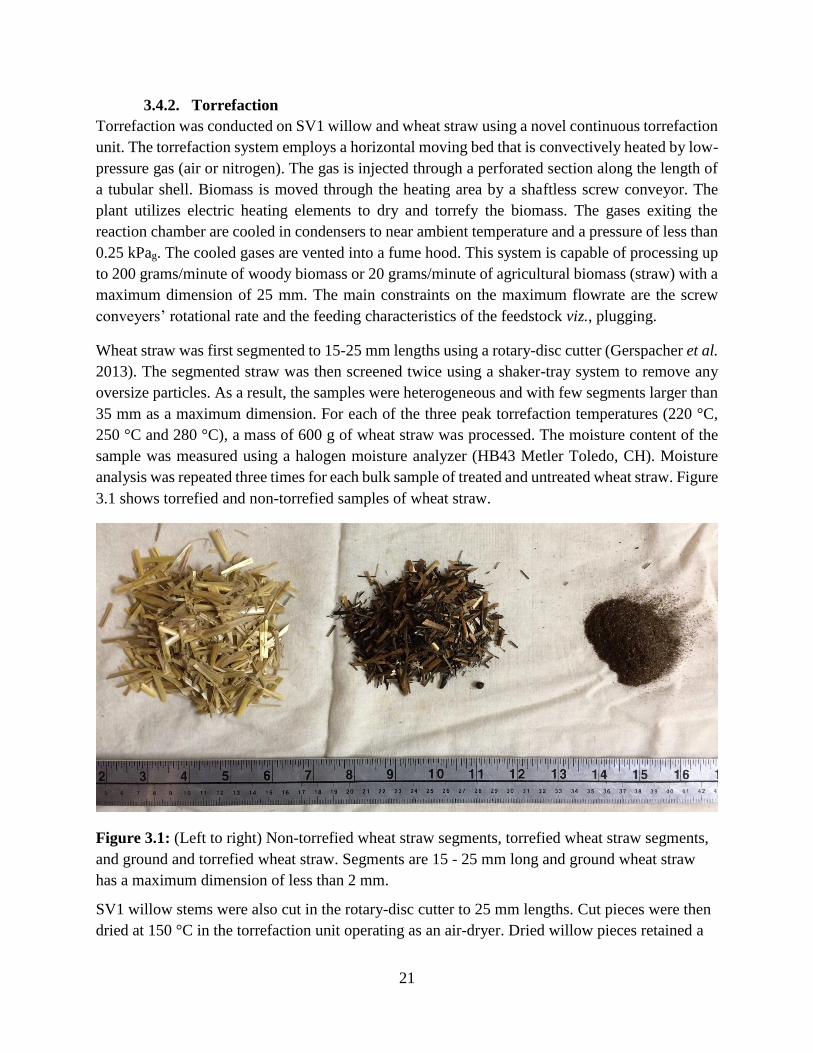
21
3.4.2. Torrefaction
Torrefaction was conducted on SV1 willow and wheat straw using a novel continuous torrefaction
unit. The torrefaction system employs a horizontal moving bed that is convectively heated by low-
pressure gas (air or nitrogen). The gas is injected through a perforated section along the length of
a tubular shell. Biomass is moved through the heating area by a shaftless screw conveyor. The
plant utilizes electric heating elements to dry and torrefy the biomass. The gases exiting the
reaction chamber are cooled in condensers to near ambient temperature and a pressure of less than
0.25 kPag. The cooled gases are vented into a fume hood. This system is capable of processing up
to 200 grams/minute of woody biomass or 20 grams/minute of agricultural biomass (straw) with a
maximum dimension of 25 mm. The main constraints on the maximum flowrate are the screw
conveyers’ rotational rate and the feeding characteristics of the feedstock viz., plugging.
Wheat straw was first segmented to 15-25 mm lengths using a rotary-disc cutter (Gerspacher et al.
2013). The segmented straw was then screened twice using a shaker-tray system to remove any
oversize particles. As a result, the samples were heterogeneous and with few segments larger than
35 mm as a maximum dimension. For each of the three peak torrefaction temperatures (220 °C,
250 °C and 280 °C), a mass of 600 g of wheat straw was processed. The moisture content of the
sample was measured using a halogen moisture analyzer (HB43 Metler Toledo, CH). Moisture
analysis was repeated three times for each bulk sample of treated and untreated wheat straw. Figure
3.1 shows torrefied and non-torrefied samples of wheat straw.
Figure 3.1: (Left to right) Non-torrefied wheat straw segments, torrefied wheat straw segments,
and ground and torrefied wheat straw. Segments are 15 - 25 mm long and ground wheat straw
has a maximum dimension of less than 2 mm.
SV1 willow stems were also cut in the rotary-disc cutter to 25 mm lengths. Cut pieces were then
dried at 150 °C in the torrefaction unit operating as an air-dryer. Dried willow pieces retained a

22
moisture content of approximately 5 % w/w on a wet basis. The dried willow pieces were
torrefied at five peak torrefaction temperatures (240 °C, 250 °C, 260 °C, 270 °C and 280 °C) in
the torrefaction unit using nitrogen gas as the heating medium rather than air. The willow
samples were conveyed such that the residence time was 10 minutes. The residence time
includes drying, intermediate heating, heating and torrefaction as described by Bergman and Kiel
(Bergman and Kiel 2005). The particles reached the target peak temperature in the last third of
the reactor length.
Torrefied and control (untreated) samples of both willow and wheat straw were ground using a
#1 Wiley mill operated by a 1 HP variable speed drive at 878 rpm with a 1.88 mm mesh screen.
Figure 3.2 shows the segmented willow stems prior to torrefaction and after torrefaction and
grinding.
Figure 3.2: (Left to right) Non-torrefied willow segments, torrefied willow segments, and
ground and torrefied willow. Segments are approximately 25 mm long and ground willow has a
maximum dimension of less than 2 mm
3.4.3. Characterization
Ultimate composition
Ultimate composition was measured using a CHNS analyzer (VarioEL III, Elementar, DE) and a
microbalance (XP6, Mettler Toledo, US) with a range of up to 5.1 g and a 1 μg precision. Once
the CHNS composition was determined, oxygen content was calculated by difference. The
CHNS analyzer operates by burning the samples in oxygen and quantifying the products of
combustion (Borman and Ragland 1998). A precise sample mass is input along with a milligram
quantity of sample by the technician. Three gas chromatographic columns selectively remove
SO2, H2O and CO2, and each gas is individually flushed to the thermal conductivity detector after
23
the measurement of N2 (Elementar 2005). Each element must be calibrated with analytical
standard compounds such as sulphanilic acid (Thompson 2008). One standard sample is
analyzed every 10 samples. The analyzer uses helium as a carrier gas and high-purity oxygen as
combustion gas.
Higher heating value
Higher heating value (HHV) of the samples was calculated based on the ultimate composition
according to three correlations. The three correlations are shown as Equations 3.1 to 3.3.
Correlations based on lignocelluloses or proximate composition have been shown to be less
accurate than correlations based on ultimate composition (Sheng and Azevedo 2005; Selvig and
Gibson 1945). Therefore, only correlations between HHV and ultimate composition were
considered.
Equation 3.1 is Dulong’s formula (Selvig and Gibson 1945). The correlation was developed for
use in the coal industry. Channiwala and Parikh (2002) found that Equation 3.1 has a +/-1.5 to 7
% accuracy depending on the oxygenation of the coal in question. Although Jenkins et al. (1998)
have suggested the Dulong formula is not well suited to biomass, a modified version has been
recommended in recent literature (Basu 2010).
𝐻𝐻𝑉 (𝑀𝐽
𝑘𝑔) = 33.823[𝐶] + 144.249 ([𝐻] −
[𝑂]
8) + 9.418[𝑆] (3.1)
Equation 3.2 is the correlation proposed by Channiwala and Parikh (2002) who found that the
correlation had an absolute error of 1.45 % with 0.00% bias error. Sheng and Azevedo (2005)
reported a 3.45 % absolute error and a 0.11 % bias error for the same correlation. A positive bias
error indicates overestimation and a negative bias indicates an underestimation of the higher
heating value. The absolute error indicates the accuracy of the calculation.
𝐻𝐻𝑉(𝑀𝐽
𝑘𝑔) = 34.91[𝐶] + 117.83[𝐻] + 10.05[𝑆] − 10.344[𝑂] − 1.51[𝑁] − 2.11[𝐴𝑠ℎ] (3.2)
Sheng and Azevedo (2005) proposed another correlation shown as Equation 3.3 with a 2.59 %
absolute error and 0.07 % bias error.
𝐻𝐻𝑉 (𝑀𝐽
𝑘𝑔) = −136.75 + 31.3[𝐶] + 70.09[𝐻] + 31.8[𝑂] (3.3)
Lignocellulosic composition
Lignocellulosic composition of biomass can be measured using a number of laboratory standard
procedures. The typical method is often referred to as the wet chemical method owing to the
digestion of samples in alcohol. Typical wet chemical methods require 1-2 days for completion.
To reduce analytical time, a dry method was developed using a thermogravimetric analyzer in
high resolution mode (HR-TGA). The method was developed by SUNY-ESF for the purposes of
breeding shrub willow (Salix spp.) for biomass and environmental applications (Serapiglia et al.
2009; Serapiglia et al. 2015). The HR-TGA method reduces laboratory time, requires lower
24
sample mass and eliminates sources of error relative to the wet chemical methods. The method is
limited to shrub willow biomass and does not provide individual carbohydrate content.
The thermograms in this work were collected using a TGA/DSC (Q600, TA Instruments, US).
The instrument is set to “high-resolution dynamic” mode with a heating rate of 20 °C/min, a
peak temperature of 600 °C, resolution of 4.0 and sensitivity setting of 1.0. The instrument uses
argon as a carrier gas and requires significant sample cooling to reduce analysis time. Unlike the
CHNS analyzer the balance is built into the TGA.
Uncertainty values presented in this work are calculated using a 2-sided student’s t value at a 95
% confidence interval divided by the standard error of the estimate.
3.5. Results and discussion
3.5.1. Ultimate composition of willow
The relative elemental composition affects the reactivity of biomass during downstream
processes. Torrefaction reduces the oxygen fraction through the initial depolymerisation of the
large, highly oxygenated hemicelluloses. Because a continuous system was used for torrefaction,
the reaction time, as defined by Bergman and Kiel (2005), is short. The depolymerisation
temperature of 200 °C is reached very rapidly due to the mixing characteristics of the screw
reactor and the convective heating system. In addition, the initial moisture content of 5 % w/w
results in a falling rate of evaporation as opposed to a constant rate. The heat-duty to reach
reaction temperatures are therefore relatively small.
Table 3.1 shows the ultimate composition of the four Saskatchewan willow samples (S. discolor,
S. eriocephala, S. petiolaris, and S. interior), the three willow cultivars (SV1-sask, SV1-PEI, and
S. viminalis from PEI), and the five torrefied SV1 samples. SV1-Sask is the control sample for
the five torrefied SV1 samples. Notably different than the findings of Bergman and Kiel (2005),
the hydrogen fraction in the solid torrefaction char for SV1 remains consistent for all torrefaction
temperatures and the samples lose considerably more oxygen. The increased carbon fraction and
reduced oxygen fraction is, however, similar to the findings of other torrefaction projects
(Phanphanich and Mani 2011; Chen et al. 2011). The main observation of interest is the
reduction in O/C and H/C ratio between the torrefied and untreated willow. The ratios have been
linked to the increase in calorific value due to the greater energy contained in C-C bonds
compared to C-O and C-H bonds (Phanphanich and Mani 2011). The carbon fraction increased
by as much as 9.0 (+/-0.6) % w/w by difference as a result of torrefaction at a peak temperature
of 280 °C along with a decrease in the oxygen fraction by 10.8 (+/-0.8) %. The O/C ratio,
initially 0.87 w/w for the SV1-Sask, decreased by 18.2 (+/-1.8) % down to 0.71 w/w for the
sample torrefied at 280 °C. The difference in carbon fraction is significant for torrefaction at
peak temperatures greater than 270 °C (p<0.05). At a peak torrefaction temperature of 270 °C,
the carbon fraction increased by 7.9 (+/-0.6) % and the corresponding O/C ratio is 16.9 (+/-1.7)
%.
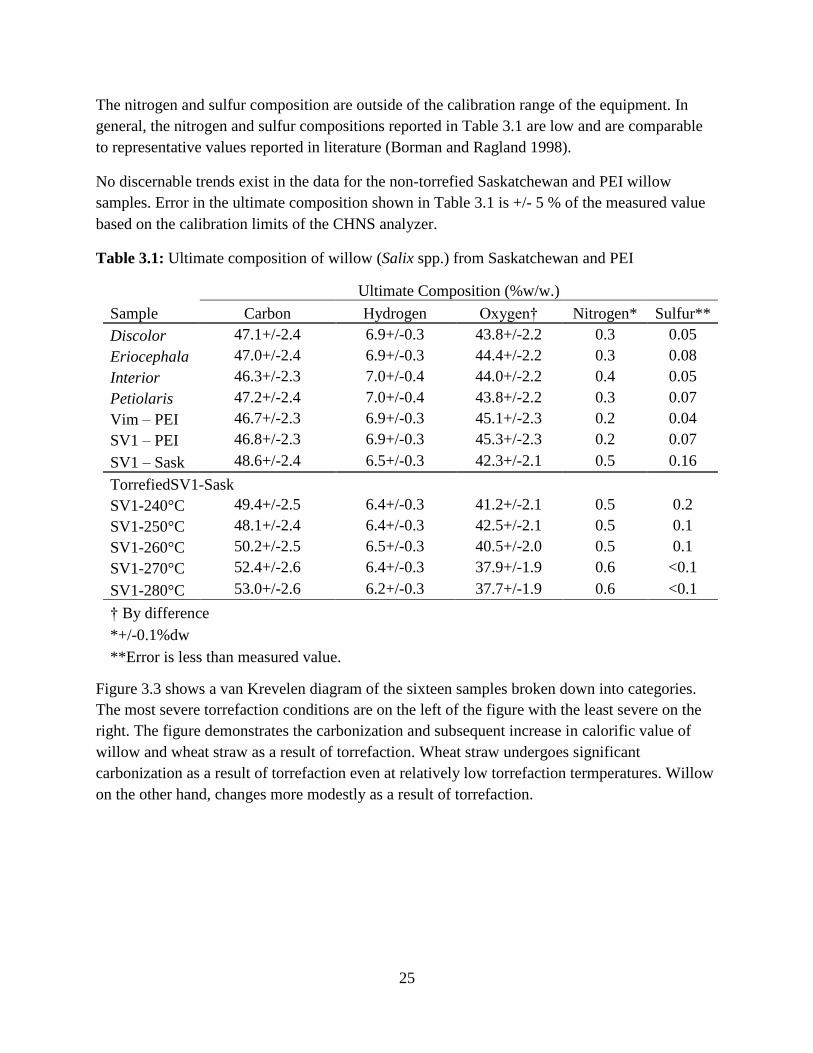
25
The nitrogen and sulfur composition are outside of the calibration range of the equipment. In
general, the nitrogen and sulfur compositions reported in Table 3.1 are low and are comparable
to representative values reported in literature (Borman and Ragland 1998).
No discernable trends exist in the data for the non-torrefied Saskatchewan and PEI willow
samples. Error in the ultimate composition shown in Table 3.1 is +/- 5 % of the measured value
based on the calibration limits of the CHNS analyzer.
Table 3.1: Ultimate composition of willow (Salix spp.) from Saskatchewan and PEI
Ultimate Composition (%w/w.)
Sample Carbon Hydrogen Oxygen† Nitrogen* Sulfur**
Discolor 47.1+/-2.4 6.9+/-0.3 43.8+/-2.2 0.3 0.05
Eriocephala 47.0+/-2.4 6.9+/-0.3 44.4+/-2.2 0.3 0.08
Interior 46.3+/-2.3 7.0+/-0.4 44.0+/-2.2 0.4 0.05
Petiolaris 47.2+/-2.4 7.0+/-0.4 43.8+/-2.2 0.3 0.07
Vim – PEI 46.7+/-2.3 6.9+/-0.3 45.1+/-2.3 0.2 0.04
SV1 – PEI 46.8+/-2.3 6.9+/-0.3 45.3+/-2.3 0.2 0.07
SV1 – Sask 48.6+/-2.4 6.5+/-0.3 42.3+/-2.1 0.5 0.16
TorrefiedSV1-Sask
SV1-240°C 49.4+/-2.5 6.4+/-0.3 41.2+/-2.1 0.5 0.2
SV1-250°C 48.1+/-2.4 6.4+/-0.3 42.5+/-2.1 0.5 0.1
SV1-260°C 50.2+/-2.5 6.5+/-0.3 40.5+/-2.0 0.5 0.1
SV1-270°C 52.4+/-2.6 6.4+/-0.3 37.9+/-1.9 0.6 <0.1
SV1-280°C 53.0+/-2.6 6.2+/-0.3 37.7+/-1.9 0.6 <0.1
† By difference
*+/-0.1%dw
**Error is less than measured value.
Figure 3.3 shows a van Krevelen diagram of the sixteen samples broken down into categories.
The most severe torrefaction conditions are on the left of the figure with the least severe on the
right. The figure demonstrates the carbonization and subsequent increase in calorific value of
willow and wheat straw as a result of torrefaction. Wheat straw undergoes significant
carbonization as a result of torrefaction even at relatively low torrefaction termperatures. Willow
on the other hand, changes more modestly as a result of torrefaction.
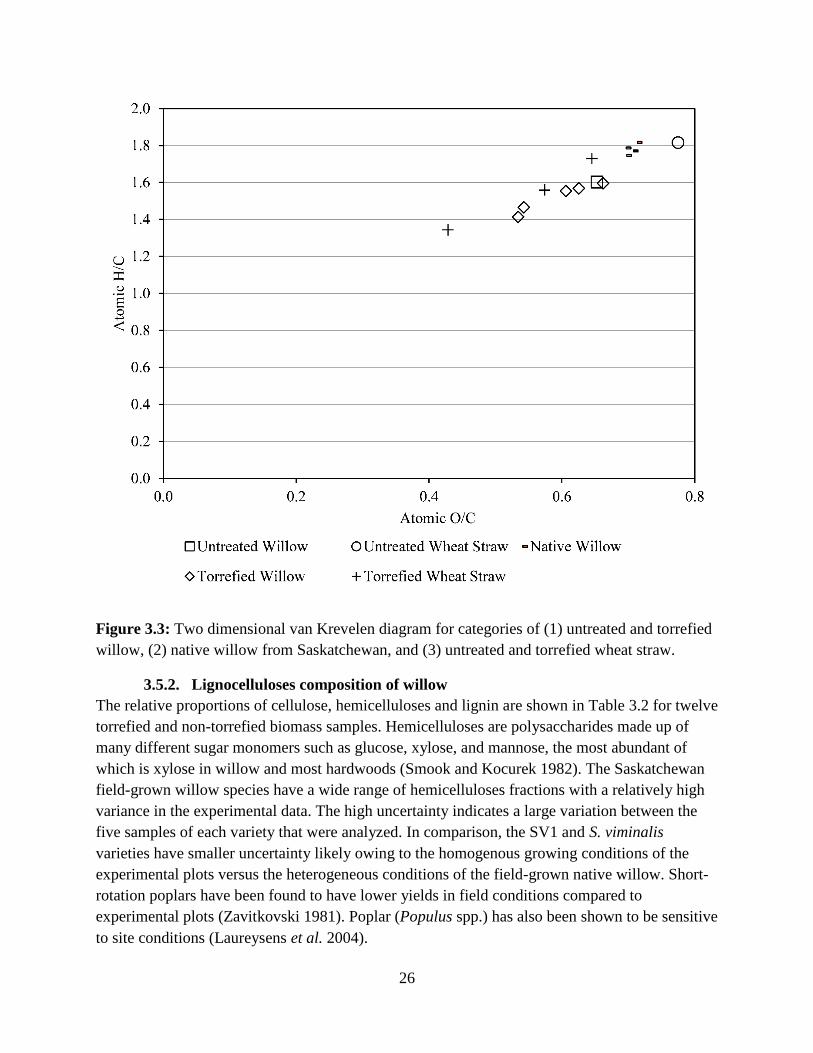
26
Figure 3.3: Two dimensional van Krevelen diagram for categories of (1) untreated and torrefied
willow, (2) native willow from Saskatchewan, and (3) untreated and torrefied wheat straw.
3.5.2. Lignocelluloses composition of willow
The relative proportions of cellulose, hemicelluloses and lignin are shown in Table 3.2 for twelve
torrefied and non-torrefied biomass samples. Hemicelluloses are polysaccharides made up of
many different sugar monomers such as glucose, xylose, and mannose, the most abundant of
which is xylose in willow and most hardwoods (Smook and Kocurek 1982). The Saskatchewan
field-grown willow species have a wide range of hemicelluloses fractions with a relatively high
variance in the experimental data. The high uncertainty indicates a large variation between the
five samples of each variety that were analyzed. In comparison, the SV1 and S. viminalis
varieties have smaller uncertainty likely owing to the homogenous growing conditions of the
experimental plots versus the heterogeneous conditions of the field-grown native willow. Short-
rotation poplars have been found to have lower yields in field conditions compared to
experimental plots (Zavitkovski 1981). Poplar (Populus spp.) has also been shown to be sensitive
to site conditions (Laureysens et al. 2004).
27
For the torrefied and non-torrefied SV1 samples, the hemicelluloses fractions decrease
incrementally in proportion to the peak torrefaction temperatures. With the exception of the peak
torrefaction temperatures 240 °C and 250 °C, all other temperature intervals (between untreated
and 240 °C, between 250 °C and 260 °C, between 260 °C and 270 °C, and between 270 °C and
280 °C) result in a significant (p<0.05) change in the hemicelluloses fraction measured by HR-
TGA. The primary decomposition reactions for hemicelluloses caused by torrefaction begin
around 250 °C and likely are not observable using the HR-TGA method between the 240 °C and
250 °C peak torrefaction temperatures.
Cellulose and lignin fractions are similarly varied for the native willow species. The most
notable difference however, occurs between the SV1-Sask and the other six non-torrefied
samples. There is a significant difference (p<0.05) in the cellulose fraction in the Saskatchewan
field samples and PEI samples compared to the SV1-Sask sample with the exception of Salix
interior. For lignin, the difference is less pronounced (p<0.06). S. eriocephala is an exception
with p =0.08. Serapiglia et al. (2013) have reported lignin fractions between 21 and 22 % for
SV1 after 3 years of growth. The lignin fraction of willow harvested after 1 year of growth is
expected to be high and this appears to be the case. However, the difference between the findings
of Serapiglia et al. (2013) and the Saskatchewan field samples preclude any conclusions
regarding age of willow and lignocelluloses composition.
Table 3.2 also shows the effect of torrefaction on lignocelluloses in SV1-Sask. A clear
correlation exists between the peak torrefaction temperatures and the fraction of hemicelluloses.
This will be discussed further in section 3.5.4, evaluating the extent of torrefaction.
Lignin-rich woody biomass has been shown to have greater calorific value compared to biomass
with higher carbohydrate composition (Fahmi et al. 2008). Analysis of the torrefied willow
samples shows a positive correlation between lignin and heating value. The increase in lignin of
7.1 %w/w between the SV1 torrefied at 280 °C and non-torrefied SV1 corresponds to an increase
in heating value of 1.7 MJ/kg (r = 0.98) where ‘r’ is the Pearson’s coefficient. A Pearson’s
coefficient of -1 represents an inverse linearly correlation, +1 represents a linear correlation and
0 represents no correlation.
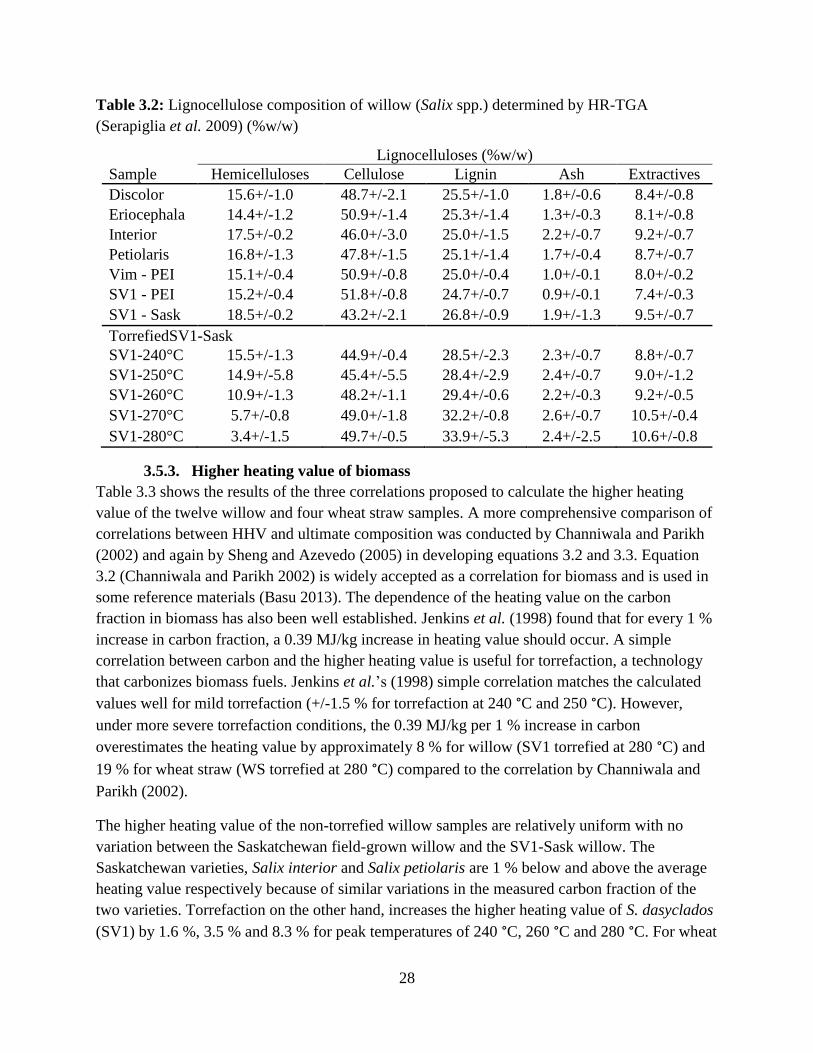
28
Table 3.2: Lignocellulose composition of willow (Salix spp.) determined by HR-TGA
(Serapiglia et al. 2009) (%w/w)
Lignocelluloses (%w/w)
Sample Hemicelluloses Cellulose Lignin Ash Extractives
Discolor 15.6+/-1.0 48.7+/-2.1 25.5+/-1.0 1.8+/-0.6 8.4+/-0.8
Eriocephala 14.4+/-1.2 50.9+/-1.4 25.3+/-1.4 1.3+/-0.3 8.1+/-0.8
Interior 17.5+/-0.2 46.0+/-3.0 25.0+/-1.5 2.2+/-0.7 9.2+/-0.7
Petiolaris 16.8+/-1.3 47.8+/-1.5 25.1+/-1.4 1.7+/-0.4 8.7+/-0.7
Vim - PEI 15.1+/-0.4 50.9+/-0.8 25.0+/-0.4 1.0+/-0.1 8.0+/-0.2
SV1 - PEI 15.2+/-0.4 51.8+/-0.8 24.7+/-0.7 0.9+/-0.1 7.4+/-0.3
SV1 - Sask 18.5+/-0.2 43.2+/-2.1 26.8+/-0.9 1.9+/-1.3 9.5+/-0.7
TorrefiedSV1-Sask
SV1-240°C 15.5+/-1.3 44.9+/-0.4 28.5+/-2.3 2.3+/-0.7 8.8+/-0.7
SV1-250°C 14.9+/-5.8 45.4+/-5.5 28.4+/-2.9 2.4+/-0.7 9.0+/-1.2
SV1-260°C 10.9+/-1.3 48.2+/-1.1 29.4+/-0.6 2.2+/-0.3 9.2+/-0.5
SV1-270°C 5.7+/-0.8 49.0+/-1.8 32.2+/-0.8 2.6+/-0.7 10.5+/-0.4
SV1-280°C 3.4+/-1.5 49.7+/-0.5 33.9+/-5.3 2.4+/-2.5 10.6+/-0.8
3.5.3. Higher heating value of biomass
Table 3.3 shows the results of the three correlations proposed to calculate the higher heating
value of the twelve willow and four wheat straw samples. A more comprehensive comparison of
correlations between HHV and ultimate composition was conducted by Channiwala and Parikh
(2002) and again by Sheng and Azevedo (2005) in developing equations 3.2 and 3.3. Equation
3.2 (Channiwala and Parikh 2002) is widely accepted as a correlation for biomass and is used in
some reference materials (Basu 2013). The dependence of the heating value on the carbon
fraction in biomass has also been well established. Jenkins et al. (1998) found that for every 1 %
increase in carbon fraction, a 0.39 MJ/kg increase in heating value should occur. A simple
correlation between carbon and the higher heating value is useful for torrefaction, a technology
that carbonizes biomass fuels. Jenkins et al.’s (1998) simple correlation matches the calculated
values well for mild torrefaction (+/-1.5 % for torrefaction at 240 °C and 250 °C). However,
under more severe torrefaction conditions, the 0.39 MJ/kg per 1 % increase in carbon
overestimates the heating value by approximately 8 % for willow (SV1 torrefied at 280 °C) and
19 % for wheat straw (WS torrefied at 280 °C) compared to the correlation by Channiwala and
Parikh (2002).
The higher heating value of the non-torrefied willow samples are relatively uniform with no
variation between the Saskatchewan field-grown willow and the SV1-Sask willow. The
Saskatchewan varieties, Salix interior and Salix petiolaris are 1 % below and above the average
heating value respectively because of similar variations in the measured carbon fraction of the
two varieties. Torrefaction on the other hand, increases the higher heating value of S. dasyclados
(SV1) by 1.6 %, 3.5 % and 8.3 % for peak temperatures of 240 °C, 260 °C and 280 °C. For wheat
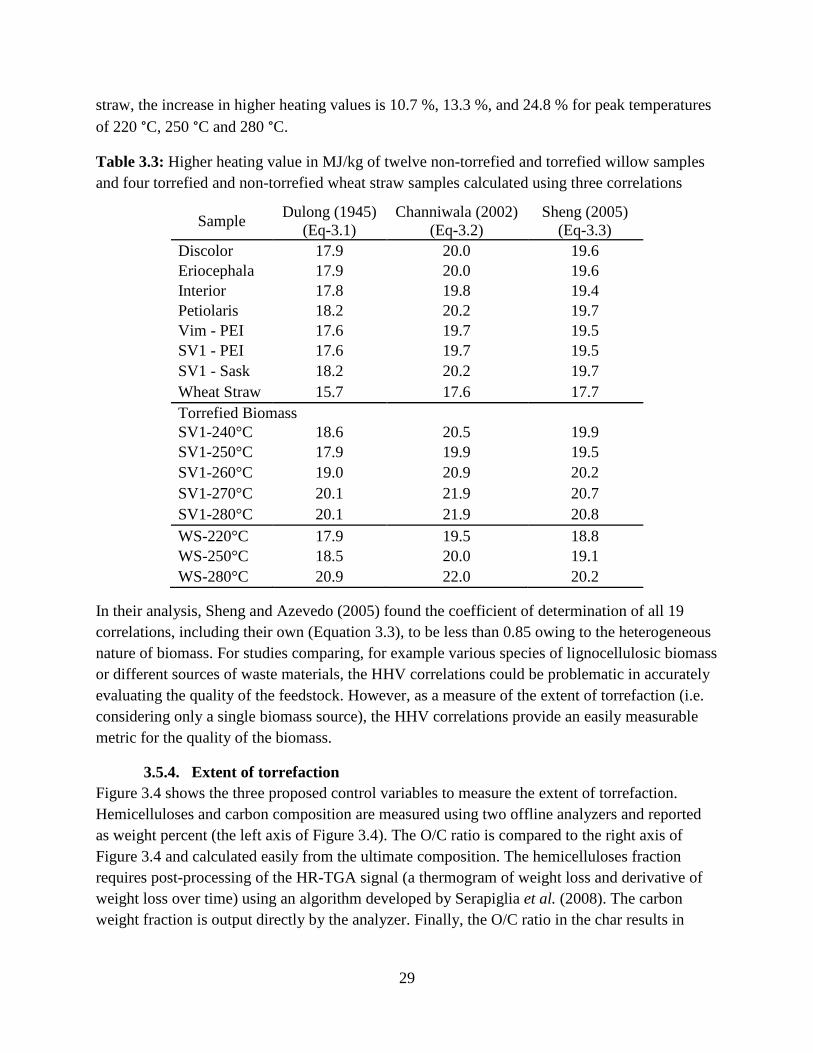
29
straw, the increase in higher heating values is 10.7 %, 13.3 %, and 24.8 % for peak temperatures
of 220 °C, 250 °C and 280 °C.
Table 3.3: Higher heating value in MJ/kg of twelve non-torrefied and torrefied willow samples
and four torrefied and non-torrefied wheat straw samples calculated using three correlations
Sample Dulong (1945)
(Eq-3.1)
Channiwala (2002)
(Eq-3.2)
Sheng (2005)
(Eq-3.3)
Discolor 17.9 20.0 19.6
Eriocephala 17.9 20.0 19.6
Interior 17.8 19.8 19.4
Petiolaris 18.2 20.2 19.7
Vim - PEI 17.6 19.7 19.5
SV1 - PEI 17.6 19.7 19.5
SV1 - Sask 18.2 20.2 19.7
Wheat Straw 15.7 17.6 17.7
Torrefied Biomass
SV1-240°C 18.6 20.5 19.9
SV1-250°C 17.9 19.9 19.5
SV1-260°C 19.0 20.9 20.2
SV1-270°C 20.1 21.9 20.7
SV1-280°C 20.1 21.9 20.8
WS-220°C 17.9 19.5 18.8
WS-250°C 18.5 20.0 19.1
WS-280°C 20.9 22.0 20.2
In their analysis, Sheng and Azevedo (2005) found the coefficient of determination of all 19
correlations, including their own (Equation 3.3), to be less than 0.85 owing to the heterogeneous
nature of biomass. For studies comparing, for example various species of lignocellulosic biomass
or different sources of waste materials, the HHV correlations could be problematic in accurately
evaluating the quality of the feedstock. However, as a measure of the extent of torrefaction (i.e.
considering only a single biomass source), the HHV correlations provide an easily measurable
metric for the quality of the biomass.
3.5.4. Extent of torrefaction
Figure 3.4 shows the three proposed control variables to measure the extent of torrefaction.
Hemicelluloses and carbon composition are measured using two offline analyzers and reported
as weight percent (the left axis of Figure 3.4). The O/C ratio is compared to the right axis of
Figure 3.4 and calculated easily from the ultimate composition. The hemicelluloses fraction
requires post-processing of the HR-TGA signal (a thermogram of weight loss and derivative of
weight loss over time) using an algorithm developed by Serapiglia et al. (2008). The carbon
weight fraction is output directly by the analyzer. Finally, the O/C ratio in the char results in
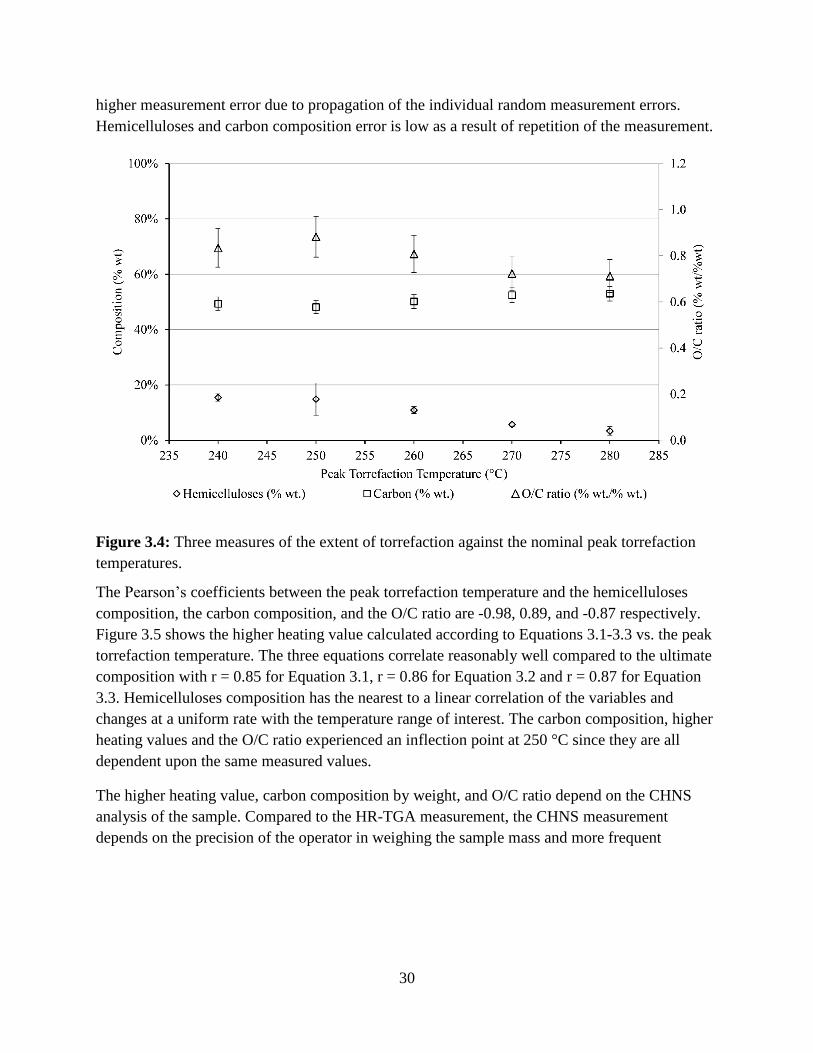
30
higher measurement error due to propagation of the individual random measurement errors.
Hemicelluloses and carbon composition error is low as a result of repetition of the measurement.
Figure 3.4: Three measures of the extent of torrefaction against the nominal peak torrefaction
temperatures.
The Pearson’s coefficients between the peak torrefaction temperature and the hemicelluloses
composition, the carbon composition, and the O/C ratio are -0.98, 0.89, and -0.87 respectively.
Figure 3.5 shows the higher heating value calculated according to Equations 3.1-3.3 vs. the peak
torrefaction temperature. The three equations correlate reasonably well compared to the ultimate
composition with r = 0.85 for Equation 3.1, r = 0.86 for Equation 3.2 and r = 0.87 for Equation
3.3. Hemicelluloses composition has the nearest to a linear correlation of the variables and
changes at a uniform rate with the temperature range of interest. The carbon composition, higher
heating values and the O/C ratio experienced an inflection point at 250 °C since they are all
dependent upon the same measured values.
The higher heating value, carbon composition by weight, and O/C ratio depend on the CHNS
analysis of the sample. Compared to the HR-TGA measurement, the CHNS measurement
depends on the precision of the operator in weighing the sample mass and more frequent
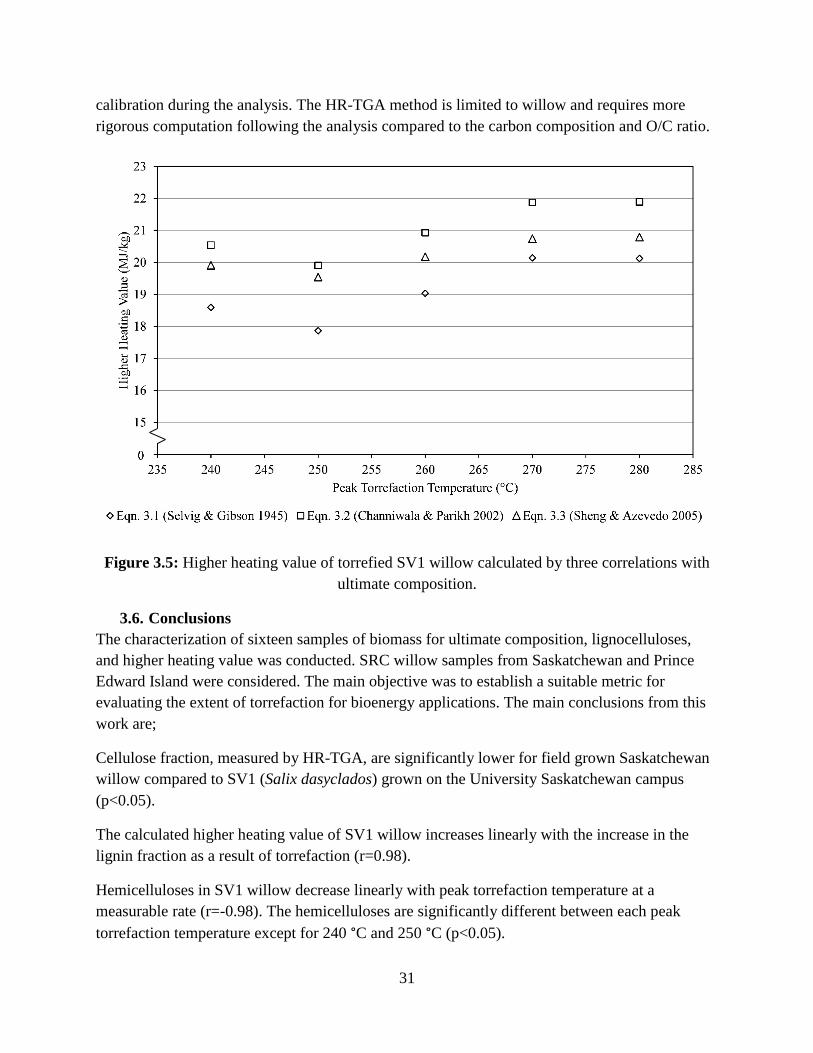
31
calibration during the analysis. The HR-TGA method is limited to willow and requires more
rigorous computation following the analysis compared to the carbon composition and O/C ratio.
Figure 3.5: Higher heating value of torrefied SV1 willow calculated by three correlations with
ultimate composition.
3.6. Conclusions
The characterization of sixteen samples of biomass for ultimate composition, lignocelluloses,
and higher heating value was conducted. SRC willow samples from Saskatchewan and Prince
Edward Island were considered. The main objective was to establish a suitable metric for
evaluating the extent of torrefaction for bioenergy applications. The main conclusions from this
work are;
Cellulose fraction, measured by HR-TGA, are significantly lower for field grown Saskatchewan
willow compared to SV1 (Salix dasyclados) grown on the University Saskatchewan campus
(p<0.05).
The calculated higher heating value of SV1 willow increases linearly with the increase in the
lignin fraction as a result of torrefaction (r=0.98).
Hemicelluloses in SV1 willow decrease linearly with peak torrefaction temperature at a
measurable rate (r=-0.98). The hemicelluloses are significantly different between each peak
torrefaction temperature except for 240 °C and 250 °C (p<0.05).
32
Significant carbonization of SV1 willow as a result of torrefaction occurs at peak temperatures
greater than 270 °C (p<0.05). The carbonization results in a 16.9(+/-1.7) % decrease in the O/C
ratio (w/w) compared to the non-torrefied SV1 willow.
The fraction of hemicelluloses is the most suitable candidate to measure the extent of torrefaction
compared to O/C ratio and carbon composition. Hemicelluloses are easily measured by HR-TGA
and undergo significant volatilization at torrefaction temperatures in the range of interest (240-
280 °C).
33
3.7. References
Amichev, B.Y., Kurz, W.A., Smyth, C., and Rees, K.C. 2012. The carbon implications of large-
scale afforestation of agriculturally marginal land with short-rotation willow in
Saskatchewan. GCB Bioenergy 4 (1): 70-87.
Basu, P. 2013. Biomass gasification, pyrolysis and torrefaction. 2nd ed. Elsevier Inc. San Diego,
USA.
Basu, P. 2010. Biomass gasification and pyrolysis. 1st ed. Elsevier Inc. Burlington, MA.
Bergman, P.C.A., and Kiel, J.H.A. 2005. Torrefaction for biomass upgrading. Paper presented at
the 14th European Biomass Conference and Exhibition, October 17-21, Paris, FR.
Berndes, G., Hansson, J., Egeskog, A., and Johnsson, F. 2010. Strategies for 2nd generation
biofuels in EU – co-firing to stimulate feedstock supply development and process
integration to improve energy efficiency and economic competitiveness. Biomass and
Bioenergy 34 (2): 227-36.
BISYPLAN. Bioenergy system planners handbook. In INTERREG IVC [database online]. 2012
Available from http://bisyplan.bioenarea.eu/Handbook-intro.html (Accessed 01/25 2017).
Borman, G.L., and Ragland, K.W. 1998. Combustion engineering. McGraw-Hill, New York,
NY.
Cameron, K.D., Smart, L.B., Ballard, B., Abrahamson, L.P., and Volk, T.A. 2007. Salix
dasyclados ‘SV1’. State University of New York College of Environmental Science and
Forestry, http://www.esf.edu/.
Campbell, W., Woytiuk, K., Evitts, R.W., Phoenix, A., and Gerspacher, R. 2012. Effect of
temperature and time on torrefaction of Canadian prairie wheat straw. Paper presented at the
4th International Symposium on Energy from Biomass and Waste, Venice, Italy.
Channiwala, S., and Parikh, P. 2002. A unified correlation for estimating HHV of solid, liquid
and gaseous fuels. Fuel 81 (8): 1051-63.
Chen, W., Cheng, W., Lu, K., and Huang, Y. 2011. An evaluation on improvement of pulverized
biomass property for solid fuel through torrefaction. Applied Energy 88 (11): 3636-44.
Couhert, C., Salvador, S., and Commandré, J. 2009. Impact of torrefaction on syngas production
from wood. Fuel 88 (11): 2286-90.
Elementar. 2005. Vario EL III CHNOS elemental analyzer, operating instructions. 11.02-5003
Elementar Analysensysteme GmbH, Hanau, DE.
Fahmi, R., Bridgwater, A.V., Donnison, I., Yates, N., and Jones, J.M. 2008. The effect of lignin
and inorganic species in biomass on pyrolysis oil yields, quality and stability. Fuel 87 (7):
1230-40.
Gerspacher, R., Campbell, W., Woytiuk, K., Evitts, R.W., and and Phoenix, A. 2013. Evaluation
of a rotary-disc cutting machine for cutting long-stem biomass into uniform granules. Paper
34
presented at (CANCAM 2013) 24th Canadian Congress of Applied Mechanics, Saskatoon,
SK, Canada.
Guidi Nissim, W., Pitre, F.E., Teodorescu, T.I., and Labrecque, M. 2013. Long-term biomass
productivity of willow bioenergy plantations maintained in southern Quebec, Canada.
Biomass and Bioenergy 56: 361-9.
Hangs, R. 2014. Biomass production and nutrient cycling in short-rotation coppice willow (Salix
spp.) bioenergy plantations in Saskatchewan, Canada.
Jenkins, B.M., Baxter, L.L., Miles Jr., T.R., and Miles, T.R. 1998. Combustion properties of
biomass. Fuel Processing Technology 54 (1–3): 17-46.
Keoleian, G.A., and Volk, T.A. 2005. Renewable energy from willow biomass crops: Life cycle
energy, environmental and economic performance. Critical Reviews in Plant Sciences 24 (5-
6): 385-406.
Kuzovkina, Y.A., Weih, M., Romero, M.A., Charles, J., Hust, S., McIvor, I., et al. 2008. Salix:
Botany and global horticulture. Horticultural Reviews-Westport then New York- 34: 447.
Laureysens, I., Bogaert, J., Blust, R., and Ceulemans, R. 2004. Biomass production of 17 poplar
clones in a short-rotation coppice culture on a waste disposal site and its relation to soil
characteristics. Forest Ecology and Management 187 (2): 295-309.
Li, J., Brzdekiewicz, A., Yang, W., and Blasiak, W. 2012. Co-firing based on biomass
torrefaction in a pulverized coal boiler with aim of 100 % fuel switching. Applied Energy
99: 344-54.
Phanphanich, M., and Mani, S. 2011. Impact of torrefaction on the grindability and fuel
characteristics of forest biomass. Bioresource Technology 102 (2): 1246-53.
Schroeder, W., Walker, D., and Inouye, G. 2009. Breeding willow for bio-energy and
agroforestry. AAFC-AESB Agroforestry Development Centre, Indian Head, SK.
Selvig, W., and Gibson, F. 1945. Calorific value of coal. Chemistry of Coal Utilization 1: 139.
Serapiglia, M.J., Cameron, K.D., Stipanovic, A.J., Abrahamson, L.P., Volk, T.A., and Smart,
L.B. 2013. Yield and woody biomass traits of novel shrub willow hybrids at two contrasting
sites. BioEnergy Research 6 (2): 533-546.
Serapiglia, M.J., Cameron, K.D., Stipanovic, A.J., and Smart, L.B. 2009. Analysis of biomass
composition using high-resolution thermogravimetric analysis and percent bark content for
the selection of shrub willow bioenergy crop varieties. BioEnergy Research (1-2): 1-9.
Serapiglia, M.J., Cameron, K.D., Stipanovic, A.J., and Smart, L.B. 2008. High-resolution
thermogravimetric analysis for rapid characterization of biomass composition and selection
of shrub willow varieties. Applied Biochemistry and Biotechnology 145 (1-3): 3-11.
35
Serapiglia, M.J., Gouker, F., Hart, J.F., Unda, F., Mansfield, S.D., Stipanovic, A.J., et al. 2015.
Ploidy level affects important biomass traits of novel shrub willow (Salix) hybrids.
BioEnergy Research 8 (1): 259-69.
Sheng, C., and Azevedo, J.L.T. 2005. Estimating the higher heating value of biomass fuels from
basic analysis data. Biomass and Bioenergy 28 (5): 499-507.
Smook, G.A., and Kocurek, M.J. 1982. Handbook for pulp and paper technologists TAPPI;
Canadian Pulp and Paper Association.
Sokhansanj, S., Mani, S., Stumborg, M., Samson, R., and Fenton, J. 2006. Production and
distribution of cereal straw on the Canadian prairies. Canadian Biosystems Engineering 48:
3.
Thompson, M. 2008. CHNS elemental analysers report. AMCTB no. 29 AMC Technical Briefs,
Royal Society of Chemistry.
Volk, T., Kiernan, B., Kopp, R., and Abrahamson, L. 2001. First-and second-rotation yields of
willow clones at two sites in New York State. Paper presented at the Fifth Biomass
Conference of the Americas, September.
Volk, T.A., Verwijst, T., Tharakan, P.J., Abrahamson, L.P., and White, E.H. 2004. Growing fuel:
A sustainability assessment of willow biomass crops. Frontiers in Ecology and the
Environment 2 (8): 411-8.
Wilen, C. 1997. Biomass feedstock analyses. Paper presented in Fuel and Energy Abstracts.
Woytiuk, K., Campbell, W., Gerspacher, R., Evitts, R.W., and Phoenix, A. 2017. The effect of
torrefaction on syngas quality metrics from fluidized bed gasification of SRC willow.
Renewable Energy 101C: 409-17.
Yan, W., Acharjee, T.C., Coronella, C.J., and Vásquez, V.R. 2009. Thermal pretreatment of
lignocellulosic biomass. Environmental Progress and Sustainable Energy 28 (3): 435-40.
Zavitkovski, J. 1981. Small plots with unplanted plot border can distort data in biomass
production studies. Canadian Journal of Forest Research 11 (1): 9-12.
36
4. The effect of torrefaction on syngas quality metrics from fluidized bed
gasification of SRC willow
4.1. Preface
Chapter 4 correlates tar concentration in syngas to hemicelluloses, established as a suitable
measure of the extent of torrefaction in chapter 3. An online measurement of tar concentration
using flame ionization detection is developed and demonstrated. The tool is a useful control
system data point that has process applications as a monitoring method for syngas quality. An
unexpected increase in tar concentration in a bioenergy process using syngas could be
catastrophic. Condensed tars can poison catalysts, foul turbomachinery, or clog filters. Both the
continuous measurement of tar concentration and the reduction attributed to torrefaction are
beneficial to bioenergy and biochemical processes. As it relates to the thesis of this work, chapter
4 provides an overview of the main conclusions. Subsequent chapters delve more deeply into the
types of tars affected by torrefaction, but the overarching theme is developed here.
The manuscript presented in Chapter 4 has been published in the Journal of Renewable Energy
and reprinted here with permission. Minor changes to the version included here were made to
reflect the wishes of the dissertation committee. The term “tar yield” in the published version is
referred to here as “tar concentration” to better reflect the units used in reporting the value.
The assistance of co-authors on the paper is greatly appreciated. The co-authors were William
Campbell MSc, P.Eng, Regan Gerspacher, Dr. Aaron Phoenix P.Eng, FEC, and Dr. Richard
Evitts P.Eng. Bill Campbell assisted with the torrefaction of SV1 willow, contributed the gasifier
piping and instrumentation diagram (Figure 4.1) and provided many rounds of manuscript
editing and review with notable contributions to gasifier and torrefier controls and data logging.
Regan Gerspacher provided engineering and technical support during the torrefaction and
gasification experiments, and contributed to the manuscript review. Dr. Aaron Phoenix and
Richard Evitts provided manuscript review and methodological assistance. All other
contributions in the paper including data analysis, literature review, methodology, experimental
design, data interpretation, and preparation of the manuscript are my unique contributions to this
work.
4.2. Abstract
Short rotation coppice willow is proposed as a dedicated energy crop in the Canadian prairie
region. A coppice willow cultivar known as SV1 (Salix dasyclados) grown at the University of
Saskatchewan was torrefied in a continuous torrefaction reactor at four temperatures (240, 260,
270 and 280 °C). The torrefied and control samples were then ground and gasified in a fluidized
bed reactor at 900 °C with air and steam. The samples were characterized for ultimate
composition and lignocelluloses. A unique HR-TGA method was used to determine the fraction
of hemicelluloses, cellulose, lignin and ash in the torrefied and control samples. Syngas quality
was evaluated based on gas yield and tar concentration. Tars were measured using a flame
37
ionization detector and gas chromatograph. The syngas yield was found to increase from 2.02 to
2.47 m3/kg between the non-torrefied and heavily torrefied samples. Tar concentration was
observed to decrease from 17.26 g/m3 (mean for the control and the 240 °C conditions) to 9.21
g/m3 (mean for the 260, 270 and 280 °C conditions) a reduction of 47 %. The change in syngas
quality coincides with the degradation of hemicelluloses below approximately 12 % dry weight.
More severe torrefaction had no additional effect on the syngas quality metrics.
4.3. Introduction
Torrefaction is a promising pretreatment for underutilized biomass resources in North America.
A mild form of pyrolysis, torrefaction involves heating biomass in the absence of oxygen to
between 230 and 300 °C (Basu 2010). The structure of the biomass changes as oxygenated
compounds are volatilized. The main effect of interest is the reduction in the polymer
hemicellulose from the biomass structure. Hemicelluloses begin to volatilize at approximately
250 °C (Medic et al. 2012). Hydrolysis first causes hemicelluloses to depolymerize, followed by
a series of acid and radical reactions which release acids and water (Lipinsky et al. 2002). The
water and acids formed by these reactions are then available to also depolymerize cellulose and
lignin, but to a much lesser extent. Overall, the result is a lower O/C and H/C ratio in the solid
product that in turn, increases the energy density and reduces the required comminution energy.
Three recent reviews summarize the state-of-the-art of torrefaction and the benefits to biomass
processes (Van der Stelt et al. 2011; Chew and Doshi 2011; Chen et al. 2015). In short, torrefied
biomass can be conveyed, stored and pulverized in a similar manner to coal, a common fuel for
electricity generation.
Independent of torrefaction, researchers have shown short-rotation coppice willow (SRCW) to
yield significantly more energy and output significantly less GHG emissions (Djomo et al.
2010). Djomo et al. reviewed 26 studies and found, on average, SRCW to yield 36 times more
energy per unit of fossil fuel energy input and 24 times lower GHG emissions compared to coal.
Co-firing ratios in existing coal-fired power infrastructure are limited to approximately 10 % due
to the behavior of biomass in suspension burning systems (Van Loo and Koppejan 2008).
Recently, a 100 % substitution of coal with torrefied biomass in a pulverized coal-fired boiler
was suggested with no loss of boiler efficiency or fluctuation in load (Li et al. 2012). With
consideration of the associated operational problems (slagging, fouling and corrosion), the
modeled reduction in CO2 and NOx emissions presented by Li et al. (2012) is promising.
Beyond co-firing, torrefied biomass has been proven to be a valuable feedstock for gasification
leading to a wider range of energy applications. Replacement of fossil derived transportation
fuels with synthetic fuels from biomass-to-liquids processes is of particular interest owing to the
lack of technically viable alternatives (Eisentraut et al. 2011). Early investigation into the area of
gasification of torrefied biomass considered the benefits of handling and fluidization as a result
of the characteristics of torrefied biomass. The reduction of net hemicelluloses through
torrefaction produces ground biomass particles with a lower length-to-diameter ratio capable of
smooth fluidization required for entrained flow (EF) gasification (Bergman and Kiel 2005).
38
More specifically, particles could be pulverized to behave like Geldart type A powders as
required for fast fluidization (Prins et al. 2006). By studying torrefied wood gasified in a
circulating fluidized bed (CFB), an EF reactor and an oxygen-blown EF reactor, Prins et al.
(2006) were able to conclude that, in addition to the improved fluidization characteristics,
decoupling torrefaction reactions from the gasifier increases the efficiency of high temperature
gasification. The increase in available energy is, however, dependent on the use of both the char
and volatile gases from torrefaction in the gasification process. More recent studies have
expanded the understanding. In a steam injected EF gasifier at 1400 °C, Couhert et al. (2009)
were able to produce 7 %g/gdry wood more H2 and 20 %g/gdry wood more CO from torrefied versus
non-torrefied beechwood, consistent with the increase in carbon and hydrogen fraction in the
feedstock. In a similar study, Chen et al. (2011) gasified sawdust without the application of
steam. The study showed improvements in the syngas quality, but a reduction in the gasification
efficiency unless the torrefaction gases were consumed in the gasifier.
Few studies relating to the gasification of torrefied biomass consider the ‘cleanliness’ of the
product or syngas. Production of clean syngas accounts for the majority of capital expenses in
modern biomass-to-liquids processes, as high as 70 % (Steynberg and Dry 2004). The main
impurities in syngas are tars, particulates, nitrogen and sulphur. Tar in particular is both costly to
remove from the gas stream and damaging to downstream equipment surfaces that are below the
dewpoint temperature of the vapour mixture. The dewpoint temperature can be as high as 450 °C
(McKendry 2002). Tar formation has been linked to biomass composition by multiple studies.
Milne et al. (1998) defined primary tars as those derived from macromolecules cellulose,
hemicellulose and lignin. Others have gasified individual components to connect tar yield and tar
species to carbohydrates and lignin (Hanaoka et al. 2005; Yu et al. 2014). Finally, researchers
have shown a decrease in tar yield by comparing syngas from a torrefied and non-torrefied
feedstock (Sweeney 2012; Raut 2014; Dudyński et al. 2015). Dudyński et al. (2015) reported a
reduction of tar mass from 0.0210 kg / kgfuel to 0.0138 kg / kgfuel in an industrial fixed-bed
gasifier between untreated sawdust and torrefied pellets. However, the gasification temperatures
were inconsistent between tests and definitive conclusions relating tar concentration to
torrefaction were not possible.
In this work, a continuous torrefaction reactor was used to torrefy short-rotation coppice willow
samples at four temperatures. The resulting biomass was analyzed and gasified in a bubbling
fluidized bed gasifier with steam and air under fixed and steady-state conditions. The scope
presupposes a techno-economic benefit to producing torrefied SRC willow for co-firing with
coal and includes value-added processing via gasification. The objective is to correlate
lignocellulose composition with syngas quality using rapid analysis techniques. The resulting
syngas analysis provides insight into syngas quality and tar concentration based on biomass
composition prior to gasification.
The novelty in this work is in application of rapid analysis techniques for process development.
Analysis of syngas from fluidized bed gasification is used as feedback to determine the
39
conditions in an upstream torrefaction process. The data and methods presented here can be used
to change the willow composition during the torrefaction process in order to produce low-tar
syngas from fluidized bed gasification. By changing the feedback information from tar
concentration and H2/CO ratio to, for example, heating value of syngas or hydrophobicity of the
willow, torrefaction parameters for other applications could be established.
4.4. Materials and methods
Lignocelluloses are controlled using a continuous torrefaction system and measured using a
high-resolution thermogravimetric method developed by the State University of New York
College of Environmental Science and Forestry (SUNY-ESF). The torrefied and non-torrefied
willow is gasified in a 75 mm diameter bubbling fluidized bed with steam and air. Tar
concentration is quantified by comparing a gas-chromatogram to a total hydrocarbon
concentration from a flame ionization detector similar to the method of Moersch et al. (2000).
4.4.1. SV1 willow
Coppice willow is a promising feedstock for bioenergy applications in Northern regions. A
plantation of 28 varieties of hybrid willow was established in 2007 on the University of
Saskatchewan campus (Saskatoon, Canada). For this work, the shrub willow cultivar named
‘SV1’ (Salix dasyclados) was selected. It is a well-known cultivar with disease and pest
resistance and has produced high yields in a variety of soil conditions (Cameron et al. 2007). In
the 2nd, three-year cycle, after 1 year of growth, the willows were harvested by hand. The stems
were collected and sorted. Stems approximately 1.25 cm in diameter or less were cut to 2.5 cm
lengths using a rotary cutting machine (Gerspacher et al. 2013). The equipment produces
approximately pellet sized segments of willow that flow easily through a screw auger system.
The cut biomass was then stored at 4 °C to prevent significant degradation. In storage, the stems
dried to approximately 10 % moisture content. Cut pieces were then further dried at 150 °C in a
continuous, moving bed torrefaction unit (CTU) operating as an air-dryer. Dried willow pieces
retained a moisture content of approximately 5 %. Moisture content between 3 and 20 % was
necessary to prevent adverse effects of reduced mass and energy yield and reduced energy
density as a result of accelerated polymer decomposition reactions (Medic et al. 2012). All
moisture content is reported on a wet basis.
SV1 willow pieces were torrefied at four temperatures (240, 260, 270 and 280 °C) in the CTU
using nitrogen gas as the heating medium rather than air. Development of the reactor is the topic
of a parallel project and details will be published elsewhere. The direct heating method and
moving bed allows for lower residence time relative to other torrefaction processes. Typically,
torrefaction times range from 10 to 60 minutes whereas in this work, samples were processed for
10 minutes including drying, intermediate heating, heating and torrefaction as described by
Bergman and Kiel (Bergman and Kiel 2005). Earlier work showed the effects of residence time
within the range of interest (10-30 minutes) did not have an appreciable impact on biomass
characteristics and the residence time was fixed at 10 minutes for these experiments (Campbell et
al. 2012; Medic et al. 2012). The particles reached peak temperature in the last third of the
40
reactor length. Torrefied and control (untreated) samples were then ground using a #1 Wiley mill
operated by a 1 HP variable speed drive at 878 rpm with a 1.88 mm mesh screen.
4.4.2. Lignocelluloses composition by HR-TGA
The relative lignocellulose composition was determined using high-resolution thermogravimetric
analysis (HR-TGA). The analysis method was developed by SUNY-ESF for the purposes of
breeding shrub willow (Salix spp.) for biomass and environmental applications (Serapiglia et al.
2009; Serapiglia et al. 2015). In the early method development, Serapiglia et al. (2009)
compared macro-molecular composition using well established wet chemical methods (TAPPI
standard T 204 om-88 and T 222 om-88) to the high-resolution TGA method. The resulting
linear regressions (p-value<0.0001) had r-squared values greater than 0.7. The HR-TGA method
reduces laboratory time, requires lower sample mass and eliminates sources of error relative to
the wet chemical methods. The method is limited to shrub willow biomass and does not provide
individual carbohydrate content. Rapid analysis is excellent for process control and verification
of biomass quality prior to downstream processes such as gasification. The thermograms in this
work were collected using a TGA/DSC (Q600, TA Instruments, US). Analysis was done in
collaboration with Serapiglia et al. to determine the relative lignocellulose composition of the
feedstocks (Serapiglia et al. 2009; Serapiglia et al. 2015). The instrument is set to “high-
resolution dynamic” mode and the method involves a heating rate of 20 °C/min, a peak
temperature of 600°C, resolution of 4.0 and sensitivity setting of 1.0.
Ultimate composition of the treated and untreated willow was determined using a CHNS
analyzer (VarioEL III, Elementar, DE) and a microbalance (XP6, Mettler Toledo, USA) with a
range of up to 5.1 g with a 1 μg precision. Once the CHNS composition was determined, oxygen
content was calculated by difference. The ultimate composition was used to calculate the lower
heating value of the biomass using an established empirical correlation shown as Equation 4.1
(Channiwala and Parikh 2002).
𝐿𝐻𝑉 = (349.1𝐶 + 1178.3𝐻 + 100.5𝑆 − 103.4𝑂 − 15.1𝑁 − 21.1𝐴𝑆𝐻) − 2260 (9𝐻
100−
𝑀
100)
(4.1)
Where C, H, S, O and N are the constituent elements of the feedstock on a percent dry weight
basis. Ash and M are the mineral content and moisture content on a dry weight basis. Equation
4.1 represents the lower heating value in kJ/kg.
Ash content of each sample is determined to be the stable mass remaining following
thermogravimetric analysis and moisture (M) is measured using a halogen moisture analyzer
(HB43 Metler Toledo, CH).
4.4.3. 75 mm fluidized bed gasifier
A 75 mm diameter tubular thermal reactor was used for gasification of the willow. Figure 4.1
shows the main components of the reactor. The windbox and steam generator are heated using
41
external heating tapes set at 200 °C. The feeding tube is located between T101 and T103 directly
above the distributor plate. The distributor consists of a punched plate with a wire mesh above to
hold fine particles within the reactor section. The auger extends into the silica bed and is purged
using nitrogen to prevent backflow of silica sand into the feed hopper. The pressure sensor P02
shown in Figure 4.1 is purged with helium to prevent the flow of sand from the bed. Heat is
added to the silica bed through a 3000 W electric clamshell furnace (Applied Test Systems, US).
The freeboard is approximately 1 m in height and an expansion in the freeboard diameter reduces
entrainment of particulates into the gas cleaning section. Above the freeboard, a swirling water-
cooled condenser and cyclone are used to cool the gas and condense organics prior to gas
evacuation.
Data acquisition is performed using two Omega 8-channel data loggers measuring temperatures
and pressures throughout the bed as well as the output from the total hydrocarbon analyzer.
Temperature and pressure measurement ports are shown in Figure 4.1. Pressure sensors are
located in the freeboard, the fluidized bed, and directly below the fluidized bed.
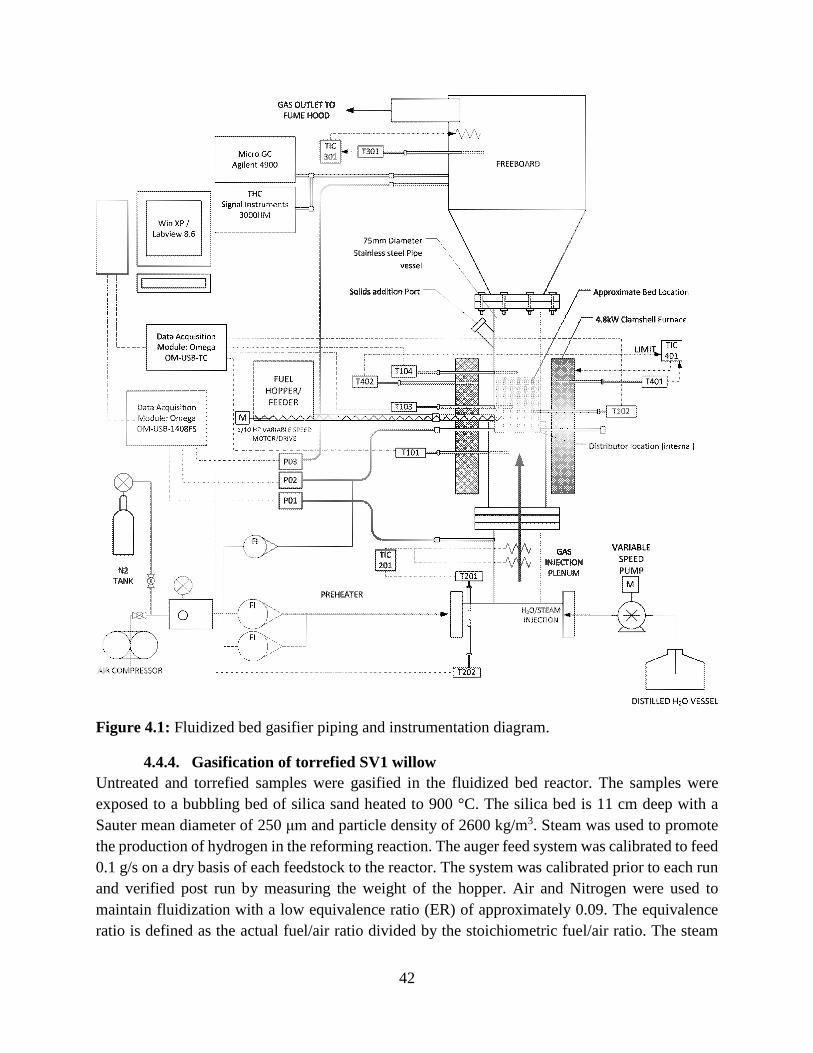
42
Figure 4.1: Fluidized bed gasifier piping and instrumentation diagram.
4.4.4. Gasification of torrefied SV1 willow
Untreated and torrefied samples were gasified in the fluidized bed reactor. The samples were
exposed to a bubbling bed of silica sand heated to 900 °C. The silica bed is 11 cm deep with a
Sauter mean diameter of 250 μm and particle density of 2600 kg/m3. Steam was used to promote
the production of hydrogen in the reforming reaction. The auger feed system was calibrated to feed
0.1 g/s on a dry basis of each feedstock to the reactor. The system was calibrated prior to each run
and verified post run by measuring the weight of the hopper. Air and Nitrogen were used to
maintain fluidization with a low equivalence ratio (ER) of approximately 0.09. The equivalence
ratio is defined as the actual fuel/air ratio divided by the stoichiometric fuel/air ratio. The steam
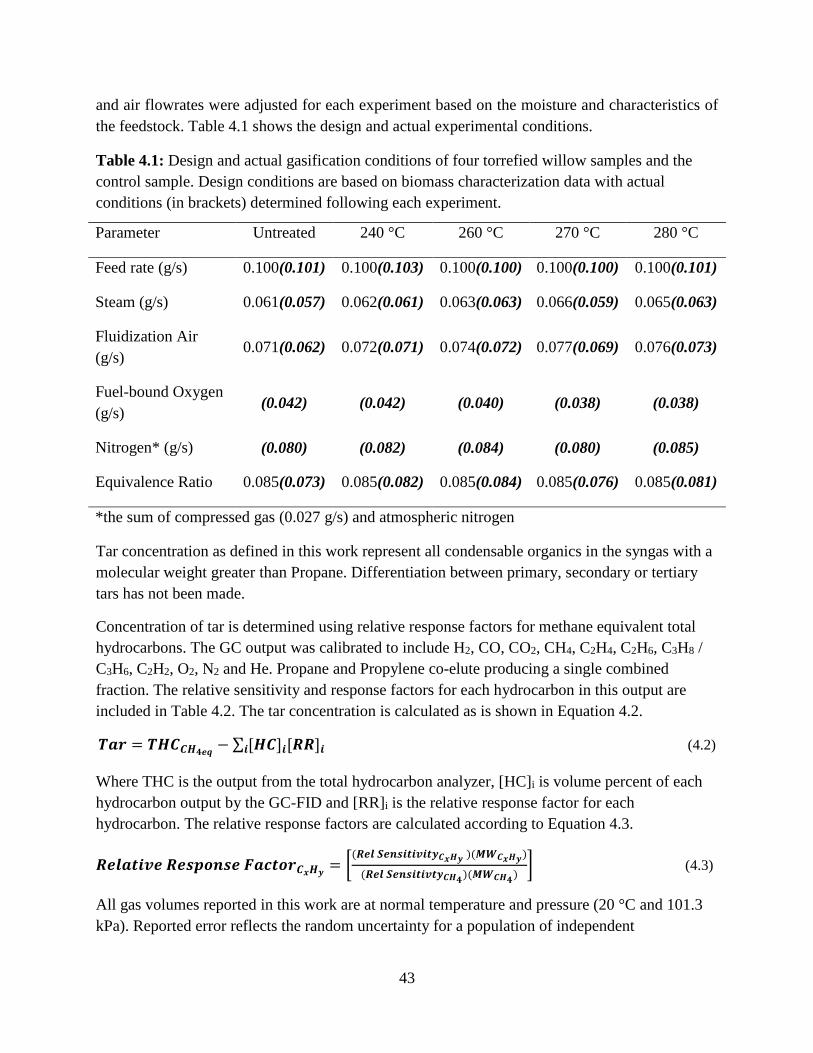
43
and air flowrates were adjusted for each experiment based on the moisture and characteristics of
the feedstock. Table 4.1 shows the design and actual experimental conditions.
Table 4.1: Design and actual gasification conditions of four torrefied willow samples and the
control sample. Design conditions are based on biomass characterization data with actual
conditions (in brackets) determined following each experiment.
Parameter Untreated 240 °C 260 °C 270 °C 280 °C
Feed rate (g/s) 0.100(0.101) 0.100(0.103) 0.100(0.100) 0.100(0.100) 0.100(0.101)
Steam (g/s) 0.061(0.057) 0.062(0.061) 0.063(0.063) 0.066(0.059) 0.065(0.063)
Fluidization Air
(g/s) 0.071(0.062) 0.072(0.071) 0.074(0.072) 0.077(0.069) 0.076(0.073)
Fuel-bound Oxygen
(g/s) (0.042) (0.042) (0.040) (0.038) (0.038)
Nitrogen* (g/s) (0.080) (0.082) (0.084) (0.080) (0.085)
Equivalence Ratio 0.085(0.073) 0.085(0.082) 0.085(0.084) 0.085(0.076) 0.085(0.081)
*the sum of compressed gas (0.027 g/s) and atmospheric nitrogen
Tar concentration as defined in this work represent all condensable organics in the syngas with a
molecular weight greater than Propane. Differentiation between primary, secondary or tertiary
tars has not been made.
Concentration of tar is determined using relative response factors for methane equivalent total
hydrocarbons. The GC output was calibrated to include H2, CO, CO2, CH4, C2H4, C2H6, C3H8 /
C3H6, C2H2, O2, N2 and He. Propane and Propylene co-elute producing a single combined
fraction. The relative sensitivity and response factors for each hydrocarbon in this output are
included in Table 4.2. The tar concentration is calculated as is shown in Equation 4.2.
𝑻𝒂𝒓 = 𝑻𝑯𝑪𝑪𝑯𝟒𝒆𝒒− ∑ [𝑯𝑪]𝒊[𝑹𝑹]𝒊𝒊 (4.2)
Where THC is the output from the total hydrocarbon analyzer, [HC]i is volume percent of each
hydrocarbon output by the GC-FID and [RR]i is the relative response factor for each
hydrocarbon. The relative response factors are calculated according to Equation 4.3.
𝑹𝒆𝒍𝒂𝒕𝒊𝒗𝒆 𝑹𝒆𝒔𝒑𝒐𝒏𝒔𝒆 𝑭𝒂𝒄𝒕𝒐𝒓𝑪𝒙𝑯𝒚= [
(𝑹𝒆𝒍 𝑺𝒆𝒏𝒔𝒊𝒕𝒊𝒗𝒊𝒕𝒚𝑪𝒙𝑯𝒚 )(𝑴𝑾𝑪𝒙𝑯𝒚)
(𝑹𝒆𝒍 𝑺𝒆𝒏𝒔𝒊𝒕𝒊𝒗𝒕𝒚𝑪𝑯𝟒)(𝑴𝑾𝑪𝑯𝟒
)] (4.3)
All gas volumes reported in this work are at normal temperature and pressure (20 °C and 101.3
kPa). Reported error reflects the random uncertainty for a population of independent

44
experimental measurements at a 95 % confidence level. The mass of samples reported are on a
dry, ash-free (daf) basis unless otherwise stated.
Table 4.2: Relative sensitivity data and calculated relative response factors.
Relative Sensitivity Relative Response Factor
Methane 0.97 1.00
Ethane 0.97 1.87
Ethylene 1.02 1.84
Propane 0.98 2.78
Propylene 0.93 2.52
Acetylene 1.07 1.79
4.5. Results and discussion
4.5.1. Torrefaction mass and energy yield
Mass loss and energy yield provide a measure of the effectiveness of the torrefaction system.
Mass loss is the ratio of final mass to starting mass and energy yield is defined by Equation 4.4.
𝐸𝑦𝑖𝑒𝑙𝑑 = [(𝐹𝑖𝑛𝑎𝑙 𝑀𝑎𝑠𝑠) (𝐿𝐻𝑉𝑠𝑎𝑚𝑝𝑙𝑒)
(𝑆𝑡𝑎𝑟𝑡𝑖𝑛𝑔 𝑀𝑎𝑠𝑠)(𝐿𝐻𝑉𝑐𝑜𝑛𝑡𝑟𝑜𝑙)] (4.4)
The increase in calorific value is balanced against the loss of volatile mass from the treated
energy feedstock. Figure 4.2 shows the energy yield which decreases from 94 % to 88 % across
the temperature range.
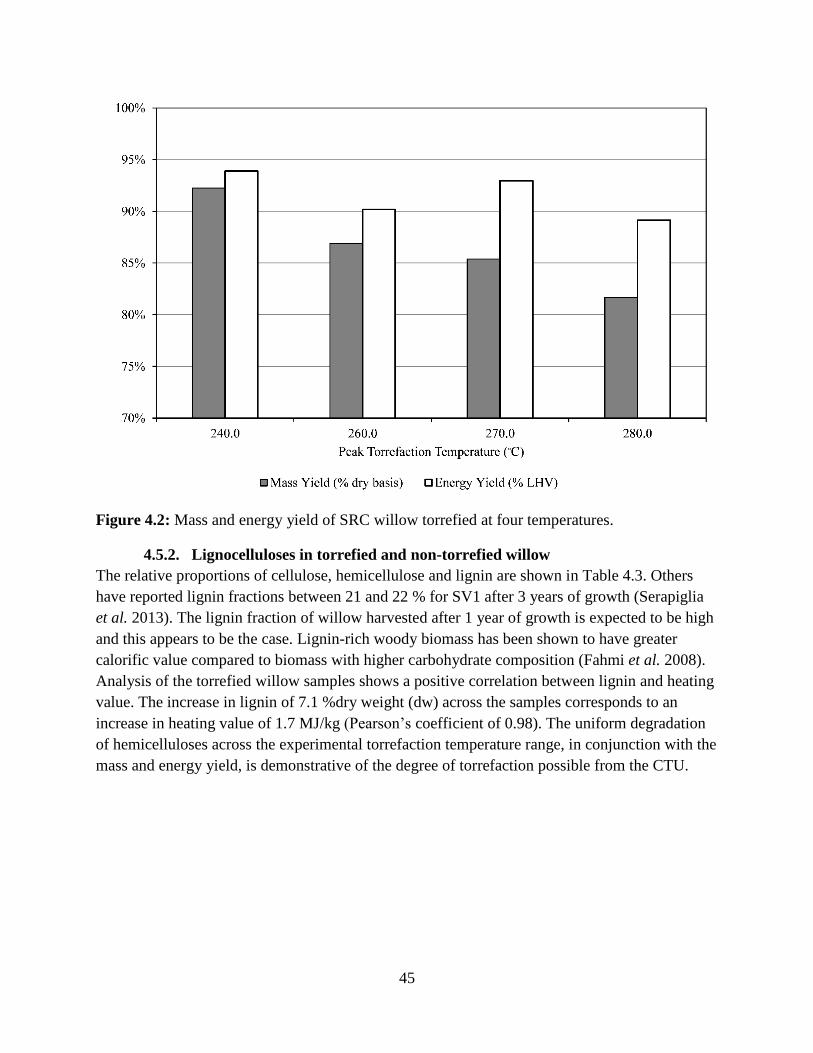
45
Figure 4.2: Mass and energy yield of SRC willow torrefied at four temperatures.
4.5.2. Lignocelluloses in torrefied and non-torrefied willow
The relative proportions of cellulose, hemicellulose and lignin are shown in Table 4.3. Others
have reported lignin fractions between 21 and 22 % for SV1 after 3 years of growth (Serapiglia
et al. 2013). The lignin fraction of willow harvested after 1 year of growth is expected to be high
and this appears to be the case. Lignin-rich woody biomass has been shown to have greater
calorific value compared to biomass with higher carbohydrate composition (Fahmi et al. 2008).
Analysis of the torrefied willow samples shows a positive correlation between lignin and heating
value. The increase in lignin of 7.1 %dry weight (dw) across the samples corresponds to an
increase in heating value of 1.7 MJ/kg (Pearson’s coefficient of 0.98). The uniform degradation
of hemicelluloses across the experimental torrefaction temperature range, in conjunction with the
mass and energy yield, is demonstrative of the degree of torrefaction possible from the CTU.
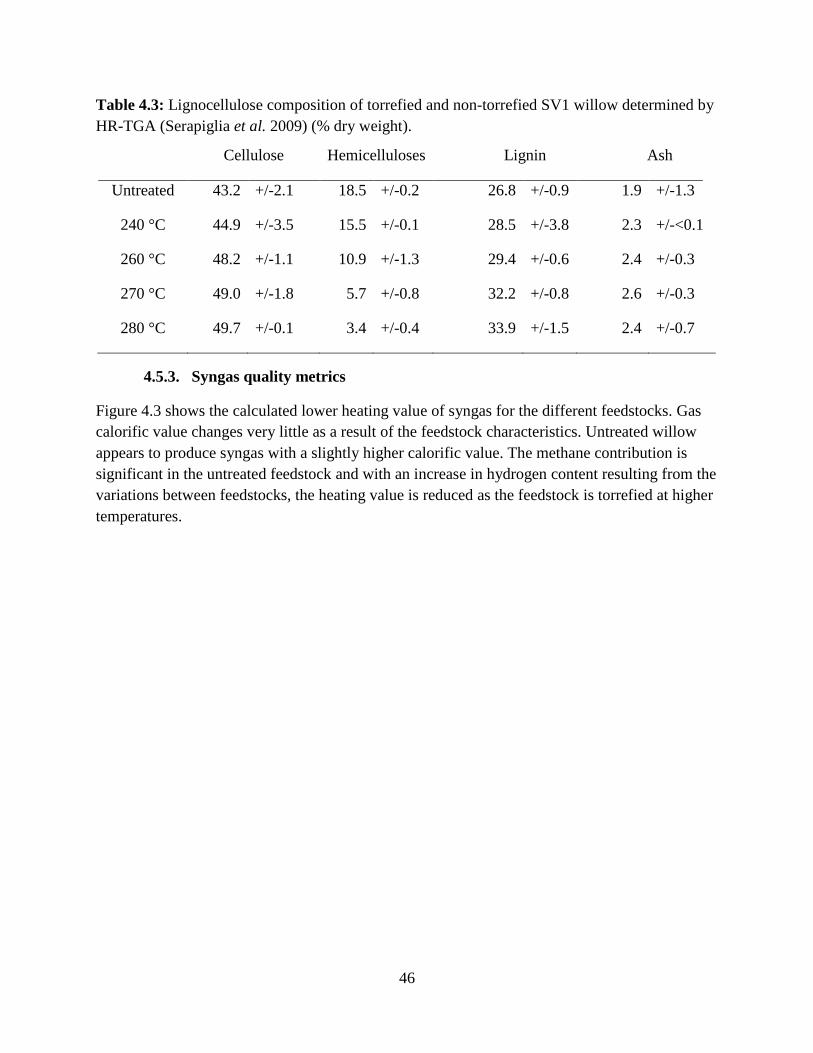
46
Table 4.3: Lignocellulose composition of torrefied and non-torrefied SV1 willow determined by
HR-TGA (Serapiglia et al. 2009) (% dry weight).
Cellulose Hemicelluloses Lignin Ash
Untreated 43.2 +/-2.1 18.5 +/-0.2 26.8 +/-0.9 1.9 +/-1.3
240 °C 44.9 +/-3.5 15.5 +/-0.1 28.5 +/-3.8 2.3 +/-<0.1
260 °C 48.2 +/-1.1 10.9 +/-1.3 29.4 +/-0.6 2.4 +/-0.3
270 °C 49.0 +/-1.8 5.7 +/-0.8 32.2 +/-0.8 2.6 +/-0.3
280 °C 49.7 +/-0.1 3.4 +/-0.4 33.9 +/-1.5 2.4 +/-0.7
4.5.3. Syngas quality metrics
Figure 4.3 shows the calculated lower heating value of syngas for the different feedstocks. Gas
calorific value changes very little as a result of the feedstock characteristics. Untreated willow
appears to produce syngas with a slightly higher calorific value. The methane contribution is
significant in the untreated feedstock and with an increase in hydrogen content resulting from the
variations between feedstocks, the heating value is reduced as the feedstock is torrefied at higher
temperatures.

47
Figure 4.3: Calculated calorific value of syngas from fluidized bed gasification of willow.
Table 4.4 shows gas yields and the Hydrogen and Carbon Monoxide concentrations in the syngas
directly above the bed. The total gas yield increased from 2.02 m3/kgdaf to 2.47 m3/kgdaf, an
increase of 22(+/-4) % over the untreated sample. The change in gas yield is most pronounced
between the 240 °C and 260 °C conditions. Similarly, H2 yield increases by 70(+/-6) % v/v and
the CO yield increases by 9(+/-4) %v/v. The notable increases in H2 and CO yield were observed
at torrefaction conditions greater than 240 °C.
An increase in H2 concentration of approximately 38 (+/-1) %v/v above the data for the untreated
condition was observed at steady state conditions. The CO concentration decreased by 12 (+/-2)
%v/v. The resulting increase in the H2/CO ratio was 56 (+/-4) %. The increase in H2
concentration between untreated and torrefied biomass is consistent with previous studies
(Couhert et al. 2009; Chen et al. 2011; Dudyński et al. 2015). However, Dudyński et al. (2015)
reported a 3 %v/v reduction in CO concentration between untreated and torrefied pellets while
Couhert et al. (2009) reported a 20 %g/gdry wood increase. Chen et al. (2011) observed a modest
increase in H2 concentration at torrefaction temperatures of 270 °C and 290 °C. These values
were slightly lower than those observed for sawdust torrefied at 230 °C and 250 °C. In each case,
the studies considered biomass types, torrefaction technologies, and gasifying reactors that were
different than those used in this study.
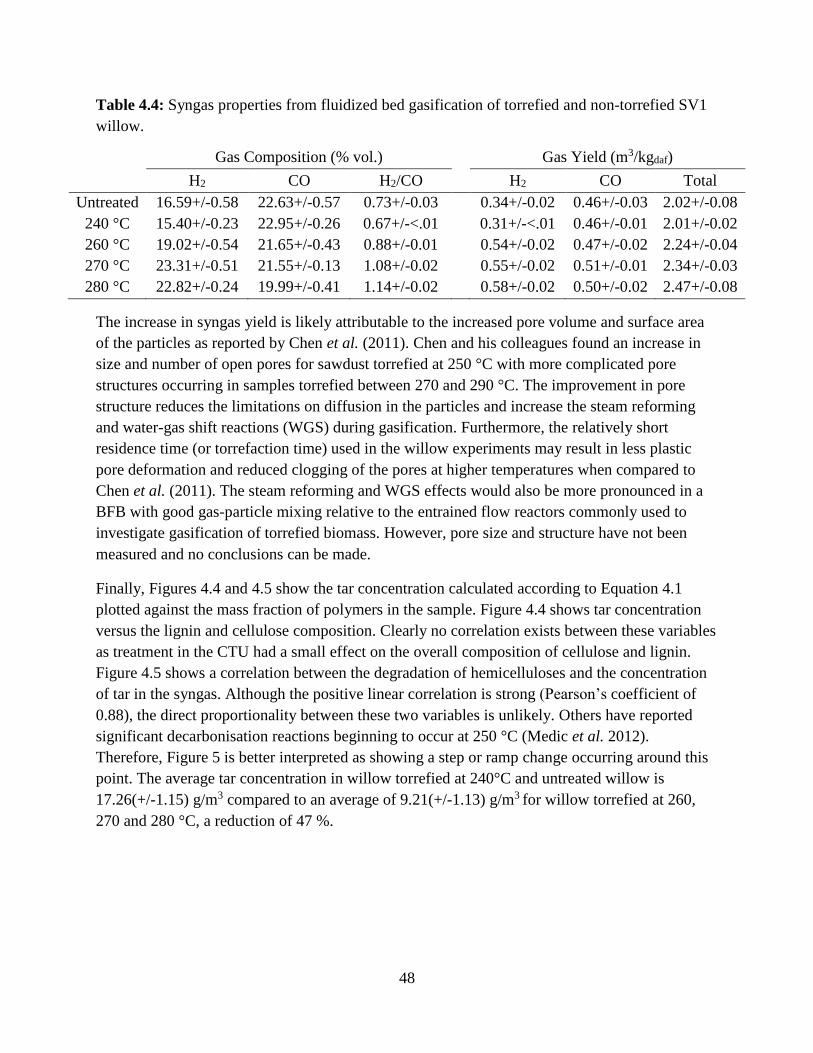
48
Table 4.4: Syngas properties from fluidized bed gasification of torrefied and non-torrefied SV1
willow.
Gas Composition (% vol.) Gas Yield (m3/kgdaf)
H2 CO H2/CO H2 CO Total
Untreated 16.59+/-0.58 22.63+/-0.57 0.73+/-0.03 0.34+/-0.02 0.46+/-0.03 2.02+/-0.08
240 °C 15.40+/-0.23 22.95+/-0.26 0.67+/-<.01 0.31+/-<.01 0.46+/-0.01 2.01+/-0.02
260 °C 19.02+/-0.54 21.65+/-0.43 0.88+/-0.01 0.54+/-0.02 0.47+/-0.02 2.24+/-0.04
270 °C 23.31+/-0.51 21.55+/-0.13 1.08+/-0.02 0.55+/-0.02 0.51+/-0.01 2.34+/-0.03
280 °C 22.82+/-0.24 19.99+/-0.41 1.14+/-0.02 0.58+/-0.02 0.50+/-0.02 2.47+/-0.08
The increase in syngas yield is likely attributable to the increased pore volume and surface area
of the particles as reported by Chen et al. (2011). Chen and his colleagues found an increase in
size and number of open pores for sawdust torrefied at 250 °C with more complicated pore
structures occurring in samples torrefied between 270 and 290 °C. The improvement in pore
structure reduces the limitations on diffusion in the particles and increase the steam reforming
and water-gas shift reactions (WGS) during gasification. Furthermore, the relatively short
residence time (or torrefaction time) used in the willow experiments may result in less plastic
pore deformation and reduced clogging of the pores at higher temperatures when compared to
Chen et al. (2011). The steam reforming and WGS effects would also be more pronounced in a
BFB with good gas-particle mixing relative to the entrained flow reactors commonly used to
investigate gasification of torrefied biomass. However, pore size and structure have not been
measured and no conclusions can be made.
Finally, Figures 4.4 and 4.5 show the tar concentration calculated according to Equation 4.1
plotted against the mass fraction of polymers in the sample. Figure 4.4 shows tar concentration
versus the lignin and cellulose composition. Clearly no correlation exists between these variables
as treatment in the CTU had a small effect on the overall composition of cellulose and lignin.
Figure 4.5 shows a correlation between the degradation of hemicelluloses and the concentration
of tar in the syngas. Although the positive linear correlation is strong (Pearson’s coefficient of
0.88), the direct proportionality between these two variables is unlikely. Others have reported
significant decarbonisation reactions beginning to occur at 250 °C (Medic et al. 2012).
Therefore, Figure 5 is better interpreted as showing a step or ramp change occurring around this
point. The average tar concentration in willow torrefied at 240°C and untreated willow is
17.26(+/-1.15) g/m3 compared to an average of 9.21(+/-1.13) g/m3 for willow torrefied at 260,
270 and 280 °C, a reduction of 47 %.
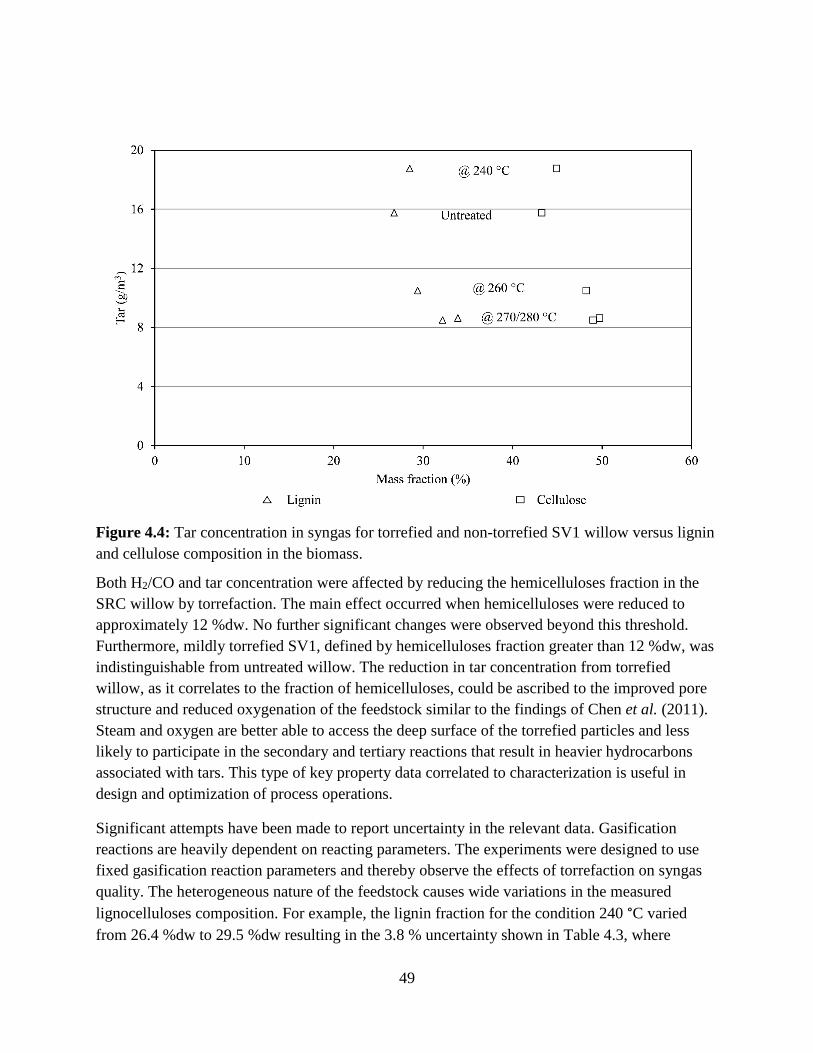
49
Figure 4.4: Tar concentration in syngas for torrefied and non-torrefied SV1 willow versus lignin
and cellulose composition in the biomass.
Both H2/CO and tar concentration were affected by reducing the hemicelluloses fraction in the
SRC willow by torrefaction. The main effect occurred when hemicelluloses were reduced to
approximately 12 %dw. No further significant changes were observed beyond this threshold.
Furthermore, mildly torrefied SV1, defined by hemicelluloses fraction greater than 12 %dw, was
indistinguishable from untreated willow. The reduction in tar concentration from torrefied
willow, as it correlates to the fraction of hemicelluloses, could be ascribed to the improved pore
structure and reduced oxygenation of the feedstock similar to the findings of Chen et al. (2011).
Steam and oxygen are better able to access the deep surface of the torrefied particles and less
likely to participate in the secondary and tertiary reactions that result in heavier hydrocarbons
associated with tars. This type of key property data correlated to characterization is useful in
design and optimization of process operations.
Significant attempts have been made to report uncertainty in the relevant data. Gasification
reactions are heavily dependent on reacting parameters. The experiments were designed to use
fixed gasification reaction parameters and thereby observe the effects of torrefaction on syngas
quality. The heterogeneous nature of the feedstock causes wide variations in the measured
lignocelluloses composition. For example, the lignin fraction for the condition 240 °C varied
from 26.4 %dw to 29.5 %dw resulting in the 3.8 % uncertainty shown in Table 4.3, where
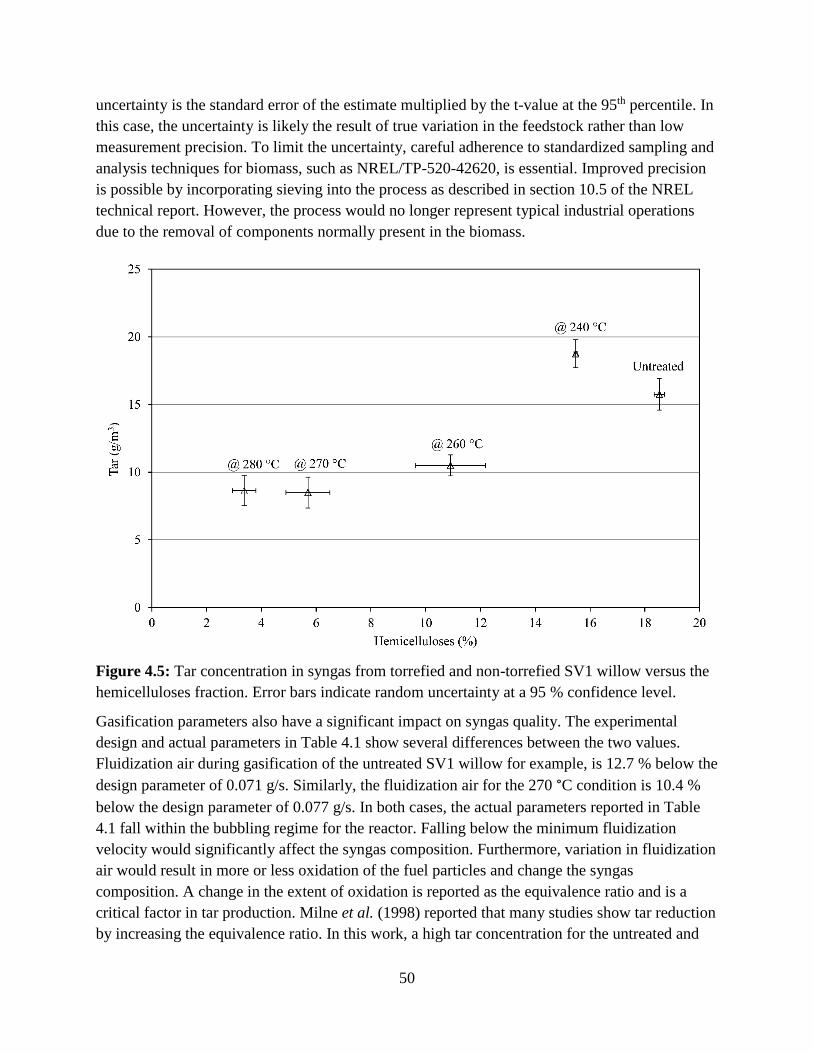
50
uncertainty is the standard error of the estimate multiplied by the t-value at the 95th percentile. In
this case, the uncertainty is likely the result of true variation in the feedstock rather than low
measurement precision. To limit the uncertainty, careful adherence to standardized sampling and
analysis techniques for biomass, such as NREL/TP-520-42620, is essential. Improved precision
is possible by incorporating sieving into the process as described in section 10.5 of the NREL
technical report. However, the process would no longer represent typical industrial operations
due to the removal of components normally present in the biomass.
Figure 4.5: Tar concentration in syngas from torrefied and non-torrefied SV1 willow versus the
hemicelluloses fraction. Error bars indicate random uncertainty at a 95 % confidence level.
Gasification parameters also have a significant impact on syngas quality. The experimental
design and actual parameters in Table 4.1 show several differences between the two values.
Fluidization air during gasification of the untreated SV1 willow for example, is 12.7 % below the
design parameter of 0.071 g/s. Similarly, the fluidization air for the 270 °C condition is 10.4 %
below the design parameter of 0.077 g/s. In both cases, the actual parameters reported in Table
4.1 fall within the bubbling regime for the reactor. Falling below the minimum fluidization
velocity would significantly affect the syngas composition. Furthermore, variation in fluidization
air would result in more or less oxidation of the fuel particles and change the syngas
composition. A change in the extent of oxidation is reported as the equivalence ratio and is a
critical factor in tar production. Milne et al. (1998) reported that many studies show tar reduction
by increasing the equivalence ratio. In this work, a high tar concentration for the untreated and
51
270 °C conditions relative to the 240 °C, 260 °C and 280 °C conditions would have indicated an
effect of the small reduction in ER shown in Table 4.1. High tar concentration was not observed
and the minor reduction in equivalence ratio for the untreated and 270 °C conditions, therefore
do not affect the conclusions.
4.6. Conclusions
Short-rotation coppice willow was torrefied at four temperatures, characterized for lignocellulose
composition and then gasified in a bubbling fluidized bed reactor with steam and air. The
objective was to correlate syngas quality metrics with characteristics of the feedstock under fixed
gasification conditions. The main conclusions from this work are;
• The H2/CO ratio of syngas from BFB gasification was found to be greater for SV1
willow torrefied at temperatures greater than 240 °C when compared to untreated SV1
willow or lightly torrefied SV1 willow (240 °C).
• Under fixed temperature and equivalence ratio conditions, tar in the syngas changes
measurably as the hemicelluloses begin to react (between 240 and 260 °C in this case).
Syngas yield was found to increase from 2.02 to 2.47 m3/kgdafSV1. A step change in tar
concentration was observed from 17.26 g/m3 to 9.21 g /m3, a reduction of 47 %.
• There is a good positive linear correlation (Pearson’s r = 0.88) between the
hemicelluloses in the feedstock and the concentration of tar in syngas from a fluidized
bed gasifier. However, a linear correlation is unlikely to exist within a significant range
of operation.
Ultimately, torrefaction of SRC willow to an extent that the treated biomass is composed of less
than 12 % dry weight hemicelluloses as measured by HR-TGA, will result in a more hydrogen-
rich, low-tar syngas from BFB, steam/air gasification.
52
4.7. References
Basu, P. 2010. Biomass gasification and pyrolysis. 1st ed. Elsevier Inc., Burlington, MA.
Bergman, P.C.A., and Kiel, J.H.A. 2005. Torrefaction for biomass upgrading. Paper presented at
the 14th European Biomass Conference and Exhibition, October 17-21, Paris, FR.
Cameron, K.D., Smart, L.B., Ballard, B., Abrahamson, L.P., and Volk, T.A. 2007. Salix
dasyclados ‘SV1’. State University of New York College of Environmental Science and
Forestry, http://www.esf.edu/.
Campbell, W., Woytiuk, K., Evitts, R.W., Phoenix, A., and Gerspacher, R. 2012. Effect of
temperature and time on torrefaction of Canadian prairie wheat straw. Paper presented at the
4th International Symposium on Energy from Biomass and Waste, Venice, Italy.
Channiwala, S., and Parikh, P. 2002. A unified correlation for estimating HHV of solid, liquid
and gaseous fuels. Fuel 81 (8): 1051-63.
Chen, W., Peng, J., and Bi, X.T. 2015. A state-of-the-art review of biomass torrefaction,
densification and applications. Renewable and Sustainable Energy Reviews 44: 847-66.
Chen, Q., Zhou, J.S., Liu, B.J., Mei, Q.F., and Luo, Z.Y. 2011. Influence of torrefaction
pretreatment on biomass gasification technology. Chinese Science Bulletin 56 (14): 1449-
56.
Chew, J.J., and Doshi, V. 2011. Recent advances in biomass pretreatment–Torrefaction
fundamentals and technology. Renewable and Sustainable Energy Reviews 15 (8): 4212-22.
Couhert, C., Salvador, S., and Commandré, J. 2009. Impact of torrefaction on syngas production
from wood. Fuel 88 (11): 2286-90.
Djomo, S.N., Kasmioui, O.E., and Ceulemans, R. 2010. Energy and greenhouse gas balance of
bioenergy production from poplar and willow: A review. GCB Bioenergy 3 (3): 181.
Dudyński, M., van Dyk, J.C., Kwiatkowski, K., and Sosnowska, M. 2015. Biomass gasification:
Influence of torrefaction on syngas production and tar formation. Fuel Processing
Technology 131: 203-12.
Eisentraut, A., Brown, A., and Fulton, L. 2011. Technology roadmap: Biofuels for transport.
International Energy Agency.
Fahmi, R., Bridgwater, A.V., Donnison, I., Yates, N., and Jones, J.M. 2008. The effect of lignin
and inorganic species in biomass on pyrolysis oil yields, quality and stability. Fuel 87 (7):
1230-40.
Gerspacher, R., Campbell, W., Woytiuk, K., Evitts, R.W., and Phoenix, A. 2013. Evaluation of a
rotary-disc cutting machine for cutting long-stem biomass into uniform granules. Paper
presented at (CANCAM 2013) 24th Canadian Congress of Applied Mechanics, Saskatoon,
SK, CA.
53
Hanaoka, T., Inoue, S., Uno, S., Ogi, T., and Minowa, T. 2005. Effect of woody biomass
components on air-steam gasification. Biomass and Bioenergy 28 (1): 69-76.
Li, J., Brzdekiewicz, A., Yang, W., and Blasiak, W. 2012. Co-firing based on biomass
torrefaction in a pulverized coal boiler with aim of 100% fuel switching. Applied Energy 99
(0): 344-54.
Lipinsky, E.S., Arcate, J.R., and Reed, T.B. 2002. Enhanced wood fuels via torrefaction.
American Chemical Society, Division of Fuel Chemistry 47: 408-410.
McKendry, P. 2002. Energy production from biomass (part 3): Gasification technologies.
Bioresource Technology 83 (1): 55-63.
Medic, D., Darr, M., Shah, A., Potter, B., and Zimmerman, J. 2012. Effects of torrefaction
process parameters on biomass feedstock upgrading. Fuel 91 (1): 147-54.
Milne, T.A., Abatzoglou, N., and Evans, R.J. 1998. Biomass gasifier "tars": Their nature,
formation and conversion. NREL/TP-570-25357. Golden, CO, USA.
Moersch, O., Spliethoff, H., and Hein, K.R.G. 2000. Tar quantification with a new online
analyzing method. Biomass and Bioenergy 18 (1): 79-86.
Prins, M.J., Ptasinski, K.J., and Janssen, F.J.J.G. 2006. More efficient biomass gasification via
torrefaction. Energy 31 (15): 3458-70.
Raut, M.K. 2014. Studies into the effect of torrefaction on gasification of biomass. MASc.
Dalhousie University.
Serapiglia, M.J., Cameron, K.D., Stipanovic, A.J., Abrahamson, L.P., Volk, T.A., and Smart,
L.B. 2013. Yield and woody biomass traits of novel shrub willow hybrids at two contrasting
sites. BioEnergy Research 6 (2): 533-546.
Serapiglia, M.J., Cameron, K.D., Stipanovic, A.J., and Smart, L.B. 2009. Analysis of biomass
composition using high-resolution thermogravimetric analysis and percent bark content for
the selection of shrub willow bioenergy crop varieties. BioEnergy Research (1-2): 1-9.
Serapiglia, M.J., Gouker, F., Hart, J.F., Unda, F., Mansfield, S.D., Stipanovic, A.J., et al. 2015.
Ploidy level affects important biomass traits of novel shrub willow (Salix) hybrids.
BioEnergy Research 8 (1): 259-69.
Steynberg, A., and Dry, M. 2004. Fischer-tropsch technology Elsevier. Amsterdam, NL.
Sweeney, D.J. 2012. Performance of a pilot scale, steam blown, pressurized fluidized bed
biomass gasifier. PhD, University of Utah.
Van der Stelt, M., Gerhauser, H., Kiel, J., and Ptasinski, K. 2011. Biomass upgrading by
torrefaction for the production of biofuels: A review. Biomass and Bioenergy 35 (9): 3748-
62.

54
Van Loo, S., and Koppejan, J. (eds.) 2008. Biomass ash characteristics and behaviour in
combustion systems. In The handbook of biomass combustion and co-firing. 2nd ed.,
Earthscan, London, UK, pp. 249
Yu, H., Zhang, Z., Li, Z., and Chen, D. 2014. Characteristics of tar formation during cellulose,
hemicellulose and lignin gasification. Fuel 118 (0): 250-6.
55
5. Real-time analysis of syngas tar species for feedback control of
temperature during torrefaction
5.1. Preface
In chapter 5, syngas quality is evaluated based on three tar species and correlated to
hemicelluloses in SV1 willow. Detailed tar characterization in syngas has been conducted by
other research, but simple, real-time monitoring of different tar species is valuable in bioenergy
or biochemical processes. Monitoring classes of tars is useful for meeting regulatory
requirements in chemical processes. In bioenergy applications, for example, intermittent
monitoring of PAHs could be used to bypass scrubbers and prevent excessive contamination of
waste water. On the other hand, as the industry develops, trace species classified as waste or
contaminants may become valued and threshold concentrations could initiate costly separation
and collection processes (for example, the separation of light aromatics mentioned in section
5.3). In relation to the thesis, the chapter investigates in greater depth the decrease in tar
concentration as a result of torrefaction. The experiments mirror those conducted in chapter 4
and demonstrate similar phenomena. The manuscript is proposed as a follow-up to chapter 4 and
has been submitted to the Journal of Renewable Energy. Section 5.4 describes background
theory on mass spectrometry (MS) that is necessary for understanding the thesis. This section has
been modified for the final manuscript because the detailed background on MS is not required
for academic interpretation of the work.
The assistance of co-authors on the paper is greatly appreciated. The co-authors were Regan
Gerspacher, Dr. Aaron Phoenix P.Eng, FEC, and Dr. Richard Evitts P.Eng. Regan Gerspacher
provided valuable manuscript editing and review. Dr. Richard Evitts and Aaron Phoenix
provided detailed manuscript review and methodological assistance. All other contributions in
the paper including data analysis, literature review, methodology, experimental design, data
interpretation, and preparation of the manuscript are my unique contributions to this work.
5.2. Abstract
As a follow up to earlier work on the effects of torrefaction on syngas quality metrics from
gasification of coppice willow, a mass spectrometer was used to measure tar species in syngas
from fluidized bed gasification. The purpose of the work is to develop a protocol for real-time
monitoring of tar species in syngas derived from torrefied biomass. Tar species monitoring by
mass spectrometry can be used to optimize torrefaction conditions. The parent ion and base peak
intensities of five tar species spanning two tar classifications in syngas from torrefied and non-
torrefied willow were measured. The ion intensities in the syngas are correlated to the
hemicelluloses fraction in the torrefied and non-torrefied coppice willow. A comparison is made
to the companion work on tar concentration measurement by GC-FID and total hydrocarbon
analysis by FID. Ion intensities of the parent ion peaks and base peaks for toluene, ethylbenzene,
xylene, and naphthalene followed a similar correlation with the fraction of hemicelluloses
56
compared to the tar concentration measurement in the companion work. Benzene’s parent ion
peak intensity in syngas correlated linearly with hemicelluloses in torrefied willow. The mass
spectrometer was found to reduce measurement lag time to virtually real-time compared to the
GC-FID system.
5.3. Introduction
The development of advanced biomass is an important component in the growth of industrial
land-based renewable energy. The production of green fuels or chemicals is a potential long-term
application for dedicated lignocellulosic or second generation, crops. Second generation biomass
is an appealing alternative because food and feed crops for energy continue to raise food security
concerns (Holland et al. 2015). To support the development of the synthetic biofuels and
chemicals industry from second-generation biomass, the relationship between treated biomass
and the terminal thermochemical process (for example gasification, pyrolysis, or combustion)
must be better understood.
The term ‘advanced biomass’ has been used to describe the torrefied and steam treated pellets, so
called ‘black pellets’, that have replaced coal at the Thunder Bay generating station in Canada
(Macklin 2015). The article implies that advanced biomass is biomass treated by any process that
improves the chemical characteristics of the solid feedstock in preparation for an energy
generating system. Torrefaction is one such process that has well known benefits relating to
transport, storage, and handling of biomass. Torrefaction is a low temperature thermal treatment
where biomass is heated to between 200 °C and 300 °C in an inert environment. The process
volatilizes hemicelluloses and initiates reactions that change the chemical composition and
physical structure of the resulting char. The biomass becomes more resistant to environmental
degradation, more energy dense, and requires less energy to grind or pulverize. The recalcitrance
of the char has been attributed to breakdown of hydroxyl groups in the cell walls (Yan et al.
2009). A reduction in the number of hydroxyl groups lowers the equilibrium moisture content by
preventing hydrogen bonding of water molecules to the cell walls. Others have connected the
hydrophobicity to the non-polar condensed tars on the surface of torrefied particles but no
corroborating evidence of this phenomenon is provided (Felfli et al. 2005). The increased energy
density of torrefied biomass is a direct result of carbonization; the oxygen to carbon ratio
decreases significantly and the energy content increases. Finally, removal of the hemicelluloses
by torrefaction results in better friability compared to the untreated biomass. Hemicelluloses are
made up of many short-chain polymers some of which are closely linked with lignin and
contribute to the fibrous characteristics of biomass (Smook and Kocurek 1982). Unlike lignin,
which breaks down slowly over a wide temperature range, hemicelluloses break down quickly at
torrefaction temperatures.
In addition to the solid char produced during torrefaction, liquids and gases are also formed in
low quantities. Bergman et al. (2005) found acetic acid, methanol, and 2-furaldehyde as the most
abundant condensed organics from torrefaction of wood cuttings at 280 °C. Similarly, CO2 was
identified as the most abundant permanent gaseous component along with CO and trace amounts
57
of benzene and toluene. The CO2 evolved during torrefaction is connected to the carboxyl and
carboxylic acid groups cracking and reforming (Yang et al. 2007). Yang et al. linked the release
of CO2 to the cracking of C-C and C-O bonds from the main hemicellulose branch during the
pyrolysis of hemicelluloses.
As a pretreatment of biomass for gasification, torrefaction has been found to increase the H2 and
CO concentrations in syngas (Couhert et al. 2009). Others have reported improved gasification
efficiency (assuming both char and gases are utilized), reduced tar mass yield, and improved ease
of fluidization (Prins et al. 2006; Dudyński et al. 2015). Research interest has focused on the
production ‘clean’ syngas from biomass (i.e. syngas that is free of contamination). Contaminants
in syngas include sulfur, particulates, halogens, metals and tar (Milne et al. 1998; Abatzoglou et
al. 2007). Tolerance of catalysts to any of these contaminants is very low and Milne et al.
conclude that syngas must be virtually free from tars, sulfur and particulates.
The categorization of tars into primary, secondary, alkyl tertiary and condensed tertiary tars is
useful in identifying the formation pathways (Milne et al. 1998). Primary tars form first from the
biomass cellulose, hemicellulose and lignin. Secondary tars consist of phenolics and olefins.
Alkyl tertiary tars are methyl derivatives of aromatics (for example styrene, xylene and toluene).
Finally, condensed tertiary tars are polycyclic aromatic hydrocarbons (PAHs) without
substituents (for example benzene and naphthalene). The most abundant tar species from
biomass gasification include benzene, toluene, ethylbenzene, and xylene (BTEX). BTEX
compounds make up 60-70 %wt. of tars in syngas (Hernández et al. 2013). Hernández et al. also
reported that naphthalene is the most abundant PAH found in syngas from biomass. Secondary
tars (xylene, phenol) are an important precursor to PAHs (Morf et al. 2002). Morf et al. report
that phenols are particularly problematic since they are corrosive and appear in high
concentrations in waste water from gasifiers. Xylene is included in the classification of
secondary tars by Morf et al. but they acknowledge the abitrary boundaries between these
classes. Benzene, is often excluded as a tar compound since it will not condense at normal
operational temperatures. However, the development of biorefining has renewed interest in
benzene from syngas. Separation technology for light aromatics from syngas motivate greater
study of torrefaction’s effects on production of benzene (van der Drift 2014; Reinikainen et al.
2015).
Most gasification research into tar species has focused on operating parameters. Mastral et al.
(2000) state that equivalence ratio (or excess air, in the case of combustion) is the most
significant parameter effecting the formation of PAHs. Milne et al. (1998) report constant tar
yield but an increase in the benzene concentration in syngas as a result of an increase in the
equivalence ratio from 0.22 to 0.32. This implies a decrease in the concentration of heavier
hydrocarbons resulting from the increase in equivalence ratio. Lin et al. (2004) observed a
positive correlation between formation of PAHs and fluidization velocity during fluidized bed
incineration. To isolate the effect of torrefaction on tar species, gasification conditions must be
carefully controlled.

58
In a companion study to this work (Woytiuk et al. 2017), the researchers measured syngas
quality metrics including tar concentration, H2/CO ratio and syngas heating value for both
torrefied and non-torrefied SV1 willow. In their research, gas chromatography with a flame
ionization detector (GC-FID) was used in conjunction with high-resolution thermogravimetric
analysis (HR-TGA). Tar concentration was calculated as the difference between the total
hydrocarbon concentration of a particulate-free, hot gas stream measured using a flame
ionization detector and the hydrocarbons in a filtered and condensed gas sample. The time
required for these measurements was 2.5 minutes, mainly due to GC-FID. Torrefaction char was
characterized for lignocellulose composition using HR-TGA, a rapid characterization technique
that has been developed for willow species (Serapiglia et al. 2009). It was found that the tar
concentration decreased by 47 %wt/vol when the samples were torrefied to an extent such that
they were comprised of less than 12 %wt hemicelluloses.
In this research work, a new methodology was applied to investigate chemical species that are
produced during gasification of torrefied and non-torrefied SV1 willow. A mass spectrometer
(MS) was used for real-time analysis of gas and vapour composition of syngas produced in a 75
mm diameter fluidized bed reactor. The mass spectra are used to investigate the concentration of
chemicals in syngas from torrefied and non-torrefied SV1 willow. Parent ion peak and base peak
intensity of benzene, toluene, ethylbenzene, xylene, and naphthalene in spectra of syngas from
torrefied and non-torrefied SV1 willow samples are used as proxy for species concentrations. Ion
intensity measurements are correlated to the hemicellulose composition of the torrefied and non-
torrefied willow measured by HR-TGA. The correlation between tar species and hemicelluloses
is then compared to the same correlation between tar concentration and hemicelluloses in
Woytiuk et al. (2017).
5.4. Theory: continuous gas analysis by mass spectrometry
A basic understanding of mass spectrometry is important to interpreting the results of this study.
A quadrupole mass spectrometer with an electron impact ionizer, a faraday plate detector and an
electron multiplier is used in this work. Mass spectrometers operate on the principle of filtration
by deflection of charged particles in an electric or magnetic field. Once introduced or ‘leaked’
into the high-vacuum, analyzer core, the analyte is first ionized by a beam of electrons from the
ionizer. The electrons are typically accelerated to 70 eV, high enough to leave the molecular or
parent ion in a highly-excited state (Skoog and West 1980). The ionizer forms characteristic ions
depending on the structure and composition of the analyte. The ions are accelerated further and
enter the mass analyzer. The quadrupole mass analyzer consists of four thin metal rods with a
direct current (DC) potential and two, phase-shifted alternating current (AC) potentials across
them (Skoog and West 1980). Ions can be filtered by adjusting the potentials across the four
rods. After the quadrupole are a faraday plate (a metal plate designed to catch charged particles)
and an electron multiplier (a cone shaped device that can multiply incident charges) that create a
current proportional to the ions impacting them. Only ions with a certain mass to charge ratio
(m/z) are allowed to pass through the mass filter at a given AC and DC voltage without colliding
59
with the rods. By varying the AC and DC potentials, a mass scan of a range of m/z ratios can be
output. The mass spectrum resulting from the mass scan is referred to here as a ‘survey scan’.
A particular analyte will fragment into characteristic ions the most common of which is the
molecular or parent ion. The parent ion has a m/z ratio equivalent to the nominal molecular
weight (example: benzene has a parent ion peak at m/z 78). The base peak corresponds with the
ion creating the largest intensity at the detector. The base peak of ethylbenzene for example,
occurs at m/z 91 owing to the appearance of a methyl radical (Skoog and West 1980).
Energetically, the loss of a methyl group from an aromatic compound occurs with only 0.4 eV
and the base peak at m/z 91 is therefore shared with several compounds, most notably xylene and
toluene, all of which experience the methyl radical ionization (Williams and Fleming 1980). The
difficulty in quantitative analysis of mass spectra for complex gas-vapour mixtures as a result of
the ionization behavior is often presented as a limitation of mass spectrometry for gas analysis.
However, as a measurement of the relative changes in trace species in syngas, the survey scan
provides valuable operational data online without complex gas calibration or manipulation.
Skoog et al. (1980) describe a quantitative method to determine concentrations whereby the ion
intensity at a mass to charge ratio is used as a proxy concentration measurement. To evaluate the
relative change in concentration of benzene, toluene, ethylbenzene, xylene and naphthalene, the
mass to charge ratios of three parent ion peaks is considered. Benzene and naphthalene are
evaluated based on the ion intensity at m/z 78 and m/z 128 respectively, their parent ion peaks.
Toluene, ethylbenzene, and xylene are considered based on m/z 91 and 92. The base peak of all
three species occurs at m/z 91 and toluene’s parent ion peak occurs at m/z 92.
5.5. Materials and methods
5.5.1. Ultimate and lignocelluloses composition of willow
A fast-growing willow cultivar known as ‘SV1’ (Salix dasyclados) was harvested and processed
into 25 mm long billets as described in the previous work (Woytiuk et al. 2017).
Characterization of the torrefied and non-torrefied samples consists of ultimate analysis
(VarioEL III CHNS analyzer, Elementar, DE) and high-resolution thermogravimetric (HR-TGA)
analysis (Q600, TA Instruments, US). CHNS data is used to calculate the effective heating value
of the char. The HR-TGA method is used to quantify lignocelluloses composition of the
untreated and torrefied samples. Following torrefaction, billets are ground in a #1 Wiley Mill in
preparation for gasification.
Results of the previous study demonstrated small variations in syngas quality between the most
heavily torrefied samples (270 °C and 280 °C) despite significant variation in the extent of
torrefaction. Syngas from SV1 torrefied at 270 °C and 280 °C were indistinguishable in most
syngas quality metrics. Therefore, the set of experiments in this work considers only three
torrefied samples and a control. The samples considered in this work are untreated SV1 willow,
SV1 willow torrefied at 240 °C, 260 °C, and 280 °C where the temperatures represent the
nominal peak conditions at which torrefaction is conducted in a continuous, moving bed reactor.
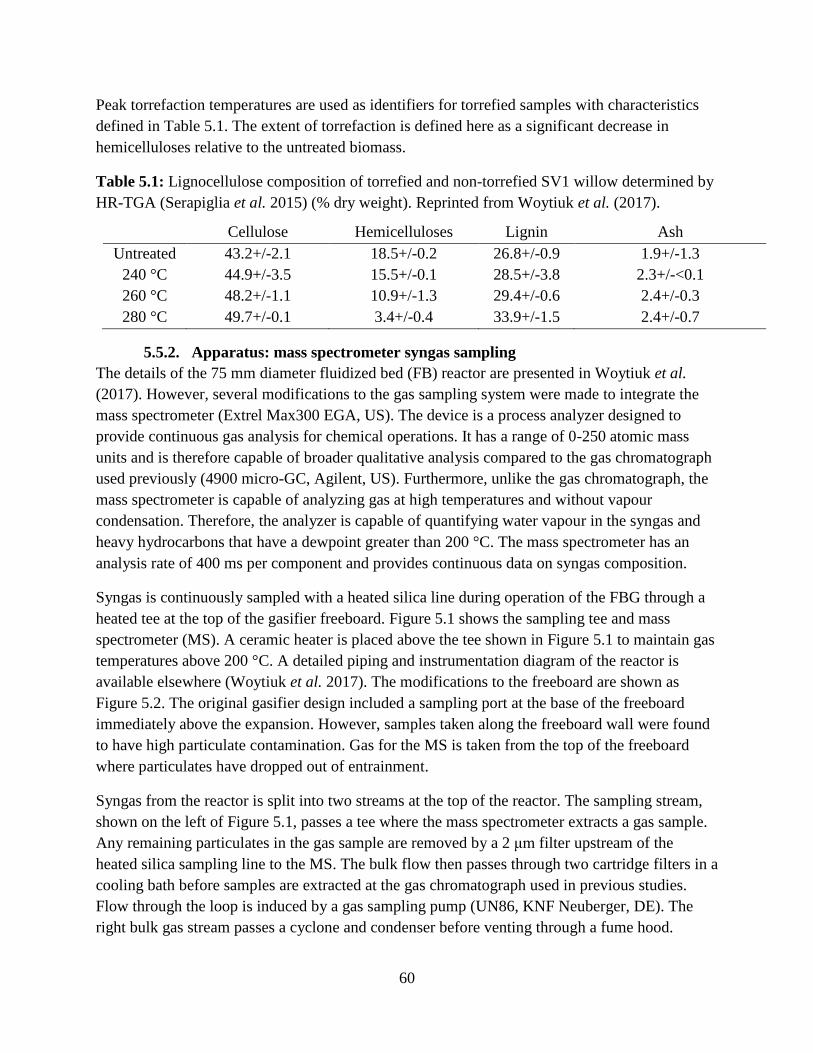
60
Peak torrefaction temperatures are used as identifiers for torrefied samples with characteristics
defined in Table 5.1. The extent of torrefaction is defined here as a significant decrease in
hemicelluloses relative to the untreated biomass.
Table 5.1: Lignocellulose composition of torrefied and non-torrefied SV1 willow determined by
HR-TGA (Serapiglia et al. 2015) (% dry weight). Reprinted from Woytiuk et al. (2017).
Cellulose Hemicelluloses Lignin Ash
Untreated 43.2+/-2.1 18.5+/-0.2 26.8+/-0.9 1.9+/-1.3
240 °C 44.9+/-3.5 15.5+/-0.1 28.5+/-3.8 2.3+/-<0.1
260 °C 48.2+/-1.1 10.9+/-1.3 29.4+/-0.6 2.4+/-0.3
280 °C 49.7+/-0.1 3.4+/-0.4 33.9+/-1.5 2.4+/-0.7
5.5.2. Apparatus: mass spectrometer syngas sampling
The details of the 75 mm diameter fluidized bed (FB) reactor are presented in Woytiuk et al.
(2017). However, several modifications to the gas sampling system were made to integrate the
mass spectrometer (Extrel Max300 EGA, US). The device is a process analyzer designed to
provide continuous gas analysis for chemical operations. It has a range of 0-250 atomic mass
units and is therefore capable of broader qualitative analysis compared to the gas chromatograph
used previously (4900 micro-GC, Agilent, US). Furthermore, unlike the gas chromatograph, the
mass spectrometer is capable of analyzing gas at high temperatures and without vapour
condensation. Therefore, the analyzer is capable of quantifying water vapour in the syngas and
heavy hydrocarbons that have a dewpoint greater than 200 °C. The mass spectrometer has an
analysis rate of 400 ms per component and provides continuous data on syngas composition.
Syngas is continuously sampled with a heated silica line during operation of the FBG through a
heated tee at the top of the gasifier freeboard. Figure 5.1 shows the sampling tee and mass
spectrometer (MS). A ceramic heater is placed above the tee shown in Figure 5.1 to maintain gas
temperatures above 200 °C. A detailed piping and instrumentation diagram of the reactor is
available elsewhere (Woytiuk et al. 2017). The modifications to the freeboard are shown as
Figure 5.2. The original gasifier design included a sampling port at the base of the freeboard
immediately above the expansion. However, samples taken along the freeboard wall were found
to have high particulate contamination. Gas for the MS is taken from the top of the freeboard
where particulates have dropped out of entrainment.
Syngas from the reactor is split into two streams at the top of the reactor. The sampling stream,
shown on the left of Figure 5.1, passes a tee where the mass spectrometer extracts a gas sample.
Any remaining particulates in the gas sample are removed by a 2 μm filter upstream of the
heated silica sampling line to the MS. The bulk flow then passes through two cartridge filters in a
cooling bath before samples are extracted at the gas chromatograph used in previous studies.
Flow through the loop is induced by a gas sampling pump (UN86, KNF Neuberger, DE). The
right bulk gas stream passes a cyclone and condenser before venting through a fume hood.
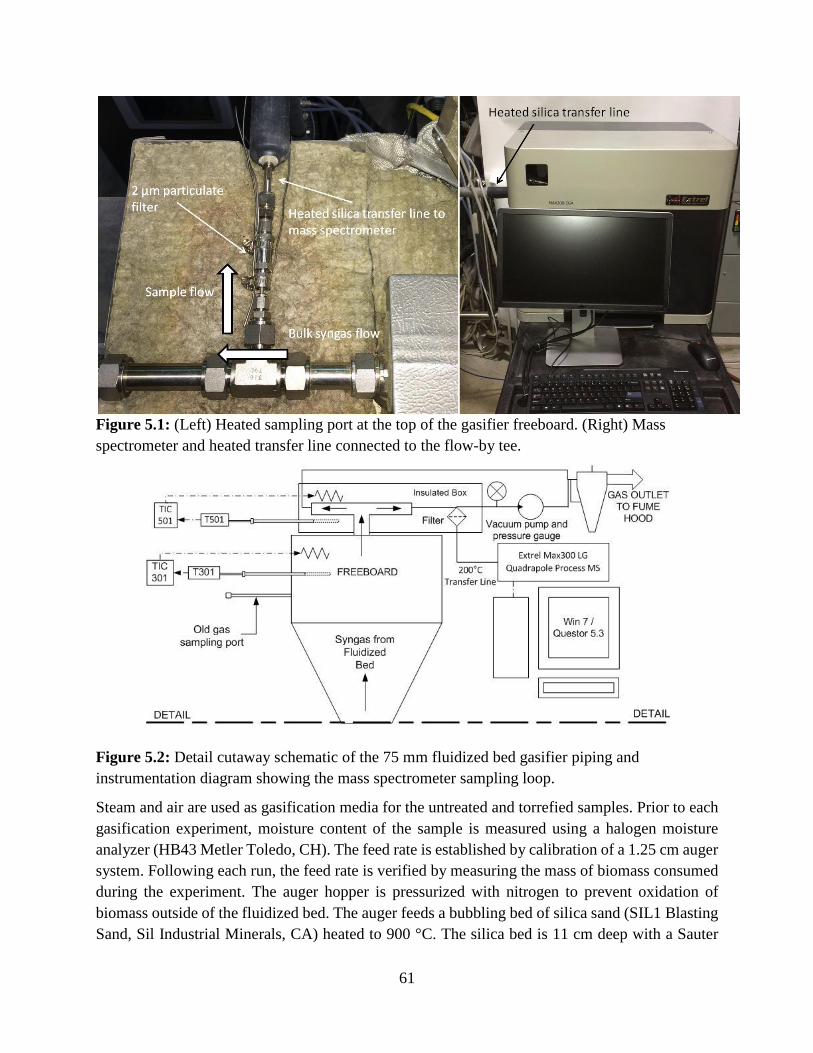
61
Figure 5.1: (Left) Heated sampling port at the top of the gasifier freeboard. (Right) Mass
spectrometer and heated transfer line connected to the flow-by tee.
Figure 5.2: Detail cutaway schematic of the 75 mm fluidized bed gasifier piping and
instrumentation diagram showing the mass spectrometer sampling loop.
Steam and air are used as gasification media for the untreated and torrefied samples. Prior to each
gasification experiment, moisture content of the sample is measured using a halogen moisture
analyzer (HB43 Metler Toledo, CH). The feed rate is established by calibration of a 1.25 cm auger
system. Following each run, the feed rate is verified by measuring the mass of biomass consumed
during the experiment. The auger hopper is pressurized with nitrogen to prevent oxidation of
biomass outside of the fluidized bed. The auger feeds a bubbling bed of silica sand (SIL1 Blasting
Sand, Sil Industrial Minerals, CA) heated to 900 °C. The silica bed is 11 cm deep with a Sauter
62
mean diameter of 250 μm and particle density of 2600 kg/m3. Steam is produced at the base of the
reactor by pumping water into an aluminum block heated to nominal 200 °C by heating tape. The
steam flowrate is determined such that the steam to biomass ratio is 0.5 accounting for the water
in the biomass. Air and nitrogen are used to maintain fluidization with a nominal equivalence ratio
(ER) of 0.10. The steam and air flowrates are adjusted for each experiment based on the moisture
and characteristics of each feedstock. Careful control of gas flow to establish a steady gas velocity
in the reactor is essential to isolating the effects of torrefaction on tar species formation. Table 5.2
shows the design and actual experimental conditions used in the experiments.
Table 5.2: Design and actual gasification conditions of three torrefied willow samples and the
control sample. Design conditions are based on biomass characterization data with actual
conditions (in brackets) determined following each experiment.
Parameter Untreated 240 °C 260 °C 280 °C
Feed rate, dry basis (g/s) 0.100(0.098) 0.100(0.099) 0.100(0.096) 0.100(0.096)
Bed Temperature (°C) 900(899) 900(894) 900(896) 900(893)
Steam (g/s) 0.044 0.049 0.049 0.048
Fluidization Air (g/s) 0.094 0.087 0.089 0.092
Fuel bound Oxygen (g/s) 0.041 0.041 0.039 0.036
Nitrogen* (g/s) 0.138 0.140 0.140 0.139
Equivalence Ratio 0.100(0.102) 0.100(0.102) 0.100(0.104) 0.100(0.104)
*the sum of compressed gas and atmospheric nitrogen
5.5.3. Syngas sampling sequence and analysis
The mass spectrometer software (Questor 5 v2.1, Extrel, US) is equipped with a sequence mode
of analysis. Two analysis modes were used in the sequence for these experiments; survey scan
and wet syngas analysis method. The wet syngas method measures the percent by volume
concentration of H2, CO, CO2, CH4, C2H4, C2H6, C3H8, C3H6, C2H2, O2, N2, H2O, and He on a
continuous basis. The survey scan mode measures the ion intensities across a specified range of
currents to produce a spectra of m/z ratio based on the intensity of the most abundant peak.
The sequence analysis mode was initiated after the first 10 minutes of operation to allow tuning
of the key peaks (m/z 78, m/z 91 and m/z 128). The sequence consisted of 2 minutes of wet
syngas analysis followed by three survey scans in the range of m/z 50-200. The spectra collected
from the survey scans are used to quantify the ion intensity of the four peaks of interest; m/z 78,
m/z 91, m/z 92 and m/z 128. The base peak for the complete scan is at m/z 78.
63
Following the experiment, the survey scan and gas analysis data was compiled and plotted to
determine when steady-state had occurred; data analysis was done for steady-state conditions.
Each experiment produces between 20 and 60 minutes of steady state data, depending on the
stability of the operation of the reactor. The runs are repeated three times for a total of between
618 and 752 data points for the syngas composition (wet syngas analysis method) and between
92 and 106 data points for the ion intensity measurements (survey scan results) for each sample.
The syngas effective heating value (or lower heating value) is calculated as the sum of the
measured gas composition multiplied by the compounds effective heating value at normal
temperature and pressure. The gas yields are calculated as the component fraction multiplied by
the ratio of the known N2 flowrate to the measured N2 composition. The actual biomass feed rate
shown in Table 5.2 is used to normalize the gas yields by mass of willow.
The mass of samples are reported on a dry, ash-free basis (daf) unless otherwise stated. All gas
volumes reported in this work are at normal temperature and pressure (20 °C and 101.3 kPa).
Each biomass sample is gasified in three independent runs with between 10 and 54 survey scans
and 70 and 375 gas composition measurements per experimental run. The error is the product of
the t-statistic and the standard deviation divided by the square root of the degrees of freedom of
the cumulative measurements from the three experimental runs. Reproducibility of torrefaction
conditions to produce feedstocks with equivalent characteristics within the reported
characterization error is assumed.
5.6. Results and discussion
5.6.1. Syngas yield and energy content
Table 5.3 shows the average syngas yield by mass of willow on a dry syngas basis. The table
shows an increase in H2, CO and total syngas yield between the untreated and torrefied samples.
A similar effect was observed in previous work and corroborated with Couhert et al. (Couhert et
al. 2009; Woytiuk et al. 2017). The total gas yield increased to a lesser extent than reported
previously. As measured by mass spectrometry, the total syngas yield increased by 12.1 (+/-0.2)
% compared to the untreated sample when torrefied at 280 °C. The change is most pronounced at
peak torrefaction temperatures greater than 240 °C. A 3.0 (+/-0.3) % decrease in syngas effective
heating value is consistent with the previous work.
The variation between the gas yield in Woytiuk et al. (2017) and Table 5.3 (for example, the H2
yield in Woytiuk et al. is 0.58 (+/-0.02) m3/kgdaf compared to 0.465 (+/-0.002) m3/kgdaf in Table
5.3) can be attributed to two factors. First, the equivalence ratio in the original work was 0.085
compared to 0.100 in this work. Greater oxidation of carbon and hydrogen in the willow into
CO2 and H2O results in lower concentrations of H2 and CO in the syngas. The small increase in
equivalence ratio also results in an increase in gas yield between the two experiments (2.47 (+/-
0.08) m3/kgdaf in Woytiuk et al. compared to 2.822 (+/-0.006) m3/kgdaf in Table 5.3 for willow
torrefied at 280 °C). Narvàez et al. (1996) reported on seven studies including their own showing
a positive correlation between ER and the syngas yield. In addition, the sampling position in the
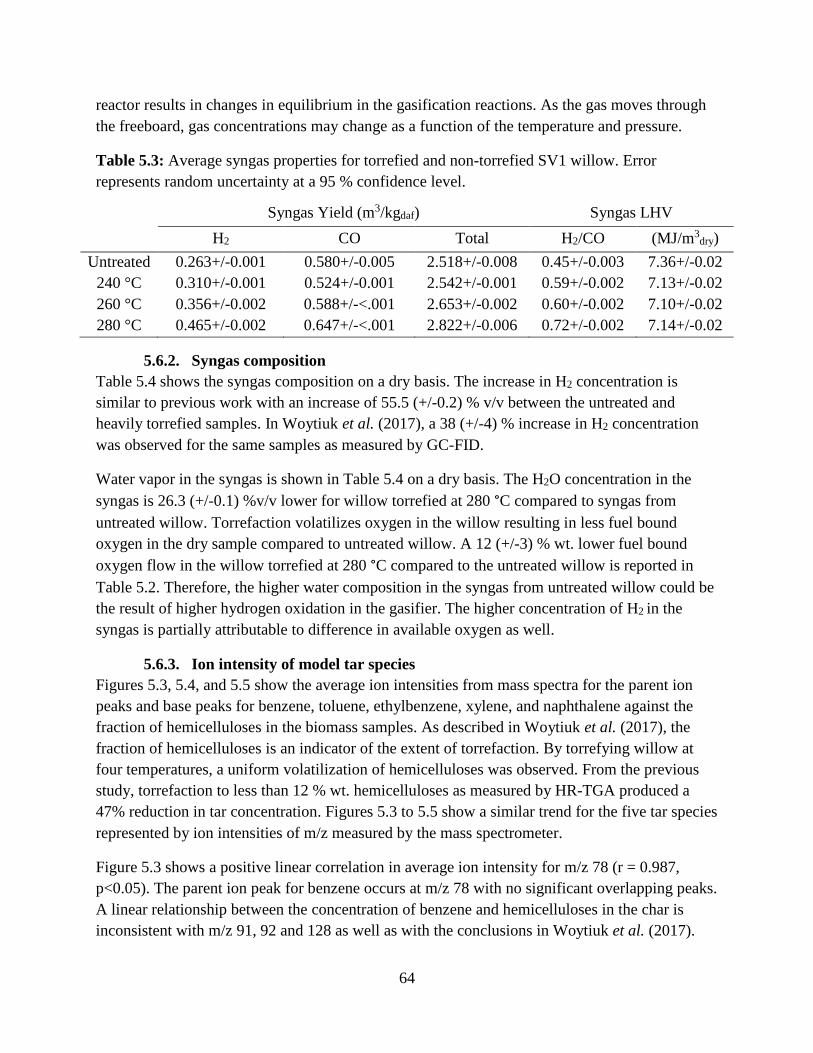
64
reactor results in changes in equilibrium in the gasification reactions. As the gas moves through
the freeboard, gas concentrations may change as a function of the temperature and pressure.
Table 5.3: Average syngas properties for torrefied and non-torrefied SV1 willow. Error
represents random uncertainty at a 95 % confidence level.
Syngas Yield (m3/kgdaf) Syngas LHV
H2 CO Total H2/CO (MJ/m3dry)
Untreated 0.263+/-0.001 0.580+/-0.005 2.518+/-0.008 0.45+/-0.003 7.36+/-0.02
240 °C 0.310+/-0.001 0.524+/-0.001 2.542+/-0.001 0.59+/-0.002 7.13+/-0.02
260 °C 0.356+/-0.002 0.588+/-<.001 2.653+/-0.002 0.60+/-0.002 7.10+/-0.02
280 °C 0.465+/-0.002 0.647+/-<.001 2.822+/-0.006 0.72+/-0.002 7.14+/-0.02
5.6.2. Syngas composition
Table 5.4 shows the syngas composition on a dry basis. The increase in H2 concentration is
similar to previous work with an increase of 55.5 (+/-0.2) % v/v between the untreated and
heavily torrefied samples. In Woytiuk et al. (2017), a 38 (+/-4) % increase in H2 concentration
was observed for the same samples as measured by GC-FID.
Water vapor in the syngas is shown in Table 5.4 on a dry basis. The H2O concentration in the
syngas is 26.3 (+/-0.1) %v/v lower for willow torrefied at 280 °C compared to syngas from
untreated willow. Torrefaction volatilizes oxygen in the willow resulting in less fuel bound
oxygen in the dry sample compared to untreated willow. A 12 (+/-3) % wt. lower fuel bound
oxygen flow in the willow torrefied at 280 °C compared to the untreated willow is reported in
Table 5.2. Therefore, the higher water composition in the syngas from untreated willow could be
the result of higher hydrogen oxidation in the gasifier. The higher concentration of H2 in the
syngas is partially attributable to difference in available oxygen as well.
5.6.3. Ion intensity of model tar species
Figures 5.3, 5.4, and 5.5 show the average ion intensities from mass spectra for the parent ion
peaks and base peaks for benzene, toluene, ethylbenzene, xylene, and naphthalene against the
fraction of hemicelluloses in the biomass samples. As described in Woytiuk et al. (2017), the
fraction of hemicelluloses is an indicator of the extent of torrefaction. By torrefying willow at
four temperatures, a uniform volatilization of hemicelluloses was observed. From the previous
study, torrefaction to less than 12 % wt. hemicelluloses as measured by HR-TGA produced a
47% reduction in tar concentration. Figures 5.3 to 5.5 show a similar trend for the five tar species
represented by ion intensities of m/z measured by the mass spectrometer.
Figure 5.3 shows a positive linear correlation in average ion intensity for m/z 78 (r = 0.987,
p<0.05). The parent ion peak for benzene occurs at m/z 78 with no significant overlapping peaks.
A linear relationship between the concentration of benzene and hemicelluloses in the char is
inconsistent with m/z 91, 92 and 128 as well as with the conclusions in Woytiuk et al. (2017).
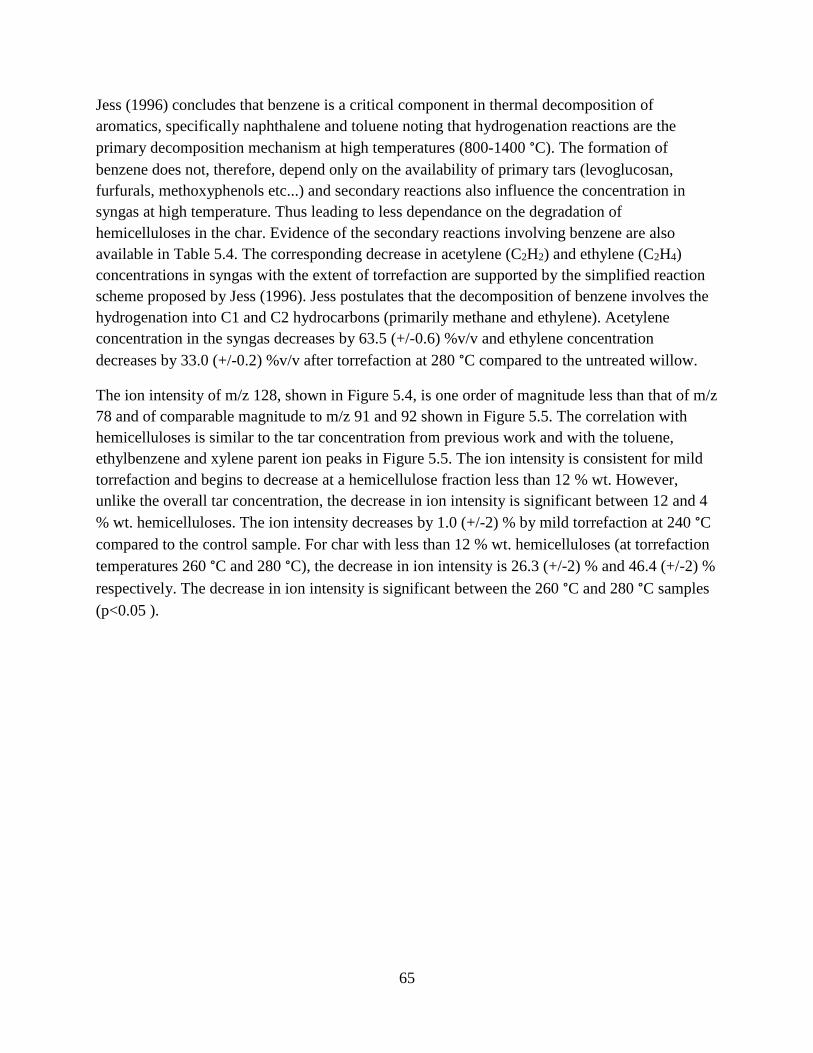
65
Jess (1996) concludes that benzene is a critical component in thermal decomposition of
aromatics, specifically naphthalene and toluene noting that hydrogenation reactions are the
primary decomposition mechanism at high temperatures (800-1400 °C). The formation of
benzene does not, therefore, depend only on the availability of primary tars (levoglucosan,
furfurals, methoxyphenols etc...) and secondary reactions also influence the concentration in
syngas at high temperature. Thus leading to less dependance on the degradation of
hemicelluloses in the char. Evidence of the secondary reactions involving benzene are also
available in Table 5.4. The corresponding decrease in acetylene (C2H2) and ethylene (C2H4)
concentrations in syngas with the extent of torrefaction are supported by the simplified reaction
scheme proposed by Jess (1996). Jess postulates that the decomposition of benzene involves the
hydrogenation into C1 and C2 hydrocarbons (primarily methane and ethylene). Acetylene
concentration in the syngas decreases by 63.5 (+/-0.6) %v/v and ethylene concentration
decreases by 33.0 (+/-0.2) %v/v after torrefaction at 280 °C compared to the untreated willow.
The ion intensity of m/z 128, shown in Figure 5.4, is one order of magnitude less than that of m/z
78 and of comparable magnitude to m/z 91 and 92 shown in Figure 5.5. The correlation with
hemicelluloses is similar to the tar concentration from previous work and with the toluene,
ethylbenzene and xylene parent ion peaks in Figure 5.5. The ion intensity is consistent for mild
torrefaction and begins to decrease at a hemicellulose fraction less than 12 % wt. However,
unlike the overall tar concentration, the decrease in ion intensity is significant between 12 and 4
% wt. hemicelluloses. The ion intensity decreases by 1.0 (+/-2) % by mild torrefaction at 240 °C
compared to the control sample. For char with less than 12 % wt. hemicelluloses (at torrefaction
temperatures 260 °C and 280 °C), the decrease in ion intensity is 26.3 (+/-2) % and 46.4 (+/-2) %
respectively. The decrease in ion intensity is significant between the 260 °C and 280 °C samples
(p<0.05 ).
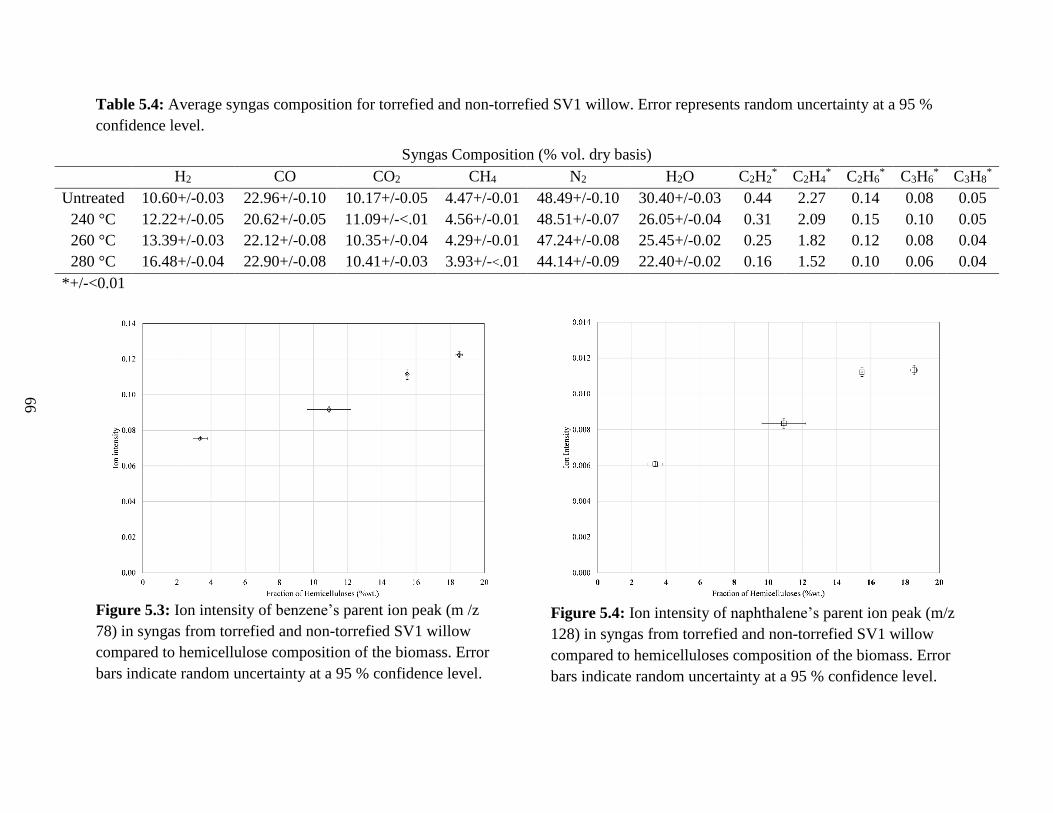
Table 5.4: Average syngas composition for torrefied and non-torrefied SV1 willow. Error represents random uncertainty at a 95 %
confidence level.
Syngas Composition (% vol. dry basis)
H2 CO CO2 CH4 N2 H2O C2H2* C2H4
* C2H6* C3H6
* C3H8*
Untreated 10.60+/-0.03 22.96+/-0.10 10.17+/-0.05 4.47+/-0.01 48.49+/-0.10 30.40+/-0.03 0.44 2.27 0.14 0.08 0.05
240 °C 12.22+/-0.05 20.62+/-0.05 11.09+/-<.01 4.56+/-0.01 48.51+/-0.07 26.05+/-0.04 0.31 2.09 0.15 0.10 0.05
260 °C 13.39+/-0.03 22.12+/-0.08 10.35+/-0.04 4.29+/-0.01 47.24+/-0.08 25.45+/-0.02 0.25 1.82 0.12 0.08 0.04
280 °C 16.48+/-0.04 22.90+/-0.08 10.41+/-0.03 3.93+/-<.01 44.14+/-0.09 22.40+/-0.02 0.16 1.52 0.10 0.06 0.04
*+/-<0.01
Figure 5.3: Ion intensity of benzene’s parent ion peak (m /z
78) in syngas from torrefied and non-torrefied SV1 willow
compared to hemicellulose composition of the biomass. Error
bars indicate random uncertainty at a 95 % confidence level.
Figure 5.4: Ion intensity of naphthalene’s parent ion peak (m/z
128) in syngas from torrefied and non-torrefied SV1 willow
compared to hemicelluloses composition of the biomass. Error
bars indicate random uncertainty at a 95 % confidence level.
66
67
Finally, Figure 5.5 shows the ion intensity of m/z 91 and 92. Hernández et al. (2013) have shown
xylene to be an abundant tar species in syngas from drop-tube gasification of marc of grape.
Therefore, Figure 5.5 is reported as all three tar compounds. The figure shows a weak correlation
between the ion intensity at m/z 91 and 92 and the fraction of hemicelluloses in the samples. The
change is -27 (+/-2) % for both m/z 91 and 92 at the heavily torrefied condition as a percent
difference of the untreated sample. The change is significant only once the fraction of
hemicelluloses is less than 12 %wt. consistent with m/z 128.
Figure 5.5: Ion intensity of toluene’s parent ion peak (m/z 92) and the base peak for toluene,
ethylene, and xylene (m/z 91) in syngas from torrefied and non-torrefied SV1 willow compared
to hemicellulose composition of the biomass. Error bars indicate random uncertainty at a 95 %
confidence level.
During torrefaction, the volatilization of hemicelluloses is significant. For example, at
torrefaction temperatures of 280 °C for 10 minutes, 82 (+/-2) %wt. of hemicelluloses are
volatilized. During gasification, some of the primary tars associated with hemicelluloses are no
longer available as precusors of aromatics (benzene and naphthalene). The alkyl tertiary tars are
formed by derivative reactions with benzene. Fewer primary tars are available to participate in
formation of simple aromatics (benzene and naphthalene) and any available methyl radicals bond
68
readily to the available aromatics resulting in a weaker correlation between hemicelluloses and
alkyl tertiary tars (toluene, xylene, and ethylbenzene).
5.7. Conclusions
Syngas from fluidized bed gasification was analyzed in real-time by mass spectrometry using a
survey scan to investigate a range of m/z between 50 and 200 and a wet syngas method to
measure syngas composition. Torrefaction is used as a pretreatment for gasification of coppice
willow in a bubbling fluidized bed with steam and air. The characteristic volatilization of
hemicelluloses associated with torrefaction correlates positively with alkyl tertiary and
condensed tertiary tars represented by BTEX species and naphthalene. However, the
volatilization of primary tars during torrefaction results in fewer available precursors to
aromatics during gasification. The available alkyl functional groups bond readily with the
aromatics and the correlation between alkyl tertiary tars (toluene, ethylbenzene, xylene) and
hemicelluloses is weakened. Some specific conclusions from the research work are as follows:
Ion intensity measured by mass scanning the quadrupole in a process mass spectrometer shows
that the relative change in the quantity of naphthalene, toluene, ethylbenzene and xylene is
comparable to tar concentration measurements quantified as the difference between flame-
ionization detection (total hydrocarbon analysis) for all hydrocarbon components and gas
chromatography with a flame-ionization detector for gaseous components.
The effective heating value of torrefied willow is consistently lower than the effective heating
value of untreated SV1 willow. The extent of torrefaction has no observable effect on the heating
value of the syngas.
Syngas from torrefied SV1 willow contains less water vapour than syngas from non-torrefied
SV1 willow.
It was found that the ion intensity values for benzene in syngas, measured by mass spectrometry,
has a positive linear correlation with the fraction of hemicelluloses resulting from torrefaction of
SV1 willow measured by HR-TGA.
Ion intensity of naphthalene measured by mass spectrometry decreases when hemicelluloses are
volatilized by torrefaction to less than 12 %wt. of the total macromolecular composition of
willow.
The data produced in this work is important for the development of feedback control strategies
for advanced biomass. An established relationship between the extent of a biomass treatment
technology such as torrefaction and energy system metrics, such as the quantity of tar species in
syngas will contribute to the control of torrefaction plants and other biorefining facilities.

69
5.8. References
Abatzoglou, N., Dalai, A., Gitzhofer, F., Markatos, N., Stamou, A., and Beltrao, J. 2007. Green
diesel from Fischer–Tropsch synthesis: Challenges and hurdles. Paper presented at the 3rd
IASME/WSEAS international conference on energy, environment, ecosystems and
sustainable development, July 24-26, Agios Nikolaos, Greece.
Bergman, P.C., Boersma, A., Zwart, R., and Kiel, J. 2005. Torrefaction for biomass co-firing in
existing coal-fired power stations. Energy Centre of Netherlands, Report no.ECN-C-05-013.
Couhert, C., Salvador, S., and Commandré, J. 2009. Impact of torrefaction on syngas production
from wood. Fuel 88 (11): 2286-90.
Dudyński, M., van Dyk, J.C., Kwiatkowski, K., and Sosnowska, M. 2015. Biomass gasification:
Influence of torrefaction on syngas production and tar formation. Fuel Processing
Technology 131: 203-12.
Felfli, F.F., Luengo, C.A., and Rocha, J.D. 2005. Torrefied briquettes: Technical and economic
feasibility and perspectives in the Brazilian market. Energy for Sustainable Development 9
(3): 23-9.
Hernández, J., Ballesteros, R., and Aranda, G. 2013. Characterisation of tars from biomass
gasification: Effect of the operating conditions. Energy 50: 333-42.
Holland, R., Eigenbrod, F., Muggeridge, A., Brown, G., Clarke, D., and Taylor, G. 2015. A
synthesis of the ecosystem services impact of second generation bioenergy crop production.
Renewable and Sustainable Energy Reviews 46: 30-40.
Jess, A. 1996. Mechanisms and kinetics of thermal reactions of aromatic hydrocarbons from
pyrolysis of solid fuels. Fuel 75 (12): 1441-8.
Lin, C., Wey, M., and Cheng, H. 2004. Relationship between pressure fluctuations and
generation of organic pollutants with different particle size distributions in a fluidized bed
incinerator. Chemosphere 56 (10): 911-22.
Macklin, A. 2015. Advanced energy: OPG Thunder Bay, OPG turns to advanced biomass for
energy production. Canadian Biomass Magazine. December 1.
Mastral, A.M., and Callen, M.S. 2000. A review on polycyclic aromatic hydrocarbon (PAH)
emissions from energy generation. Environmental Science and Technology 34 (15): 3051-7.
Milne, T.A., Abatzoglou, N., and Evans, R.J. 1998. Biomass gasifier "tars": Their nature,
formation and conversion NREL/TP-570-25357. Golden, CO, USA
Morf, P., Hasler, P., and Nussbaumer, T. 2002. Mechanisms and kinetics of homogeneous
secondary reactions of tar from continuous pyrolysis of wood chips. Fuel 81 (7): 843-53.
Narvaez, I., Orio, A., Aznar, M.P., and Corella, J. 1996. Biomass gasification with air in an
atmospheric bubbling fluidized bed. Effect of six operational variables on the quality of the
produced raw gas. Industrial and Engineering Chemistry Research 35 (7): 2110-20.
70
Prins, M.J., Ptasinski, K.J., and Janssen, F.J.J.G. 2006. More efficient biomass gasification via
torrefaction. Energy 31 (15): 3458-70.
Reinikainen, M., Thomas, D., Simell, P., and Hannula, I. 2015. Pure aromatics from biomass.
Paper presented at Biorefinery I: Chemicals and Materials from Thermo-Chemical Biomass
Conversion and Related Processes, Chania (Crete), Greece.
Serapiglia, M.J., Cameron, K.D., Stipanovic, A.J., and Smart, L.B. 2009. Analysis of biomass
composition using high-resolution thermogravimetric analysis and percent bark content for
the selection of shrub willow bioenergy crop varieties. BioEnergy Research (1-2): 1-9.
Serapiglia, M.J., Gouker, F., Hart, J.F., Unda, F., Mansfield, S.D., Stipanovic, A.J., et al. 2015.
Ploidy level affects important biomass traits of novel shrub willow (Salix) hybrids.
BioEnergy Research 8 (1): 259-69.
Skoog, D.A., and West, D.M. 1980. Principles of instrumental analysis. Vol. 158 Saunders
College Philadelphia.
Smook, G.A., and Kocurek, M.J. 1982. Handbook for pulp and paper technologists TAPPI;
Canadian Pulp and Paper Association.
van der Drift, B. 2014. Bio-aromatics from gasification. ECN-L--14-030 Energy Research
Center of the Netherlands, Petten, NL.
Williams, D.H., and Fleming, I. 1980. Spectroscopic methods in organic chemistry McGraw-
Hill. New York, NY
Woytiuk, K., Campbell, W., Gerspacher, R., Evitts, R.W., and Phoenix, A. 2017. The effect of
torrefaction on syngas quality metrics from fluidized bed gasification of SRC willow.
Renewable Energy 101C: 409-17.
Yan, W., Acharjee, T.C., Coronella, C.J., and Vásquez, V.R. 2009. Thermal pretreatment of
lignocellulosic biomass. Environmental Progress and Sustainable Energy 28 (3): 435-40.
Yang, H., Yan, R., Chen, H., Lee, D.H., and Zheng, C. 2007. Characteristics of hemicellulose,
cellulose and lignin pyrolysis. Fuel 86 (12): 1781-8.
71
6. Life-cycle assessment of torrefied coppice willow co-firing and co-
combustion with lignite coal in an existing pulverized coal boiler
6.1. Preface
Originally developed in 2011, chapter 6 was proposed by the co-authors to evaluate co-firing of
plantation willow with coal in the Boundary Dam generating station. Comparison of co-firing
biomass with the carbon capture and storage (CCS) project was just as relevant then as it is
today. The CCS project is a costly carbon reduction strategy and the carbon sequestration
modeling by Dr. Beyhan Amichev showed the potential for greater bioenergy integration in
Saskatchewan. The co-firing LCA proposed by Dr. David Sanscartier, extends the work of Dr.
Amichev by demonstrating the plantation to generating station emissions for a complete 23-year
life-cycle of willow plantations. Starting in 2015, my contribution to the work was to develop an
alternative pathway in the form of indirect co-firing of willow with coal. This included
integrating data collected for chapters 3, 4, and 5 of the thesis, verifying and modifying data and
assumptions from the original model, developing assumptions and performance criteria for the
gasification system, and writing the chapter. Chapter 6 uses data collected through my work
(chapters 3-5) to demonstrate a potential application for syngas from SRC willow in
Saskatchewan. The specific results relating to torrefied willow are used in the model to
demonstrate the effects torrefaction has on emissions via both direct and indirect co-firing.
The manuscript presented in Chapter 6 has been submitted for publication in the journal
Biofuels, Bioproducts, and Biorefining. The assistance of co-authors on the paper is greatly
appreciated. The co-authors were Dr. David Sanscartier P.Eng., William Campbell MSc, P.Eng,
Dr. Beyhan Amichev, and Dr. Ken Van Rees. Dr. David Sanscartier made a substantial
contribution to this work by developing the original LCA model for co-firing. He provided
methodological and critical evaluation of the indirect co-firing pathway and made significant
contributions to the manuscript. These include Figure 6.1, Table 6.3, and Figure 6.4. Bill
Campbell provided valuable manuscript editing and review. Dr. Beyhan Amichev provided
access to his data and maps (including Figure 6.3) and reviewed the manuscript. Dr. Ken Van
Rees provided detailed manuscript review. All other contributions to the paper including the
indirect co-firing pathway development, model analysis, literature review, model interpretation,
and preparation of the manuscript are my unique contributions to this work.
6.2. Abstract
Coal-fired electricity generation is a major emitter of greenhouse gases (GHG) in Canada and the
federal government has taken steps towards mandated reduction in GHG emissions. One
pathway to reduced emissions is via co-firing of coal with short-rotation coppice (SRC) willow
grown on marginal land in Saskatchewan. This study uses a life-cycle inventory model to
investigate the GHG emissions from nine scenarios for electricity generation with willow pellets
at a retrofitted generating station in Saskatchewan. Torrefied and non-torrefied willow pellets
72
from SRC plantations in the Prairie and Boreal Plains ecozones are considered. Direct co-firing
of pellets and indirect co-firing via a circulating fluidized bed gasifier are modeled. The model
output shows cumulative, levelized, and disaggregated GHG emissions. The scenarios account
for the plantation establishment period required to reach a co-firing ratio of 40 % by energy
input. Torrefied and non-torrefied willow pellets grown in the Prairie ecozone indirectly co-fired
with lignite coal result in 43 % and 47 % net cumulative GHG emissions reduction compared to
the existing coal fired pathway over the entire life of the willow plantation. Direct co-firing of
the same feedstocks results in a 34 % and 31 % reduction in GHG emissions, respectively. The
difference between the direct and indirect pathway is attributed to greater carbon sequestration in
the larger willow plantation required for indirect co-firing. Co-firing is a technically viable
option for reducing GHG emissions from electricity generation on a life-cycle basis.
6.3. Introduction
The Canadian government is attempting to reduce carbon (C) emissions across the country. One
major action is to reduce the emissions from electricity generation by implementing a
performance standard of 420 g of carbon dioxide-equivalent per 1 kilo Watt-hour of energy
(CO2-eq /kWh) from coal fired power stations based on the performance of a natural gas
combined cycle power station (Government of Canada 2015). This regulation will have the
greatest effect on the prairie provinces of Alberta and Saskatchewan that still derive large
amounts of electricity from abundant coal resources.
The Province of Saskatchewan has pursued carbon capture and storage (CCS) to reduce coal-
derived C emissions below the federally mandated target (Government of Saskatchewan). The
post-combustion carbon capture unit was installed on Unit 3 of Boundary Dam (BD), the largest
and oldest coal fired generating station in Saskatchewan. The 115 MW system was designed to
capture 1 million tonnes of CO2 per year (90 % of the unit’s total emissions). The captured CO2
is transported via pipeline to nearby oilfields for use in enhanced oil recovery. The CCS system
began operation in 2014 and in 2015 captured approximately 400,000 metric tonnes of CO2. At a
cost of $1.24 billion CDN ($0.9 billion USD, Nov/2016), the project is controversial because few
similar sized successful projects exist and the technology does not discourage increased use of
low quality lignite coal for electricity generation.
Co-firing biomass with coal represents an alternative near-term opportunity to significantly
reduce the CO2 emissions from the generation of electricity, while offering a technology that is
complementary rather than purely competitive with CCS. When combined with CCS, biomass
combustion has been presented as the only pathway that can produce net-negative CO2 emissions
(International Energy Agency 2011; Lempp 2013).
A number of different technologies have been employed to retrofit existing pulverized coal
power stations to accommodate biomass combustion. These can be categorized as direct,
parallel, and indirect methods (Van Loo and Koppejan 2008a; Koppejan et al. 2012). Direct co-
firing refers to mixing biomass and coal during the feedstock preparation stage and burning the
73
mixture in a retrofitted coal boiler. Parallel co-firing involves an adjacent boiler fired with
biomass supplying steam to the coal boiler power cycle. Finally, indirect co-firing involves the
production of syngas from biomass in a gasifier adjacent to the boiler. The syngas is
subsequently burned in a retrofitted coal boiler. Each method has strengths and weaknesses
specific to the site, available material and type of coal-fired power station. Parallel co-firing
typically involves high capital investment and is used for biomass sources that are not suited to
coal boilers (e.g., agricultural residues). Therefore, only the direct and indirect co-firing methods
are considered in this current study.
Many researchers have reported the successful, industrial-scale direct and indirect co-firing of
biomass with coal. As of 2011, as many as 230 coal generating stations globally had experience
with co-firing, or intended to do so, using one of the three methods for coal and biomass co-
firing (Lempp 2013). Many early trials utilized waste products. Granatstein (2002b; 2002a)
reported results from two indirect co-firing projects in Europe on behalf of the International
Energy Agency. Both facilities indirectly co-fired biomass and refuse derived fuel (RDF) via a
circulating fluidized bed (CFB) gasifier. CFB gasification has the benefit of excellent mixing
characteristics, good scalability, and a wide range of acceptable feedstocks (Borman and Ragland
1998). At the Finnish facility, Granatstein (2002b) reported a decrease in NOx, SOx, and
particulate emissions as a result of the modifications. Improved NOx performance is confirmed
by Van Loo and Koppejan (2008a), and was attributed to the larger fuel-rich region near the
burner compared to coal alone. Basu et al. (2011) studied the economics of three distinct
strategies of co-firing and concluded that direct co-firing produced the highest internal rate of
return with lower costs per tonne of CO2 saved compared to CCS. Mann and Spath (2002)
studied the emissions from power generation using both dedicated woody biomass and urban
biomass residues for five electricity generation pathways. They compared integrated gasification
combined cycle (IGCC) burning hybrid poplar (Populus spp.) biomass, conventional pulverized
coal, co-firing of a coal-biomass mixture at 15 % biomass by heat input, direct fired urban
biomass residues, and natural gas combined cycle (Mann and Spath 2002). Biomass residues
alone produced net negative global warming potential (GWP), reported as gCO2eq/kWh, while
the dedicated IGCC plant produced very low emissions (<100 gCO2eq/kWh). Mann and Spath
(2002) attributed the low life-cycle emissions to the carbon sequestered in the hybrid poplar
plantation. Finally, Tsaladis et al. (2014) conducted a life-cycle assessment considering direct
co-firing of torrefied and non-torrefied pellets with hard coal in the Netherlands. A 12 %
reduction in GWP was modeled for torrefied Dutch pellets co-fired with coal at a coal-to-
biomass ratio of 20 % by energy.
The ratio of raw biomass to coal for direct co-firing applications is limited to around 10 %
(2008b). Pulverized coal units generally use a high maximum flame temperature (greater than
typical wood ash melting temperatures). Pulverization of biomass at a high co-firing ratio is also
problematic due to the fibrous characteristics of wood. Finally, the highly oxygenated
74
composition of wood compared to coal results in a rapid burnout of the solid fuel and thereby
lower temperatures in the re-burn and economizer sections of the boiler.
Torrefied biomass, on the other hand, is marketed as a drop-in coal replacement in coal burning
systems without modifications (Sherrard 2014; Diacarbon 2017). Torrefaction is a low-
temperature thermal treatment that partially carbonizes biomass (Basu 2013). The char resulting
from torrefaction is more brittle, hydrophobic and energy dense than the untreated biomass
(Bergman and Kiel 2005). The increased concentration of minerals, particularly in non-woody
torrefied biomass, is likely to impact typical hard coal fired combustion systems. Additionally,
volatile constituents (primarily silica, chlorine, and sulphur) provide improved transport for coal
ash onto heat transfer surfaces and increase fouling in the boiler (Van Loo and Koppejan 2008a).
Indirect co-firing of biomass has several benefits over direct co-firing. The benefits include: (1)
separate biomass handling equipment, (2) minor modifications to existing infrastructure, and (3)
an extended lifespan for the biofuels facility distinct from the expected lifespan of the coal power
plant. Incorporating and mixing solid fuels (lignite and SRC willow) can be difficult and costly,
particularly in pulverized coal systems that were not designed for biomass. Keeping biomass
handling systems on an adjacent site enables optimization of handling for both coal and biomass
(Granatstein 2002b). Furthermore, the modifications to the existing boiler could occur within a
regular shutdown cycle and would not require the lengthy shutdown that may be required for the
direct co-firing scenario. Finally, with careful design consideration, the gasifier may be
repurposed following the decommissioning of an aging pulverized coal boiler. The risks
associated with major upgrades to old power infrastructure are thereby reduced. On the other
hand, the gasifier is likely to require greater capital investment and additional operators with
specialized training.
Dedicated energy plantations have been utilized for decades in Europe and parts of North
America. Although hybrid poplar is one of the primary woody crops in Canada (Van Oosten
2006; Welham et al. 2007), short-rotation coppice (SRC) willow (Salix spp.) has been identified
as a potential biomass source for the Prairie ecozone where most of Saskatchewan’s power
generation stations are located (Hangs 2014). Amichev et al. (2012) identified approximately 2
million hectares of marginal land across the Province with the potential to grow coppice willow
in both the Prairie and Boreal Plains ecozones. Agriculturally marginal lands are defined as
agricultural land classes 4 and 5 which are not suitable for annual food or forage crop growth but
are agriculturally manageable. Despite the availability of unutilized marginal land in
Saskatchewan, the lack of a suitable market for SRC willow biomass feedstock has impeded the
large-scale implementation of willow plantations in the province. Co-firing of plantation willow
with coal therefore, remains an emerging technology in the region.
Short rotation coppice willow plantations are typically established with 15,000 stools/ha and
coppiced after 1 year of growth (Abrahamson et al. 2010). Coppicing is the cutting back of the
stem which promotes the growth of a higher number of stems from a single stool. Harvest of the
75
willow typically occurs three years after coppicing. Subsequent harvests occur on a three-year
cycle and yield begins to decline after 7 cycles (21 years after coppicing). The resulting average
willow biomass yield can vary significantly throughout the life-cycle of the plantation and
depends on the willow clone and growing conditions (Amichev et al. 2015). Willow harvest
occurs in the winter, which allows for an indirect limitation of the herbaceous biomass (leaves
and new growth) from entering the fuel cycle.
Although life-cycle assessment (LCA) methodology has been applied to SRC willow plantations
for co-firing in the past (Ney and Schnoor 2002; Heller et al. 2004), the life-cycle GHG
emissions reduction potential of co-firing with willow biomass in Saskatchewan is not well
understood. In particular, most studies assume an average yield over the life-cycle of the willow
plantation. Since no large-scale SRC willow plantations currently operate in Saskatchewan, a
significant period of establishment would be required prior to achieving full yield of the
plantations. A recent study has identified the timing of GHG mitigation strategies to be
significant to decision makers, particularly for land-based renewable energy projects, where land
use changes and land management practices have a large impact on emissions (McKechnie and
MacLean 2014). As decisions are made to meet the performance standard set out in government
policy, or by international governing bodies such as the Intergovernmental Panel on Climate
Change (IPCC), any delayed or poorly understood emissions reduction measures could be costly
or ineffective in reducing GHG emissions. Furthermore, most LCAs assume carbon neutrality of
the plantations in determining the offset of CO2 (Zhang et al. 2010). The carbon from biomass
burned in the boiler is assumed to be immediately offset by the plantation and the biogenic
carbon fluxes are not considered. In fact, in Canadian federal regulations for coal power
generation, electricity generated from biomass is excluded from the calculation of emissions (i.e.,
biomass is assumed to be carbon neutral) (Government of Canada 2015). Changes in plant
growth and land use, leaf-litter, die-back, and harvesting operations, are all parts of a dynamic
managed ecosystem characterized with a variable carbon flux. When combined with the carbon
costs during the plantation establishment period, the question of biomass as a net-neutral energy
source must be carefully considered.
In this study the potential GHG emissions reduction of SRC willow plantations for co-firing with
lignite coal in Saskatchewan is examined. The CO2 emissions reduction potential is based on the
creation of demand for the feedstock (i.e., once the decision to co-fire has been made). SRC
willow is assumed to be the sole source of available biomass feedstock for co-firing despite the
availability of agricultural residues. The research work estimates the GHG emissions reductions
associated with the establishment of willow plantations and investigates the net-neutrality of
establishing a plantation on marginal agricultural lands in Saskatchewan for the purpose of
electricity generation. Finally, the study investigates the carbon emissions of indirect co-firing in
an adjacent circulating fluidized bed gasifier compared to direct co-firing of solid biomass fuel.
Biogenic CO2 emissions from willow are reported separately regardless of the scenario.
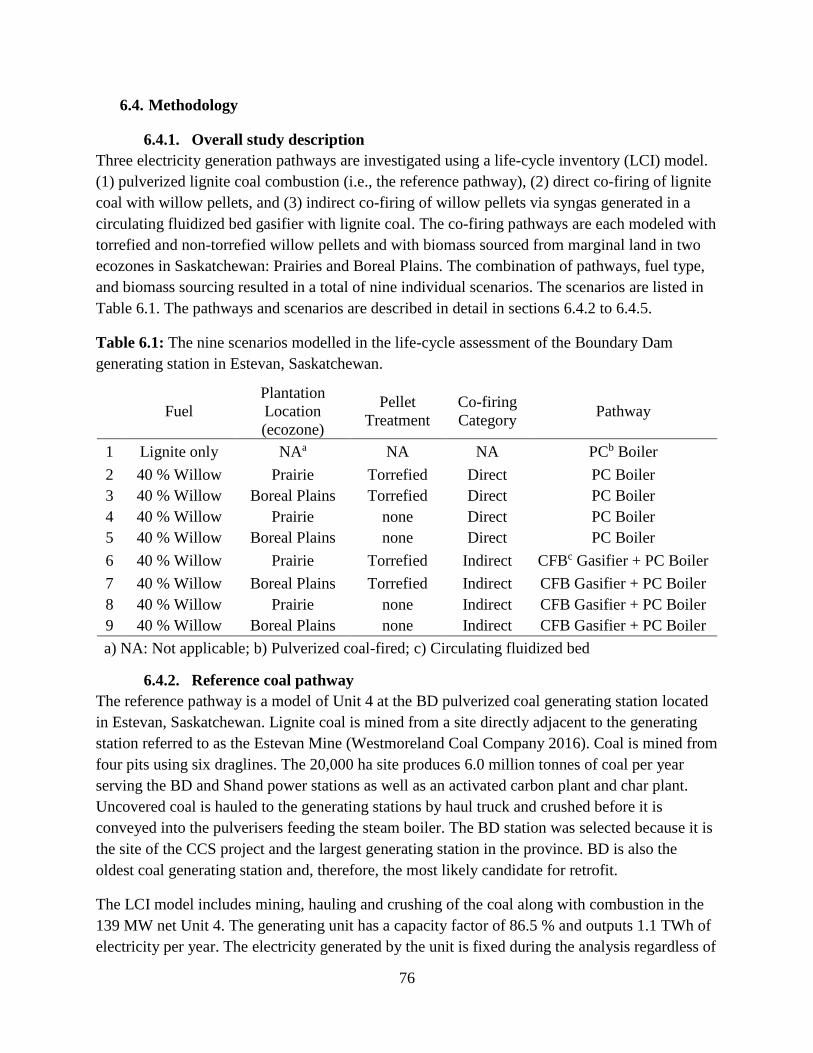
76
6.4. Methodology
6.4.1. Overall study description
Three electricity generation pathways are investigated using a life-cycle inventory (LCI) model.
(1) pulverized lignite coal combustion (i.e., the reference pathway), (2) direct co-firing of lignite
coal with willow pellets, and (3) indirect co-firing of willow pellets via syngas generated in a
circulating fluidized bed gasifier with lignite coal. The co-firing pathways are each modeled with
torrefied and non-torrefied willow pellets and with biomass sourced from marginal land in two
ecozones in Saskatchewan: Prairies and Boreal Plains. The combination of pathways, fuel type,
and biomass sourcing resulted in a total of nine individual scenarios. The scenarios are listed in
Table 6.1. The pathways and scenarios are described in detail in sections 6.4.2 to 6.4.5.
Table 6.1: The nine scenarios modelled in the life-cycle assessment of the Boundary Dam
generating station in Estevan, Saskatchewan.
Fuel
Plantation
Location
(ecozone)
Pellet
Treatment
Co-firing
Category Pathway
1 Lignite only NAa NA NA PCb Boiler
2 40 % Willow Prairie Torrefied Direct PC Boiler
3 40 % Willow Boreal Plains Torrefied Direct PC Boiler
4 40 % Willow Prairie none Direct PC Boiler
5 40 % Willow Boreal Plains none Direct PC Boiler
6 40 % Willow Prairie Torrefied Indirect CFBc Gasifier + PC Boiler
7 40 % Willow Boreal Plains Torrefied Indirect CFB Gasifier + PC Boiler
8 40 % Willow Prairie none Indirect CFB Gasifier + PC Boiler
9 40 % Willow Boreal Plains none Indirect CFB Gasifier + PC Boiler
a) NA: Not applicable; b) Pulverized coal-fired; c) Circulating fluidized bed
6.4.2. Reference coal pathway
The reference pathway is a model of Unit 4 at the BD pulverized coal generating station located
in Estevan, Saskatchewan. Lignite coal is mined from a site directly adjacent to the generating
station referred to as the Estevan Mine (Westmoreland Coal Company 2016). Coal is mined from
four pits using six draglines. The 20,000 ha site produces 6.0 million tonnes of coal per year
serving the BD and Shand power stations as well as an activated carbon plant and char plant.
Uncovered coal is hauled to the generating stations by haul truck and crushed before it is
conveyed into the pulverisers feeding the steam boiler. The BD station was selected because it is
the site of the CCS project and the largest generating station in the province. BD is also the
oldest coal generating station and, therefore, the most likely candidate for retrofit.
The LCI model includes mining, hauling and crushing of the coal along with combustion in the
139 MW net Unit 4. The generating unit has a capacity factor of 86.5 % and outputs 1.1 TWh of
electricity per year. The electricity generated by the unit is fixed during the analysis regardless of
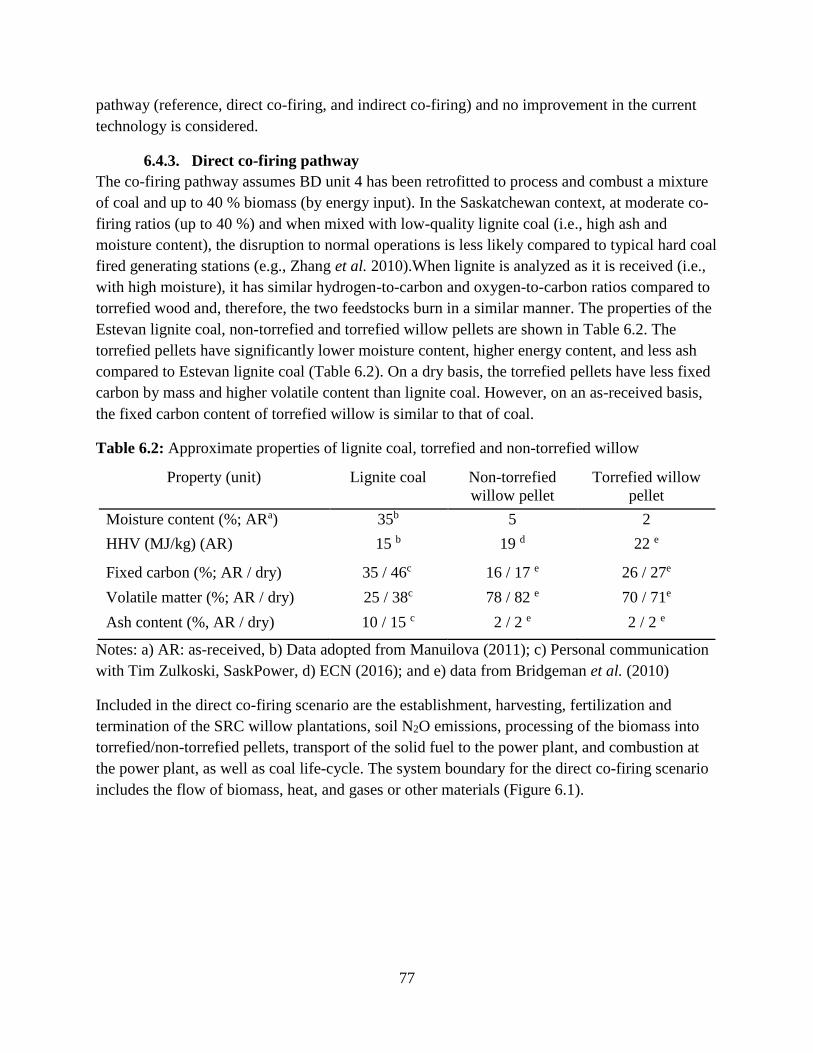
77
pathway (reference, direct co-firing, and indirect co-firing) and no improvement in the current
technology is considered.
6.4.3. Direct co-firing pathway
The co-firing pathway assumes BD unit 4 has been retrofitted to process and combust a mixture
of coal and up to 40 % biomass (by energy input). In the Saskatchewan context, at moderate co-
firing ratios (up to 40 %) and when mixed with low-quality lignite coal (i.e., high ash and
moisture content), the disruption to normal operations is less likely compared to typical hard coal
fired generating stations (e.g., Zhang et al. 2010).When lignite is analyzed as it is received (i.e.,
with high moisture), it has similar hydrogen-to-carbon and oxygen-to-carbon ratios compared to
torrefied wood and, therefore, the two feedstocks burn in a similar manner. The properties of the
Estevan lignite coal, non-torrefied and torrefied willow pellets are shown in Table 6.2. The
torrefied pellets have significantly lower moisture content, higher energy content, and less ash
compared to Estevan lignite coal (Table 6.2). On a dry basis, the torrefied pellets have less fixed
carbon by mass and higher volatile content than lignite coal. However, on an as-received basis,
the fixed carbon content of torrefied willow is similar to that of coal.
Table 6.2: Approximate properties of lignite coal, torrefied and non-torrefied willow
Property (unit) Lignite coal Non-torrefied
willow pellet
Torrefied willow
pellet
Moisture content (%; ARa) 35b 5 2
HHV (MJ/kg) (AR) 15 b 19 d 22 e
Fixed carbon (%; AR / dry) 35 / 46c 16 / 17 e 26 / 27e
Volatile matter (%; AR / dry) 25 / 38c 78 / 82 e 70 / 71e
Ash content (%, AR / dry) 10 / 15 c 2 / 2 e 2 / 2 e
Notes: a) AR: as-received, b) Data adopted from Manuilova (2011); c) Personal communication
with Tim Zulkoski, SaskPower, d) ECN (2016); and e) data from Bridgeman et al. (2010)
Included in the direct co-firing scenario are the establishment, harvesting, fertilization and
termination of the SRC willow plantations, soil N2O emissions, processing of the biomass into
torrefied/non-torrefied pellets, transport of the solid fuel to the power plant, and combustion at
the power plant, as well as coal life-cycle. The system boundary for the direct co-firing scenario
includes the flow of biomass, heat, and gases or other materials (Figure 6.1).
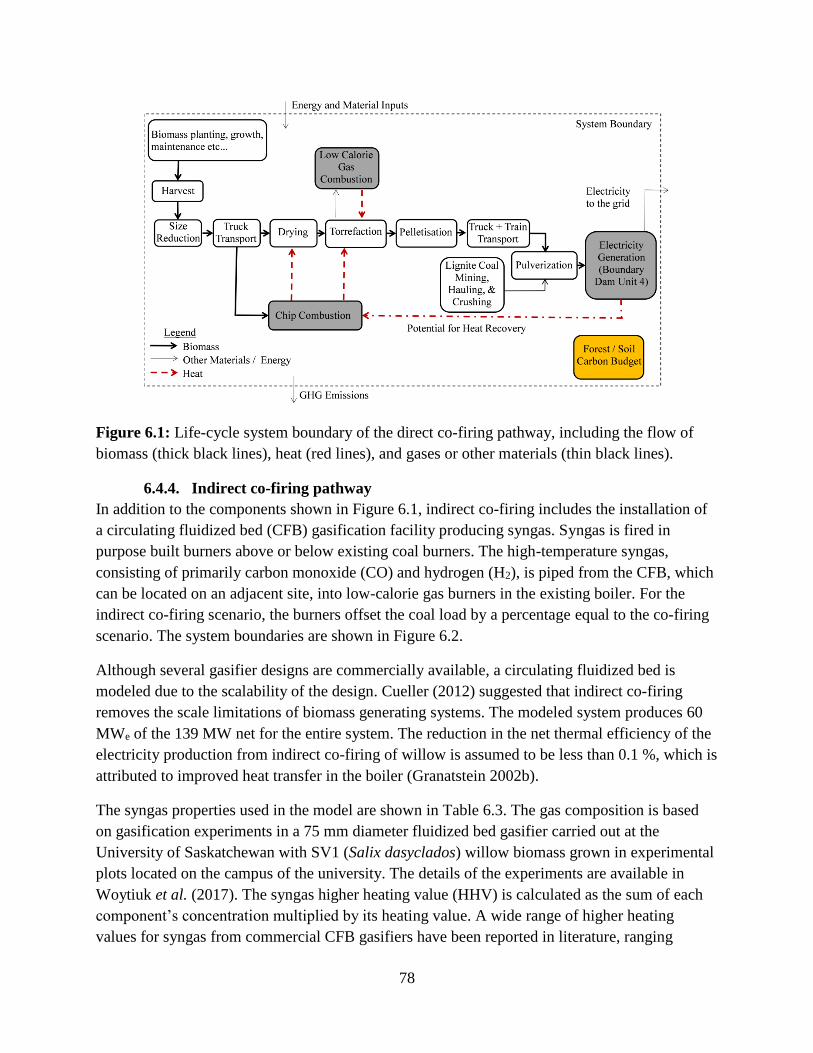
78
Figure 6.1: Life-cycle system boundary of the direct co-firing pathway, including the flow of
biomass (thick black lines), heat (red lines), and gases or other materials (thin black lines).
6.4.4. Indirect co-firing pathway
In addition to the components shown in Figure 6.1, indirect co-firing includes the installation of
a circulating fluidized bed (CFB) gasification facility producing syngas. Syngas is fired in
purpose built burners above or below existing coal burners. The high-temperature syngas,
consisting of primarily carbon monoxide (CO) and hydrogen (H2), is piped from the CFB, which
can be located on an adjacent site, into low-calorie gas burners in the existing boiler. For the
indirect co-firing scenario, the burners offset the coal load by a percentage equal to the co-firing
scenario. The system boundaries are shown in Figure 6.2.
Although several gasifier designs are commercially available, a circulating fluidized bed is
modeled due to the scalability of the design. Cueller (2012) suggested that indirect co-firing
removes the scale limitations of biomass generating systems. The modeled system produces 60
MWe of the 139 MW net for the entire system. The reduction in the net thermal efficiency of the
electricity production from indirect co-firing of willow is assumed to be less than 0.1 %, which is
attributed to improved heat transfer in the boiler (Granatstein 2002b).
The syngas properties used in the model are shown in Table 6.3. The gas composition is based
on gasification experiments in a 75 mm diameter fluidized bed gasifier carried out at the
University of Saskatchewan with SV1 (Salix dasyclados) willow biomass grown in experimental
plots located on the campus of the university. The details of the experiments are available in
Woytiuk et al. (2017). The syngas higher heating value (HHV) is calculated as the sum of each
component’s concentration multiplied by its heating value. A wide range of higher heating
values for syngas from commercial CFB gasifiers have been reported in literature, ranging
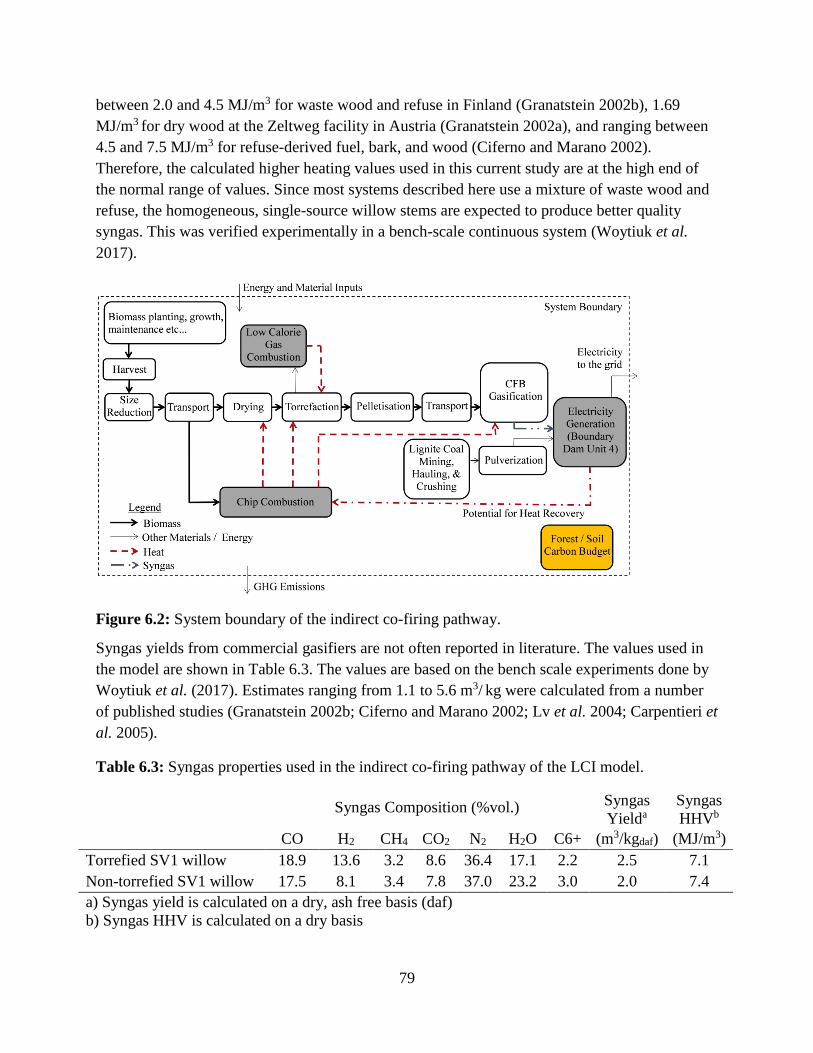
79
between 2.0 and 4.5 MJ/m3 for waste wood and refuse in Finland (Granatstein 2002b), 1.69
MJ/m3 for dry wood at the Zeltweg facility in Austria (Granatstein 2002a), and ranging between
4.5 and 7.5 MJ/m3 for refuse-derived fuel, bark, and wood (Ciferno and Marano 2002).
Therefore, the calculated higher heating values used in this current study are at the high end of
the normal range of values. Since most systems described here use a mixture of waste wood and
refuse, the homogeneous, single-source willow stems are expected to produce better quality
syngas. This was verified experimentally in a bench-scale continuous system (Woytiuk et al.
2017).
Figure 6.2: System boundary of the indirect co-firing pathway.
Syngas yields from commercial gasifiers are not often reported in literature. The values used in
the model are shown in Table 6.3. The values are based on the bench scale experiments done by
Woytiuk et al. (2017). Estimates ranging from 1.1 to 5.6 m3/ kg were calculated from a number
of published studies (Granatstein 2002b; Ciferno and Marano 2002; Lv et al. 2004; Carpentieri et
al. 2005).
Table 6.3: Syngas properties used in the indirect co-firing pathway of the LCI model.
Syngas Composition (%vol.) Syngas
Yielda
Syngas
HHVb
CO H2 CH4 CO2 N2 H2O C6+ (m3/kgdaf) (MJ/m3)
Torrefied SV1 willow 18.9 13.6 3.2 8.6 36.4 17.1 2.2 2.5 7.1
Non-torrefied SV1 willow 17.5 8.1 3.4 7.8 37.0 23.2 3.0 2.0 7.4
a) Syngas yield is calculated on a dry, ash free basis (daf)
b) Syngas HHV is calculated on a dry basis
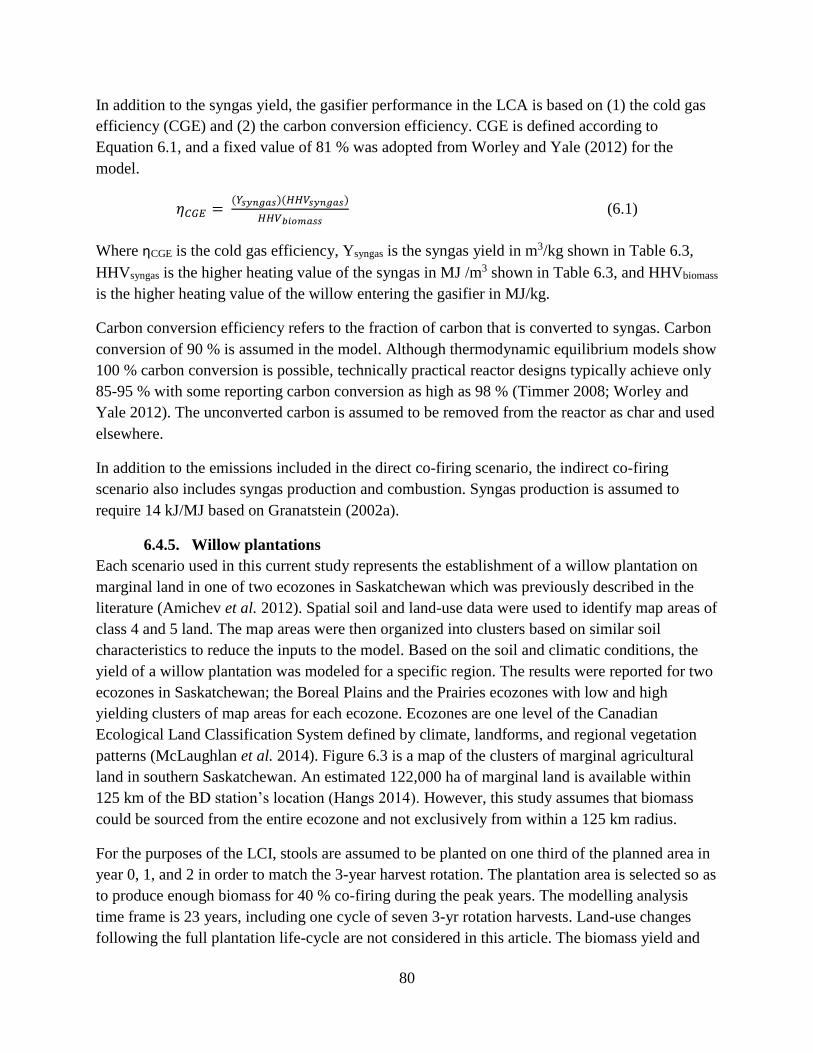
80
In addition to the syngas yield, the gasifier performance in the LCA is based on (1) the cold gas
efficiency (CGE) and (2) the carbon conversion efficiency. CGE is defined according to
Equation 6.1, and a fixed value of 81 % was adopted from Worley and Yale (2012) for the
model.
𝜂𝐶𝐺𝐸 = (𝑌𝑠𝑦𝑛𝑔𝑎𝑠)(𝐻𝐻𝑉𝑠𝑦𝑛𝑔𝑎𝑠)
𝐻𝐻𝑉𝑏𝑖𝑜𝑚𝑎𝑠𝑠 (6.1)
Where ηCGE is the cold gas efficiency, Ysyngas is the syngas yield in m3/kg shown in Table 6.3,
HHVsyngas is the higher heating value of the syngas in MJ /m3 shown in Table 6.3, and HHVbiomass
is the higher heating value of the willow entering the gasifier in MJ/kg.
Carbon conversion efficiency refers to the fraction of carbon that is converted to syngas. Carbon
conversion of 90 % is assumed in the model. Although thermodynamic equilibrium models show
100 % carbon conversion is possible, technically practical reactor designs typically achieve only
85-95 % with some reporting carbon conversion as high as 98 % (Timmer 2008; Worley and
Yale 2012). The unconverted carbon is assumed to be removed from the reactor as char and used
elsewhere.
In addition to the emissions included in the direct co-firing scenario, the indirect co-firing
scenario also includes syngas production and combustion. Syngas production is assumed to
require 14 kJ/MJ based on Granatstein (2002a).
6.4.5. Willow plantations
Each scenario used in this current study represents the establishment of a willow plantation on
marginal land in one of two ecozones in Saskatchewan which was previously described in the
literature (Amichev et al. 2012). Spatial soil and land-use data were used to identify map areas of
class 4 and 5 land. The map areas were then organized into clusters based on similar soil
characteristics to reduce the inputs to the model. Based on the soil and climatic conditions, the
yield of a willow plantation was modeled for a specific region. The results were reported for two
ecozones in Saskatchewan; the Boreal Plains and the Prairies ecozones with low and high
yielding clusters of map areas for each ecozone. Ecozones are one level of the Canadian
Ecological Land Classification System defined by climate, landforms, and regional vegetation
patterns (McLaughlan et al. 2014). Figure 6.3 is a map of the clusters of marginal agricultural
land in southern Saskatchewan. An estimated 122,000 ha of marginal land is available within
125 km of the BD station’s location (Hangs 2014). However, this study assumes that biomass
could be sourced from the entire ecozone and not exclusively from within a 125 km radius.
For the purposes of the LCI, stools are assumed to be planted on one third of the planned area in
year 0, 1, and 2 in order to match the 3-year harvest rotation. The plantation area is selected so as
to produce enough biomass for 40 % co-firing during the peak years. The modelling analysis
time frame is 23 years, including one cycle of seven 3-yr rotation harvests. Land-use changes
following the full plantation life-cycle are not considered in this article. The biomass yield and
81
co-firing rate vary over the analysis timeframe from 0, at year 2, to 40 %, at year 11 as shown in
Figure 6.4. The left side of Figure 6.4 shows the production of dry tonnes of willow for each of
the four scenarios and the right side shows the resulting rate of co-firing based on the available
willow biomass.
The area-weighted average yields and corresponding C fluxes for the Boreal Plains and Prairie
ecozones are used as input for the life-cycle model. The first-rotation and maximum area
weighted average (AWA) yields for the plantations are shown in Table 6.4. Plantation yields
were determined using the Physiological Principles in Predicting Growth (3PG) model calibrated
using data from willow experiments in Saskatchewan (Amichev et al. 2012). The average first-
rotation yield in Saskatchewan has since been measured as 3.5 oven dry tonnes per hectare per
year (odt/ha/ yr), ranging from 1.3 to 5.8 odt/ha/ yr (Amichev et al. 2015), validating the 3PG
model results. Determination of the above and below ground and in-soil sequestration of carbon
is based on the Carbon Budget Model of the Canadian Forest Sector (CBM-CFS3) (Amichev et
al. 2012).

82
Figure 6.3: Marginal agricultural land (classes 4 and 5) in southern Saskatchewan as a percent of
the area of each mapped soil polygon.
Figure 6.4: (Left) Coppice willow available for co-firing with lignite coal. (Right) Co-firing
ratio based on available willow biomass over time.
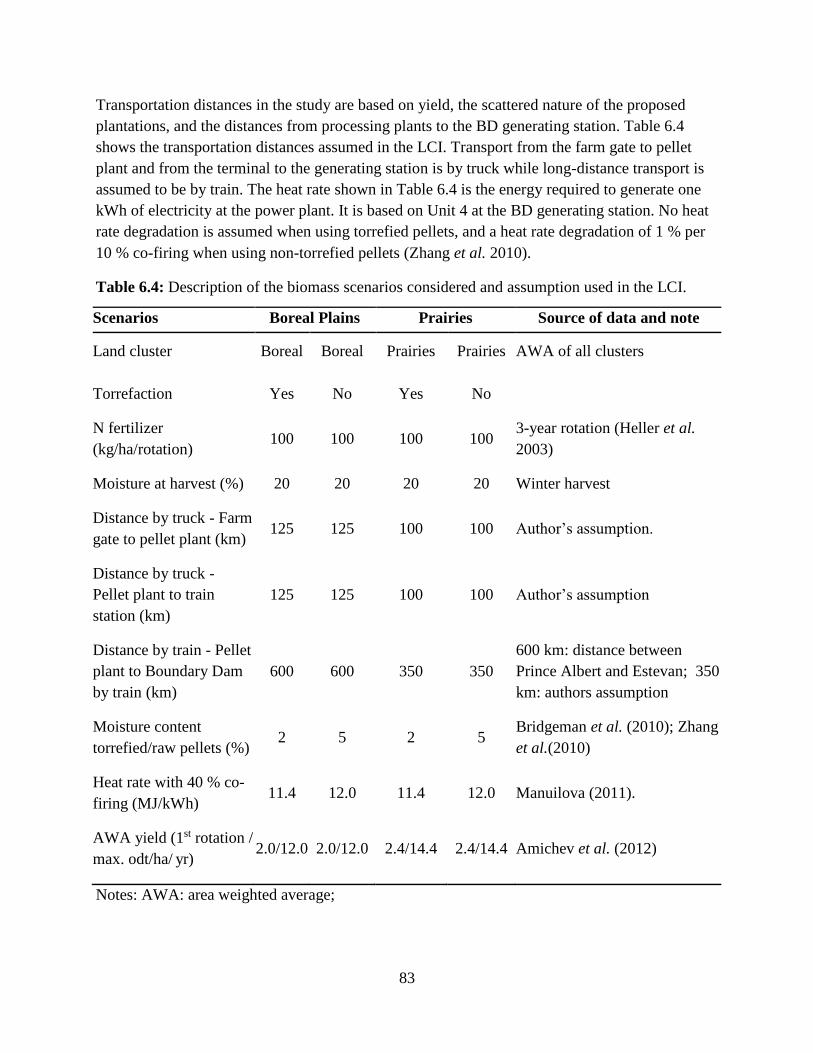
83
Transportation distances in the study are based on yield, the scattered nature of the proposed
plantations, and the distances from processing plants to the BD generating station. Table 6.4
shows the transportation distances assumed in the LCI. Transport from the farm gate to pellet
plant and from the terminal to the generating station is by truck while long-distance transport is
assumed to be by train. The heat rate shown in Table 6.4 is the energy required to generate one
kWh of electricity at the power plant. It is based on Unit 4 at the BD generating station. No heat
rate degradation is assumed when using torrefied pellets, and a heat rate degradation of 1 % per
10 % co-firing when using non-torrefied pellets (Zhang et al. 2010).
Table 6.4: Description of the biomass scenarios considered and assumption used in the LCI.
Scenarios Boreal Plains Prairies Source of data and note
Land cluster Boreal Boreal Prairies Prairies AWA of all clusters
Torrefaction Yes No Yes No
N fertilizer
(kg/ha/rotation) 100 100 100 100
3-year rotation (Heller et al.
2003)
Moisture at harvest (%) 20 20 20 20 Winter harvest
Distance by truck - Farm
gate to pellet plant (km) 125 125 100 100 Author’s assumption.
Distance by truck -
Pellet plant to train
station (km)
125 125 100 100 Author’s assumption
Distance by train - Pellet
plant to Boundary Dam
by train (km)
600 600 350 350
600 km: distance between
Prince Albert and Estevan; 350
km: authors assumption
Moisture content
torrefied/raw pellets (%) 2 5 2 5
Bridgeman et al. (2010); Zhang
et al.(2010)
Heat rate with 40 % co-
firing (MJ/kWh) 11.4 12.0 11.4 12.0 Manuilova (2011).
AWA yield (1st rotation /
max. odt/ha/ yr) 2.0/12.0 2.0/12.0 2.4/14.4 2.4/14.4 Amichev et al. (2012)
Notes: AWA: area weighted average;
84
6.4.6. Life-cycle impact assessment
Calculation of CO2 equivalence includes emissions of CO2, N2O, and CH4. Emissions are
reported as CO2-equivalent (CO2-eq) which is calculated according to the guidelines by the IPCC
for100-yr global warming potentials (GWPs). The global warming potential of CH4 is 25 times
greater than CO2, and the GWP of N2O is 298 times greater than CO2 and, therefore, the
respective emissions are multiplied by these factors (Smith and Wigley 2000). Biogenic CO2
emissions are defined as emissions resulting from a stationary source directly resulting from the
combustion or decomposition of biologically based materials other than fossil fuels (US EPA
2011). These emissions are included in the total emissions, but are also reported separately for
illustrative purposes.
The N2O emissions are calculated using the IPCC generic methodology (De Klein et al. 2006).
The calculation is based on the synthetic nitrogen fertilizer application rate proposed by Heller et
al. (2003). Leaf litter and dead roots N2O emissions are estimated using the very fast above and
below ground carbon pools developed for the CBM-CFS3 model (Amichev et al. 2012). Willow
biomass was assumed to contain 1.5 % nitrogen. Emissions associated with infrastructure,
buildings, and machine manufacturing are not considered as they tend to have a small
contribution to the life-cycle emissions (Zhang et al. 2010).
6.5. Results and discussion
6.5.1. Cumulative GHG emissions
Table 6.5 shows the cumulative GHG emissions for the nine scenarios over the lifetime of the
plantation (i.e., 23 years). The table compares two factors against the existing lignite coal
generation pathway (i.e., feedstock pre-treatment by torrefaction and location of the plantation
by ecozone). The GHG emissions for the coal fired pathway alone (i.e., the reference pathway)
are consistent with the results by Manuilova (2011) who found that total emissions from the BD
generating station are 1,200 gCO2-eq/kWh.
For the direct co-firing pathway (i.e., co-firing 40 % willow pellets with coal), torrefied willow
that was produced on marginal lands in the Prairie ecozone, represents the greatest emissions
reduction compared to the reference pathway. As the yield of the plantation and the higher
heating value of the biomass are increased, there is a corresponding decrease in both the
emissions and the land required for biomass production.
The analysis indicated that the indirect co-firing pathway also requires a smaller land area for the
Prairies and the torrefied pellet scenarios compared to the Boreal Plains and non-torrefied pellet
scenarios (Table 6.5). However, contrary to the direct co-firing scenarios, the cumulative and
levelized GHG emissions are lower for the non-torrefied pellets compared to the torrefied pellets.
Levelized GHG emissions represent the cumulative net GHG emissions per kWh of electricity
generated over the 23-year life of the system. The discrepancy is the result of the syngas
properties of torrefied willow. Torrefied willow produces a higher syngas yield compared to non-
85
torrefied willow resulting in less pellets and less area of land required to reach the 40 % co-firing
rate. On the other hand, the HHV of syngas from torrefied willow was also found to be lower
compared to non-torrefied willow resulting in higher GHG emissions for torrefied pellets
compared to non-torrefied pellets.
The emissions reductions associated with the Boreal Plains ecozone (23 % and 27 % in Table
6.5) are lower than the emissions reductions associated with the prairie-produced willow (31 %
and 34 % reduction). The difference is attributed to three factors. The AWA yield of willow
biomass, shown in Table 6.4, is 20 % higher in the Prairies compared to the Boreal Plains at the
peak yields (i.e., after 11 years). Higher yields reduce emissions associated with establishment,
harvest, and maintenance of the plantation. Emissions from transportation are greater for the
Boreal Plains because of the location of BD generating station (shown in Figure 6.3). Finally, the
emissions for the Boreal Plains scenario are higher due to higher organic-based N2O emissions
which are linked to larger very-fast above- and below-ground C pools (litter and dead roots) in
the Boreal Plains compared to Prairies. This may also be the result of a methodological artifact
as N2O emissions are estimated based on N-fertilizer application and N content in the soil (which
was assumed as 1.5 % of the very-fast C pools). The same factors are likely to result in better
economic performance for plantations in the Prairie ecozone compared to the Boreal Plains.
Comparing indirect and direct co-firing for the Prairie ecozone, indirect co-firing results in a
greater emissions reduction. GHG emissions for non-torrefied and torrefied pellets respectively
are 32 % and 17 % lower for indirect co-firing compared to direct co-firing. The difference is
attributed primarily to the carbon sequestration associated with the greater land area required to
reach 40 % co-firing for the indirect pathway. Larger plantation size implies a lower land-use
efficiency of the system compared to the direct co-firing scenario. Energy loss during
gasification requires additional energy input to the system and therefore, requires more biomass
compared to the direct scenario to produce the same amount of electricity. The larger plantation,
in turn, sequesters more carbon. This result highlights the risks associated with overemphasis on
GHG emissions as a singular sustainability metric. On the other hand, the effect of the greater
land requirement for indirect co-firing also highlights the potential for carbon sequestration in
willow plantations on marginal land.
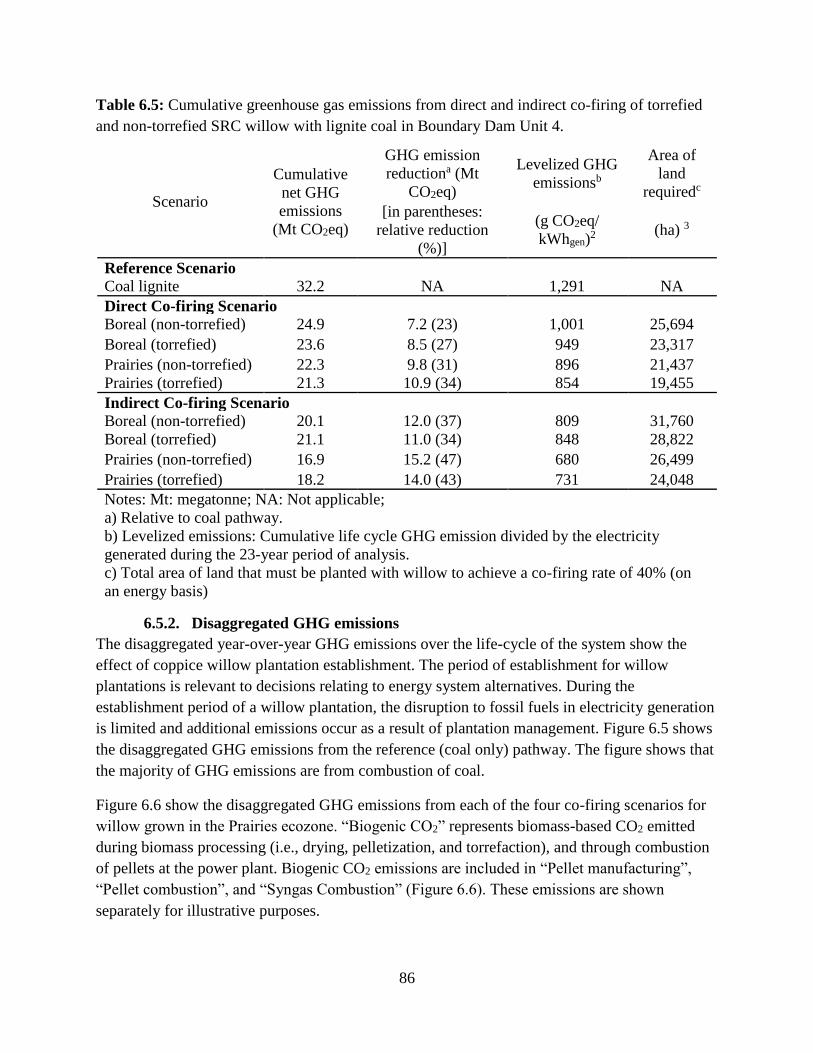
86
Table 6.5: Cumulative greenhouse gas emissions from direct and indirect co-firing of torrefied
and non-torrefied SRC willow with lignite coal in Boundary Dam Unit 4.
Scenario
Cumulative
net GHG
emissions
(Mt CO2eq)
GHG emission
reductiona (Mt
CO2eq)
Levelized GHG
emissionsb
Area of
land
requiredc
[in parentheses:
relative reduction
(%)]
(g CO2eq/
kWhgen)2
(ha) 3
Reference Scenario
Coal lignite 32.2 NA 1,291 NA
Direct Co-firing Scenario
Boreal (non-torrefied) 24.9 7.2 (23) 1,001 25,694
Boreal (torrefied) 23.6 8.5 (27) 949 23,317
Prairies (non-torrefied) 22.3 9.8 (31) 896 21,437
Prairies (torrefied) 21.3 10.9 (34) 854 19,455
Indirect Co-firing Scenario
Boreal (non-torrefied) 20.1 12.0 (37) 809 31,760
Boreal (torrefied) 21.1 11.0 (34) 848 28,822
Prairies (non-torrefied) 16.9 15.2 (47) 680 26,499
Prairies (torrefied) 18.2 14.0 (43) 731 24,048
Notes: Mt: megatonne; NA: Not applicable;
a) Relative to coal pathway.
b) Levelized emissions: Cumulative life cycle GHG emission divided by the electricity
generated during the 23-year period of analysis.
c) Total area of land that must be planted with willow to achieve a co-firing rate of 40% (on
an energy basis)
6.5.2. Disaggregated GHG emissions
The disaggregated year-over-year GHG emissions over the life-cycle of the system show the
effect of coppice willow plantation establishment. The period of establishment for willow
plantations is relevant to decisions relating to energy system alternatives. During the
establishment period of a willow plantation, the disruption to fossil fuels in electricity generation
is limited and additional emissions occur as a result of plantation management. Figure 6.5 shows
the disaggregated GHG emissions from the reference (coal only) pathway. The figure shows that
the majority of GHG emissions are from combustion of coal.
Figure 6.6 show the disaggregated GHG emissions from each of the four co-firing scenarios for
willow grown in the Prairies ecozone. “Biogenic CO2” represents biomass-based CO2 emitted
during biomass processing (i.e., drying, pelletization, and torrefaction), and through combustion
of pellets at the power plant. Biogenic CO2 emissions are included in “Pellet manufacturing”,
“Pellet combustion”, and “Syngas Combustion” (Figure 6.6). These emissions are shown
separately for illustrative purposes.

87
Figure 6.5: Cumulative life-cycle GHG emissions for the reference pathway with coal only in
Boundary Dam Unit 4.
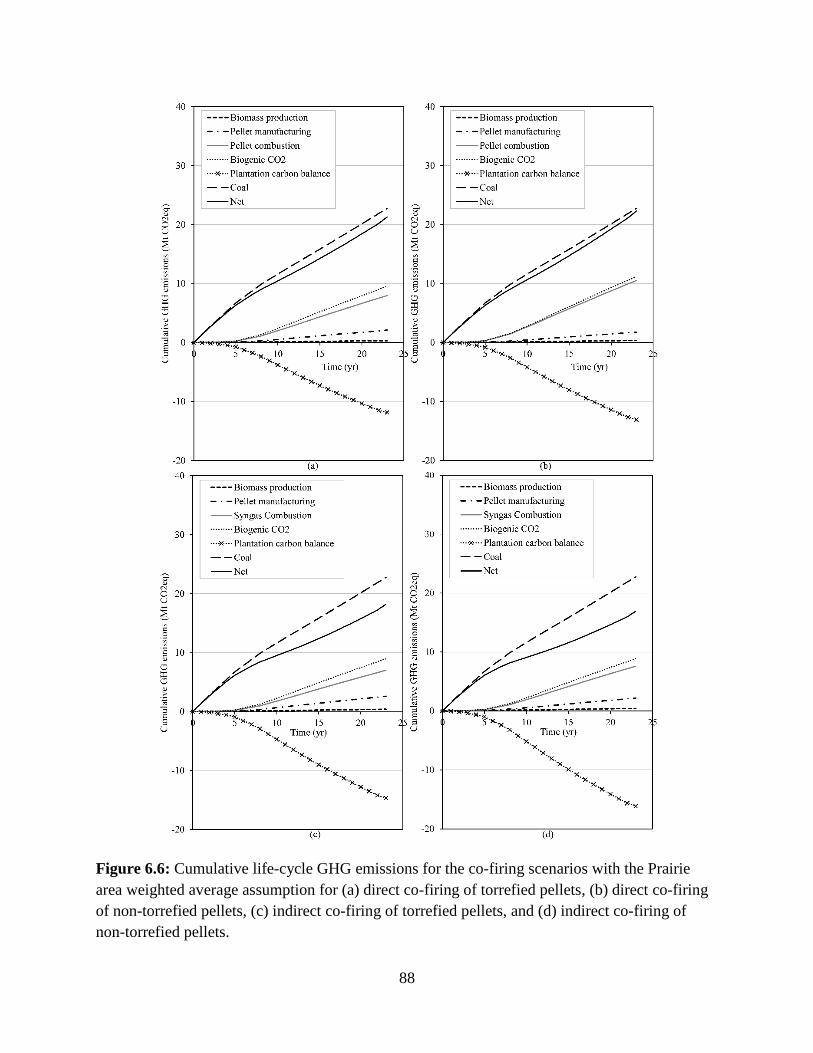
88
Figure 6.6: Cumulative life-cycle GHG emissions for the co-firing scenarios with the Prairie
area weighted average assumption for (a) direct co-firing of torrefied pellets, (b) direct co-firing
of non-torrefied pellets, (c) indirect co-firing of torrefied pellets, and (d) indirect co-firing of
non-torrefied pellets.
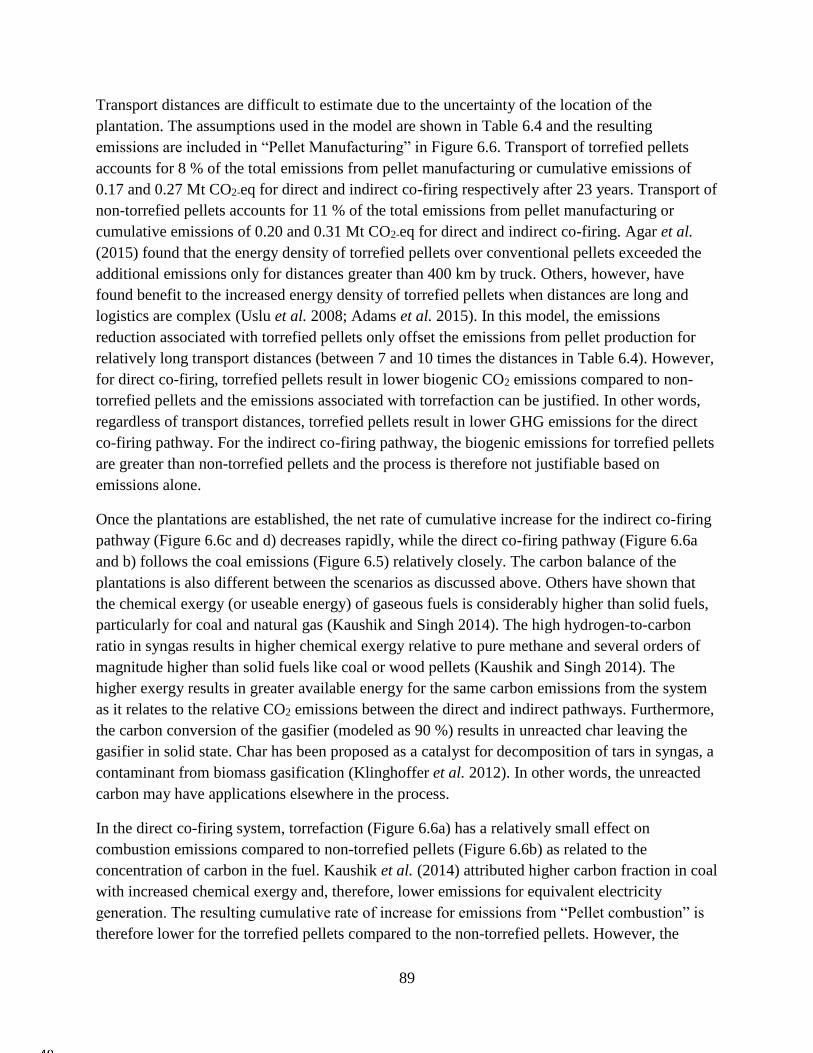
89
Transport distances are difficult to estimate due to the uncertainty of the location of the
plantation. The assumptions used in the model are shown in Table 6.4 and the resulting
emissions are included in “Pellet Manufacturing” in Figure 6.6. Transport of torrefied pellets
accounts for 8 % of the total emissions from pellet manufacturing or cumulative emissions of
0.17 and 0.27 Mt CO2-eq for direct and indirect co-firing respectively after 23 years. Transport of
non-torrefied pellets accounts for 11 % of the total emissions from pellet manufacturing or
cumulative emissions of 0.20 and 0.31 Mt CO2-eq for direct and indirect co-firing. Agar et al.
(2015) found that the energy density of torrefied pellets over conventional pellets exceeded the
additional emissions only for distances greater than 400 km by truck. Others, however, have
found benefit to the increased energy density of torrefied pellets when distances are long and
logistics are complex (Uslu et al. 2008; Adams et al. 2015). In this model, the emissions
reduction associated with torrefied pellets only offset the emissions from pellet production for
relatively long transport distances (between 7 and 10 times the distances in Table 6.4). However,
for direct co-firing, torrefied pellets result in lower biogenic CO2 emissions compared to non-
torrefied pellets and the emissions associated with torrefaction can be justified. In other words,
regardless of transport distances, torrefied pellets result in lower GHG emissions for the direct
co-firing pathway. For the indirect co-firing pathway, the biogenic emissions for torrefied pellets
are greater than non-torrefied pellets and the process is therefore not justifiable based on
emissions alone.
Once the plantations are established, the net rate of cumulative increase for the indirect co-firing
pathway (Figure 6.6c and d) decreases rapidly, while the direct co-firing pathway (Figure 6.6a
and b) follows the coal emissions (Figure 6.5) relatively closely. The carbon balance of the
plantations is also different between the scenarios as discussed above. Others have shown that
the chemical exergy (or useable energy) of gaseous fuels is considerably higher than solid fuels,
particularly for coal and natural gas (Kaushik and Singh 2014). The high hydrogen-to-carbon
ratio in syngas results in higher chemical exergy relative to pure methane and several orders of
magnitude higher than solid fuels like coal or wood pellets (Kaushik and Singh 2014). The
higher exergy results in greater available energy for the same carbon emissions from the system
as it relates to the relative CO2 emissions between the direct and indirect pathways. Furthermore,
the carbon conversion of the gasifier (modeled as 90 %) results in unreacted char leaving the
gasifier in solid state. Char has been proposed as a catalyst for decomposition of tars in syngas, a
contaminant from biomass gasification (Klinghoffer et al. 2012). In other words, the unreacted
carbon may have applications elsewhere in the process.
In the direct co-firing system, torrefaction (Figure 6.6a) has a relatively small effect on
combustion emissions compared to non-torrefied pellets (Figure 6.6b) as related to the
concentration of carbon in the fuel. Kaushik et al. (2014) attributed higher carbon fraction in coal
with increased chemical exergy and, therefore, lower emissions for equivalent electricity
generation. The resulting cumulative rate of increase for emissions from “Pellet combustion” is
therefore lower for the torrefied pellets compared to the non-torrefied pellets. However, the
90
carbon flux in the plantation is correspondingly smaller (i.e., the plantation is smaller) for the
torrefied pellets scenario resulting in a relatively small decrease in biogenic CO2 emissions for
direct co-firing.
For the indirect co-firing pathway, comparison of torrefied (Figure 6.6c) and non-torrefied
pellets (Figure 6.6d) is more complex. The analysis shows that the torrefied pellets produce
higher GHG emissions relative to the non-torrefied pellets. The difference is the result of the
calorific value of the syngas from each feedstock (Table 6.3). Torrefied biomass was found to
produce syngas with a lower concentration of methane and other C1-C6 hydrocarbons relative to
non-torrefied biomass (Woytiuk et al. 2017). The lower heating value of the syngas ultimately
leads to higher emissions for an equivalent amount of electricity produced.
Ultimately, the cumulative biogenic CO2 emissions increase at the slowest rate for the non-
torrefied pellets indirectly fired in a CFB gasifier prior to co-firing in BD Unit 4 (Figure 6.6d).
The greater demand for pellets required by this pathway, combined with lower emissions per unit
of energy produced, relative to all other scenarios, result in lower net emissions for this scenario.
The implications of greater requirement for pellets in this pathway is a greater plantation size
and, thereby, greater removal of carbon from the atmosphere by the SRC willow grown on the
plantation.
More land occupied by willow plantations has several potential negative consequences. For
example, land use changes from grasslands or boreal forest to agricultural land would result in
significant carbon emissions which were beyond the scope of this study. However, within the
parameters established in the carbon model of the plantations on marginal class 4 and 5
agricultural lands used in the current study (Amichev et al. 2012), and with careful consideration
of the local ecosystems and sustainable farm management practices, the GHG emissions
reduction demonstrated by the carbon balance of the larger plantation is technically achievable.
Finally, the net-neutrality assumption for willow pellets can be evaluated by comparing the sum
of the biogenic CO2 emissions and the biomass production emissions with the plantation carbon
balance (Figure 6.6a to d). In all four cases, neutral cumulative GHG emissions (i.e., zero GHG
emissions from production and combustion of willow pellets) are exceeded over the lifespan of
the modelled scenarios. The net cumulative emissions over the life of the plantation between
“Biogenic CO2” and the “Plantation carbon balance” (from growing the willow) ranges from -0.4
Mt CO2-eq for direct co-firing of non-torrefied pellets (Figure 6.6b) to -6.0 Mt CO2-eq for
indirect co-firing of non-torrefied pellets (Figure 6.6d), meaning that all scenarios exceed carbon
neutrality (i.e., more carbon is sequestered than emitted). However, neutrality is not achieved
immediately as is often assumed. In the Boreal Plains, carbon sequestration in the plantation does
not occur until year 5 (figures not shown), resulting in greater cumulative emissions and a longer
timeframe to reach net neutrality in co-firing. In the Prairies ecozone, carbon sequestration in the
plantation begins after year 1. The short timeframe for carbon sequestration in the Prairies
highlights the value of agroforestry for emissions reduction, but the difference between adjacent
91
ecozones implies the need for careful evaluation of the potential GHG emissions. Decisions to
start or stop co-firing biomass must carefully consider the establishment emissions required to
begin operation of the plantation.
6.5.3. Limitations and challenges
The major limitation of the work is the use of a single metric (GHG emissions). Recent interest
in bioenergy systems has identified the need to more broadly recognize ecosystem services and
evaluate the many interacting metrics associated with energy crop production, recently referred
to as ‘energy-scape’ (Howard et al. 2013). Although this current study contributes a timely and
critical measure of the ecological value of energy plantations, a broader look at multiple metrics
could better evaluate the efficacy of land based bioenergy options. For example, although
analyzing cost was beyond the scope of this study, it could be an important factor if all scenarios
meet the mandated carbon reduction targets. Furthermore, the current study does not address the
technology or economics of plantation establishment. Early adopters are likely to address
regionally specific application requirements in addition to power generation. Applications that
have been proposed include wastewater treatment through effluent irrigation and riparian buffers
protecting wetlands (potholes) from nutrient rich runoff (Christen and Dalgaard 2013; Woytiuk
et al. 2014). Symbiotic applications would increase knowledge regarding the limitations of SRC
willow plantations and reduce the widespread application of SRC willow on high-value
agricultural land if large-scale co-firing with coal is adopted.
6.6. Conclusions
In this investigation, levelized, cumulative and disaggregated greenhouse gas emissions were
modeled for three alternative electricity generating pathways. For each pathway, short-rotation
coppice willow plantations were proposed as a source of biomass established in Boreal Plains
and Prairie ecozones in the province of Saskatchewan, Canada. The plantations are proposed for
marginal agricultural lands with class 4 and 5 soils that do not support cereal or oil seed crops, so
as to avoid competition for land with food production operations.
The main conclusions from the model are
• Indirect co-firing of syngas from coppice willow pellets via gasification in a circulating
fluidized bed at a rate of 40 % by energy results in 32 % lower GHG emissions compared
to direct co-firing of willow pellets in an existing coal-fired generating station. The
reduction in emissions is primarily the result of greater pellets required for indirect co-
firing compared to direct co-firing. The increase in plantation size results in more carbon
sequestration by the plantation over the life-cycle of the SRC system.
• For direct co-firing of coppice willow pellets with coal up to 40 % by energy, torrefied
willow pellets grown on marginal land in the Prairie ecozone represent the largest net
cumulative GHG emissions reduction at 34 % below the emissions from the existing
coal-fired pathway when compared to non-torrefied pellets from the Boreal Plains
ecozone.

92
• For indirect co-firing of syngas from coppice willow pellets with coal up to 40 % by
energy, non-torrefied willow pellets grown on marginal land in the Prairie ecozone
represent the largest net cumulative GHG emissions reduction at 47 % by difference
below the emissions from the existing coal-fired generating station compared to torrefied
pellets from the Boreal Plains ecozone.
• Accounting for the plantation establishment period, the “net-neutral” GHG emissions
assumption for biomass energy systems underestimates the emissions reduction potential
of coppice willow grown on marginal land in the Prairie ecozone of Saskatchewan and
co-fired with coal.
Co-firing coppice willow grown on marginal land in an existing coal-fired generating station in
Saskatchewan is a technically viable option for reducing greenhouse gas emissions from
electricity generation.
93
6.7. References
Abrahamson, L.P., Volk, T.A., Smart, L.B., and Cameron, K.D. 2010. Shrub willow biomass
producer’s handbook. SUNY-ESF, Syracuse, NY.
Adams, P.W.R., Shirley, J.E.J., and McManus, M.C. 2015. Comparative cradle-to-gate life cycle
assessment of wood pellet production with torrefaction. Applied Energy 138: 367-80.
Agar, D., Gil, J., Sanchez, D., Echeverria, I., and Wihersaari, M. 2015. Torrefied versus
conventional pellet production – A comparative study on energy and emission balance based
on pilot-plant data and EU sustainability criteria. Applied Energy 138: 621-30.
Amichev, B.Y., Hangs, R.D., Bélanger, N., Volk, T.A., Vujanovic, V., Schoenau, J.J., et al.
2015. First-rotation yields of 30 short-rotation willow cultivars in central Saskatchewan,
Canada. BioEnergy Research 8 (1): 292-306.
Amichev, B.Y., Kurz, W.A., Smyth, C., and Rees, K.C. 2012. The carbon implications of large‐scale afforestation of agriculturally marginal land with short‐rotation willow in
Saskatchewan. GCB Bioenergy 4 (1): 70-87.
Basu, P. 2013. Biomass gasification, pyrolysis and torrefaction. 2nd ed. Elsevier Inc. San Diego,
USA.
Basu, P., Butler, J., and Leon, M.A. 2011. Biomass co-firing options on the emission reduction
and electricity generation costs in coal-fired power plants. Renewable Energy 36 (1): 282-8.
Bergman, P.C.A., and Kiel, J.H.A. 2005. Torrefaction for biomass upgrading. Paper presented at
the 14th European Biomass Conference and Exhibition, October 17-21, Paris, FR.
Borman, G.L., and Ragland, K.W. 1998. Combustion engineering McGraw-Hill, New York, NY.
Bridgeman, T.G., Jones, J.M., Williams, A., and Waldron, D.J. 2010. An investigation of the
grindability of two torrefied energy crops. Fuel 89 (12): 3911-8.
Carpentieri, M., Corti, A., and Lombardi, L. 2005. Life cycle assessment (LCA) of an integrated
biomass gasification combined cycle (IBGCC) with CO 2 removal. Energy Conversion and
Management 46 (11): 1790-808.
Christen, B., and Dalgaard, T. 2013. Buffers for biomass production in temperate European
agriculture: A review and synthesis on function, ecosystem services and implementation.
Biomass and Bioenergy 55: 53-67.
Ciferno, J.P., and Marano, J.J. 2002. Benchmarking biomass gasification technologies for fuels,
chemicals and hydrogen production. US Department of Energy. National Energy
Technology Laboratory.
Cuellar, A.D. 2012. Plant Power: The Cost of using Biomass for Power Generation and
Potential for Decreased Greenhouse Gas Emissions. MSc. in Technology and Policy, MIT
94
De Klein, C., Novoa, R.S.A., Ogle, S., Smith, K.A., Rochette, P., Wirth, T.C., et al. 2006.
Chapter 11: N2O emissions from managed soils, and CO2 emissions from lime and urea
application. In 2006 IPCC guidelines for greenhouse gas inventories. International Panel on
Climate Change.
Diacarbon. Biocoal. 2017Available from http://www.diacarbon.com/biocoal/ (Accessed 01/16
2017).
ECN. ECN Phyllis 2 database. Available from https://www.ecn.nl/phyllis2/Biomass/View/1367
(Accessed 12/01 2016).
Government of Canada. (2015) Reduction of Carbon Dioxide from Coal-Fired Generation of
Electricity Regulations. SOR/2012-67, http://laws-lois.justice.gc.ca/eng/regulations/SOR-
2012-167/index.html. (Accessed 01/17 2017)
Government of Saskatchewan. Climate change. Available from
http://www.environment.gov.sk.ca/climatechange (Accessed 01/16 2017).
Granatstein, D. 2002a. Case study on BIOCOCOMB biomass gasification project Zeltweg power
station, Austria. Report for IEA Bioenergy Agreement—Task 36: 2001-3.
Granatstein, D. 2002b. Case study on Lahden Lampovoima gasification project, Kymijarvi
power station, Lahti, Finland. IEA Bioenergy Agreement—Task 36.
Hangs, R. 2014. Biomass production and nutrient cycling in short-rotation coppice willow (Salix
spp.) bioenergy plantations in Saskatchewan, Canada, PhD., University of Saskatchewan.
Heller, M.C., Keoleian, G.A., and Volk, T.A. 2003. Life cycle assessment of a willow bioenergy
cropping system. Biomass and Bioenergy 25 (2): 147-65.
Heller, M.C., Keoleian, G.A., Mann, M.K., and Volk, T.A. 2004. Life cycle energy and
environmental benefits of generating electricity from willow biomass. Renewable Energy 29
(7): 1023-42.
Howard, D.C., Burgess, P.J., Butler, S.J., Carver, S.J., Cockerill, T., Coleby, A.M., et al. 2013.
Energyscapes: Linking the energy system and ecosystem services in real landscapes.
Biomass and Bioenergy 55: 17-26.
International Energy Agency. 2011. Combining bioenergy with CCS. Paris, FR.
Kaushik, S., and Singh, O.K. 2014. Estimation of chemical exergy of solid, liquid and gaseous
fuels used in thermal power plants. Journal of Thermal Analysis and Calorimetry 115 (1):
903-8.
Klinghoffer, N.B., Castaldi, M.J., and Nzihou, A. 2012. Catalyst properties and catalytic
performance of char from biomass gasification. Industrial and Engineering Chemistry
Research 51 (40): 13113-22.
Koppejan, J., Sokhansanj, S., Melin, S., and Madrali, S. 2012. Status overview of torrefaction
technologies. 32.

95
Lempp, P. 2013. Biomass co-firing in coal power plants. E21IEA-ETSAP, http://iea-etsap.org/E-
TechDS/PDF/E21IR_Bio-cofiring_PL_Jan2013_final_GSOK.pdf. (Accessed 01/17 2017)
Lv, P., Xiong, Z., Chang, J., Wu, C., Chen, Y., and Zhu, J. 2004. An experimental study on
biomass air–steam gasification in a fluidized bed. Bioresource Technology 95 (1): 95-101.
Mann, M.K., and Spath, P.L. 2002. Life cycle assessment comparisons of electricity from
biomass, coal and natural gas. Paper presented at the Annual meeting of the American
Institute of Chemical Engineers, November.
Manuilova, A. 2011. Evaluation of environmental performance of carbon capture and storage
project in Canada using life cycle assessment methodology. PhD. University of Regina.
McKechnie, J., and MacLean, H.L. 2014. Implications of emissions timing on the cost‐effectiveness of greenhouse gas mitigation strategies: Application to forest bioenergy
systems. GCB Bioenergy 6 (4): 414-24.
McLaughlan, M.S., Wright, R.A., and Jiricka, R.D. 2014. Field guide to the ecosites of
Saskatchewan's provincial forests. Saskatchewan Ministry of Environment, Prince Albert,
SK.
Ney, R.A., and Schnoor, J.L. 2002. Greenhouse gas emission impacts of substituting switchgrass
for coal in electric generation: The Chariton valley biomass project. Center for Global and
Regional Environmental Research, University of Iowa.
Sherrard, A. 2014. World's first advanced biomass power plant conversion nears completion.
Bioenergy International. July.
Smith, S.J., and Wigley, T.M.L. 2000 Global warming potentials: 1. climatic implications of
emissions reductions. Climatic Change 44, (4).
Timmer, K.J. 2008. Carbon conversion during bubbling fluidized bed gasification of biomass,
PhD., Iowa State University.
Tsalidis, G., Joshi, Y., Korevaar, G., and de Jong, W. 2014. Life cycle assessment of direct co-
firing of torrefied and/or pelletised woody biomass with coal in the Netherlands. Journal of
Cleaner Production 81: 168-77.
US EPA. 2011. Accounting framework for biogenic CO2 emissions from stationary sources.
Environmental Protection Agency.
Uslu, A., Faaij, A.P., and Bergman, P.C. 2008. Pre-treatment technologies, and their effect on
international bioenergy supply chain logistics. techno-economic evaluation of torrefaction,
fast pyrolysis and pelletisation. Energy 33 (8): 1206-23.
Van Loo, S., and Koppejan, J. (eds.) 2008a. Biomass ash characteristics and behaviour in
combustion systems. In The handbook of biomass combustion and co-firing. 2nd ed.,
Earthscan, London, UK, pp. 249
96
Van Loo, S., and Koppejan, J. (eds.) 2008b. Biomass fuel supply and pre-treatment. In The
handbook of biomass combustion and co-firing, 2nd ed., Earthscan, London, UK, pp. 54
Van Oosten, C. 2006. Hybrid poplar crop manual for the prairie provinces. Forest Development
Fund Final Report, Saskatchewan Forest Centre, Prince Albert, Saskatchewan: 232.
Welham, C., Van Rees, K., Seely, B., and Kimmins, H. 2007. Projected long-term productivity
in Saskatchewan hybrid poplar plantations: Weed competition and fertilizer effects.
Canadian Journal of Forest Research 37 (2): 356-70.
Westmoreland Coal Company. 2017 Estevan mine - Saskatchewan. Available from
http://westmoreland.com/location/estevan-mine-saskatchewan/ (Accessed 01/17 2017).
Worley, M., and Yale, J. 2012. Biomass Gasification Technology Assessment: Consolidated
Report NREL/SR-5100-57085. Golden, CO, USA.
Woytiuk, K., Campbell, W., Gerspacher, R., Evitts, R.W., and Phoenix, A. 2017. The effect of
torrefaction on syngas quality metrics from fluidized bed gasification of SRC willow.
Renewable Energy 101C: 409-17.
Woytiuk, K., Campbell, W., Gerspacher, R., Phoenix, A., and Evitts, R.W. 2014. Torrefaction of
SRC willow as a pretreatment for fluidized bed gasification. Paper presented at the 3rd
International Conference on Industrial and Hazardous Waste Management, Crete, GR,
September 1-5, 2014.
Zhang, Y., McKechnie, J., Cormier, D., Lyng, R., Mabee, W., Ogino, A., et al. 2010. Life cycle
emissions and cost of producing electricity from coal, natural gas, and wood pellets in
Ontario, Canada. Environmental Science and Technology 44 (1): 538-44.
97
7. Summary and Conclusions
7.1. Summary of findings
The purpose of this thesis is to correlate syngas quality from fluidized bed gasification of willow
with lignocellulosic composition, a measure of the extent of torrefaction (chapters 3, 4 and 5),
the hypothesis being that syngas quality is improved by torrefaction. In the pursuit of the
objective, a unique method of measuring tar concentration was developed (chapter 4) along with
a simplified analysis of mass spectrometer fingerprints (chapter 5). Finally, the resulting data
was used to demonstrate the life-cycle GHG emissions reduction potential of co-firing willow
with coal in Saskatchewan (chapter 6).
This PhD project has furthered the science of thermochemical conversion of biomass in the
following ways.
7.1.1. Syngas quality metrics
Syngas quality was measured according to several metrics including higher heating value, H2/CO
ratio, syngas yield, and moisture in syngas. The syngas yield was found to increase from 2.02 to
2.47 m3/kgdafSV1 (chapter 4) and from 2.52 to 2.82 m3/kgdafSV1 (chapter 5) as a result of
torrefaction, increases of 22 % and 12 % respectively.
Hydrogen rich syngas is required for most chemical synthesis processes. Most processes require
upgrading by steam reforming to produce syngas with H2/CO of 2 or greater. Any reduction in
steam reforming implies a significant energy savings to the process. The H2/CO ratio of syngas
from fluidized bed gasification is greater for SV1 willow torrefied at temperatures greater than
240 °C when compared to untreated SV1 willow or lightly torrefied SV1 willow (240 °C). The
ratio increased by as much as 70 % as a result of torrefaction.
The use of mass spectrometry allowed for the measurement of water vapor in the syngas.
Moisture in syngas for chemical synthesis must be condensed into contaminated waste water
requiring costly treatment prior to discharge. In direct combustion, moisture decreases the
available energy in the boiler. In this work, syngas from torrefied SV1 willow was found to
contain less water vapour than syngas from non-torrefied SV1 willow.
Heating value is a measure of the available energy during combustion. The effective heating
value of syngas produced from torrefied willow is consistently lower than the effective heating
value of syngas produced from untreated SV1 willow. The extent of torrefaction has no
observable effect on the heating value of the syngas during fluidized bed gasification.
Each of the metrics considered with the exception of the decreased heating value show an
improvement as a result of torrefaction of the SV1 willow and the hypothesis is therefore
considered proved with respect to these quality metrics. The decreased higher heating value is a
98
tradeoff between the production of a more homogeneous, hydrogen rich syngas and higher
concentrations of energy rich, higher order hydrocarbons and methane.
7.1.2. Tar concentration and speciation by mass spectrometry
A reduction in tars contaminating syngas will reduce the gas cleaning required downstream of
the gasifier. Lower concentrations of tar can reduce parasitic energy consumption, reduce waste
water treatment, and improve process operations. Under fixed temperature and equivalence ratio
conditions in the gasifier, tar in the syngas changes measurably as the hemicelluloses fraction is
decreased by torrefaction. Hemicelluloses begin to react when peak torrefaction temperatures are
between 240 °C and 260 °C in this case. A step change in tar concentration was observed from
an average of 17.26 g/m3 to 9.21 g/m3 for mildly torrefied and non-torrefied biomass (untreated
and at a peak torrefaction temperature of 240 °C) compared to severely torrefied SV1 willow
(torrefied at peak temperatures of 260, 270, and 280 °C). The reduction in tar concentration as a
result of severe torrefaction is 47 %.
The two unique measurement techniques employed in chapters 4 and 5 produced similar results
when measuring gas composition, tar species, and tar concentration. Specifically, the ion
intensity measured by the process mass spectrometer shows that the relative change in the
quantity of the characteristic tar species is comparable to tar concentration measurements
quantified as the difference between flame-ionization detection (total hydrocarbon analysis) for
all hydrocarbon components and gas chromatography with a flame-ionization detector for
gaseous components.
7.1.3. Correlation of hemicelluloses with tar concentration and species
Torrefaction produces several characteristic and measureable property changes in biomass
ultimately removing oxygen and increasing the carbon fraction. After comparison of four
measures of the extent of torrefaction, the fraction of hemicelluloses is the most suitable
candidate compared to higher heating value, O/C ratio and carbon composition. Hemicelluloses
in willow can be measured rapidly by HR-TGA. Furthermore, hemicelluloses decrease linearly
with peak torrefaction temperature at a measurable rate (r=-0.98). The hemicelluloses are
significantly different between each peak torrefaction temperature with the exception of 240 °C
and 250 °C (p<0.05).
Carbonization of biomass is an important outcome from torrefaction. In this work significant
carbonization of SV1 willow as a result of torrefaction occurred only at peak temperatures
greater than 270 °C (p<0.05). Therefore, in order to increase the carbon fraction of willow,
torrefaction at temperatures at or greater than 270 ◦C is required.
A linear relationship between hemicelluloses in SV1 willow and tar concentration in syngas is
unlikely to exist despite a reasonably strong coefficient of determination between the variables
(r=0.88). The tar concentration decreases significantly when the hemicelluloses are less than 12
% w/w, but change very little for more severe torrefaction. Therefore, mild torrefaction of
99
biomass is effective in producing cleaner syngas (i.e. producing syngas with lower tar
concentration), but severe torrefaction offers no further measureable benefit with respect to
syngas tars.
The characteristic volatilization of hemicelluloses associated with torrefaction correlates with
alkyl tertiary and condensed tertiary tars represented by BTEX compounds and naphthalene.
However, torrefaction has only a small effect on toluene, ethylbenzene, and xylene. The
concentration of these three aromatic derivatives decreases only a small amount as the extent of
torrefaction is increased.
Benzene is a light aromatic that has an established market value. Benzene was found to decrease
linearly with the fraction of hemicelluloses in SV1 willow. Therefore, torrefaction can be used to
reduce the concentration of benzene and severe torrefaction could produce syngas with little or
no benzene. Benzene will contaminant aqueous filtration systems and may poison certain
catalysts. Therefore, syngas low in benzene is valuable during downstream upgrading.
Similar to the decrease in tar concentration, ion intensity of naphthalene measured by mass
spectrometry was found to decrease when hemicelluloses are volatilized by torrefaction to less
than 12 % w/w. A decrease in the concentration of naphthalene is advantageous to syngas
applications. PAHs are extremely harmful in terms of human health and well-being, but are also
detrimental to most downstream processes.
In general mild torrefaction of SV1 willow (torrefaction with peak temperatures sufficient to
reach 12 % w/w hemicelluloses as measured by HR-TGA) is the most beneficial in producing
low tar and low moisture syngas. Further syngas quality improvements in terms of an increased
H2/CO ratio are possible with more severe torrefaction.
7.1.4. Life-cycle greenhouse gas emissions reduction by co-firing torrefied and non-
torrefied willow pellets in Saskatchewan
Co-firing of biomass with coal is considered and complimentary technology to carbon capture
and storage. The combined technologies are one of the few systems that can produce negative
GHG emissions. This work modeled the GHG emissions from direct and indirect co-firing of
willow grown on marginal land in Saskatchewan with lignite coal in the Boundary Dam
generating station. Indirect co-firing of non-torrefied willow via a circulating fluidized bed
gasifier at 40 % of the energy required produced a 47 % GHG emissions reduction compared to
the existing coal-fired generating station. The reduction is, however, partially attributed to a
larger willow plantation size compared to the direct co-firing pathway. The land for the
plantation is therefore used less efficiently for the indirect co-firing pathway compared to direct
co-firing. For direct co-firing, 34 % GHG emissions reduction can be achieved by co-firing
torrefied willow pellets at a rate of 40 % by energy.
The assumption that biomass is net neutral was found to underestimate the potential GHG
emissions reduction on a life-cycle basis when considering willow grown on marginal land in the
100
Prairie ecozone of Saskatchewan. One year after establishing willow plantations for 40 % co-
firing in the Boundary Dam Unit 4, the plantations begin sequestering carbon and offset
emissions from the coal combustion in the generating station.
7.2. Evaluation of research objectives
The two energy pathways considered in the thesis include syngas for liquid fuels and chemicals
and syngas used directly for electricity generation.
7.2.1. Syngas for liquid fuels and chemicals
The quality of syngas from fluidized bed gasification of willow was found to improve as a result
of torrefaction. The H2/CO ratio of the syngas increased as a result of torrefaction and, in some
experiments, was measured greater than 1.0. The syngas had lower moisture content when
torrefied willow was gasified compared to non-torrefied willow. The tar concentration decreased
by 47 % when willow was torrefied to less than 12 % w/w as did the concentration of
naphthalene. Benzene decreased linearly as a result of torrefaction. Toluene, xylene, and
ethylbenzene decreased to a lesser extent than benzene and naphthalene as a result of
torrefaction.
7.2.2. Syngas for electricity generation
Torrefaction is not beneficial to indirect co-firing of willow with lignite coal. The hydrogen-rich
syngas produced by torrefied pellets in a CFB gasifier has a lower calorimetric heating value
compared to syngas from non-torrefied pellets and therefore produces higher emissions on a life-
cycle basis. On the other hand, torrefied pellets directly co-fired produce lower emissions than
non-torrefied pellets due to the increased energy density of the pellets.
The research undertaken in the project and described in the thesis found that increasing the
severity of torrefaction improved the quality of syngas from fluidized bed gasification of willow.
7.3. Implications
7.3.1. Feedback control using syngas quality correlations
The methodology used in this research was to connect pretreatment processes with
thermochemical conversion processes, specifically for the production of advanced biomass
(Figure 1.1). The finding that tar concentration and overall syngas quality is improved under
specific torrefaction conditions has valuable implications for the design of bioenergy and
biorefining processes. Producers of pellets, such as Arbaflame (current supplier of black pellets
to the Thunder Bay generating station in Ontario), can use the methodology and the data to
develop products (advanced biomass) for specific biorefinery processes. The producer can target
the unique requirements of a facility in their process design. On the other hand, during the design
of a biorefinery, advanced biomass and the associated pretreatment process equipment can be
developed alongside the plant design to match the strengths and limitations of the technology
selected in the engineering phase.
101
7.3.2. Mass scanning to evaluate syngas quality
Mass scanning of a complex syngas mixture by a process mass spectrometer was used to identify
heavy hydrocarbon vapours in the syngas (tar species). The method provides a simple analytical
tool for measuring the relative change in tar species as a result of changes in a feedstock. Tests
conducted in a bench or pilot scale reactor can be used to develop advanced biomass prior to
completion of a full-scale process. Highly accurate quantification of tar species in the gas is of
limited value at this scale. However, the relative syngas properties allow the simultaneous
development of pretreatment processes and thermochemical processes shortening the design
cycle and reducing the engineering risks normally associated with heterogeneous biomass
feedstocks. More accurate methods can then be applied during commissioning to fine-tune and
monitor the process.
7.3.3. Emissions reduction with torrefied willow in Saskatchewan
Significant GHG emissions reduction was demonstrated on a life-cycle basis for co-firing of
willow grown on marginal land in Saskatchewan’s Boundary Dam generating station. This work
adds an important life-cycle measure to the existing evidence related to implementation of
agroforestry in southern Saskatchewan.
7.4. Recommendations
Several additional research topics follow from the thesis. The work suggested here utilizes the
methodology and equipment produced and procured during completion of this work.
7.4.1. Torrefaction gas analysis by process mass spectrometry
Quantification of the quality of gases from the torrefaction process is an important design
consideration. Similar to syngas, torrefaction gases are made up of a mixture of useful, high
calorie gases, contaminants, inert gas, and water vapour. The ability to stage torrefaction and
separate gases during the process is a major design benefit of the CTU. Measurement of the gas
quality and recirculation of useful gases is critical to the process optimization and efficiency.
The methods developed in this thesis are excellent for the evaluation of torrefaction gases. Using
the mass spectrometry method and apparatus, torrefaction gases can be analyzed for calorific
content and volatiles. Quantification of gas properties can be used in process design as well as to
evaluate char quality.
7.4.2. Combined water leaching and torrefaction to reduce alkali metals and
alkaline earth elements in agricultural residues
Agricultural residues are abundant in the prairies and problematic in energy processes due to
high concentration of alkali metals and alkaline earth elements in the ash. Water leaching has
been used to remove alkali metals, alkaline earth elements, and halogens from biomass (Jenkins
1998).
Using the feedback control methodology with additional biomass treatment processes will
expand the capacity to modify feedstock quality. Combining torrefaction of wheat straw with
102
water leaching has potential to carbonize the straw while simultaneously reducing the tendency
for slagging and fouling during straw combustion in power boilers.
7.4.3. Soot formation during fluidized bed gasification of torrefied willow
Soot is a recognized and problematic contaminant in syngas and, as described in chapter 6, as a
by-product of large-scale gasification. Soot forms as a result of incomplete reactions during
gasification or combustion and the properties could affect process waste streams. Quantification
of the effects of torrefaction on soot formation and characterization during fluidized bed
gasification is a logical extension of this work. Soot collected during gasification of torrefied and
non-torrefied biomass could be analyzed and compared.

103
7.5. References
Jenkins, B. M., Baxter, L. L., Miles Jr., T. R., and Miles, T. R. 1998. Combustion properties of
biomass. Fuel Processing Technology, 54 (3): 17-46.