production of zero sulfur diesel fuel from domestic coal
TRANSCRIPT

Production of Zero Sulfur Diesel Fuel from Domestic Coal: Configurational Options to Reduce Environmental Impact
December 2011
DOE/NETL-2012/1542

Production of Zero Sulfur Diesel Fuel from Domestic Coal: Configurational Options to Reduce Environmental Impact
Disclaimer This report was prepared as an account of work sponsored by an agency of the United States (U.S.) government. Neither the U.S., nor any agency thereof, nor any of their employees, nor any of their contractors, subcontractors, or their employees makes any warranty, expressed or implied, or assumes any legal liability or responsibility for the accuracy, completeness, or usefulness of any information, apparatus, product, or process disclosed, or represents that its use would not infringe privately owned rights. Reference herein to any specific commercial product, process, or service by trade name, trademark, manufacturer, or otherwise does not necessarily constitute or imply its endorsement, recommendation, or favoring by the U.S. government or any agency thereof. The views and opinions of authors expressed herein do not necessarily state or reflect those of the U.S. government or any agency thereof.
The views, opinions, and findings contained in this document are those of Noblis and should not be construed as the official position, policy, or decision of the organization receiving this report unless so designated by other documentation. The use of trade names in this document does not constitute an official endorsement or approval of the use of such commercial products unless directly stated in the document. This document may not be cited for purposes of advertisement.

Production of Zero Sulfur Diesel Fuel from Domestic Coal: Configurational Options to Reduce Environmental Impact
Production of Zero Sulfur Diesel Fuel from Domestic Coal: Configurational Options to Reduce Environmental Impact
DOE/NETL-2012/1542
December 2011
NETL Contact:
Thomas J. Tarka, P.E. Office of Strategic Energy Analysis & Planning
National Energy Technology Laboratory www.netl.doe.gov

Production of Zero Sulfur Diesel Fuel from Domestic Coal: Configurational Options to Reduce Environmental Impact
Prepared by:
Energy Sector Planning and Analysis (ESPA)
Charles White Noblis
David Gray Noblis
DOE Contract Number DE-FE0004001
Production of Zero Sulfur Diesel Fuel from Domestic Coal: Configurational Options to Reduce Environmental Impact
Acknowledgments
This report was prepared by Noblis for the United States Department of Energy (DOE), National Energy Technology Laboratory (NETL). This work was completed under DOE NETL Contract Number GS-10F-0189T/DE-NT0005816.
The authors wish to acknowledge the excellent guidance, contributions, and cooperation of the NETL staff, particularly:
Thomas J. Tarka, P.E.
Kristin Gerdes (COR)

Production of Zero Sulfur Diesel Fuel from Domestic Coal: Configurational Options to Reduce Environmental Impact
This page intentionally left blank.

Production of Zero Sulfur Diesel Fuel from Domestic Coal: Configurational Options to Reduce Environmental Impact
NETL Viewpoint
Summary
The conversion of domestic resources such as coal and biomass into diesel fuel is a near-term technology pathway to address the energy security, economic sustainability, and climate change concerns which currently face our nation. This study evaluates the economic viability and environmental impact of producing diesel fuel via Fischer-Tropsch (FT) synthesis. Two facility design approaches – focused on fuels production and the co-production of fuels and electricity, respectively – were evaluated for the conversion of domestic resources such as coal or a mixture of coal and biomass.
It was found that diesel fuel can be produced from coal that has a lower life cycle greenhouse gas (GHG) emissions profile than conventional petroleum-derived diesel fuel on a well-to-wheels basis. This requires the sequestration of carbon dioxide (CO2) produced at the facility, and methane mitigation practices may be required in the case of certain bituminous coals which are particularly high in methane content. The coal-derived diesel will be economically viable when crude oil prices are as low as $94 per barrel, corresponding to a petroleum-derived diesel price of $2.70 per gallon.
If sufficient biomass resources are available to co-convert with the coal, the GHG emissions profile of the diesel fuel can be significantly reduced at a minimal increase in cost. This synergy represents a near-term pathway to leverage cellulosic biomass at a large-scale, enabling dramatic cost reductions when compared to current technologies for producing fuels from biomass.
Replacing 15 percent of the feedstock to the facility with switchgrass will result in a fuel which produces up to 34 percent less life cycle GHG emissions than petroleum-derived diesel. Such a facility would be economically viable at crude oil prices as low as $104 per barrel, increasing the diesel fuel price by $0.26 to $0.46 per gallon. The choice of switchgrass is notable because it is an herbaceous crop which can be grown on land not-suitable for food crops, alleviating competition with food crops for cropland. Other cellulosic biomass types can also be leveraged, although the change in fuel price and GHG benefits will vary depending on the biomass which is selected and the type of land it is cultivated on.
The co-production of fuels and electricity as a pathway has the potential to produce less overall GHG emissions than conventional pathways, but these benefits are highly sensitive to the methodology utilized to evaluate these emissions. The economic viability is somewhat sensitive to the price at which electricity can be sold – a 10% change in the electric sale price results in a 1% change in the required selling price of the fuel.
Fischer-Tropsch synthesis is a near-term technology pathway which can be leveraged to produce large volumes of fungible transportation fuels from domestic coal and biomass. A commercial-scale plant would produce 50,000 barrels per day, or almost 700 million gallons per year, using technologies which are available, but which require an integrated demonstration. The fuels are economically viable at diesel prices as low as $2.70 per gallon, and technological headroom exists for innovation that will further bring down cost. It is NETL’s hope that this study will shed light on how design decisions and feedstock choice can impact the techno-economic performance of FT facilities, informing policy makers and developers on the potential of this pathway in improving America’s energy security while addressing climate change concerns.

Production of Zero Sulfur Diesel Fuel from Domestic Coal: Configurational Options to Reduce Environmental Impact
Background
Recent concerns over dependence on foreign oil, greenhouse gas (GHG) emissions from the transportation sector, and economic sustainability have prompted a renewed interest in fuels produced from domestic feedstocks. The use of biomass-derived feedstocks has been of particular interest due to (1) potential reduction in GHG emissions associated with photosynthetic-derived fuels, (2) the renewable nature of the feedstock, and (3) the widespread domestic availability.
The National Energy Technology Laboratory (NETL) has a history of research and development in the area of liquid transportation fuel production from coal dating back to 1943. Many of the technologies developed for conversion of coal to transportation fuels can also be leveraged for the conversion of biomass-derived feedstocks, either independently or in conjunction with coal.
The renewed interest in domestically produced fuels has prompted NETL to investigate how existing technologies can be leveraged to convert domestic feedstocks such as coal and biomass into transportation fuels which can be utilized in today’s fueling infrastructure. These studies, most notably the January 2009 report entitled Affordable, Low-Carbon Diesel Fuel from Domestic Coal and Biomass (DOE/NETL-2009/1349), have focused on estimating both the cost of large-scale fuel production and the life cycle GHG emissions impact of the fuels produced, such that different production pathways and feedstock pairings can be evaluated.
This study builds upon that previous work, examining a number of different plant configurations, water management strategies, and feedstock pairings. The methodology and metrics used herein have been refined, and the results presented herein generally supersedes those presented previously in both the January 2009 report, as well as those presented in the April 2007 report entitled Baseline Technical and Economic Assessment of a Commercial Scale Fischer-Tropsch Liquids Facility (DOE/NETL-2007/1260).
A number of cases represented in the January 2009 report were not updated due to time and resource constraints, including scenarios where: (1) CO2 produced by the facility is vented to the atmosphere; (2) a more capital intensive configuration was utilized in order to achieve more aggressive CO2 emissions reductions; and (3) the facility utilizes biomass alone as a feedstock. The findings of those cases are worth mentioning as they are not reiterated herein:
Sequestering CO2 produced at these facilities has a minimal impact on the price of the finished fuel – a price increase of roughly $0.12/gallon or $5/barrel – representing a great opportunity for early CO2 sequestration demonstrations and deployment;
GHG emissions can be further reduced beyond the cases reported by making changes to the process configuration utilized, but this comes at a cost; and
Biomass resource constraints prevent biomass-only facilities from being cost-competitive (crude prices in excess of $200 per barrel are required for economic viability).

Production of Zero Sulfur Diesel Fuel from Domestic Coal: Configurational Options to Reduce Environmental Impact
Study Objectives
The objective of this study is to evaluate the economic and environmental performance of converting either: (a) coal or (b) a combination of coal with a modest amount (15% by weight) of biomass, into zero sulfur diesel fuel using commercially available technologies. Performance is measured by such metrics as: (1) required selling price of the fuel; (2) crude oil price when the process will become economically viable; (3) the Well-to-Wheels (WTW) life cycle GHG emissions profile of the diesel fuel; and (4) the water usage associated with the facility.
The study expands upon previous work by examining the following new scenarios:
Conversion of additional coal types (subbituminous coal) at a facility located in the Western part of the United States;
Poly-generation of electricity with fuels (up to 12% of the total product slate); and
How different cooling technologies can be leveraged to reduce water usage.
Several additional refinements were also made to update previous results, including modification to the plant configuration, based on lessons learned and updated performance/environmental metrics. These changes have been described below.
Approach
The low temperature Fischer-Tropsch synthesis process was selected for producing zero sulfur diesel fuel from coal and coal/biomass mixtures. This selection was made on the basis of (1) commercial availability and operating experience of the FT process for diesel fuel production, (2) robustness of the supporting technologies (syngas production from coal or coal/biomass), and (3) the ability to produce an ultra-clean diesel fuel which is fungible in today’s fueling infrastructure.
In order to provide a comprehensive look at the potential of domestic coal to liquids (CTL) facilities, both bituminous and subbituminous coals were evaluated as taken together these coal types represent 90% of the domestic reserve base (53% and 37%, respectively). Switchgrass was selected as a representative type of biomass for use in evaluating Coal and Biomass to Liquids (CBTL) facilities, based on its potential to be grown on degraded and marginal lands which may not be suitable for food production. It is a drought-resistant, herbaceous biomass which can be grown throughout the United States with a minimum of management after established.
Two broad design approaches were considered: one in which the facility is designed to primarily produce liquid fuels, and a poly-generation plant which is designed to also co-produce electric power for sale into the grid. In the fuels-focused production facility, a portion of the unconverted syngas is recycled back to the FT reactors, resulting in a greater percentage of the original carbon in the feedstock being converted into liquid fuels. A modicum of export electric power for sale may be produced in these cases, up to 4% of the total product slate, based on combustion turbine sizing. In the poly-generation facility, none of unconverted syngas is recycled: instead it only passes through the FT island once and is combusted for power generation, resulting in additional electric power for sale, up to 12% of the total product slate. This latter case is sometimes referred to as a “once-through” configuration.
Both the fuels-focused facility (i.e. the “recycle” configuration) and the once-through configuration are designed to produce 50,000 barrels per day (bpd) of FT liquids, comprised of

Production of Zero Sulfur Diesel Fuel from Domestic Coal: Configurational Options to Reduce Environmental Impact
34,000 bpd of FT diesel (or 69% of the product) with the balance consisting of FT naphtha.1 The FT diesel is completely fungible in today’s fueling infrastructure and can be used as a drop-in fuel, while the FT naphtha is assumed to be sold for use as an ethylene cracker feedstock.
Applying the 50,000 bpd design constraint to the once-through configuration results in significantly larger gasification, gas-cleanup, and power island areas of the facility, and consequently, higher capital outlays and operating costs for the poly-generation facility. Put simply: more syngas must be generated in the gasification island for the “once-through” cases to make up for the absence of recycled syngas, increasing the size of the facility in those cases.
Finally, life cycle GHG assessments were performed using the “displacement” methodology of accounting for co-products produced in the facilities, namely FT naphtha and in some cases electrical power. As this methodology can be sensitive to the assumed GHG profiles of the co-products, a second methodology was also utilized wherein the life cycle GHG emissions produced prior to the product transportation and use are divided across all of products based on the usable energy fraction of that product. The results of the “energy allocation” LCA are detailed in Appendix B of the report.
Key Design Choices
The decision to evaluate both bituminous and subbituminous coals, as well as biomass, dictated a number of design choices, including plant location and water management strategy. The bituminous coal cases were assumed to be located in Illinois near the coal resource. As water availability is not expected to be a concern in Illinois locations, process cooling was accomplished by the use of mechanical draft evaporative cooling towers, which are the most economical and have the smallest impact on overall plant efficiency.
Subbituminous coal is generally found west of the Mississippi in the Powder River Basin (PRB). The facilities which utilize PRB coal are assumed to be located in Montana where water resources are expected to be scarce, requiring tight water management. This prompted the evaluation of three different strategies for process cooling water management: (1) mechanical draft evaporative cooling towers; (2) hybrid cooling in which a closed loop, air-cooled condenser is utilized to condense steam exiting the low-pressure turbine – reducing evaporative cooling load and therefore water losses – and the remainder of the cooling needs are met through the use of mechanical draft evaporative cooling towers similar to those used in the first strategy; and (3) a closed-loop, indirect, dry cooling system is used in which air is blown through a dry-cooling tower and the only water losses in the process cooling system are those associated with blow-down to maintain water quality. This provided insights into impacts water use reduction on the performance and economics of facility.
The feedstocks, along with the FT operating requirements (high pressure, oxygen-blown operation), also dictated the choice of gasification technology. The use of relatively reactive, high-moisture feedstocks such as the PRB coal and biomass indicate that either a fluidized bed or a dry-feed gasifier would be appropriate. However, a fluidized bed gasifier is not appropriate for bituminous coals due to the reduced reactivity of that feedstock, hence it was determined that a dry feed, entrained flow gasifier would be used for syngas generation in this study.
1 Liquefied Petroleum Gases, or LPGs, produced were combusted for electricity generation.

Production of Zero Sulfur Diesel Fuel from Domestic Coal: Configurational Options to Reduce Environmental Impact
A preliminary analysis comparing the performance of the commercially-available dry-feed, entrained flow gasifiers – a notably those offered by Shell and Siemens – concluded that the environmental performance and efficiency of the Shell-type gasifier was better, but that the use of the lower cost Siemens gasifier resulted in a lower price hurdle for the product. The Siemens gasifier was selected for use in this study in order to produce the least expensive fuel, but it is recognized that a choice to place a focus on environmental or system performance might result in different gasifier choice.1 Similarly, other gasifiers might be appropriate for different feedstocks or feedstock pairings.
A final design choice was to use a combined cycle – gas turbines to combust unconverted syngas and F-T tail gases coupled with a heat recovery steam generator (HRSG) and steam turbine – for the production of electric power to meet the needs of the facility. This marks a shift in design from the Affordable, Low-Carbon Diesel Fuel study, in which these gases were combusted in a boiler to raise steam for use in a steam turbine. The shift to a combined cycle has the benefit of a more efficient power generation cycle, but results in the production of excess electrical power in a number of the recycle plant designs based on a need to meet turbine flow rate requirements.
The production of excess power in both the fuels-focused and poly-generation scenarios can make the comparison of the different facilities more difficult due to the:
1) choice of life cycle analysis (LCA) methodology, which can result in significantly different results when evaluating electricity as a co-product, and
2) the power cycle being less efficient than the production of fuels, which can give the appearance that the use of one feedstock over another would be preferred.
Key Results
The over-arching results of this study are that diesel fuel produced from coal:
Is economically viable when crude oil prices reach $95/bbl or $98/bbl for the recycle and poly-generation scenarios, respectively. This equates to diesel prices in the range of $2.70 to $2.80 per gallon of petroleum diesel.
Will produce less life cycle GHG emissions than petroleum fuels if produced from a recycle facility, regardless of the LCA methodology employed, so long as CO2 produced by the facility is sequestered. In the case of particularly high-methane content bituminous coals, methane mitigation may also be required at the site of the mine.
Will, in the case of the poly-generation scenario, produce either significantly less or slightly more life cycle GHG emissions than petroleum fuels depending on the LCA methodology used. Therefore, poly-generation facilities might require the use of modest amounts of biomass (less than 10% by weight) or more aggressive carbon capture strategies if petroleum parity is required.
Will require between 1.6 and 7.4 barrels of water for each barrel of FT product produced, depending on the water management strategy utilized.
1 The NETL report entitled Cost and Performance Baseline for Fossil Energy Plants Volume 4: Coal-to-Liquids via Fischer-Tropsch Synthesis, due to be published later this year, examines the use of a Shell gasifier and can be used as counter-point to this study.

Production of Zero Sulfur Diesel Fuel from Domestic Coal: Configurational Options to Reduce Environmental Impact
If a modest amount of biomass is co-gasified with the coal to produce liquid fuels:
The point of economic viability is increased by $9 to $15 per bbl, to between $104/bbl and $115/bbl, representing a $0.26 to $0.46 per gallon increase in fuel price over the coal cases.
The fuel will produce less GHG emissions than petroleum-derived fuels, regardless of the configuration choice or LCA methodology, if 15 percent of the feedstock to the facility is switchgrass. A reduction of up to 34 percent less life cycle GHG emissions than petroleum-derived diesel is possible at this level of biomass usage.
Additional results:
The overall plant efficiency of the sub-bituminous coal cases is higher than that of the bituminous coal cases. This is due to the increased electrical power produced in the bituminous coal cases, which reduces the efficiency of the facility (as power generation is less efficient than fuel production). Less power is produced in the sub-bituminous cases as some of the steam which would otherwise be used for power production is instead utilized to dry the relatively high-moisture content subbituminous coal.
The poly-generation cases are all larger and more expensive than the recycle cases due to the 50,000 bpd design constraint. The facilities would be similar in size and cost if the coal input rate – and therefore syngas production rate –was held constant between the two cases, although the poly-generation cases would then have a lower fuels output.

Production of Zero Sulfur Diesel Fuel from Domestic Coal: Configurational Options to Reduce Environmental Impact
i
Table of Contents Executive Summary .........................................................................................................................2 1 Introduction .................................................................................................................................15 1.1 Scope of the Study ...................................................................................................................15 2 Basis of Conceptual Plant Designs .............................................................................................24 2.1 Case BRW00: CTL Recycle Configuration, Bituminous Coal ...............................................24 2.2 Case BOW00: CTL Once-Through Configuration, Bituminous Coal .....................................25 2.3 Case BRW15: CBTL Recycle Configuration, Bituminous Coal and 15 Percent Switchgrass 26 2.4 Case BOW15: CBTL Once-Through Configuration, Bituminous Coal and 15 Percent
Switchgrass .............................................................................................................................28 2.5 Case SRW00: CTL Recycle Configuration, PRB Coal and Wet Cooling Tower Water
Management ...........................................................................................................................28 2.6 Case SRA00: CTL Recycle Configuration, PRB Coal, Maximum Air Cooling .....................29 2.7 Case SRH00: CTL Recycle Configuration, PRB Coal, Hybrid Cooling .................................29 2.8 Cases SOW00, SOA00, SOH00: CTL Once-Through Configuration, PRB Coal ...................30 2.9 Cases SRW15, SRA15, SRH15, SOW15, SOA15, SOH15: CBTL Configurations, PRB Coal
and 15 Percent Switchgrass ....................................................................................................30 3 Methodology ...............................................................................................................................55 3.1 Process Performance Estimates ...............................................................................................55 3.2 Cost Estimates ..........................................................................................................................55 3.3 Required Selling Price Estimates for Products ........................................................................57 3.4 Limited Life Cycle GHG Estimates .........................................................................................59 4 Feedstock Analysis and Site Conditions .....................................................................................64 4.1 Feedstock Analysis ..................................................................................................................64 4.2 Site Conditions .........................................................................................................................65 5 Results .........................................................................................................................................67 5.1 Overall Results Summary for Bituminous Coal Configurations .............................................68 5.2 Overall Results Summary for Subbituminous Coal Only Configurations ...............................71 5.3 Overall Results Summary for Subbituminous CBTL Configurations .....................................75 6 Sensitivity Analyses ....................................................................................................................77 6.1 Sensitivity to Indirect Air Cooling Capital Cost Estimate .......................................................77 6.2 Sensitivity to Co-produced Electric Power Value ...................................................................78 6.3 Sensitivity to Return on Equity ................................................................................................79 7 Findings and Conclusions ...........................................................................................................58 8 References ...................................................................................................................................60 Appendix A: Case Parameters and Results ....................................................................................63 Appendix B: LCA Methodologies Comparison ............................................................................90
Production of Zero Sulfur Diesel Fuel from Domestic Coal: Configurational Options to Reduce Environmental Impact
ii
List of Tables Table 1-1: Bituminous Coal Configurations ................................................................................. 16 Table 1-2: Subbituminous Coal Configurations ........................................................................... 18 Table 3-1: Components of Owner's Costs .................................................................................... 56 Table 3-2: Components of the Total As Spent Capital ................................................................. 56 Table 3-3: Feedstock Costs ........................................................................................................... 57 Table 3-4: By-Product Value ........................................................................................................ 57 Table 3-5: Economic Parameters Used in DCF Analysis ............................................................. 58 Table 3-6: GHG Emissions from Coal Mining ............................................................................. 60 Table 3-7: GHG Emissions from Switchgrass Production and Transportation ............................ 61 Table 3-8: Baseline Petroleum Diesel GHG Values ..................................................................... 61 Table 3-9: FT Naphtha Displacement Values ............................................................................... 62 Table 3-10: Displacement Values for Co-produced Electric Power ............................................. 62 Table 3-11: GHG Items Used in Accounting ............................................................................... 63 Table 4-1: Analysis of Illinois #6 Bituminous Coal ..................................................................... 64 Table 4-2: Analysis of Montana Rosebud PRB Coal ................................................................... 65 Table 4-3: Analysis of Switchgrass Biomass ................................................................................ 66 Table 4-4: Site Conditions for Eastern U.S. and Western U.S. C/BTL Plants ............................. 66 Table 5-1: Results Summary for Bituminous Coal Configuration ............................................... 70 Table 5-2: Results Summary for Subbituminous CTL Configurations ........................................ 74 Table 5-3: Results Summary for Subbituminous CBTL Configurations ...................................... 75 Table A-1: Bituminous - Plant Carbon Balances .......................................................................... 62 Table A-2: Bituminous - Overall Carbon Credits and Debits (ton/yr) ......................................... 64 Table A-3: Bituminous - Plant Power Summary (MWe) ............................................................. 65 Table A-4: Bituminous - Plant Water Balance (gpm) .................................................................. 66 Table A-5Bituminous - Cooling Water Circuit (gpm) .................................................................. 67 Table A-6: Bituminous - Bare Erected Cost Summary ($MM) .................................................. 687 Table A-7: Bituminous - Cost Details of Syngas Cleaning & Shift ($MM/yr) ............................ 68 Table A-8: Bituminous - Annual Operating and Maintenance Costs ($MM/yr) .......................... 68 Table A-9: Bituminous - Total Capital Costs Summary ($MM) .................................................. 69 Table A-10: Bituminous - Overall Economic Summary .............................................................. 69 Table A-11: SubbituminousCTL - Plant Carbon Balances ........................................................... 71 Table A-12: Subbituminous CTL - Overall Carbon Credits and Debits (ton/yr) ....................... 721 Table A-13:Subbituminous CTL - Plant Power Summary (MWe) .............................................. 73 Table A-14:Subbituminous CTL - Plant Water Balances (gpm) .................................................. 74 Table A-15 Subbituminous CTL - Cooling Water Circuit (gpm) ................................................. 75 Table A-16: Subbituminous CTL - Bare Erected Cost Summary ($MM) .................................... 76 Table A-17: Subbituminous CTL - Cost Detail of Syngas Cleaning & Shift ($MM/yr) ............. 77 Table A-18: Subbituminous CTL - Annual Operating and Maintenance Cost ($MM/yr) ........... 78 Table A-19: Subbituminous CTL - Total Capital Cost Summary ($MM) ................................... 77 Table A-20: Subbituminous CTL - Overall Economic Summary ................................................ 78 Table A-21: Subbituminous CBTL - Plant Carbon Balances ....................................................... 79 Table A-22: Subbituminous CBTL - Overall Carbon Credits and Debits (ton/yr) ....................... 80 Table A-23: Subbituminous CBTL - Plant Power Summary (MWe) ........................................... 81

Production of Zero Sulfur Diesel Fuel from Domestic Coal: Configurational Options to Reduce Environmental Impact
iii
Table A-24: Subbituminous CBTL - Plant Water Balance (gpm) ................................................ 82 Table A-25 Subbituminous CBTL – Cooling Water Circuit (gpm) ............................................. 84 Table A-26: Subbituminous CBTL - Bare Erected Cost Summary ($MM) ............................... 854 Table A-27: Subbituminous CBTL - Cost Details of Syngas Cleaning & Shift ($MM/yr) ......... 85 Table A-28: Subbituminous CBTL - Annual Operating and Maintenance Cost ($MM/yr) ......... 86 Table A-29: Subbituminous CBTL - Total Capital Cost Summary ($MM) ................................. 87 Table A-30: Subbituminous CBTL - Overall Economic Summary...............................................88 Table B-1: Comparison of Petroleum Ratio Values for Displacement and Energy Allocation LCA Methodologies.......................................................................................................................90
List of Figures Figure 2-1: Block Flow Schematic for the Case BRW00 CTL .................................................... 24 Figure 2-2: Block Flow Schematic for the Case BOW00 CTL .................................................... 26 Figure 2-3: Block Flow Schematic for Case BRW15 CBTL ....................................................... 26 Figure 2-4: Block Flow Schematic for Case B0W15 CBTL ........................................................ 27 Figure 6-1: Sensitivity of Diesel RSP to Air Cooling Capital Cost ............................................. 77 Figure 6-2: Sensitivity of Diesel RSP to Electric Power Value.................................................... 78 Figure 6-3: Sensitivity of Diesel RSP to IRROE .......................................................................... 79
Production of Zero Sulfur Diesel Fuel from Domestic Coal: Configurational Options to Reduce Environmental Impact
iv
Acronyms and Abbreviations
AR As Received ARR Annual Revenue Requirement ASU Air Separation Unit BEC Bare Erected Cost BFW Boiler Feedwater BPD Barrels per Day CBM Coal Bed Methane CBTL Coal/Biomass-to-Liquids CCS Carbon Capture and Sequestration CE Carbon Equivanlent CH4 Methane CMM Coal Mine Methane CO2 Carbon Dioxide CO2E Carbon Dioxide Equivalent COE Crude Oil Equivalent CRF Capital Recovery Factor CTEU Cradle-to-end-user CT Cooling Tower CTL Coal-to-Liquids DB Daily Barrel DCF Discounted Cash Flow DOE Department of Energy EISA Energy Independence and Security Act EPA Environmental Protection Agency EPCC Engineering, Procurement, and Construction Cost FT Fischer-Tropsch GHG Greenhouse Gas GWP Global Warming Potential HHV High Heating Value HRSG Heat Recovery Steam Generator IGCC Integrated Gasification Combined Cycle IPCC Intergovernmental Panel on Climate Change LCA Life Cycle Analysis LHV Low Heating Value LP Low Pressure LPG Liquefied Petroleum Gas MAC Main Air Compressor MDEA Methyldiethanolamine MF Monitoring Fund N2O Nitrous Oxide NETL National Energy Technology Laboratory NGCC Natural Gas Combined Cycle O&M Operations and Maintenance
Production of Zero Sulfur Diesel Fuel from Domestic Coal: Configurational Options to Reduce Environmental Impact
ii
OPEC Organization of the Petroleum Exporting Countries OT Once-Through PR Petroleum Ratio PRB Powder River Basin RSP Required Selling Price SG Switchgrass SWS Sour Water Stripper T&D Transmission and Distribution TASC Total as Spent Capital TCR Total Capital Requirement TOC Total Overnight Cost TPC Total Plant Cost TPD Tons per day TS&M Transport, storage, and monitoring

Production of Zero Sulfur Diesel Fuel from Domestic Coal: Configurational Options to Reduce Environmental Impact
1
This page intentionally left blank.
Production of Zero Sulfur Diesel Fuel from Domestic Coal: Configurational Options to Reduce Environmental Impact
2
Executive Summary If, in the future, world conventional oil supplies become scarce enough to threaten the security of our nation’s energy supply, the ability to produce fungible transportation fuels from our domestic coal and biomass resources could counterbalance this threat.
Because of the continuing concern over global climate change, Section 526 of the Energy Independence and Security Act (EISA) mandates that Government cannot purchase alternative fuels that have a greenhouse gas (GHG) footprint higher than petroleum. To meet this requirement for coal-to-liquids (CTL) plants, successful deployment of carbon capture and sequestration (CCS) will be necessary.
When CCS is applied to CTL the resulting life cycle greenhouse gas (GHG) footprint for production and utilization of CTL fuels can be less than comparable fuels produced from petroleum. Additions of small quantities of biomass that can be gasified together with the coal can further reduce the GHG footprint compared to petroleum. In these ways, with choice of configuration, CCS, and addition of biomass, the life cycle GHG emissions can be considerably less than petroleum.
In addition to concerns over global climate change, availability of fresh water is becoming an important issue. This is particularly the case in semi-arid areas where there is competition for scarce water resources. These areas include the Powder River Basin regions of Montana and Wyoming where about 37 percent of the nation’s demonstrated coal reserve base resides. Utilization of this Western coal resource at a near mine mouth location would mandate employment of water management practices that minimize consumption.
Because of these dual concerns of climate change and water availability the National Energy Technology Laboratory (NETL) requested that Noblis perform an analysis of conceptual CTL and Coal/Biomass-to-Liquids (CBTL) plant configurations that could reduce both the GHG footprint as estimated by life cycle analysis (LCA) and the overall consumption of water. In response to this request, Noblis simulated a series of conceptual CTL and CBTL plant configurations with recycle and once-through configurations, with bituminous and subbituminous coals, with CCS, with and without addition of biomass, and with various water management options. These conceptual plants were then analyzed to determine the technical performance, to estimate the economics and required selling price of the fuels, to estimate the overall water consumption, and to compare the life cycle GHG footprint with petroleum derived fuels.
Aspen Plus was used to simulate conceptual CTL and CBTL plants that produced Fischer-Tropsch (FT) diesel fuel, naphtha, and in many cases electric power for sale to the grid. Both bituminous and subbituminous coals were used as feedstock to the CTL plants and 15 percent by mass switchgrass on an as received basis was added in the CBTL configurations. The plants were operated in both recycle and once-through modes.
There are sixteen configurations analyzed in this report. The Case Identifier is a five character code based on the specific case configuration. The first character denotes the coal type with “B” denoting bituminous and “S” denoting subbituminous. The second character denotes the recycle

Production of Zero Sulfur Diesel Fuel from Domestic Coal: Configurational Options to Reduce Environmental Impact
3
configuration. “R” denotes simple recycle and “O” denotes once-through. The third character denotes the cooling configuration. “W” refers to the system where mechanical draft water cooled cooling towers are used for the plant cooling duties. “A” denotes configurations with maximum air cooling and “H” denotes the hybrid cooling scheme. Only the subbituminous coal plants assumed to be located in Montana, where water resources are scarce, use A and H water management. The fourth and fifth characters designate the mass fraction of biomass on an as-received basis.
For the bituminous coal cases (BRW00, BOW00, BRW15, and BOW15) the following findings can be made by referring to Table ES-1:
For the two CTL plants with no biomass addition (cases BRW00 and BOW00) the petroleum ratio (PR) calculated by using the LCA displacement methodology was found to be less than one. The PR is defined in Section 3.4 and if it is less than one the life cycle GHG emissions are less than diesel fuel produced from crude oil (petroleum-derived diesel fuel). The PR for once-through configurations was lower than for recycle because the displacement methodology was used for the GHG LCA and credit was taken for co-produced power and naphtha. This implies that if the LCA displacement methodology is used, CTL plants with CCS are able to produce fuels compliant with Section 526 with no biomass addition if the appropriate configuration is used to capture the CO2 produced during fuels production.
One feasible option to further reduce the PR of CTL plants with CCS is to add biomass. This study analyzed the impact of adding 15 percent by mass of switchgrass (on an as-received basis). For the recycle case this reduced the PR from 0.91 to 0.70; well below the GHG footprint of petroleum-derived fuels. However for this size plant this required the addition of 3,500 TPD of biomass. To obtain that quantity of biomass on a continuous basis for 328 days per year could well be a challenge. The encouraging aspect is that only a relatively small percentage of biomass would be needed to be significantly below a PR of one. This implies that amounts lower than 15 percent would insure that the CBTL plant would be capable of producing fuels easily compliant with Section 526 of EISA. The lowest petroleum ratio of 0.53 was for the 15 percent biomass once-through case. This is the result of taking the biomass carbon credit and the power and naphtha displacement credits.
For the bituminous coal cases the overall efficiency was higher for plants configured in the recycle mode of operation. This is because it is generally more efficient to produce fuels than power.
For the bituminous coal cases there was no effort made to reduce water consumption and conventional water cooling was used. For recycle cases water consumption was around 7.5 barrels per barrel of fuel product‡. For once-through cases water demand increased
‡ Note that this analysis ratios the water use to the fuels products, not the total energy products. If there was no excess power, the water usage ratio would be smaller.
Production of Zero Sulfur Diesel Fuel from Domestic Coal: Configurational Options to Reduce Environmental Impact
4
(around 8.5 barrels per barrel) because of additional cooling duty needed for turbine steam condensation.
In the recycle mode, addition of 15 percent biomass imposes about a $10 per barrel penalty on the required selling price (RSP) of the FT diesel product. In the once-through mode the penalty increases to $13 per barrel of FT diesel product ($13/bblFTD). This penalty is the result of the high cost of biomass on a Btu basis ($5.34/MMBtu) and the pretreatment and biomass preparation costs. The penalty is exacerbated in the once-through case by the increased biomass feed rate required to the facility, associated with the larger overall size of the once-through plants.
The resulting RSP of zero sulfur diesel fuel from these bituminous C/BTL plants averages $122/bblFTD ($2.90/gallonFTD).
For the subbituminous coal only cases (SRW00, SRA00, SRH00, SOW00, SOA00, and SOH00) the following findings can be made by referring to Table ES-2:
The six subbituminous cases all produce fuels with slightly lower PRs than petroleum-derived fuel. The once-through cases have lower PRs than the recycle cases because of the electric power GHG displacement credit.
The subbituminous cases investigated three different water management techniques to assess their impact on performance and costs. For a benchmark, case SRW00 used all water cooling although this would be unlikely in practice because of the semi-arid plant location. Using indirect air cooling for the recycle case reduced water use from 6.7 barrels of water per barrel of fuel product (bbl/bbl) to 1.6 bbl/bbl. The hybrid water management system had a water use in between air and water cooling at 3.9 bbl/bbl. Similar results were obtained for the once-through configurations although water use is increased over that of the recycle cases.
Air and hybrid cooling impose an additional energy penalty that results from the power use for the air cooling fans. This increases the parasitic power requirement for these cases.
Using air and hybrid cooling imposes a cost penalty that is reflected in the increase in the RSP of the diesel fuel produced. Air cooling increases the RSP of diesel in the recycle case by $5.40/bblFTD. Hybrid cooling adds a $3.20/bblFTD penalty. Because of the value of the co-produced power the penalty for the once-through cases is less.
For water cooling cases the total overnight cost (TOC) is higher for the subbituminous plants than for the bituminous. This is primarily because of the greater coal throughput in the subbituminous cases. However, the lower coal cost tends to compensate for this and the resulting diesel RSPs for Cases BRW00 and SRW00 are very close, as are the RSPs for Cases BOW00 and SOW00.
For the subbituminous coal cases with biomass (SRW15, SRA15, SRH15, SOW15, SOA15, and SOH15) the following findings can be made by referring to Table ES-2:
The PRs are significantly reduced compared to the subbituminous coal-only cases. Section 526 compliance would be readily attained with these configurations.

Production of Zero Sulfur Diesel Fuel from Domestic Coal: Configurational Options to Reduce Environmental Impact
5
As expected the trends in water usage follow those of the subbituminous coal-only cases.
The TOC for this series of cases is the highest. This is because of the higher plant coal through put and the costs of biomass pretreatment. This results in the highest RSP for the FT diesel product.
This comprehensive study of C/BTL using different coals, different configurations, and several water management options has produced a matrix of results that can be used to gain a better understanding of the complexities of these integrated systems. The overall findings of this study are that both Eastern bituminous and Western subbituminous coals could be used to produce high quality, fungible diesel fuel for transportation if future circumstances warranted. Further, that this fuel could be produced with a smaller GHG footprint than petroleum fuels§ and with low water consumption.
However, the estimated capital cost of these C/BTL plants is high, in the range of $135,000 to $170,000 per daily barrel on a TOC basis. This combined with feedstock and other operating and maintenance costs results in RSPs for the diesel fuel produced in the range of $113-$137 per barrelFTD ($2.68 -$3.27/gallonFTD). These fuels will be economically viable to produce when crude oil is as low as $94 to $95 per barrel ($94-$95/bblCOEP, or crude oil equivalent price) for the coal-only cases (subbituminous and bituminous coal cases, respectively) or as low as $104 to $109/bblCOEP for the coal/biomass cases (bituminous and subbituminous cases, respectively).
It should also be emphasized that this study is a conceptual design study. The technologies utilized are all commercially available, however, the specific plant configurations evaluated have not been built. Therefore, while the configurations are technically feasible, an integrated demonstration will be required to reduce the potentially significant uncertainty in both the estimated capital and operating costs of the plants.
There are also technical performance uncertainties. Primary among these is the suitability of the biomass switchgrass to be used as a feed for high pressure entrained flow gasification. Pretreatment of this material will be challenging and other more amenable biomass may have to be used in a commercial plant. Although there will be some differences in the results if other biomass is used it is not expected to change the overall conclusions of the study.
In this study it is assumed that once the CO2 produced in the C/BTL plant has been captured and compressed it can be sequestered for a certain cost and these costs are accounted for in the cost of the fuel. One sequestration pathway, enhanced oil recovery (EOR), has been proven and may be the best near-term solution for CO2 long-term sequestration. This report, however, assumes sequestration in a geologic reservoir owing to the larger sequestration potential of such reservoirs. Technologies and potential storage reservoirs for this approach are currently being demonstrated and the hope is that many of them will prove successful. Another uncertainty is the costs and penalties associated with using total indirect air cooling for cooling duty. The costs and
§ In the case of the CTL configurations, the actual plant configuration and feedstock choice required for the fuel to meet this requirement will vary based on the LCA methodology utilized, as certain methodologies favor a recycle configuration, while others favor the co-production of electricity (once-through). The co-utilization of small fractions of biomass in the C/BTL configurations ensures that the fuel has a smaller GHG footprint than petroleum fuels.

Production of Zero Sulfur Diesel Fuel from Domestic Coal: Configurational Options to Reduce Environmental Impact
6
penalties involved may be higher than have been estimated in this study. Another issue is the disposition and value of the FT co-product naphtha. Although an excellent feed stock for ethylene production, production of large quantities of this material may not be readily marketable. Additional studies being performed by NETL are examining the potential of upgrading this naphtha to gasoline of a sufficient octane to be used as a fungible fuel in today’s fueling infrastructure.
Production of Zero Sulfur Diesel Fuel from Domestic Coal: Configurational Options to Reduce Environmental Impact
7
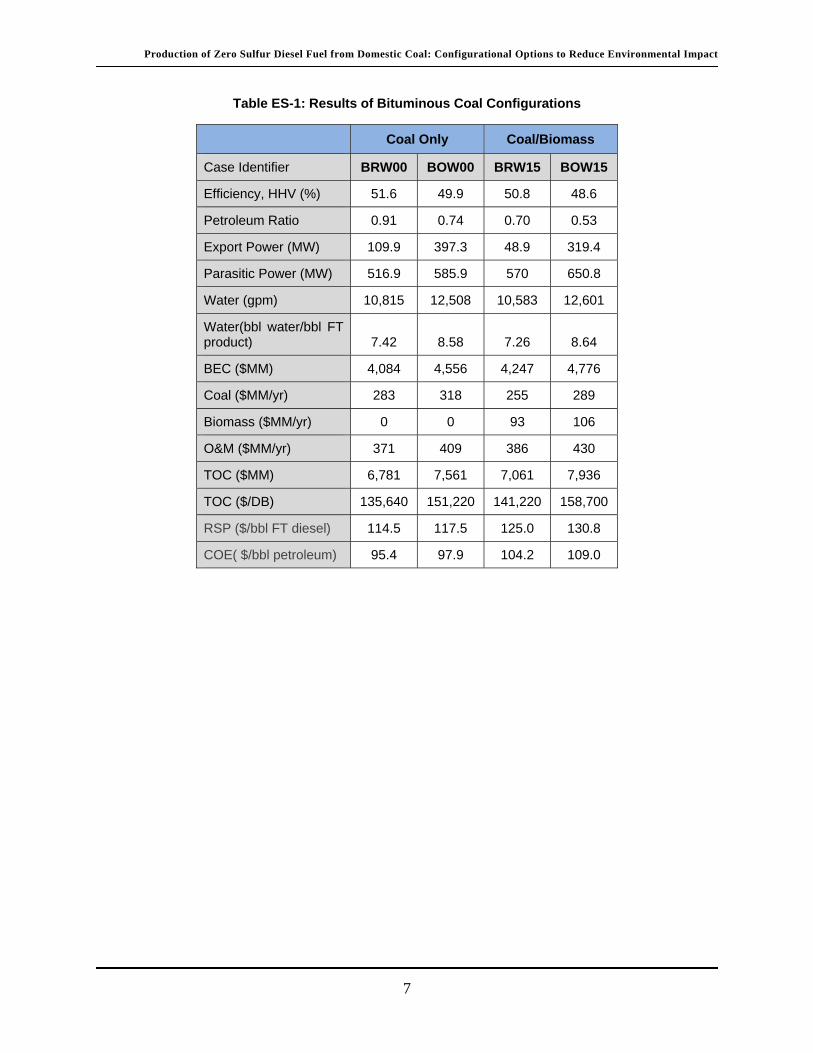
Table ES-1: Results of Bituminous Coal Configurations
Coal Only Coal/Biomass
Case Identifier BRW00 BOW00 BRW15 BOW15
Efficiency, HHV (%) 51.6 49.9 50.8 48.6
Petroleum Ratio 0.91 0.74 0.70 0.53
Export Power (MW) 109.9 397.3 48.9 319.4
Parasitic Power (MW) 516.9 585.9 570 650.8
Water (gpm) 10,815 12,508 10,583 12,601
Water(bbl water/bbl FT product) 7.42 8.58 7.26 8.64
BEC ($MM) 4,084 4,556 4,247 4,776
Coal ($MM/yr) 283 318 255 289
Biomass ($MM/yr) 0 0 93 106
O&M ($MM/yr) 371 409 386 430
TOC ($MM) 6,781 7,561 7,061 7,936
TOC ($/DB) 135,640 151,220 141,220 158,700
RSP ($/bbl FT diesel) 114.5 117.5 125.0 130.8
COE( $/bbl petroleum) 95.4 97.9 104.2 109.0

Production of Zero Sulfur Diesel Fuel from Domestic Coal: Configurational Options to Reduce Environmental Impact
13
Table ES-2: Results of Subbituminous Coal Configurations
Coal Only Configurations Biomass And Coal
Case Identifier SRW00 SRA00 SRH00 SOW00 SOA00 SOH00 SRW15 SRA15 SRH15 SOW15 SOA15 SOH15
Efficiency, HHV(%) 53.0 51.3 52.2 50.6 50.1 50.5 50.0 48.2 49.5 48.9 48.4 48.8
Petroleum Ratio 0.93 0.97 0.95 0.82 0.86 0.83 0.66 0.70 0.67 0.52 0.57 0.53
Export Power (MW) 0.0 0.0 0.0 227.2 190.9 213.9 0.0 0.0 0.0 190.3 150.5 177.2
Parasitic Power(MW) 504.5 539.0 524.6 568.4 588.0 581.9 605.3 648.9 624.9 659.1 679.2 672.4
Water (gpm) 9,741 2,348 5,715 11,540 2,693 6,798 10,688 2,386 6,590 11,881 2,490 7,005
Water(bbl water/bbl FT product) 6.68 1.61 3.92 7.91 1.85 4.66 7.33 1.64 4.52 8.15 1.71 4.8
BEC ($MM) 4,238 4,473 4,384 4,735 4,848 4,822 4,681 4,963 4,815 5,069 5,180 5,152
Coal ($MM/yr) 116 120 118 130 130 130 107 112 109 116 116 116
Biomass($MM/yr) 0 0 0 0 0 0 117 121 118 126 126 126
O&M ($MM/yr) 411 424 418 454 455 455 447 462 453 479 479 480
TOC ($MM) 7,020 7,400 7,255 7,836 8,015 7,975 7,763 8,221 7,978 8,403 8,577 8,533
TOC ($//DB) 140,380 148,020 145,100 156,720 160,300 159,480 155,240 164,420 159,560 168,040 171,540 170,660
RSP ($/bbl FT diesel) 112.7 118.1 115.9 117.3 120.7 119.4 130.4 137.0 133.4 133.8 137.3 135.8
COE( $/bbl petroleum) 93.9 98.4 96.6 97.8 100.6 99.5 108.7 114.2 111.2 111.5 114.4 113.2

Production of Zero Sulfur Diesel Fuel from Domestic Coal: Configurational Options to Reduce Environmental Impact
15
1 Introduction If, in the future, world conventional oil supplies became scarce enough to threaten the security of our nation’s energy supply, the ability to produce fungible transportation fuels from our domestic coal and biomass resources could counterbalance this threat.
Because of the continuing concern over global climate change, Section 526 of the Energy Independence and Security Act (EISA) mandates that Government cannot purchase alternative fuels that have a greenhouse gas (GHG) footprint higher than petroleum. To meet this requirement for coal-to-liquids (CTL) plants successful deployment of carbon capture and sequestration (CCS) will be necessary.
When CCS is applied to CTL the resulting life cycle greenhouse gas (GHG) footprint for production and utilization of CTL fuels can be less than comparable fuels produced from petroleum. Additions of small quantities of biomass, which can be gasified together with the coal, can further reduce the GHG footprint compared to petroleum. In these ways, with choice of configuration, CCS, and addition of biomass the life cycle GHG emissions can be considerably less than petroleum.
In addition to concerns over global climate change, availability of fresh water is becoming an important issue. This is particularly the case in semi-arid areas where there is competition for scarce water resources. These areas include the Powder River Basin regions of Montana and Wyoming where about 37 percent of the nation’s demonstrated coal reserve base resides. Utilization of this Western coal resource at a near mine mouth location would mandate employment of water management practices that minimize consumption.
Because of these dual concerns of climate change and water availability the National Energy Technology Laboratory (NETL) requested that Noblis perform an analysis of conceptual CTL and Coal/Biomass-to-Liquids (CBTL) plant configurations that could reduce both the GHG footprint as estimated by life cycle analysis and the overall consumption of water. In response to this request, Noblis simulated a series of conceptual, Fisher-Tropsch-based CTL and CBTL plant configurations with recycle and once-through configurations, with bituminous and subbituminous coals, with CCS, with and without addition of biomass, and with various water management options. These conceptual plants were then analyzed to determine the technical performance, to estimate the economics and required selling price of the fuels, to estimate the overall water consumption, and to compare the life cycle GHG footprint with petroleum derived fuels.
The GHG emissions reported here are for the diesel product and these estimates are based on applying displacement credits for the co-products naphtha and electric power. An alternative methodology for estimating GHG emissions in a co-production scenario is to allocate the emissions amongst the products separately. The results of the GHG estimates based on an energy allocation method are provided in Appendix B.
1.1 Scope of the Study
Table 1-1and Table 1-2 define the scope of the conceptual plant configurations analyzed in this study. All of the plants are configured to produce 50,000 barrels per day (BPD) of zero sulfur diesel fuel and naphtha. All plants use CCS to capture the carbon dioxide produced during the

Production of Zero Sulfur Diesel Fuel from Domestic Coal: Configurational Options to Reduce Environmental Impact
16
production of the fuels and electric power. In contrast to some prior studies, the configurations analyzed in this study did not use aggressive strategies to decarbonize fuel gas streams and hence the amount of CO2 captured will be less than the 90% value attained in some previous studies1. Also, this study did not include a non-CCS (CO2 vent) case since part of the focus was on Section 526 compliance. Previous work did include a non-CCS case. The minimum crude oil price required for economic feasibility for the non-CCS case for that study was $83.57/bbl. There was a 3% increase for the all coal feed with CCS case. Likewise, the required selling price of diesel for the non-CCS case was $2.49/gal and $2.56/gal for the all coal feed with CCS case.
All plants generate the parasitic electricity needed to power the facility and in some cases, excess power for sale. Four of the configurations use Eastern Bituminous coal (Illinois #6) and are located in the Eastern U.S. where adequate water is assumed to be available. The other plants use Western PRB coal from Montana and the plants are assumed to be located in Montana where water resources are scarce.
All configurations use Siemens entrained flow gasification with full water quench to produce the raw synthesis gas from the coal feed2,3. Raw synthesis gas (syngas) conditioning is accomplished using conventional cold gas cleaning for sulfur removal and recovery and for bulk CO2 removal. Synthesis is accomplished using low temperature Fischer-Tropsch (FT) slurry phase reactor technology using iron based FT catalysts4.
Table 1-1: Bituminous Coal Configurations
Case Identifier BRW00 BOW00 BRW15 BOW15
Biomass Type NONE NONE SG SG
Biomass Mass (%) 0 0 15 15
Configuration Recycle Once-
Through Recycle
Once-Through
Water Management
Water / CT Water / CT Water / CT Water / CT
All use Siemens gasifier, LT Slurry reactor, CCS, plant located at Eastern US, produce 50,000 BPD of diesel and naphtha.
For plants cases designated “Once-Through”, the clean syngas is passed through the FT reactors one time only. After product recovery and CO2 removal, the unconverted syngas and light hydrocarbons are sent to gas turbines for power generation. These configurations produce liquid fuels and a large quantity of power as a co-product. Plant cases designated “Recycle” use the recycle configuration where most of the unconverted syngas and light hydrocarbons are recycled back to the FT reactors (after CO2 removal) to increase the liquid production. The balance of the unconverted syngas and light hydrocarbons are diverted to the gas turbines for power generation.
Half of the configurations are coal/biomass-to-liquids (CBTL) configurations where 15 percent biomass (switchgrass, SG) by mass, on an as-received basis, is added to the coal and co-fed to the gasifiers to produce the syngas.
Production of Zero Sulfur Diesel Fuel from Domestic Coal: Configurational Options to Reduce Environmental Impact
17
Three water management systems are used in the configurations evaluated. Columns in Table 1-1 and Table 1-2 designated “Water / CT” refer to the water management system where mechanical draft, water-cooled, cooling towers are used for the plant cooling duties. Columns designated “Max Air” use maximum air cooling to minimize the consumption of water. This system uses indirect air cooling for the plant cooling duties. Columns designated by “Hybrid” use a combination of water cooling and direct air cooling for the plant cooling duties. Only the plants assumed to be located in Montana where water resources are scarce use maximum air cooling or hybrid cooling.
There are sixteen configurations analyzed in this report. The Case Identifier is a five character code based on the specific case configuration. The first character denotes the coal type with “B” denoting bituminous and “S” denoting subbituminous. The second character denotes the recycle configuration. “R” denotes simple recycle and “O” denotes once-through. The third character denotes the cooling configuration. “W” refers to the system where mechanical draft water cooled cooling towers are used for the plant cooling duties. “A” denotes configurations with maximum air cooling and “H” denotes the hybrid cooling scheme. The fourth and fifth characters designate the mass fraction of biomass on an as-received basis.
For example, Case “BRW00” is shorthand for bituminous coal, recycle mode, water cooling, and no biomass. In a similar manner, “BOW15” is bituminous coal, once-through mode, water cooling, with 15 percent biomass. For the subbituminous coal cases, “SRA00” means subbituminous coal, recycle, air cooling, and no biomass. Similarly, “SOH15” is subbituminous coal, once-through mode, hybrid cooling, with 15 percent biomass.

Production of Zero Sulfur Diesel Fuel from Domestic Coal: Configurational Options to Reduce Environmental Impact
18
Table 1-2: Subbituminous Coal Configurations
Case
Identifier SRW00 SRA00 SRH00 SOW00 SOA00 SOH00 SRW15 SRA15 SRH15 SOW15 SOA15 SOH15
Biomass Type NONE NONE NONE NONE NONE NONE SG SG SG SG SG SG
Biomass Mass (%)
0 0 0 0 0 0 15 15 15 15 15 15
Configuration Re-
cycle
Re-
cycle
Re-
cycle Once-
Through Once-
Through Once-
Through Recycle Recycle Recycle
Once-Through
Once-Through
Once-Through
Water Management
Water / CT
Max Air Hybrid Water /
CT Max Air Hybrid
Water / CT
Max Air Hybrid Water /
CT Max Air Hybrid
All use Siemens gasifier, LT Slurry reactor, CCS; plant located at Western US, produce 50,000 BPD of diesel and naphtha.
Production of Zero Sulfur Diesel Fuel from Domestic Coal: Configurational Options to Reduce Environmental Impact
24
2 Basis of Conceptual Plant Designs
2.1 Case BRW00: CTL Recycle Configuration, Bituminous Coal
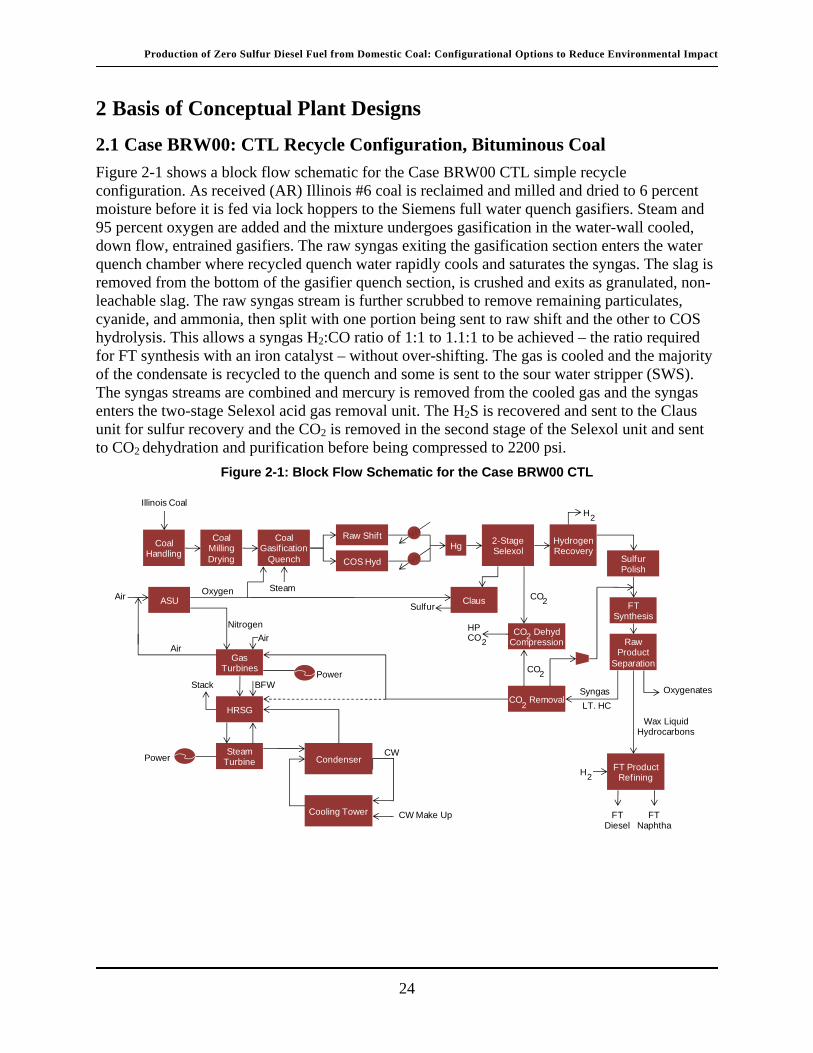
Figure 2-1 shows a block flow schematic for the Case BRW00 CTL simple recycle configuration. As received (AR) Illinois #6 coal is reclaimed and milled and dried to 6 percent moisture before it is fed via lock hoppers to the Siemens full water quench gasifiers. Steam and 95 percent oxygen are added and the mixture undergoes gasification in the water-wall cooled, down flow, entrained gasifiers. The raw syngas exiting the gasification section enters the water quench chamber where recycled quench water rapidly cools and saturates the syngas. The slag is removed from the bottom of the gasifier quench section, is crushed and exits as granulated, non-leachable slag. The raw syngas stream is further scrubbed to remove remaining particulates, cyanide, and ammonia, then split with one portion being sent to raw shift and the other to COS hydrolysis. This allows a syngas H2:CO ratio of 1:1 to 1.1:1 to be achieved – the ratio required for FT synthesis with an iron catalyst – without over-shifting. The gas is cooled and the majority of the condensate is recycled to the quench and some is sent to the sour water stripper (SWS). The syngas streams are combined and mercury is removed from the cooled gas and the syngas enters the two-stage Selexol acid gas removal unit. The H2S is recovered and sent to the Claus unit for sulfur recovery and the CO2 is removed in the second stage of the Selexol unit and sent to CO2 dehydration and purification before being compressed to 2200 psi.
Figure 2-1: Block Flow Schematic for the Case BRW00 CTL
Air
Coal Handling
Coal MillingDrying
Coal Gasification
Quench
Raw Shift
COS Hyd
Hg2-Stage Selexol
Hydrogen Recovery
SulfurPolish
FT Synthesis
Raw Product
Separation
ASU Claus
Steam Turbine
HRSG
Gas Turbines
CO Removal2
CO DehydCompression
2
FT Product Refining
Condenser
Cooling Tower
Illinois Coal
Air
Oxygen
Nitrogen
Steam
Sulfur
Air
Power
FTDiesel
FTNaphtha
CW Make Up
CWPower
2H
Syngas
LT. HC
Oxygenates
Wax LiquidHydrocarbons
2CO
2CO
2COHP
Stack BFW
2H

Production of Zero Sulfur Diesel Fuel from Domestic Coal: Configurational Options to Reduce Environmental Impact
25
The cleaned syngas containing a few ppm of sulfur is sent to hydrogen recovery using PRISM/PSA to recover enough hydrogen for the FT refining section. The syngas is then polished using zinc oxide to remove the last of the sulfur before being sent to the slurry phase FT reactors.
The cleaned conditioned syngas is passed to the FT section of the plant that has several trains of FT reactors with each train consisting of two slurry phase FT reactors in series. Overall syngas conversion to FT products is about 80 percent. The overhead from the FT reactors is sent to raw product cooling and separation where the products are separated into a gaseous phase consisting of unconverted syngas, CO2, nitrogen, and light hydrocarbon gases; a hydrocarbon liquids phase; and an aqueous phase containing the FT oxygenates. The gases are sent to a MDEA unit for CO2 removal and then the gas stream is split so that a portion is recycled back to the FT reactors and the remaining gas is sent to the combustor of the gas turbines. The removed CO2 is sent to CO2 dehydration, purification and compression. The hydrocarbon liquids are sent to the refinery and the aqueous phase is sent to wastewater treatment to remove oxygenates. The raw wax product is removed from the FT reactors and also sent to the refinery for further upgrading into diesel fuel.
The plant power island consists of one “FB-class” syngas turbine, heat recovery steam generator (HRSG), and steam turbine generator. The air separation units (ASU) provide nitrogen diluent to the gas turbine and there is air extraction from the gas turbine compressors to reduce the ASU main air compressors (MAC) power requirements.
Carbon dioxide is recovered from the two-stage Selexol units before the syngas enters the FT section to reduce inert gas volume through the slurry reactors. Carbon dioxide produced in the FT reactors is recovered from the FT tail gas prior to being sent to the gas turbine combustors. This reduces the carbon content of the gas turbine feed. The combined CO2 streams are dehydrated and purified using auto-refrigeration to meet the Kinder Morgan CO2 pipeline specification of 95 percent purity. The CO2 is then compressed to 2200 psi and sent by pipeline to a suitable geological site for sequestration.
The FT refining section of the plant upgrades the raw FT products into specification diesel fuel and essentially unrefined FT naphtha. The raw separated liquid hydrocarbon FT product from the separator is distilled into a distillate (diesel) fraction and straight run naphtha. No more refining is applied to the straight run naphtha. The distillate fraction undergoes mild hydrotreatment to saturate olefins and the product from the hydrotreater is distilled to produce some hydrotreated naphtha and hydrotreated diesel. The raw wax product is sent to a hydrocracker where it is cracked to produce an essentially C23 endpoint diesel fraction. The hydrocracker product is distilled to separate refinery off-gas, hydrotreated naphtha, and diesel. This diesel hydrocrackate is blended with the hydrotreated diesel to produce the diesel product. The hydrotreated naphtha is blended with the straight run naphtha to produce the naphtha product. The refinery off-gases are used as fuel gas for fired heaters etc.
In this case, because adequate water is assumed to be available, all of the plant cooling duty is accomplished using conventional circulating cooling water with mechanical draft cooling towers.
2.2 Case BOW00: CTL Once-Through Configuration, Bituminous Coal
Figure 2-2 shows a block flow schematic for the Case BOW00 CTL once-through configuration. The production of the clean syngas is the same as for Case BRW00 described above. The difference between the cases is that the clean syngas is sent to the FT reactors only once and
Production of Zero Sulfur Diesel Fuel from Domestic Coal: Configurational Options to Reduce Environmental Impact
26
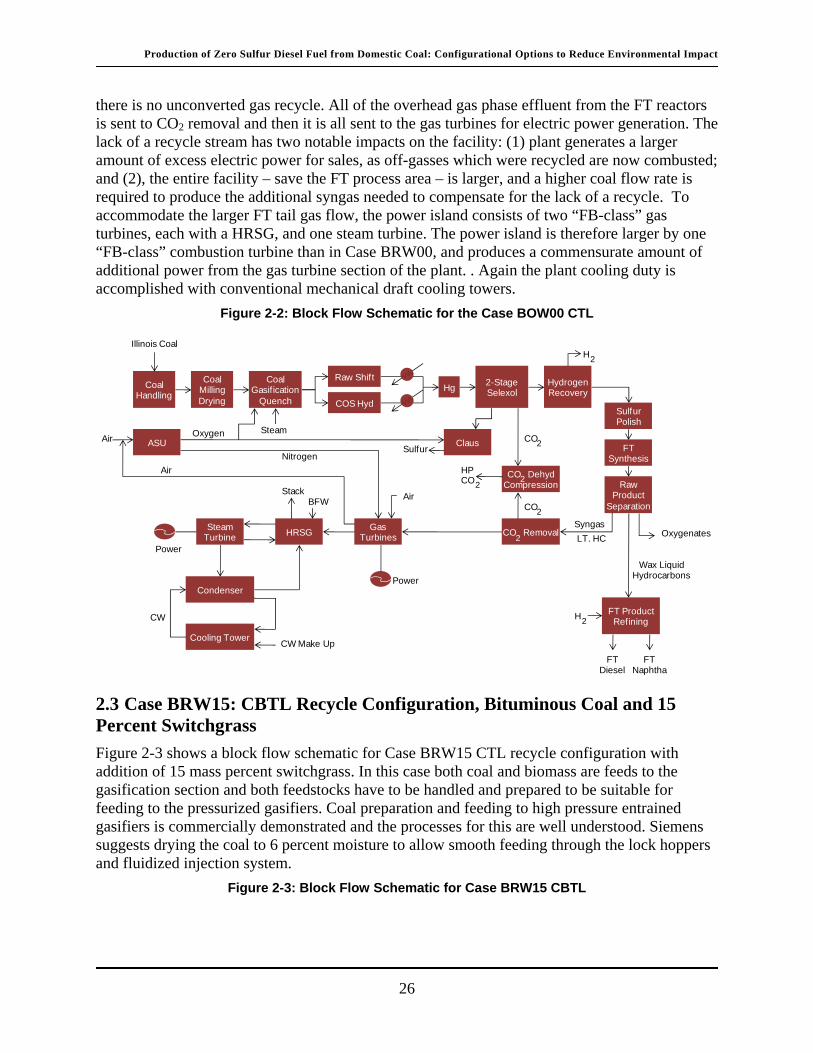
there is no unconverted gas recycle. All of the overhead gas phase effluent from the FT reactors is sent to CO2 removal and then it is all sent to the gas turbines for electric power generation. The lack of a recycle stream has two notable impacts on the facility: (1) plant generates a larger amount of excess electric power for sales, as off-gasses which were recycled are now combusted; and (2), the entire facility – save the FT process area – is larger, and a higher coal flow rate is required to produce the additional syngas needed to compensate for the lack of a recycle. To accommodate the larger FT tail gas flow, the power island consists of two “FB-class” gas turbines, each with a HRSG, and one steam turbine. The power island is therefore larger by one “FB-class” combustion turbine than in Case BRW00, and produces a commensurate amount of additional power from the gas turbine section of the plant. . Again the plant cooling duty is accomplished with conventional mechanical draft cooling towers.
Figure 2-2: Block Flow Schematic for the Case BOW00 CTL
2.3 Case BRW15: CBTL Recycle Configuration, Bituminous Coal and 15 Percent Switchgrass
Figure 2-3 shows a block flow schematic for Case BRW15 CTL recycle configuration with addition of 15 mass percent switchgrass. In this case both coal and biomass are feeds to the gasification section and both feedstocks have to be handled and prepared to be suitable for feeding to the pressurized gasifiers. Coal preparation and feeding to high pressure entrained gasifiers is commercially demonstrated and the processes for this are well understood. Siemens suggests drying the coal to 6 percent moisture to allow smooth feeding through the lock hoppers and fluidized injection system.
Figure 2-3: Block Flow Schematic for Case BRW15 CBTL
Coal Handling
Coal MillingDrying
Coal Gasification
Quench
Raw Shift
COS Hyd
Hg2-Stage Selexol
Hydrogen Recovery
Sulfur Polish
FT Synthesis
Raw Product
Separation
ASU Claus
Steam Turbine HRSG
Gas Turbines CO Removal
2
CO DehydCompression
2
FT Product Refining
Condenser
Cooling Tower
Illinois Coal
Air
Air
Oxygen
Nitrogen
Steam
Sulfur
Air
Power
FTDiesel
FTNaphtha
CW Make Up
CW
Power
2H
Syngas
LT. HCOxygenates
Wax LiquidHydrocarbons
2H
2CO
2CO
2COHP
StackBFW

Production of Zero Sulfur Diesel Fuel from Domestic Coal: Configurational Options to Reduce Environmental Impact
27
Figure 2-4: Block Flow Schematic for Case B0W15 CBTL
The situation for switchgrass is different. There is commercial experience in feeding up to 30 percent woody biomass and other wastes (notably chicken litter and sewage sludge) at the Shell IGCC plant in the Netherlands, which uses an entrained flow, high pressure gasifier which is
Air
Coal Handling
Coal MillingDrying
Coal Gasif ication
Quench
Raw Shift
COS Hyd
Hg2-Stage Selexol
Hydrogen Recovery
SulfurPolish
FT Synthesis
Raw Product
Separation
ASU Claus
Gas Turbines
CO Removal2
CO DehydCompression
2
FT Product Refining
Illinois Coal
Air
Oxygen
Nitrogen
Steam
Sulfur
Air
Power
FTDiesel
FTNaphtha
2H
Syngas
LT. HC
Oxygenates
Wax LiquidHydrocarbons
2CO
2CO
2COHP
Biomass Handling
Biomass Prep/Drying
Switchgrass
Steam Turbine
HRSG
Condenser
Cooling Tower CW Make Up
CWPower
Stack BFW
2H
Coal Gasif ication
Quench
Raw Shift
COS Hyd
Hg2-Stage Selexol
Hydrogen Recovery
Sulfur Polish
FT Synthesis
Raw Product
Separation
ASU Claus
Steam Turbine HRSG
Gas Turbines CO Removal
2
CO DehydCompression
2
FT Product Refining
Condenser
Cooling Tower
Air
Air
Oxygen
Nitrogen
Steam
Sulfur
Air
Power
FTDiesel
FTNaphtha
CW Make Up
CW
Power
2H
Syngas
LT. HCOxygenates
Wax LiquidHydrocarbons
2H
2CO
2CO
2COHP
StackBFW
Coal Handling
Coal MillingDrying
Illinois Coal
Biomass Handling
Biomass Prep/Drying
Switchgrass

Production of Zero Sulfur Diesel Fuel from Domestic Coal: Configurational Options to Reduce Environmental Impact
28
similar to the Siemens gasifier evaluated in this study4. Similar tests attempted to feed 100 percent biomass into the Siemens gasifier (as conducted by Future Energy GmbH, the previous owners of the Siemens SFG technology) concluded that willow wood (pulverized to a d50 diameter of 210 microns) was not suitable for their fluidized pneumatic gasifier feeding system5. It proved to be impossible to fluidize this material at the 100 percent biomass level because of the fiber-like structures and the resulting high cohesion forces between the particles.
Additionally, as far as these authors are aware, there is no commercial experience in feeding switchgrass to entrained flow, high pressure gasifiers, and the fibrous and compressible nature of this feedstock may result in different feed characteristics and pre-treatment requirements prior to operation at larger biomass percentages.
The co-gasification of coal and biomass cases analyzed in this report utilize a feed which is predominantly pulverized coal with only 15 percent by mass of switchgrass. Because of this ratio it is assumed that the coal will effectively dilute the pulverized biomass particles so that the combination of the pulverized coal and switchgrass can still be fluidized and thus can be fed using the same feeding system as coal. This assumption is supported by the success in feeding up to 30 percent woody biomass into the Shell gasifier, and the relatively conservative estimate of 15 percent by weight is meant to provide a further margin for operational learning experience with switchgrass. Previous modeling efforts have shown that the use of different biomass types – such as woody biomass or corn stover in the place of switchgrass – would change the performance of the facility, but not appreciably, and the overall trends are expected to be similar.
Apart from this feed combination the plant configuration is the same as recycle configuration Case BRW00.
2.4 Case BOW15: CBTL Once-Through Configuration, Bituminous Coal and 15 Percent Switchgrass
Figure 2-4 shows the configuration for Case BOW15. This case has the same overall plant configuration as Case BOW00 except that the feed contains 15 percent switchgrass in addition to the bituminous coal.
2.5 Case SRW00: CTL Recycle Configuration, PRB Coal and Wet Cooling Tower Water Management
Case SRW00 has the same overall plant configuration as Case BRW00 with bituminous coal. In this case Montana Rosebud Powder River Basin (PRB) subbituminous coal is the feed rather than Illinois #6 bituminous coal and the location is assumed to be in Montana. This coal is a high moisture coal (25.77 percent as-received basis) and must be dried to about 6 percent before feeding to the gasifiers. Drying is accomplished using the RWE WTA process with vapor condensation6. The WTA process is a proprietary RWE Power technology developed for drying lignite and other high moisture coals with plants operating at Frechen and Niederaussem in Germany. In this process the coal is fluidized using steam in a compact fluid bed and drying is accomplished through heat exchange with steam pipes within the bed. The overhead vapors containing the coal moisture are sent to electrostatic precipitators to remove fines and some of the vapor is re-circulated to the bed for fluidization and the rest is condensed. This condensed moisture can be treated and used for process water. This is an advantage in the PRB cases where

Production of Zero Sulfur Diesel Fuel from Domestic Coal: Configurational Options to Reduce Environmental Impact
29
the CTL plants are assumed to be located in Montana close to the mine mouth where water resources are scarce.
Although this case is conceptually located in an arid region, for the purposes of comparing the impact of water management on overall water consumption, water cooled mechanical draft cooling towers were assumed for this case.
The plant power island consists of a single “FB-class” hydrogen-rich syngas gas turbine, one HRSG and one steam turbine. The higher elevation in the Montana location results in lower atmospheric pressure and this correspondingly reduces the power output from the gas turbine.
2.6 Case SRA00: CTL Recycle Configuration, PRB Coal, Maximum Air Cooling
The overall process configuration for this case is essentially the same as for Case BRW00. PRB coal is the feedstock and the location is assumed to be in Montana. The major difference in this case is the water management scheme. Instead of allowing circulating cooling water to evaporate in mechanical draft cooling towers, all of the cooling duty of the plant is accomplished by means of an indirect dry cooling system. In this system the circulating cooling water is in a closed loop and the heat is dispersed by blowing ambient air over-finned tube banks through which the circulating cooling water flows. These finned tubes are contained in a dry cooling tower structure. Indirect dry cooling is used rather than direct air cooling because of the multitude of necessary plant cooling duties in various locations of the plant infrastructure. The steam condensation duty from the steam turbine is also accomplished by this indirect air cooling system.
Because the largest water usage in conventionally water cooled towers results from cooling tower evaporation and blow down, dry cooling will significantly reduce the water use footprint of the plant because there is no cooling tower evaporation and drift loss.
Even though maximum air cooling is used in this case there will still be net raw water consumption in the plant. There is water needed for reactions and necessary blow down from the essentially closed-loop circulating cooling water in the indirect dry cooling system. In addition there are other water make up requirements in the plant. Net raw water consumption is very dependent on assumptions made for percent blow down needed to maintain circulating cooling water quality and for percent recycle achieved.
Indirect air cooling systems are more capital intensive than standard mechanical draft water cooling and the power requirements for the dry cooling tower fans are significantly higher than for mechanical draft fans.
2.7 Case SRH00: CTL Recycle Configuration, PRB Coal, Hybrid Cooling
The overall process configuration for this case is essentially the same as for Case BRW00. PRB coal is the feedstock and the location is assumed to be in Montana. The major difference in this case is the water management scheme. Instead of using indirect dry cooling for all the plant cooling duties a hybrid cooling system was used. In this hybrid cooling system, steam condensing duty from the LP turbine was accomplished using a direct dry air cooled condenser (ACC). This system uses aluminized carbon steel tube/aluminum fin tube bundles in an A-frame
Production of Zero Sulfur Diesel Fuel from Domestic Coal: Configurational Options to Reduce Environmental Impact
30
configuration that directly cools and condenses the steam from the LP steam turbine with air flowing across the A-frame. All the other cooling plant duties were accomplished using a conventional mechanical draft water cooling tower. This approach reduces the overall plant water consumption by eliminating almost half of the water cooled cooling duty.
2.8 Cases SOW00, SOA00, SOH00: CTL Once-Through Configuration, PRB Coal
These cases are analogous to the previous three cases described except that a once-through configuration is used. This leads to the generation of excess power for sales. The three cases encompass the three water management systems.
2.9 Cases SRW15, SRA15, SRH15, SOW15, SOA15, SOH15: CBTL Configurations, PRB Coal and 15 Percent Switchgrass
This series of configurations mirrors the previous six cases (cases SRW00 through SOH00) except that the feed is both PRB coal and 15 percent switchgrass. Three of the cases are recycle mode and three are once-through. In a similar manner to the above series all three water management systems are used.

Production of Zero Sulfur Diesel Fuel from Domestic Coal: Configurational Options to Reduce Environmental Impact
55
3 Methodology
3.1 Process Performance Estimates
The conceptual process designs for all of the cases were based on systems level models for indirect coal liquefaction technology. Aspen Plus simulation models for the plants were developed to determine the composition and flows of all of the major streams in the plants. These were used to develop conceptual level cost estimates for capital and operating costs for the major process units. Because the cases were assumed to be located at two very different sites, site specific data was incorporated into the Aspen Plus models to adjust the performance predictions for the plants to the given conditions.
Where appropriate, additional specialized software packages were used to extrapolate the performance of certain unit operations under site-specific conditions. For example, GTPRO was used to validate gas turbine and steam cycle operating conditions and performance under the specific plant conditions and PROMAX was used to validate simulation of operations like sour water stripping. These performance predictions were then incorporated into the Aspen Plus systems models.
The Aspen Plus models have been validated against vendor data where possible and/or predictions from more detailed design models and are considered to be of appropriate accuracy for this conceptual feasibility study.
3.2 Cost Estimates
In most cases, the capital and operating cost estimates were obtained from conceptual-level cost algorithms that scale costs based on one or more measures of unit capacity. These algorithms have been developed based on information from the open literature7. In some cases, cost estimates were based on vendor quotes.
The methodology used to determine total capital requirement (TCR) is as follows. The bare erected cost (BEC) estimates for the various conceptual plants consist of equipment cost, material cost, and installation labor costs. These three components are added to give the BEC of the individual unit operations. The engineering, procurement, and construction cost (EPCC) is the sum of the BEC and the home office costs. The home office costs include detailed design costs and construction and project management costs. Home office costs are estimated as 9.5 percent of the BEC. The total plant cost (TPC) is the sum of the EPCC, the process contingencies, and the overall project contingency. The TPC is a depreciable capital expense. The process contingencies are added to the plant sections and the amount of the contingency depends on an engineering assessment of the level of commercial maturity of the process. The overall project contingency is assumed to be 15 percent of the sum of the BEC and process contingencies. This is added to compensate for uncertainty in the overall cost estimate.
The Total Overnight Cost (TOC) of the plants is defined as the sum of the TPC, the Owner’s Cost, and the CO2 monitoring fund. Table 3-1 shows the components of the Owner’s Costs and Table 3-2 shows components of the as-spent capital.
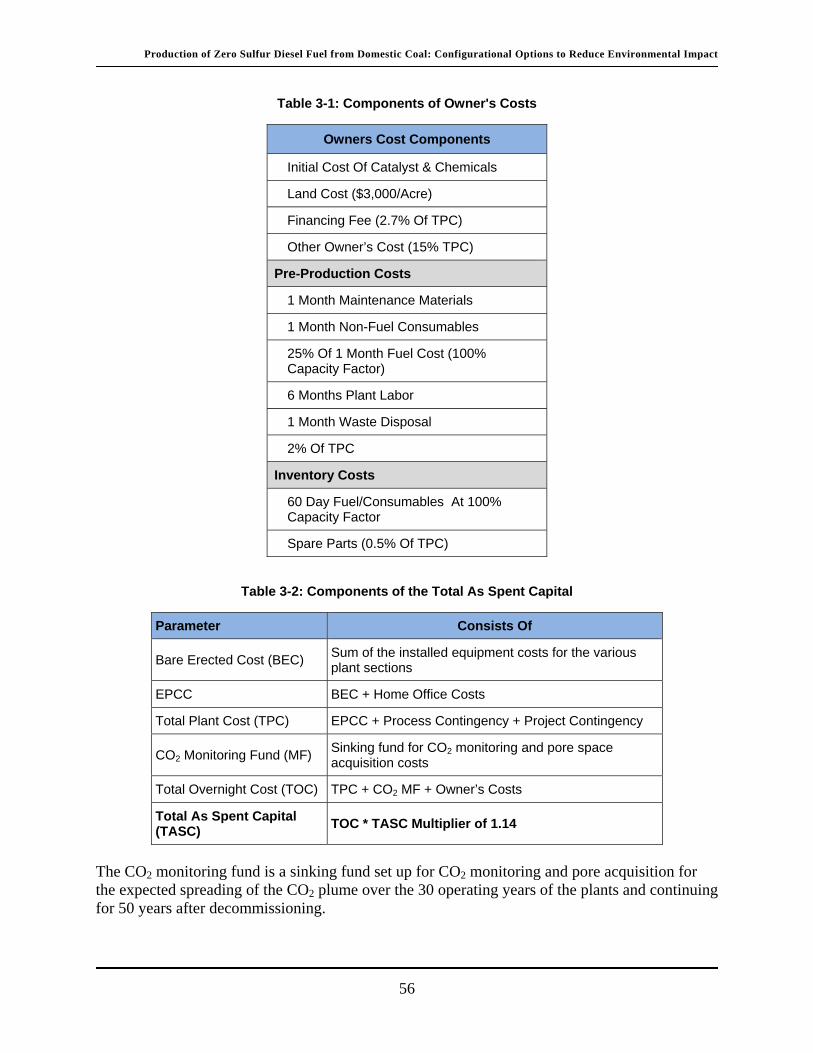
Production of Zero Sulfur Diesel Fuel from Domestic Coal: Configurational Options to Reduce Environmental Impact
56
Table 3-1: Components of Owner's Costs
Owners Cost Components
Initial Cost Of Catalyst & Chemicals
Land Cost ($3,000/Acre)
Financing Fee (2.7% Of TPC)
Other Owner’s Cost (15% TPC)
Pre-Production Costs
1 Month Maintenance Materials
1 Month Non-Fuel Consumables
25% Of 1 Month Fuel Cost (100% Capacity Factor)
6 Months Plant Labor
1 Month Waste Disposal
2% Of TPC
Inventory Costs
60 Day Fuel/Consumables At 100% Capacity Factor
Spare Parts (0.5% Of TPC)
Table 3-2: Components of the Total As Spent Capital
Parameter Consists Of
Bare Erected Cost (BEC) Sum of the installed equipment costs for the various plant sections
EPCC BEC + Home Office Costs
Total Plant Cost (TPC) EPCC + Process Contingency + Project Contingency
CO2 Monitoring Fund (MF) Sinking fund for CO2 monitoring and pore space acquisition costs
Total Overnight Cost (TOC) TPC + CO2 MF + Owner’s Costs
Total As Spent Capital (TASC)
TOC * TASC Multiplier of 1.14
The CO2 monitoring fund is a sinking fund set up for CO2 monitoring and pore acquisition for the expected spreading of the CO2 plume over the 30 operating years of the plants and continuing for 50 years after decommissioning.

Production of Zero Sulfur Diesel Fuel from Domestic Coal: Configurational Options to Reduce Environmental Impact
57
The annual operating expenses for the plants are composed of fuel costs and variable and fixed operating costs. Fuel cost is the cost of the coal and switchgrass feedstocks to the plants based on assumed delivered prices. Non-fuel variable operating costs include catalysts and chemicals, water, solids disposal, maintenance materials, and CO2 storage. The small quantities of natural gas and electric power needed for start-up are not included. Fixed operating costs include labor, administrative and overhead costs, local taxes and insurance and fixed CO2 transport and storage costs. Gross annual operating costs are the sum of the fuel, variable, and fixed operating costs and are expressed in million dollars per annum based on 90 percent capacity factor. By-product credits include any sales of electric power to the grid. No credit is taken for the sale of elemental sulfur. No value is assumed for the carbon dioxide captured. Feedstock costs delivered to the plant on an as-received basis and the credit for electric power are shown below in Table 3-3 and Table 3-4. These values were provided by NETL8.
Table 3-3: Feedstock Costs
Feedstock Cost ($/ton) Cost ($/MMBtu)
Illinois #6 Bituminous Coal (AR) 38.18 1.64
Montana Rosebud PRB Coal (AR)
12.17 0.71
Switchgrass (Dry) 88.00 5.46
Table 3-4: By-Product Value
By-Product Value
Electricity ($/MWH) 70.59
Sulfur ($/ton) 0
Carbon Dioxide ($/tonne) 0
3.3 Required Selling Price Estimates for Products
The key measure of the economic viability of these C/BTL plants is the estimation of the required selling price (RSP) of the products. The RSP is the minimum price at which the products must be sold to recover the annual revenue requirement (ARR) of the plant. The ARR is the annual revenue needed to pay the operating costs, service the debt, and provide the expected rate of return for the investors. If the market price of the products is equal to or above the calculated RSP, the CTL project is considered economically viable.
The ARR is the sum of the fuel cost, variable operating cost, fixed operating cost, and annual capital component minus the by-product credits for electric power sale revenues. The annual capital component of the ARR is determined as the product of the total overnight cost (TOC) and the capital recovery factor (CRF). The CRF is determined from a standard discounted cash flow (DCF) analysis using the financial parameters shown in Table 3-5. The resulting CRF for these high risk plants is determined to be 16.95%.

Production of Zero Sulfur Diesel Fuel from Domestic Coal: Configurational Options to Reduce Environmental Impact
58
The conceptual plants produce at most three products for sale if it is assumed that the CO2 cannot be sold. These products are: (1) zero sulfur diesel fuel, (2) FT naphtha, and (3) electric power. All light gases including LPG are used within the plant. FT naphtha, although it has a similar boiling range to gasoline, has not traditionally been considered to be suited for refining into high octane gasoline because of its highly paraffinic nature, although NETL is examining this in a separate study. This analysis assumes that the naphtha can be sold at a discounted price compared to the diesel fuel. The discount price is assumed to be 0.7692 (1/1.3) the value of the diesel fuel. This relative value is used to determine the equivalent diesel fuel yield from the CTL plant in terms of barrels per year.
Table 3-5: Economic Parameters Used in DCF Analysis
Parameter Value
Debt: Equity ratio 60:40
Interest rate on debt 4.56% nominal
Return on equity 20%
Income Tax Rate 38% (Effective 34% Federal, 6%
State)
Repayment Term of Debt 30 years
Grace Period on Debt Repayment
0 years
Debt Reserve Fund None
Depreciation 20 years, 150% declining
balance
Working Capital Zero for all parameters
Plant Economic Life 30 years
Investment Tax Credit 0%
Tax Holiday 0 years
EPC escalation 3.6%
Duration of Construction 5 years
General Inflation 3%
Escalation rate for coal 3%
Escalation rate for products 3%

Production of Zero Sulfur Diesel Fuel from Domestic Coal: Configurational Options to Reduce Environmental Impact
59
The quotient of the ARR and the diesel fuel equivalent barrels gives the RSP. It is often convenient to express the RSP in terms of an equivalent crude oil price. Historically the ratio of the price of diesel to the crude oil price has been about 1.2.5 This ratio was checked by averaging the ratios of refined diesel product price to the price of West Texas Intermediate crude for the years 2009 and 20109. Assuming that this ratio is valid then dividing the RSP by 1.2 will give an estimate of the crude oil equivalent (COE) price.
3.4 Limited Life Cycle GHG Estimates
The comparison of greenhouse gas (GHG) emissions, reported on a carbon dioxide equivalent (CO2E) basis, between petroleum-derived fuels and Fischer-Tropsch (FT) derived fuels is based on a limited life cycle analysis (LCA). The limited LCA for the FT fuel includes the major GHG sources from the production and transportation of the feedstocks to the plant (the mining and transportation of the coal and the growing, harvesting and delivery of the biomass), the CO2 emitted during conversion of the feedstocks to naphtha and diesel at the CTL plant, the emissions resulting from transportation of the products from the CTL plant to the end user, and the combustion of the fuels by the end user.
This is, then, a limited well/mine/field-to-wheels LCA and most of the emissions result from the energy used in each processing step and the final combustion step. The major limit imposed on the life cycle analysis is that the GHG emissions resulting from the actual construction of the CTL facility and the fabrication of the equipment were not considered.
The reference point for the GHG balance is the CO2E level in the atmosphere. Any processing step that increases atmospheric CO2E levels has a positive emissions value and any step that decreases atmospheric CO2E levels has a negative emissions value.
The GHG emissions in this study only account for CO2, methane (CH4), and nitrous oxide (N2O). To normalize the effect of these gases in terms of the CO2 equivalent value (CO2E) the global warming potential (GWP) is used. These GWPs are based on the 2007 IPCC values: for CH4 the value of 25 is used and for N2O the value of 298 is used.
GHG emissions associated with coal mining include both non-methane and methane sources. Non-methane emissions are produced as a result of the energy used in extracting the coal and in transporting the coal from the mine to the plant. Coal mine methane (CMM) emissions occur when coal is mined with the result that the methane in the coal is released to the atmosphere unless it is recovered as coal bed methane (CBM). The quantity of these emissions is difficult to estimate because of wide variation within different basins and mines and with different coal ranks.
For the Illinois #6 bituminous coal, this report assumes that the coal is gassy and the mine uses CMM recovery techniques to recover the CBM. This reduces the atmospheric emissions of the methane. The CBM is assumed to be combusted for use in mining equipment such as heaters or natural gas-powered vehicles (e.g. forklifts) and the CO2 emissions resulting from this
5 A ratio of 1.25 may be more appropriate based on the lack of sulfur in, and the combustion properties of the FT diesel product, which are likely to afford a price premium. That ratio has been used in previous studies and is based on the ratio between crude oil and Ultra-Low Sulfur Diesel.
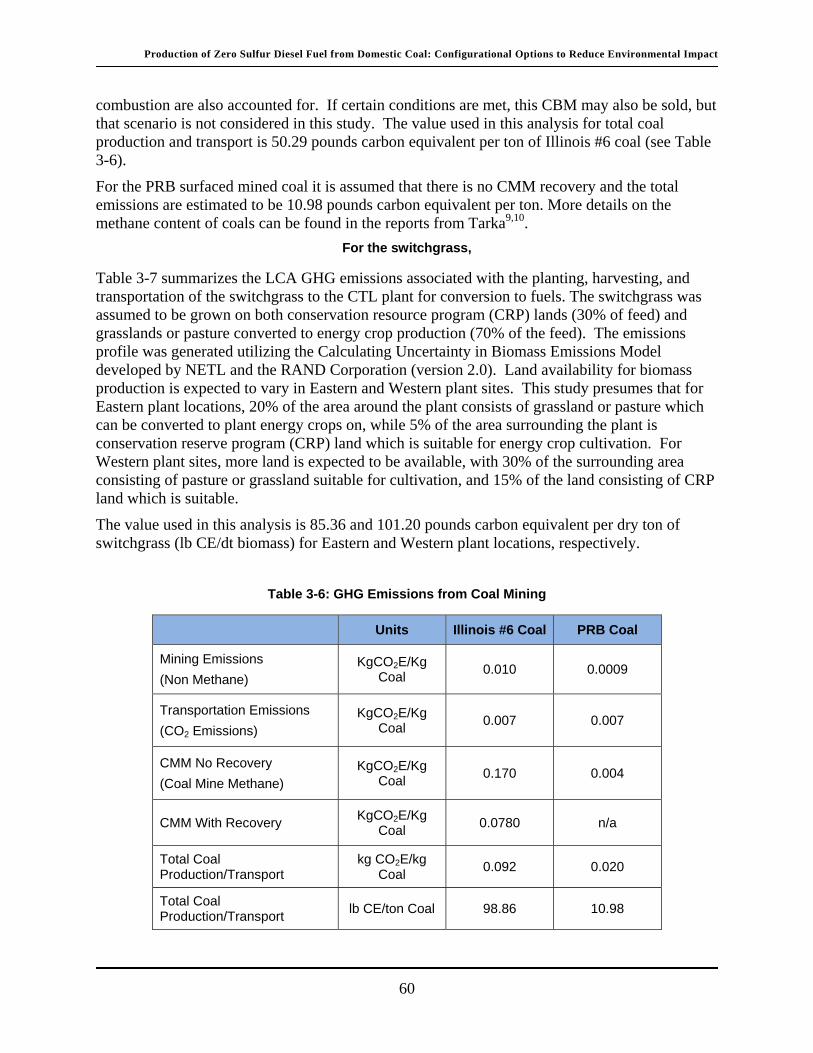
Production of Zero Sulfur Diesel Fuel from Domestic Coal: Configurational Options to Reduce Environmental Impact
60
combustion are also accounted for. If certain conditions are met, this CBM may also be sold, but that scenario is not considered in this study. The value used in this analysis for total coal production and transport is 50.29 pounds carbon equivalent per ton of Illinois #6 coal (see Table 3-6).
For the PRB surfaced mined coal it is assumed that there is no CMM recovery and the total emissions are estimated to be 10.98 pounds carbon equivalent per ton. More details on the methane content of coals can be found in the reports from Tarka9,10.
For the switchgrass,
Table 3-7 summarizes the LCA GHG emissions associated with the planting, harvesting, and transportation of the switchgrass to the CTL plant for conversion to fuels. The switchgrass was assumed to be grown on both conservation resource program (CRP) lands (30% of feed) and grasslands or pasture converted to energy crop production (70% of the feed). The emissions profile was generated utilizing the Calculating Uncertainty in Biomass Emissions Model developed by NETL and the RAND Corporation (version 2.0). Land availability for biomass production is expected to vary in Eastern and Western plant sites. This study presumes that for Eastern plant locations, 20% of the area around the plant consists of grassland or pasture which can be converted to plant energy crops on, while 5% of the area surrounding the plant is conservation reserve program (CRP) land which is suitable for energy crop cultivation. For Western plant sites, more land is expected to be available, with 30% of the surrounding area consisting of pasture or grassland suitable for cultivation, and 15% of the land consisting of CRP land which is suitable.
The value used in this analysis is 85.36 and 101.20 pounds carbon equivalent per dry ton of switchgrass (lb CE/dt biomass) for Eastern and Western plant locations, respectively.
Table 3-6: GHG Emissions from Coal Mining
Units Illinois #6 Coal PRB Coal
Mining Emissions
(Non Methane) KgCO2E/Kg
Coal 0.010 0.0009
Transportation Emissions
(CO2 Emissions) KgCO2E/Kg
Coal 0.007 0.007
CMM No Recovery
(Coal Mine Methane) KgCO2E/Kg
Coal 0.170 0.004
CMM With Recovery KgCO2E/Kg
Coal 0.0780 n/a
Total Coal Production/Transport
kg CO2E/kg Coal
0.092 0.020
Total Coal Production/Transport
lb CE/ton Coal 98.86 10.98

Production of Zero Sulfur Diesel Fuel from Domestic Coal: Configurational Options to Reduce Environmental Impact
61
Table 3-7: GHG Emissions from Switchgrass Production and Transportation
GHG EQ
( kg CO2E per kg dry biomass) Eastern U.S.
Plant Site Western U.S.
Plant Site
Planting & Harvesting 0.145 0.174
Transportation 0.011 0.011
Carbon Equivalent Emissions
Total Emissions (kg CO2E/kg dry biomass)
0.156 0.185
Total Emissions (lb CE/ ton dry biomass)
85.36 101.20
For the reference petroleum-derived diesel fuel GHG baseline, data was obtained from the EPA and represents diesel fuel sold or distributed in the United States in the year 2005. This EPA methodology relies heavily on the methodology developed by DOE and described in the NETL report entitled “Development of Baseline Data and Analysis of Life Cycle Greenhouse Gas Emissions of Petroleum-Based Fuels” dated November 2008. The petroleum baseline for conventional diesel fuel sold or distributed in the United States in 2005, on a national average basis, is 97.0 kg CO2E/MMBtu (LHV) of fuel consumed. This value has been adjusted to 97.4 kg CO2E/MMBtu (LHV) based on a conversion from the 1996 IPCC GHG GWP values to the 2007 GWP values. Table 3-8 summarizes the values used11.
In addition to producing FT diesel fuel these sixteen plants produce FT naphtha. Some of the plants co-produce electric power (more or less depending on whether operated in once-through
or recycle mode). In this LCA methodology, displacement CO2E values are used to account for the GHG emissions off-set by producing these co-products. For FT naphtha the displacement value is based on the average for the production of kerosene jet fuel by U.S. refineries. Kerosene was
used rather than gasoline because of the paraffinic nature and refining similarities between kerosene and FT naphtha. The value used represents average well-to-refinery gate GHG
emissions of 75.8 kg CO2E/bbl (see
Table 3-9).
Table 3-8: Baseline Petroleum Diesel GHG Values
Value Units
97.4 KgCO2E/MMBtu (LHV)
214.7 lbCO2E/MMBtu (LHV)

Production of Zero Sulfur Diesel Fuel from Domestic Coal: Configurational Options to Reduce Environmental Impact
62
58.6 lbCE/MMBtu (LHV)
Table 3-9: FT Naphtha Displacement Values
Value Units
75.8 KgCO2/bbl
167.11 lbCO2/bbl
45.575 lbC/bbl
9.734 lbC/MMBtu (LHV)
The displacement LCA GHG value for co-product electricity is based on the U.S. electric grid mix for the year 2005. The cradle-to-end-user (CTEU) emissions are estimated to be 273.2 kgCO2E/MMBtu, but this includes 7 percent loss for transmission and distribution (T&D). Accounting for this, the gate-to-busbar displacement value used in this report is 254.1 kgCO2E/MMBtu. Table 3-10 summarizes the displacement values for electricity for several reference scenarios. If IGCC with CCS is used for the reference instead of the grid average the displacement off-set would be reduced from 152.78 to 26.61 pounds of carbon per MMBtu.
Table 3-10: Displacement Values for Co-produced Electric Power
Value Units
Average Grid
867 KgCO2/MWH
1911 lbCO2/MWH
521 lbC/MWH
152.78 lbC/MMBtu
NGCC No CCS
448 KgCO2/MWH
987.67 lbCO2/MWH
269.36 lbC/MWH
78.95 lbC/MMBtu
IGCC With CCS
151 KGCO2/MWH
332.89 lbCO2/MWH
90.79 lbC/MWH
26.61 lbC/MMBtu
CTEU -T&D
254.1 KgCO2/MMBtu
560.19 lbCO2/MMBtu
152.78 lbC/MMBtu

Production of Zero Sulfur Diesel Fuel from Domestic Coal: Configurational Options to Reduce Environmental Impact
63
Below in Table 3-11are tabulated the greenhouse gas items used in the carbon accounting methodology for the LCA.
Table 3-11: GHG Items Used in Accounting
LCA GHG Item
Sources
Total Carbon Input
Biomass Production & Transportation
Coal Production & Transportation
Diesel Transportation
CO2 Transportation & Storage
Credits
Biomass Carbon Input
Power Credit
Sequestered Carbon
Slag Carbon
Naphtha Credit
The first source item is the total carbon input to the C/BTL plant. This includes coal and biomass carbon. Source items 2 and 3 represent upstream GHG emissions associated with the production and delivery of the biomass and coal mining and coal transport to the plant. The fourth source item is the GHG emissions from transporting the C/BTL product fuel to the end user. The final source item is the CO2 lost to the atmosphere during transport (1.65%) and storage (1%) of the captured CO2.
The GHG credits include the biomass carbon, the electricity generation carbon off-set that is allowed because this power does not have to be generated elsewhere, the CO2 that is captured in the plant and subsequently sequestered, the coal and biomass carbon that is unconverted during gasification and thus remains in the slag, and the off-set carbon credit from production of the naphtha. The total effective carbon is then the difference between the sum of the source items and the sum of the credits. This is the total effective carbon associated with the diesel fuel, the naphtha, and the FT oxygenates. The diesel effective carbon is therefore the total effective carbon minus the carbon content contained in the naphtha and oxygenates.
Once this diesel effective carbon number has been computed, it is divided by the heating value of the diesel fuel on an LHV basis to give the effective pounds of carbon per MMBtu LHV. This value is then divided by 58.6 lb carbon/MMBtu (see Table 3-8) to obtain the “petroleum ratio” (PR). If the PR is 1.0 then both the petroleum and FT derived diesel fuel have the same GHG
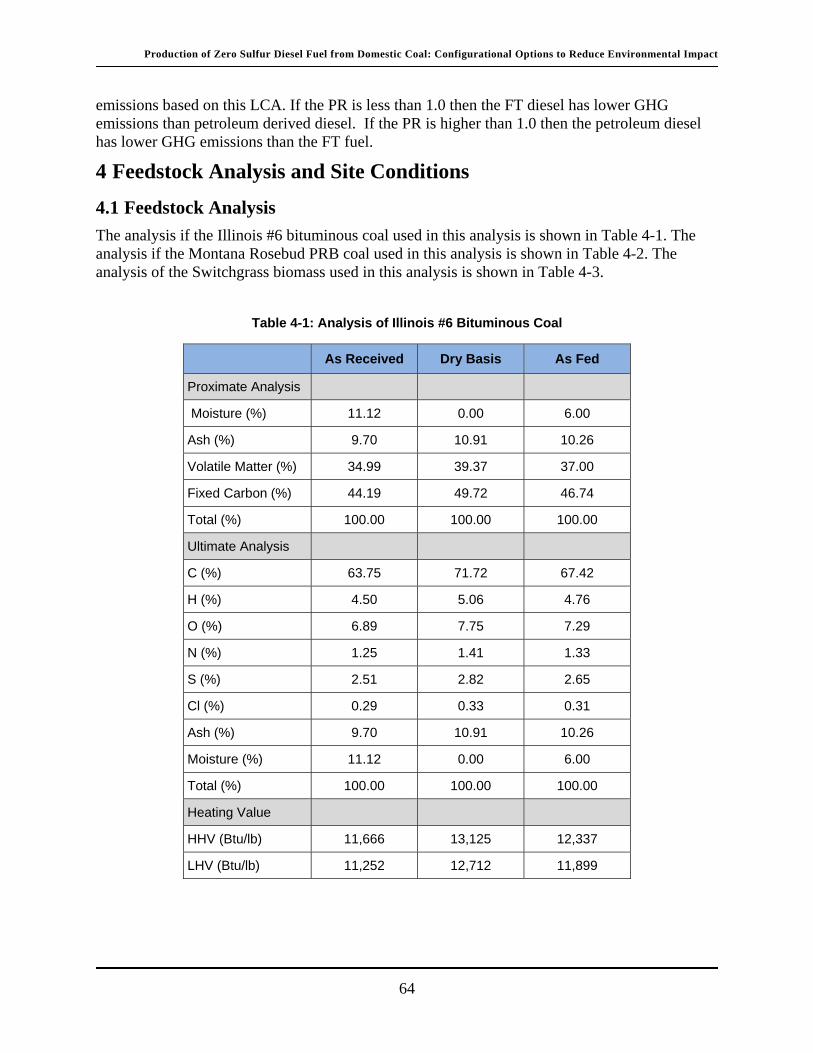
Production of Zero Sulfur Diesel Fuel from Domestic Coal: Configurational Options to Reduce Environmental Impact
64
emissions based on this LCA. If the PR is less than 1.0 then the FT diesel has lower GHG emissions than petroleum derived diesel. If the PR is higher than 1.0 then the petroleum diesel has lower GHG emissions than the FT fuel.
4 Feedstock Analysis and Site Conditions
4.1 Feedstock Analysis
The analysis if the Illinois #6 bituminous coal used in this analysis is shown in Table 4-1. The analysis if the Montana Rosebud PRB coal used in this analysis is shown in Table 4-2. The analysis of the Switchgrass biomass used in this analysis is shown in Table 4-3.
Table 4-1: Analysis of Illinois #6 Bituminous Coal
As Received Dry Basis As Fed
Proximate Analysis
Moisture (%) 11.12 0.00 6.00
Ash (%) 9.70 10.91 10.26
Volatile Matter (%) 34.99 39.37 37.00
Fixed Carbon (%) 44.19 49.72 46.74
Total (%) 100.00 100.00 100.00
Ultimate Analysis
C (%) 63.75 71.72 67.42
H (%) 4.50 5.06 4.76
O (%) 6.89 7.75 7.29
N (%) 1.25 1.41 1.33
S (%) 2.51 2.82 2.65
Cl (%) 0.29 0.33 0.31
Ash (%) 9.70 10.91 10.26
Moisture (%) 11.12 0.00 6.00
Total (%) 100.00 100.00 100.00
Heating Value
HHV (Btu/lb) 11,666 13,125 12,337
LHV (Btu/lb) 11,252 12,712 11,899

Production of Zero Sulfur Diesel Fuel from Domestic Coal: Configurational Options to Reduce Environmental Impact
65
Table 4-2: Analysis of Montana Rosebud PRB Coal
As Received Dry Basis As Fed
Proximate Analysis
Moisture (%) 25.77 0.00 6.00
Ash (%) 8.19 11.04 10.37
Volatile Matter (%) 30.34 40.87 38.42
Fixed Carbon (%) 35.70 48.09 45.20
Total (%) 100.00 100.00 100.00
Ultimate Analysis
C (%) 50.07 67.45 63.40
H (%) 3.38 4.56 4.29
O (%) 11.14 15.01 14.11
N (%) 0.71 0.96 0.90
S (%) 0.73 0.98 0.92
Cl (%) 0.01 0.01 0.01
Ash (%) 8.19 11.03 10.37
Moisture (%) 25.77 0.00 6.00
Total (%) 100.00 100.00 100.00
Heating Value
HHV (Btu/lb) 8,564 11,516 10,825
LHV (Btu/lb) 8,252 11,096 10,430
4.2 Site Conditions
Two separate site locations are assumed for the C/BTL plants analyzed in this report. Conceptual plants using Illinois #6 bituminous coal as feedstock are assumed to be located in Illinois and the ambient conditions are summarized in Table 4-4. The site is a greenfield facility occupying approximately 1,300 acres. Access is by road and rail and plant water requirements are assumed to be available. Treated wastewater is allowed to be discharged.
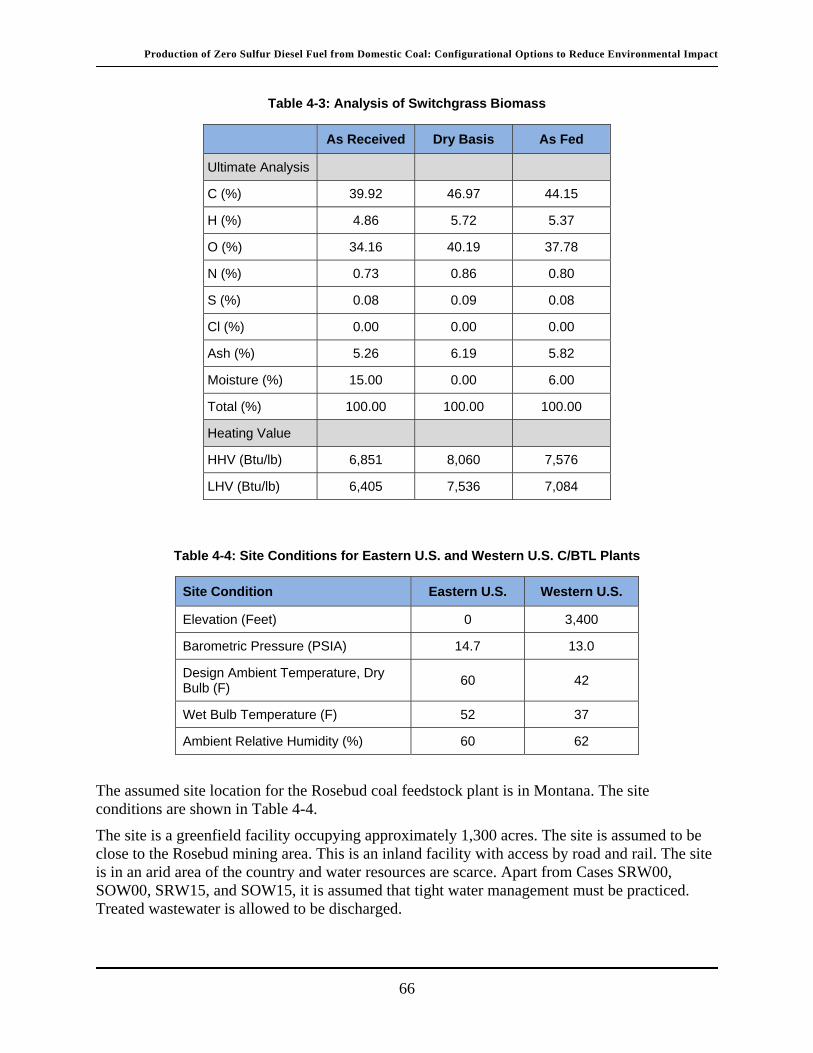
Production of Zero Sulfur Diesel Fuel from Domestic Coal: Configurational Options to Reduce Environmental Impact
66
Table 4-3: Analysis of Switchgrass Biomass
As Received Dry Basis As Fed
Ultimate Analysis
C (%) 39.92 46.97 44.15
H (%) 4.86 5.72 5.37
O (%) 34.16 40.19 37.78
N (%) 0.73 0.86 0.80
S (%) 0.08 0.09 0.08
Cl (%) 0.00 0.00 0.00
Ash (%) 5.26 6.19 5.82
Moisture (%) 15.00 0.00 6.00
Total (%) 100.00 100.00 100.00
Heating Value
HHV (Btu/lb) 6,851 8,060 7,576
LHV (Btu/lb) 6,405 7,536 7,084
Table 4-4: Site Conditions for Eastern U.S. and Western U.S. C/BTL Plants
Site Condition Eastern U.S. Western U.S.
Elevation (Feet) 0 3,400
Barometric Pressure (PSIA) 14.7 13.0
Design Ambient Temperature, Dry Bulb (F)
60 42
Wet Bulb Temperature (F) 52 37
Ambient Relative Humidity (%) 60 62
The assumed site location for the Rosebud coal feedstock plant is in Montana. The site conditions are shown in Table 4-4.
The site is a greenfield facility occupying approximately 1,300 acres. The site is assumed to be close to the Rosebud mining area. This is an inland facility with access by road and rail. The site is in an arid area of the country and water resources are scarce. Apart from Cases SRW00, SOW00, SRW15, and SOW15, it is assumed that tight water management must be practiced. Treated wastewater is allowed to be discharged.

Production of Zero Sulfur Diesel Fuel from Domestic Coal: Configurational Options to Reduce Environmental Impact
67
5 Results In evaluating sixteen CTL and CBTL plant configurations, it was determined that diesel fuel produced from coal:
Is economically viable when crude oil prices reach $95/bbl or $98/bbl for the recycle and poly-generation scenarios, respectively. This equates to diesel prices in the range of $2.70 to $2.80 per gallon of petroleum diesel.
Will produce less life cycle GHG emissions than petroleum fuels if produced from a recycle facility, regardless of the LCA methodology employed, so long as CO2 produced by the facility is sequestered. In the case of particularly high-methane content bituminous coals, some methane mitigation may also be required at the site of the mine.
Will, in the case of the poly-generation scenario, produce either significantly less or slightly more life cycle GHG emissions than petroleum fuels depending on the LCA methodology used. Therefore, poly-generation facilities might require the use of modest percentage of biomass (less than 10% by weight) or more aggressive carbon capture strategies if petroleum parity is required.
Will require between 1.6 and 7.4 barrels of water for each barrel of FT product produced, depending on the water management strategy utilized.
If a modest percentage of biomass is co-gasified with the coal to produce liquid fuels:
The point of economic viability is increased by $9 to $15 per bbl, to between $104/bbl and $115/bbl, representing a $0.26 to $0.46 per gallon increase in fuel price over the coal cases.
The fuel will produce less GHG emissions than petroleum-derived fuels, regardless of the configuration choice or LCA methodology, if 15 percent of the feedstock to the facility is switchgrass. A reduction of up to 48 percent less life cycle GHG emissions than petroleum-derived diesel is possible at this level of biomass usage.
Additional results:
The overall plant efficiency of the sub-bituminous coal cases is higher than that of the bituminous coal cases. This is due to the increased electrical power produced in the bituminous coal cases, which reduces the efficiency of the facility (as power generation is less efficient than coal generation). Less power is produced in the sub-bituminous cases as some of the steam which would otherwise be used for power production is instead utilized to dry the relatively high-moisture content subbituminous coal.
The poly-generation cases are all larger and more expensive than the recycle cases due to the 50,000 bpd design constraint. The facilities would be similar in size and cost if the coal input rate – and therefore syngas production rate –was held constant between the two cases, although the poly-generation cases would have a lower fuels output.

Production of Zero Sulfur Diesel Fuel from Domestic Coal: Configurational Options to Reduce Environmental Impact
68
5.1 Overall Results Summary for Bituminous Coal Configurations
Table 5-1 is a synopsis of the overall performance summary for the four bituminous coal configurations (BRW00, BOW00, BRW15, and BOW15). Overall plant HHV efficiency for once through CTL cases are lower than for the recycle cases because of the excess power produced and the relatively improved efficiency of fuels production over electric power production. The efficiency of the CBTL cases is slightly lower than the CTL cases mostly because of the energy penalties associated with biomass preparation.
Using the LCA displacement methodology the resulting petroleum ratio in all cases is less than one indicating that CTL and CBTL derived fuels can comply with Section 526 in EISA if the appropriate configuration is used and all plants practice CCS. Section 526 compliance is also very sensitive to the methane content of the coal. If a high methane content coal is utilized, coal mine methane recovery practices may be required for compliance. The two CBTL plants with 15 percent biomass (Cases BRW15 and BOW15) have significantly lower petroleum ratios than plants with no biomass because of the biomass carbon credit. The two once-through CTL plants (Cases BOW00 and BOW15) have lower petroleum ratios than the recycle cases because of the displacement value methodology used for the co-produced electric power, although this result is very sensitive to the assumed GHG profile of the displaced electric power.
Details of the carbon balances around the four plants on tons of carbon per day basis are shown in
Table A-1 in Appendix A. During the production of fuels and the generation of electricity, carbon as CO2 is captured using Selexol and MDEA units and this CO2 is assumed to be sequestered in suitable geologic formations. Carbon is contained in the liquid fuels product naphtha and diesel and this carbon is not released until the products are combusted, or otherwise utilized, by the end user. The ungasified coal carbon remains in the slag. In steady state operations the carbon in the stack gas and the fuel gases is the only carbon released to the atmosphere from the plants. Overall carbon capture for the plants is between 81 and 88 percent.
Table A-2 shows the values of the various accounts used in the limited GHG life cycle analysis. The units are in tons of carbon equivalents per annum. “Total carbon in” is the sum of the carbon contained in the coal and biomass (where applicable). Section 0 and Table 3-11 explain the accounting procedure used to estimate the “diesel effective carbon”. The resulting “petroleum ratio” is calculated from this LCA diesel effective carbon equivalent value as the quotient of the diesel effective carbon equivalent value on a pounds per MMBtu (LHV) and the reference petroleum value of 58.6 pounds carbon equivalent per MMBtu (LHV) (see Table 3-8).
Details of the electric power generation and the auxiliary plant power requirements for the plants are shown in Table A-3. All plants are self sufficient in electric power generation and all generate some additional net power for sales. The two once-through configurations generate a large excess of net power (9% to 11% of the total product slate on an energy basis). The largest parasitic power requirement is for air separation followed by CO2 compression and acid gas cleaning. Biomass pretreatment is also a large energy user.
A summary of the plant water balances for the configurations is shown in Table A-4. Inputs to the C/BTL plants included in the “CTL Process Inputs” account are: coal moisture; gasification steam; gasifier syngas quench makeup water; BFW makeup water; moisture contained in the

Production of Zero Sulfur Diesel Fuel from Domestic Coal: Configurational Options to Reduce Environmental Impact
69
input air; and small miscellaneous inputs. Included in the “Water Generated/Consumed” account are: the net consumption of water during coal gasification; the water contained in the raw wet syngas; resulting from the water quench; that is consumed for shift and COS hydrolysis; water produced in the FT and Claus reactors; and water produced as a result of the combustion of fuels in the gas turbines and fired heaters. A positive number denotes water generated and a negative number denotes water consumed. The “CTL Process Outputs” account includes: the water contained in the exhaust streams from the plant consisting of combustion air moisture; deaerator carry over; coal dryer moisture; water contained in the slag and other solid wastes; and discharged water. This shows a water balance as the sum of the “CTL Process Inputs” and “Water Generated/Consumed” accounts is equal to the “CTL Process Outputs” account.
Table A-5 shows details of the cooling water circuits for the plant configurations. The cooling water flow is obtained from the total cooling utility requirements and an assumed 20 °F temperature rise in the cooling water. All of these bituminous coal plants use mechanical draft cooling towers for all plant cooling duties and the cooling tower evaporation and drift losses are shown. Cooling tower water blow down is shown for an assumed 4 cycles of concentration. The make-up water requirement reflects the water usage and estimates for recycled water.
Table 5-1 also shows the net raw water consumption for the plants. This is also expressed as barrels of water used per barrel of FT product. For the recycle standard water configurations a raw water consumption of about 7 barrels of water per barrel of FT product is estimated from this analysis. Higher water consumption is estimated for the once-through cases, although some of this water is associated with the generation of electrical power for sale.
Table 5-1 shows the bare erected costs (BEC) for the plant configurations. The total BEC is the sum of the costs of the unit operations. The major cost item in all cases is for feedstock gasification. Other large cost accounts are for air separation and biomass preparation. The total cost of producing the clean synthesis gas from coal constitutes about 65-70 percent of the BEC. Details of the components of the BEC are shown in Table A-6. Table A-7 details the cost components of the “Syngas Cleaning & Shift” account in the BEC.
Details of the annual operating and maintenance costs for the plants are shown in Table A-8. Total fixed O&M includes labor, taxes and insurance and fixed TS&M costs. Total variable O&M includes maintenance materials, water, catalysts and chemicals, waste disposal, and variable TS&M costs. Fuel costs include the cost of coal and biomass (when applicable).
The Total Overnight Cost (TOC) of the plants is shown in Table 5-1. Table A-9 summarizes the components that constitute the total plant capital costs. The total plant cost (TPC) is the sum of the BEC, home office, and contingencies. The total overnight cost is the sum of the TPC, the owner’s costs, and the CO2 monitoring fund. The components of the Owner’s Costs are detailed in Table 3-1. The capital costs on a dollar per daily barrel basis (on a TOC basis) are shown in Table 5-1.
The required selling price (RSP) and crude oil equivalent selling price in $/barrel are shown at the bottom of Table 5-1. Details of the calculations are shown in Table A-10. The Annual Revenue Requirement (ARR) is the sum of the capital, fixed and variable operating, and fuel cost components minus the revenue from electric power sales. It represents the annual revenue needed to pay the operating costs, service the debt, and provide the expected rate of return for the investors. The required selling price (RSP) of the diesel fuel produced by the plants is calculated
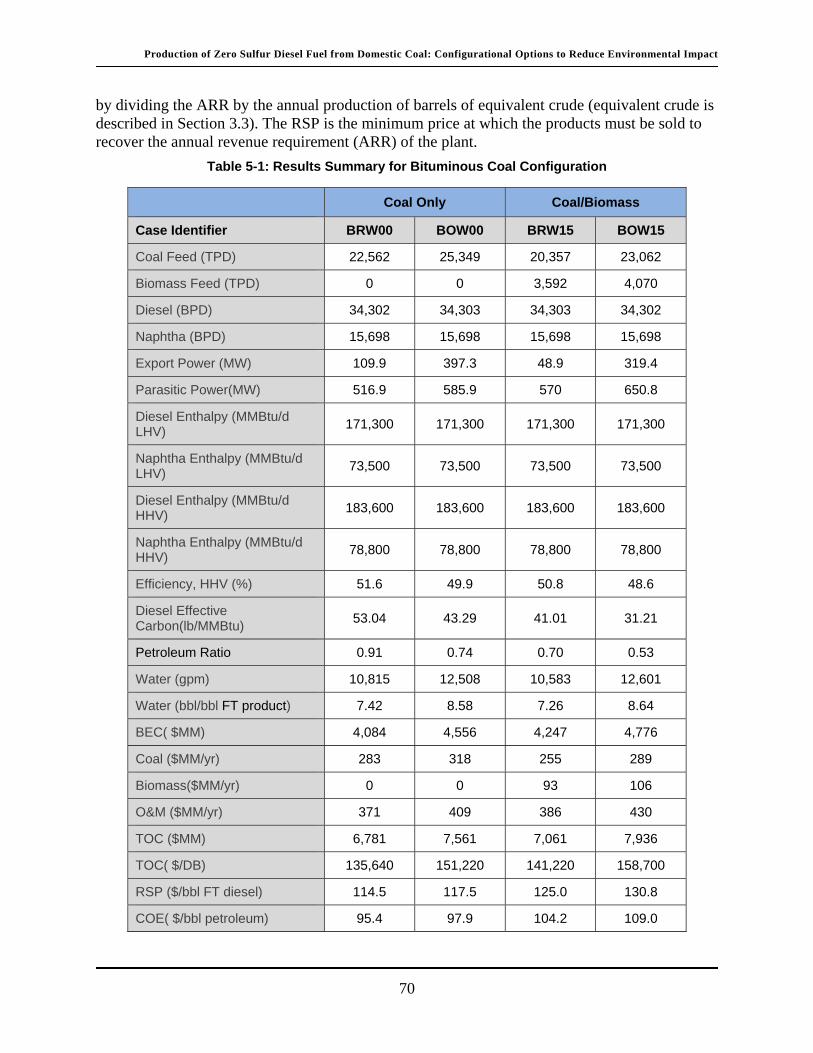
Production of Zero Sulfur Diesel Fuel from Domestic Coal: Configurational Options to Reduce Environmental Impact
70
by dividing the ARR by the annual production of barrels of equivalent crude (equivalent crude is described in Section 3.3). The RSP is the minimum price at which the products must be sold to recover the annual revenue requirement (ARR) of the plant.
Table 5-1: Results Summary for Bituminous Coal Configuration
Coal Only Coal/Biomass
Case Identifier BRW00 BOW00 BRW15 BOW15
Coal Feed (TPD) 22,562 25,349 20,357 23,062
Biomass Feed (TPD) 0 0 3,592 4,070
Diesel (BPD) 34,302 34,303 34,303 34,302
Naphtha (BPD) 15,698 15,698 15,698 15,698
Export Power (MW) 109.9 397.3 48.9 319.4
Parasitic Power(MW) 516.9 585.9 570 650.8
Diesel Enthalpy (MMBtu/d LHV)
171,300 171,300 171,300 171,300
Naphtha Enthalpy (MMBtu/d LHV)
73,500 73,500 73,500 73,500
Diesel Enthalpy (MMBtu/d HHV)
183,600 183,600 183,600 183,600
Naphtha Enthalpy (MMBtu/d HHV)
78,800 78,800 78,800 78,800
Efficiency, HHV (%) 51.6 49.9 50.8 48.6
Diesel Effective Carbon(lb/MMBtu)
53.04 43.29 41.01 31.21
Petroleum Ratio 0.91 0.74 0.70 0.53
Water (gpm) 10,815 12,508 10,583 12,601
Water (bbl/bbl FT product) 7.42 8.58 7.26 8.64
BEC( $MM) 4,084 4,556 4,247 4,776
Coal ($MM/yr) 283 318 255 289
Biomass($MM/yr) 0 0 93 106
O&M ($MM/yr) 371 409 386 430
TOC ($MM) 6,781 7,561 7,061 7,936
TOC( $/DB) 135,640 151,220 141,220 158,700
RSP ($/bbl FT diesel) 114.5 117.5 125.0 130.8
COE( $/bbl petroleum) 95.4 97.9 104.2 109.0
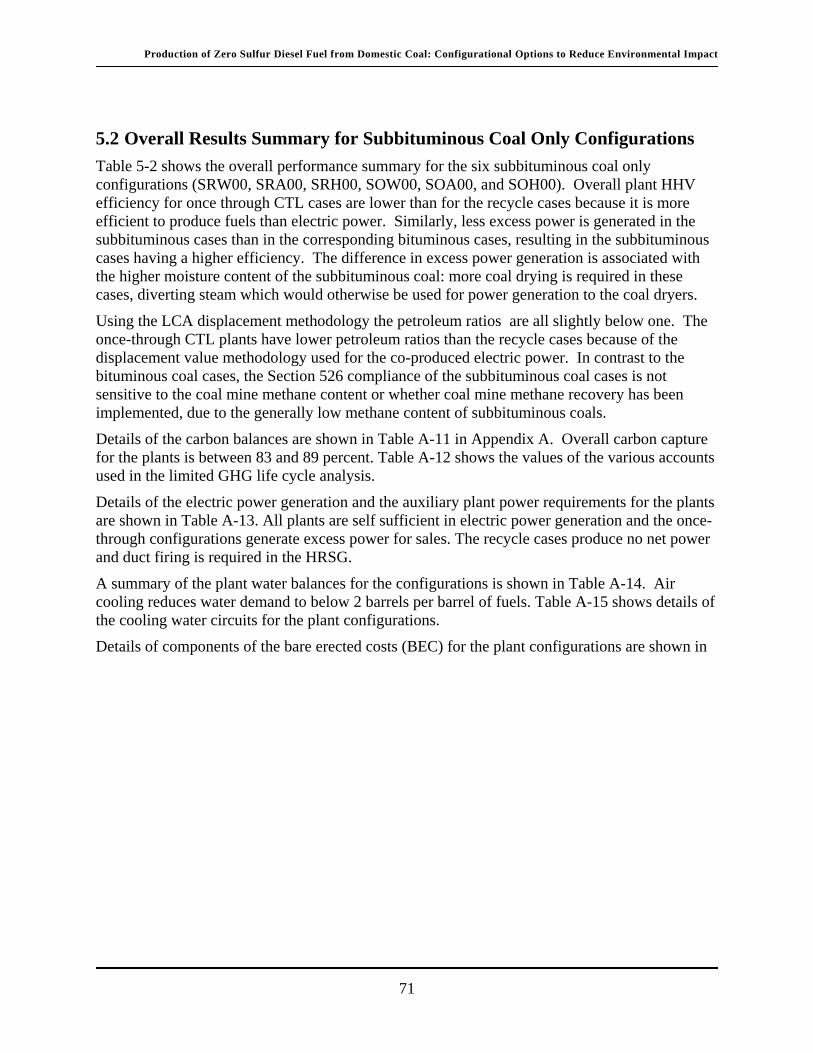
Production of Zero Sulfur Diesel Fuel from Domestic Coal: Configurational Options to Reduce Environmental Impact
71
5.2 Overall Results Summary for Subbituminous Coal Only Configurations
Table 5-2 shows the overall performance summary for the six subbituminous coal only configurations (SRW00, SRA00, SRH00, SOW00, SOA00, and SOH00). Overall plant HHV efficiency for once through CTL cases are lower than for the recycle cases because it is more efficient to produce fuels than electric power. Similarly, less excess power is generated in the subbituminous cases than in the corresponding bituminous cases, resulting in the subbituminous cases having a higher efficiency. The difference in excess power generation is associated with the higher moisture content of the subbituminous coal: more coal drying is required in these cases, diverting steam which would otherwise be used for power generation to the coal dryers.
Using the LCA displacement methodology the petroleum ratios are all slightly below one. The once-through CTL plants have lower petroleum ratios than the recycle cases because of the displacement value methodology used for the co-produced electric power. In contrast to the bituminous coal cases, the Section 526 compliance of the subbituminous coal cases is not sensitive to the coal mine methane content or whether coal mine methane recovery has been implemented, due to the generally low methane content of subbituminous coals.
Details of the carbon balances are shown in Table A-11 in Appendix A. Overall carbon capture for the plants is between 83 and 89 percent. Table A-12 shows the values of the various accounts used in the limited GHG life cycle analysis.
Details of the electric power generation and the auxiliary plant power requirements for the plants are shown in Table A-13. All plants are self sufficient in electric power generation and the once-through configurations generate excess power for sales. The recycle cases produce no net power and duct firing is required in the HRSG.
A summary of the plant water balances for the configurations is shown in Table A-14. Air cooling reduces water demand to below 2 barrels per barrel of fuels. Table A-15 shows details of the cooling water circuits for the plant configurations.
Details of components of the bare erected costs (BEC) for the plant configurations are shown in

Production of Zero Sulfur Diesel Fuel from Domestic Coal: Configurational Options to Reduce Environmental Impact
72
Table A-16 and Table A-17. Details of the annual operating and maintenance costs for the plants are shown in

Production of Zero Sulfur Diesel Fuel from Domestic Coal: Configurational Options to Reduce Environmental Impact
73
Table A-18. Total Overnight Cost (TOC) of the plants is shown in Table 5-2 and
Table A-19 summarizes the components that constitute the total plant capital costs. The capital costs on a dollar per daily barrel basis (on a TOC basis) are shown in Table 5-2. The required selling price (RSP) and crude oil equivalent selling price in $/barrel are shown at the bottom of Table 5-2. Details of the calculations are shown in
Table A-20.
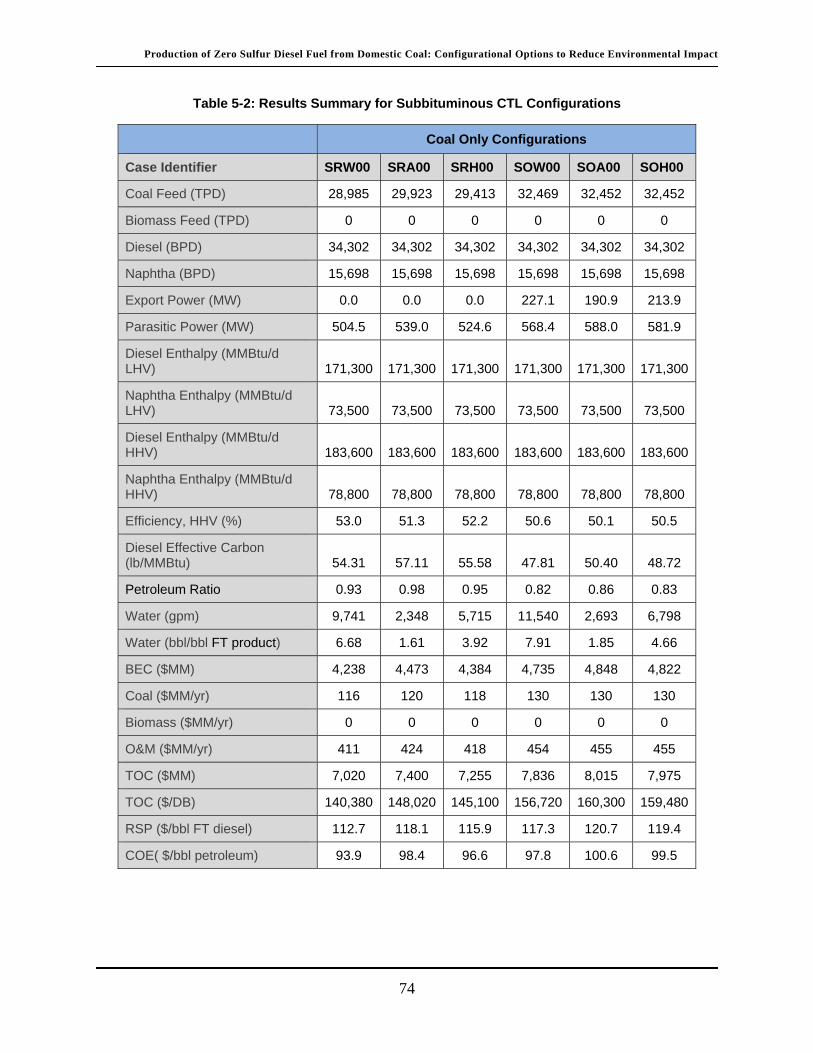
Production of Zero Sulfur Diesel Fuel from Domestic Coal: Configurational Options to Reduce Environmental Impact
74
Table 5-2: Results Summary for Subbituminous CTL Configurations
Coal Only Configurations
Case Identifier SRW00 SRA00 SRH00 SOW00 SOA00 SOH00
Coal Feed (TPD) 28,985 29,923 29,413 32,469 32,452 32,452
Biomass Feed (TPD) 0 0 0 0 0 0
Diesel (BPD) 34,302 34,302 34,302 34,302 34,302 34,302
Naphtha (BPD) 15,698 15,698 15,698 15,698 15,698 15,698
Export Power (MW) 0.0 0.0 0.0 227.1 190.9 213.9
Parasitic Power (MW) 504.5 539.0 524.6 568.4 588.0 581.9
Diesel Enthalpy (MMBtu/d LHV) 171,300 171,300 171,300 171,300 171,300 171,300
Naphtha Enthalpy (MMBtu/d LHV) 73,500 73,500 73,500 73,500 73,500 73,500
Diesel Enthalpy (MMBtu/d HHV) 183,600 183,600 183,600 183,600 183,600 183,600
Naphtha Enthalpy (MMBtu/d HHV) 78,800 78,800 78,800 78,800 78,800 78,800
Efficiency, HHV (%) 53.0 51.3 52.2 50.6 50.1 50.5
Diesel Effective Carbon (lb/MMBtu) 54.31 57.11 55.58 47.81 50.40 48.72
Petroleum Ratio 0.93 0.98 0.95 0.82 0.86 0.83
Water (gpm) 9,741 2,348 5,715 11,540 2,693 6,798
Water (bbl/bbl FT product) 6.68 1.61 3.92 7.91 1.85 4.66
BEC ($MM) 4,238 4,473 4,384 4,735 4,848 4,822
Coal ($MM/yr) 116 120 118 130 130 130
Biomass ($MM/yr) 0 0 0 0 0 0
O&M ($MM/yr) 411 424 418 454 455 455
TOC ($MM) 7,020 7,400 7,255 7,836 8,015 7,975
TOC ($/DB) 140,380 148,020 145,100 156,720 160,300 159,480
RSP ($/bbl FT diesel) 112.7 118.1 115.9 117.3 120.7 119.4
COE( $/bbl petroleum) 93.9 98.4 96.6 97.8 100.6 99.5

Production of Zero Sulfur Diesel Fuel from Domestic Coal: Configurational Options to Reduce Environmental Impact
75
5.3 Overall Results Summary for Subbituminous CBTL Configurations
Table 5-3 shows the results summary for the six subbituminous/biomass configurations. Again, overall plant HHV efficiency for once through CBTL cases are lower than for the recycle cases because it is more efficient to produce fuels than electric power. As in the bituminous coal cases, the efficiency of the CBTL cases is slightly lower than the CTL cases mostly because of the energy penalties associated with biomass preparation.
Using the LCA displacement methodology the resulting petroleum ratio in all cases is well below one. The once-through cases have lower petroleum ratios than the recycle cases because of the displacement value methodology used for the co-produced electric power.
Details of the carbon balances around the four plants on tons of carbon per day basis are shown in Table A-21 in the appendix. Overall carbon capture for the plants is between 83 and 87 percent. Table A-22 shows the values of the various accounts used in the limited GHG life cycle analysis.
Details of the electric power generation and the auxiliary plant power requirements for the plants are shown in Table A-23. All plants are self sufficient in electric power generation and once-through configurations generate excess power for sales. The largest parasitic power requirement is for air separation followed by CO2 compression and acid gas cleaning. Biomass pretreatment is also a large energy user.
A summary of the plant water balances for the configurations is shown in Table A-24. Table A-25 shows details of the cooling water circuits for the plant configurations. Table 5-3 shows the net raw water consumption for the plants. This is also expressed as barrels of water used per barrel of FT product. Water consumption savings is very significant for the air cooling cases with less than 2 barrels per barrel of fuel product being attained.
Table 5-3 shows the bare erected costs (BEC) for the plant configurations. Details of the components of the BEC are shown in Table A-26. Table A-27 details the cost components of the “Syngas Cleaning & Shift” account in the BEC.
Details of the annual operating and maintenance costs for the plants are shown in Table A-28. Table A-29 summarizes the components that constitute the total plant capital costs. The required selling price (RSP) and crude oil equivalent selling price in $/barrel are shown at the bottom of Table 5-3. Details of the calculations are shown in Table A-30.
Table 5-3: Results Summary for Subbituminous CBTL Configurations

Production of Zero Sulfur Diesel Fuel from Domestic Coal: Configurational Options to Reduce Environmental Impact
76
CBTL Configurations
Case Identifier SRW15 SRA15 SRH15 SOW15 SOA15 SOH15
Coal Feed (TPD) 26,883 27,908 27,183 29,119 29,104 29,104
Biomass Feed (TPD) 4,744 4,925 4,797 5,139 5,136 5,136
Diesel (BPD) 34,301 34,302 34,302 34,302 34,302 34,301
Naphtha (BPD) 15,698 15,698 15,698 15,698 15,698 15,698
Export Power (MW) 0.0 0.0 0.0 190.3 150.5 177.2
Parasitic Power (MW) 605.1 648.9 625.0 659.1 679.2 672.4
Diesel Enthalpy (MMBtu/d LHV) 171,300 171,300 171,300 171,300 171,300 171,300
Naphtha Enthalpy (MMBtu/d LHV) 73,500 73,500 73,500 73,500 73,500 73,500
Diesel Enthalpy (MMBtu/d HHV) 183,600 183,600 183,600 183,600 183,600 183,600
Naphtha Enthalpy (MMBtu/d HHV) 78,800 78,800 78,800 78,800 78,800 78,800
Efficiency, HHV (%) 50.0 48.2 49.5 48.9 48.4 48.8
Diesel Effective Carbon (lb/MMBtu) 38.60 41.19 39.32 30.30 33.19 31.25
Petroleum Ratio 0.66 0.70 0.67 0.52 0.57 0.53
Water (gpm) 10,688 2,386 6,590 11,881 2,490 7,005
Water (bbl/bbl) 7.33 1.64 4.52 8.15 1.71 4.8
BEC ($MM) 4,681 4,963 4,815 5,069 5,180 5,152
Coal ($MM/yr) 107 112 109 116 116 116
Biomass ($MM/yr) 117 121 118 126 126 126
O&M ($MM/yr) 447 462 453 479 479 480
TOC ($MM) 7,763 8,221 7,978 8,403 8,577 8,533
TOC ($/DB) 155,240 164,420 159,560 168,040 171,540 170,660
RSP ($/bbl FT diesel) 130.4 137.0 133.4 133.8 137.3 135.8
COE( $/bbl petroleum) 108.7 114.2 111.2 111.5 114.4 113.2

Production of Zero Sulfur Diesel Fuel from Domestic Coal: Configurational Options to Reduce Environmental Impact
77
6 Sensitivity Analyses
6.1 Sensitivity to Indirect Air Cooling Capital Cost Estimate
The capital cost estimates for the air cooling system were based on ROM estimates provided by SPX12 and these estimates have a relatively larger uncertainty than other capital cost estimates. At an estimated cost of approximately $200 million for air cooling systems of this size, the penalty in substituting indirect air cooling for standard mechanical draft cooling in the subbituminous coal-only recycle configurations (SRW00 and SRA00) is estimated to be about $5.50 per barrel of diesel produced. If the cost of the air cooling system was to be increased by 50 percent to $300 million the difference in diesel RSP between these two cases would increase to $7.40 per barrel. Figure 6-1 shows a plot of diesel RSP versus the capital cost (BEC) of the air cooling system for Case SRA00.
Figure 6-1: Sensitivity of Diesel RSP to Air Cooling Capital Cost
112
114
116
118
120
122
124
0 100 200 300 400
RSP
($/bbl FT diesel)
Air Cooling BEC ($MM)
SRA00
SRW00
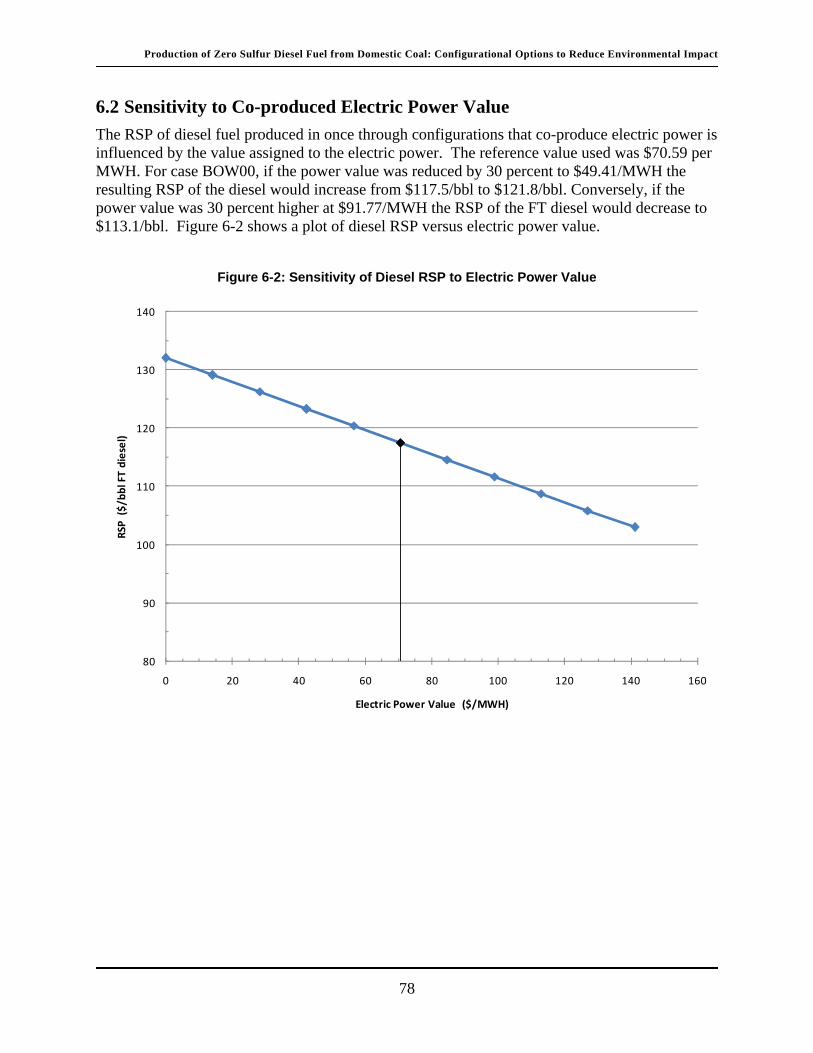
Production of Zero Sulfur Diesel Fuel from Domestic Coal: Configurational Options to Reduce Environmental Impact
78
6.2 Sensitivity to Co-produced Electric Power Value
The RSP of diesel fuel produced in once through configurations that co-produce electric power is influenced by the value assigned to the electric power. The reference value used was $70.59 per MWH. For case BOW00, if the power value was reduced by 30 percent to $49.41/MWH the resulting RSP of the diesel would increase from $117.5/bbl to $121.8/bbl. Conversely, if the power value was 30 percent higher at $91.77/MWH the RSP of the FT diesel would decrease to $113.1/bbl. Figure 6-2 shows a plot of diesel RSP versus electric power value.
Figure 6-2: Sensitivity of Diesel RSP to Electric Power Value
80
90
100
110
120
130
140
0 20 40 60 80 100 120 140 160
RSP
($/bbl FT diesel)
Electric Power Value ($/MWH)
Production of Zero Sulfur Diesel Fuel from Domestic Coal: Configurational Options to Reduce Environmental Impact
79
6.3 Sensitivity to Return on Equity
The diesel RSP estimates are based on an internal rate of return on equity (IRROE) of 20%. With a lower risk profile and lower IRROE, the RSP would be correspondingly lower. Figure 6-3 shows a plot of diesel RSP versus IRROE for Cases SOA15, BOW15, BRW00, and SRW00. These cases span the range of capital cost among the various configurations. On average, the RSP drops $4-5/bbl for each percentage point drop in IRROE.
Figure 6-3: Sensitivity of Diesel RSP to IRROE
60
70
80
90
100
110
120
130
140
150
6 8 10 12 14 16 18 20 22
RSP
($/bbl FT diesel)
Internal Rate of Return on Equity (%)
SOA15
BOW15
BRW00
SRW00

Production of Zero Sulfur Diesel Fuel from Domestic Coal: Configurational Options to Reduce Environmental Impact
58
7 Findings and Conclusions For the bituminous coal cases (BRW00, BOW00, BRW15, and BOW15) the following findings can be made by referring to Table 5-1:
For the two CTL plants with no biomass addition (cases BRW00 and BOW00) the petroleum ratio (PR) calculated by using the LCA displacement methodology was found to be less than one in both cases. The PR for once-through configurations was lower than for recycle because of the displacement GHG credit taken for co-produced power. This implies that if the LCA displacement methodology is used, CTL plants with CCS are able to produce fuels compliant with Section 526 with no biomass addition if the appropriate configuration is used to capture the CO2 produced during fuels production.
One feasible option to further reduce the PR of CTL plants with CCS is to add biomass. This study analyzed the impact of adding 15 percent by mass of switchgrass (on an as-received basis). For the recycle case this reduced the PR from 0.91 to 0.70, well below the GHG footprint of petroleum-derived fuels. However for this size plant this required the addition of 3,500 TPD (as-received) of biomass. To obtain that quantity of biomass on a continuous basis for 328 days per year could well be a challenge. The encouraging aspect is that only a relatively small amount of biomass is needed to significantly reduce the PR. This implies that amounts lower than 15 percent would insure that the CBTL plant would be capable of producing fuels easily compliant with Section 526 of EISA. The lowest petroleum ratio of 0.53 was for the 15 percent biomass once-through case. This is the result of taking the biomass carbon credit and the power and naphtha displacement credits.
For the bituminous coal cases the overall efficiency was higher for the recycle mode of operation. This is because it is generally more efficient to produce fuels than power.
For the bituminous coal cases there was no effort made to reduce water consumption and conventional water cooling was used. For recycle cases water consumption was around 7.5 barrels per barrel of fuel product. For once-through cases water demand increased (around 8.5 barrels per barrel) because of additional cooling duty needed for turbine steam condensation.
Addition of 15 percent biomass imposes a $10 per barrel penalty on the recycle mode RSP of diesel. In the once-through mode the penalty increases to $13 per barrel. This penalty is the result of the high cost of biomass on a Btu basis ($5.34/MMBtu) and the pretreatment and biomass preparation costs.
The resulting RSP of zero sulfur diesel from these bituminous CTL and CBTL plants averages $122/bbl FT diesel ($2.90/gallon FT diesel). These fuels will be economically viable to produce when crude oil is as low as $95/bblCOEP for the coal-only cases or as low as $104/bblCOEP for the coal/biomass cases.
For the subbituminous coal-only cases (SRW00, SRA00, SRH00, SOW00, SOA00, and SOH00) the following findings can be made by referring to Table 5-2:

Production of Zero Sulfur Diesel Fuel from Domestic Coal: Configurational Options to Reduce Environmental Impact
59
For the subbituminous cases the PRs are slightly below that of petroleum-derived fuel. The once-through cases have lower PRs because of the electric power GHG displacement credit.
The subbituminous cases investigated three different water management techniques to assess their impact on performance and costs. For comparison case SRW00 used all water cooling although this would be unlikely in practice because of the semi-arid plant location. Using indirect air cooling for the recycle case reduced water use from 6.7 barrels of water per barrel of fuel product (bbl/bbl)††to 1.6 bbl/bbl. The hybrid water management system had a water use in between air and water cooling at 3.9 bbl/bbl. Similar results were obtained for the once-through configurations, although water use is increased over that of the recycle cases.
Air and hybrid cooling impose an additional energy penalty that results from the power use for the air cooling fans. This increases the parasitic power requirement for these cases.
Using air and hybrid cooling imposes a cost penalty that is reflected in the increase in the RSP of the diesel fuel produced. Air cooling increases the RSP of the diesel fuel in the recycle case by $5.40/bbl compared to the water cooling case. Hybrid cooling adds a $3.20/bbl penalty. Because of the value chosen for the co-produced power the penalty for the once-through cases is less.
For water cooling cases the TOC is higher for the subbituminous plants than for the bituminous. This is primarily because of the greater coal throughput in the subbituminous cases. However, the lower coal cost tends to compensate for this and the resulting diesel RSP for cases BRW00 and SRW00 are very close as are the RSPs for cases BOW00 and SOW00.
The resulting RSP of zero sulfur diesel from these subbituminous CTL plants averages $117/bbl FT diesel ($2.79/gallon FT diesel). These fuels will be economically viable to produce when crude oil is as low as $94/bblCOEP.
For the subbituminous coal cases with biomass (SRW15, SRA15, SRH15, SOW15, SOA15, and SOH15) the following findings can be made by referring to Table 5-3:
As expected the PRs are significantly reduced compared to the subbituminous coal-only cases. Section 526 compliance would be readily attained for these configurations.
As expected the trends in water usage follow those of the subbituminous coal-only cases.
The TOC for this series of cases is the highest. This is because of the plant coal through put and the costs of biomass pretreatment. This, together with the high cost of the biomass feed stock, results in the highest RSP for the FT diesel product.
†† Note that this analysis ratios the water use to the fuels products, not the total energy products. If there was no excess power, the water usage ratio would be smaller.

Production of Zero Sulfur Diesel Fuel from Domestic Coal: Configurational Options to Reduce Environmental Impact
60
The resulting RSP of zero sulfur diesel from these subbituminous CBTL plants averages $117/bbl FT diesel ($2.79/gallon FT diesel). These fuels will be economically viable to produce when crude oil is as low as $94/bblCOEP for the coal-only cases or as low as $104/bblCOEP for the coal/biomass cases.
This comprehensive study of C/BTL using different coals, different configurations, and several water management options has produced a matrix of results that can be used to gain a better understanding of the complexities of these integrated systems. The overall findings of this study are that both Eastern bituminous and Western subbituminous coals could be used to produce high quality, fungible diesel fuel for transportation if future circumstances warranted. Further, that this fuel could be produced with a smaller GHG footprint than petroleum fuels, especially when a small percentage of biomass is added, and with low water consumption.
However, the estimated capital cost of these C/BTL plants is high, in the range of $135,000 to $170,000 per daily barrel on a TOC basis. This combined with feedstock and other operating and maintenance costs results in RSPs for the diesel fuel produced in the range of $113-$137 per barrel FT diesel ($2.68 -$3.27/gallon FT diesel).
It should, however, also be emphasized that this study is only a conceptual design study. The technologies utilized are all commercially available, however, the specific plant configurations evaluated have not been built. Therefore, while the configurations are technically feasible, an integrated demonstration will be required to reduce the potentially significant uncertainty in both the estimated capital and operating costs of the plants.
There are also technical performance uncertainties. Primary among these is the suitability of the biomass switchgrass to be used as a feed for high pressure entrained gasification. Pretreatment of this material will be challenging and other more amenable biomass may have to be used in a commercial plant. In this study it is assumed that once the CO2 produced in the C/BTL plant has been captured and compressed it can be sequestered for a certain cost. One sequestration pathway, enhanced oil recovery (EOR), has been proven and may be the best near-term solution for CO2 long-term sequestration. This report, however, assumes sequestration in a geologic reservoir owing to the larger sequestration potential of such reservoirs. Technologies and potential storage reservoirs for this approach are currently being demonstrated and the hope is that many of them will prove successful.
Another uncertainty is the costs and penalties associated with using total indirect air cooling for cooling duty. The costs and penalties involved may be higher than have been assumed in this study. Another issue is the disposition and value of the FT co-product naphtha. Although an excellent feed stock for ethylene production, production of large quantities of this material may not command the value assumed in this study. NETL has initiated a separate study to investigate opportunities to refine FT naphtha into a fungible gasoline.
8 References 1) Tarka, T. et. al., “Affordable Low-Carbon Diesel Fuel From Domestic Coal and
Biomass”, DOE/NETL-2009/1349, January 2009
2) Harry Morehead, Siemens Gasification and IGCC Update, Presented at the Gasification Technologies Council Meeting, Washington DC Oct 2008

Production of Zero Sulfur Diesel Fuel from Domestic Coal: Configurational Options to Reduce Environmental Impact
62
3) Siemens Fuel Gasification Technology, Answers for Energy, Brochure published by Siemens AG, 2008
4) A. van der Drift et al., Entrained Flow Gasification of Biomass, ECN-C-04-039, April 2004
5) A.P. Steynberg and M.E. Dry editors. Fischer-Tropsch Technology, Studies in Surface Science and Catalysis 152, Elsevier 2004.
6) James Cobb, Production of Synthesis Gas by Biomass Gasification, Proceedings of the Spring AIChE Meeting, Houston, Texas, April 2007
7) WTA Technology, A Modern Process for Treating and Drying Lignite, RWE Power internet brochure.
8) “Cost and Performance Baseline for Low-Rank Coal Fossil Energy IGCC Power Plants with and without CO2 Capture”, Final report DOE/NETL-2010/1399, March 2010
9) Personal communications with Tom Tarka, NETL, 2009-2010
10) Oil & Gas Journal, PennWell Publishing, Houston, TX, Vols. 107.1 to 107.46 and Vols. 108.1 to 108.46
11) Tarka, T., “Quality Guidelines for Energy Systems Analysis: Methane Emissions from Mining Illinois Basin Coals”, DOE/NETL-2010/1445, September 2010
12) Tarka, T., “Quality Guidelines for Energy Systems Analysis: Methane Emissions from Mining Powder River Basin Coals”, DOE/NETL-2010/1445, September 2010
13) Personal communications with Tom Tarka, NETL, 2009-2010
14) Personal communication with Ralph Wyndrum, Principal Systems Engineer, SPX Cooling Technologies Inc.
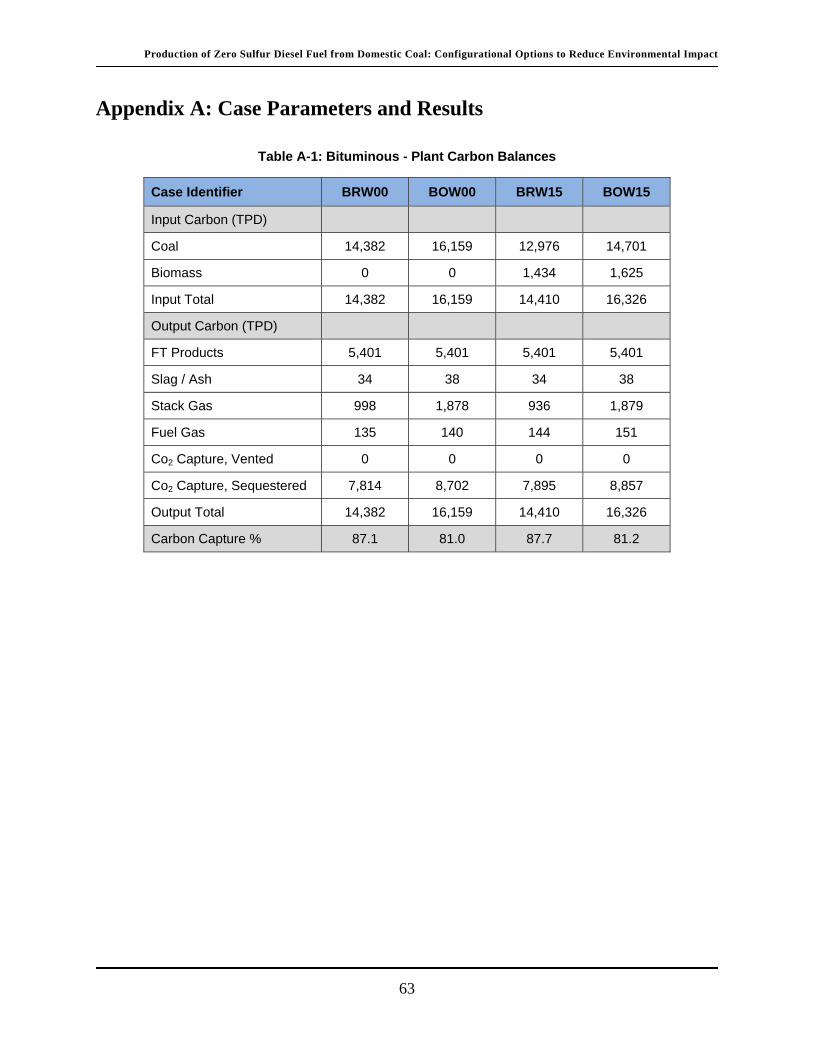
Production of Zero Sulfur Diesel Fuel from Domestic Coal: Configurational Options to Reduce Environmental Impact
63
Appendix A: Case Parameters and Results
Table A-1: Bituminous - Plant Carbon Balances
Case Identifier BRW00 BOW00 BRW15 BOW15
Input Carbon (TPD)
Coal 14,382 16,159 12,976 14,701
Biomass 0 0 1,434 1,625
Input Total 14,382 16,159 14,410 16,326
Output Carbon (TPD)
FT Products 5,401 5,401 5,401 5,401
Slag / Ash 34 38 34 38
Stack Gas 998 1,878 936 1,879
Fuel Gas 135 140 144 151
Co2 Capture, Vented 0 0 0 0
Co2 Capture, Sequestered 7,814 8,702 7,895 8,857
Output Total 14,382 16,159 14,410 16,326
Carbon Capture % 87.1 81.0 87.7 81.2
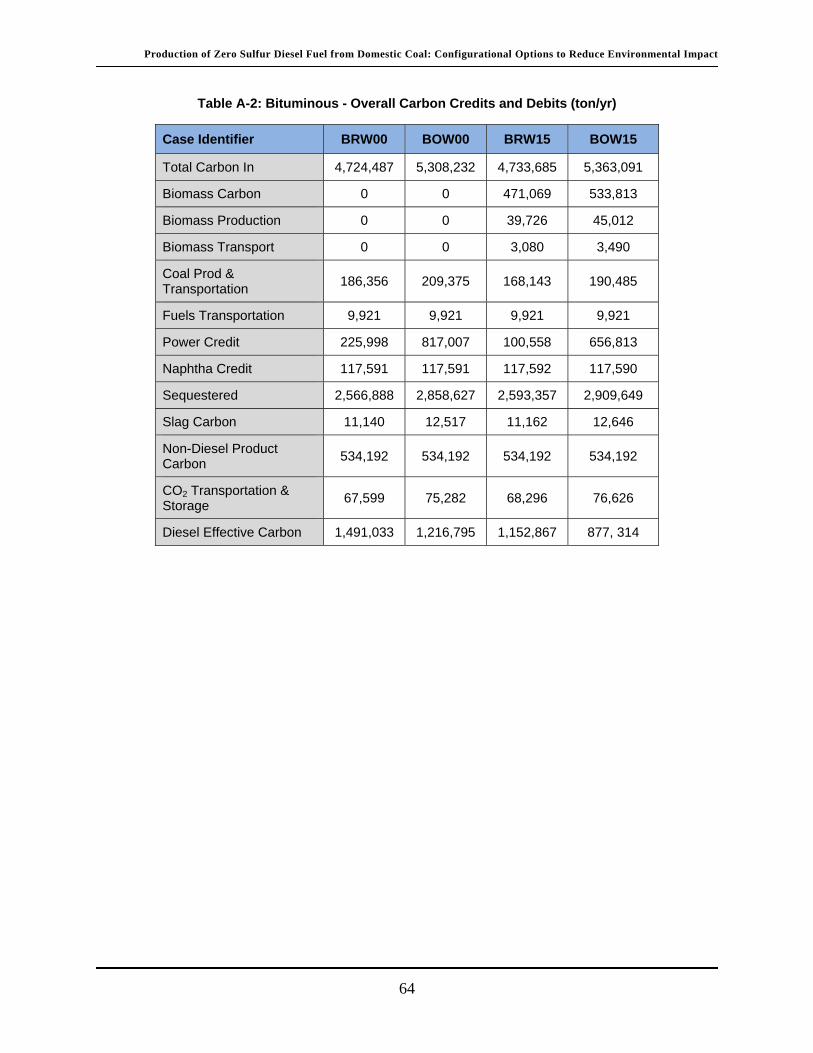
Production of Zero Sulfur Diesel Fuel from Domestic Coal: Configurational Options to Reduce Environmental Impact
64
Table A-2: Bituminous - Overall Carbon Credits and Debits (ton/yr)
Case Identifier BRW00 BOW00 BRW15 BOW15
Total Carbon In 4,724,487 5,308,232 4,733,685 5,363,091
Biomass Carbon 0 0 471,069 533,813
Biomass Production 0 0 39,726 45,012
Biomass Transport 0 0 3,080 3,490
Coal Prod & Transportation
186,356 209,375 168,143 190,485
Fuels Transportation 9,921 9,921 9,921 9,921
Power Credit 225,998 817,007 100,558 656,813
Naphtha Credit 117,591 117,591 117,592 117,590
Sequestered 2,566,888 2,858,627 2,593,357 2,909,649
Slag Carbon 11,140 12,517 11,162 12,646
Non-Diesel Product Carbon
534,192 534,192 534,192 534,192
CO2 Transportation & Storage
67,599 75,282 68,296 76,626
Diesel Effective Carbon 1,491,033 1,216,795 1,152,867 877, 314
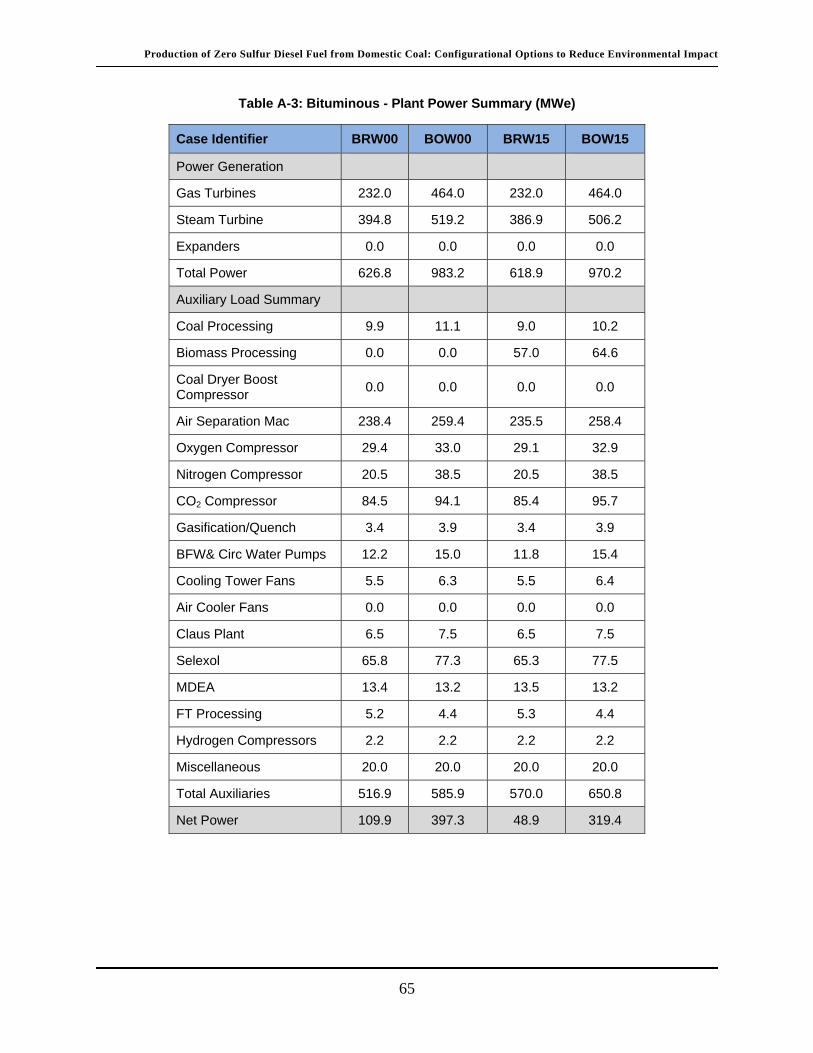
Production of Zero Sulfur Diesel Fuel from Domestic Coal: Configurational Options to Reduce Environmental Impact
65
Table A-3: Bituminous - Plant Power Summary (MWe)
Case Identifier BRW00 BOW00 BRW15 BOW15
Power Generation
Gas Turbines 232.0 464.0 232.0 464.0
Steam Turbine 394.8 519.2 386.9 506.2
Expanders 0.0 0.0 0.0 0.0
Total Power 626.8 983.2 618.9 970.2
Auxiliary Load Summary
Coal Processing 9.9 11.1 9.0 10.2
Biomass Processing 0.0 0.0 57.0 64.6
Coal Dryer Boost Compressor
0.0 0.0 0.0 0.0
Air Separation Mac 238.4 259.4 235.5 258.4
Oxygen Compressor 29.4 33.0 29.1 32.9
Nitrogen Compressor 20.5 38.5 20.5 38.5
CO2 Compressor 84.5 94.1 85.4 95.7
Gasification/Quench 3.4 3.9 3.4 3.9
BFW& Circ Water Pumps 12.2 15.0 11.8 15.4
Cooling Tower Fans 5.5 6.3 5.5 6.4
Air Cooler Fans 0.0 0.0 0.0 0.0
Claus Plant 6.5 7.5 6.5 7.5
Selexol 65.8 77.3 65.3 77.5
MDEA 13.4 13.2 13.5 13.2
FT Processing 5.2 4.4 5.3 4.4
Hydrogen Compressors 2.2 2.2 2.2 2.2
Miscellaneous 20.0 20.0 20.0 20.0
Total Auxiliaries 516.9 585.9 570.0 650.8
Net Power 109.9 397.3 48.9 319.4

Production of Zero Sulfur Diesel Fuel from Domestic Coal: Configurational Options to Reduce Environmental Impact
66
Table A-4: Bituminous - Plant Water Balance (gpm)
Case Identifier BRW00 BOW00 BRW15 BOW15
CTL Process Inputs
Coal/Biomass Moisture 418 469 467 529
Gasification Steam 207 232 8 0
Syngas Quench Makeup 565 814 610 893
BFW Make Up 68 79 66 80
Moisture In Air 130 182 129 181
Selexol Purge 10 10 10 10
Subtotal 1,398 1,787 1,289 1,694
Water Generated/Consumed
Burners 91 69 67 75
Gas Turbine 420 884 419 883
Claus 67 75 61 70
FT Reactor 586 576 587 576
Gasification -73 -80 101 119
WGS & COS Hydrolysis -1,116 -1,363 -1,147 -1,420
Subtotal -25 161 88 303
CTL Process Outputs
Exhaust 846 1,365 858 1,415
Solids Waste 447 492 442 491
Discharge 79 91 77 92
Subtotal 1,372 1,948 1,377 1,997

Production of Zero Sulfur Diesel Fuel from Domestic Coal: Configurational Options to Reduce Environmental Impact
67
Table A-5: Bituminous - Cooling Water Circuit (gpm)
Case Identifier BRW00 BOW00 BRW15 BOW15
Cooling Water Flow 571,409 652,041 567,058 666,122
Cooling Tower Evap/Drift Loss
9,200 10,498 9,130 10,725
Cooling Water Blowdown 3,067 3,499 3,043 3,575
Cooling Water Make Up 9,966 11,373 9,890 11,618
Net Raw Water Consumed 10,815 12,508 10,583 12,601

Production of Zero Sulfur Diesel Fuel from Domestic Coal: Configurational Options to Reduce Environmental Impact
68
Table A-6: Bituminous - Bare Erected Cost Summary ($MM)
Case Identifier BRW00 BOW00 BRW15 BOW15
Coal/Biomass Handling 96 106 101 113
Coal/Biomass Prep & Feed 481 535 610 682
Feedwater Bop Systems 51 59 50 59
Gasification 820 912 861 965
Air Separation 752 845 743 842
Syngas Cleaning & Shift* 471 525 468 528
CO2Compression 79 88 80 90
Gas Turbine 50 100 50 100
HRSG 51 65 48 66
Steam Turbine 114 142 112 139
FT Synthesis 368 367 368 367
FT Refining 181 181 181 181
Tankage & Shipping 46 46 46 46
Ash Handling 87 96 86 96
AccesElec Plant 62 84 61 84
Instrument/Control 64 70 67 74
Site Improvements 43 47 45 50
Build/Structures 45 49 47 52
Cooling Water System 53 59 53 60
Air Cooling System 0 0 0 0
CO2Transportation & Storage 170 180 170 182
Bare Erected Cost 4,084 4,556 4,247 4,776
*Cost details provided in Table A-7

Production of Zero Sulfur Diesel Fuel from Domestic Coal: Configurational Options to Reduce Environmental Impact
69
Table A-7: Bituminous - Cost Details of Syngas Cleaning & Shift ($MM/yr)
Case Identifier BRW00 BOW00 BRW15 BOW15
Raw Shift 14 17 14 17
COS Hydrolysis 25 26 24 26
Mercury Removal 9 10 9 10
Selexol 2-Stage 217 255 221 263
Claus 87 97 80 90
Other 19 21 20 23
Hydrogen Recovery
8 8 8 8
MDEA 92 91 92 91
Total 471 525 468 528
Table A-8: Bituminous - Annual Operating and Maintenance Costs ($MM/yr)
Case Identifier BRW00 BOW00 BRW15 BOW15
Labor 107 121 114 129
Maintenance Materials
92 102 95 107
Water 6 6 5 6
Chemicals 49 49 49 49
Waste Disposal 9 10 9 10
TS&M Variable 0 0 0 0
Nonfuel Consumables
55 56 55 56
Tax & Insurance 108 121 113 127
TS&M Fixed 1 1 1 1
Total Fixed O&M 216 242 227 257
Total Variable O&M 155 167 159 173
Coal Cost 283 318 255 289
Biomass Cost 0 0 93 106

Production of Zero Sulfur Diesel Fuel from Domestic Coal: Configurational Options to Reduce Environmental Impact
70
Table A-9: Bituminous - Total Capital Costs Summary ($MM)
Case Identifier BRW00 BOW00 BRW15 BOW15
Bare Erected Cost (BEC) 4,084 4,556 4,247 4,776
Home Office 388 433 403 454
Process Contingency 286 319 297 334
Project Contingency 655 731 682 766
Total Plant Cost (TPC) 5,413 6,039 5,629 6,330
CO2 Monitoring Fund (ND)
78 87 79 89
Owner’s Costs 1,290 1,435 1,353 1,517
Total Overnight Cost (TOC)
6,781 7,561 7,061 7,936
Capital ($/Daily Barrel) 135,640 151,220 141,220 158,700
Table A-10: Bituminous - Overall Economic Summary
Case Identifier BRW00 BOW00 BRW15 BOW15
Parameters
Capital Charge Factor 0.16953 0.16953 0.16953 0.16953
Coal Cost ($/ton AR) 38.18 38.18 38.18 38.18
Biomass Cost ($/ton Dry) N/A N/A 88 88
Components of RSP ($MM/Annum)
Capital 1,150 1,282 1,197 1,345
Fixed Operating Cost 216 242 227 257
Variable Operating Cost 155 167 159 173
Coal Cost 283 318 255 289
Biomass Cost 0 0 93 106
Power Credit 61 221 27 178
Annual Revenue Required 1,744 1,790 1,905 1,992
Required Selling Price (RSP, $/bbl)
RSP ($/bbl FT diesel) 114.5 117.5 125.0 130.8
COE ($/bbl petroleum) 95.4 97.9 104.2 109.0

Production of Zero Sulfur Diesel Fuel from Domestic Coal: Configurational Options to Reduce Environmental Impact
71
Table A-11: SubbituminousCTL - Plant Carbon Balances
Case Identifier SRW00 SRA00 SRH00 SOW00 SOA00 SOH00
Input Carbon (TPD)
Coal 14,512 14,982 14,726 16,257 16,248 16,248
Biomass 0 0 0 0 0 0
Input Total 14,512 14,982 14,726 16,257 16,248 16,248
Output Carbon (TPD)
FT Products 5,401 5,401 5,401 5,401 5,401 5,401
Slag / Ash 34 35 35 38 38 38
Stack Gas 886 1,118 991 1,724 1,719 1,719
Fuel Gas 73 73 73 72 72 72
CO2Capture, Vented 0 0 0 0 0 0
CO2Capture, Sequestered
8,118 8,355 8,226 9,022 9,018 9,018
Output Total 14,512 14,982 14,726 16,257 16,248 16,248
Carbon Capture % 89.2 87.3 88.3 83.2 83.2 83.2

Production of Zero Sulfur Diesel Fuel from Domestic Coal: Configurational Options to Reduce Environmental Impact
72
Table A-12: Subbituminous CTL - Overall Carbon Credits and Debits (ton/yr)
Case Identifier SRW00 SRA00 SRH00 SOW00 SOA00 SOH00
Total Carbon In 4,767,192 4,921,587 4,837,491 5,340,425 5,337,468 5,337,468
Biomass Carbon 0 0 0 0 0 0
Biomass Production
0 0 0 0 0 0
Biomass Transport
0 0 0 0 0 0
Coal Prod & Transportation
52,287 53,979 53,059 58,572 58,541 58,541
Fuels Transportation
9,921 9,921 9,921 9,921 9,921 9,921
Power Credit 0 0 0 467,214 392,772 439,863
Naphtha Credit 117,595 117,596 117,595 117,595 117,595 117,595
Sequestered 2,666,739 2,744,759 2,702,172 2,963,863 2,962,501 2,962,459
Slag Carbon 11,241 11,605 11,407 12,593 12,586 12,586
Non-Diesel Product Carbon
534,242 534,242 534,242 534,242 534,242 534,242
CO2 Transportation & Storage
70,229 72,283 71,162 78,053 78,017 78,016
Diesel Effective Carbon
1,526,590 1,605,440 1,562,369 1,344,044 1,416,791 1,369,499

Production of Zero Sulfur Diesel Fuel from Domestic Coal: Configurational Options to Reduce Environmental Impact
73
Table A-13:Subbituminous CTL - Plant Power Summary (MWe)
Case Identifier SRW00 SRA00 SRH00 SOW00 SOA00 SOH00
Power Generation
Gas Turbines 220.7 217.9 219.2 428.9 428.4 428.4
Steam Turbine 283.7 321.1 305.4 366.6 350.5 367.4
Expanders 0.0 0.0 0.0 0.0 0.0 0.0
Total Power 504.4 539.0 524.6 795.5 778.9 795.8
Auxiliary Load Summary
Coal Processing 12.7 13.1 12.9 14.2 14.2 14.2
Biomass Processing 0.0 0.0 0.0 0.0 0.0 0.0
Coal Dryer Boost Compressor
1.3 1.4 1.4 1.5 1.5 1.5
Air Separation Mac 236.3 247.5 243.1 256.1 259.4 259.4
Oxygen Compressor 27.7 29.1 28.6 31.0 31.5 31.5
Nitrogen Compressor 18.1 17.7 18.0 32.5 33.0 33.0
CO2 Compressor 88.5 93.3 91.9 98.1 100.5 100.5
Gasification/Quench 0.9 0.9 0.9 1.0 1.0 1.0
BFW & Circ Water Pumps 9.2 11.1 10.1 12.2 12.3 12.2
Cooling Tower Fans 5.2 0.0 2.4 6.1 0.0 2.8
Air Cooler Fans 0.0 17.3 9.3 0.0 18.9 10.1
Claus Plant 5.7 5.9 5.8 6.5 6.5 6.5
Selexol 58.7 61.5 60.0 69.7 69.7 69.7
MDEA 13.5 13.5 13.5 13.0 13.0 13.0
FT Processing 4.6 4.5 4.6 4.4 4.4 4.4
Hydrogen Compressors 2.1 2.1 2.1 2.1 2.1 2.1
Miscellaneous 20.0 20.0 20.0 20.0 20.0 20.0
Total Auxiliaries 504.4 539.0 524.6 568.4 588.0 581.9
Net Power 0.0 0.0 0.0 227.1 190.9 213.9

Production of Zero Sulfur Diesel Fuel from Domestic Coal: Configurational Options to Reduce Environmental Impact
74
Table A-14:Subbituminous CTL - Plant Water Balances (gpm)
Case Identifier SRW00 SRA00 SRH00 SOW00 SOA00 SOH00
CTL Process Inputs
Coal/Biomass Moisture 1,244 1,284 1,262 1,393 1,393 1,393
Gasification Steam 145 146 146 156 156 156
Syngas Quench Makeup -344 -306 -327 -199 -200 -200
BFW Make Up 49 56 52 62 62 62
Moisture In Air 72 74 73 101 101 101
Selexol Purge 10 10 10 10 10 10
Subtotal 1,177 1,265 1,216 1,523 1,522 1,522
Water Generated/Consumed
Burners 31 32 32 34 34 34
Gas Turbine 385 390 387 811 809 809
Claus 29 30 29 33 33 33
FT Reactor 588 587 587 595 596 596
Gasification 18 20 19 24 24 24
WGS & COS Hydrolysis -1,131 -1,200 -1,162 -1,403 -1,402 -1,402
Subtotal -80 -140 -108 94 93 93
CTL Process Outputs
Exhaust 509 518 513 969 967 967
Solids Waste 478 491 483 526 526 526
Discharge 110 117 112 123 123 123
Subtotal 1,096 1,125 1,109 1,617 1,615 1,615

Production of Zero Sulfur Diesel Fuel from Domestic Coal: Configurational Options to Reduce Environmental Impact
75
Table A-15: Subbituminous CTL - Cooling Water Circuit (gpm)
Case Identifier SRW00 SRA00 SRH00 SOW00 SOA00 SOH00
Cooling Water Flow 532,217 575,082 551,239 621,752 628,896 622,985
Cooling Tower Evap/Drift Loss
8,569 0 3,946 10,010 0 4,682
Cooling Water Blowdown 2,856 8,626 5,907 3,337 9,433 6,543
Cooling Water Make Up 9,283 1,725 5,128 10,844 1,887 5,991
Net Raw Water Consumed 9,741 2,348 5,715 11,540 2,693 6,798
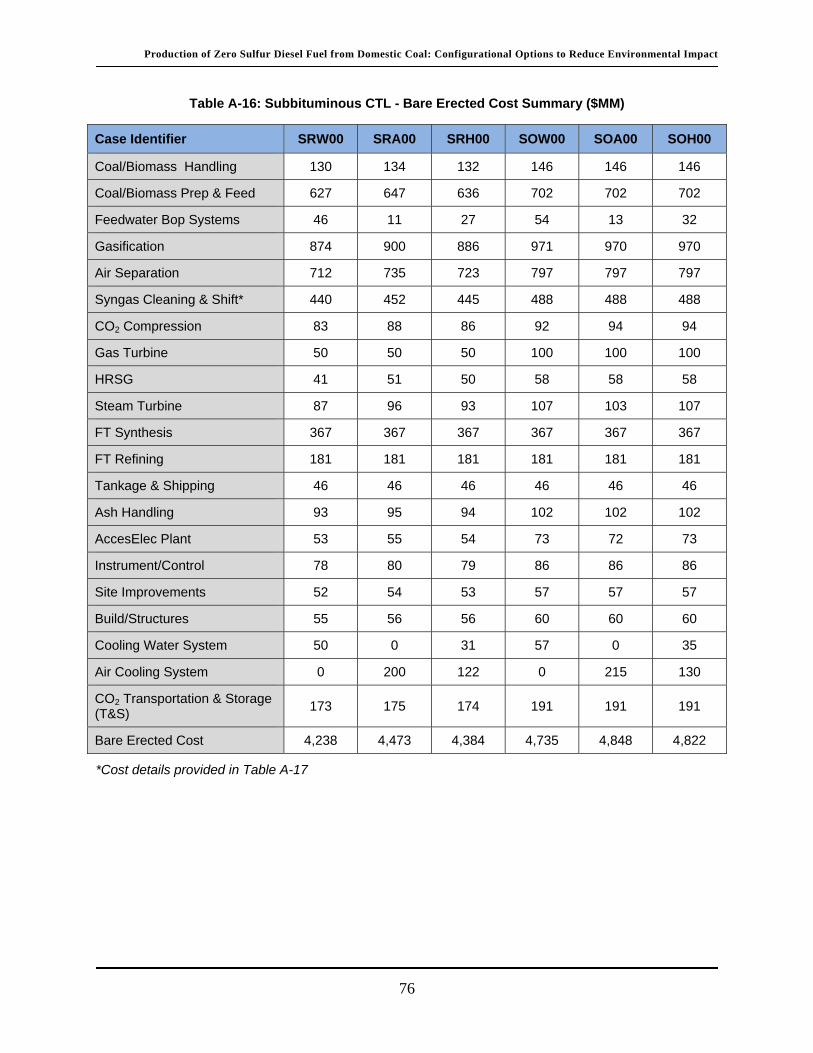
Production of Zero Sulfur Diesel Fuel from Domestic Coal: Configurational Options to Reduce Environmental Impact
76
Table A-16: Subbituminous CTL - Bare Erected Cost Summary ($MM)
Case Identifier SRW00 SRA00 SRH00 SOW00 SOA00 SOH00
Coal/Biomass Handling 130 134 132 146 146 146
Coal/Biomass Prep & Feed 627 647 636 702 702 702
Feedwater Bop Systems 46 11 27 54 13 32
Gasification 874 900 886 971 970 970
Air Separation 712 735 723 797 797 797
Syngas Cleaning & Shift* 440 452 445 488 488 488
CO2 Compression 83 88 86 92 94 94
Gas Turbine 50 50 50 100 100 100
HRSG 41 51 50 58 58 58
Steam Turbine 87 96 93 107 103 107
FT Synthesis 367 367 367 367 367 367
FT Refining 181 181 181 181 181 181
Tankage & Shipping 46 46 46 46 46 46
Ash Handling 93 95 94 102 102 102
AccesElec Plant 53 55 54 73 72 73
Instrument/Control 78 80 79 86 86 86
Site Improvements 52 54 53 57 57 57
Build/Structures 55 56 56 60 60 60
Cooling Water System 50 0 31 57 0 35
Air Cooling System 0 200 122 0 215 130
CO2 Transportation & Storage (T&S)
173 175 174 191 191 191
Bare Erected Cost 4,238 4,473 4,384 4,735 4,848 4,822
*Cost details provided in Table A-17

Production of Zero Sulfur Diesel Fuel from Domestic Coal: Configurational Options to Reduce Environmental Impact
77
Table A-17: Subbituminous CTL - Cost Detail of Syngas Cleaning & Shift ($MM/yr)
Case Identifier SRW00 SRA00 SRH00 SOW00 SOA00 SOH00
Raw Shift 14 15 14 17 17 17
COS Hydrolysis 25 25 25 26 26 26
Mercury Removal 11 11 11 12 12 12
Selexol 2 Stage 229 239 234 270 270 270
Claus 36 37 36 40 40 40
Other 24 25 24 26 26 26
Hydrogen Recovery
8 8 8 8 8 8
MDEA 93 92 93 89 89 89
Total 440 452 445 488 488 488
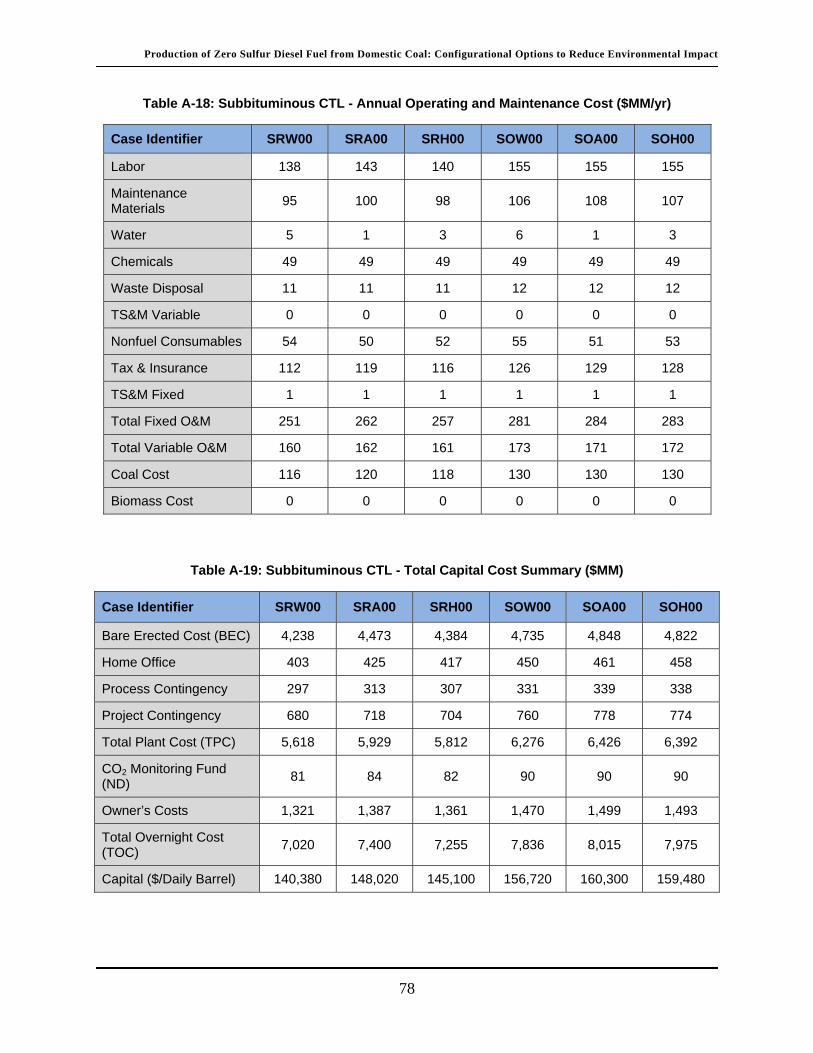
Production of Zero Sulfur Diesel Fuel from Domestic Coal: Configurational Options to Reduce Environmental Impact
78
Table A-18: Subbituminous CTL - Annual Operating and Maintenance Cost ($MM/yr)
Case Identifier SRW00 SRA00 SRH00 SOW00 SOA00 SOH00
Labor 138 143 140 155 155 155
Maintenance Materials
95 100 98 106 108 107
Water 5 1 3 6 1 3
Chemicals 49 49 49 49 49 49
Waste Disposal 11 11 11 12 12 12
TS&M Variable 0 0 0 0 0 0
Nonfuel Consumables 54 50 52 55 51 53
Tax & Insurance 112 119 116 126 129 128
TS&M Fixed 1 1 1 1 1 1
Total Fixed O&M 251 262 257 281 284 283
Total Variable O&M 160 162 161 173 171 172
Coal Cost 116 120 118 130 130 130
Biomass Cost 0 0 0 0 0 0
Table A-19: Subbituminous CTL - Total Capital Cost Summary ($MM)
Case Identifier SRW00 SRA00 SRH00 SOW00 SOA00 SOH00
Bare Erected Cost (BEC) 4,238 4,473 4,384 4,735 4,848 4,822
Home Office 403 425 417 450 461 458
Process Contingency 297 313 307 331 339 338
Project Contingency 680 718 704 760 778 774
Total Plant Cost (TPC) 5,618 5,929 5,812 6,276 6,426 6,392
CO2 Monitoring Fund (ND)
81 84 82 90 90 90
Owner’s Costs 1,321 1,387 1,361 1,470 1,499 1,493
Total Overnight Cost (TOC)
7,020 7,400 7,255 7,836 8,015 7,975
Capital ($/Daily Barrel) 140,380 148,020 145,100 156,720 160,300 159,480
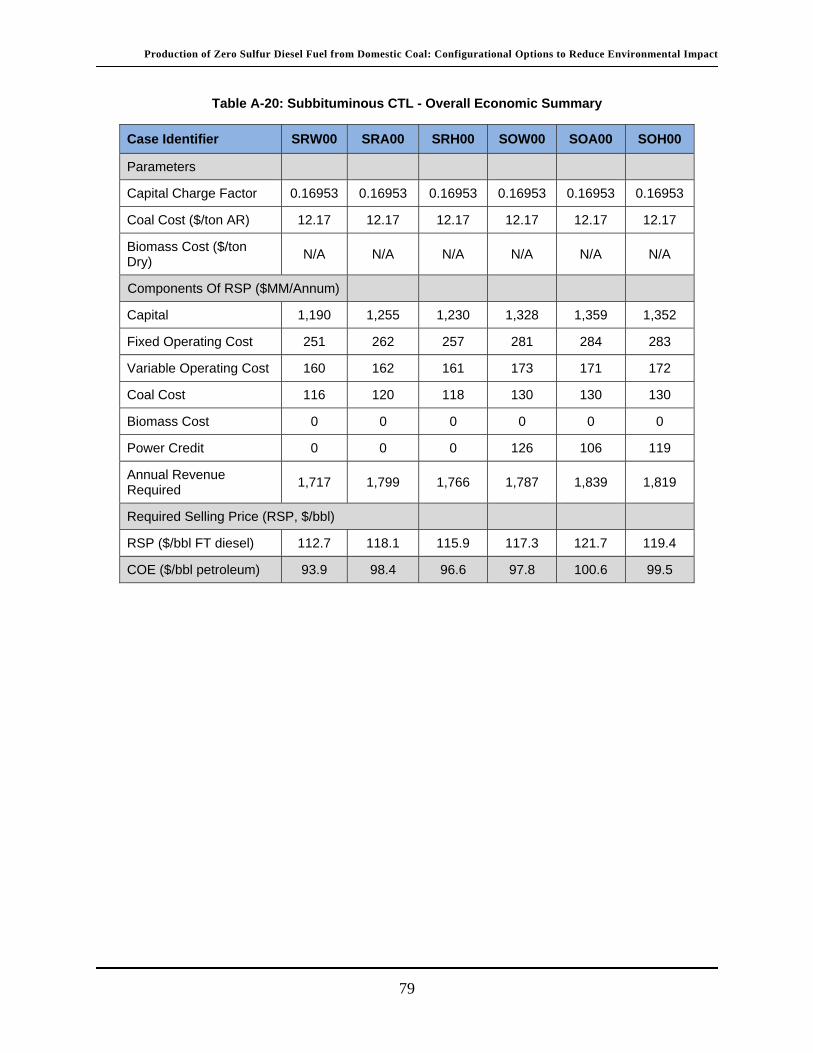
Production of Zero Sulfur Diesel Fuel from Domestic Coal: Configurational Options to Reduce Environmental Impact
79
Table A-20: Subbituminous CTL - Overall Economic Summary
Case Identifier SRW00 SRA00 SRH00 SOW00 SOA00 SOH00
Parameters
Capital Charge Factor 0.16953 0.16953 0.16953 0.16953 0.16953 0.16953
Coal Cost ($/ton AR) 12.17 12.17 12.17 12.17 12.17 12.17
Biomass Cost ($/ton Dry)
N/A N/A N/A N/A N/A N/A
Components Of RSP ($MM/Annum)
Capital 1,190 1,255 1,230 1,328 1,359 1,352
Fixed Operating Cost 251 262 257 281 284 283
Variable Operating Cost 160 162 161 173 171 172
Coal Cost 116 120 118 130 130 130
Biomass Cost 0 0 0 0 0 0
Power Credit 0 0 0 126 106 119
Annual Revenue Required
1,717 1,799 1,766 1,787 1,839 1,819
Required Selling Price (RSP, $/bbl)
RSP ($/bbl FT diesel) 112.7 118.1 115.9 117.3 121.7 119.4
COE ($/bbl petroleum) 93.9 98.4 96.6 97.8 100.6 99.5

Production of Zero Sulfur Diesel Fuel from Domestic Coal: Configurational Options to Reduce Environmental Impact
80
Table A-21: Subbituminous CBTL - Plant Carbon Balances
Case Identifier SRW15 SRA15 SRH15 SOW15 SOA15 SOH15
Input Carbon (TPD)
Coal 13,460 13,973 13,610 14,579 14,572 14,572
Biomass 1,894 1,966 1,915 2,052 2,051 2,051
Input Total 15,354 15,939 15,525 16,631 16,623 16,623
Output Carbon (TPD)
FT Products 5,401 5,401 5,401 5,401 5,401 5,401
Slag / Ash 36 38 37 38 39 38
Stack Gas 1,238 1,516 1,316 1,843 1,839 1,840
Fuel Gas 73 72 73 72 72 72
CO2 Capture, Vented 0 0 0 0 0 0
CO2 Capture, Sequestered
8,606 8,912 8,698 9,076 9,272 9,271
Output Total 15,354 15,939 15,525 16,631 16,623 16,623
Carbon Capture % 86.6 84.7 86.0 82.7 82.7 82.7
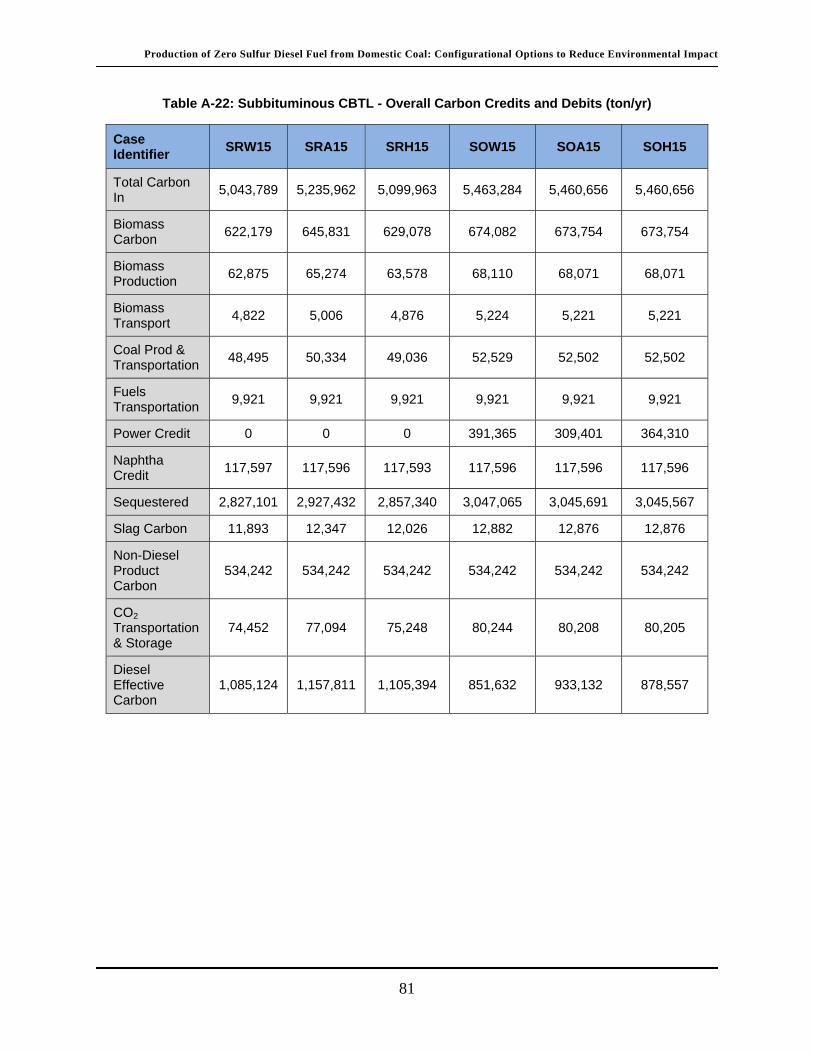
Production of Zero Sulfur Diesel Fuel from Domestic Coal: Configurational Options to Reduce Environmental Impact
81
Table A-22: Subbituminous CBTL - Overall Carbon Credits and Debits (ton/yr)
Case Identifier
SRW15 SRA15 SRH15 SOW15 SOA15 SOH15
Total Carbon In
5,043,789 5,235,962 5,099,963 5,463,284 5,460,656 5,460,656
Biomass Carbon
622,179 645,831 629,078 674,082 673,754 673,754
Biomass Production
62,875 65,274 63,578 68,110 68,071 68,071
Biomass Transport
4,822 5,006 4,876 5,224 5,221 5,221
Coal Prod & Transportation
48,495 50,334 49,036 52,529 52,502 52,502
Fuels Transportation
9,921 9,921 9,921 9,921 9,921 9,921
Power Credit 0 0 0 391,365 309,401 364,310
Naphtha Credit
117,597 117,596 117,593 117,596 117,596 117,596
Sequestered 2,827,101 2,927,432 2,857,340 3,047,065 3,045,691 3,045,567
Slag Carbon 11,893 12,347 12,026 12,882 12,876 12,876
Non-Diesel Product Carbon
534,242 534,242 534,242 534,242 534,242 534,242
CO2 Transportation & Storage
74,452 77,094 75,248 80,244 80,208 80,205
Diesel Effective Carbon
1,085,124 1,157,811 1,105,394 851,632 933,132 878,557
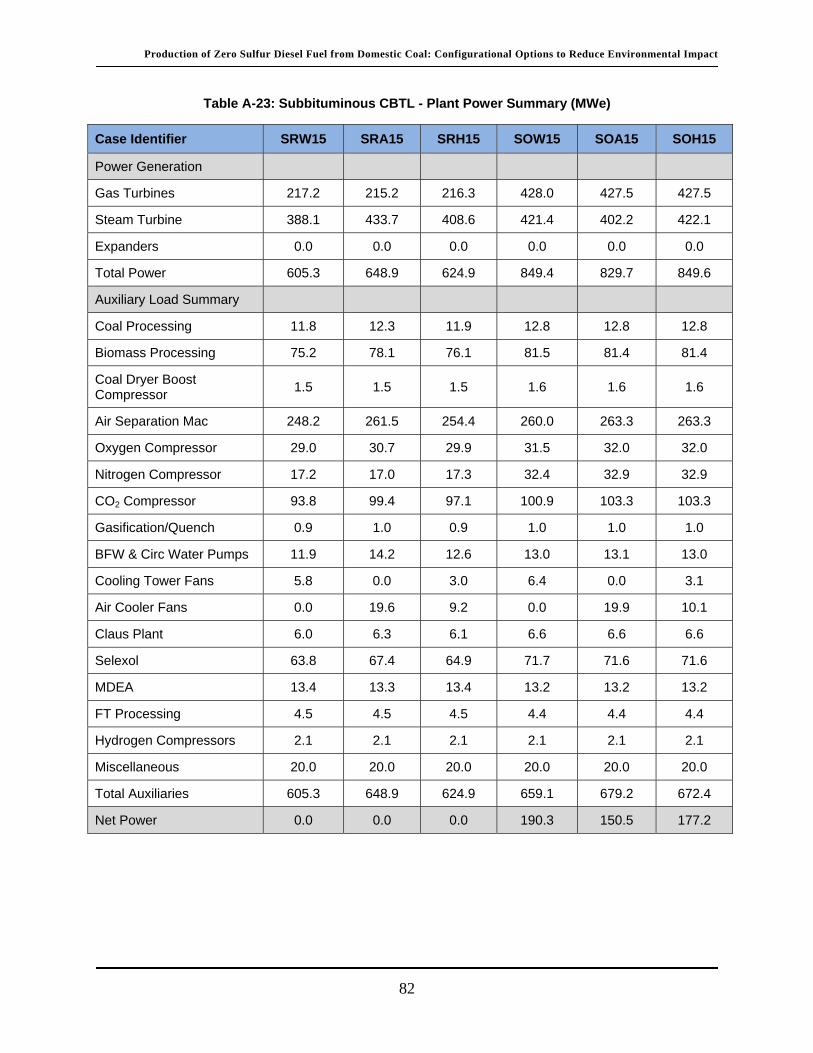
Production of Zero Sulfur Diesel Fuel from Domestic Coal: Configurational Options to Reduce Environmental Impact
82
Table A-23: Subbituminous CBTL - Plant Power Summary (MWe)
Case Identifier SRW15 SRA15 SRH15 SOW15 SOA15 SOH15
Power Generation
Gas Turbines 217.2 215.2 216.3 428.0 427.5 427.5
Steam Turbine 388.1 433.7 408.6 421.4 402.2 422.1
Expanders 0.0 0.0 0.0 0.0 0.0 0.0
Total Power 605.3 648.9 624.9 849.4 829.7 849.6
Auxiliary Load Summary
Coal Processing 11.8 12.3 11.9 12.8 12.8 12.8
Biomass Processing 75.2 78.1 76.1 81.5 81.4 81.4
Coal Dryer Boost Compressor
1.5 1.5 1.5 1.6 1.6 1.6
Air Separation Mac 248.2 261.5 254.4 260.0 263.3 263.3
Oxygen Compressor 29.0 30.7 29.9 31.5 32.0 32.0
Nitrogen Compressor 17.2 17.0 17.3 32.4 32.9 32.9
CO2 Compressor 93.8 99.4 97.1 100.9 103.3 103.3
Gasification/Quench 0.9 1.0 0.9 1.0 1.0 1.0
BFW & Circ Water Pumps 11.9 14.2 12.6 13.0 13.1 13.0
Cooling Tower Fans 5.8 0.0 3.0 6.4 0.0 3.1
Air Cooler Fans 0.0 19.6 9.2 0.0 19.9 10.1
Claus Plant 6.0 6.3 6.1 6.6 6.6 6.6
Selexol 63.8 67.4 64.9 71.7 71.6 71.6
MDEA 13.4 13.3 13.4 13.2 13.2 13.2
FT Processing 4.5 4.5 4.5 4.4 4.4 4.4
Hydrogen Compressors 2.1 2.1 2.1 2.1 2.1 2.1
Miscellaneous 20.0 20.0 20.0 20.0 20.0 20.0
Total Auxiliaries 605.3 648.9 624.9 659.1 679.2 672.4
Net Power 0.0 0.0 0.0 190.3 150.5 177.2

Production of Zero Sulfur Diesel Fuel from Domestic Coal: Configurational Options to Reduce Environmental Impact
83
Table A-24: Subbituminous CBTL - Plant Water Balance (gpm)
Case Identifier SRW15 SRA15 SRH15 SOW15 SOA15 SOH15
CTL Process Inputs
Coal/Biomass Moisture 1,272 1,321 1,286 1,378 1,377 1,377
Gasification Steam 0 0 0 0 0 0
Syngas Quench Makeup -279 -235 -265 -181 -182 -182
BFW Make Up 61 70 64 66 66 66
Moisture In Air 75 77 75 102 102 102
Selexol Purge 10 10 10 10 10 10
Subtotal 1,139 1,242 1,170 1,374 1,373 1,373
Water Generated/Consumed
Burners 32 33 33 33 33 33
Gas Turbine 394 398 395 807 805 805
Claus 28 30 29 31 31 31
FT Reactor 587 585 586 586 586 586
Gasification 199 207 202 217 217 217
WGS & COS Hydrolysis -1,245 -1,330 -1,271 -1,433 -1,433 -1,432
Subtotal -5 -77 -28 242 241 241
CTL Process Outputs
Exhaust 522 529 524 965 963 963
Solids Waste 491 507 495 525 525 525
Discharge 121 130 124 126 126 126
Subtotal 1,134 1,166 1,143 1,616 1,614 1,614

Production of Zero Sulfur Diesel Fuel from Domestic Coal: Configurational Options to Reduce Environmental Impact
84
Table A-25 Subbituminous CBTL – Cooling Water Circuit (gpm)
Case Identifier SRW15 SRA15 SRH15 SOW15 SOA15 SOH15
Cooling Water Flow 598,008 650,988 612,338 651,919 659,980 653,163
Cooling Tower Evap/Drift Loss
9,628 0 4,967 10,496 0 5,152
Cooling Water Blowdown 3,209 9,765 6,213 3,499 9,900 6,715
Cooling Water Make Up 10,430 1,953 6,210 11,371 1,980 6,495
Net Raw Water Consumed 10,688 2,386 6,590 11,881 2,490 7,005
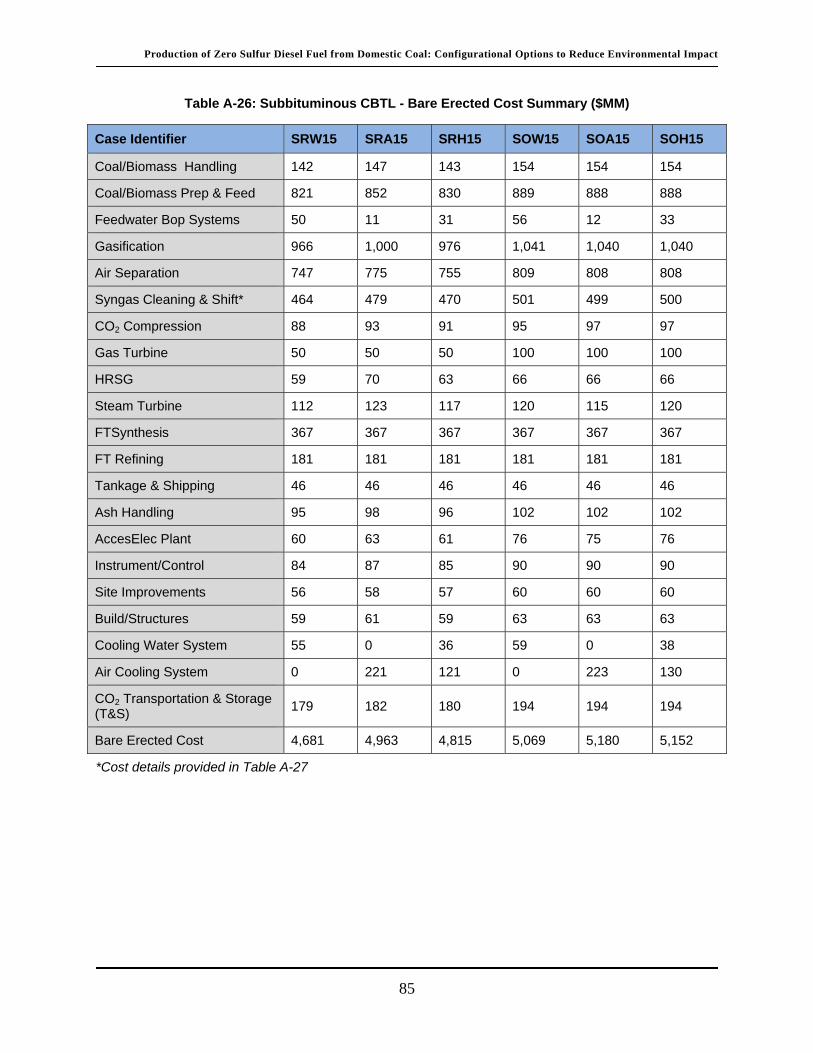
Production of Zero Sulfur Diesel Fuel from Domestic Coal: Configurational Options to Reduce Environmental Impact
85
Table A-26: Subbituminous CBTL - Bare Erected Cost Summary ($MM)
Case Identifier SRW15 SRA15 SRH15 SOW15 SOA15 SOH15
Coal/Biomass Handling 142 147 143 154 154 154
Coal/Biomass Prep & Feed 821 852 830 889 888 888
Feedwater Bop Systems 50 11 31 56 12 33
Gasification 966 1,000 976 1,041 1,040 1,040
Air Separation 747 775 755 809 808 808
Syngas Cleaning & Shift* 464 479 470 501 499 500
CO2 Compression 88 93 91 95 97 97
Gas Turbine 50 50 50 100 100 100
HRSG 59 70 63 66 66 66
Steam Turbine 112 123 117 120 115 120
FTSynthesis 367 367 367 367 367 367
FT Refining 181 181 181 181 181 181
Tankage & Shipping 46 46 46 46 46 46
Ash Handling 95 98 96 102 102 102
AccesElec Plant 60 63 61 76 75 76
Instrument/Control 84 87 85 90 90 90
Site Improvements 56 58 57 60 60 60
Build/Structures 59 61 59 63 63 63
Cooling Water System 55 0 36 59 0 38
Air Cooling System 0 221 121 0 223 130
CO2 Transportation & Storage (T&S)
179 182 180 194 194 194
Bare Erected Cost 4,681 4,963 4,815 5,069 5,180 5,152
*Cost details provided in Table A-27

Production of Zero Sulfur Diesel Fuel from Domestic Coal: Configurational Options to Reduce Environmental Impact
86
Table A-27: Subbituminous CBTL - Cost Details of Syngas Cleaning & Shift ($MM/yr)
Case Identifier SRW15 SRA15 SRH15 SOW15 SOA15 SOH15
Raw Shift 15 16 16 17 17 17
COS Hydrolysis 26 26 26 27 26 27
Mercury Removal 12 12 12 13 13 13
Selexol 2 Stage 251 264 255 281 280 280
Claus 34 35 35 37 37 37
Other 26 27 26 28 28 28
Hydrogen Recovery 8 8 8 8 8 8
MDEA 92 91 92 90 90 90
Total 464 479 470 501 499 500
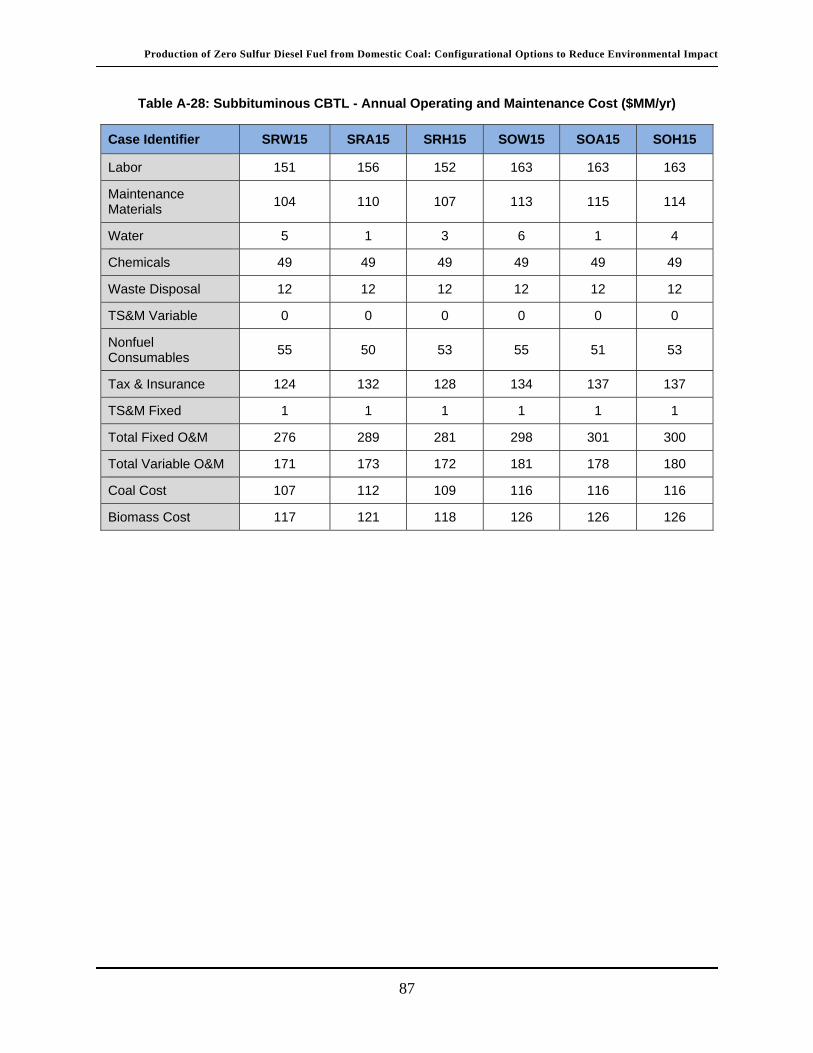
Production of Zero Sulfur Diesel Fuel from Domestic Coal: Configurational Options to Reduce Environmental Impact
87
Table A-28: Subbituminous CBTL - Annual Operating and Maintenance Cost ($MM/yr)
Case Identifier SRW15 SRA15 SRH15 SOW15 SOA15 SOH15
Labor 151 156 152 163 163 163
Maintenance Materials
104 110 107 113 115 114
Water 5 1 3 6 1 4
Chemicals 49 49 49 49 49 49
Waste Disposal 12 12 12 12 12 12
TS&M Variable 0 0 0 0 0 0
Nonfuel Consumables
55 50 53 55 51 53
Tax & Insurance 124 132 128 134 137 137
TS&M Fixed 1 1 1 1 1 1
Total Fixed O&M 276 289 281 298 301 300
Total Variable O&M 171 173 172 181 178 180
Coal Cost 107 112 109 116 116 116
Biomass Cost 117 121 118 126 126 126
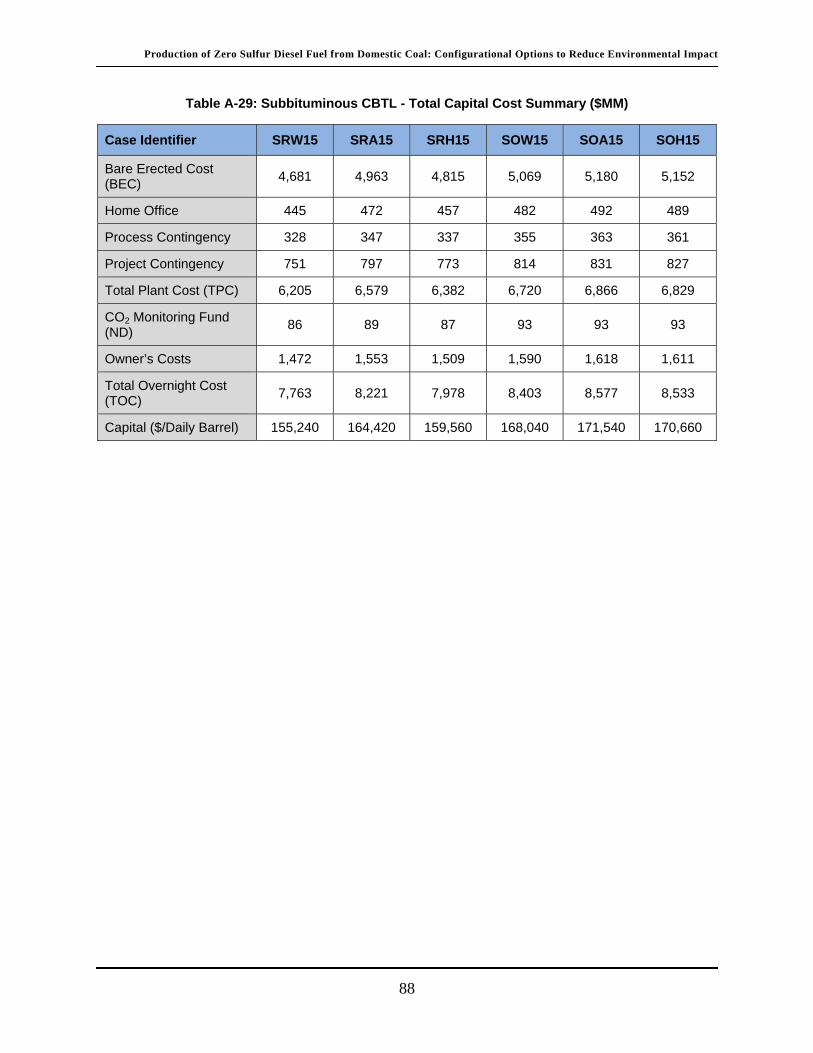
Production of Zero Sulfur Diesel Fuel from Domestic Coal: Configurational Options to Reduce Environmental Impact
88
Table A-29: Subbituminous CBTL - Total Capital Cost Summary ($MM)
Case Identifier SRW15 SRA15 SRH15 SOW15 SOA15 SOH15
Bare Erected Cost (BEC)
4,681 4,963 4,815 5,069 5,180 5,152
Home Office 445 472 457 482 492 489
Process Contingency 328 347 337 355 363 361
Project Contingency 751 797 773 814 831 827
Total Plant Cost (TPC) 6,205 6,579 6,382 6,720 6,866 6,829
CO2 Monitoring Fund (ND)
86 89 87 93 93 93
Owner’s Costs 1,472 1,553 1,509 1,590 1,618 1,611
Total Overnight Cost (TOC)
7,763 8,221 7,978 8,403 8,577 8,533
Capital ($/Daily Barrel) 155,240 164,420 159,560 168,040 171,540 170,660

Production of Zero Sulfur Diesel Fuel from Domestic Coal: Configurational Options to Reduce Environmental Impact
89
Table A-30: Subbituminous CBTL - Overall Economic Summary
Case Identifier SRW15 SRA15 SRH15 SOW15 SOA15 SOH15
Parameters
Capital Charge Factor 0.16953 0.16953 0.16953 0.16953 0.16953 0.16953
Coal Cost ($/ton AR) 12.17 12.17 12.17 12.17 12.17 12.17
Biomass Cost ($/ton Dry) 88 88 88 88 88 88
Components Of RSP ($MM/Annum)
Capital 1,316 1,394 1,353 1,424 1,454 1,447
Fixed Operating Cost 276 289 281 298 301 300
Variable Operating Cost 171 173 172 181 178 180
Coal Cost 107 112 109 116 116 116
Biomass Cost 117 121 118 126 126 126
Power Credit 0 0 0 106 84 99
Annual Revenue Required
1,987 2,088 2,033 2,038 2,091 2,070
Required Selling Price (RSP, $/bbl)
RSP ($/bbl FT diesel) 130.4 137.2 133.4 133.8 137.3 135.8
COE ($/bbl petroleum) 108.7 114.2 111.2 111.5 114.4 113.2

Production of Zero Sulfur Diesel Fuel from Domestic Coal: Configurational Options to Reduce Environmental Impact
90
Appendix B: LCA Methodologies Comparison
The LCA analysis results in the report that are used to calculate the petroleum ratios are estimated using the “displacement methodology”. In this method GHG credits are given for the co-produced electric power and for the FT naphtha produced. An alternative LCA approach is to use the “energy allocation methodology”. In this method the GHG emissions are allocated to each product based on the lower heating value of the product. Table B-1 shows the comparison of these two methods for calculating the petroleum ratio for the 16 configurations.
Using the energy allocation method, the PRs for coal-only cases are all very close to 1. In general, the recycle configurations are at or slightly below one while the once-through cases are all just above 1. This is opposite to the trend observed with the displacement method in which the PRs for once-through configurations were lower than for the corresponding recycle configuration.
For the coal and biomass cases, the PRs estimated using the energy allocation method are all significantly below 1, although they are uniformly higher than the PRs estimated using the displacement method.
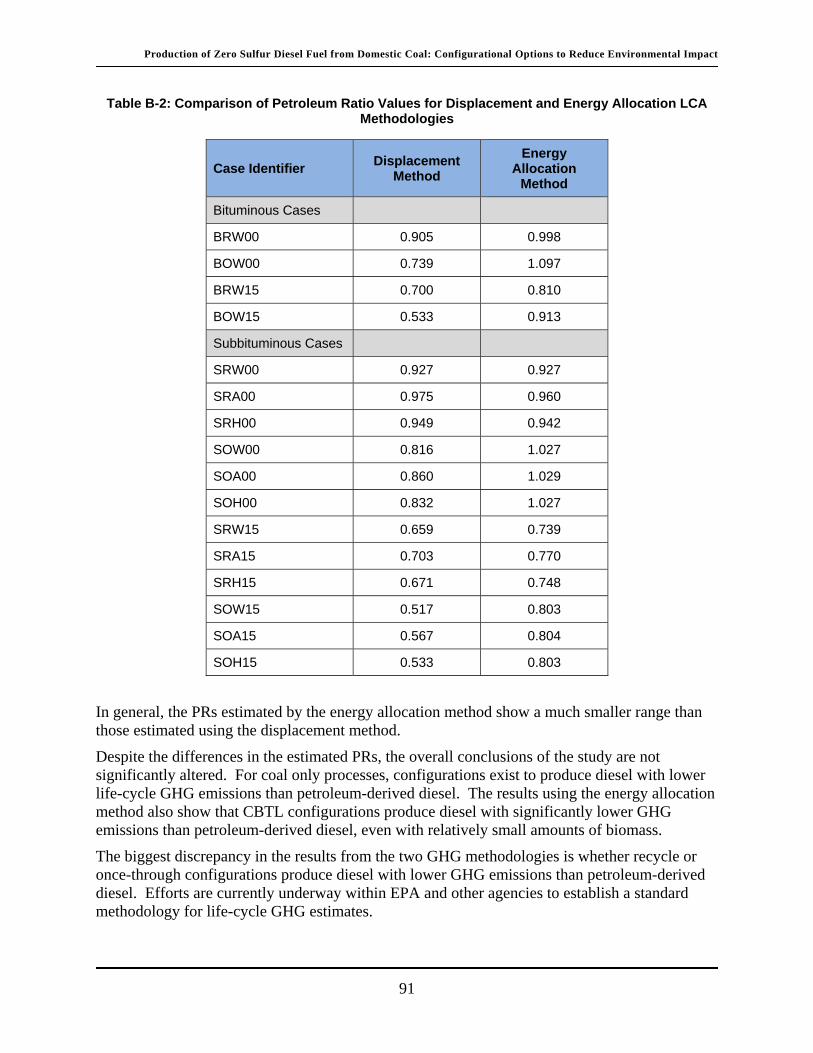
Production of Zero Sulfur Diesel Fuel from Domestic Coal: Configurational Options to Reduce Environmental Impact
91
Table B-2: Comparison of Petroleum Ratio Values for Displacement and Energy Allocation LCA Methodologies
Case Identifier Displacement
Method
Energy Allocation
Method
Bituminous Cases
BRW00 0.905 0.998
BOW00 0.739 1.097
BRW15 0.700 0.810
BOW15 0.533 0.913
Subbituminous Cases
SRW00 0.927 0.927
SRA00 0.975 0.960
SRH00 0.949 0.942
SOW00 0.816 1.027
SOA00 0.860 1.029
SOH00 0.832 1.027
SRW15 0.659 0.739
SRA15 0.703 0.770
SRH15 0.671 0.748
SOW15 0.517 0.803
SOA15 0.567 0.804
SOH15 0.533 0.803
In general, the PRs estimated by the energy allocation method show a much smaller range than those estimated using the displacement method.
Despite the differences in the estimated PRs, the overall conclusions of the study are not significantly altered. For coal only processes, configurations exist to produce diesel with lower life-cycle GHG emissions than petroleum-derived diesel. The results using the energy allocation method also show that CBTL configurations produce diesel with significantly lower GHG emissions than petroleum-derived diesel, even with relatively small amounts of biomass.
The biggest discrepancy in the results from the two GHG methodologies is whether recycle or once-through configurations produce diesel with lower GHG emissions than petroleum-derived diesel. Efforts are currently underway within EPA and other agencies to establish a standard methodology for life-cycle GHG estimates.