production outlook and economic forecast - smmt · production outlook and economic forecast ......
TRANSCRIPT
SOCIETY OF MOTOR MANUFACTURERS AND TRADERS LIMITED SMMT, the ‘S’ symbol and the ‘Driving the motor
industry’ brandline are trademarks of SMMT Ltd
Production Outlook and Economic Forecast
Yung Tran, Head of Member Services and Business Improvement, SMMT
Robert Baker, Chief Economist, SMMT
Ian Henry, Director, AutoAnalysis
14 February 2013

SOCIETY OF MOTOR MANUFACTURERS AND TRADERS LIMITED PAGE 2
• During presentations (10:30 – 11:00) everyone will be muted so that only
the presenters will be heard.
• The presentation will be followed by a Q&A session. Click on the hand
symbol to show that you have a question.
• If you are experiencing any technical problems please call 0207 344
1611 or 07793 773391
SOCIETY OF MOTOR MANUFACTURERS AND TRADERS LIMITED PAGE 3
Robert Baker
Chief Economist
SMMT
SOCIETY OF MOTOR MANUFACTURERS AND TRADERS LIMITED SMMT, the ‘S’ symbol and the ‘Driving the motor
industry’ brandline are trademarks of SMMT Ltd
It’s recovery, but not as expected and incomplete:
…UK still searching for a sustainable recovery by 2013
• Growth has slumped, remains weak, is disjointed and slow
• Inflation rate eased, but remains sticky, volatile and untamed
• Financial and restructuring strains constrict confidence
• Car markets stable in total variegated in the mix
SOCIETY OF MOTOR MANUFACTURERS AND TRADERS LIMITED SMMT, the ‘S’ symbol and the ‘Driving the motor
industry’ brandline are trademarks of SMMT Ltd
UK macroeconomic agenda for 2013:
- Domestic economic growth may reignite slowly;
- Risks of UK fiscal stance; EZ crisis and FX volatility
• Continued slow growth in consumer spending
• Sticky but lower inflation and resilient employment
• Financial and investment confidence still fickle & unsure
• FLS may be successful in easing credit flow and terms
SOCIETY OF MOTOR MANUFACTURERS AND TRADERS LIMITED PAGE 6
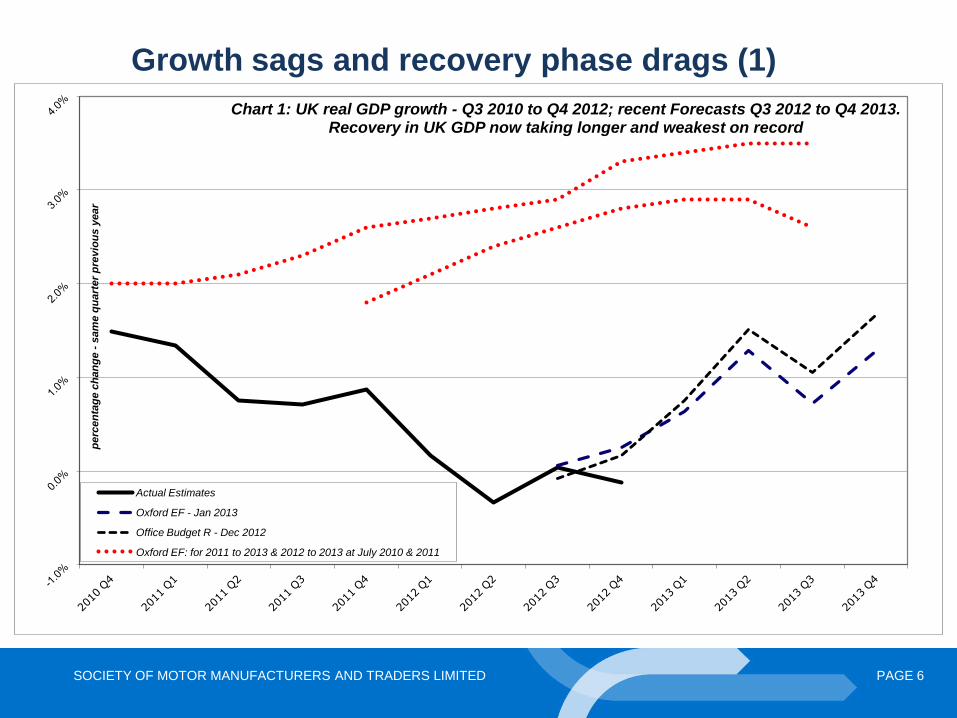
Growth sags and recovery phase drags (1)
pe
rcen
tag
e c
ha
ng
e -
sam
e q
ua
rter
pre
vio
us
year
Chart 1: UK real GDP growth - Q3 2010 to Q4 2012; recent Forecasts Q3 2012 to Q4 2013. Recovery in UK GDP now taking longer and weakest on record
Actual Estimates
Oxford EF - Jan 2013
Office Budget R - Dec 2012
Oxford EF: for 2011 to 2013 & 2012 to 2013 at July 2010 & 2011
SOCIETY OF MOTOR MANUFACTURERS AND TRADERS LIMITED PAGE 7
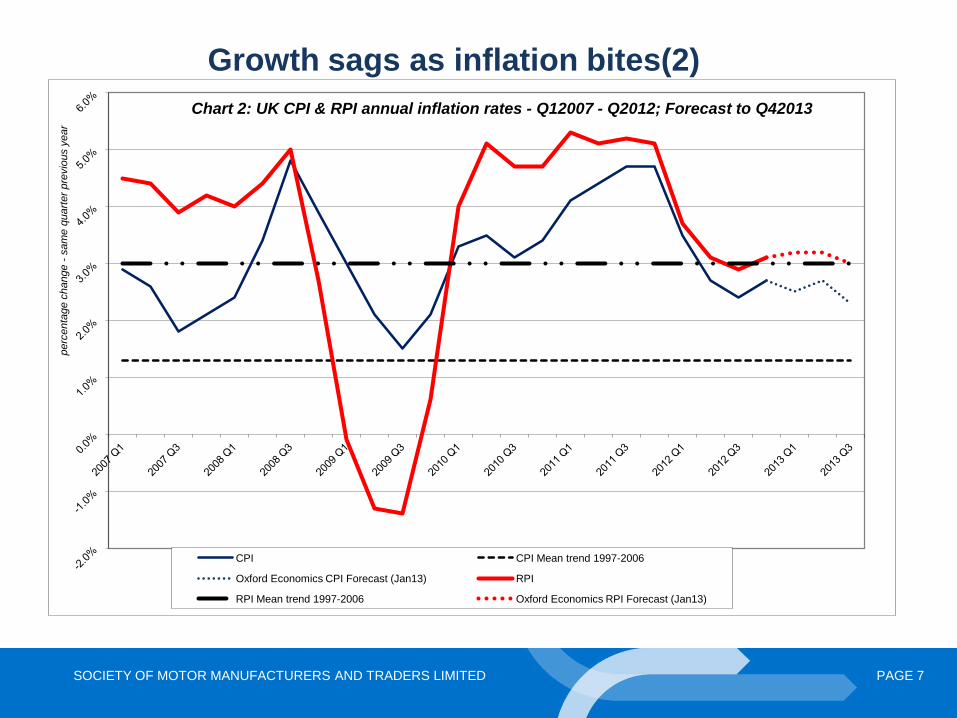
Growth sags as inflation bites(2)
perc
enta
ge c
hange -
sam
e q
uart
er
pre
vio
us y
ear
Chart 2: UK CPI & RPI annual inflation rates - Q12007 - Q2012; Forecast to Q42013
CPI CPI Mean trend 1997-2006
Oxford Economics CPI Forecast (Jan13) RPI
RPI Mean trend 1997-2006 Oxford Economics RPI Forecast (Jan13)
SOCIETY OF MOTOR MANUFACTURERS AND TRADERS LIMITED PAGE 8
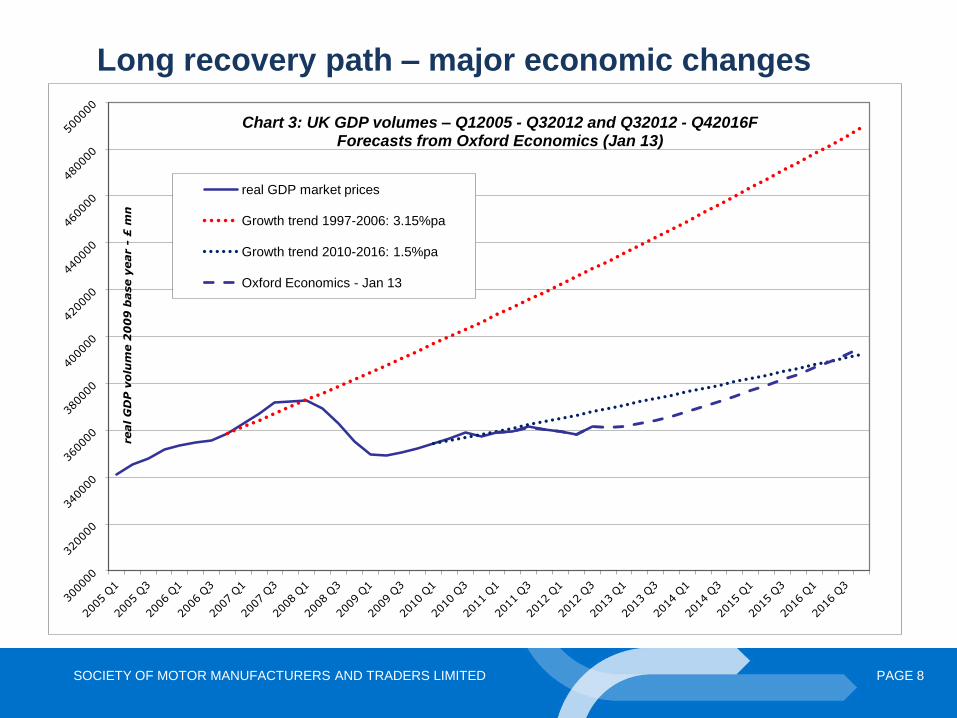
Long recovery path – major economic changes
real G
DP
vo
lum
e 2
00
9 b
ase y
ear -
£ m
n
Chart 3: UK GDP volumes – Q12005 - Q32012 and Q32012 - Q42016F Forecasts from Oxford Economics (Jan 13)
real GDP market prices
Growth trend 1997-2006: 3.15%pa
Growth trend 2010-2016: 1.5%pa
Oxford Economics - Jan 13
SOCIETY OF MOTOR MANUFACTURERS AND TRADERS LIMITED PAGE 9
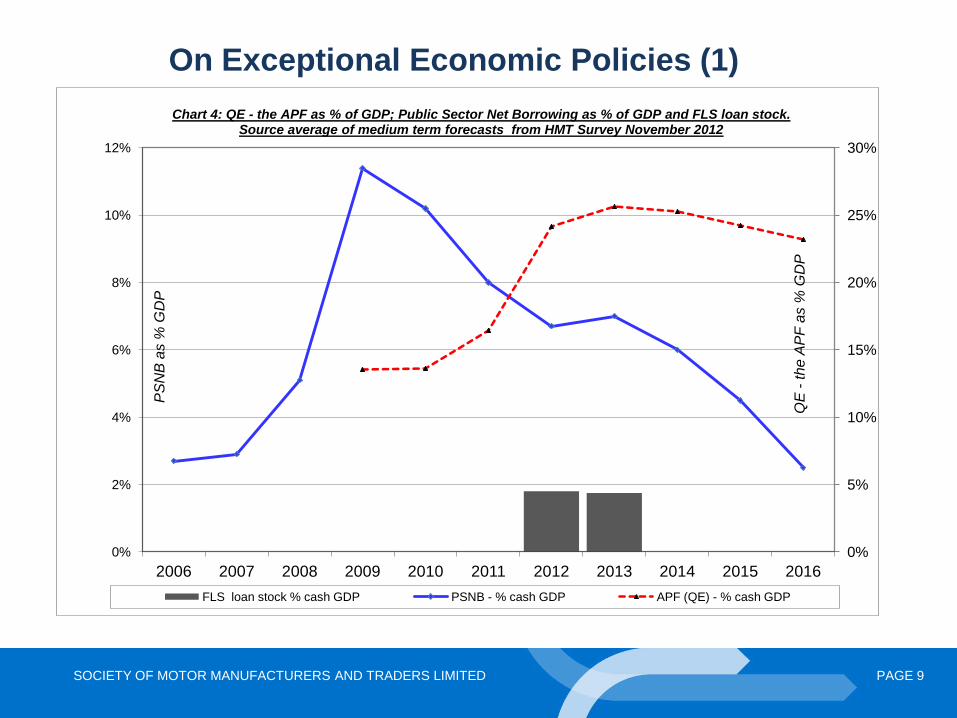
On Exceptional Economic Policies (1)
0%
5%
10%
15%
20%
25%
30%
0%
2%
4%
6%
8%
10%
12%
2006 2007 2008 2009 2010 2011 2012 2013 2014 2015 2016
QE
- the A
PF
as %
GD
P
PS
NB
as %
GD
P
Chart 4: QE - the APF as % of GDP; Public Sector Net Borrowing as % of GDP and FLS loan stock. Source average of medium term forecasts from HMT Survey November 2012
FLS loan stock % cash GDP PSNB - % cash GDP APF (QE) - % cash GDP
SOCIETY OF MOTOR MANUFACTURERS AND TRADERS LIMITED PAGE 10
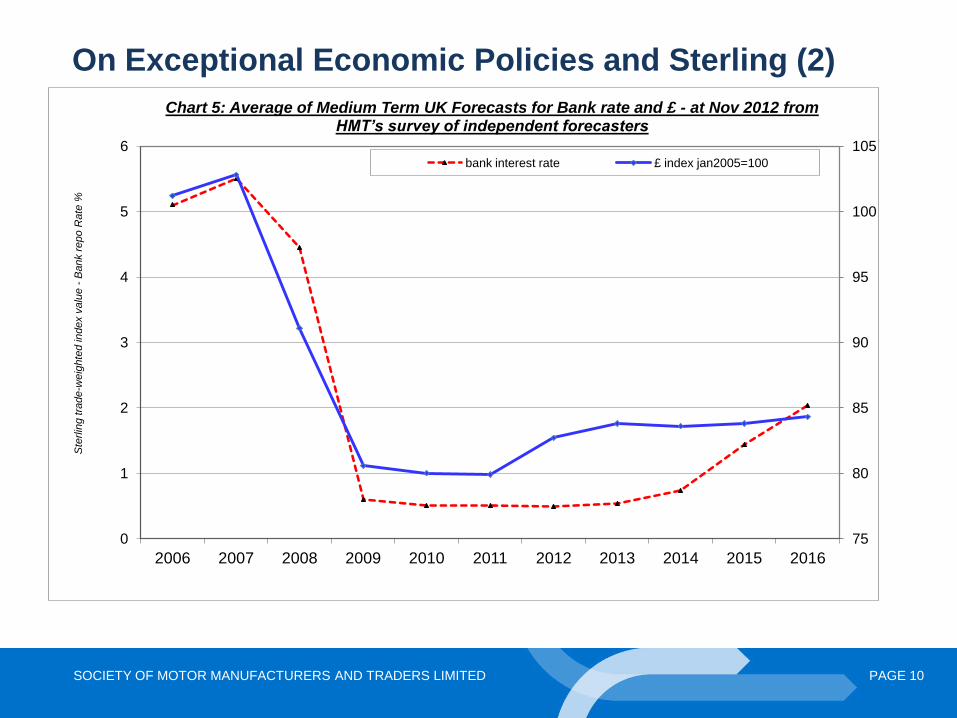
On Exceptional Economic Policies and Sterling (2)
75
80
85
90
95
100
105
0
1
2
3
4
5
6
2006 2007 2008 2009 2010 2011 2012 2013 2014 2015 2016
Ste
rlin
g tra
de
-weig
hte
d in
dex v
alu
e -
Bank r
epo R
ate
%
Chart 5: Average of Medium Term UK Forecasts for Bank rate and £ - at Nov 2012 from HMT’s survey of independent forecasters
bank interest rate £ index jan2005=100
SOCIETY OF MOTOR MANUFACTURERS AND TRADERS LIMITED PAGE 11
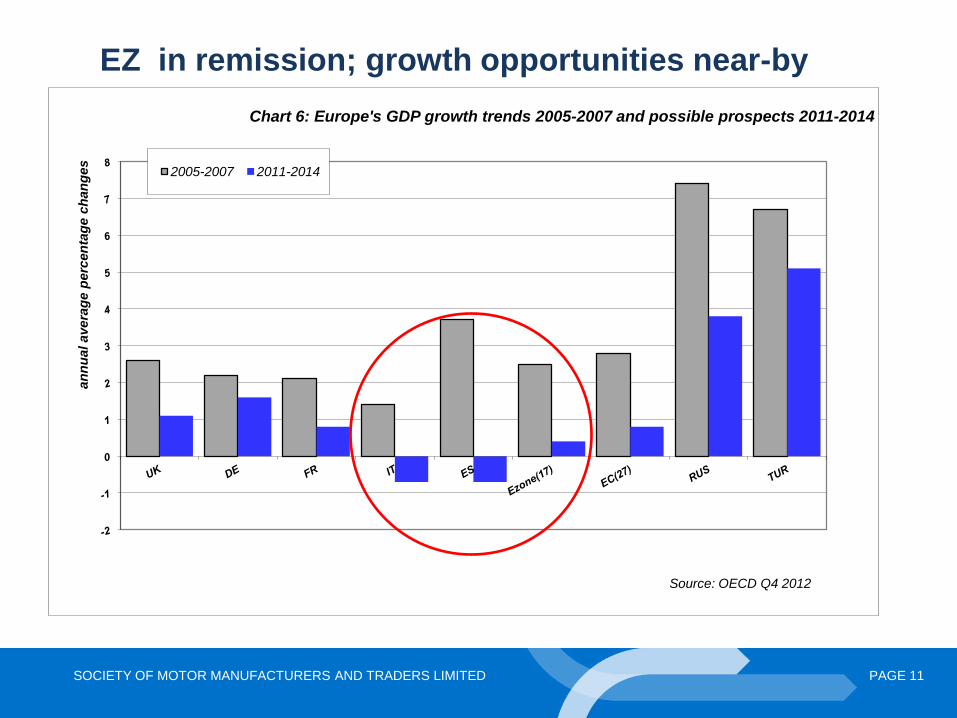
EZ in remission; growth opportunities near-by
an
nu
al avera
ge p
erc
en
tag
e c
han
ges
Chart 6: Europe's GDP growth trends 2005-2007 and possible prospects 2011-2014
2005-2007 2011-2014
Source: OECD Q4 2012
SOCIETY OF MOTOR MANUFACTURERS AND TRADERS LIMITED PAGE 12
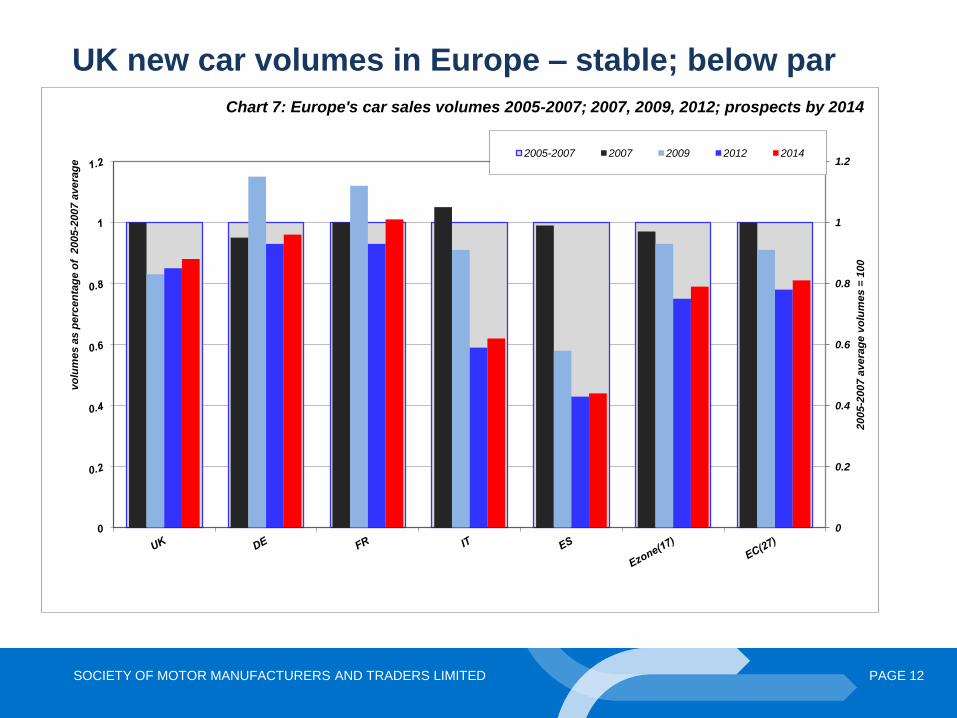
UK new car volumes in Europe – stable; below par
0
0.2
0.4
0.6
0.8
1
1.2
2005-2
007 a
vera
ge
vo
lum
es =
100
vo
lum
es a
s p
erc
en
tag
e o
f 2
005
-2007 a
vera
ge
Chart 7: Europe's car sales volumes 2005-2007; 2007, 2009, 2012; prospects by 2014
2005-2007 2007 2009 2012 2014
SOCIETY OF MOTOR MANUFACTURERS AND TRADERS LIMITED PAGE 13
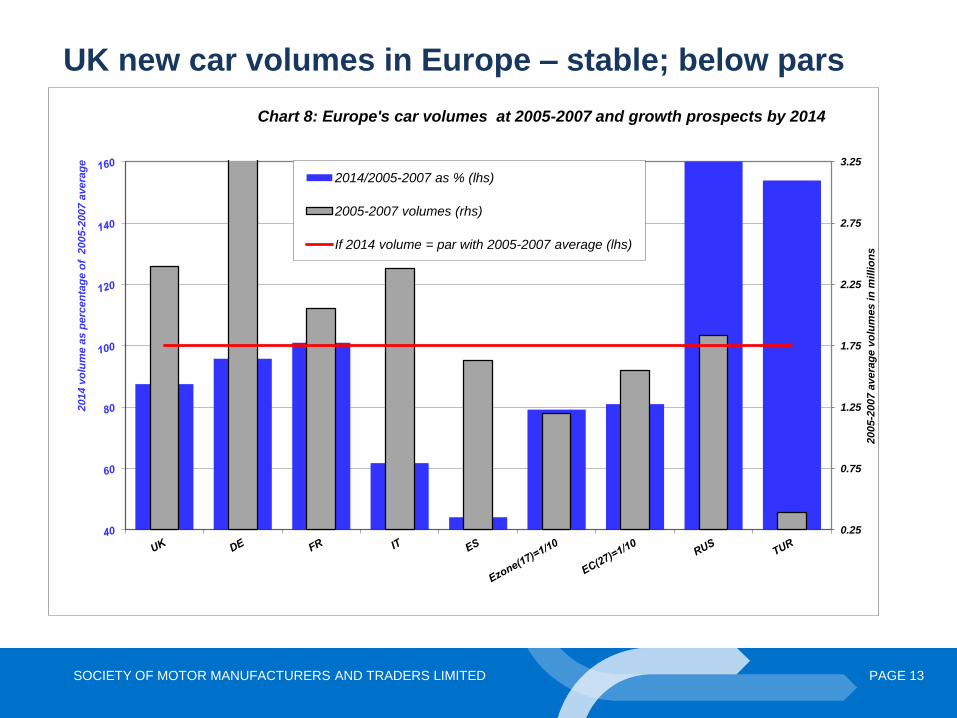
UK new car volumes in Europe – stable; below pars
0.25
0.75
1.25
1.75
2.25
2.75
3.25
2005-2
007 a
vera
ge
vo
lum
es in
millio
ns
2014 v
olu
me a
s p
erc
en
tag
e o
f 2
005
-2007 a
vera
ge
Chart 8: Europe's car volumes at 2005-2007 and growth prospects by 2014
2014/2005-2007 as % (lhs)
2005-2007 volumes (rhs)
If 2014 volume = par with 2005-2007 average (lhs)

SOCIETY OF MOTOR MANUFACTURERS AND TRADERS LIMITED PAGE 14
UK’s unique revival in private car demand?
• A timely (low) point on recovery’s route for many habitual new car buyer types and confidence raised
• Postponed buying meant heightened needs to buy new
• Ability to buy as jobs stable, cash & collateral rich; PPI miss-selling payments windfalls (£9.5bn); housing in doldrums
• Willing to replace from earlier buying vintages
• OEMs ready to respond – dire EZ! £/€ attractive Packaged marketing & asset-backed car finance must have helped too
SOCIETY OF MOTOR MANUFACTURERS AND TRADERS LIMITED PAGE 15
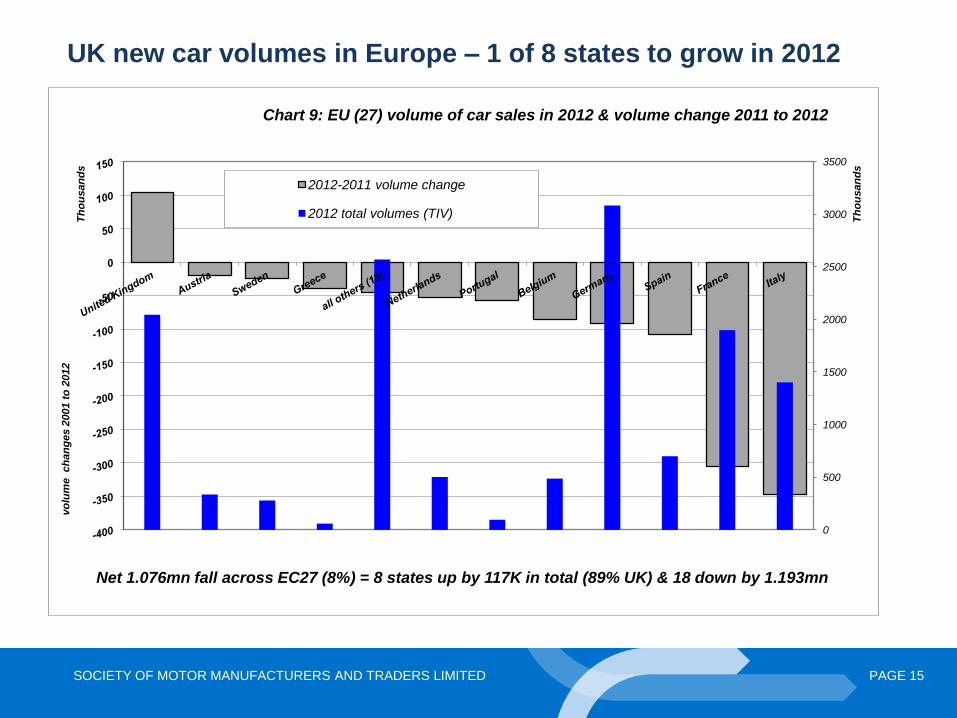
UK new car volumes in Europe – 1 of 8 states to grow in 2012
0
500
1000
1500
2000
2500
3000
3500
Th
ou
san
ds
vo
lum
e ch
an
ges 2
001 t
o 2
012
Th
ou
san
ds
Chart 9: EU (27) volume of car sales in 2012 & volume change 2011 to 2012
2012-2011 volume change
2012 total volumes (TIV)
Net 1.076mn fall across EC27 (8%) = 8 states up by 117K in total (89% UK) & 18 down by 1.193mn
SOCIETY OF MOTOR MANUFACTURERS AND TRADERS LIMITED PAGE 16
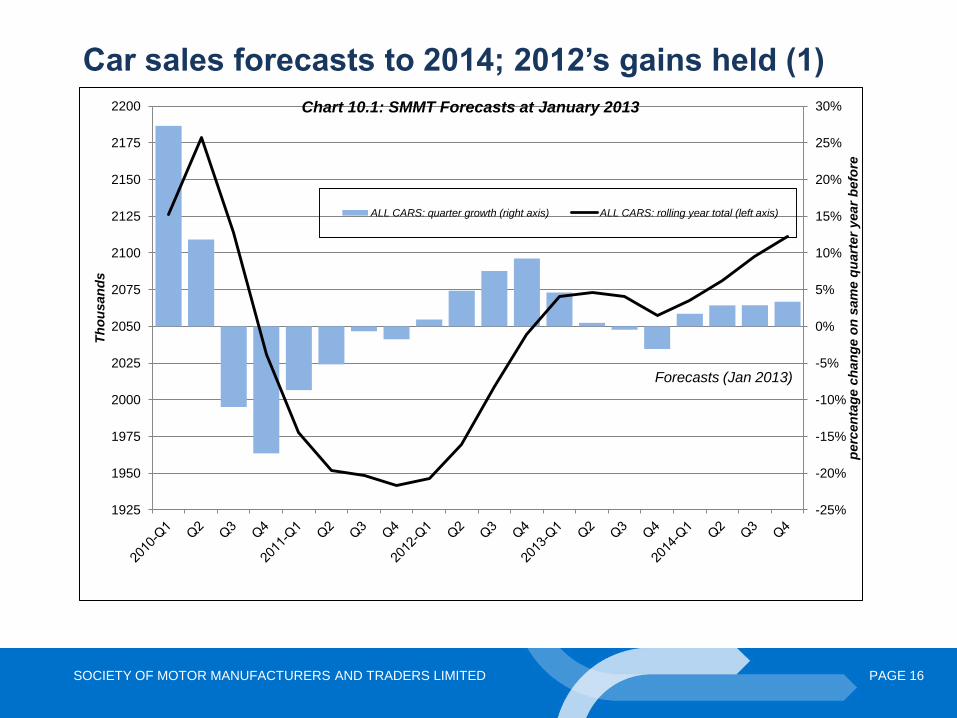
Car sales forecasts to 2014; 2012’s gains held (1)
-25%
-20%
-15%
-10%
-5%
0%
5%
10%
15%
20%
25%
30%
1925
1950
1975
2000
2025
2050
2075
2100
2125
2150
2175
2200
perc
en
tag
e c
han
ge o
n s
am
e q
uart
er
year
befo
re
Th
ou
san
ds
Chart 10.1: SMMT Forecasts at January 2013
ALL CARS: quarter growth (right axis) ALL CARS: rolling year total (left axis)
Forecasts (Jan 2013)

SOCIETY OF MOTOR MANUFACTURERS AND TRADERS LIMITED PAGE 17
Private cars forecasts to 2014; 2012’s gains held (2)
-40%
-30%
-20%
-10%
0%
10%
20%
30%
40%
750
800
850
900
950
1000
1050
1100
1150
perc
en
tag
e c
han
ge o
n s
am
e q
uart
er
year
befo
re
Th
ou
san
ds
Chart 10.2: SMMT forecasts at January 2013
PRIVATE: quarter growth (right axis)
PRIVATE: rolling year total (left axis)
Forecasts (Jan 2013)
SOCIETY OF MOTOR MANUFACTURERS AND TRADERS LIMITED PAGE 18
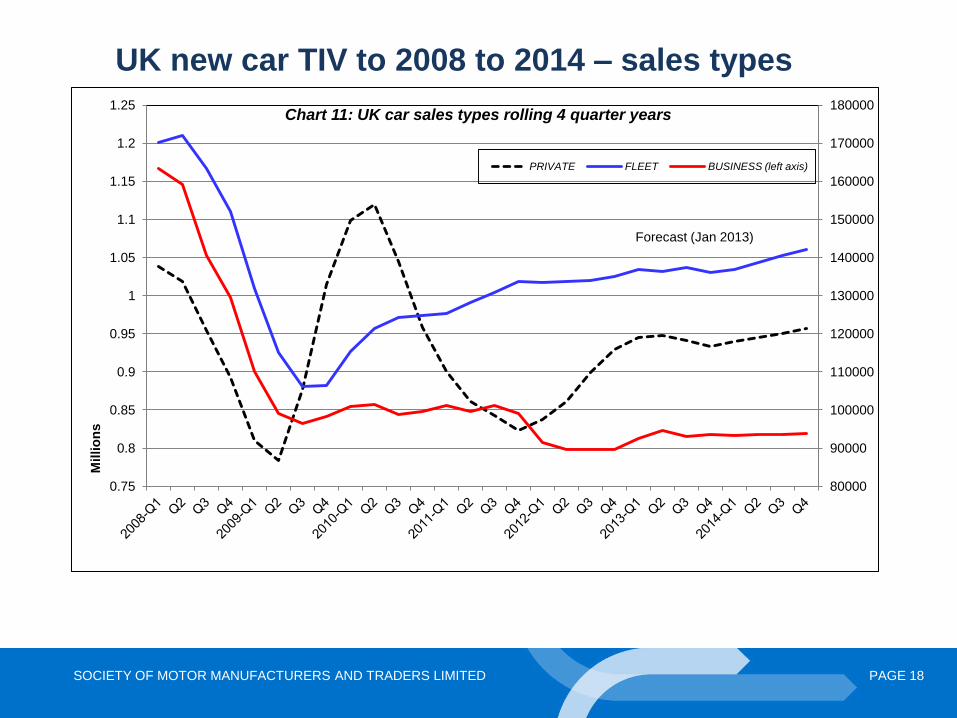
UK new car TIV to 2008 to 2014 – sales types
80000
90000
100000
110000
120000
130000
140000
150000
160000
170000
180000
0.75
0.8
0.85
0.9
0.95
1
1.05
1.1
1.15
1.2
1.25 M
illio
ns
Chart 11: UK car sales types rolling 4 quarter years
PRIVATE FLEET BUSINESS (left axis)
Forecast (Jan 2013)
SOCIETY OF MOTOR MANUFACTURERS AND TRADERS LIMITED PAGE 19
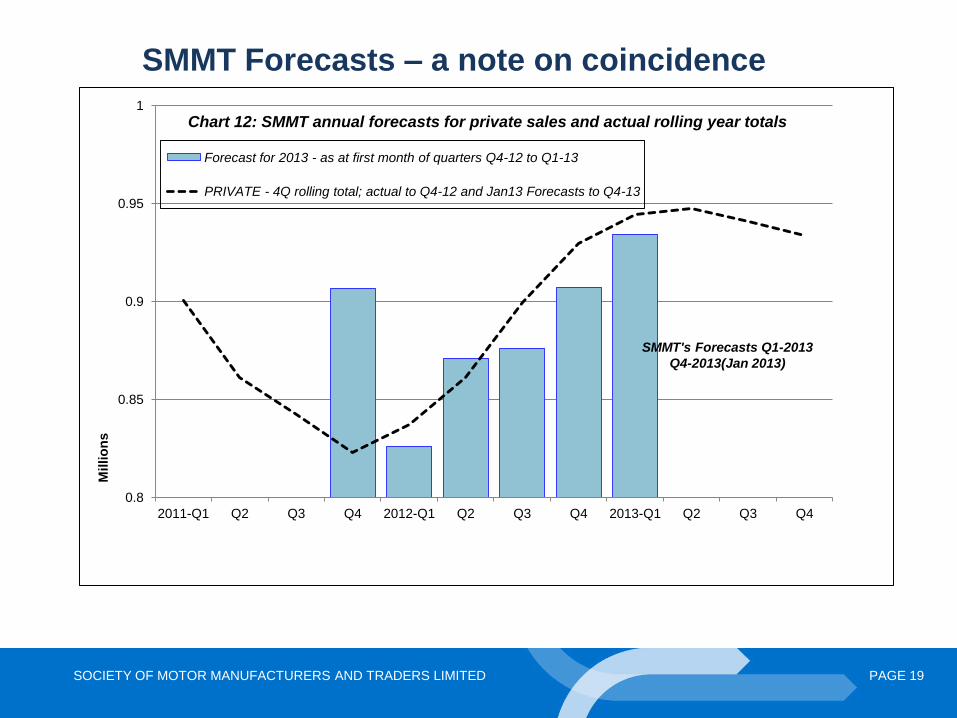
SMMT Forecasts – a note on coincidence
0.8
0.85
0.9
0.95
1
2011-Q1 Q2 Q3 Q4 2012-Q1 Q2 Q3 Q4 2013-Q1 Q2 Q3 Q4
Millio
ns
Chart 12: SMMT annual forecasts for private sales and actual rolling year totals
Forecast for 2013 - as at first month of quarters Q4-12 to Q1-13
PRIVATE - 4Q rolling total; actual to Q4-12 and Jan13 Forecasts to Q4-13
SMMT's Forecasts Q1-2013
Q4-2013(Jan 2013)
SOCIETY OF MOTOR MANUFACTURERS AND TRADERS LIMITED PAGE 20
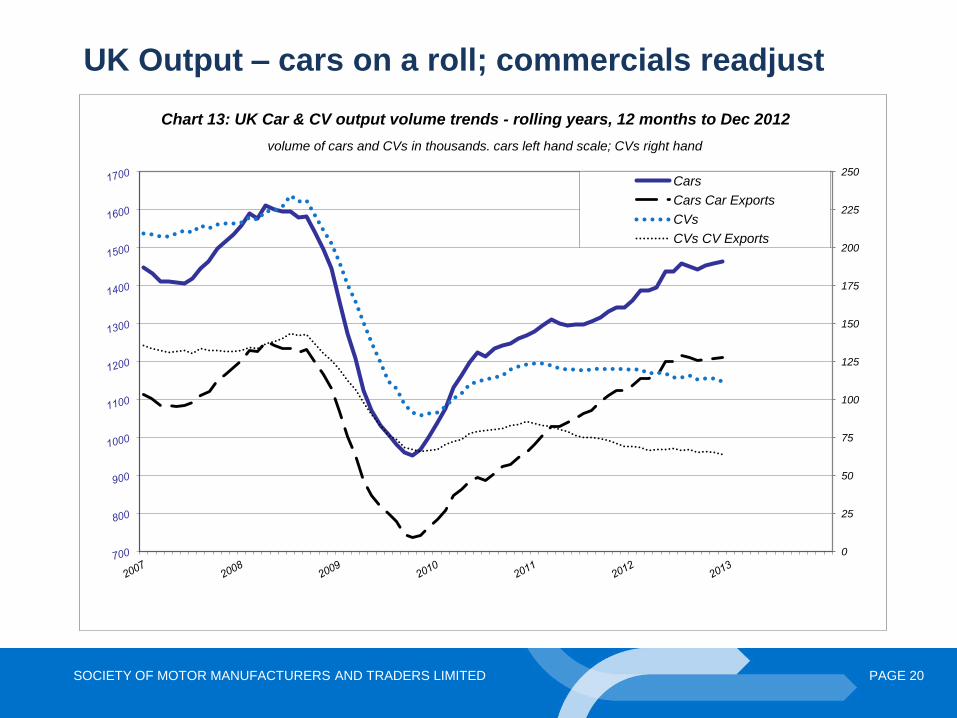
UK Output – cars on a roll; commercials readjust
0
25
50
75
100
125
150
175
200
225
250
Chart 13: UK Car & CV output volume trends - rolling years, 12 months to Dec 2012
Cars
Cars Car Exports
CVs
CVs CV Exports
volume of cars and CVs in thousands. cars left hand scale; CVs right hand
SOCIETY OF MOTOR MANUFACTURERS AND TRADERS LIMITED PAGE 21
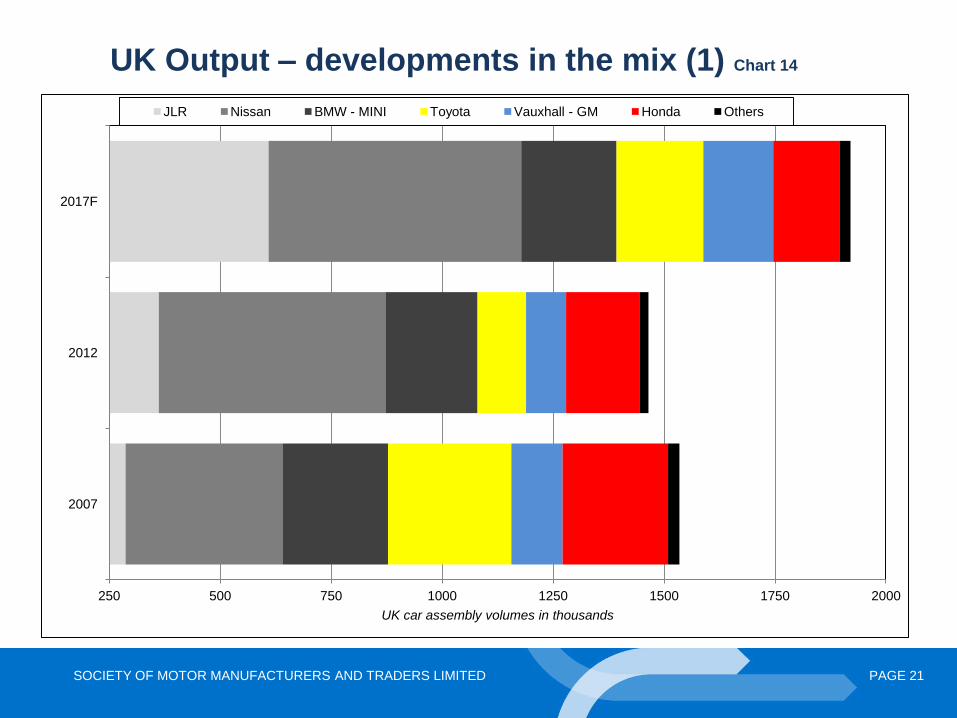
UK Output – developments in the mix (1) Chart 14
250 500 750 1000 1250 1500 1750 2000
2007
2012
2017F
UK car assembly volumes in thousands
JLR Nissan BMW - MINI Toyota Vauxhall - GM Honda Others
SOCIETY OF MOTOR MANUFACTURERS AND TRADERS LIMITED PAGE 22
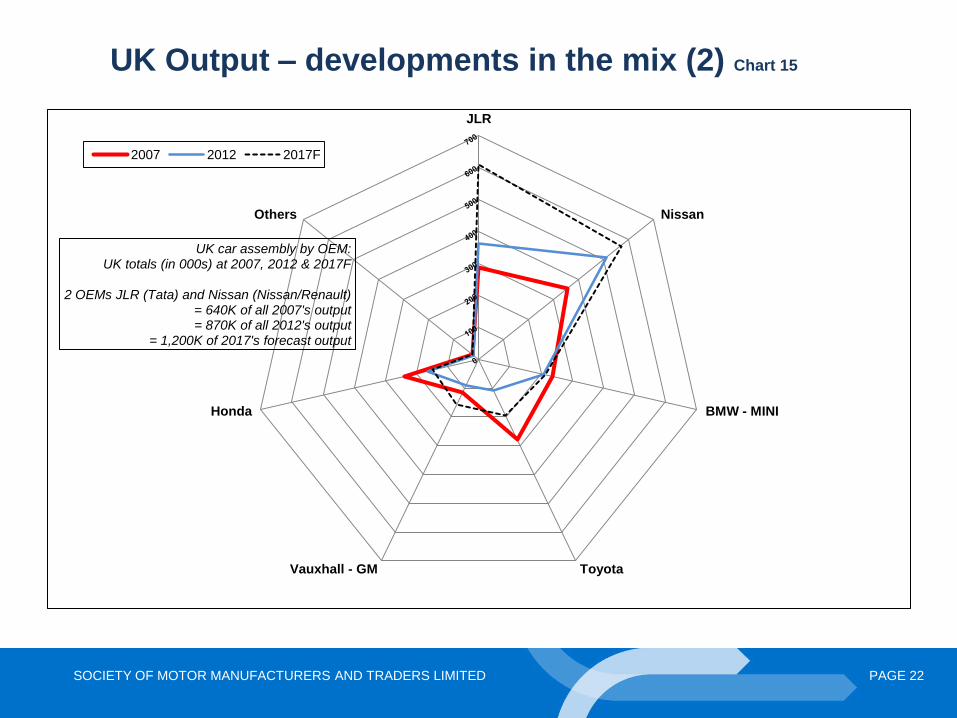
UK Output – developments in the mix (2) Chart 15
JLR
Nissan
BMW - MINI
Toyota Vauxhall - GM
Honda
Others
UK car assembly by OEM: UK totals (in 000s) at 2007, 2012 & 2017F
2 OEMs JLR (Tata) and Nissan (Nissan/Renault)
= 640K of all 2007's output = 870K of all 2012's output
= 1,200K of 2017's forecast output
2007 2012 2017F
SOCIETY OF MOTOR MANUFACTURERS AND TRADERS LIMITED PAGE 23
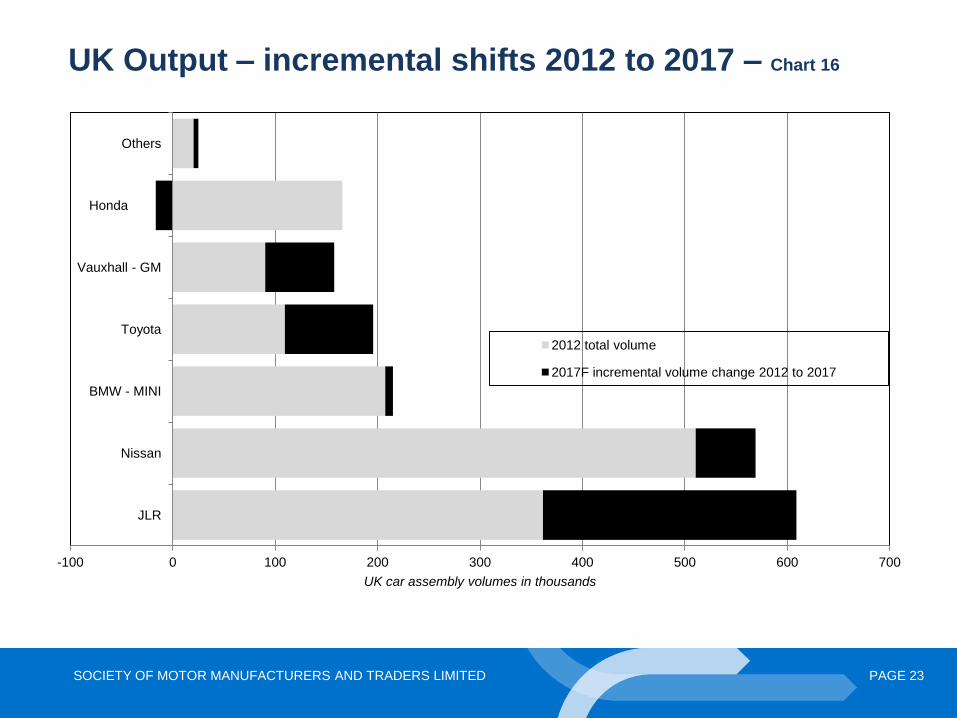
UK Output – incremental shifts 2012 to 2017 – Chart 16
-100 0 100 200 300 400 500 600 700
JLR
Nissan
BMW - MINI
Toyota
Vauxhall - GM
Honda
Others
UK car assembly volumes in thousands
2012 total volume
2017F incremental volume change 2012 to 2017
SOCIETY OF MOTOR MANUFACTURERS AND TRADERS LIMITED PAGE 24
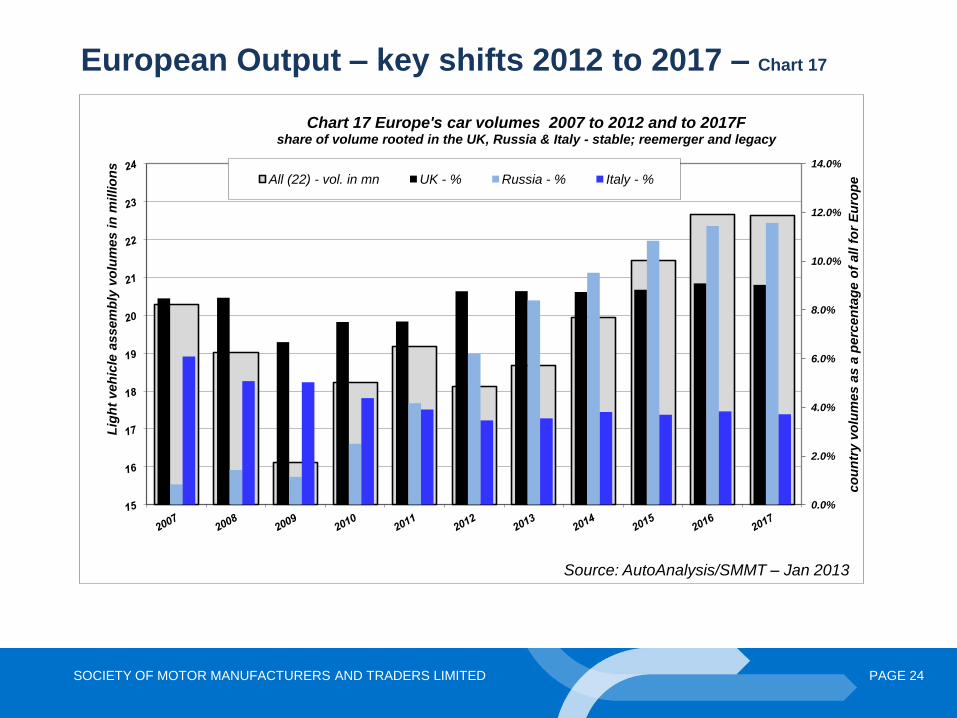
European Output – key shifts 2012 to 2017 – Chart 17
0.0%
2.0%
4.0%
6.0%
8.0%
10.0%
12.0%
14.0%
co
un
try v
olu
mes a
s a
perc
en
tag
e o
f all f
or
Eu
rop
e
Lig
ht
veh
icle
assem
bly
vo
lum
es i
n m
illio
ns
Chart 17 Europe's car volumes 2007 to 2012 and to 2017F
share of volume rooted in the UK, Russia & Italy - stable; reemerger and legacy
All (22) - vol. in mn UK - % Russia - % Italy - %
Source: AutoAnalysis/SMMT – Jan 2013
SOCIETY OF MOTOR MANUFACTURERS AND TRADERS LIMITED PAGE 25
In conclusion, on the UK economy and cars
Recovered; stable; firmer growth later not sooner
• Less restrictive outlook for immediate household spending
• External threats to trade, credit and confidence remain also
domestic concerns on austerity & unique monetary policy
• Domestic growth potential & opportunities yet to be realised
• Car TIV and assembly stable, but big shifts in the mix
• Economy adjusting to major restructuring, rebalancing and
reorientation agenda – unsure and unsteady growth likely

SOCIETY OF MOTOR MANUFACTURERS AND TRADERS LIMITED PAGE 26
Ian Henry
Director
AutoAnalysis
SOCIETY OF MOTOR MANUFACTURERS AND TRADERS LIMITED PAGE 27
Production Outlook – 2012 key facts
– Provisional 2012 European production inc. Russia = 18.1mn, >1mn down on 2011:
– W/out Russia = 17mn, down >1.4mn
– Production collapse prevented by modest growth in Czech Rep., Hungary, Romania & UK – and boost in Slovakia from VW Up!
– Big 2012 losers = Spain (c460k), Italy (c120k), France (c340k) and even Germany (c540k)
– Larger than expected fall in Germany due to wholesale decline at Ford & Opel and model cycle effects at Mercedes & especially Audi (A4/A6/Q5) and switch to new Golf

SOCIETY OF MOTOR MANUFACTURERS AND TRADERS LIMITED PAGE 28
Production Outlook – recovery highlights
– Germany will recover: by 2017 should be back at 2007 peak
– France, Italy & Spain = long-term losers, in 2017:
– France should be c30%/900k down on 2007
– Italy down one-third/400k and Spain c20%/600k on 2007
– Eastwards shift continues 2012-2017:
– Czech +c20%; Hungary + c140%
– Romania +c40%; Slovakia +c10% or quite possibly more
– UK production still growing, by as much as c25% 2012-2017 if Mini, JLR and Nissan fulfil expectations, reaching c2mn upa:
– Mini parts production boosted by Mini production in Netherlands
SOCIETY OF MOTOR MANUFACTURERS AND TRADERS LIMITED PAGE 29
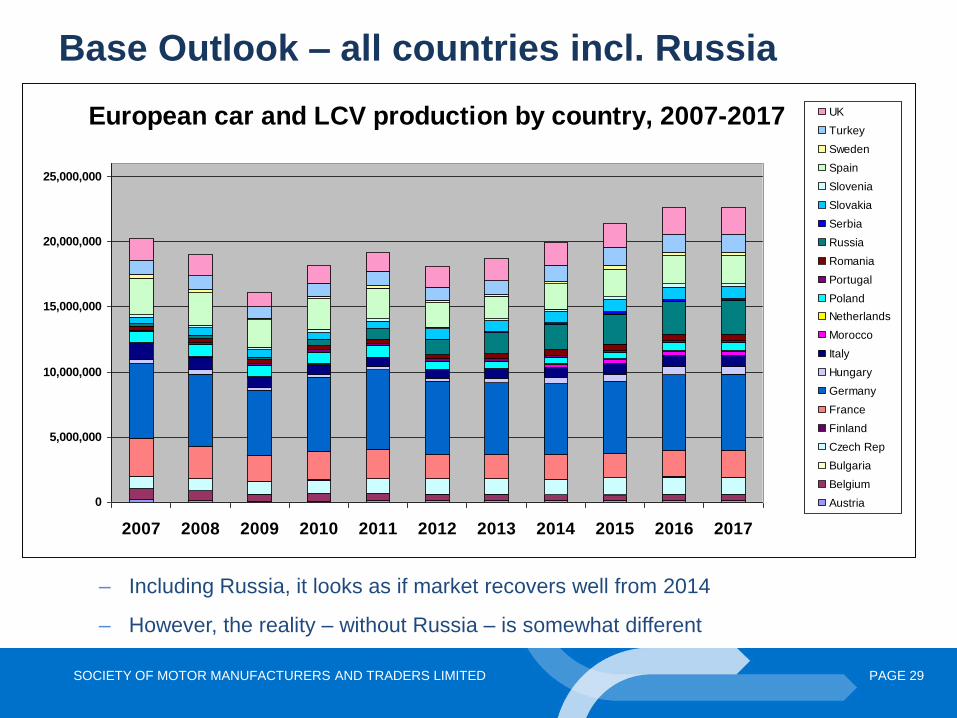
Base Outlook – all countries incl. Russia
– Including Russia, it looks as if market recovers well from 2014
– However, the reality – without Russia – is somewhat different
European car and LCV production by country, 2007-2017
0
5,000,000
10,000,000
15,000,000
20,000,000
25,000,000
2007 2008 2009 2010 2011 2012 2013 2014 2015 2016 2017
UK
Turkey
Sweden
Spain
Slovenia
Slovakia
Serbia
Russia
Romania
Portugal
Poland
Netherlands
Morocco
Italy
Hungary
Germany
France
Finland
Czech Rep
Bulgaria
Belgium
Austria

SOCIETY OF MOTOR MANUFACTURERS AND TRADERS LIMITED PAGE 30
Without Russia, the picture is less attractive
– Without Russia, and being optimistic, Europe takes until 2016 to recover to 2007 volumes
– Scenarios 1-3 assume fall of 1-5% in major markets above and beyond the falls inherent in our Base Outlook
European Production Excl Russia - Base Outlook & 3 alternative
scenarios
15,000,000
16,000,000
17,000,000
18,000,000
19,000,000
20,000,000
21,000,000
22,000,000
2007 2008 2009 2010 2011 2012 2013 2014 2015 2016 2017
Years
Un
its Base w/o Russia
Scen 1 w/o Russia
Scen 2 w/o Russia
Scen 3 w/o Russia
SOCIETY OF MOTOR MANUFACTURERS AND TRADERS LIMITED PAGE 31
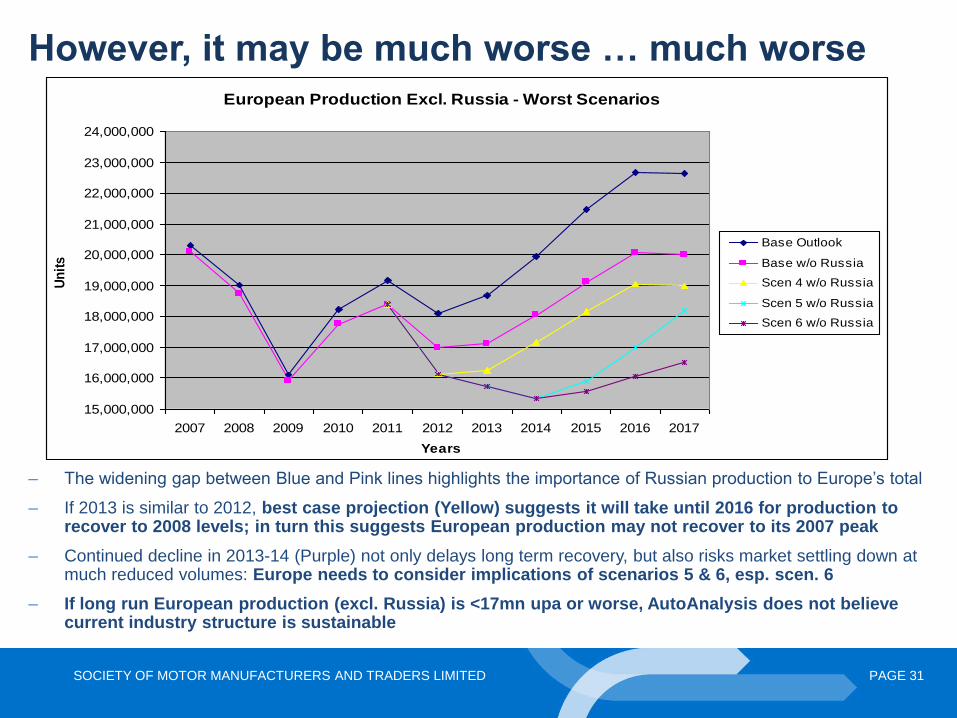
However, it may be much worse … much worse
– The widening gap between Blue and Pink lines highlights the importance of Russian production to Europe’s total
– If 2013 is similar to 2012, best case projection (Yellow) suggests it will take until 2016 for production to recover to 2008 levels; in turn this suggests European production may not recover to its 2007 peak
– Continued decline in 2013-14 (Purple) not only delays long term recovery, but also risks market settling down at much reduced volumes: Europe needs to consider implications of scenarios 5 & 6, esp. scen. 6
– If long run European production (excl. Russia) is <17mn upa or worse, AutoAnalysis does not believe current industry structure is sustainable
European Production Excl. Russia - Worst Scenarios
15,000,000
16,000,000
17,000,000
18,000,000
19,000,000
20,000,000
21,000,000
22,000,000
23,000,000
24,000,000
2007 2008 2009 2010 2011 2012 2013 2014 2015 2016 2017
Years
Un
its
Base Outlook
Base w/o Russia
Scen 4 w/o Russia
Scen 5 w/o Russia
Scen 6 w/o Russia
SOCIETY OF MOTOR MANUFACTURERS AND TRADERS LIMITED PAGE 32
Falling sales leading to falling production volumes
and structural change at the volume VMs …
– European car & LCV markets fell in 2012: EU27 at 17-year low
– January 2013 sales shows no sign of improvement, except UK which continued to rise:
– SAAR @ lowest rate since 1987 …
– 01/13 y-o-y falls:
– W Eur: -9.5%; Germany: -8.6%
– France: -15%; Italy: -12.6%; Spain: -9%
– Volume VMs’ European production falling significantly
– Traditional brands facing long-run, structural decline as value brands and premium marques continue to grow:
– New order for VMs in Europe beginning to emerge …
– VMs attempting new strategies: Fiat wants to move core brand upmarket, possibly adding value brand
– Nissan and VW also considering value brands
SOCIETY OF MOTOR MANUFACTURERS AND TRADERS LIMITED PAGE 33
Structural change under way at the volume VMs …
– Restructuring began in earnest in 2012:
– Ford, GM & PSA closing plants; GM and PSA bringing forward closure of Bochum and Aulnay
– GM & PSA established a defensive alliance, but benefits not yet apparent …
– Fiat reorganising model allocation between Italian factories, slimming down, but not closing plants:
– Investing €1bn at Melfi for new Fiat and Jeep small SUVs, to be made at 1600/day on a 3-shift basis
– Cutting at least 1,500 jobs in Poland, with 2013 production likely to be ½ that in 2009
– Renault following Fiat approach, for now:
– Claims that union deals (c7,500 job cuts) will lead to additional 180k upa in France, including 80k from “partners”
– Nissan however has confirmed expansion in Barcelona not France
– Highly likely that Fiat & Renault will have to cut capacity
SOCIETY OF MOTOR MANUFACTURERS AND TRADERS LIMITED PAGE 34
Although things have changed, are recent actions enough?
• VMs no longer just talking about restructuring – they have had to act: – GM and Ford each lost >€1bn in Europe in 2012; similar or greater losses
expected in 2013
– PSA, Renault and Fiat also loss-making in Europe … PSA reportedly losing €7mn/day – unions expressed fears over potential bankruptcy
• Will closures announced so far be enough? – Can Fiat and Renault avoid closing factories for much longer?
– Will Ford, GM and PSA close more plants?
• Despite strength of German & UK premium brands, Hyundai-Kia and Nissan, we doubt whether non-EU exports can sustain European production in perpetuity, especially at the volume brands:
– VW group, Fiat, PSA, BMW and Mercedes all growing plants outside Europe, esp. in NAFTA, Brazil & China
– VW also cutting Passat production in Germany, but adding shifts to cope with demand for Golf and Tiguan; and adding Golf production in Mexico
SOCIETY OF MOTOR MANUFACTURERS AND TRADERS LIMITED PAGE 35
In conclusion …
• Production recovery unlikely before 2014, quite possibly 2015:
– Production revival will be shallower and slower than in 2009 …
• Increasingly likely that long run production volumes will be far below 2007-2008 peaks
• Further re-structuring and capacity cutbacks seem inevitable: – Realistic chance of a major European name disappearing by the
end of the decade, if not before – Rising strength of Koreans & Nissan and enduring appeal of
German/UK premium brands should not be underestimated – More value brands likely to appear
• Not a question of if/when European VMs will restructure further: – Key issue remains: how much more change will be required? – National governments unlikely to be able to save national brands

PAGE 36 SOCIETY OF MOTOR MANUFACTURERS AND TRADERS LIMITED
Questions and Answers
Please click on the hand symbol to raise your hand if you have a question.
Please ensure that you are connected to the audio to ask a question.
Email: [email protected] with your questions after this session.
Slides emailed to participants after this session
Alternatively, you can type your question.