productions and operations management...
TRANSCRIPT

managementMEDIAHEALTH
lawD
ESIGN
EDU
CAT
ION
MU
SICagriculture
LA
NG
UA
GEM E C H A N I C S
psychology
BIOTECHNOLOGY
GEOGRAPHY
ARTPHYSICS
history
ECOLOGY
CHEMISTRY
math
ematicsENGINEERING
Productions Management

Subject: PRODUCTION MANAGEMENT Credits: 4
SYLLABUS
Operations and Productivity
Operations Functions and Evolution of POM; Framework for Managing Operations; Operations Strategy;
Trends in Operations Management
Product and Process Design
Product Development; Product Design Tools; Design of Services; Flexible Manufacturing; Systems; Process
Design: Types of Process, Modern Production Technologies; Process Reengineering
Capacity Design
Capacity Management; Economies and Diseconomies of Scale and Learning Curve; Capacity Strategies;
Decision Trees
Facility Location
Location Strategy and its Importance; Factors influencing Plant Location; Globalization; Location Selection
Models
Layout Design
Layout Planning; Layout Types; Design of Product and Process Layouts; Job Design; Work Measurement
Inventory Management
Basic Economic Order Quantity (EOQ) Model; Quantity Discount Models; Spare Parts Inventory; Material
Resources Planning; Manufacturing Resource Planning; Purchasing Objectives
Operations Planning and Scheduling Systems
Aggregate Planning and its Process; Master Scheduling; Aggregate Planning for Service Organizations;
Operating Schedules; Sequencing Rules; Optimized Production Technology and Synchronous Manufacturing;
Just in Time (JIT) Manufacturing System; Basics of SCM and ERP
Suggested Readings:
1. Production and Operations Management by Everette E. Adam, Jr. Ronald J. Ebert; Publisher: Prentice
Hall of India
2. Production and Operations Management by N.G. Nair; Publisher: Tata Mc. Graw Hill
3. Production and Operations Management by Panneerselvam R; Publisher: Prentice Hall of India
4. Operations Management by Shafer Scott M; Publisher: John Wiley
5. Succeeding in Project-Driven Organizations by Knutson Joan; Publisher: John Wiley

5
---------------------------------------------------------------------------------------------------------------- OPERATIONS AND PRODUCTIVITY ---------------------------------------------------------------------------------------------------------------- Structure 1.1 Introduction 1.2 Operation Function 1.3 Evolution of POM 1.4 Framework for Managing Operations 1.5 Operations Strategy 1.6 Trends in Operation Management 1.7 Review Questions ---------------------------------------------------------------------------------------------------------------- 1.1 INTRODUCTION ---------------------------------------------------------------------------------------------------------------- This unit introduces the students with the basic concepts of the production and operation functions. Among different functions in any organization, production and operation function is a vital function which does the job of value addition to products / services respectively. Maximizing the value addition automatically results in productivity improvement. An organization consists mainly of four functional subsystems, viz. marketing, production, finance and human resource management. The marketing function of an organization aims to promote its products among customers which help it to obtain sales orders. This, in turn, is communicated to the production subsystem which is concerned with the management of physical resources for production of an item or provision of services. This means that the available facilities also need to be managed to meet the current market requirements. To manufacture the product as per the specifications, the production function needs to organize its resources (raw material, equipments labor and working capacity) according to predetermined production plans. The finance function provides authorization and to control to all other subsystems to utilize money more effectively through a well defined finance plan. The human resource management function plans and provides manpower to all other subsystems of the organization by proper recruitment and training programs. It also monitors the performance of the employees by proper motivation for targeted results. Thus we can see that all the subsystems of an organization are mutually interlinked. They cannot work in isolation. A complete integration of all the functions /subsystems of an organization are absolutely essential for the effective functioning and achievement of desired results. The concern of any organization today is the pursuit of creating more value for the customer. This value end focus provides the competitive advantage that has become of necessity today. 09 Production and operation management provides the means to explore and implement initiatives on how to avoid waste, how to create value and how the organization can differentiate itself from its competitors. This differentiation has become the means to survive

6
in this brutal world of competition. In fact “Operations” greatly influences, directly or indirectly, the value creation logic of the organization. Production and operation management is the science-combination of techniques and systems – that guarantee production of goods and services of the right quality, in the right quantities and at right time with the minimum cost within shortest possible time. The essential features of a production and operation function is to bring together people, machines and materials to provide goods and services for satisfying customer needs. In our next paragraph we shall describe what is meant by ‘operation function’ in an organization Definition of production management: One cannot demarcate the beginning and end point of Production and Operation Management in an establishment. The reason is that it is interrelated with many other functional areas of business viz. marketing, finance, industrial relations policies etc .Alternately, Production and Operation Management is not independent of marketing, financial, and personnel management due to which it is difficult to formulate some single appropriate definition of Production and Operation Management. The following definitions try to explain main characteristics of Production and Operation Management:
• In the words of Mr. E.L. Brech: “Production and Operation Management is the process of effective planning and regulating the operations of that section of an enterprise which is responsible for the actual transformation of materials into finished products”. This definition limits the scope of operation and production management to those activities of an enterprise which is associated with the transformation process of inputs into outputs. The definition does not include the human factors involved in production process. It lays stress on materialistic features only.
• Production and Operation Management deals with decision making related to production processes, so that the resulting goods and services are produced in accordance with the quantitative specifications and demand schedule with minimum cost. According to this definition design and control of the production system are two main functions of production and operation management.
• Production and Operation Management is a set of general principles for production economies, facility design, job design, schedule design, quality control, inventory control work study and cost band budgeting control. This definition explains the main areas of an enterprise where the principles of production and operation management can be applied. This definition clearly points out that the production and operation management is not a set of techniques,
It is evident from the above definitions that production planning and its control are the main characteristics of production and operation management. In the case of poor planning and control of production activities the organization may not be not be able to attain its objectives and may result in loss of customer’s’ confidence and retardation in the progress of the establishment. In short, the main activities of operation and production management can be listed as;
• Specialization and procurement of input resources namely management, material and labor, equipment and capital.
• Product design and development to determine the production process for transforming the input factors into output goods and services.
• Specialization and control of transformation process for efficient production of goods and services.

7
---------------------------------------------------------------------------------------------------------------- 1.2 OPERATION FUNCTION ---------------------------------------------------------------------------------------------------------------- The operation function of an organization is the part that produces the organization’s products. The product may be physical goods or services. This function performs several activities to ‘transform’ a set of inputs into a useful output using a conversion process. The conversion process is the process of changing inputs of labor, materials, capital and management into outputs of goods and services. The basic elements of a conversion process are shown in the Figure 1.1
Figure 1.1 Basic Elements of Conversion Process
The production process consists of number of activities and operations. These operations and activities can be applied in different combinations and order to achieve the desired objective. The operations can be purchase of raw materials, maintenance of inventories, transportation of goods etc. The combination of two or more constitutes a system. In any production process two or more systems can be combined in series or parallel e.g. number of factories producing produce similar products to supply several markets areas then they constitute a parallel system. According to Webster “System is a regularly interacting or interdependent group of items forming a unified whole.” Any systems may have many components and variation in one component is likely to effect the other components of a system e.g. change in rate of production will affect inventory, overtime hours etc. Broadly speaking an ‘operation function’ or operations management is a systematic approach to address all the issues pertaining to the transformation process that converts some inputs into outputs that are useful and could fetch revenue to the organization. Four aspects of this definition merit closer attention. A systematic approach involves understanding, nature of issues and problems to be studied, establishing measures of performance, collecting relevant data, using scientific tools and techniques to analyze and effective and efficient solutions to the problem. Therefore, for successful operation management, the focus should be on developing a set of tools and techniques to analyze problems within operation systems.

8
The second aspect of operation management pertains to addressing several issues that an organization faces. These issues vary markedly in terms of the time horizon, the nature of the problem to be solved and commitment of the required resources, the problems may include deciding how to re-route jobs when a machine breaks down on a shop floor or how to handle a surge in demand in a service systems. On the other hand, decisions such as where to locate the plant, what capacity to build in the system and what type of products and services need to be offered to the customers is to be done? Operation management provides alternative methodologies to address such wide-ranging issues to an organization. Transformation processes are central to operation systems. The transformation process ensures that inputs are converted into useful outputs. Therefore, the focus of the operation management is to address the various aspects of design in the transformation process as well as planning and operational control. Finally, the goal of operation management is to ensure that through careful planning and control of operations the organization is able to keep the costs. In order to ensure this an appropriate performance evaluation system is required. Therefore the operation management discipline also involves the development of such a system of performance evaluation and methods by which the operating system could make improvements to meet targeted performance measures. Importance of Productivity: Effectiveness of production and operation system may be viewed as the efficiency with which inputs are converted into outputs. The conversion efficiency can be gauged by ratio of the output to the inputs and is commonly known as productivity of the system. Productivity is the ratio of input facilities to the output of goods and services. Output Productivity = -------------- Input Goods or services = ----------------------------------------------------------------------------------- Capital, manpower, materials, machines and land and building The higher the productivity of the operating system, more efficient the operation function said to be. Management of operation system thus is essentially concerned with the management of productivity. Another way of looking at the concept of productivity is to look at the amount of waste generated in the system. If waste is unnecessary output and/or defective output from the system, then the productivity of the system can be improved by eliminating / minimizing the waste occurring in the system. Policy formation in modern times has become a very complicated and time consuming phenomenon. Business enterprises now days want to plan their future strategies from the past performance. There are number of measures viz. Productivity, Profitability, rate of return etc. to illustrate the past performance. All these indicators are some sort of direct or indirect relationship between inputs and outputs factors. But none of the measures is able to determine or evaluate the overall performance of an enterprise. We shall be discussing measures of productivity in a little more detail in the following paragraphs.

9
The only way of raising the living standards of people is to increase productivity. Productivity can be increased by increasing output from each unit of input. Concept of Productivity: In general sense, productivity is some relationship between inputs and outputs of an enterprise. It is quantitative relationship between what we produce and the resources used. The concept of productivity measurement is many sided. It can relate to every item/activity on which money is spent to get the final product Some of the definitions given below explain the concept of productivity.; Definition of Productivity:
• Productivity is a measure of how much input is produced to a given output i.e. it is ratio of output to input
• Productivity is the ratio between the amount produced and the amount of resources used in the course of production. The resources may be any combination of materials, machines, men and space.
• European productivity council defines “productivity is an attitude of mind. It is mentality of progress, of the constant improvement of that which exists. It is the certainty of progress, of the constant improvement of that which exists. It is the certainty of being able to do better than yesterday and continuously. It is the continual effort to apply new techniques and methods. It is the faith in human progress.”
• According to Peter Drucker, “productivity means a balance between all factors of production that will give the maximum output with the smallest efforts.”
• I.L.O generally takes productivity to mean. “The ratio between the volume of output as measured by production indices the corresponding volume of labor input as measured by employment indices.”
• Organization of European Economic Community (OEEC) defines productivity as the ratio between the production of given commodity measured by volume and one or more of the corresponding input factors also measured by volume.
Thus there can be a number of measures indicating the level of performance corresponding to each input. In general sense, productivity is measure of how much input is required to produce a given output. Importance of Productivity: The concept of productivity is of great significance for undeveloped and developing countries. In both the cases there are limited resources which should be used to get the maximum output i.e. there should be tendency to perform a job cheaper, safer, and in quicker ways. The aim should be optimum use of resources so as to provide maximum satisfaction with minimum efforts and expenditure. Productivity analyses and measures indicate the stages and situations where improvement in the working of inputs is possible to increase the output. The productivity indicators can be used for different purposes viz. comparison of performance for various organizations, contribution of different input factors, bargaining with trade unions etc. Factors affecting Productivity: All the factors which are related to input and output components of a production process are likely to affect productivity. These factors can be divided into 2 main categories, namely:

10
Category 1 Primary factors are effort and working capacity of an individual.
• Organization factors are related to the design and transformation process required to produce some item, the nature of training and other skill imported to workers to perform certain operations in a production process, control and various other incentives.
• Conventions and traditions of the organization e.g. activities of labor unions, medical facilities, worker and executive understanding etc.
Category II
• Factors related to output: research and development techniques, improvement in technology and efficient sales strategy of the organization will lead to improvement in output.
• Efficient use of input resources , better stores control , production control policy , maintenance of machines etc will minimize the cost of production
The factors listed in category I and II can be further divided into 4 major classes viz.
• Technological • Managerial • Labor, and • External factors
The technological factors can increase the output per unit of input substantially. They can be defined in terms of technology employed, tools and raw material used. The labor factors are characterized by the degree of skills of the works force, health, and attitude towards management, training and discipline Managerial factors can be located in organizational structure, scheduling of work, financial management, layout innovation, personnel policies and practice work environment, material management etc. External factors or innumerable and identifiable in the environment which an organization has to interact e.g., the power and transport facilities, tariffs and taxes etc have important bearing on the levels of productivity. Some of these factors are controllable and some are uncontrollable and demarcation should be made between the two. Ways of increasing productivity: Productivity can be increased in a number of ways. It can be increased either by reducing the input for the same level of output or by increasing the output with the level of input or by combination of both. This can be achieved by elimination of waste , by using improved technology , better production design and management efforts there can be increase in productivity by reducing down time of maintenance , reduction in material inputs , better quality of goods , improved utilization of resources , reduction in working capital requirements , reduction in inventory size , improvement in man power skills

11
through training etc . Output can be increased by better leadership management. When employees are better motivated output can be increased. Decision making is a key factor which effects productivity. Better decisions obtained through educate and timely information system will improve effectiveness and efficiencies of the organization Techniques to Improve Productivity: Productivity can be considerably improved by improving the performance of various factors affecting productivity. The measures to improve productivity can be:
• Better planning and training of employees, improved jobs and communication and effective management through CPM/PERT methods.
• Use of time and motion studies to study and improve work performance. It enables to assess the quantum of work which can be used for planning and control.
• Better transportation and material handling systems. • By providing work incentives and other benefits to workers. • Workers involvement in decision making and working of organizations. • Improvement in technology of production process and nature of raw material and the
quality. • Simplification, standardization and specialization techniques. • Better and efficient utilization of resources at the disposal of the enterprise. • Use of linear programming and other quantitative techniques for better decision
making. • ABC analysis to identify more important items and then apply inventory control to
reduce capital investment. • Value engineering to reduce material content by good design.
Measurement of Productivity: There are a number of ways to measure productivity. The main criterion of measuring productivity is:
• In term of input performance by calculating changes in output per unit of input. • On the basis of output performance by calculating changes in input per unit in output.
Following are some of the measures in common use
Amount of output Labor Productivity= ------------------------- Amount of Labor
Where output can be measured in total quantity produced and labor can be measured in total manpower required to produce that output. Output and labor can also be measured in terms of their value in money units.
Turn Capital Productivity =-----------------------
Capital employed

12
Profit Profit Productivity = -----------------------
Investment
Output Energy Productivity =---------------------------------
Quantity of energy used A general measure of productivity can be defined as;
Output
Productivity = ---------------------------------------------- Labor + Capital +Other inputs
Each kind of measure needs some specific kind of information. The appropriate measure can be selected on the basis of information available and the objective of investigation. In fact the measure of productivity indicates the performance of inputs namely labor and capital in an enterprise. Increase in output is not an indication of increase in productivity. Production is an absolute measure and productivity is a relative measure. Productivity and Input Output Analysis: Input-output analysis is a method to study the interdependence of input and output factors of production system. It tries to locate the equilibrium between input and output factors. If Y denotes the final demand of an industry and A is the matrix of inputs then the outputs for each industry can be determined by the relation; X= (1-A) Where I is the identity matrix and X is the matrix of estimated output. (1-A) is known as Technology matrix. Input-Output analysis can be used to study the productivity of an enterprise. The index of productivity can be defined as:
Qi (1-Ai) Po ------------------- Qo (1-Ao) Po Where Po Qo is the value of output in the base year and QiPo value in the current year based on base year, (1-Ai) is technology matrix in current year and (1-Ao) is technology matrix in base year. ---------------------------------------------------------------------------------------------------------------- 1.3 EVOLUTION OF PRODUCTION AND OPERATION
MANAGEMENT ---------------------------------------------------------------------------------------------------------------- Operation Management has been variously known as Industrial Management, Management Science, Operation Research, Production management and Production and Operation Management. The concepts associated with Operation Management, perhaps, have their roots embedded in the development of early organizations. The class of problems represented by Operation Management came in the era after Industrial Revolution. This was a period of radical changes. People got replaced by machines and water and mule power replaced human muscular efforts. These developments changed the nature of production. As production

13
moved from the cottage to factory, the seeds of operation management sprouted on fertile ground. Time and Motion studies—Scientific Management: It has passed through various stages to reach the present stage. Its roots go back to the concept of “division of labor” advocated by Adam Smith in his book “The Wealth of Nations” in 1776. He recognized the economic benefits of specialization of lab our, He recommended breaking the job down into subtasks and reassigning workers to specialized tasks in which they would become highly skilled and efficient. In the early twentieth century, Frederick W. Taylor implemented Smith’s theories and enunciated his theory of “scientific management”. The basis of scientific management was a focus on machines and system of their utilization. This concept led to “time and motion study “Early in the 20th.century , Frank and Lillian Gilbreth developed a more systematic and sophisticated method of time and motion study taking into account the limits to physical and mental capacity and importance of good physical environment. The Hawthorne Studies by Elton Mayo, in 1927, resulted in the Human Resource Movement. These developments changed the way operations were managed in many businesses during that period World War II – Operation Research ---1940—1980: Before World War II the focus of ‘scientific management’ was based on the micro-environment in the manufacturing sector. During the war, the focus moved from micro-environment to macro-environment. There was rapid development in the concepts ‘theory and techniques of production and operation management after World War II. The operation Research techniques evolved during defense operations in the World War II found useful operations e.g. linear programming and network analysis. A new multi-disciplinary approach to problem solving called ‘Operation Research’ was developed. This was quantitative approach basically concerned with the efficient allocation and control of resources. Operation Research is the application of scientific methods to study and devise solutions to managerial problems in decision making using mathematical models and system approach. Operation Research has helped solve resource allocation, scheduling, processing, inventory, location layout and control problems replacement methods, and advent of computers introduced the field of automation. The demand of manpower in defense operations in Second World War necessitated evolving production systems requiring lesser labor force. This resulted in detailed time and motion studies and standard machine tool designs to improve the efficiency of reduced work force. Where We Stand Today? If we assess the past, covering a period of 200 years after Adam Smith, it can be observed that total production capacity as well as productivity has expanded considerably. Production and Operation Management has become an empirical science. Undoubtedly, during this period, we have responded to the expansion of markets and large scale business units by using concepts of division of labor and progressive mechanization in order to achieve economies of large scale production. There has been continuous improvement in design, layout and equipment of production processes by:
• With efficient use of labor, material and equipment economies in production, • Using sophisticated production control techniques to produce goods and services of
desired specialization at the desired time and with minimum cost, • Improvement in production line e.g. automation in industries.

14
---------------------------------------------------------------------------------------------------------------- 1.4 FRAME WORK FOR MANAGING OPERATIONS ---------------------------------------------------------------------------------------------------------------- An operation manager whose job is to manage the process of converting inputs (land, labor, capital and management) uses the following three approaches:
• Classical • Behavioral • Modeling
Classical management has contributed to scientific management and process orientation theories. The basis of scientific management is a focus on economic efficiency at the production core of the organization. Economic efficiency refers the ratio of outputs to inputs. Management is concerned with labor efficiency. The school of process management views management as a continuous process of planning, Organizing and controlling.
• Planning includes all activities that establish a course of action. These activities guide future decision making,
• Organizing includes all activities that establish a structure of tasks and authority, • Controlling includes all activities that ensure that actual performance is in accordance
with planned performance. Behavioral management is one of the primary theories of management emphasizing human relations and behavioral sciences. Human relations phenomenon recognized by behavioral scientists that people are complex and have needs and that the subordinate-supervisor relationship directly affect productivity. Behavioral science explores how human behavior is affected by leadership, motivation, Communication, interpersonal relationships and attitude change. Modeling management is concerned with decision making and systems theory and mathematical modeling of these theories. The decision making orientation considers making decisions to be the central purpose of management. System theory stresses the importance of studying organizations from a “total system” point of view. According to this, identifying subsystem relationships, predicting effects of changes in the system, properly implementing system change are all part of managing the total organization. With its foundations in operations research and management science, mathematical modeling focuses on creating mathematical representation of management problems and organizations. For a particular problem, the variables are expressed mathematically, and the model is used to demonstrate different outcomes that would result from the various possible managerial choices. To study the Operation Management the following three approaches are created for the frame work for managing operations:
• Planning: The operation manager defines the objectives for the operations subsystem of the organization and the policies, programs and procedures for achieving the objectives. This stage includes clarifying the role and focus of operations in the organizational overall strategy. It also involves planning, facilities designing and using the conversion process.

15
• Organizing: Operation managers establish a structure of roles and flow of information within the operation subsystem. They determine the activities required to achieve the operation’s subsystem’s goals and assign responsibility authority for carrying them out.
• Controlling: To ensure that the plans for the operations subsystem are accomplished, the operation manager must also exercise control by measuring actual output and comparing them to planned output. Controlling costs, quality and schedules is at the very heart of operations management.
Beside planning, organizing and controlling the various activities of the operation subsystem, the Operation manager is also concerned with the following two approaches;
• Behavior: Operation managers are concerned with how their efforts to plan organize and control effect human behavior. They also want to know how the behavior of subordinates can affect management’s planning, organizing and controlling actions. In operations we are interested in the behavior of managers as well especially their decision making behavior
• Models: As operation manager plans, organizes and controls the conversion process, he encounters many Problems and must make many decisions. They can frequently simplify these difficulties by using models.
---------------------------------------------------------------------------------------------------------------- 1.5 OPERATION STRATEGY ---------------------------------------------------------------------------------------------------------------- The environment of organizations is becoming more and more complex because of increased rate of environmental, social and technological change, the increased internalization of business organizations and increased scarcity and cost of natural recourses. An analysis of the competitive scenario in our country in the last ten years reveals that it is inevitable for organizations to have a good operation strategy. Due to the liberalization and globalization policies of the Union Government, Indian manufacturing and service firms have faced competition from other parts of the world. They are new and required to have a global outlook as opposed to the traditional domestic outlook. It also signaled the end of an era when customer orientation and the need for cost cutting were not all that important. Today the primary goals are related to market opportunities and customer satisfaction. The general thrust of the operation management is guided by competitive and market condition of the industry, which provides the basis for determining the organization’s strategy. Where is the industry now, and where will it be in future? What are existing and potential markets? What market gap exists and what competencies do we have for filling them? A careful analysis of market segments and the ability of our competitors and ourselves to meet the needs of these segments will determine the best direction for focusing an organization’ efforts. After assessing the potential within the industry, an overall organizational strategy must be developed, including some basic choices of the primary basis for competing. In doing so, priorities are established among the following four characteristics;
• Quality ( product performance) • Cost efficiency ( low product price ) • Dependability ( reliable; timely delivery of orders to customers ) • Flexibity ( responding rapidly with new products or changes in output volumes )

16
The manufacturers need to devise methods to remain competitive in the market following the four characteristics. Better cost management practices are often required in the manufacturing and service organizations to handle the threat of competition. Time is emerging as a critical dimension of competition in both manufacturing and service industries. In any industry the firm with the fastest response to customer demands has the potential to achieve an overwhelming market advantage. Developing superior capabilities to cut down lead time is an important requirement today. Another area of operation strategy is the proliferation of variety. Some of the key inferences from the changes in the last ten years can be summarized as follows:
• Due to several factors, the competitive dynamics will change and the expectation of the customers will also change on account of this.
• Organizations need a structured approach to scan the market and distill the changing needs at the market place. Moreover they also need a mechanism to chalk out a plan for responding to these changes in the most effective way.
• With the changes in the market place, the competitive priorities for an organization must also change. Organizations need to tune their operations to match the competitive priorities?
• The above processes are expected to repeat several times in the future and the organization must be in a position to respond to the changes every time it is called for.
These basic strategic choices, then, set the tone for the shape and content of the operation function and what it accomplishes. Therefore it is important for organizations to develop the capabilities to devise strategies for operations. This strategic planning exercise enables an organization to respond to the market needs in the most effective manner by aligning the resources and various activities in the organization to deliver products and services that are likely to succeed in the market place. The process of formulating operation strategy in any organization involves a sequential and structured set of activities. There are three steps in the process. The first step is to identify the strategic options for sustaining the competitive advantage. Once the options are known, based on the firm’s strengths and weaknesses, the overall corporate strategy could be devised. In the last step, the corporate strategy provides the basis for arriving at the appropriate operation strategy for the organization. Any strategy making exercise begins with scanning the marketplace and understanding the dynamics of the marketplace. The market dynamics informs an organization of the relevant issues to be considered for the strategy formulation process. It provides useful information about competitors, the nature of offerings that they make to the current customers, the customer’s expectations, any missing links between expectations and the current offerings and intensity of competition. The expectations of the customers can be manifold. It can include price, performance, quality, ease of use, delivery commitments, technological superiority of products, critical post sales service and so on. Customer expectation changes with time on account of several reasons. Technological improvements, evolution of market and infrastructure may cause a shift in customer expectations about a product or service. The demographic profile of the customer base may also shift over the years. Moreover customers are exposed to newer choices either by a smart competitor or due to entry of the foreign firms into the market Therefore, it is important for the organization to prioritize the alternatives and understand what is likely to make greater

17
impact on the market. Customer’s expectations and the competitive priorities that an organization needs to pursue could be better understood using order winning attitudes. Decision Making In Production Management: The production strategy can be planned in a number of ways and the organization wants to select the best course of action. The decision making process involves proper analysis of these alternatives and then to select the most suitable alternative .The decision making is an art of taking rational decisions using various scientific and analytical techniques. Here a rational decision for any organization is one with which the management can achieve its goals with minimum efforts of time and money. The management should be able to evaluate the risks associated with each alternative and the one with minimum risk should be preferred. In the opinion of Herbert Simon decision making and management appears to synonymous terms. Decision making approach in production management mainly consists of following steps:
• Comprehension: A step unified awareness is derived from sensory processes about the phenomenon under consideration
• Conception: It is the scheme of design of formulating ideas or concepts about the phenomenon generated from comprehension.
• Investigation: The idea or concepts from conception provides many alternative choices. The procedure of collected information about the possible outcomes from these alternatives and then to compare their merits and demerits is known as investigation
• Deliberation: This implies the mental weighing and assessment of merits and consequences of various schemes.
• Selection: Investigation and deliberation provides the guidelines to select the best alternative for the given situation keeping in view the overall interest of the organization.
• Implementation: This is the final stage of decision making process. The information about the alternative selected is communicated to the concerned people for using it to get the desired solution.
In recent years a production manager is generally involved in making decisions under unpredictable and uncertain situation. There are many considerations or factors associated with the final choice and the decision maker must be fully acquainted with these factors. The decision making process can be divided into two categories:
• Based on judgment and intuition. • Based on some quantitative methods
---------------------------------------------------------------------------------------------------------------- 1.6 TRENDS IN OPERATION MANAGEMENT ----------------------------------------------------------------------------------------------------------------Recently several developments that affect operations management practices have taken place in the market place. These changes have been due to economic policies at the national and international levels, advent of new sectors of industry and new technologies. The following represent a brief projected perspective on what operation managers should look at when they think of future. These are the emerging trends and future challenges which will have a profound impact for operation strategy.

18
• Dismantling of Trade Barriers: One of the recent developments which could potentially affect the operation management practices in the country is the opening up the Indian market to foreign competition. Beginning 1991, the Union Government brought new reforms for easy import of foreign goods in India. In addition to cost pressures from overseas players Indian manufacturing firms had to face large scale dumping of goods. Therefore the new market scenario sets new priorities for operation management and manufacturing firms need to face up to the new challenge. Besides this new challenge, Indian manufacturing firms have greater chances for market expansion, on account of liberalized economy, for two important reasons. The first is the overall attractiveness of Indian firms due to factor cost advantage, because of relatively low cost of labor. The second advantage for India is the large installed base of technical manpower, manufacturing know-how and experience in manufacturing and operation management .These developments are likely to affect operation management practices in the country.
• Shift in Economic Activity: In the beginning of the 21’st century the global economy
shows significant structural changes with a swing of service sector. Reserve Bank of India Annual Report for the year 1998-99 notes that the services have emerged as the fastest growing sector. From 41.3%share in 1990-91 of services the real gross domestic product has increased to 51.2% in 1998-99. Increasing economic activity in service sector that employment pattern will shift from manufacturing sector to service sector.
• Out sourcing as a major wave: India is the direct beneficiary of the phenomenon of
dismantling of trade barriers. Based on the successful experience of outsourcing software jobs in India, firms in developed countries are increasing variety of other jobs, thus creating an ‘outsourcing wave’ .Business process outsourcing (BPO) is an arrangement by which some of the business processes are done by a third party on behalf of the organization. The key motivation for a firm to outsource some of its processes stems from three factors: (i) Cost (ii) - Capacity (iii) Competency. Excellence in operations is a prerequisite for being successful in the BPO sector. Since the primary consideration for a BPO is cost operation strategy thus a BPO firm must emphasize cost leadership, otherwise the BPO activities may be shifted to competitor. Another critical performance measure is quality. Since an organization often outsourcers the entire operations pertaining to business process to third party, quality considerations are followed as per stringent norms. Therefore, developing strategic planning for high level of quality is another important implication for BPO organizations. In several other cases, in addition to cost and quality requirements, stringent delivery requirements may also have to be met as the processes may be in the intermediate stages of value creating process.
• Collaborative Commerce through the Internet: One of the most recent
developments is the advent of Internet in commerce and trade. Using the huge IT infrastructure, consisting of network connectivity, client-service architecture and several computers, it is possible to connect remote trading partners. Collaborative commerce opens up new areas for consideration in the operations management. Many of traditional methods of operation management can either be replaced or supplemented by new procedures using the electronic methods. Two important areas of significant interest are (i) procurement and supply management practices using electronic means (ii) design and new product development by means of CAD.

19
• Technological Change: There is a tremendous growth in the use of robots in automatic machine loading. The robot is used to load position and then unload and transfer work pieces. Welding processes use robots extensively. Project management techniques of PERT/CPM are very effective tools of planning and control of various projects. Computer simulation, computer-aided design and manufacturing (CAD/CAM), group technology (GT) and cellular manufacturing systems (CMS) are being introduced in future. Lean Manufacturing concept conceived by Toyota Corporation in Japan is widely adopted. Lean redefines the organization’s means, methods and mission. In lean philosophy non-value added activities (NVA’s) are excluded.
• The Environment: Technologies, to make products more earth friendly will be
developed. Stringent legislations and their compliance will be mandatory. Recycling and reuse of waste will be adopted in many industries. New technologies will be developed to provide benefits to the organizations.
In an organization production manager has to administer a great variety of activities. He assembles appropriate resources and direct the use of resources, be they people, machines, processing etc. in transforming material and time of people into products and services. Managers also have to respond to others forces from the external environment such as government regulation, labor organization as well as local, regional, national and international economic conditions Thus managers have to pay more attention to not only what their customers might buy but also to increasing government regulations and behavior of consumers and environment protection groups.
• Production manager should concern himself with production planning: In every enterprise the Production Manager is responsible for producing the required quantity of produces in time to meet the stipulated delivery date. The quantity to be produced depends upon the magnitude of the demand whereas the time by which the production should be completed is determined by the delivery date. Besides, the production department has to make arrangements for input factors and. Also has to produce in economic lot quantity. To achieve all these objectives proper production planning is necessary. Production planning involves the generation and identification of alternative courses of action and to select the optimum alternative. This can be done by; (i) Assessing the requirements of various factors of productions on the basis of demand forecast. (ii)Formulating demand schedule for factors of production to permit purchase of raw material and production of products in economic lot sizes.
• Production Control: It is the duty of the production manager to use the resources at
its disposal in the best possible manner as well as to regulate the operations in such a way that the desired delivery schedule is maintained. This is done by routing, scheduling and inspection during the production process.
• Production manager should concern himself with Quality Control: It is the
responsibility of the production manager to manufacture the goods and services of the desired specifications. Though the quality of the finished goods can be ensured by inspection of the finished goods, but It is better to employ measure which minimize the likelihood of producing defective items

20
• Method of Analysis: There can be a number of ways in which some operations can be executed. Production manager should select the most efficient and economical method to perform the operation.
• Plant layout and material handling: The physical management of manufacturing
components and the equipment for handling the material during production process has considerable effect on cost of production. The material handling system and the plant layout should be most efficient for the given situation.
• Proper Inventory Control: Inventory implies all the materials, parts, supplies, tools
and in-process or finished product kept in stock for some time. The procurement policy of these items requires a careful consideration and analysis. The purchases should be planned in economic lot sizes and the time of purchase should be so scheduled that the investment in inventory is at the lowest possible level. This implies determination of economic lot size and re-orders level.
• Work Study: Method study and work measurement techniques are applied to find the
relationship between output of goods and services and inputs of human and material resources. The production manager should try to find the most appropriate method of performing various operations involved in the production process so as to obtain the optimum use of the resources as well as increasing the productivity. Production manager should be able to generate the interest of the workers to increase their efforts by providing them wage incentives. This will result in an increase in labor productivity.
• The cost of production varies with different methods of production: The
production manager is responsible to follow a systematic approach to control capital and expenditure designed in a way that the desired profit is ensured. The nature of problems associated in the production management is such that the production manager should have the capacity as well as the aptitude to use qualitative and quantitative methods of analysis to get the desired solution. ‘’

21
---------------------------------------------------------------------------------------------------------------- 1.7 REVIEW QUESTIONS ----------------------------------------------------------------------------------------------------------------
1. What do you understand by operation and production management? 2. Define operation processes and explain its key components. 3. Discus the various stages in the evolution of production and operation management
discipline 4. What is the strategic perspective of operation and production management? 5. What are the future trends in production and operation management? 6. How will environmental issues impact on the future of production and operations? 7. What is the function of a Production manager? Is this function different from the
function of a marketing manager? 8. “The management of the transformation process is what we mean by production
management. Its study is quite independent of whatsoever specific technologies are involved and is concerned with employing methodology to operate and administer transformation systems with effectiveness.” Discuss and explain the above statement
9. What do you mean by Productivity? What is its importance? How would you measure productivity? Explain in brief.
10. Explain tools of productivity that are used to attain higher productivity 11. How would you describe the input-output analysis method in production process?
How it can be used in finding productivity of the enterprise

22
--------------------------------------------------------------------------------------------------------------- FORECASTING ---------------------------------------------------------------------------------------------------------------- Structure 2.1 Introduction to forecasting 2.2 Forecasting models 2.3 Weighted Moving Averages 2.4 Casual forecasting Models 2.5 Linear regression analysis 2.6 Multiple regression analysis 2.7 Review Questions ---------------------------------------------------------------------------------------------------------------- 2.1 INTRODUCTION TO FORECASTING ---------------------------------------------------------------------------------------------------------------- Every business enterprise interested in planning its activities must have clear idea about the demand for its product .Important business planning decisions, including the strategies to be followed, the amount of capital that is likely to be necessary, labor requirement and skills, the necessary distribution and after-sale service networks, sales incentives, sourcing of raw material, etc. are all critically dependent on the perception of the demand of its product. If this perception is substantially faulty, most of these decisions of the enterpriser likely to prove to be erroneous and lead to avoidable losses. A reasonably correct estimate of demand on the other hand can prove to be the key for a successful venture. Every organization invariably engages in annual planning exercise. The heads of various functional areas such as marketing, production, materials and finance take part in this exercise with specific objectives. The marketing function provides data on sales that the organization should target in coming year. This is primarily achieved through forecasting. Based on this inputs, the production function prepares an annual production plan and projects various requirements on the basis of this plan. The material function prepares a procurement plan to match the requirements projected by the production function. Finally, on the basis of all these, the finance function undertakes cash planning and funds management. Therefore, forecasting plays a vital role in every organization What is Demand Forecasting? The formulation of appropriate and useful production policy is an important aspect for an enterprise. This involves determination of level of production, manpower requirements equipment and inventory level etc. All these decisions are basically related to the size of production which in turn can be determined from potential demand of the product. Thus, the starting point of decision related to production strategy is the product demand forecast for a specified period. To know what a business should perform we must know its future Sales. In the absence of this information , both short and long term planning will rest on the foundation which is much less substantial than sand. A poor job of demand forecasting will lead to an ineffective production planning and towards an inventory that is either too large or too small.
23
In a literal sense forecasting means prediction. Forecasting may be defined as a technique of translating past experience in the prediction of things to come. It tries to evaluate the magnitude and significance of forces that will affect future operating conditions in an enterprise. In the words of Garfield, “Production is an integral past of any of any scientific generalization that holds the relationship between two or more factors. The generalization must hold not only with respect to past observations related to the same phenomenon but also for all future observations related to the same phenomenon. Production is even more organically related to these that those generalization which establish a definite time sequence in the occurrence of certain factors; Due to dynamic nature of market phenomenon demand forecasting has become a continuous process and requires regular monitoring of the situation. Demand forecasts are first approximations to production planning. These provide foundation s upon which plans may rest and adjustments may be made. “Demand forecast is an estimate of sales in monetary or physical units for a specified future period under a proposed business plan or program or under assumed set of economic and other environmental forces, planning premises outside the business organization for which the forecast estimate is made.” Sales forecast is an estimate based on some past information, the prevailing situation and prospect of future. It is based on an effective system and is valid only to some specified period. The following are some main components of a sales forecasting system:
• Market Research Operations to get the relevant and reliable information about the trends in the market
• A data processing and analyzing system to estimate and evaluate the sales performance in the various markets.
• Proper co-ordination of steps (i) and (ii) and then to place the findings before the top management for making final decisions
Why do we forecast? Since forecasting activity typically precedes a planning process one can identify specific reasons for the use of forecasting in organizations. Organizations face a different set of issues while they engage in planning and in each of these, forecasting plays an important role as a tool for planning process. The key areas of application of forecasting are summarized below:
• Dynamic and complex environment: Only if an organization has complete control over market forces and knows exactly what the sale of its products is going to be in the future is there no role for forecasting.
• Short term fluctuation in production: A good forecasting system will be able to predict the occurrence of short fluctuations in demand. Therefore, from this knowledge, organizations can avoid knee-jerk reactions to the unfolding reality. Production planning decisions could utilize this information and develop plans that minimize the cost of adjusting the production system for short term fluctuations.
• Better material management: Since the impending events in an organization are predicted through a forecasting system, organizations can benefit from better material management and ensure better resource availability.
• Rationalized man-power decisions: A forecasting system provides useful information on the nature of resources required, their timing and magnitude.

24
Therefore, organizations could minimize hiring and lying off decisions. Moreover, better planning on overtime and idle time could also be done based on this information
• Basis for planning and scheduling: With proper forecasting, planning and scheduling activities can be done on a rational basis.
• Strategic decisions: Forecasting plays an important role in long term strategic decision making. This includes planning for product line decisions
Importance of Fore-casting: Production and distribution are two main activities of a business enterprise. Demand forecasts tries to maintain a balance between production and distribution policies of the enterprise. With decentralization of functions and increase in the size of the organizations, forecasting of demand is of great value for proper control and co-ordinasation of various activities. An efficient demand forecast helps the management to take suitable decisions regarding plant capacity, raw material requirements space and building needs and availability of labor and capital. Production schedules can be prepared in conformity with demand requirements minimizing inventory, production and other related costs. Demand forecasting also helps evaluating the performance of the sales department. Thus, demand forecasting is a necessary and effective tool in the hands of management of an enterprise to have finished goods of right quality and quantity at right time with minimum cost.
Steps in Forecasting: The following are the main steps in demand forecasting;
• Determine the objective of forecast, • Select the period over which the forecast is to be made, • Select the technique to be used for forecasting, • Collect the information to be used, • Make the forecast.
Techniques of forecasting: Implicit in forecasting is that there exist a pattern in the past demand data which can be extrapolated or generalized for the future with the desired measure of certainty. The demand pattern though regular is found to be stable in statistical sense. Since the only input to the forecasting system is the past history of the demand of an item, no direct information concerning the market, the industry, the economy, the sale of competition and complementary products, products price changes, advertising campaigns and so on is used. Forecasting methods involve construction of suitable mathematical relationship to describe the appropriate demand pattern. Management experts have developed many forecasting techniques to help managers to handle the increasing complexity in management decision making it is tricky and experimental process. No one method of forecasting can be applied to all enterprises. In many cases the decisions are based on a combination of several, if not all of these approaches. Final forecast generally include the contributions of many men of varied experience. The use of particular method depends upon the nature of the enterprise, the products manufactured, information system in use.
Elements of Forecasting: Forecasting consists basically of analysis of the following elements;

25
Internal factors:
• Past • Present • Proposed or future
External Factors:
• Controllable: (a) Past (b) Present © Future • Non controllable: (a)Past (b) Present © Future
Fore- casting is essentially a study of internal and external forces that shape demand and supply. The shape of things to come will depend partially upon how one shapes the controllable factors. With different strategies, the forecasting will be different offering multiple scenarios in management decision making. ---------------------------------------------------------------------------------------------------------------- 2.2 FORECASTING MODELS ---------------------------------------------------------------------------------------------------------------- One can classify the various models available for forecasting into three categories:
1. Extrapolative models: They make use of past data and essentially prepare future estimates by some methods of extrapolating the past data. For example, the demand for soft drinks in a city or a locality could be estimated as 110 percent of the average sales during the last three months. Similarly, the sale of new garments during the festive season could be estimated to be a percentage of the festive season sales during the previous year.
2. Casual models: It analyses data from the point view of cause-effect relationship. For instance, to the process of estimating the demand for the new houses, the model will identify the factors that could influence the demand for the new houses and establish the relationship between these factors. The factors, for example, may include real estate prices, housing finance options, disposable income of families, and cost of construction and befits derived from tax laws. Once tea relationship between these variables and the demand is established, it is possible to use it for estimating the demand for new houses.
3. Subjective judgments: Another set of models consist of subjective judgment using qualitative data. In some cases, it could be based on quantitative and qualitative data. In several of these methods special mechanisms incorporated to draw substantially from the expertise of group of senior managers using some collective decision making framework.
Selection of a forecasting technique: The selection of a forecasting technique depends on the following three factors:
1. The characteristics of the decision making situation, which include: (i) The time horizon (ii) Level of detail (iii) Number of items (iv) Control versus planning
2. The characteristics of the forecasting methods: (i) the time horizon (number of periods for which forecasting required) (ii) The pattern of data (horizontal, seasonal trend etc.) (iii) Type of model( casual, time series or sta6tistical) (iv) Cost (v) Accuracy (vi) Ease of application

26
3. Present situation which includes: (i) The item that is being forecast (ii) Amount of historical data available (iii) Time allowed for preparing forecast.
Although there are the below mentioned forecasting models we shall be concentrating on Weighted moving averages model.
• Weighted moving averages • Casual forecasting model • Linear regression analysis • Multiple regression analysis
---------------------------------------------------------------------------------------------------------------- 2.3 WEIGHTED MOVING AVERAGE ---------------------------------------------------------------------------------------------------------------- Equal weights are assigned to all periods in the computation of simple moving average. The weighted moving average assigns more weight to some demand values (usually more recent ones) the Table 2.1 Shows the computation for three months weighted moving average with a weight of 0,5 assigned to the most recent demand value, a weight of 0, 3 assigned to the next most recent value and a weight of 0, 2 assigned to the oldest of the demand value included in the average
Table 2.1 Three months weighted moving average
Time Months (t) Demand (Dt) Moving average Forecast (Mt)
1 120 - - 2 130 118 - 3 110 - - 4 140 129 1 5 110 119 1 6 130 126 9
Weighted MA3 = 0, 2 * 120 + 0, 3 * 130+o, 5*110 =110 0, 2+0, 3+0, 5 Weight MAi = $WtDt $Wt Where I =1, 2, 3 if we use these periods moving average, i=3 corresponds to the most recent times period and i=1 correspond to oldest time period Wt=Weight for the time period t In the example, Wi=0, 2 W2=0, 3 and so on An advantage of this model is that it allows you to compensate for some trend in seasonality. If you want to, you can weight recent months more heavily and still dampen somewhat the effect of noise by placing small weightings on older demands. Of course the modeler or manager still has to choose the coefficients and this choice is critical to model success or failure.

27
---------------------------------------------------------------------------------------------------------------- 2.4 CAUSAL FORECASTING MODELS ---------------------------------------------------------------------------------------------------------------- These methods construct a forecasting logic through a process of identifying the factors that cause some effect on the forecast and building a functional form of the relationship between the identified factors. In other words, a set of independent variables are identified and associated with the dependent variable through a functional relationship. For example, let us consider the demand in the country for a new product such as Direct to Home receivers (DTH). Since this is a new product, we may not have adequate past data on the demand and may need other means of establishing the potential demand. Even in the case of existing product, the number of factors that influence demand may be several requiring us to understand interaction among these, Several factors – including exchange rate fluctuation, installed capacity in the country, new product launches customers tariffs and price of raw material at the international markets—influence the demand. Forecasting in these situations uses casual methods. In general, let us consider the forecast for a dependent variable Y using n independent variables X1, X2, X3, … Xn. Then developing a forecasting logic requires establishing a establishing as follows: Y= f(X1, X2, X3, … Xn) Use of casual method to extract the trend component in times series is a frequent application of casual method. Other casual methods include econometric models, multiple regression models and technological forecasting techniques. Casual methods of forecasting require greater degree of mathematical treatment of data. There are several computer packages such as SPSS available today to help the forecast designer in this process Example: A manufacturer of tricycles in the age group of two to four years commissioned a market research firm to understand the factors that influence the demand for its product. After some detailed studies, the market research firm concluded that the demand is a simple linear function of the number of newly married couples in the city. Based on this assumption, build a causal model for forecasting the demand for the product using the data given below for a residential area in the city Also estimate the demand for tricycles if the number of new marriages is 150 and 250
X Y New marriages Demand for tricycles
200 165 225 184 210 180 197 145 225 190 240 169 217 180 225 170

28
Solution: Since the causal relationship is a simple linear regression the method of least squares is used to determine the coefficient of linear regression Y= a + b
New marriages Demands for tricycles
X Y X*Y X*X 200 165 33,000 40,000 235 184 43,200 55,225 210 180 37800 44100 145 197 28,565 38,809 225 190 42,750 50,625 240 169 40560 57600 217 180 39060 47089 225 170 38250 50,625
Sum: 1749 1383 303,225 384,073 Average 216-625 172.875 - -
From the equation b= $X1Y1-nXY $X1*X1-nX*X a =Y-bX We have b=303,225-(8*218,625*172.875) =0.5104 384,073-8*218,625*218,625 a= 172.875-0, 5104 ore the demand for tricycles is given by relationship Number of tricycles demanded= 61.29+0.5104 *no. of new marriages If the no. of new marriages is 159 then the demand-138 tricycles If the no. of new marriages is 250 then the demand = 189 tricycles ---------------------------------------------------------------------------------------------------------------- 2.5 LINEAR REGRESSION ANALYSIS ---------------------------------------------------------------------------------------------------------------- Linear regression analysis is a forecasting technique that establishes a relationship between variables. One variable is known or assumed, and used to forecast the value of an unknown variable. Past data establishes a functional relationship between the two variables. We will consider the simplest regression situation between the two variables and the linear relationship. Our forecast of the period’s demand is expressed by: Ft=a + bX1 Where F1 is the forecast for the period t, given we know the value of the variable X in the period t. The coefficients a and b are constants: a is the intercept value for the vertical (F) axis and b is the slope of the line. Often the equation is expressed as: Y=a + bX.

29
In this equation we have substituted F for Y, to indicate b is the forecasted value. In order to find coefficients a and b, old demand is utilized rather than the old forecast. These coefficients are computed by the following two equations b=: a ($X1D1)-($X1)($D1)___ n ($X1*$X1)-($X1)($X1) a=$D1- b & X1 n Where D = a + bX, and a= no. of periods Example: A pepperbox company carryout pizza boxes. The operation planning department knows that the pizza sales of major client are a function of the advertisement amount, the client spends, on account of which they receive in advance of the expenditure. Operation planning is interested in determining the relationship the client’s advertisement and sales. The amount of pizza the client would order. In money value is known to be a fixed percentage of sales Quarterly advertising and sales Quarter Advertising (in 1, 00,000 Rs.) Sales (in 1, 00,000 Rs.) 1 4 1 2 10 4 3 15 5 4 12 4 5 8 3 6 16 4 7 5 2 8 7 1 9 9 4 10 102 Computing b and a, where advertising is X1 for the quarter t, sales are D1 for the quarter t and forecast is F1 for the future Period t
Quarter (t) Advertisement(X1) Sales (D) Xi*Xi X1D1 1 4 1 16 4 2 10 4 100 40 3 15 5 225 75 4 12 4 144 48 5 8 3 64 24 6 16 4 256 64 7 5 2 25 10 8 7 1 49 7 9 9 4 81 36 10 10 2 100 20
Sum 96 30 1060 328

30
b = 10(328) – (96)30 =29 10(1060) _96*96 a = 30- .29(96) = .22 10 Thus the estimated regression line, the relationship between future sales F, and advertising X is F=22+.29X The operation planner can now ask for planned expenditure expenditures, and from that sales can be forecast ---------------------------------------------------------------------------------------------------------------- 2.6 MULTIPLE REGRESSION ANALYSIS ---------------------------------------------------------------------------------------------------------------- In multi regression analysis, the regression equation is used where demand for commodity is deemed to be the functions of many variables; the process of multi regression analysis may be briefly described as:
• The first step in multiple regression analysis is to specify the variables that are supposed to explain the variations in demand for the product under reference. The explanatory variables are generally chosen from the determinants of demand, viz. price of the product, price of its substitute, consumer’s income and their tastes and preference. For estimating the demand for durable consumer goods (e.g. TV sets refrigerators, houses etc,), the explanatory variables which are considered are availability of credit and rate of interest. For estimating the demand of capital goods (e.g. machinery, and equipment) the relevant variables are additional corporate investments, rate of depreciation, cost of capital goods cost of other inputs (e.g., labor and raw materials) market rate of interest etc.
• Once the explanatory or independent variable is specified, the second step is to collect time-series data on the independent variables.
• After necessary data is collected, the next step is to specify the form of the equation which can appropriately describe the nature and extent of relationship between the dependent and the independent variables.
• The final step is to estimate the parameters in the chosen equations with the help of statistical techniques. The multivariate equation cannot be easily estimated manually. They have to be estimated with the help of computers.
The reliability of the demand forecast depends to a large extent on the form of equation and degree of consistency of the explanatory variables in the estimated demand function. The greater the degree of consistency, the higher the reliability of the estimated demand and vice versa. Adequate precautions should, therefore, be taken in specifying the equation to be estimated Selection of the Forecasting Model: We have discussed several statistical forecasting models for demand estimation in planning and control. As a manager, you now have the task of selecting the best model for your needs. Which one should you choose, and what criteria should you use to make the decision. The most important criteria are:
• cost , and • accuracy

31
Accuracy (forecast error), can be converted into cost. Costs to be considered in the model selection are;
• implementation costs, • systemic costs • Forecast error costs.
Of these three, forecast error costs are perhaps the most complex to evaluate. They depend upon the noise in the time series, the demand pattern, the length of forecast period and the measure of the forecast error. Several studies have evaluated and compared the performance of different models. In general, different models are best, depending on the demand pattern, noise levels and length of the forecast period .It is typical to have a choice of several good models for any one demand pattern, when the choice is based only on forecast error Combining Naïve Forecasting Models: In comprehensive studies it has been found that average and weighted average methods of forecasting is different from other forecasting methods. From these studies we can conclude that forecasting accuracy improves, and that the variability of accuracy among different combinations decreases, as number of methods in the average increases. Combining forecast models holds considerable promise for operations. As Makridakis and Walker state “Combining forecasts seem to be reasonable practical alternatives when , as is often the case a true model of the data-generating process or single best forecast method cannot or is not, for whatever reason, identified.” Behavioral Dimensions of Forecasting: To understand some of the dimensions of forecasting, it is wise to consider human behaviors, because forecasts are not always made with statistical models. Individuals can and do forecasts by intuitively casting forth past data, and they often intervene in other ways in the statistical forecasting procedure as well. A manager may feel that item forecast generated by models must be checked for reasonableness by qualified operating decision makers. Forecasts generated by models should not be followed blindly; potential cost consequences must be considered. Decision makers can take into account qualitative data that are not in the model. Decision makers should use the forecasting model as an aid in decision making; they should not rely totally on the forecasting models for all decisions. Many, perhaps most, forecasts for production/operation management are individual intuitive forecasts. Intuitive Forecasting as a Judgmental Process: Currently, little is known about the effectiveness of intuitive forecasting. We can, however analyze some of the mental processes involved. A forecast may be regarded as the culmination of a process consisting of several stages, including information search and information processing. It results in human inferences about the future that are based on particular patterns of historical data presented to the forecaster. We can speculate about a number of environmental factors that may affect intuitive forecasting. Meaningfulness: Forecasting requires considering a restricted set of information about historical demand. When we discuss job enrichment and job design we see that if repetitive tasks can be made meaningful to the person performing them, positive effects usually result. Imparting meaningfulness to the task of forecasting, then, may be expected to affect the reliability of intuitive forecasting task, the more accurate the intuitive forecast.

32
Pattern Complexity: Pattern complexity, the shape of demand pattern, is in general, a critical variable in intuitive forecasting, just as it is in model forecasting. Some behavioral studies suggest that intuitive forecasts may perform better on a linear than on non-linear demand patterns. In addition, people apparently try to use non-linear date in a linear manner.
Degree of Noise: Given sufficient historical data, the forecasting problems are trivial for most cases without noise. Introducing random variations, however, often it brings about a condition called cue uncertainty. Very high noise levels obscure the basis for accurate forecasting, and often the result is lower forecast accuracy.
Individual Variability: Another finding in intuitive forecasting studies which is the wide variability of performance of the forecasters. When comparing forecasters with models, there are typically a few very good forecasters, but there are even more very poor forecasters. If planning and directing production and operation are based on poor intuitive forecasts, these variations in performance can be very expensive.
Individual versus Model Performance: How do individuals compare to naïve forecasting models? In studies, exponential smoothening models, when fit to the historical demands given to intuitive forecasters significantly outperformed group average performance. Only a very few good intuitive forecasters outperformed the models. The operation manager would be wise to consider models as an alternative to individuals. Models generally are more accurate, and if large number of items must be forecast, the models are more economical.
Forecasting, Planning and Behavior An excellent literature review and evaluation compares many modeling and psychological dimensions of forecasting, planning and decision making. Many information processing limitation and biases involving human judgment apply to forecasting and planning as well. Errors in forecasting procedures are caused by using redundant information, failing to seek possible disconfirming evidence, and being overconfident about judgments. In addition, numerous studies show that predictive judgment of humans is frequently less reliable than that of simple quantitative models.
Forecasting and the Indian Scenario: Some of the more creative and productive organizations in India are to be found among high technology organizations such as Atomic Energy Commission, Indian Space and Research Organization, Bharat Heavy Electrical and Defense Research and Development Organization (DRDO) The participation of private sector in the high technology area has been very limited. The high technology companies in India have been scanning for technology development in the world and trying to develop indigenous equivalent products. And for this, they do forecasting, particularly that of technology, in some measures. However, barring these few examples, by and large other organizations have not been using forecasting in a scientific manner. The reasons could be many. One of the main reasons has been that they do not feel the need to survey the environment and forecast future business. The reason behind this has been the country’s erstwhile closure of foreign participation, ensuring secure markets for domestic companies. India has been a sellers market at least for past half a century. If you could produce something, it could always be sold in a product-starved country. The situation has changed since the turn of the century but old habits, beliefs and psychology take time to change. The emphasis, therefore, had been on producing rather than on real proactive marketing. The environmental scan of business /industries stopped at that. Hence, forecasting had indeed been a neglected aspect of management. Now, with the

33
gradual opening up of the economy, the economic scenario has changed due to the increasing participation of the multinational corporations in various areas of business/industry., including infrastructure. The Indian economy is increasingly getting the characteristics of a buyers market. The Indian businessman, therefore, has to be very alert about the mumblings in the gangways. Forecasting models, such as the causal models can now be used to forecast the effect of concession in the corporate tax, custom duty, excise and other areas. Opinion based methods such as Delphi techniques and consumer behavioral surveys have increasing relevance. Monopoly or oligopoly does not need forecasting. Indian industries and businesses are waking up to the fact that it is now a different game. They know that if they do not follow appropriate management basics such as forecasting they risk the danger of being marginalized for a long time to come. ---------------------------------------------------------------------------------------------------------------- 2.7 REVIEW QUESTION ----------------------------------------------------------------------------------------------------------------
1. Define the term “forecasting” What is its purpose? Describe the uses and limitations of weighted moving average method of forecasting
2. Discuss critically the different models of forecasting. 3. What are the possible consequences if a large-scale firm places its product in the
market without having estimated the demand for its product? 4. Explain the regression method of demand forecasting. 5. Why is demand forecasting essential? Is demand forecasting equally important for
small and big ; old or new business ventures 6. What independent variables are relevant for forecasting the demand for; A-cement B-
toothpastes C-electricity And D-text books. You are given the following data ---------------------------------------------------------------------------------------------------------------- X 3 6 8 10 13 13 13 14 Y 8 6 10 12 12 14 14 20 ---------------------------------------------------------------------------------------------------------------- Estimate the regression equation, Y= a +b X.

34
---------------------------------------------------------------------------------------------------------------- PRODUCT AND PROCESS DESIGN ---------------------------------------------------------------------------------------------------------------- Structure 3.1 Introduction 3.2 Product development 3.3 Product Design Tools 3.4 Design of Services 3.5 Flexible manufacturing systems 3.6 Process Design 3.7 Types processes 3.8 Modern Production Technologies 3.9 Process Reengineering 3.10 Review Questions ---------------------------------------------------------------------------------------------------------------- 3.1INTRODUCTION ----------------------------------------------------------------------------------------------------------------A company has to be good at developing new products, without products there would be no customers. Without customers, there would be no revenue. Developing a new product is a major activity. Thomas Alva Edison, with as many as 1,300 inventions and 1100 patents to his credit ,said about the product development process,” Genius is 1 per cent inspiration and 99 per cent perspiration,” Product development requires more of perspiration and less of genius to be successful. The company also must manage them in the face of changing tastes, technologies and competitions. Every product seems to go through a life cycle—it is born. Goes through several phases, and eventually dies as newer products come along that better serve the consumers needs. The product life cycle presents two major challenges:
• First, because all products eventually decline, the firm must find new products to replace aging ones (the problem of product development).
• Second, the firm must understand how the products age and adapt its marketing strategies as product pass through life cycle stages (the problem of product life-cycle strategies
The Operation management addresses the issue of innovation for product development by enabling firms with some distinctiveness in their offerings. The distinctiveness may be on account of products/services offered, technologies and channel employed and various processes used while providing the product or services to the customers. In recent years we

35
have been witnessing a rise in customer expectations with respect to the products and services offered. Firms can benefits in this scenario, either by offering highly differentiated products and services or by offering very cost effective products. Furthermore, firms can also benefit by bringing these products and services much faster than the competitors and gain from the early mover advantage, In order to achieve this, firms need to have a robust mechanism to understand customers’ expectations. Firms must also have the capability to reach faster once the expectations are understood. In the 1950sand 1960s Hindustan Motors introduced variations of its Ambassador (Mark 2, Mark3 and so on) roughly once in ten years. Today, no automobile manufacturer can afford to take that much time to introduce new products and variations of existing ones. A good product development process addresses these issues and provides a firm with a set of tools, techniques and concepts to bring products faster and cheaper into the market and realize the associated gains. Organizations have experienced several tangible benefits from good product development processes. Some of them are:
• The International Motor Vehicles Programme showed that while Japanese manufacturers such as Honda and Toyota introduced as many as 85 models between1982 and 1989, their American counterpart were able to introduce only 49 models . This significantly affected the competitive positioning of these firms.
• Another study analyzed the market impact of new product introduction. It was shown that by introducing products six months ahead of competitors , a firm can gain as much as three times the cumulative profit earned over the life of the product
It is, therefore clear that product development is an important aspects of the operation management function in every organization, be it services or manufacturing. An organization armed with good product development process will be in a better position to bring new products and services to the market ahead of competition and will be able to retain customers and its market share in the sector. ---------------------------------------------------------------------------------------------------------------- 3.2 PRODUCT DEVELOPMENT ---------------------------------------------------------------------------------------------------------------- A successful product development requires a total-company effort. The most successful innovating companies make a consistent commitment of resources to product development, design a new product strategy that is linked to their strategic planning process, and set up formal and sophisticated organizational arrangements for managing product development process. The product development process for finding and growing new products consist of eight major steps as explained below;
• Idea generation • Idea screening • Concept development and testing • Marketing Strategy Development • Business analysis • Product Development • Test marketing • Commercialization

36
We shall briefly describe these steps: Idea Generation: It is a systematic search for new product ideas. A company has to generate many ideas in order to find good ones. The search for new products should be systematic rather than haphazard. Top management should state what the products and markets to emphasize. It should state what the company wants from its new products, whether it is high cash flow, market share or some bother objective. To obtain a flow of new-products ideas, the company can tap many sources. Major sources of product ideas include internal sources like customers, competitors, distributors and suppliers. It has been found that more than 55 percent of all product ideas come from internal sources. Idea screening: The purpose of idea generation is to create a large number of ideas. The purpose of the succeeding stages is to reduce that number. The first reducing stage is idea screening. The purpose of screening is to spot good ideas and drop poor ones. Most companies require their executive to write up the new product ideas on a standard format that can be reviewed by a new product committee. The write up describes the product, the target market, the competition and makes some rough estimate of market size, product development time and costs, manufacturing costs and rate of return. The committee then evaluates the idea against a set of general criteria. Concept Development and testing: Customers do not buy product ideas, they buy the product concepts. The concept testing calls for testing new product concepts with a group of target consumers. After being exposed to the concept, consumers then may be asked to react to it by asking a few questions. Market strategy development: The next step is market strategy development, designing an initial marketing strategy for introducing the concept to the market. The market strategy statement consists of three parts:
• The first part describes the target market; the planned product positioning, market share and profit goals for the first few years.
• The second part of the marketing strategy statement outlines the product planned price, distribution and marketing budget for the first year.
• The third part of the marketing strategy statement describes the planned long-run sales, profit goals, and marketing mix strategy.
Business Analysis: Once management has decided on its product concept and marketing strategy, it can evaluate the business attractiveness of the proposal. Business analysis involves a review of its sales, cost, and profit projections for a new product to find out whether they satisfy the company‘s objectives. Product development: If the product concept passes the business test, it moves into product development. Here, R&D or engineering develops the concept into a physical product. The R&D department will develop one or more physical versions of the product concept, R&D hopes to design a prototype that will satisfy and excite consumers and that can be produced quickly and at budgeted cost. When the prototype is ready it must be tested. Functional tests are then conducted to make sure that the product performs safely and effectively. Test Marketing: If the product passes functional and consumer tests, the next step is test marketing, the stage at which the product and marketing program are introduced into more

37
realist marketing setting. This allows the marketer to find potential problems so that these could be addressed. Commercialization: is introducing the new product into the market Tools for Product Development: The following are various product development techniques adopted by different organizations;
Standardization: This means fixation of some appropriate size, shape, Quality, manufacturing process, weight and other characteristics as standard to manufacture a product of desired variety and utility e.g. manufacture of television sets of standard size of the screen using standard components and technology; shaving blades are made of standard size and shape to suite every kind of razor. The concept of standardization is applicable to all factors of production namely men, materials, machines and finished goods. These standards can become the basis to evaluate the performance of various components of production in a manufacturing process. In the words of Behel, Smith and Stackman: “A standard is essentially a criterion of measurement, quality, performance, practice established by custom, consent or authority and used as a basis for comparison over a period of time. The setting of standards and the coordination of the industrial factors to comply with these standards and to maintain them during the periods for which they are effective is known as industrial standardization” According to Dexter S Kimball of production control operation in the manufacturing sense is the reduction of any one line to fixed types, sizes and characteristics.” Standardization becomes the basis of production control operations and works as a catalyst in directing and operating the working of business enterprise. It identifies and compares various products, systems and performances in an enterprise. It is the function of the department responsible for designing the product to provide the guidelines and infrastructure for standardization of the whole system keeping into consideration the designing stage towards standardization may be too expensive to be rectified. For an organization designing of the product without considering standardization aspect is of no value of significance. Franklin F. Folts has described the concept of standardization as,” simplification of product lines and concentration on a restricted predetermined variety of output is one common application of the principles of standardization may be extended to all factors in the production process”. Standardization is an instrument to manufacture maximum variety of products out of minimum variety of components by means of a minimum variety of machines and tools. This decreases working capital requirements and reduction in manufacturing costs. Standardization also implies that non-standard items are not to be manufactured except when consumers order them specially. Some standards are enacted by law viz. automobile windscreen which must be made of safety glass. Usually there are institutions, societies and governmental departments that regulate the standards. In a factory, it is best to have standardization committee drawing its members from sales, engineering, production purchasing, quality control and inspection. Sales department and engineering department have to work closely in effecting changes towards standardization because the older products that have been sold are affected for after-sales service needs. Within an organization, it is the engineering department who sets standards for the materials to be procured and specification of the end products and the mode of testing the products.

38
Advantages of standardization:
• Standardization in designing, purchasing of raw material, semi finished and finished goods and of the manufacturing process tries to eliminate wastage and reduces the cost of production. Reduction in varieties of raw materials means reduced investments in stocks and less attention to stock control.
• Standardize product components reduce tool cost, permits larger and more economical lot sizes of production, avoids losses for obsolescence and reduces capital requirements for work in process.
• Production in larger quantities can be planned which results in less set-up costs. • By minimizing the operations in production process it provides facility to introduce
mechanization and use of more specialized tools and equipments. • Service and maintenance costs as well as marketing expenses are reduced. • Encourages the manufacturer to products of new style, use and performance with an
object to generate more customers. • The value of the standardized product lying in stocks or in stocks or in transit can be
easily for the purpose of advancing loans.
Disadvantages of Standardization: Product standardization leads to some disadvantages also. These are:
• Too much standardization has an adverse affect on the efficiency and morale of the workers. They in the long run feel bored and fed-up in doing the same routine again. The sprit of challenge and initiative vanishes with passage of time.
• During the initial process of product Development where frequent improvements and changes may be necessary to bring the product and production process up to the mark, standardization may create obstacles in innovations.
• For small scale enterprises standardization may not be advantageous.
Simplification: In production, simplification can be done at two places namely (i) for product or) for work. Simplification in product development is used for products; In fact simplification should be done before standardization. In the words of F. Clark and Carrie, “simplification in an enterprise connotes the elimination of excessive and undesirable or ‘marginal lines’ of product to hammer out waste and to attain economy connotes the elimination of excessive and undesirable or ‘marginal lines’ of product to hammer out waste and to attain economy coupled with the main object of improving quality and reducing costs and prices leading to increased sales.” W.R Spiegel and R.H Lansburg also defines,” Simplification refers to the elimination of superfluous varieties, size dimensions etc.” Simplification can be advantageous to both producer and the consumer of a product. These can be listed as: To the producer:
• Eliminates surplus use of materials to provide economy in production cost. • More production increases the inventory size which avoids delays in supply. • Less obsolescence of materials and machinery.

39
• Due to simplification in operation the efficiency of the production process increase and this leads to more productive due to scope of better training and learning facility with simplification operation.
• Human efforts become more productive due to scope of better training and learning facility with simplified operation.
• After-sales service prospects are minimized. • Production planning and control operations become easy and simple. • Reduction in cost of production leads to more sales.
To jobber-wholesalers and detailers:
• Increased turn over. • Sales effort on fewer items. • Reduction in storage space4. • Less overheads and handling expenditures.
To the consumer:
Specialization: Specialization implies expertise in some particular area or field. It is experienced that as the companies expand the range of their products, manufacturing system, involves more and operations for transforming inputs into output. This often result an increase in operation cost and decline profits. The problem can be solved by identifying the products contributing to losses and then eliminate their production. This will lead to confine the production of profitable items only and consequently a reduction in number of operation required in the process. The minimization of operation can lead to use of expert knowledge, skill and techniques in production system, the nature and the type of product. Operation required manufacturing it and the nature of the market. Specialization implies reduction in the variety of products manufacturing by the organization. Advantages of specialization are:
• Specialization and standardization leads to higher productivity. • Incase in output and reduction in per unit cost of production , • Savings in purchase of raw material and improvement in the quality of the finished
goods. Disadvantages of specialization are:
• Less flexibility in adjustment to changed situations. • Monotony and boredom may adversely affect the efficiency.
Diversification: It implies policy of producing different types of products by an enterprise. Thus it is reverse of simplification are associate with the nature of the industry e.g. in the case of capital goods industry simplification is more important as the customers give preference to economy, accuracy and performance of the product, whereas in an consumer goods industry diversification leads to produce variety of goods in ;terms of style, shape, color, design etc. The establishment facing tough competition is forced to diversify this activates to capture the market. In general diversification can be adopted for the purpose the market. In general diversification can be adopted for the purpose of (a) utilization of idle/surplus resources, (b)

40
stabilization of sales, (c) to cope with demand fluctuations and (d) for survival of the organization. Due care and precautions should be taken in the formulation of diversification policy. Proper and extensive market analysis at different levels of the quality and quantity of the products should be done to determine the levels of profitability. This will help in selection most appropriate diversification strategy under the prevailing circumstances. Advantages of Diversifications are:
• Increase in sales due to production of different kind of products. This also leads to increase in volume of business.
• Needs of wider section of consumer are fulfilled. • Risk minimization’ in the case of quick and unpredictable demand variations. • Uniform and balanced production programme can be chalked out without any
consideration of wastage by production by products. • Elimination of wastage by producing by-products
Disadvantages of Diversifications are:
• Due to increase in number of operations the production process becomes quite
complicated and some times expensive. • Production Planning and control operation becomes complicated and time consuming
requiring extra Efforts. • The size and the variety of items in; the inventory increases with diversification
introducing more problems. • Worker of different types of skill and expertise are required.
Automation in Business Enterprises: The concept of automation has brought another revolution in industrial world. This has resulted in phenomenal growth in industrial arena by providing wide range of products with minimum cost and efforts. Automation implies use of machines and equipments for performing physical and mental operations in a production operation in place of human beings. Automation can be visualized as an electronic brain with capacity of taking routine and logical decisions connected with control and planning functions of management. Routine decisions can belike scheduling, routing, dispatching and inspection of modifications of operations to see that the whole system operates according to the planned strategy. In the absence of any human intervention or activity automation can be considered as a self regulating and controlling system. Mechanization provides the self regulating property and performing manual operations by means of mechanized operations. Thus automation can be defined as “A system of doing work where material handling, production process and product design are integrated through mechanization of thoughts and to achieve a self regulating system. In automation the machines and equipment required to perform various operations process are sequent arranged in order of hierarchy of operations. Electronic devices are used to

41
record, store and interpretation of information at various stages of production .Machines is used to operate other machines. Automation can be done at various levels of the manufacturing system in parts or as a whole. Some of the situations can be:
• Handling of raw materials, semi finished goods or finished goods. Instead of doing the work manually the operation can be done by means of trolleys, conveyer belts, overhead cranes, lifts etc. This eliminates chances of losses due to handling and saves valuable time.
• Sophisticated, reliable and efficient machines and equipment can be used in production process. This will ensure both quality and quantity of the product desired.
• Inspection and quality control operations can be done by means of mechanical devices. This eliminates chances of human bias and error.
Use of machines and equipment in automation ensures production of high quality products at minimum cost. This also increases the confidence of consumers in the product and stabilizes the demand for the product. There is a general fear that automation leads to unemployment. But on the other hand operation of machines and equipments in the system need highly skilled and qualified manpower. So the technical skills of the system increase with reduction in size. It goes without saying that automation ensures high level of efficiency and capacity utilization.
Advantages of automation are: • Better quality of goods and services, • Reduction in direct labor cost, • Effective control on operations, • Greater accuracy, more output, greater speed, • Minimization of waste, • Production planning and control is to be done in the beginning only, • Working conditions can be improved greatly since much of the work follows an
orderly path, • The waste does not come into much contact with the equipment; also the design of the
special purpose equipment is usually superior to that of general purpose equipment. This improves overall safety considerably,
• Direct and indirect costs, Inventories, Set-up times and lead times are all reduced. The space and equipment utilization is improved,
• Since the human inputs in the production are minimized, the quality is also improved. Human beings are more erratic than machines,
• Throughput time is reduced and therefore service to the customers is enhanced.
Disadvantages of automation are;
• High capital investment, • High maintenance costs and requirement of labor of high caliber, • Requires highly skilled manpower, • Can create unemployment, • Scheduling and routing operations are difficult and time consuming,

42
• Restriction in designing and construction of buildings, • Larger inventories, • Continuous power supply, • Automation equipment is highly inflexible i.e. if a new product is to be introduced the
existing equipment may have to be salvaged entirely, • Any break down anywhere would lead to complete shut-down.
---------------------------------------------------------------------------------------------------------------- 3.3 PRODUCT DESIGN TOOLS ---------------------------------------------------------------------------------------------------------------- Several tools and techniques are available for efficient design and development of products. These tools address all the stages of design and development. Some of the tools that are available for product designers to understand customers needs and translate them into meaningful design and manufacturing specifications, as well as some guidelines for incorporating the manufacturing requirements at the design stage. Understanding Customer Needs: The first step of product design and development process is to know what exactly the product is going to be. Organizations need various methods by which can obtain information regarding the needs of the customers. This can be by:
• Market Research: In market research, target group is identified and appropriate sampling is done within the target group. Using structured data collection methods, such as questionnaire surveys and interviews, information is solicited from the sample. The information is subjected to statistical and other analytical reasoning before arriving at customers’ preferences and needs.
• Competitive Analysis: Understanding what the existing offerings are now and how the gaps and problems identified could be eliminated can sometimes offer valuable inputs to the designer. One method of competitor analysis is to “reverse engineer” the product. The competitors’ product is dismantled down to individual components level and some detailed studies are conducted on them. These may sometimes reveal the probable processes utilized in their manufacture such as the choice of materials and their specifications and the relationship between these parameters and performance. Reverse engineering is one crude method of a larger issue of benchmarking. In case of benchmarking, the competitive product offerings are chosen for detailed analysis. Specific parameters are chosen for the benchmarking exercise. For example, cost, features, performance, ease in maintenance, ease of manufacture, assembly and distribution are some of the issues on which comparative study may be possible. Once these parameters are identified, data collection and analysis will reveal the positioning of ones’ own products vis-à-vis the competitor’s offerings. Another method for competitive analysis is to develop perceptual maps. Perceptual maps are graphical representation of various competitors offering and that of ones’ own proposed product and/or service.
• Quality Function Deployment: The goal of good product design is to bring out products that satisfy customers needs better than those of the competitions. However, the attributes of competitor satisfaction are often qualitative in nature. On the other hand the product design process result in a bundle of quantitative attributes pertaining to the product. The challenge, therefore for a designer is to ensure that the transformation from qualitative attributes to quantitative ones is smooth and complete. Quality function deployment is a Japanese tool that helps organizations achieve this transition in a systematic and progressive manner Quality Function Deployment

43
achieves these transition .in four stages. The first stage links customer needs to the design attributes required. In the second stage, the design attributes form the basis for actions that the firm needs to take to achieve these attributes. The actions identified at this stage are basis for third staging arriving at the specific decisions to be implemented. In the fourth stage the implementation decisions drive the process plan to be deployed.
• Value Engineering: Value Engineering refers to a set of activities under taken to investigate the design of components in a designing process strictly from cost-value perspective. Typically, the design professionals brain storm various options in conjunction with procurement, personnel, suppliers and production personnel, with respect to the value-cost dimensions of the product being designed. Usually several questions are addressed, which include the following: (i) Can we eliminate certain features from design? (ii) Are there instances of over design of certain components increasing the cost? (iii) Are there certain features of design that cost more than they are worth? (iv) Is it possible to replace the proposed method of manufacture with less costly ones? (v) Is it possible to outsource some of the components? (vi) Can we eliminate some parts and replace them with standard parts? (vii) Are there opportunities for cost cutting by developing import substitution methods?
• Design for manufacturability: Design for manufacturability (DFM) is a structural approach to ensure that manufacturing requirements and preferences are considered fairly early in the design process without the need of extensive coordination between the two. DFM guidelines address three sets of generic requirements:
• Reducing the variety: (i) minimize the number of parts (ii) minimize subassemblies
(iii) avoid separate fasteners (iv) use standard parts when possible (v) design parts for multi-use (vi) develop modular design (vii) use repeatable and understood processes
• Reducing cost: (i) analyze failures (ii) assess value rigorously • Considering operational convenience: (i) simplify operations (ii) eliminate
adjustments (iii) avoid tools (iv) design for minimum handling (v) design for top-down assembly (vi) design for efficient and adequate testing.
• Tools for mass customization: Mass customization provides a structural set of ideas and tools to provide high levels of customization without increasing the complexity of planning and control operations .The various tools and techniques of mass customization are (i) Employ some variety reduction techniques (ii) Promote modular design, The advantage of modular design is that with fewer subassemblies (or modules) it will be possible to create very large number of final products. (iii) Make use of the concept of product platform. A product platform is a collection of assets that are shared by a set of products. These assets can be components, including parts, designs, fixtures and tools or manufacturing processes for manufacturing or assembly.
---------------------------------------------------------------------------------------------------------------- 3.4 DESIGN OF SERVICES ---------------------------------------------------------------------------------------------------------------- Design of services involve the same stages as the design of products .It begins with identifying consumer needs and developing a service concept that fulfills the needs. When the Federal Express saw the need for fast, dependable shipping services, they developed a new delivery system that features private ownership, a limited range of services, and a complete pick-up-process delivery cycle that emphasizes convenience and nationwide accessibility detailed design of its services design. Identifying the concept led to and unique processing technologies (including equipment, human resources, and procedures), and continues today with refinement and redesign of services. Although the generic steps may be the same, there

44
are some significant differences between product and service design. Services that do not include physical component do not require the engineering, testing, component analysis, and prototype building of the product design. Further along in service design, the process technology involves different issues and considerations than those for products, primarily because the client or consumers are present in the conversion process. Process technologies for services are at least as diverse, and perhaps more so, than product process technologies. Services vary in the amount of customer contact and in the intensiveness of labor versus capital. Service process technologies vary accordingly. ---------------------------------------------------------------------------------------------------------------- 3.5 FLEXIBLE MANUFACTURING SYSTEMS ---------------------------------------------------------------------------------------------------------------- Batch manufacturing has always had inherent limitations on account of mid-volume, mid variety nature of manufacturing. Work- in- process levels are generally high and machine utilization tends to be low. Job spend a high proportion of time waiting for machine to be set up, waiting to be moved or waiting for other jobson the machines to be completed. Batch production often requires an army of expeditors, progress chasers to keep jobs flowing through the manufacturing facilities. In batch type manufacturing, some studies conducted revealed that only 5 percent of the total time spent on the shops unnecessary waiting of jobs and so on. One way to improve productivity is to use technology to obtain a better process. These requirements could be met with the aid of computers and numerical control techniques using the basic concepts of Flexible Manufacturing Systems (FMS) Job shops are designed to produce a variety of products. They usually tend to have low production rate, high manufacturing lead time, more WIP, and more inventories of finished goods. On the other hand, flow shops are designed for mass production. Consequently, they are less flexible to change. The change over a period of time is very high, as it involves redesigning of template, cam switches, dies; fixtures etc. FMS is a combination of job shopped flow in the sense that a limited variety with reasonably quick changeover time is possible. An FMS is a manufacturing system that actually consists of numerical control (NC) machines connected by an automated material handling system. It is operated through central computer control and is capable of simultaneously processing a family of parts with low to medium demand, different process cycles and operation sequences. We can characterize the typical features of FMS as follows:
• It is an attempt to solve the production problem of mid-volume and mid variety parts for which neither high production rate transfer lines nor highly flexible stand-alone NC machines are suitable.
• It is designed to process simultaneously several types of parts in the given mix. • It is equipped with sophisticated flexible machine tools that are capable of processing
a sequence of different parts with negligible tool change over time. • Parts are transferred from machine to machine by Computer controlled machine
handling system. • It consists of three subsystems (i) the machining system (ii) the material handling
systems (iii) the control system

45
FNS technology results in the reduction of direct and indirect labor force. With the level of automation that is employed in the subsystem, it is possible for a worker to attend to a group of machines in the system. The following is the role of human labor in the FMS:
• loading and unloading,, tool set up, tool replacement, work piece set up off-line • Maintenance of the system, multi-task monitoring (3to8 machines) • Supervision of the overall system taking decisions using the information supplied by
the computer system. The technologically advanced features of the FMS, in part, simplify process designs and complexities in flow in an intermittent flow system in batch manufacturing by offering the following flexibilities;
• Machine flexibility • Process flexibility • Routing flexibility • Volume flexibility
---------------------------------------------------------------------------------------------------------------- 3.6 PROCESS DESIGN ---------------------------------------------------------------------------------------------------------------- At the product conception stage, manufacturing proposes investigates processes and concepts. When the product concept has been finalized, the role of process management then is to develop cost estimates, define process architecture, conduct process simulation and validate suppliers. Concurrently with the detailed product design, process management is involved in the designing of the process, designing and developing tooling and participating in building full-scale prototype. At the time the product development teams are developing the prototype, the process management teams test and try out tooling and equipment; help build second-phase; an assembly line is a prototypes; install equipment and specify process procedures. This is followed by building pilot units in commercial process; refining process based on pilot experience, training personnel’s and verifying supply channels. Finally at the release of product, process management has to ramp up plan to volume targets, meet targets for quality, yield and cost. /The analytical work of process planning can be divided into two classes:
• Process analysis, • Operation analysis
Process analysis: is governed by the main process decisions namely, capital/labor intensity, outsourcing, resource flexibility and volumes. These four decision areas represent broad strategic issues that have to decide prior to finalizing the process design. It is concerned with the overall set of operations constituting the process. Process analysis is not directly concerned with the content of operations constituting the process, or with the detailed method of carrying out the operations. It comes out with recommendations for primary (work station) and secondary equipment (accessories) required for the most effective and efficient production of the products and work flow. The process analysis decisions are reflected in a route sheet. A route sheet normally specifies the sequence of operations in a process by name and numbers. A rout sheet is prepared for each component. Operation Analysis: Once the process analysis decisions are taken management has to determine exactly how each process will be performed. This is called ‘operation analysis.

46
Operation analysis is concerned with the work content constituting the operation and method of performing the work, given the resources allocated to the process. Similar to process analysis, operation analysis generates an operation sheet. It specifies the steps and elements of work for each operation. These are specified in a proper sequence. Together with the route sheet and operation sheet provide all the information required to perform a process effectively and efficiently. ---------------------------------------------------------------------------------------------------------------- 3.7 TYPES OF PROCESSES ---------------------------------------------------------------------------------------------------------------- There are different ways to categorize a process. They can be categorized on the basis of orientation, e.g. market orientation or manufacturing process; they may also be categorized on the basis of the production methodology or customer involvement. The various typeset processes are given below: Processes by Market Orientation: There are four types of processes based on market orientation:
• Make to stock-The goods usually are standard, mature products. As a general rule make to stock products compete primarily on the basis of cost and availability. Example of such products includes most retail goods.
• Assemble to order-products are standard items that are assembled from in stock subassemblies. This allows customers to specify a wide range of options.
• Make to order- are made from previously designs, but are made only after an order has been received. Make to order products are used when the standard product is too costly to stock, have too uncertain demand, or will deteriorate if stocked on shelf.
• Engineer to order-This market orientation is used to make unique products that have not been previously engineered, Extensive customization to suite the customers’ need is possible but only if customer is willing to wait for this addition stage in the value creation process.
Processes as production systems: A production system refers to how an organization organizes material flow using different process technologies. There are five types of production systems:
• Projects: These are one-off projects. It is based on extensive customization that is suited to the customer’s ‘need. Many construction projects, project management contract, shipbuilding and civil engineering projects fall in this category.
• Job shop: Construction is characterized by processing of small batched of a large number of products, most of which require a different set or sequence of processing steps. Production equipment is mostly general purpose to meet the specific customer orders.
• Batch production: Production is in discrete parts that are repeated at regular intervals. Such a structure is generally employed for relatively stable lines of products, each of which is produced in medium volume.
• Assembly Line: It is a mass production process. On assembly line, production follows in a predetermined sequence of steps which are continuous rather than discreet. The product moves from work station to workstation at a controlled rate following the sequence needed to build the product.

47
• Continuous flow: It is common in the food processing industry, and in industries involving undifferentiated materials. Most bulk products are manufactured using continuous flow production; generally, on-line control and continuous system monitoring is needed.
Cell Manufacturing (Group Technology): A cell is a self sufficient unit, in which all operations required to make components or complete products can be carried out. It is like mini factory within the factory, which is managed by a cell team. Cell layouts can be U-shaped or s segment of a line allowing self organizing, multiskilled group of fewer people to manage the operations Flexible manufacturing systems (FMS): Already explained earlier. Process and customer involvement: Many processes are designed keeping in mind that value is provided by involving the customer in the delivery of the final product. The involvement may range from self service to the customer by deciding the time and place where the service is to be produced. Business organizations are increasingly attempting to involve their customers in the product design by providing them different options for customization. They engage in an active dialogue with customers using new changing technologies. Customers are increasingly becoming partners in creating value. The customers can now decide the time and location where the service or product is to be delivered. Making Economic Decisions: Engineering economy is the discipline concerned with the economic aspects of engineering. It involves the systematic evaluation of the costs and benefits of proposed technical projects. In reality, any engineering project must be not only physically realizable but also economically feasible. For example, Maruti Udyog has decided that the weight of the Maruti 800 was a critical requirement of the design. How do you choose between plastic composite and steel sheet stock for the auto body panels? The choice of material will dictate the manufacturing process for the body panels as well as manufacturing costs. Some may argue that because the composite body panels will be stronger and was looking for a car that would be low cost so that it could tap the higher end of the two-wheeler users. It also had to take into account that:
• The customer may not believe that plastics will provide a stronger body option than steel panels, and may not be willing to pay more, and
• A maintenance man may not believe that it is easy to repair composites, and therefore repair and maintenance will cost more.
One might suggest that the above arguments are ridiculously simplistic and that common sense would dictate choosing steel sheets for the framing material. Although the scenario is an exaggeration, it reinforces the idea that the economic factors of a design weight heavily in the design process, and that engineering economy is an integral part of that process, regardless of the engineering discipline. The focus on economic cost and engineering costs of new product development has great importance. Each different technical solution to a problem constitutes an alternative. Each alternative requires different level of resources to build and causes different levels of resource

48
to be expended. Thus trade-offs must be made during the design of engineered systems. Engineering economy selects the best alternative based on design for the theme.
• Why do this at all? • Why do this now? • Why do it this way?
An engineering cost analysis, in its simplest form, may be no more than a spreadsheet listing the phases found in the product concept through product realization cycles on one axis and identifying the many functional areas, costs, or even software tools on the other.
• In its second generation form, engineering cost analysis software will approximate the costs associated with each phase of the product development realization cycle.
In its ultimate form, the engineering cost analysis will include and improve upon all of systems engineering's current discrete event optimization functions; but, more importantly, it will extend forward in time to include accurate estimates for various design, material, and process selection options. In some instances, it may also include the determination of the optimum product concept to satisfy the intended customer's needs and cost constraints. Figure 3.1 provides a glimpse into the various inter-connections within the operations function that need to be taken into account in a properly designed engineering cost analysis.
Figure 3.1 Second Generation Engineering Cost Analysis As a rule of thumb, 70 per cent of the cost of the product or service is firmed up by the time the conceptual design has been completed. By the time the system definition is completed, 80 percent of the cost is finalized and 90 percent of the cost is firmed up before production. For example, the geometrical shape of a part or assembly determines the subsequent manufacturing processes by which it may be manufactured. This, in turn, limits the materials to just those few that are suitable for those processes.

49
Figure 3.2 Locking of Product Costs and Design.
The impact of the design process on costs shows how costs are firmed up and it will be seen that the majority of cost reduction opportunities are lost prior to the actual production." These decisions are difficult because there is no guarantee for success. Two out of three new products fail after launch. Therefore, the key observations on product development recommended by the expert committee on Bridging Design and Manufacturing set up by the National Research Council, U.S.A., after a series of hearings from industry, in February 2003, should be of great interest:
• Continue the early collaborative exploration of the lifecycle, including manufacturing, logistics, time-phased requirements, and technology insertion.
• Perform assessments based on modeling and simulation early in the development cycle alternative system designs built, tested and operated in the computer before critical decisions are locked in and manufacturing begins.
• Wait to develop designs until requirements are understood. • Requirements are the key. Balance them early! • Once the design is drawn, the cost and weight are set. • No amount of analysis can help a bad design get stronger or cheaper. • Remember that 80percent of a product's cost is determined by the number of parts,
assembly technique, manufacturing processes, tooling approach, materials and tolerances.
Measuring Costs and Identifying Waste: Operations Management is interested in enhancing value. Cost reductions often translate directly into increases in value if they out weight changes in performance. Like the other inputs to the value equation, the costs are composed of a variety of different elements. For example, the costs relevant to the purchase decision could include one or more of several categories. • Acquisition cost : The purchase price of a car, for instance. • Repair costs : The cost of replacing a broken part. • Maintenance costs : The cost of oil changes and tune-ups. • Operating costs : The cost of gas & tyres. • Salvage/resale costs : The cost recovered on selling a car. • Disposal costs : The cost of disposing of a wrecked car.

50
Furthermore, managers can breakdown cost to express them quantitatively or qualitatively. A major problem in much corporate accounting system has been that the overhead costs are precisely applied to the products that they support. Effective performance measurement requires such products to bear its fair share of all costs incurred to create, make, sell, and service. Direct costs pose no major problem; managers simply record all the labor, material and other resources used by a product. However, assigning overhead costs become more difficult. Unlike direct costs, these costs seldom vary with changes in output. “Marketers know well that people like to buy things cheaply, but do not like cheap things,” This statement describes both major attractions and the problem of emphasizing cost vas the firm’s major source of value. Customers want at least the same performance for lower cost; not simply less for less. A cost driven approach to value treats performance as a given and focuses on reducing cost. For example, this approach has been successful in Bajaj Auto. It has been successful in inculcating a concept in its workforce of lower costs means better quality. The firm should be able to measure customer satisfaction, to evaluate customer service costs. It is cheaper to keep a good customer happy than to win one of your competitor’s good customer. Customer satisfaction can be measured by the use of the concept of lifetime value of a customer, which is an estimate of the stream of income a firm can expect to receive from a satisfied good customer. This is a useful concept in that, like value, it forces all within a system to focus on keeping customers satisfied and coming back. Operations management system must examine both the product it is selling and the processes it uses to deliver and service the product, to achieve this objective. It should identify product features that customers do not value highly or processes or parts of processes that contribute unnecessarily to cost. Activities that do not add value are waste, if they don’t support activities. Unnecessary product features they don’t add value are waste—these need to be eliminated. Using a waste reduction approach helps reduce the excessive emphasis on cost reduction. Cost reduction programs that ignore the negative effects on lead time, flexibility and quality will not enhance a firm’s competitiveness in the long run. For example, affirm that uses cheaper material that reduce the quality to lower costs may save money in the short ten. However, over the long haul, they reduce the ability of the firm to deliver a product consumer value. They may buy the product once, but not thereafter. New Product Development and Economic Cost: The design of a system or product involves the principal task of evolving a form that can support the functions required by the system or product. The design must be optimized with regard to cost, technical requirements and value consideration of the customer. The challenge is to use resources wisely. This has given rise to a number of techniques and created a number of tools that are being practiced in industries , focused to provide the greatest value of the product to the consumers and optimize the production process and capacity, Of the various techniques developed , the best known are the following; Design for Manufacturability /Design for ‘X’ Value Engineering /Value Analysis Both these techniques have been discussed elsewhere in this course pack, but to make the concept clear in the new product development both the techniques are discussed here;

51
Design for Manufacturability (DFM)
• DFM is the process of designing a product for efficient production while maintaining the higher level of quality
• It is intended to avoid more complex and expensive product design to simplify assembly operations.
Figure 3.3: The DFM process
The flow chart for DLM process is given in Figure 3.3. Some guidelines to determine whether the design is good enough are given below;
• Minimize the number of parts. • Develop a modular design • Design parts for multi use • Avoid separate fasteners • Eliminate adjustments • Design for top down s\assembly • Design for minimum handling • Avoid tools • Minimize subassemblies • Use standard parts when possible • Simplify operations • Design for efficient and adequate testing • Use repeatable and understood processes. • Analyze failures • Rigorously assess value
DFM is a team based approach that involves everyone associated with the development process. DFX—Design for ‘X ‘DFX is a special case of DFM, where a certain area say X is selected for attention. Improvement in ‘X’are proposed after detailed analysis of the process by a team of cross functional experts. The performance measures are established and items

52
are identified that will simplify the process and at the same time provide value to the customer. An example is of Escorts Ltd. a company that was making heating elements for electrical kettles. The holder that screwed on the element to the kettle was made of casting. The casting had to be pre-machined, sized, cut and turned before it was ready for threading. The technical requirements were not critical, as the function of the part was to protect the consumer from the contact with electrical contacts and guide the external socket to the corresponding part of the heating element. Standard tube was found that met the dimensional requirements for the component. This greatly simplified the process, avoided a number of operations. Reduced the number of parts, and also reduced costs Value Analysis / Value Engineering: What provides value to the product? A way to consider the customer’s view in designing products is by analyzing the value they see in the end product. It is important that the value is designed into the products. Value Engineering is an organized creative technique directed at analyzing for the functions of a product, service or system with all the requirements, which comprises its value. Such as performance, reliability, maintainability, appearance etc. Value, in general, is defined as the ratio of the function and cost. It reflects what the product, service or system accomplishes and at what cost. Thus; Value= Function / Cost Where ‘function’ is expressed as units of performance and ‘Cost’ is expressed as a monetary unit. Value engineering is used as a generic term and generally includes value analysis. The purpose of both value analyses (VA) and value engineering (VE) is to simplify products and processes. VA specifically deals with products already in production and is a cost reduction technique. It is used to analyze product specifications as shown in production documents to achieve similar or better performance at a lower cost while maintaining all functional requirements defined by the customer. Value engineering is performed before the production stage and is considered a cost avoidance method. Value engineering starts with the classification and identification of a product, service or system. The function of a product, service or system is identified. Each function is evaluated and compared. The process involved in value engineering is as follows:
• Step 1: Identify each of the functions of the product or service and list them down. • Step 2: Give a weight to the importance of each function, such that the total of the
weights come to step 1, rearrange the functions on the basis of their importance. • Step 3: Identify each of the components in the product or service and list its function • Step 4: The functions of components have to be related to the product and the
function of the product. Each component will have to given weight to show how it contributes to the function of the product or service. There may be some components that have more than one function. This should be taken into account
• Step 5: Identify the cost of each component and convert it to a weight corresponding to the total cost so that the total of the weights does not exceed ‘1’, just as in step 2.
• Step 6: Compare the weights of the functions with the weights of the costs of each component
• Step 7: Identify those components where the ratio of Function / Cost is low.
53
The VA/VE analysis approach involves taking these identified components and brainstorming with such question as;
• Does the item have any design features that are not necessary? • Can two or more parts be combined into one? • How can we cut down the weight? • Are there nonstandard parts that can be eliminated?
---------------------------------------------------------------------------------------------------------------- 3.8 MODERN PRODUCTION TECHNOLOGIES ---------------------------------------------------------------------------------------------------------------- Manufacturing management practices have undergone significant evolution during the course of 20th century. The culmination of these is the guiding principle of excellence in manufacturing. The oil crises in 1973 followed by recession affected governments, businesses and business world over. By 1974, Japan’s economy had collapsed to a state of zero growth and many companies were suffering. But at Toyota Motor Company, although profits suffered, greater earnings were sustained in 1975, 1976 and 1977 than at other companies. The widening gap between it and other companies was because the production system followed at Toyota was different from conventional production systems which were followed in other companies. This has now been popularly known as ‘Toyota Production System (TPS). The basis of Toyota Production system is the absolute elimination of waste. The two pillars needed to support the system are:
• just –in- time • Autonomation or automation with human touch.
Just-in-time means that, in a flow process, the right parts needed in assembly reach the assembly line at the time they are needed and only in the amount needed. A company establishing this flow throughout can approach zero inventory. From the standpoint of production management, this is an ideal state. However, with a product made of thousands of parts, like the automobile, the number of processes involved is enormous. Obviously, it is extremely difficult to apply just-in-time to the production plan of every process in an orderly way. The earlier investment in Toyota Production System (TPS) was mostly in the areas of quality. A very body of knowledge, tools, techniques and special procedures were developed to effectively address the quality-cost trade off. The core philosophy of JIT is to provide an organizational framework to continuously reveal opportunities for elimination of non-value added activities IT systems have brought to the limelight the distinction between value-added and non-value added activities . If due to poor design of the factory layout, jobs travel a few kilometers before being converted into saleable products, customers may not be interested in paying for the excess transportation. Just –in time requires a great deal of organizational discipline J IT requires not only changes in the way a company handles its inventory but also changes in its culture. JIT is a manufacturing system whose goal is to optimize processes and procedures by continuously pursuing waste reduction. The following seven types of waste identified by Shigeo Shingo are as follows:
• Waste of overproduction • Waste of waiting • Waste of transportation • Waste of processing itself

54
• Waste of stocks • Waste of motion • Waste of making defective products’
These seven wastes are targets for reduction through continuous improvement in the production system. Maintenance Planning and Control: Equipment is an important resource which is constantly used for adding value to products. So, it must be kept at the best operating condition. Otherwise there will be excessive down time and also interruption of production if it is used in a mass production line. Poor working of equipment s will lead to quality related problems. Hence it is an absolute necessity to maintain the equipment in good operating conditions with economical costs. Hence, we need an integrated approach to minimize the cost of maintenance. Maintenance is any action that restores failed units to an operational condition or retains non failed units in an operational state or an activity carried out for any equipment or asset to ensure its reliability to perform its functions. The objectives of maintenance are to maintain equipments and facilities in such conditions that:
• They give trouble free service and output at rated capacity. • Safety is ensured. • Down time is minimized. • The cost of operations and maintenance is minimized.
The maintenance function plays a supporting role to effective operations. It ensures that the equipment is able to maintain quality standards, as well as the quantitative and cost standards of outputs. Maintenance activity can be classified into four types;
• ,Break down Maintenance • Preventive Maintenance • Predictive Maintenance • Proactive Maintenance
Breakdown maintenance is totally reactive maintenance is only activated on breakdowns. The goal of corrective or breakdown maintenance is
• To restore the faulty equipment to a healthy operating state as promptly as possible, • To do this in as cost effective manner
Preventive maintenance (PM) is the periodical inspection and service activities which are aimed to detect potential failures and perform minor adjustment in repairs which will prevent major operating problems in future.
Predictive maintenance depends on the ability to measure asset health and extrapolate this information in order to predict the moment that the assets will fail to fulfill the function. It is condition based approach to maintenance.

55
Proactive maintenance concentrates on its monitoring and correction of root causes to equipment failures. This strategy is designed to extend the useful age of the equipment to reach the wear-out stage by adaptation to high level of operating precision. ---------------------------------------------------------------------------------------------------------------- 3.9 PROCESS RE – ENGINEERING ---------------------------------------------------------------------------------------------------------------- Re engineering is the fundamental rethinking and radical redesign of the process. Reengineering is about reinvention, rather than incremental improvement. Reengineering relies on a different school of thought than does continuous improvement. In the extreme, reengineering assumes that the current process is irrelevant-it doesn’t work,. It’s broke, forget it. Start over. Such a clean slate perspective enables the designers to focus on a new process. Michael Hammer and James Champy had suggested seven principles of reengineering to streamline the work process and thereby achieve significant levels of improvement in quality, time management and cost:
• Organize around outcomes, not tasks, • Identify all the processes in an organization and prioritize them in order of redesign
urgency, • Integrate information processing work into the real work that produces the
information, • Treat geographically dispersed resources as though they were centralized, • Link parallel activities in the workflow instead of just integrating their results, • Put the decision point where the work is performed and build control into the process, • Capture information once and at the source.
Companies can determine which business processes need to be reengineered by working backwards from the customer to determine how best to meet the customer needs. The company needs to believe that in order to survive; it is going to have better and better at delivering quality products to customers. Introduction of new materials, the advent of new machines and tooling and the improvement of processing and handling methods are more or less continuous phenomenon. These changes can result in improved processing, cost reduction and improvements in productivity. They can pay big dividends if incorporated in ongoing process. Michael Hammer and James Champy in their book “Reengineering the Corporation,” observed this phenomenon. They promoted the idea that sometimes radical redesign and reorganization of an enterprise was necessary to lower costs and increase quality of service. Organizations must pay attention to all avocets of their operations, including people, products, processes and materials. They should co duct an assessment and planning step that results in an action plan designed to achieve breakthrough performance improvement in cycle time, quality and cost, and customer satisfaction.

56
----------------------------------------------------------------------------------------------------------------3.10 REVIEW QUESTIONS ----------------------------------------------------------------------------------------------------------------
1. Discuss the concept of product development. Explain various steps in product development.
1. Explain with examples the various design tools used while designing. 2. How is design of services different from design of product s? 3. Discuss the advantages and disadvantages of flexible manufacturing systems. 4. Name some types of the processes. 5. Explain the concept of Toyota Production System. 6. What is process reengineering, explain the advantages of reengineering?

57
---------------------------------------------------------------------------------------------------------------- CAPACITY DESIGN ---------------------------------------------------------------------------------------------------------------- Structure 4.1 Introduction 4.2 Capacity Management 4.3 Economies and Diseconomies of scale and Learning Curve 4.4 Capacity Strategies 4.5 Decision Trees 4.6 Review Questions ---------------------------------------------------------------------------------------------------------------- 4.1 INTRODUCTION ---------------------------------------------------------------------------------------------------------------- The creation of capacity means committing financial and other resources to it mostly on substantial basis. It is an investment decision. It brings out the operational strategy of an organization. In services of organizations, it means creation of more space, furniture, and other accessories and equipment. Planning for capacity is in response to the future growth and expansion plans, market trends, sales forecasting, multiple scenario analysis and our policy towards risk capacity planning decisions has to decide a centralized capacity at one geographical location or decentralized decision of plants at several locations, Some other considerations also affect capacity decisions. How to tide over a temporary deficient in capacity by operating additional shifts giving over-time or holiday work? How best we should satisfy the market demand either the demand to be fully met or can we allow some lost sales? All these factors are a part of capacity planning. What is Capacity? A dictionary meaning of Capacity is the ability to hold, receive, store, or accommodate. The capacity is also defined as the maximum output of a system in a given period of time under ideal conditions. Thus the annual capacity of Bajaj is seven lacs scooters currently. It means the production is limited to this productive capacity over a period of time, here a year. The capacity however is subject to the intensiveness of use of the facilities. Imagine a transformation process having many sub processes, each of these interlinked. Here capacity’s is determined by the capacity of that sub process which produces the least. If we want to upgrade the capacity, we can do so by balancing the equipment to create a better balance amongst the processes. The concept of capacity is thus invariably connected with the weakest link in the chain. This means that even when the capacity is fully utilized in terms of definition of capacity, there may be individual processes that may remain underutilized ---------------------------------------------------------------------------------------------------------------- 4.2 CAPACITY MANAGEMENT ---------------------------------------------------------------------------------------------------------------- Management of capacity basically involves capacity planning, balance between various issues against economic advantages and disadvantages and its proper utilization_, before discussing the planning and management of capacity let understand the process of measurement of capacity.

58
Process of Measurement of Capacity: To estimate capacity one should first select a yardstick to measure it. The first major task in capacity measurement is to define the unit of output. In some cases, the choice is obvious, for example. RIL set up capacity to manufacture250, 000MT of polypropylene and 160,000MT of polyethylene at Hazira plant. This measures the output of end products. Another example is megawatt-hours of electricity for a power generation utility. Finding a yardstick to estimate capacity is more difficult in many service industries where there is no uniform product on which the measurements can be based, e.g. , airlines, hospitals, restaurants etc. However, measures can be devised to assess capacity. For example, airlines can use seat-mileage as a measure of capacity. A hospital can measure capacity as bed-days each year. In a restaurant, this might be the number of customers that can be handled per day. In a process focused facility, capacity is often determined by some measure of size, such as number of in a hospital, seating capacity in a restaurant, etc. In repetitive process, the number of units assembled per shift, such as number of refrigerators may be the criterion for capacity. And in product focused facility, such as TISCO, tones of steel produced per shift may be the measure of capacity. Whatever the measure, the capacity decision is critical to the management of an organization because every thing from cost to customer service is measured on the basis of capacity of the process, once the capacity is determined. In general, capacity can be expressed in one of the two ways:
• Output measures • Input measures
Output measures are the usual choice for high volume processes. Maruti was set up to manufacture 100.000 passenger cars per year. This type of capacity measurement needs to be taken with some caution. The Maruti plant produces many types of vehicles on a single plant. As the man-hours required producing the different models are not identical. Maruti may be able to manufacture 125,000 vehicles if it only produced Maruti 800, 110,000 vehicles if it produced the Omni and 85,000vehicles if only produced Gypsy. The 100,000 number is an average number to make the capacity measurement easy. As the amount of customization and variety in the product mix increase, output-based capacity measures become less useful. Output measures are best utilized when the firm provides a relatively a small number of standardized products and services, or when such measures are applied to individual processes within the overall firm. Let us take another example. We could say that a plastic goods unit turns out plastic goods. Can we, therefore unambiguously make a statement of the capacity as the weight of the processed output or number of plastic goods unit period. Though, the capacity of plastic unit can be expressed as weight of plastic processed, it would not be accurate because the number will differ according to the mix of products being made. A change in product mix will usually mean a change in capacity also. Also, as there are a variety of plastic goods, coming in different shapes and sizes, the number may not be a good measure. Finally, the decision has to be based on judgment or industry practice Input Measures are generally used for low volumes, flexible processes, For example, in a machine shop; capacity can be measured in machine hours or number of machines, Demand,

59
which invariably is expressed as an output rate, must be converted to an input measure. This conversion is required to compare demand requirements and capacity on an equivalent basis. Capacity then may be measured in terms of inputs or outputs of the conversion process. However converting demand into output measures may be quite difficult .In a general business sense, capacity is most frequently viewed as the amount of output that a system is capable of achieving over a specific period of time. Capacity Planning: One of the functions of capacity management is capacity planning. Capacity planning is the study of the level of capacity the organization provides at each stage of production, or service delivery system to meet its objectives. Capacity planning is a long term strategic decision that establishes a firm’s overall level of resources. The decisions are strategic because they often commit the resources of the organization for long periods .For example, Reliance’s decision to put up an ethylene cracker required an investment of hundred of crores of rupees. Similarly, large investments are required to build a refinery, or a caustic soda plant. As these expenditures are usually for fixed assets (plant and equipment) they are extensive to sustain or even more expensive to change. Capacity decisions affect product lead times customer responsiveness, operating cost and firm’s ability to compete effectively with the competitors. They also impact the survival of the firm; too much capacity can result in low return on assets, low morale, damaging lay-offs and facility closures (which are often expensive); while too little capacity can result in lost sales; , high operating cost and result in erosion of customer loyalty. From the economic point of view, capacity planning is focused on the level of capacity that we provide at each stage of production or service delivery systems. It relates to planning decisions on total assets employed by the firm. The management should invest in assets up to the point that marginal efficiency or productivity of capital employed equals interest rate. Time Horizon in Capacity Planning: Capacity planning issues vary markedly with respect to the time horizon in which the decisions are made. It is useful to divide the time horizon into long-term, medium –term and short-term to understand the nature of issues to be addressed with respect to capacity planning in table 9.1 illustrates the salient features of capacity planning under the three time horizons. In the long term, the emphasis in capacity planning is on making the right amount of capacity available to meet the projected growth. Typically, organizations initially make a certain investment of capacity. However, as operations stabilize and market share increases, firms need to take decisions in advance to plan for augmenting capacity. These options differ in the amount of additional capacity that is brought into the system and the cost and technological aspects of capacity build-up. De-bottlenecking is a commonly employed method in process industries as it is easy to identify the flow and bottleneck points in the system. Capital budgeting exercises are an integral part of the decision – making process at this stage Further, addition in capacity is likely to shift the breakeven points as fixed costs in the system go up. Therefore, it is also common for management accounting professionals to work on the breakeven points as fixed costs in the system go up. Therefore, it is also common for management accounting professionals to work on the breakeven impact of capacity augmentation decisions. Operations and maintenance personal plan in advance for the installation of additional capacity and dovetailing the new equipment with the existing system.

60
Nine sources of waste: The Japanese concept to the sum of work and waste is a simple yet powerful method for capacity management. A manufacture of auto components has a hydraulic system that contains master cylinders. The master cylinder is manufactured using as set of six machines. The installed capacity of the master cylinder manufacturing facility was 32,000 per month. However, for a variety of reasons, the maximum production achieved was in the range of 70-75 % of the installed capacity. A study was initiated to understand how capacity realization could be improved without any major investment in additional machines. The underlying philosophy behind the exercises was to estimate the various sources source of waste, as proposed by the canon productivity system. The table below shows some of the findings and major sources of waste. The study highlighted two major areas of waste: materials and equipments usage. The waste due to start-up also pertains to equipments usage. Based on this study, additional studies were initiated to understand the nature of wastages pertaining to use of the equipment. The study showed how poor planning of operations and very long set up times were resulting in high idle time of the machines. The maximum set up time was found to be 16 hours, which converted the machine into the bottleneck.
SOURCES OF WASTE AMOUNT (RS. LACS) Waste due to human resources 19.55 Waste due to materials 215.27 Waste due to operations 14.71 Waste due to start up 52.35 Waste due to equipment 126.96 Total of the above 430.84 Divisional turnover 1359.03 Waste as a percentage 31.70% Set up time reduction exercises were carried out on the bottleneck machine as well as on the other machines. After a two months study and implementation of simple improvements in equipments usage and set up time procedures , the maximum set up time came down to less than 3 hours . As a result of these efforts, the actual production of master cylinders shot up to nearly 90% of the installed capacity. This experiment clearly established the usefulness of the simple yet a profound equation capacity = work +waste In the medium –term , the focus in capacity planning shifts to balancing available capacity with demand .In the medium –term ,firms have some opportunities for limited capacity augmentation by increasing the usage of existing capacity through overtime and introduction of an additional shift . Further, by sub contraction part of the work to outside vendors, some capacity inadequacies can be handled on a temporary basis. It is also possible for firms to modify the demand by shifting it from a peak period to a non-peak period .Several methods is available for capacity planning using the above options. These methods are often as aggregate production planning. Capacity planning in the short-run is very different from the other two that we discussed above. In the short-run, the maximum available capacity is fixed. Therefore, the capacity planning exercise in confined to making effective use of the available capacity planning methods do not lead to keeping the capacity idle. The focus in capacity planning in the short-

61
run is no maximizing resource availability and efficient use of the resources. Several operations management tools are available to manage capacity in the short-run. These include planning and scheduling methods and maintenance management methods. Waiting line models are a generic class of tools used to analyze capacity issues in both service and manufacturing firms. Similarly, a detailed analysis of the impact of capacity on the working of the system can also be studied using simulation modeling of the system. Capacity Planning Framework: A capacity planning exercise is initiated in response to several scenarios that an organization faces from time to time. However, two of these are more common. First is the changing market condition leading to an increase in demand of the products and services that a firm offers? Due to increased demand, the capacity becomes inadequate and calls for a detailed computation of the new requirement. Moreover, since capacity additions are done over longer intervals, an estimate of the future capacity planning exercise is the strategic decision taken with respect to introduction of new products and new markets. In this situation also there is a need to revisit the capacity issue. Irrespective of the context a capacity planning framework consists of three important steps (figure 4.2.1). First, a careful estimation of the current and future capacity requirements is to be made. Once the capacity requirements are known, it becomes relatively easy to perform detailed computations and identify bottleneck points in the system. This constitutes the second step. In the final step, available alternatives are to be enumerated as well as some of the tools and techniques to be used, to evaluate the alternatives and select the best one. All these steps are described in details below.
Fig. 4.1 Capacity Planning Framework Estimating Total Requirement:-Estimation of capacity requirements begins with inputs from a forecasting exercise if the intent of the capacity planning exercise is to respond to imminent and future growth projections in the market. There are several techniques available for forecasting, which an organization can use to estimate the end product or the service offered. Capacity planning exercises typically make use of medium term and long term demand projection methods. These exercises use past data collected at the end user level and systematically aggregated in the hierarchy before being analyzed and projected into the
Estimate the capacity requirements for the planning horizon
Compute the available capacity and identify quantum of capacity to be augmented
Identify available alternatives and select the best one for capacity augmentation

62
future. Once the projections for the end product sales are forecast, then detailed capacity computations can be done at individual facilities in the plant. On the other hand, estimation of capacity requirements can also be in response to some targeted capacity build up in the factory. For example, the medium voltage circuit breakers manufacturing facility of ABB at Nasik decided to increase the capacity of its plant by 1997. In this case, the capacity requirements are computed to meet the revised target. Once the end product requirements are estimated using appropriate techniques, estimating capacity requirements and matching them with the availability calls for detailed computations at the individual resource or division level. Labor and machines are the two major resources for which capacity planning is required. Therefore, capacity calculations are done on the basis of man hour and machine hour requirements per unit of product manufactured. Estimating Labor and Machine Requirements: The computation of the labor requirements depends on two major factors, the amount of standard labor hours required per unit of the product and the efficiency of the labor. Let the Projected demand per unit time during the planning horizon =D Standard labor hours required per unit of product =SL Efficiency of labor =EL D x SL…………Equation 1 Then the capacity requirements (labor) = EL
Although the above computation appears simple, in reality, estimating SL and EL has certain operational difficulties. The standard labor hours are supposed to be established by a standard setting routine in every organization. This will call for studying each and every process, estimating normal allowances and incorporating them. Further, as the process is put into practice, some assumptions are required about the efficiency of the workers. The efficiency is likely to be somewhat low during the initial stages. However, as the employees experience learning curve effects, the efficiency of the process improves, thereby calling for a revision of these standard labor hours. Despite this, revisions are not done as frequently as the process warrants. This is because the earning potential of the employees is inextricably linked to standard hours and efficiency assumptions. By keeping the standards loose and efficiencies low, it is possible for some workers to earn productivity bonus even for normal work. Due to these reasons, in a vast majority of industrial organizations, SL and EL have an industrial relations angle as well. In recent years, however, the notion of productivity and the manner in which employees are rewarded for good performances in productivity are not linked to these issues. Operations managers need to be aware of these limitations while making a judicious choice of these parameters. One can use a similar expression for computing the machine requirements by using the subscript "M" in the place of "L". D x SM …………………Equation 2 Capacity requirement (Machine) = EM

63
Example: A manufacturer of medium voltage circuit breakers is planning for a capacity build up of 8 cubicles and 13 circuit breakers per day. A year is made of 305 working days. The fabrication division is responsible for manufacturing metal sheet components that are welded to host the circuit breakers inside the cubicle. The components are painted after welding. While the fabrication uses a CNC Turret press, painting is a manual job. The standard time required at the CNC turret press for fabricating a cubicle is 150 minutes and the time for the breaker housing is 36 minutes. A cubicle requires 43 square meters of area to be painted and breaker housing requires 2.60 square metres of painting. The standard time required to paint one square to paint one square metre of area is 18 minutes. The machines work at 80 percent efficiency and the manual labour works at 90 percent efficiency. Using the above data, computer the labour hour and machine hour requirements. Solution: Capacity planning is done for the planning horizon. In our example, the basic data for the problem pertains to the planning horizon. The table below summarizes the data for further computations. Since the demand during the planning horizon is the basis for computing the capacity requirement, we compute the demand using the data. Since eight cubicles are to be manufactured per day, in a year the required capacity is to fabricate 2440 (8 x 305 = 2440) cubicles. The table below shows the computation.
Planning horizon 1 Year Number of working days in a year
305
Cubicles Breaker housing Number per day 8 13 Demand per annum 2440 3965
The standard time for fabricating one unit of cubicle and breaker housing are available. Also known is the efficiency of the machine. Using equation 2 we can therefore compute the machine hours required. The table below has the computations.
Machine hour calculations Efficiency of CNC Turret Press 80% Cubicles Breaker
housing Total
Machine hours required per unit 2.50 0.60 Machine hours required per annum
7,625.00 2,973.75 10,598.75
One can use equation 1 to compute the labour hours required in a similar manner. The table below shows the details of the computation.

64
Labor hour calculations
Efficiency of the workers 90% Standard man hours for painting 1sq.m
0.30
Cubicles Breaker housing Total Square meters of area to be painted per unit
43.00 2.60
Total area to be painted during one year (sq.m)
104,920.00 10,309.00 115,229.00
Labour hours required per annum
34,973.33 3,436.33 38,409.67
Computing Capacity Availability: Once the capacity required is computed, one can estimate how much is already available in the system. By performing this computation and comparing with the requirements, one can identify the gaps or excess capacity available for each resource in question. The comparison of the available with the requirement serves several important purposes in a capacity planning exercise. Some of these worth mentioning are:-
• The comparison provides a basis to understand the comparison provides a basis to understand the consequence of the capacity expansion initiative to the operations manager.
• It helps to separate the resources into those with adequate capacity and insufficient capacity and help focus on the latter category for problem solving.
• It provides impetus for process plan changes and improvements for uncovering waste, and thereby discovering more capacity at some of the bottlenecks.
• Finally, it helps the manager to draw out capital budgeting and investment requirements of the capacity expansion initiative.
Availability of capacity in a system is a function of two parameters. One is the system availability and the second is the resource availability. System availability is a function of the number of working days and the number of hours per day. The number of hours in a day depends on operating policies pertaining to the number of shifts and overtime practices. Resource availability is a function of maintenance schedules and breakdown behavior of the resource (in the case of machines) and absenteeism (in the case of labour). Based on these, the capacity available in the system can be computed. The relevant computational details are as follows: System availability Number of working days in the planning horizon : Nd Number of working hours per day : h System availability (hours) = Nd x h Resource availability' Number of machines available : Nm Machine: Time lost in breakdowns and maintenance = b% Number of workers available : NL Number of workers available : a%

65
Capacity available in the system Machine : Nd x h x Nm x (1-b/100) Labour : Nd x h x NL x (1-a/100) Example: Consider the fabrications shop. Referred in this previous example. Suppose the factory works on a two-shift basis with six workers in the paint shop. There is only one CNC turret press currently available. Suppose prior data shows that the equipment at the shop has a downtime of 12 percent and the absenteeism rate of the employees is 5 percent, assess the impact of the capacity expansion initiative in the plant. Solution: The capacity requirements have already been computed in the previous example. They are as follows:- Labour hours required at the paint shop : 38,409.67 Machine hours required at CNC Turret press facility: 10,598.75 Now let us compute the available capacity using equation 4.1.3. Table relevant computations are in the table below:
Number of days in the planning horizon 305
Number of working hours per day 16
System availability (hours) 4880
Number of turret presses available 1
Percent of time lost in breakdown & maintenance 12%
Capacity of CNC turret press available (hours) 4,294.40
Number of workers in the paint shop 6
Percent of time lost in absenteeism 5%
Total labour hours available 27,816.00
Comparison of Availability and Requirement: The table below shows the comparison between requirement and availability for the CNC Turret press and the labour in the paint shop. Since there is only 72 percent of the total requirement available in the paint shop, cubicles and breaker housing can be fabricated only to that extent (as shown in the table). Clearly, there is insufficient capacity in both these cases.

66
Capacity Scenario (Hours)
Requirement Availability Excess (Deficits)
Availability (% of reqt.)
Labour in paint shop 38,409.67 27,816.00 (10,593.67) 72% CNC Turret press 10,598.75 4,294.40 (6,304.35) 41%
Present production capacity
Paint shop Fabrication
Cubicles / day 5.79 3.24 Breaker Housings/day 9.41 5.27
The firm needs to explore methods for augmenting this capacity to meet the revised capacity expansion initiative. One direct method is to compute the number of additional machines and labour required to meet the shortfall. Using the data already available, we can compute the number of additional hours that one can augment by adding one unit of labor on the machine. For example, one more worker will bring 4636 hours of work (305 days x 16 hours/day x 95 percent attendance). Using this information the number of additional machines and workers can be computed as shown in the table below. Number of hours of capacity added by one worker 4,636.00 Number of hours of capacity added by one CNC Turret Press 4,294.40 Additional workers required in the paint shop 2.29=3 Additional CNC Turret presses required 1.47=2
Process Mapping and Capacity Analysis What we have seen above is a detailed computation of the capacity requirement for a particular machine in the fabrication shop and the paint shop of the factory. However, the capacity of the fabrication shop is a function of the capacity of alternative resources available in the shop. Therefore, in order to understand the capacity of one stage of the production system (for example the paint shop) we need to understand the manner and the extent to which the available resources are utilized in manufacturing. One can obtain this information from a process mapping exercise. By process mapping, we mean a representation of all the available resources, the patterns and the extent to which each of these resources is being used. Using this information, we can compute the capacity of each resource available in the shop and the limiting capacity for the entire shop. The process mapping exercise can be done at any level of abstraction and capacity implications are analyzed at that level of abstraction. Continuing with our example, the entire hierarchy of capacity computation could be graphically illustrated as in shown Figure 4.2. We will consider an example to understand the capacity issues stemming from a process mapping exercise.

67
First operation
Fabrication shop
Paint shop
Electrical & wiring
Assembly & testing
Shearing unit
Pressing unit
Welding unit
CNC Turret press
Hydraulic press
NC Press brake
63 tonne ECC press
Fig. 4.2: Hierarchies in Capacity Estimation Exercise
Example: A product is manufactured in a shop using a five-stage process. The first step in the process is to cut the sheet metal to required shapes and sizes using a shearing process. After the shearing process, the components are subjected to pressing operations to alter the shape of the flat sheet as per the design. In the third stage of the process, welding is done to join the components. The next step in the process is a painting operation. After painting, the components are packed and kept ready for dispatch. The time taken for each of these operations is 20, 30, 15 and 6 minutes respectively. Presently, each stage has only one machine for operation. Map the process and analyze the capacity with respect to the following scenarios.
• If the shop works on an 8-hour shift with an effective available time of 450 minutes, what is the production capacity of the shop?
• Where is the bottleneck in the system? If we want to add one machine, where should we make the investment?
• Identify the additional capacity required for a daily production target of 25 units. Compute the utilization of the machines as per the revised capacity calculations.
• What are the key inferences of this exercise? Solution: Based on the description given above, one can map the process and identify the extent of time the resources will be used at each stage of the process for manufacturing. The figures below have the process map. The numbers in parentheses denote the time required at each stage.
Denotes bottleneck in the process

68
Shearing (20 minutes)
Pressing (30 minutes)
Welding (15 minutes)
Painting (12 minutes)
Packing (6 minutes)
Shearing (20 minutes)
Pressing (30 minutes)
Welding (15 minutes)
Painting (12 minutes)
Packing (6 minutes)
Pressing (30 minutes)
These timings can be translated into production capacities by dividing the total available time per shift with the required time at each stage. The production capacities are: Shearing : 450/20 = 22.50 Pressing : 450/30 = 15.00 Welding : 450/15 = 30.00 Painting : 450/12 = 37.50 Packing : 450/6 = 75.00 The smallest number in the above calculation limits the production capacity for the shop. Therefore, the current production capacity is 15 units per day. The slowest process is the bottleneck in the system and it dictates the production capacity. Therefore, it is prudent to channelize the investment at the bottleneck process. By adding one more machine, the situation changes as follows:
Since two machines are available at the pressing stage, the effective time per unit will now be 15 minutes. Therefore, the bottleneck now shifts to shearing and the revised production capacity will be 22.50 units a day. The production target is now 25 per day. Since a day has 450 units, the maximum time that the process can take at each stage is 18 minutes. The packing, painting and welding sections have timings less than 15 minutes. Therefore, they do not need any more investment in capacity. By adding one more machine at the pressing stage, the effective time will be less than 18 minutes. Similarly, by adding one more machine at the shearing stage, the effective time will be 10 minutes. Using equation 4.1.3, the capacity utilization for the machines are as follows:

69
Daily production x process time Utilization of shearing = number of machines x available time 25 x 20 = 2 x 450 = 55.56% 25 x 30 Utilization of pressing = 2 x 450 = 83.33% 25 x 15 Utilization of welding = 1 x 450 = 83.33% 25 x 12 Utilization of painting = 1 x 450 = 66.67% 25 x 6 Utilization of packing = 1 x 450 = 33.33% Key inferences: Computation of individual capacity availability and requirement is an important and the first step in the capacity planning exercise. The value of this exercise lies in our ability to use this information to identify bottlenecks. A process mapping exercise will help us achieve this objective. The utilization of the shearing process has dropped to 56 percent due to the addition of a machine. Clearly, addition of one more unit of resource may not always be the best always be the best solution. Alternatives for Capacity Augmentation: The previous example pointed out the need for looking at alternative methods for capacity augmentation during a capacity planning exercise. The straightforward option is to add more units of resource. Although it is simple from an operational decision making point of view, in reality the implications, could be far too many. The cost of the resource in question, the utilization of the resource and the ease of implementation of the capacity expansion plan are some of the issues that will influence the choice of this option. Moreover, as more and more units of resources are added, it may significantly impact the long term operational costs of the system. For example, if several new workers are added, then the cost of the system increases not merely in terms of salary but also in terms of support costs, benefits, health and post-retirement provisions. Similarly, as more machines are added, equipment maintenance costs will go up in the long run. Furthermore, if the resource in question is very expensive and the utilization of resource is likely to be low, it is very unattractive and operations managers should look of other options. Waste Elimination: One method to increase the capacity of the resources in the system is to employ Japanese methods of resources planning and management, as described earlier in the chapter. In a nutshell, it is for the operations manager to make use of eq1uation 4.1.3 and progressively uncover capacity from the system by elimination of waste. Process industries increase capacity by de-bottlenecking operations. Since in process industries, the system is a continuous flow of material from the raw material to finished goods, merely identifying the bottleneck stage in the process and de-bottlenecking it can increase the capacity of the

70
system. Japanese approaches to waste elimination and /or addition of fresh capacity is that stage will increase the capacity of the system. However, the bottleneck will shift elsewhere and the process could be repeated. Multi-skilling of Work Force: Another approach to increasing capacity is by multi-skilling of the work force. Often, capacity constraints manifest on account of non-availability of shills even when adequate capacity is available in machines and other resources. For instance, in a machine shop, there will be enough drilling machines, grinding machines, gear cutting machines and CNC machines to process all the requirements. However, if the workforce is not multi-skilled, then production may suffer on account of a specific set of skills not being available at some time. There may be just a few workers who can operate the gear cutting machine and the CNC machine. Therefore, these workers will dictate the capacity of the system. On the other hand, if all the workers have skills, to operate all the machines, then it is much easier to absorb fluctuations in both demand and workforce availability. Multi-skilling not only solves the problem of providing each operating unit or a subdivision with the required skills but also increases the flexibility of operating such units. Employee absenteeism does not affect the working seriously. At the shop floor level, multi-skilling in a machine shop would mean picking up the skills required for operating all the machines and in the assembly shop it would mean working at all stages of assembly. In the fabrication shop it would call for proficiency in fitting, welding, shearing etc. On the other hand, at the supervisory level and shop floor managerial level, it would mean discharging various manufacturing support functions such as production planning and control, inventory and stores management and procurement. Developing multi-skilling is an easy but time bound programme in any organization. The management needs to focus adequate attention on this aspect and encourage employees to acquire, in addition to the skill required for processing at his/her work place, the skill to perform the preceding and the succeeding stages of processing. That is a good way to start the process. However, in order to get a sense of direction in this process, organizations need to conduct a skill inventory at every shop. The skill inventory could be used to compute some indices that describe the current status of multi-skilling in the shop. Once this information is available, the management could chalk out various training programmes to help employees in each shop to pick up critical and scarcely available skills first. It also helps to set up measurement system to keep track of the extent to which employees have acquired additional skills. The advantage of a measurement system lies in its usefulness in setting up targets for achieving improvements over a period of time. The multi-skilling index is a potential candidate for such a measurement system (Table 4.1.). Once the current index is established, it serves as a baseline over which further improvements could be made. Quarter-wise or half-yearly targets can be set up and used for reviewing the progress in the process. The information presented to Table 4.1. can be used in different ways. For example, for each skill required in each shop, the number of people trained could be identified. Such an analysis would help in identifying the critical skills and those that are not currently available. In Table 4.1, it may be seen that skill 4 is critical as only one employee has acquired it. Using such information, shop workers can be encouraged to gravitate towards the required critical skills.

71
It is also possible to display the above information on a board and use it as a visual control aid. Once such example was found in a two-wheeler manufacturer in South India, who made use to visual aids for measurement of multi-skilling. As a part of the shop information system, the list of employees and the skills that they were proficient in was displayed. As and when an employee acquires and additional skill, the display board was updated. For each employee belonging to a particular shop, a solid circle against a skill would indicate that he had acquired the skill and a hollow circle, otherwise. Displaying the multi-skilling chart on board will have a positive impact on the work force. While those who have acquired a large number of skills experience a sense of satisfaction and pride and aspire to reach the best possible stage, others with proficiency just one or two skills experience an implicit psychological pressure to improve.
Table 4.1
Sample skill inventory matrix and multi-skilling index Sr.No. Employee Name Skill 1 Skill 2 Skill 3 Skill 4
01 Datta K N No No Yes No 02 Bhokare S B No No Yes No 03 Mense A N No Yes No No 04 D'Souza A J Yes No No No 05 Shriram C R Yes Yes No Yes 06 Chidre Y M No No Yes No 07 Raskar S N No No Yes No 08 Narke B R Yes Yes No No 09 Karanjia K R No Yes No No
Maximum number skills that could be acquired in the shop = 36 Number of skills the employees currently possess = 12 Multi-skilling index for the shop = 33% Sub-contracting/Outsourcing: Capacity augmentation need not be done in-house always. An alternative approach to capacity augmentation is to sub-contracting decision closely follows that of a "make or buy" decision that purchase managers and management accountant address in their respective domains. Several considerations influence the sub-contracting decisions in firms. Primary among them is the lack of capacity to meet the current demand. The other consideration is the technological intensity and criticality of the item for which capacity is being sub-contracted. When the item is of low technical intensity and criticality, then it is less risky to sub-contract capacity. The firm may not lose any valuable trade secret or know-how pertaining to the product being manufactured. The third issue is one of cost. When the cost of performing an activity in-house is much higher than what is available outside, then it is appropriate to outsource such activities and use the released capacity for other important activities. Sub-contracting offers several advantages to a firm. First is the flexibility to handle fluctuations in demand. By investing in capacity in house, the firm may run the risk of under-utilization should the demand for the product/service come down in the future. In -house capacity augmentation is a time consuming process. On the other hand, firms can react much faster to market requirements by using sub-contracting. Sub-contracting is also very useful to manage peak hour demand. By having an in-house capacity equal to the average demand during period, firms can address peak hour requirement using sub-contracting.
72
Despite these advantages, sub-contracting has some drawbacks. The major challenge in sub-contracting is to identify an appropriate vendor for providing sub-contracted services. If the selection of the vendor is not done carefully, poor performance of the vendors will impact adversely the firm's business and market standing. Capacity utilization: Capacity utilization is the degree to which equipments currently being used. It is expressed as under; Utilization= Average output * 100 % Maximum capacity The units of measurement for both numerator and denominator should be the same. Though the capacity utilization can be measured by the equation given above but it is difficult to measure the effective capacity utilization. There are day to day variations, job changes, product mix changes, absenteeism, equipment breakdown, facility down time etc. Due to these variations, the capacity of a facility can rarely be measured in precise terms. It is found that an organization can operate more efficiently when its resources are not stretched beyond a limit. Capacity is the capacity, which a firm can expect to achieve, given its product mix, method of scheduling, maintenance and standard of quality. Thus Expected capacity Effective capacity utilization = --------------------- Capacity- Efficiency is a measure of actual output over effective capacity and is expressed as a percentage of effected capacity. Actual output Efficiency = ------------------------- Effective capacity A rated capacity is a measure of the maximum usable capacity of a particular facility Rated capacity = (capacity)’ (utilization)’ (efficiency) For example, one facility has an efficiency of 90%and utilization is 80%. Three product lines are used to produce the product. The lines operate 6 days a week and three 8-hrs shifts; each line was designed to produce 100 standard units per hour. The rated capacity is Rated capacity = (capacity)’ (utilization) ‘(efficiency) ‘ = (100)’ (3)’ (144)’ (0.8) ‘(0.9) =31,104 products /week ---------------------------------------------------------------------------------------------------------------- 4.3 ECONOMIES AND DISECONOMIES OF SCALE AND LEARNING
CURVE ---------------------------------------------------------------------------------------------------------------- Economies of scale: “Economies” refer to lower costs, hence economies of scale, would mean lowering of copses of production by way of producing in bulk. Stated in very simple terms, economies of scale refers to the efficiencies associated with large scale operations ;it is a situation in which the long run average cost of producing a good or service decrease with

73
increase in level of production. For example, it might cost Rs 100 for one unit, Rs 180 for two units, Rs.240 for three units , and so on, such that the average cost per unit decreases as the production volume increase. Economies of scale are extremely important in real world production processes. Hence firms are often concerned about a minimum efficient level of production, which is nothing but the amount of production that spreads setup costs sufficiently for the firms to undertake production profitably. This level is reached once the size of the market is large enough for firms to take advantages of all economies of scale. There are two types of economies of scale:
• Internal economies( in which the cost per unit depends on size of the firm) • External economies (in which the cost per unit depends on the size of industry, not
firm).
Internal Economies: It includes the following:
• Specialization: In large scale plants workers can be assigned repetitive jobs; an entire job can be broken down into components or processes and each such process can be assigned to a worker or a group of workers. This idea, also termed as division of labor, was propounded by Adam Smith, in his legendary pin factory example, and is nothing but specialization in a particular job. Such specializations would need lesser training; time taken to complete each assignment would be lesser; lesser time would be taken in switching from one operation to another; and lesser supervision would also be needed.
• Greater efficiencies of machines: In large scale production large machines would be
needed; for a given amount of inputs these machines will render output in larger quantities. Besides, they would ensure more efficient use of available raw materials.
• Managerial Economies: Large production can ensure better managerial functions, by
way of better supervision and administration. Departmentalization becomes possible; planning and organizing becomes worthwhile.
• Financial Economies: Large firms going for large volumes of production may be
able to raise capital from the market with much less difficulties than small firms. Cost of production may also decline for larger volume of output, because larger output enables a firm to obtain inputs at lower prices by quantitative discounts etc
• Production in stages: A large plant may house all the processes of production and
this saves time and cost in moving components from one location to the other for final assembling. Modernization of production processes is possible only in large scale.
External Economies: As an industry grows in size, it would create various economies for the existing firms in the industry. Since these economies are external to a particular firm and are commonly available to all firms hence the term ‘external economies’. Aspects contributing to external economies are:
• Technological advancement: A large growing industry would encourage investment in research and would result in development of better technology of production, as the industry expands, technological innovations get definite boost, as has been the case cars, computers and TV etc.

74
• Easier access to cheaper raw materials: Suppliers would have large market to cater to and therefore the availability of raw material would be easier. Expanded demand for raw material encourages increased supplies. Buying in bulk will also enable the firms to get more discounts and better commercial terms.
• Financial institutions in proximity: As industry needs finances to grow and financial institutions look for avenues for investment? This mutuality of interest encourages their mutual growth and coexistence, No wonder you find boom in financial sector in India after globalization.
• Pool of skilled workers: Large industries provide opportunities of employment; hence just like technology, material and finance human resources too would acquire needed skills
Dis-economies: Diseconomies of scale are disadvantages that arise due to expansion of production scale and lead to a rise in cost of production. Like economies, diseconomies may be internal or external. Internal diseconomies are those which are exclusive and internal to the firm—they arise within the firm. External diseconomies arise outside the firms mainly in the input market as: Internal Diseconomies: As every thing else, economies of scale have a limit too. This limit is reached when the advantages of division of labor managerial staff have been fully exploited; excess capacity of plant , warehouses transport and communication systems etc, is fully used; and economy in advertisement cost tapers off. Managerial inefficiencies: Diseconomies begin to appear first at the management level. Managerial inefficacies arise, among other things, from expansions scale itself. With fast expansion of production scale, personal contacts and communications between (i) Owner and manager and (ii) managers and labor) get rapidly reduced. Close control and supervision is replaced by remote control management. With the increase in managerial personnel, decision making becomes complex and delays become inevitable Labor inefficiencies: Another source of internal diseconomy is overcrowding of labor leading to loss of control over labor productivity. The increase in number of workers, on the other hand, encourages labor union activities which simply mean the loss of output per unit of time and hence rise in cost of production. External Diseconomies: External diseconomies are the disadvantages that originate outside the firm, in the input market and due to natural constraints especially in agriculture and extractive industries. With the expansion of the firm, particularly when all the firms in industry are expanding; the discounts and concessions that are available in bulk purchase in inputs and confessional finance come to an end More than that, increasing demand for inputs puts pressure on the input markets and input prices begin to rise causing a rise in the cost of production. On the production side, the law of diminishing returns to scale comes in force due to excessive use in fixed factors, more so in agriculture and extractive industries. Learning Curves: Do you remember your first attempt at learning new skill? Be it setting your hand on the computer mouse, or playing any musical instrument. You would agree that you learn by doing and gradually gain experience at any activity which previously took a lot of time (and perhaps cost) when you were beginner. Learning by doing means that as we do something, we learn what works, and what does not, and overtime we become more proficient, at it. In economics learning by doing refers to the process by which producers

75
learn from experience; in fact production techniques available to real world and firms are constantly changing because of learning by doing and technological change. In many businesses the effect by learning by doing is incorporated into their pricing structures. Average cost s may decline with cumulative production, because of and other learning effects. Simply speaking, experience with a particular set of suppliers, production process, facility, workforce, distribution channels and managerial teams can result in improvement in technical efficiency. The concept of learning curve is used to represent the extent to which an average cost of production falls in response to increase in output. The learning curve was adopted from the historical observation that the individuals who perform repetitive tasks exhibit an improvement in performance; as the task is repeated a number of times. The equation of learning curve can be expressed as: bth C=AQ Where C is the cost of inputs and Q unit of output produced and A is the cost of the first unit of output obtained. Now following the logic that increase in cumulative output leads to decrease in cost, “b” has a negative value. The logarithmic form of the equation is given as: In C= In A+ b in Q In this logarithmic form, b is the slope of learning curve. Sources of lower costs include greater familiarity of workers and managers with the production process, reduction in overheads, and division of labor process improvement, etc. It can logically be inferred that the only recurring costs are affected by learning, while non-recurring costs, like cost of acquiring equipments, are not affected by learning. ---------------------------------------------------------------------------------------------------------------- 4.4 CAPACITIES STRATEGIES ---------------------------------------------------------------------------------------------------------------- Capacity strategies can be discussed under two major heads:
• Short-term response • Long -term response
Short term strategies: In short term periods of up to one year, fundamental capacity is fixed. Major facilities are seldom opened or closed on a regular monthly or yearly basis. Many short term adjustments for increasing or decreasing capacity are possible, however. Which adjustment to make depend on whether the conversion process is labor or capital intensive and whether the product is one that can be stored in inventory Capital intensive processes rely heavily on physical facilities, plant, and equipment. Short term capacity can be modified by operating these facilities more or less intensively than normal. The cost of setting up, changing over and maintaining facilities, procuring raw materials and managing inventory, and scheduling can all be modified by such capacity changes. In labor intensive processes, the short term capacity can be changed by laying off or hiring people or having employees overtime or be idle. These alternatives expensive, though since hiring costs, severance pay, or premium wages may have to be paid, the scarce human skills may be lost permanently.

76
Strategies for changing capacity also depend upon long the product can be stored in inventory. For products that are perishable (raw food) or subject to radical style changes, storing in inventory may not feasible. This is also true for many service organizations offering such products as insurance protection, emergency operations (fire, police etc,) and taxi and barber services. In stead of storing outputs in inventory, inputs can be expanded or shrunk temporarily in anticipation of demand. Long term Responses: Capacity expansion strategies- capacity expansion adds capacity, within the industry, to further the objectives of the firm to improve the competitive position of the organization. It focuses on growth of the Organization by enabling it to increase the flow of its products in the industry. Capacity expansion is a very significant decision; the strategic issue is how to add capacity while avoiding industry overcapacity. Overbuilding of capacity has plagued many industries e.g. paper, aluminum and many chemical businesses. The accountants’ or financial procedure for deciding on capacity expansion is straightforward. However two types of expectations are crucial:
• Those about future demand, • Those about competitors behavior
With known future demand, organizations will compete to get the capacity on stream to supply that demand, and perhaps preempt such action from others. Horizontal and vertical integration: Horizontal and vertical integration add capacity, within the industry, to further the objectives of the firm to improve the competitive position of the organization Horizontal Integration: Horizontal integration is the growth of a company at the same stage of value chain. Horizontal integration consists of procuring (related companies, products or processes) the company could start related business within the firm, which would be an example of internal concentric diversification. Vertical Integration: Vertical integration is the combination of economic processes within the confines of a single organization. It reflects the decision the decision of the firm to utilize internal transaction rather than market transaction to accomplish its economic purpose. It is expressed by acquisition of a company either further down the supply chain, or further up the supply chain, or both. Backward Integration: In case of backward integration, it is critical that the volumes of purchases of the organization are large enough to support an in-house supplying unit, If the volume of through puts is sufficient to set up capacities with economies of scale, organization will rep benefits in production, sales purchasing and other areas. Takeover or Acquisitions: Takeover or acquisition is a popular strategic alternative to accelerate growth. Major companies which have been taken over post liberalization period include Shaw Wallace, Ashok Leyland, Dunlop, etc. Acquisition can either be for value creation or value capture.

77
---------------------------------------------------------------------------------------------------------------- 4.5 DECISION TREES ---------------------------------------------------------------------------------------------------------------- Decision Trees are most commonly used in capacity planning. They are excellent tools for helping choose between several courses of action. They provide an effective structure within which you can lay out options and investigate the possible outcomes of choosing those options. They also provide a balanced picture of the risks and rewards associated with each possible courses of action. The capacity planning exercise requires methods by which alternative options are evaluated. Two metrics are useful to perform the evaluation. In the cost based methods, each alternative can be evaluated from the perspective of cost and benefits accruing out of the alternative. A firm, for example, may be considering three options: not to do anything about capacity, add a new machine or go for sub-contracting. Another firm may have three options of varying technological and operational capabilities for capacity addition, resulting in different capital costs, operating costs and useful life of the resource. In each of the above examples, one can evaluate the alternatives from the perspective of costs and benefits. The other method is to use operational performance based methods for comparing alternatives. If the choice is to go for multiple resources, one can analyze the impact of the alternatives in terms of utilization of capacity and the waiting time of the jobs. If more machines are added, the waiting time as well as the utilization of the resource will come down. It is possible to analyze and select the best alternative on the basis of these measures. Decision trees are useful to evaluate alternative capacity choices on the basis of cost of the capacity and the benefits. Further, the inherent uncertainty in the demand tree is a schematic model in which different sequences and steps involved in a problem and the consequences of the decisions are systematically portrayed. Decision trees comprise nodes and branches. Each node represents the decision point and branches represent the potential outcomes of the decision. The consequence of each outcome is measured as the cost of the impact, and the uncertainty associated with each outcome could be associated with the requisite branch. Using this basic information, the tree is constructed. After the tree is constructed, each branch in the tree is evaluated with respect to the costs, benefits and uncertainty. The tree is evaluated from right to left (from end to beginning). As we move from right to left, unattractive portions of the tree are eliminated to arrive at the final decision. The used of a decision tree for evaluating capacity alternatives is explained with the help of an example below. Waiting Line Models: Consider the capacity planning in the case of the computerized passenger reservation facility of Indian Railways. In simple terms, the question boils down to deciding the number of booking counters to be made available to the public. It is obvious that if there are fewer booking counters to be made available to the public. It is obvious that if there are fewer booking counters, the queue is likely to build and customers may end up spending more time in the system before they get their tickets booked. We have similar experiences in a banking system or BSNL's bill payment counters. Capacity decisions in service systems are often made on the basis of the impact on the customers. In service systems, waiting time is an important operational measure that determines service quality. Similar examples exist in manufacturing systems as well. A resource that is few in number and highly utilized is likely to be a bottleneck and increase the waiting time of the jobs ahead

78
of it. Due to this, manufacturing lead time will increase and work in progress will pile up in the factory. This will have a cascading effect in terms of missing delivery commitments and shipping delays. Waiting line models make use of queuing theory fundamentals such as queue length, waiting time and utilization of resources, to analyze the impact of alternative capacity choices on important operational measures in operating systems. Therefore, capacity planning problem could be analyzed using queuing system and the alternative scenarios that can be analyzed that can be analyzed using the waiting line models developed. Basic Structure of a Queuing System: Figure 4.3 depicts the basic structure of a queuing system. The demand for the products/ services offered by the operating system originates from a calling population or source. In the case of a restaurant, the calling population (source) of demand could be the citizens in the vicinity of the restaurant. The demand manifests in the form of arrivals at the system. In the case of service systems it could be actual customers arriving to get the service. In the case of a manufacturing system it could be work orders at a shop or customer orders at a division. The third element is the waiting line, which characterizes the provisions made for the arrivals to wait for their turn. There are servers in the system for service delivery and finally the served customers exit the system. We shall understand each element in details and enumerate alternative representations that exist in real life in each of these. Figure 4.3 provides the elements of waiting line models in a nutshell and enumerates the alternatives pertaining to each element. Arrivals Wa Waiting line Server Served Customers Fig. 4.3Basic Structure of a Queuing System Calling Population: It is the calling population in an operating system that places a demand and uses the capacity deployed. In several cases the calling populating is infinite for all practical purposes. For instance, the calling population for a petrol bunk in the city of Delhi could be the entire set of vehicles running on the roads of Delhi. Similarly for a bank in a metropolitan city such as Chennai the calling population could be the individual and institutional members. in the society in the city. These typically amount to an infinite number as far as the operating system is concerned. However, in some cases, the calling population could be finite. Consider the maintenance department in a large manufacturing plant. If there are 300 machine tools in the plant, they form the calling population for the maintenance department in the manufacturing plant. Every machine breakdown corresponds to an arrival at the maintenance shop. In this situation, the calling population is finite. The important difference between an infinite source and a finite one is the manner in which arrival rates are
Calling Population

79
estimated. Clearly, every arrival from a calling population decreases the probability of arrival of the remaining machines at the maintenance shop. ---------------------------------------------------------------------------------------------------------------- 4.6 REVIEW QUESTIONS ----------------------------------------------------------------------------------------------------------------
1. How will you measure the capacity of the plant?
2. What are economies of scale?
3. What are diseconomies of Scale?
4. Discuss the various strategies for measurement of capacity.
5. What are decision trees and what is their importance?

80
---------------------------------------------------------------------------------------------------------------- FACILITY LOCATION ---------------------------------------------------------------------------------------------------------------- Structure 5.1 Introduction 5.2 Location strategy and its importance 5.3 Factors Influencing Plant Location 5.4 Globalization 5.5 Location selection models 5.6 Review questions ---------------------------------------------------------------------------------------------------------------- 5.1 INTRODUCTION ---------------------------------------------------------------------------------------------------------------- Business systems utilize facilities like plant and machinery, warehouses etc., while performing the task of producing products and services a proper planning of these facilities would definitely reduce their cost of operation and maintenance. Plant location decisions are very important because they have direct bearing on factors like financial, employment and distribution patterns. In the long run, relocation may even benefit the organization. But, the relocation of the plant involves stoppage of production, and also cost for shifting the facilities to a new location. In addition to these things, it will introduce some inconvenience in the normal functioning of the business. Hence at the time of starting any industry, one should generate several alternate sites for locating the plant. After a critical analysis, it is the best site to be selected for commissioning the plant. Location of warehouses and other facilities are also having direct bearing on the operational performance of organization ---------------------------------------------------------------------------------------------------------------- 5.2 LOCATION STRATEGY AND ITS IMPORTANCE ---------------------------------------------------------------------------------------------------------------- The following events are quite common in any business venture:
• Establishment of a new venture • Expansion of the existing business • Significant change in existing demand, supply and marketing locations • Significant change in the cost structure. • Government policies
Because of these events, an organization will be keen in additional or alternate sites for its production activities. So the plant location becomes an important decision which in turn influences plant layout and facilities needed. Also, it influences capital investment and operating costs. For example, in steel industry, if we integrate the unit’s right from ore extraction to final steel formation in a nearby area, the transportation cost would be substantially reduced and also, the availability of supplies to the final stage of production in the integrated plant would be improved. This in turn, improves the productivity of the plant.

81
---------------------------------------------------------------------------------------------------------------- 5.3 FACTORS INFLUENCING PLANT LOCATION ---------------------------------------------------------------------------------------------------------------- The factors which influence plant location can be classified into general factors and specific factors: General factors: These are:
1. Availability of land for present and future needs and cost of land and land development and building etc.
2. Availability of inputs such as labor and raw material, etc. 3. Closeness to the market place 4. Stability of demand 5. Availability of communication facilities 6. Availability of necessary modes of transportation like road, rail, airport, and
waterways. 7. Availability of infrastructural facilities such as power, water, financial institutions
banks etc. 8. Disposal of waste and effluents and their impact on environment 9. Government support, grant, subsidy, tax structure 10. Availability of housing facilities and recreational facilities. 11. Demographic factors like population, trained man power, academic institutions,
standard of living, income level, etc. 12. Security culture of the society 13. Fuel cost
Specific Factors: A multinational company, desiring to set up plant should consider the following aspects in addition to the normal factors:
1. Economic stability of the country and the concern of the country towards outside investments are to be considered
2. The success of operation of the factory depends upon the cultural factors, language and cultural differences which can present operating control and even policy problems. Units of measurement are also very important in international business.
3. Analysis must be based on the factors like wage rate, policy, duties, etc., 4. The Company can set up joint ventures with any leading local giants that will solve
many local problems ---------------------------------------------------------------------------------------------------------------- 5.4 GLOBALIZATION ---------------------------------------------------------------------------------------------------------------- Location issues have become more prominent in recent years due to the increased pace of economic reforms in several countries and consequent globalization of markets. The globalization of markets opens up new opportunities to Multinational Corporation on issues related to location, which they have not faced before. For instance, ABB decided to identify factories that could produce world class products at internationally competitive prices. More over the factories needed to have high level of technical capability and domain expertise. This resulted in selecting plants at Vadodra and Nasik for circuit breakers of range above 72.5 KV. Similarly, their motor division in Faridabad, the one available east of the Suez Canal is capable of making variable drive motors for global market. These examples amplify the close relationship between globalization and operations and new dimensions to the

82
location of manufacturing facilities. Therefore, in the paragraphs we shall examine the factors that have caused globalization of operations their influence on location decisions. Regulatory Issues: The most significant factor that drives globalization is ongoing economic and regulatory reforms in several developing countries. In India, beginning 1991, we embarked on a set of regulatory changes that has made our country much more attractive in terms of locating a manufacturing facility. Two events have been broadly responsible for this. First is the reduction in customs and excise tariffs and move towards a single point value added tax (VAT) regime. The other is deli censing of several sectors of the industry and progressively removing the cap on foreign direct investment. Further, there is a progressive simplification of the procedural aspects of setting up operations and running them on a day to day basis. These changes have several implications for location choices for multinational firms. Removal of entry barriers and reduction in cost of manufacture due to tariff reduction will make India an attractive destination for shifting manufacturing base. In the case of multinational firms with manufacturing facilities already located in India these facilities will be attractive candidates for further development and growth. Another issue of relevance for location planning with respect to regulatory issues is the emergence regional trading blocs a trading bloc is essentially of geographically separated nations that have advantageous access to markets, manufacturing facilities and technologies within the member countries. If required, it could also have a common currency, as in case of the European Union. Such an organization operating in such markets, India is a member of two trading blocs, SAARC, and ASEAN. Factor Advantage: Globalization manufacturing is also triggered by factor advantages that an organization can enjoy by operating in specific location. .Generally, developed countries in Europe and in the US are characterized by high cost of labor. On the other hand, developing countries offer significant advantage to a firm due to availability of cheap labor. Therefore, in location planning these advantages are likely to be considered. The recent shifting of manufacturing base to China and India and the large scale shifting of BPO activities to India are primarily related to the factor cost advantages that these countries offer to firms in the western world. For a similar reason, the bulk of semiconductor and electronic appliances manufacturing has been shifting to countries such as South Korea, Taiwan and Malaysia. Factor advantage also accrues to a firm on account of availability of skilled labor and other resources required in plenty for manufacturing. The other resources may be power and water, in case of chemical processing industries and availability of technical infrastructure in the form of well developed ancillary industries. Essentially, when these resources are available in plenty, firms develop confidence that the location of their facilities will benefit them in the long run and enable them to make further enhancement in product offering without much difficulty. Moreover, the plentiful availability of these resources will introduce a healthy competition among them, paving the way for the cost reduction and overall improvement in quality and delivery and availability. These factors may significantly influence the location decisions of a firm and may encourage the firm to globalize its operation Expanding Markets in Developing Countries: Another phenomenon promotes globalization of operation and provides more alternatives for location decisions. This is

83
related to the growth rate of the economy in developed and developing countries,. Developing countries such as India and China are growing at an annual rate of 6% and above. In contrast, most developed countries witness very little growth, amounting to less than 2 percent. Moreover, developing countries (primarily in Asia) have very high populations. In several of these countries, the middle income group is larger than the entire population of most developed countries. Clearly, such a scenario means expanding markets in developing countries and the desire multinational firms has been to capture a market share in these regions. Therefore, several firms have been considering new locations in these markets for their manufacturing facilities in recent years. The factors that drive globalization of operations is aptly summarized in the study on world competitiveness rating done by the Geneva based World Economic Forum shows that various factors that make a country (location) attractive for firms. There are three tiers of competitiveness:
• First, include certain factors that make a country attractive. These include the quality of judicial economic and financial institutions, openness to international trade and finance and the role of its government in creating an environment Conducive for business
• Second, the sartorial competitiveness determines how attractive a location is, covering issues of quality and availability of manpower and associated infrastructure for the sector.
• Thirdly, the firm level issues contribute to the attractiveness of the location. This basically pertains to the ability of the firm to compete effectively in the market by operating in a particular location
General Procedures for Facility Location Planning: The preliminary Screening: A preliminary screening to identify feasible sites begins the planning process. For some kinds of facilities, particular environmental or labor considerations are crucial. Breweries, for example, require an adequate supply of clean water. Aircraft manufacturers must be located near a variety of subcontractors; primary aluminum producers need electrical power. Resources Local Conditions
1. Labor skills and productivity. 2. Land availability and cost 3. Raw materials 4. Subcontractors 5. Transportation facilities (highways, rail, air, water 6. Utility availability and rates
1. Community receptivity to business 2. Construction costs 3. Organized industrial complexes 4. Quality of life: climate, housing, recreation, schools 5. Tasks
Sources of information After identifying several key location requirements, management undertakes a search to find alternative locations that are consistent with these requirements. Where does this information come from? Local chambers of commerce provide literature promoting expansion possibilities in various state and local communities. The wall street Journal and numerous trade publications contain advertisements placed by cities and communities hoping to attract new commerce. The national Industrial Conference Board, the

84
U.S. Department of Commerce, the U.S. Small Business Administration, and the U.S. Census of Manufactures are among the many sources that provide both general and detailed location information. Data include geographic breakdowns of labor availability, population, transportation facilities, types of commerce, and similar information. Detailed Analysis: Once the preliminary screening narrows alternative sites to just a few, more detailed analysis begins. At each potential site a labor survey may be conducted to assess the local skills. Where community or consumer response is in question, pilot studies or systematic surveys may be undertaken. Community response is important, for example, in deciding where to locate a nuclear reactor, recreation area, commercial bank, state prison, or restaurant. For assessing community attitudes and for developing strategies to gain acceptance, survey research techniques can be very helpful. Among all the many considerations, each company must identify which ones most pertinent for their location strategies? Factor Ratings Factor ratings are frequently used to evaluate location alternatives because:
• Their simplicity facilitates communication about why one site is better than another; • They enable managers to bring diverse location considerations into the evaluation
process; • They foster consistency of judgment about location alternatives.
Typically, the first step in using factor ratings is to list the most relevant factors in the location decision (column 1 in Table 5.1). Next, each factor is rated, say from 1 (very low) to 5 (very high), according to its relative importance, (column 2 in table 5.1). Then, each location rated, say from 1 (very low) to 10 (very high), according to its merits on each characteristic (column 3 in Table 5.1). Finally, the factor rating is multiplied by the location rating for each factor, (column 4 in Table 5.1), and the sum of the products yields the total rating score for that location. The total scores indicate which alternative locations are most promising, considering of all the various location factors.
Table 5.2 Factor ratings for location alternative
Factor Factor Rating Location Rating
Product of ratings
Tax advantages 4 8 32 Suitability of labor skills 3 2 6 Proximity to customers 3 6 18 Proximity to suppliers 5 2 10 Adequacy of water 1 3 3 Receptivity of community 5 4 20 Quality of educational system 4 1 4 Access to rail and air transportation 3 10 30 Suitability of climate 2 7 14 Availability of power 2 6 12 Total Score 149
85
---------------------------------------------------------------------------------------------------------------- 5.5 LOCATION SELECTION METHODS ---------------------------------------------------------------------------------------------------------------- Various quantitative models are used to help determine the best locations of facilities. There are some widely known general models that can be adapted to the needs of variety of systems. These are explained below: Simple Median Model: Suppose we want to locate a new plant that will receive shipments of raw materials from two sources: F1 and F2. The plant will create finished goods that must be shipped to two distribution warehouses F3 and F4 Given these four facilities, where should we locate the new plant to minimize annual transportation cost for the network of facilities? The median model can help answer this question. The model considers the volume ofLoads transported on rectangular paths. All movements are made in east-west or North-south directions; diagonal moves are not considered. The simple median model provides an optimal solution. Table 5.2 shows the number of loads Li to be shipped annually between each existing facility F, and the new plant; it also shows the coordinate location' (Xi, Yi) of each existing facility Fi and the cost Ci to move a load one distance unit to or from Fi. We let Di be the distance units between facility Fi and the new plant. The total transit cost, then, is the sum of the products CiLiDi for all i: cost times loads times distance. n Total transportation cost = ∑ CiLiDi Equation 5.1 i=1
Table 5.2 Locations of existing facilities and number of loads to be moved
Coordinate Location (Xi, Yi) of Fi
Existing Facility Fi
Annual Loads Li between Fi and New Plant
Cost Ci to move one Load One distance Unit
(Xin Yi
F1 755 1 (20, 30) F2 900 1 (10, 40) F3 450 1 (30, 50) F4 500 1 (40, 60)
Total 2,605 Since all loads must be on rectangular paths, distance between each existing facility and the new plant will be measured by the difference in the x-coordinates and the difference in the y-coordinates (see figure 5.1). If we let (x0, y0) be the coordinates of a proposed new plant, then Di = x0 - xi + y0- yi Equation 5.2 Notice we calculate the absolute value of the differences, because distance is always positive. Notice too we could have written
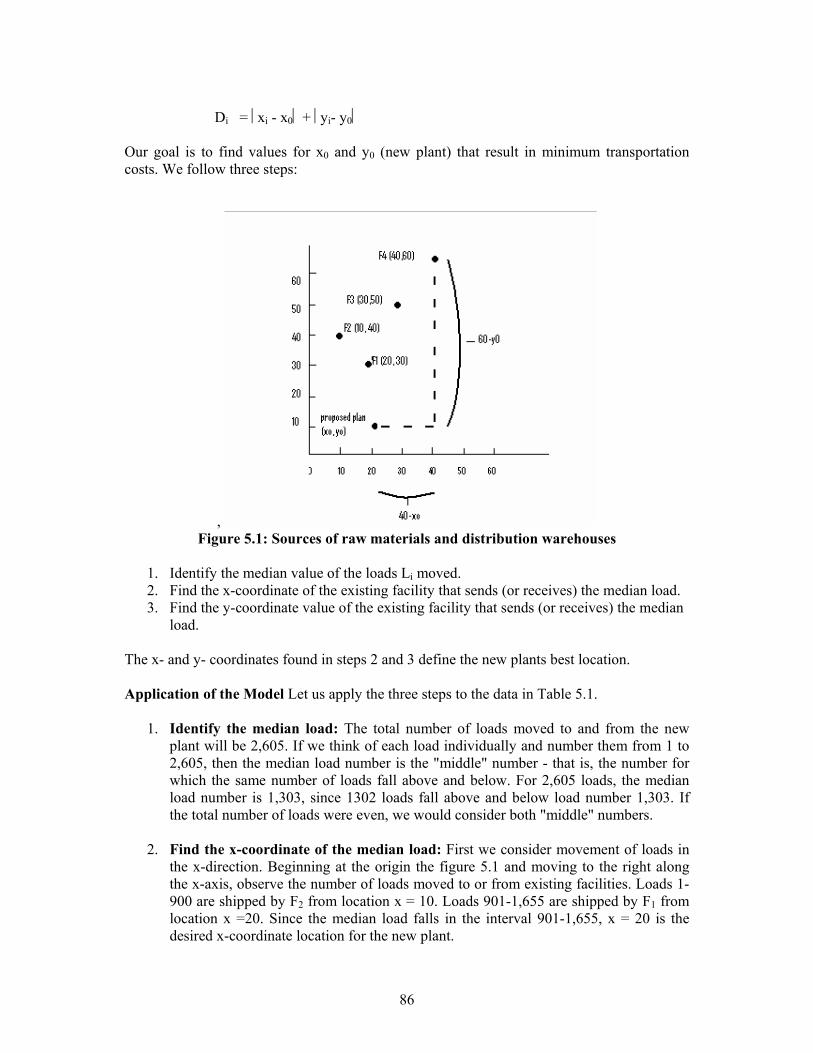
86
Di = xi - x0 + yi- y0 Our goal is to find values for x0 and y0 (new plant) that result in minimum transportation costs. We follow three steps:
, Figure 5.1: Sources of raw materials and distribution warehouses
1. Identify the median value of the loads Li moved. 2. Find the x-coordinate of the existing facility that sends (or receives) the median load. 3. Find the y-coordinate value of the existing facility that sends (or receives) the median
load. The x- and y- coordinates found in steps 2 and 3 define the new plants best location. Application of the Model Let us apply the three steps to the data in Table 5.1.
1. Identify the median load: The total number of loads moved to and from the new plant will be 2,605. If we think of each load individually and number them from 1 to 2,605, then the median load number is the "middle" number - that is, the number for which the same number of loads fall above and below. For 2,605 loads, the median load number is 1,303, since 1302 loads fall above and below load number 1,303. If the total number of loads were even, we would consider both "middle" numbers.
2. Find the x-coordinate of the median load: First we consider movement of loads in
the x-direction. Beginning at the origin the figure 5.1 and moving to the right along the x-axis, observe the number of loads moved to or from existing facilities. Loads 1-900 are shipped by F2 from location x = 10. Loads 901-1,655 are shipped by F1 from location x =20. Since the median load falls in the interval 901-1,655, x = 20 is the desired x-coordinate location for the new plant.

87
3. Find y-coordinate of the median load: Now consider the y-direction of load movements. Begin at the origin of Figure 5.1 and move upward along the y-axis. Movements in the y direction begin with loads 1-755 being shipped by F1 from location y=30. Loads 756-1,655 are shipped by F2 from location y=40. Since the median load falls, in the interval 756-1655, y=40 is the desired y-coordinate for the new plant.
The optimal plant location, x =20 and y=40, results in minimizing annual transportation costs for this network of facilities. To calculate the resulting cost, we use equation 5.1: n Total transportation cost = ∑ CiLi (x- xi + y-yi) i=1 Total cost, $45,550 Some concluding remarks are in order: First, we considered the case in which only one new facility is to be added. Second, you should not an important assumption of this model: Any point in the x-y coordinate system is an eligible point for locating the new facility. The model does not consider road availability, physical terrain, population densities, or any other of the many important location considerations. The task of blending model results with other major considerations to arrive at a reasonable location choice is a major managerial responsibility. Linear Programming: Linear programming may be helpful after the initial screening phase has narrowed the feasible alternative sites. The remaining candidates can then be evaluated. , one at a time, to determine how well each would fit in with existing facilities, and alternatives that leads the best overall system( network) performance can be identified. Most often, overall transportation cost is the criterion used for performance evaluation. A special type of linear programming called the distribution or transportation method is particularly useful in location planning. The mechanics of this technique are omitted in the example. Example: Alpha Processing Company has three Midwestern production plants located at Evansville, Indiana: Lexington, Kentucky; and Fort Wayne, Indiana. Five-year operations plans require that 200 shipments of raw materials be delivered annually to the Evansville plant, 300 shipments to Lexington, and 400 shipments to Fort Wayne. Currently, Alpha has two sources of raw materials, one at Chicago, Illinois, the other at Louisville, Kentuchy. The Chicago source can supply 300 shipments per year and Louisville, 400. An additional source of raw materials must therefore be found. Preliminary screening by Alpha has narrowed the choice to two attractive alternatives: Columbus, Ohio and St. Louis, Missouri. Each of these sites can supply 200 shipments per year. Alpha has decided to make its selection on the basis of minimizing transportation costs. Estimates of the cost per shipment from each source to each plant are shown in Table 5.3 The cost analysis for Alpha Company proceeds in two stages.
1. The first stage determines the number of shipments from each source to each plant that yields the lowest possible cost, assuming Columbus is the third source.
2. The second stage determines the number of shipments yielding the lowest possible cost, assuming St. Louis is the third source. The minimum Columbus cost is

88
compared to the minimum St. Louis cost, and the cheaper site is selected. A final solution for Alpha is shown in Figure 5.2
Table 5.3 Sources, destinations, and costs of raw material shipments Destination (cost per shipment)
Source Evansville Lexington Fort Wayne Shipments Available
Chicago $200 $300 $200 300 Louisville 100 100 300 400 Columbus 300 200 100 200 St. Lousis 100 300 400 200 Shipments needed
200 300 400
If Columbus is selected, minimum annual shipping costs will be $120,000. This occurs if 100 shipments go from Chicago to Evansville (costing $200 each), 200 shipments from Chicago to Fort Wayne (costing $200 each), 100 from Louisville to Evansville ($100 each), 300 from Louisville to Lexington ($100 each), and 200 from Columbus to Fort Wayne ($100 each). These shipment quantities, shown beneath the diagonal lines in part (a) of Figure 5.2, satisfy the raw material needs of all three plants and fully uses the capacities of all three raw materials sources. Any other pattern of shipments will result in higher annual shipping costs. Part (b) of Figure 5.2 shows that if St. Louis is selected he minimum annuals cost will be $140,000. Columbus is therefore selected, at a cost of $120,000 annually.
Figure 5.2 Evaluation of Alpha transportation costs Notice that the linear programming model differs from the simple median model in two fundamental ways.
1. Number of alternative sites: The simple median model assumes that all locations are eligible to be the new location. The linear programming model, in contrast, considers only a few locations pre-selected from preliminary feasibility studies.

89
2. Direction of transportation movements: The simple median model assumes that all shipments move in rectangular patterns. The linear programming model does not so assume.
Behavioral Impact in Facility Location: Our previous discussions of models focused on the cost consequences. But costs are not the whole story, and models can't account for aspects of a problem that are not quantifiable. New locations require that organizations establish relationships with new environments and employees, and adding or deleting facilities requires adjustments in the overall management system. The organization structure and modes of making operating decisions must be modified to accommodate the change. These hidden "system costs" are usually excluded from quantitative models, and yet they are very real aspects to location decisions. Cultural Differences: The decision to locate a new facility usually means that employees will be hired from within the new locate. It also means that the organization must establish appropriate community relations to "fit into" the locale as a good neighbor and citizen. The organization must recognize the differences in the way people in various ethnic, urban, suburban, and rural communities react to new businesses. Managerial style and organizational structure must adapt to the norms and customs to local subcultures. Employees' acceptance of authority may vary with subcultures, as do their life goals, beliefs about the role of work, career aspirations, and perceptions of opportunity. These cultural variations in attitude impact on the job behavior and talent. At the international level are even greater cultural differences. Compare, for example, the Japanese work tradition with that of Western industrial society. Japanese workers are often guaranteed lifetime employment. Management decisions usually are group rather then individual decisions. Employee compensation is determined by length of service, number of dependents, and numerous factors apart from the employee's productivity. Obviously operations managers in Japan face a very different set of managerial problems from their U.S. counterparts. Wage determination, employee turnover, hiring and promotion practices are not at all the same. The European social system, as another example, has resulted in a more "managerial elite" in their organizations than in U.S. organizations. Because of education, training and socialization, including a lifelong exposure to a relatively rigid class system; lower subordinates are not prepared to accept participative managerial styles. This has resulted in organizations more authoritarian/centralized than participative /decentralized. Locating a new facility in a new culture is not simply a matter of duplicating a highly refined manufacturing process. Merely transferring tools and equipment is not adequate. Managerial techniques and skills, in proper mixture, must be borrowed from the culture, and so must the cultural assumptions that are needed to make them work. Clearly, the economic, political makeup of a society has far-reaching effects on the technological and economic success of multinational location decisions. Job Satisfaction: In recent years managers have been very concerned about employee job satisfaction because it affects how well the organization operates. Although no consistent overall relationship between job satisfaction and productivity seems to exist, other consistent relationships have been found. As compared with employees with low job satisfaction, those expressing high job satisfaction exhibit the following characteristics.

90
• Fewer labor turnovers • Less absenteeism • Less tardiness • Fewer grievances
These four factors can substantially affect both costs and disruptions of operations. But how is job satisfaction related to facility location? There is some evidence that satisfaction is related to community characteristics such as community prosperity, small town versus large metropolitan locations, and the degree of unionization. Accordingly, a company with facilities in multiple locations can expect variations in employees' satisfaction due to variations in attitudes and value systems across locations. ---------------------------------------------------------------------------------------------------------------- 5.6 REVIEW QUESTIONS ----------------------------------------------------------------------------------------------------------------
1. What is importance of Facility location in Production and Operation management? 2. What are various strategies for effective facility location? 3. Define Globalization. What is impact of Globalization on the choice of a facility? 4. How do multinationals choose the location of their industry? Explain giving some
examples from Indian context.

91
---------------------------------------------------------------------------------------------------------------- LAYOUT DESIGN ---------------------------------------------------------------------------------------------------------------- Structure 6.1 Introduction 6.2 Layout Planning 6.3 Layout types 6.4 Design of Product and Process Layout 6.5 Job Design 6.6 Work Measurement 6.7 Review Questions ---------------------------------------------------------------------------------------------------------------- 6.1 INTRODUCTION ---------------------------------------------------------------------------------------------------------------- Plant layout is a floor plan of the physical facilities which bare used in production. Layout planning is referred to the generation of several possible plans for the spatial arrangement of physical facilities and selects the one which minimizes the distance between departments. The following are the main objectives of plant layout:
• Minimum investment in equipment • Minimum overall production time • Utilize existing space effectively • Provide for employment convenience, safety and comfort • Maintain flexibility of arrangement and operations • Minimized material handling costs • Facilitate the manufacturing process • Facilitate the organizational structure
Imagine yourself visiting a multi-specialty hospital for a master health check up. What if the radiology department was located in the second floor, the general physicians were sitting in the ground floor at the rear side, ECG and tread-mill test facilities were in the fourth floor and so on. Finally, imagine that you need to walk out of the main complex and go 50 meters away to another building to have your breakfast after you give your fasting food samples and return to the main complex to continue with the process. Such instances are uncommon. How many times have you felt that you were made to walk too much in a hospital when you went for a health check up or you went to a financial institution asking for a loan sanction or to a government office to pay some utilities bill and make some enquiries? What is the core problem in these examples? In simple terms, these examples suggest that with better arrangement of resources it is possible to provide better service to the customers. That is where layout planning in manufacturing and service organization is important.
92
---------------------------------------------------------------------------------------------------------------- 6.2 LAYOUT PLANNING ---------------------------------------------------------------------------------------------------------------- Layout planning in manufacturing and service organizations deals with the physical arrangement of various resources that are available in the system with the objective to improve the performance of the operating system, thereby better customer service. Typically, in case of a manufacturing organization, there may be over 200 machine tools of various kinds to be located in a machine shop. Similarly, in the case of a service organization such as hospital or hotel, there are various resources to be physically located. We can identify the best possible locations for various resources in organizations through good layout planning exercise. Layout planning provides a set of tools and techniques that help an operation manager to decide where to locate the resources and also to assess the impact of the alternative choices that he/she may have for locating the resources. A good layout design will ensure that a vast majority of jobs in a manufacturing system may have to travel shorter distances before completing their processing requirements. Similarly, in the case of service organizations, customers may need to walk shorter distances and spend less time in the systems of the processes come down. On the other hand, a bad layout design will result in longer distances to be covered before completing the process. This creates several problems in organizations and several key performance measures suffer. The most significant and visible effect is the time taken to complete the process. Longer distances would mean more time to complete the process and more material handling in the case of manufacturing organization, leading to higher material handling costs. Eventually, in both service and manufacturing systems, this leads to poor quality. Implications of Layout Planning: Addressing the layout planning problems it begins with good understanding of the key factors that influence the layout design. The nature of issues to be tackled and the manner in which these issues could be addressed vary from one type of organization to another. Let us consider a high variety manufacturer such as Bharat Heavy Electrical Limited (BHEL) and that of high volume manufacturer such as Maruti Udyog Limited (MUL); it is reasonable to expect that the basis on which the resources are to be located will differ in these two cases. A high volume manufacturer like MUL will have dominant flow pattern and this information will be useful for the layout planner. On the other hand, in the case of low volume manufacturer like BHEL there will not be dominant flow of material in the shop. The demand placed on different resources will vary widely in this case from time to time. In more general case, the relationship between ‘volume-variety-flow’ provides crucial inputs to a layout problem. Variety and volume are inversely related in any operating system. Thus, when variety is low, the volume of production is high. The typical examples are processing industry firms such as petrochemical manufactures and mass manufacturers such as automobiles components manufacturers. In these cases, the flow is highly streamlined. Raw materials move progressively through the system from one end of the process until to reach the final assembly, testing and packing, similar effect exists in service systems also. In case of fast food joint with just few offerings, the process could be highly streamlined. Customers may enter the eatery, place , order and pay at the cash counter, move to the delivery counter, pick up their order, and move to the dining area. Finally, they may move to disposal area to leave their used plates before exiting the system. At the other extreme is a project shop. In a project shop the volume is typically one. Examples include building of large scale power projects, nuclear facilities, and a multi-level flyover system for a large metropolitan city and

93
so on. Resources requirements in these projects are vast and varied, uneven in demand and stretched over long periods. Therefore, layout planning is a very different problem. Between these two extremes we have operating systems that vary volume-variety dimension and therefore, have varying flow implications. As variety increases the volume drops, leading to batch manufacturing firms. Further increase in variety leads to reduction in volume as we find in case of job shops and customized product and service providers. In general, as the flow becomes more cumbersome, the type of layout may significantly influence the ability of operation manager to effectively plan and control operations on shop floor. ----------------------------------------------------------------------------------------------------------------6.3 LAYOUT TYPES ---------------------------------------------------------------------------------------------------------------- It is clear from the above discussion that alternate types of layouts are required for the above systems. Over the years, operation management researchers and practitioners have evolved certain types of layouts. These are described below: Process Layout: A process or functional layout is an arrangement of resources on the basis of process characteristics of the resources available. Consider a machine shop consisting of lathes (L), grinders (G), milling machines (M) and drilling machines (D). A sample process layout for this shop is shown in the figure 6.1. In the example, components belonging to product A first visit a lathe, then they visit a drilling machine, a milling machine and finally a grinding machine .The sequence of visits is functional of the process plan and is available in route card. The major implication of this design is that each component manufactured in the shop needs to visit the machines in order of their processing. In reality, when the number of components manufactured is large, there will be enormous crisscrossing in the shop, as components need to visit machines in multiple combinations. This increase material handling and poses challenges for production control. Each department in a process layout is typically organized into functional groups. Thus all lathes will be organized into a lathe department. Similarly, there will be drilling department milling department and so on. In the fabrication area a similar arrangement would be a welding department, fitting department, and shearing department and so on. All manufacturing support areas are also arranged on a functional basis. Examples include maintenance department, quality control department procurement store and production control department. Product Layout: A product layout is an alternative design for the arrangement of resources. In this case the order in which the resources are placed exactly follows the visitation sequence dictated by a product. In product layout shown in figure 6.1 the required set of resources for every product is made available in dedicated fashion. Due to this, it is possible to arrange the resources in the order of machining requirements and ensure smooth component flow in the shop. Since each product will have its own set of resources, material handling is simpler and it is possible to invest in fixed path material handling systems to speed up material transfer between successive work stations. Moreover, the production volumes also are higher. The production control issues are much simpler in a product type layout as compared to the process layout.

94
Figure 6.1: A Sample Process Layout Very often the final assembly in several manufacturing plants follows a product layout. The assembly workstations are designed in such a manner that at each workstation a part of the job is completed. The feeder stations are linked to assembly workstations to ensure material availability. As the products move through the assembly the process is completed. Testing, final inspection and even packing could be part of this layout so that at the end of the line it is ready for dispatch to the market. The notion of product and process layouts applies not only to manufacturing settings but also to service settings.
Figure 6.2: A Sample Product Layout Group Technology Layout: Product layouts are feasible only in case of mass production systems. When the production volume is less, it may be difficult to justify dedication of resource to individual products. Therefore, organizations have been using process layouts for such situations. However, since process layouts create more problems in production planning and control’ due to complex routing of various components on the shop floor, operation managers were looking for alternatives to the process layout. On the other hand, there has been an increasing trend towards more variety. The industrial fans and blowers division of

95
ABB Ltd, a multinational company operating in India manufactures about 725 models, Titan Industries increased the jumpers of watch models from 850 in 1993 to 1200 in 1996, an average more than 100 new models every year. Group Technology (GT) layout provides an alternative method for configuring resources in organizations that have mid-value, mid variety product portfolios. Group Technology is a philosophy that seeks to exploit commonality in manufacturing and uses this as the basis for grouping components and resources. The implications of GT are often known as cellular manufacturing. In cellular manufacturing, the available components are grouped part families. An approximate measure for manufacturing similarity is used to identify part families. Corresponding to each part family, machine groups are identified and layout is formed accordingly. The benefits of GT are many. Once the part families and the machine groups are identified, the layout ensures that each cell has only a certain number of components to be processed. In essence, it is akin to breaking a monolith structure into smaller, more manageable and independent units of production. The components seldom travel outside their respective cell for processing. Therefore, material handling becomes easier and traceability improves. Moreover, employees are able to relate better to their workplace and make concerned improvements. The new structure also helps to implement several other operations management practices such as small group improvement, Kaizen and JIT manufacturing practices. Fixed Position Layout: There are several situations in which the product manufactured is very bulky, difficult to move and is often made in quantities of one or few pieces. In such situations, the layout design ought to be very different. Typical examples include building very large machines tools and equipments, ships, and aircraft building. Since the equipments are very large and bulky they dictate several choices with respect to layout. The specific orientation of the equipment will dictate the placement of specific resources required for the process. Layout planning in such cases is often a question of a good work place organization Some examples include the nuclear engineering division of Bharat Heavy Electrical Division at Tiruchirapalli, the final assembly panel of advanced helicopter division. Reasons for Location Changes: In addition to the need for greater capacity, there are other reasons for changing or adding locations.
1. Changes in resources may occur. The cost or availability of labor, raw materials, and supporting resources (such as subcontractors) may change.
2. The geography of demand may shift. As product markets change, it may be desirable to change facility location to provide better service to customers.
3. Companies may merge, making facilities redundant. 4. New products may be introduced, changing the availability of resources and markets. 5. Political and economic conditions may change.
---------------------------------------------------------------------------------------------------------------- 6.4 DESIGN OF PRODUCTS AND PROCESSES ---------------------------------------------------------------------------------------------------------------- Design of Product layout: Layout design for products can be classified into the following two methods
• Manual methods • Computerized methods

96
Manual Methods: Under this category there are some conventional methods like travel chart and Systematic Layout Planning (SLP). We will discuss Systematic Layout process: Systematic Layout Design Method (SLP) This is an organized approach to layout planning. This approach has been developed by Muther. It is clear that once the appropriate information is gathered, a flow analysis can be combined with an activity analysis to develop the relationship diagram. This space-relationship diagram is constructed by combining space considerations with the relationship diagram. Based on space relationship diagram, modifying considerations and practical limitations, a number of alternative layouts are designed and evaluated. Computerized methods: Under these methods the layout design procedures can be classified into constructive type algorithms and improvement type algorithms. Constructive type algorithms are:
• Automated Layout Design Program (ALDEP) • Computerized Relationship Layout Planning (CORELAP)
Improvement type algorithms are:
• Computerized Relative allocation of Facilities Technique (CRAFT) We shall be discussing only Computerized Relative Allocation of Facilities Technique (CRAFT). This algorithm was originally developed by Armour and Buffa. Craft is more widely used than other computerized methods. It starts with an initial layout and improves the layout by interchanging the department’s pair wise so that the transportation cost is minimized. CRAFT requirements
• Initial layout • Flow data • Cost per unit distance • Total number of departments • Fixed departments , their number and location • Area of departments.
CRAFT Procedures: The steps of CRAFT algorithm are summarized below Step 1:
• Number of Department • Number of interchangeable departments • Initial layout • Cost matrix • Flow matrix • Area of departments

97
Step 2: Compare cetroids of departments in the present layout. Step 3: Form distance matrix using the controls Step 4: Given data on flow, distance and cost, compute the total handling cost of the present layout Step 5: Find all the possible pair wise interchanges of departments based on common border of equal area criterion Step 6: Find the pair of departments corresponding to minimum handling cost from among all possible pairs of interchanges. Step 7: Interchange the selected pair of departments. Call this new layout ---------------------------------------------------------------------------------------------------------------- 6.5 LAYOUT DESIGN FOR SERVICES ----------------------------------------------------------------------------------------------------------------The principles of designing layouts for manufacturing settings do apply for service setting also. However, there are other aspects of the service system that will influence its layout design. Therefore, the layout designer should factor in these also during the design process. Two important factors that influence the layout design problem of in a service organization are degree of customer contact and line of visibility. Customer contact refers to the physical presence of the customer in the system. For example, in a restaurant, customers’ presence is confined to the dining area. The kitchen, back office and stores are areas that are outside the zones of physical presence of the customers. Similarly, in the case of a bank, front office, facilities such as cash and payment counters and locker facilities have a customer contact, whereas the record keeping rooms, network infrastructure facilities, strong rooms and other such facilities are outside scope of customer access. By degree of customer contact we mean the percentage of time the customer spends to get service. The notion of customer contact significantly influence service delivery and layout design .If the firms aim to high degree of service, then the customer convenience is of paramount importance and the firms may have to forego the efficiency aspect of design. Appropriate ambience comfort of using and extent of travel and the search required to get the service well done are key objective of design. On the other hand, if the design is with low customer contact, efficiency in utilizing the space as well as other resources could be pursued without seriously jeopardizing service efficiency. One of the fallouts and operational implications of the degree of customer contacts the line of visibility available to the customer. As the degree of customer contact increase, the line of visibility also gets pushed back in the system. Therefore more and more aspects of business processes are exposed to customers, paving the way for multiple opportunities for jeopardizing service quality. Layout decisions are critical in such situations. ---------------------------------------------------------------------------------------------------------------- 6.6 JOB DESIGN ---------------------------------------------------------------------------------------------------------------- The Hawthorne Studies conducted from 1924 onwards, showed that productivity is not only influenced by asset of methods and procedures that specify a set of tasks but also by employees feelings about their jobs. This is actually one of the major determinants of productivity. For many years, Job Design has also been involved with the physical environment of the job. This often means specifying the allowable levels of noise, dirt, temperature, and the layout of facilities. Job Design also takes into account all factors which affect the work and organizes the content of the tasks .Job Design refers to the way that a set of tasks or an entire job is organized within the social and psychological environment of the organization. Job Design helps to determine:

98
• What tasks are done • How the tasks are done • How many tasks are done • In what order the tasks are done
Humans have certain physiological, psychological and sociological characteristics. In performing work, human functions at three different levels:
• They receive information through the sense organs, • Process the information received and the information stored in the memory for
decision making • Take action based on these decisions. The decision may be automatic based on
learned responses, as with a highly repetitive jobs, or may involve extensive reasoning and the results may be complex.
These characteristics define their capabilities and limitations in the work situation. There is variation in these characteristics among individuals. In addition, there are socio-psychological and socio-technical factors that determine behavior. Such factors include not only how a job is done, but the employee feels about the job. It takes into account how easily or quickly a person may perform a job and how she or he will react emotionally to that job and the environment in which it is performed. Job Design, as it is seen today, has expanded to include social and psychological environment by considering what are called socio-psychological factors related to a job and socio-technical considerations- the social and technical make-up of the individual Socio- technical Factors: Based on different levels of human functioning the socio-technical theory believes that machines and humans at one level have the general structure of a closed loop automated system. However, machines and humans are alike in certain important respects. Both have sensors, stored information, comparators, decision makers, effectors and feed back loops. The difference between the two is that unlike machines—which are specialized in the kind of ranges of tasks they can perform—humans have tremendous range of capabilities, and limitations which are imposed by their physiological and sociological characteristics. Machines perform tasks as faithful servants reacting mainly to physical factors. Humans, however, react to their psychological and sociological environments as well as to the physical environment. Socio-technical theory believes that humans operate on socio-technical systems. In their job environment, they optimize both social and technological considerations. Every socio-technical system is defined by the social aspects, reflected by the environment that consists of culture and its values and by a set of generally accepted practices. The environment provides certain roles for organizations, groups and people while technology imposes constraints that limit the possible arrangements of processes and jobs and thereby impact job satisfaction and social system needs. According to socio-technical principles, Job Design is the application of the concept of their joint optimization between technology and the values of the social systems. Socio-psychological factors: Humans have certain physiological, psychological and sociological characteristics that define their capacities and limitations in the work situation. They can be related to empirical evidence that suggests that workers prefer tasks of a

99
substantial degree of wholeness, in which the individual has control over the materials and the process involved and which integrates the employee into the fabric of organization. Keeping these observations and empirical evidence in mind, jobs should be designed such that there are an optimal variety of tasks within each job. The optimal level is one that allows the employee to rest from the high level of attention or effort while working on another task or, conversely to stretch after a period of routine activity. There is research that suggests employees derive satisfaction from using a number of skilled levels. There are some points that must be considered for Job Design:
• The jobs should be challenging for each skill category • It is important that the group or individual undertaking the job should be able to
exercise some control over their work. • Area of discretion and decision making should be available to them. • Ideally, employees should have some responsibility for setting their own standards of
quantity and quality. • There should be clarity in the sets of tasks. Wherever possible, a group or individual
employee should have responsibility for a set of tasks that is clearly defined, visible and meaningful.
• As people have sociological needs, they require feedback. Workers should know when they have achieved their targets and how they are doing relative to others.
Performance and Job Design: Achieving good Job Design involves administrative practices that determine what the employee does, for how long, where and when as well as giving the employees choices wherever possible. In Job Design, you may choose to examine the various tasks of an individual job or design of a group of jobs. Job Design principles can address problems such as:
• Work overload • Work under load • Repetitiveness • Limited control over work • Isolation • Shift work • Delay in filling vacant positions • Excessive working hours • Limited understanding of the whole job process.
However, one has to look beyond these limitations. Job Design is more rewarding if we understand the psychological and sociological of employees. In determining whether a job is designed for high performance, we require to look at four basic spans of the job--- control, accountability, influence and support. The span of control is reflected in each employee wanting to know the answer to four basic questions:
• “What resources do I control to accomplish my task,?” • “What means will be used to evaluate my performance?” • “Who do I need to interact with and influence to achieve my goals?” • “How much support can I expect when I reach out to others for help?”

100
Each span can be adjusted to get the setting right. ---------------------------------------------------------------------------------------------------------------- 6.7 WORK MEASUREMENT ---------------------------------------------------------------------------------------------------------------- It is the determination of the degree and quantity of labor in performing tasks. It is actual quantifying of performance dimensions. Managers are used to measuring work in terms of "hours of work done". In many cases, this provides very inaccurate data on performance. With performance measurements which depend on establishing standards, we can determine how well a process is proceeding to forecast the end conditions. The fundamental purpose of work measurement is to set time standards for work. Standards are needed for several reasons: One reason is the need to measure performance, which requires a comparison of accomplishment against a standard. Performance data is needed so that one can avoid surprises when one has to make decisions. All scheduling requires some estimate of how much time it takes to do the work. Standards are necessary to schedule work and allocate capacity. Standards are used in industry as a basis for payments to workers where output based incentive plans employed. This requires an objective basis for motivating the workforce and measuring worker's performance. Costing and monitoring of work presume the existence of standards. In contracting, this is particularly important for new contracts. Questions such as "Can we do it"? And "How best can we do it"? Can only be answered using standards. Most important, standards provide benchmarks for improvement. Using universal standard data, it is possible to compare your work standards with those of similar jobs in other organizations. There are many techniques used to measure work. However, they can be classified into those that rely either on direct observation of the work or indirect observation of the work. Some techniques, such as motion-time systems or standard data can provide standard times from simulation, etc. However, the data on which such techniques are based, are based on earlier observations of actual work. Work Measurement Techniques: There are six basic ways of establishing a time (work) standard:
• Ignoring formal work measurement • Using the historical data approach' • Using the direct time study approach • Using the predetermined time study approach • Using the work sampling approach • Combining approaches 2 through 5
Ignoring Formal Work Measurement: For many jobs in many organizations, especially in the labor-intense service sector, formal labor standards are simply not set at all. The issue of a fair day's work for a fair day's pay is ignored. Even though there is no explicit basis for criticism, workers may be blamed for poor performance and inefficiency. Often, because management has not established a work (time) standard, some informal standard is established by default. Since this informal standard generally compares unfavorably with those set by other techniques, we do not recommend ignoring formal work measurement. Historical Data Approach: This method assumes that past performance is normal performance. In the absence of other formal techniques, some managers use part performance

101
as their main guide in setting standards. What are the advantages of these methods? Basically, it is quick, simple, inexpensive, and probably better than ignoring formal work measurement altogether. The major disadvantage, as you can reason, is that past performance might not at all be what an average worker can reasonably be expected to perform under average working conditions. Direct Time Study: Often called a time study, a stopwatch study, or clocking the job, this technique is certainly the most widely used method for establishing work standards in manufacturing. Perhaps you have observed a job being studied by an industrial engineer, clipboard and stopwatch in hand. How does direct time study work? Basically there are six steps in the procedure:
• Select the job to be timed: The direct time study approach depends upon direct observation and is therefore limited to jobs that already exist. The job selected should be standardized, in terms of equipment and materials, and the worker should be representative of all workers doing the job.
• Select a job cycle: Identify the elements and tasks that constitute a complete cycle. Decided how many cycles you want to time with a stopwatch.
• Time the job for all cycles and rate the worker: Workers behave in varying ways when their performances are being recorded; common reactions are resentments, nervousness, and slowing the work pace. To minimize these effects, repeated study, study across several workers, and standing by one worker while studying a job somewhere nearby, perhaps in another department, can be helpful. You can assign the worker a rating, as a percentage of the "normal" or average worker. Industrial engineers frequently use a rating factor when timing jobs. In essence the engineer is judging the worker as 85 percent normal, 90 percent normal, or some other rating depending on his or her perception of "normal." Obviously, ratings of this kind depend on subjective judgments. Compute the normal time based on the average cycle time and the worker rating. Determine the fraction of time available, making allowances for personal needs; delays, and fatigue,Set the performance standard (standard time) based on the normal time and the allowances.
To be more precise about the calculations of this procedure: Sum of cycle times recorded Average cycle time = ------------------------------------- Number of cycles observed Normal time = Average cycle time x Worker rating Allowance fraction = Fraction of time for personal needs, fatigue, and
unavoidable delays Available fraction of time = 1- Allowance faction Normal time Standard time = -------------------------- Available fraction of time

102
Predetermined Time Study: For setting standards for jobs that are not currently being performed but are being planned, the predetermined time study is helpful. A predetermined time study can also be applied to existing jobs as an alternative to a direct time study. The bases of this technique are the stopwatch time study and time study from films. Historical data have been accumulated on tens of thousands of people making such basic motions as reaching, grasping, stepping, lifting, and standing. These motions have been broken down into elements, each element timed, the times averaged to yield predetermined time standards, and the standards published in table form. The procedure for setting a predetermined time standard is as follows:
• Observe the job or think it through if it is not yet being performed: It is best to observe under "typical" conditions: typical machine, materials, and worker.
• Itemize the job element: Do not be concerned about timing them; just thoroughly document all the motions performed by the worker.
• From a table of predetermined time standards, record the standard for each motion units: Motion units are expressed in some basic scale (a The rblig scale is often used) that corresponds to time units.
• Find the sum of the standards for all motions. • Estimate an allowance for personal time, delays, and fatigue, and to the sum of
standards. This total sum is the predetermined time standard for the job. The primary advantage of predetermined time studies is that they are not skewed by a typical performance of workers who are nervous because they are being timed: the timing has already taken place - away from the workplace in a logical, systematic manner. The basic disadvantage of this technique is that some job elements may not be recorded, or may be recorded improperly. Furthermore, if job elements can't be properly categorized and located in a table, a direct time study approach must be made instead of the predetermined time study. Work sampling: Work sampling does not involve stopwatch measurement, as do many of the other techniques; instead, it is based on simple random sampling techniques derived from statistical sampling theory. The purpose of the sampling is to estimate what proportion of a worker's time is devoted to work activities. It proceeds along the following steps:
• Decide what activities are defined as "working." "Not working" comprises all activities not specifically defined as "working."
• Observe the worker at selected intervals, recording whether a person is working or not.
• Calculate the portion P of time a worker is working as : Number of observations during which working occurred P = -------------------------------------------------------------------------- Total number of observations This calculation can then be used as a performance standard. Work sampling can also be used to set standards; the procedure is similar to the one used in direct time studies.

103
Work sampling is particularly adaptive to service to service sector jobs such as those in libraries, banking, health, banking, health care, insurance companies, and government. Accuracy of this technique depends keenly upon sample size. Disadvantages of work sampling are that the analyst may not be completely objective or may study only a few workers, and that "working" is a broad concept not easily defined with precision. There are, however, some obvious, advantages with work sampling: It is simple easily adapted to service sector and indirect labor jobs, and an economical way to measure performance. In short, work sampling is a useful work measurement technique if it is used with discretion. Combining Work Measurement: Techniques which work measurement technique should you use? In practice, they are used in combination, as cross-checks. One common practice is to observe a job, write down in detail all the job elements, and set a predetermined time standard. Then you can check the history of performance on this or similar jobs to verify that the predetermined standard is reasonable. To provide a further check, a direct time study can be made of the job by element and in total. No one work measurement technique is totally reliable. Because of the high skill level required in setting the standard, a cross-check is desirable whenever possible. ---------------------------------------------------------------------------------------------------------------- 6.8 REVIEW QUESTIONS ----------------------------------------------------------------------------------------------------------------
1. Why is layout planning important? 2. Discuss the various types of layout. 3. Give explain of product and process layout. 4. What is job design? 5. Define work measurement Discus the various types used and work measurement.

104
---------------------------------------------------------------------------------------------------------------- PROJECT SCHEDULING ---------------------------------------------------------------------------------------------------------------- Structure 7.1 Introduction 7.2 Project Management 7.3 Scheduling Project 7.4 Case Study - Scheduling at Bellop 7.5 Logic of PERT 7.6 Review Questions ---------------------------------------------------------------------------------------------------------------- 7.1 INTRODUCTION ---------------------------------------------------------------------------------------------------------------- A project is a one-time-one set of activities with a definite beginning and ending point in time. The activities must be done in a particular order (they have precedence relationships). The key difference between project planning and other types of planning is that each project is a unique entity that occurs just once. ---------------------------------------------------------------------------------------------------------------- 7.2 PROJECT MANAGEMENT ---------------------------------------------------------------------------------------------------------------- Project Planning: Project planning includes all activities that result in a course of action for a project. Goals for the project, including resources to be committed, completion times, and activities must be set and their priorities established. Areas of responsibility must be identified and assigned. Time and resource requirements to perform that work activities must be forecast and budgeted. Project scheduling: This in contrast to project planning is more specific. Scheduling establishes times and sequences of the various phases of the project. In project scheduling, the manager considers the many activities of an overall project and the tasks that must be accomplished and relates them coherently to one another and to the calendar. Example: Slick Wilson, a first-semester freshman at State, is receiving advice from his sophomore roommate on how to study for finals, which start in two weeks. Slick, who has ignored the entire problem until now, is advised to list all his courses and estimate how much time he needs to study for the final in each course. Next, Slick's roommate suggests that he should look in the final exam schedule. When he has determined the order in which he must take his finals, Slick should plan to study for the first one first, the second one next, and so on until he has prepared for all his exams. Slick prepares a study plan according to this advice, adding to the plan that, when he finishes his last final, he will throw the schedule away and forget about finals, school, and his introduction to (finals/project) scheduling.

105
The project in this example is to study for finals. The beginning point in time is now, two weeks before his first final. The ending point is the moment Slick steps in to take the last final. The project activities are studying for various courses. These activities must be time sequenced according to the order and dates he has to take the exams. Viewing final exam preparation as a project, you might use project management to improve the scheduling of your study time at the end of this semester. ---------------------------------------------------------------------------------------------------------------- 7.3 SCHEDULING PROJECT ---------------------------------------------------------------------------------------------------------------- Project Scheduling Models: There are various methods for scheduling projects. Here we will look at two simple project scheduling models - Gantt charting and the Program Evaluation and Review Technique (PERT). Both are schematic models, but PERT also has some mathematical model adaptations. Gantt Charts: A Gantt chart is a bar chart that shows the relationship of activities over time. Table 7.1 gives the symbols often used in a Gantt chart. An open bracket indicates the scheduled start of the activity, and a closing bracket indicates the scheduled completion. A heavy line indicates the currently completed portion of the activity. A caret at the top of the chart indicates current time.
TABLE 7.1. Gantt chart symbols
Symbol
Meaning
[
Start of an activity
]
End of an activity
[-]
Actual progress of the activity
v
Point in time where the project is now
Figure 7.1 shows a Gantt chart of a student preparing for final exams. Project activities are listed down the page and time across the page. The project activities are studying for exams in English, History, Math and Psychology. Math is broken into two sub activities - studying concepts new since the last exam and studying concepts covered on previous exams, for review. By examining the horizontal time axis, we see that all activities must be completed in three and one-half weeks. Studying English, for example, is scheduled to start at the beginning of week 1 and end after one and one-half weeks. The caret at the top indicates that one and has already been done. Students can use this chart to visualize their progress and to adjust their study activities. As you can see, one of the strength of project scheduling with Gantt charts is the simplicity of the schematic model.

106
V
Project activity
Week1 2 3 4
Study English
[------------------ ]
Study History
[------------------ ]
Study Math
Study concepts new since last
exam
[------- ]
Study concepts
covered on previous exams
[ ]
Study Psychology
[ ]
Figure 7.1: Gantt chart for Project Scheduling
---------------------------------------------------------------------------------------------------------------- 7.4 CASE STUDY - SCHEDULING AT BELLOP ---------------------------------------------------------------------------------------------------------------- Introduction: Bellop Ltd. established in the early 1960s as a private firm, is manufacturing a number of electronic equipment items. The organization, being a fairly large one, is a pioneer in the range of products manufactured by it. The technological excellence of its products has gained it a place among organizations, which undertake complex design development work for the electronic industry as a whole. During the late eighties, the company established a unit within its present manufacturing premises, exclusively dedicated to such developmental tasks. The unit was organized to produce fabricated components on the cellular manufacturing principle. Currently, its fabrication shop is divided into five work cells. These cells are, more or less, divided on the basis of operation layouts for components. Each cell processes a group of similar products, due to which, flexibility and economy are achieved in manufacturing. Approximately 50 to 70 percent of mechanical parts go through the paint shop to the assembly; hence, the importance of the paint shops. The present trend indicates that about 70 percent of the load in the paint shop is due to jobs related to PRC and RRA projects. The work cell sequence is maintained for all the jobs but some operations may be skipped

107
depending upon the, routing of a job. More details about various operations in their sequence for the jobs of the particular month studied are given in Table 7.2.
Table 7.2 Sequence of Operations for Jobs
Part
Num
ber
Nam
e
Qua
ntity
Mas
k
Dem
ark
Sand
B
last
Mak
e Se
al
App
lyin
g pu
tty
Putt y
Prim
er
coat
Fina
l C
oat
Scre
en
Prin
ting
Lette
r Pa
intin
g
Gra
nd
Tota
l
2016496501 Housing 245 .103 .22 .045 .053 103.12
21000490133 Housing 275 .1027 .21 .043 .054 103.12
475612420122 Knob 539 .0042 .0031 .005 .0057 9.69 35001035022 Clamp 244 .0036 .0044 .007 .009 5.86 110000403272 Heatsink 30 .035 .047 .036 .017 .017 4.56 110000403175 Heatsink 30 .035 .047 .036 .017 .017 4.56 110000045245 Frame 12 .084 .081 .47 .039 .042 8.592 210002360145 Box
assembly 50 .078 .085 .0765 .52 .141 .047 .054 .047 72.72
5 21162300234 Clamping
frame 33 .031 .046 .021 .024 3.678
130384 Window 45 .0083
.3735
250010360213 Clamp 500 .0027 .0051 .0056 .0061 9.75 210001600150 Cap nut 952 .0019 .0023 .0042 .0052 12.94
7 11000253795 Box 31 .082 .094 .082 .44 .130 .058 .062 .066 44.21 1.00004700324 Reflector
assembly 4 .014 .0267 .0517 .053 .5816
21000161010184
Cavity tube
14 .023 .05 .0048 .0052 1.162
110000023323 Radiator holder
15 .116 .067 .23 .673 .1152 8.868
100004700324 Reflector assembly
21 .014 .267 .517 .053 3.0534
110000020122 Radiator wing
7 .0667 .82 .275 .091 .097 4.2819
35001037024 Plate 131 .031 .033 .029 .0834 .375 .0416 33.46 110.000072114 Device
panel 1 .0616 .068 .05 .1083 .
5 .029 .033 .141
6 .9915
110000023226 Spine 13 .064 .021 .033 1.989 The paint shop can be considered as a job shop inputs coming in batches of different quantities and of different types at different points in time. Yearly forecast / order booking is done by the Sales Department. The forecast gives an idea 0 how many jobs per project are to be processed during the current year. It includes any backlog 0 the previous orders as well. This forecast is considered by various project cells so as to make quarterly schedule for the number of jobs. There are five project cells which monitor the progress of various jobs produced against their requirements. These cells expedite the production in the pair shop on the basis of assembly requirements.

108
The job plan is divided into the categories.
• Monthly production. • Quarterly production. • Yearly production.
The quarterly plan is broken into a monthly plan or monthly list for the parts to be delivered (which are in short supply) for the assembly requirements. Except for RRA accessories and some critical parts of the project, due dates are generally not fixed. There is a senior planning officer whose function is to coordinate the shop floor planning and project cells. Based on his advice, the priority of urgent jobs is fixed. Once a week, the production progress for each project is reviewed by the work cells, project cells and the senior planning officer and corrective actions are decided upon. At the overall operating level, the control is applied through a weekly review of production. Weekly production is monitored by the respective project cells. The general experience of the planning group is that, urgent jobs are always in large numbers. This leads to the disturbance of the normal operation of the production shop and consequently, the equipment utilization suffers. The shop is controlled by a shop planning cell in coordination with an assistant works manager. The shop gets a monthly open shop order for various jobs. The first batch may be a partial one. If it is a partial batch, then the rest of the batch arrives the next time. But this arrival is random. After getting the priority of a job from the project cell, the daily priority of a job order is fixed and it is launched. No completion time of the job is specified on the job order. It is solely dependent upon the discretion of the shop supervisor, who determines the quantity and what jobs are to be loaded together with the jobs with higher priority. Existing Control Procedure: The only method of controlling the system is to monitor the operations and to expedite the jobs which are urgent. Since work standardization has not been done, a due date for the completion of an operation is only tentative and how much time is required for it is decided by the workman himself. Uttampad, the manager of the development division, was facing considerable problems of undergoing delays taking place in the paint shop, which caused heavy rescheduling of assemblies and failure in delivery date commitments; He discussed his problem with the deputy manager (finishing), Anandan, the senior planning officer, Shankar and the superintendent of paint shop, Vora. The following were the main contentions. Anandan felt that if they compared the overall operating system with an ideal system, deficiencies were very many. Shankar, however, felt that a specific schedule had to be made, giving due dates for the completion of the operations so as to minimize the avoidable delay and determine the point of delay in the production process. By giving due dates, a higher level of control over the entire production could be achieved, because some techniques like the critical ration decision rule could be used to determine the priorities automatically. It would also minimize the effect of passing of the buck in respect of delays. A higher number of rush orders reflected a poor system that was existing. Uttampad, however, felt that if due dates could not be given a priority, then obey would have to settle for some sort of loading of facilities with jobs, according to some dynamic priority criterion over very short intervals to utilize the capacity as fully as possible. But the paint

109
shop superintendent, Vora, felt that the capacity of the paint shop was inadequate for the load coming on it. He wanted Khan, the industrial engineering supervisor, to correctly assess the capacity of the shop and submit a report. In his opinion, the capacity was increased, the scheduling procedures, which Shankar felt were required would be of no ask Walker, a young management graduate student (who had approached him for arranging him a project study for his degree) to study the shop and develop a scheduling procedure. Khan made a snap work sampling study and discussed with the supervisors in the paint and finishing shops. He submitted the following report. Khan's Report: For analyzing the existing problems, first a snap work sampling was carried out to estimate the required capacity utilization (see Appendix to report). Then the existing paint shop was studied thoroughly. The paint shop studied could be considered as a batch type production system. The main features of the shop were:
• Intermittent and random arrival of jobs. • Different types of jobs. • Wholly manual operation.
Load and capacity were estimated in man-hour units. Load was defined as the man-hours required performing an operation at normal pace. The total load was obtained as the summation of various loads. Capacity was defined as the potential time available for work, at a work centre expressed in man-hours. For the purposes of calculation of capacity, various allowances like personal time, cleaning work station, shutdown, tool maintenance and unavoidable delays were also considered. A load factor of 0.7 was used because only two projects were considered. Absenteeism and lunch or tea breaks were also considered in determining the capacity. Estimation of Available Capacity:
1. Net capacity for various operations is calculated as shown below 2. Net capacity available per shift was calculated using the formula 3. Net capacity /shift in man-hours= available hours shift x allowance factor 4. x absenteeism factor x load factor
Further, it was decided to estimate the representative time per part. Based on observations, the times for different operations and their averages were computed depending on the type of job and operations. Proper allowances (fatigue, personal and others) were added to these on the basis of the standards prescribed by the International Labor Organization (ILO). In arriving at these timings the views of the workers themselves and the shop supervisions were given due weightings. Acceptance of these times by the workers facilitated their use in short interval scheduling (SIS) Since it was not possible to observe the operations of the all the parts, Khan decided to_ extrapolate the time per operation for the remaining parts on the basis of representative parts of that category. It was assumed after discussion with the management, that a measure of the painting time could be taken as proportional to the painted area. After estimating the average time per operation for all the jobs in a month it was added up for different operations and the total load in terms of man-hours was calculated.

110
Capacity Utilization: The load cleared (in man-hours) for the month in the study was as follows; Stenciling 15.49
Sand blasting 168.19
Painting 281.80
Screen printing 33.55
Sub-total 499.03
Other manual operations 818.94
Total 1317.97
Standard man-hours available = 3173.8 for the month.
Therefore,
Overall capacity utilization = 1317.9/3173.8
= 41.5%
This was comparable to the work sampling results. As compared to this, the loard for the next
month (in man-hours) was as follows:
Estimated for the next month
Painting 178.66
Stenciling 11.15
Screen printing 4.02
Sand blasting 35.71
Manual 673.26
The expected load capacity rations were as follows:
Painting 175/209.83=0.83
Stenciling 11.2/141.68=.079
Screen printing 35.70/141.6=0.25
Sand blasting 4.0/70.5= 0.05
Manual 673.3/1039=0.64
Therefore, the painting and manual operations were the bottleneck in the system and an extra paint booth might be required if the capacity utilization as low as in the previous months. But due to the flexible nature of manual operations, man-power could be diverted to manual work from stenciling, sand blasting and screen printing booths, and this had to be exploited in the development of any algorithm for scheduling of jobs in the paints shop.

111
Walker's Report on the Proposed Scheduling Procedure: Similarly, Walker the management graduate student studied the shop along with Khan for about one and half months and submitted a report to Uttampad as given in the following Appendix. Appendix to Khan's Report Details of work sampling:
Total number of observations = 98
Total number of observations when paint
Booths were used = 20
Total number of observations when sand
Blasting booths were used = 7
Total number of observations when stenciling
Booths were used = 21
Total number of observations when
Screen painting was done = 7
(i) Utilization of point booth = 20/98
=20.4%
(ii) Utilization of sand blasting booth = 7/98
= 7.14%
(iii) Utilization of stenciling booth = 21/98
= 21.4%
(iv) Utilization of screen painting fixture = 7/98
= 7.14%
Note: For the purposes of calculating the number of observations, the following formula was
use<1
b=fx, op (1-p/n) where
h =+or-1O%
1 = 1.96 for 90% confidence interval with normal distribution
Ip= 0.4, i.e. the utilization is 40%
One of the problems of scheduling or controlling in the job shop under consideration is the requirement of data on the status of the system. An associated problem is that such data pertaining to the production system may not be available. Thus, many decisions are to be based on insufficient data. Another problem is to develop a scheduling procedure which works in practice. There are two phases of controlling an intermittent job shop. The first phase is loading and the second is scheduling.

112
Loading: A load is the amount of work assigned to a facility and loading is the assignment of work to a facility. A chart can tell us in advance whether there is an overload or underload. Loading can be used to smooth the work load in small scheduling periods. For loading effectively information is required on the following points:
• The work assignment. • The work content of the assignments, 3. Notice of assignment completion.
In the present study, work assignment was first determined. From the part production progresses and project process chart, the number and type of parts coming for the processing in the paint shop were obtained. Since the work content was not given full in the operation analysis and routing chart, it W2 is estimated with the help of shop supervisors. For example, the operation and routing chart does not_ say whether the putty is to be applied or not, how standardization of the operations and labor force. Therefore, the times for the operation were estimated on the basis of a number of observations and extrapolation to various other parts for which personal observations were not possible. By aggregation the total work content for a particular month was calculated. The required date of completion of a part was not normally given a priority by the management. There was only a part planning system in the operation on the basis of monthly loading. Therefore, it was not possible to know in advance as to when a particular part would be required from the paint shop. Therefore, the capacity was estimated for the paint shop on the basis of a work study and the standard times of fabrication shop. Scheduling, on the other hand, can smoothen the production, minimize the inventories, shorten the lead times and eliminate bottlenecks. Since the scheduling in the time-phasing of a job, the time of its starting is required. There are various scheduling techniques applicable is the case of intermittent job shops. Priority scheduling approaches, such as shortest processing time, minimum operations etc., could not be employed because the operation times were not accurately known. Therefore, it was decided to use the available 'man-power effectively and to improve the process time of the jobs. Thus, for this purpose, short interval scheduling (SIS) was considered the most suitable approach. Short Interval Scheduling: The main characteristic of the approach is the short interval used to describe the work activities or operations. The usual time interval is in hours and tenths of an hour. The work to be assigned to one man is broken down into a series of short tasks to which reasonable times are assigned. The overall time for the job is the summation of SIS times assigned. The operations are assumed to be steady and at average pace. The emphasis is on the minimization of idle time. Using the SIS in its best sense, the worker should perform at or near the peak efficiency with a minimum of breaks. Thus is can optimize the performance of the point shop alone by keeping in mind the various constraints. Workers were assigned specific jobs. Estimated times were used in SIS in order to reduce the amount of sequential mental planning required of the operator. To be fair to the workers, maximizing communication between the shop superintendent and the workers was recommended. As a first step in establishing SIS, an operation or an occurrences sheet was prepared in which operations were listed in sequential order. After this, various data required under each source and control unit information were listed (the control unit is 'the operations unit of

113
production, which lists components, assemblies, drawings and other reference materials, the frequencies of operations and the times required for each operation). These were taken from historical data. In establishing times for each operation, contact between the foreman and workers had to be encouraged. During the initial implementation there might be below par performance due to orientation in requirements. For this reason, the missed schedule report is recommended. It records all the assignments not completed in time. The key section is the column headed 'corrective action'. In this column, the scheduler notes why the schedule was not met and what corrective action was taken. A daily or weekly performance report can also be prepared. This is similar to the missed schedule report but can also report routine or better performance. A daily performance report can be made on an individual basis while the weekly report can be made on departmental basis. Since the operations were not standardized, this method which seems quite reasonable in the present context could not be recommended in its entirety. Therefore, only its concept was used in developing a scheduling algorithm. The Algorithm: Having considered various available techniques, it was clear that none of them could be used in total to schedule the jobs in the paint shop. Therefore, it was decided to make a combination of these to provide a new approach in scheduling the paint shop on daily basis. An algorithm was developed to suit the present system of operation. The algorithm is developed with the objective of using the manpower effectively, and maintaining the priority of the jobs. Scheduling of the paint shop should be done in entirely and it should not disturb the overall system. The algorithm takes the following information as input and gives job operations personnel allocation as the output, while maintaining the priorities:
1. Priority list of the jobs with specified quantity per order. 2. Persons available and their capability of performing an operation. 3. Constraints on the number of persons due to non-availability of facilities. 4. Hours available per shift.
The algorithm has the following constraints:
• At any instance of time, at the most three paints booths or two sand blasting booths or one screen printing fixture will be in operation.
• The operation sequence cannot be altered and is to be strictly adhered to. • Partial batch processing is not permitted. • Partial operation is not possible. • An incomplete batch will be given its due priority in the next shift. Whenever an
operation is allocated to different workmen they would start the work simultaneously. Assumptions: The following assumptions are made in developing the present algorithm.
• The shop supervisor will be given a specific priority list. • The required batch quantity will be known in advance. • There will be no delay for want of instruction. • Material movement times will be negligible.

114
---------------------------------------------------------------------------------------------------------------- 7.5 LOGIC OF PERT ---------------------------------------------------------------------------------------------------------------- Development of PERT: In 1958 the U.S. Navy developed Program Evaluation and Review Technique (PERT) for planning and control of the Polaris nuclear submarine project. the results of using PERT in that application, in which some 3,000 contractors were involved, is generally reported to have reduced by two years the project completion time for the Polaris project. In both government and industry today PERT is still widely used.
Figure 7.2: Network of nodes and arcs A similar modeling approach called the Critical Path Method (CPM) is also used by business and government. Since CPM and PERT are nearly equivalent, we will concentrate only on PERT. Application of PERT First we should clarify the conditions under which PERT may be appropriately used. If your situation lacks the following features, PERT will yield little benefit.
• First, the project must be one whose activities clearly are distinct and separable. • Second, the project and activities must all have clear starting and ending dates. • Third, the project must not be complicated by too many interrelated tasks. • Fourth, the project must be one whose activities afford alternative sequencing and
timing. Language of PERT The PERT language comprises simple symbols and terms. As described in Figure 7.2, key symbol are those for activity, dummy activity, event, and critical path of the network. Since the critical path requires the longest time through the network, management should watch it most closely to avoid unnecessary project delays. Logic of PERT How does PERT work? It works by following these steps:
1. Clearly identify all activities in the project. 2. Identify the precedence requirements of the activities. 3. Diagram the precedence requirements as a sequence of activities. 4. Estimate the time each activity will take. 5. Calculate the critical path and other project performance criteria, creating the schedule
and plan for subsequent control criteria, creating the schedule and plan for subsequent control.
6. Reevaluate and revise as experience dictates.

115
Time estimates are obtained from either past data or from people experienced in a particular activity. Optimistic t0, pessimistic tp, and most likely tm times must be estimated so that the expected (average) time te can be calculated from the following equation. (t0 + 4tm + tp) te= 6
TABLE 7.3 Program Evaluation and Review Technique (PERT) glossary
Symbol Name Meaning Activity A task within the project that has a definite beginning
and ending date or point in time. The activity consumes time. The length of the arrow is of no significance. Designated as an arc.
Dummy activity
A fictitious activity consuming no time; necessary to preserve the unique identification of activities.
Event The beginning or ending of an activity. A point in time. Each project has a distinct project beginning and project ending. Designated as a node.
Network The sequence of all project activities. The sequence obeys precedence requirements. Nodes connected by arcs.
Path Any one unique portion of the project sequence, beginning with the first activity and ending with the last activity, for which each activity has a single immediate successor. Each node pair has a single arc, an activity.
---------------------------------------------------------------------------------------------------------------- 7.6 REVIEW QUESTIONS ----------------------------------------------------------------------------------------------------------------
1. What is the meaning of project? Provide an example of the project? 2. Discuss how a Gantt chart can be used as a scheduling tool. What type of model is a
Gantt chart? 3. Describe the conditions under which PERT may be appropriately used. 4. In PERT, the terms are important. Explain the difference between an activity and an
event. What is a critical path? 5. Present the logic of PERT- that is, explain how PERT works. 6. Your project is to design and build an insulated dog house for your favorite collie.
Show how to use PERT.

116
---------------------------------------------------------------------------------------------------------------- INVENTORY MANAGEMENT ---------------------------------------------------------------------------------------------------------------- Structure 8.1 Introduction 8.2 Basic Economic Order Quantity (EOQ) Model 8.3 Quantity Discount Models 8.4 Spare Parts Inventory 8.5 Material Resource Planning 8.6 Manufacturing Resource Planning 8.7 Purchasing Objectives 8.8 Review Questions ---------------------------------------------------------------------------------------------------------------- 8.1 INTRODUCTION ---------------------------------------------------------------------------------------------------------------- The approach to stock in manufacturing company needs to be different from that in a trading or a commercial business. For a Supermarket the main reason for holding stock will be to provide good customer service. A high degree of such service will be required. If the cornflakes are out of stock, the customer will go elsewhere. The goods classed as "Stock" will mainly be finished goods; ready for sale, ordering from Suppliers will be done largely without considering the consequences on any manufacturing activity. For a manufacturing company, stock control systems must take account of manufacturing activities. Inevitably there will be clashes or trade offs between the level of stock carried, the service given to the customers, the cash flow involved in carrying stock and the influence stock ordering policy has on manufacturing costs. "Stocks" will cover finished goods stocks, but also raw materials, work in process and components ready for use. The term "Inventory" refers to the stock of raw materials, Parts and finished products at hand at a given time (a tangible asset which can be seen, weighed or counted). In a wider sense "inventory consists of usable but idle resources''. The resources may be of any type; for example men, materials, machines or money. When the resource involved is material or goods in any stage of completion, inventory is referred to as stock''. Inventory consists of the following-
• Raw Materials: They are the physical resources to use in the production of finished goods. The purpose of holding raw material is to ensure uninterrupted production in the event of delays in delivery and to take advantage of bulk or other favorable terms of purchase.

117
• Bought out components: Items not manufactured/fabricated by the organization but used with or without further processing and/or packing the finished product, e.g. Rubber parts by Egg co. Tin cans by a Vanaspati Mill.
• Work in process- or intermediate goods are in the process of production. Their
purpose is to disconnect the various stages of production which facilitate production planning. Such Inventory helps to stabilize the rate of out put at successive stages in the face of fluctuation. Partly manufactured/processed inventories awaiting further mfg/processing between two operations and are in the process of being fabricated or assembled into finished products, including materials lying with subcontractors and material lying in shop food for further processing or assembly.
• Finished Goods: They are the inventory held for sale in ordinary course of business.
Such inventory serves as a buffer against fluctuations in demand for a product. Stock of finished goods facilitates a reasonable rate of out put and enables the firm to provide a quick service to customers. It helps to reduce the risk associated with stoppages or reductions in production on account of strikes, break down, shortage of material/power etc.
• MRO: Maintenance, Repair and operating supplies. The group include spare parts
and consumables which are required for use in the process but do not form a part of the finished product, e.g. Lubricants, V Belt, Electrodes, Pencil, Soap etc.
Inventory policies are important enough that production, marketing, and financial managers work together to reach agreement on these policies. That there are conflicting views concerning inventory policies underscores the balances that must be struck among conflicting goals-reduce production costs, reduce inventory investment, and increase customer responsiveness. Opposing Views of Inventories: There are many reasons why we like to have inventories, but there are also reasons why holding inventories is considered to be unwise. WHY We Want to Hold Inventories? Inventories are necessary, but the important issue is how much inventory to hold. Below is the summary and the reasons for holding finished goods, in-process, and raw materials inventories. Finished:
• Essential in produce-to-stock positioning strategies, of strategic importance. • Necessary in level aggregate capacity plans. • Products can be displayed to customers.
In-Process:
• Necessary in process-focused production; uncouples the stages of production; increases flexibility.
• Producing and transporting larger batches of products creates more inventory but may reduce materials-handling and production costs.
Raw Materials:

118
• Suppliers produce and ship some raw materials in batches. • Larger Purchases result in more inventory, but quality discounts and reduced freight
and materials handling costs may result. In addition to the strategic importance in providing finished-goods inventor so that customer service is improved through fast shipment of customers' order, we also hold inventories because by doing so certain costs are reduced.
• Ordering costs. Each time we purchase a batch of raw material from a supplier a cost is incurred for processing the purchase order. Expediting, record keeping and receiving the order into the warehouse. Each time we produce a production lot, a changeover cost is incurred for changing production over from a previous product to the next one. The larger the lot sizes, the more inventory we hold, we order fewer times during the year and annual ordering costs are lower.
• Stockpot costs. Each time we run out of raw materials or finished-goods inventory cots ma b incurred. In finished-goods inventory, stock out costs can include sales and dissatisfied customers. In raw materials, inventory, stock out costs can include the cost disruption to production and sometimes even lost sales and dissatisfied customers. Additional inventory, called safety stock, can be carried to provide insurance against excessive stock outs.
• Acquisition costs. For purchased materials, ordering larger batches may increase raw materials inventories, but unit costs may be lower because of quantity discounts and lower freight and materials-handling costs. For produced materials, larger lot sizes increase in process or finished goods inventories, but average unit costs may be lower because changeover costs are amortized over larger lots.
• Start-up quality costs. When we first begin a production lot, the risk of defectives is great. Workers may be learning, materials may not feed properly, machine settings may need adjusting, and a few products may need to be produced before conditions stabilize. Larger lot sizes mean fewer changeovers as per year and less scrap.
Inventories can be indispensable to the efficient and effective operation of production systems. But there are good reasons why we do not want to hold inventory. Why We Do Not Want To Hold Inventories: Certain costs increase with higher levels of inventories:
• Carrying costs: Interest on debt, interest income foregone, warehouse rent, cooling, heating, lighting, cleaning, repairing, protecting, shipping, receiving, materials-handling, Taxes, insurance and management are some of the costs incurred to insure, finance, store, handle and manage larger inventories.
• Cost of Customer responsiveness: Large in -process inventories clog production systems. The time required to produce and deliver customer orders is increased, and our ability to respond to changes in customer orders diminishes.
• Cost of coordinating production: Because large inventories clog the production process, more people are needed to unsnarl traffic jams. Solve congestion-related production problems, and coordinate Schedules.
• Cost of diluted return on investment (ROI): Inventories are assets, and large inventories reduce return on investment, reduced return on investment adds to the finance costs of the firm by increasing interest rates on debt and reducing stock prices.

119
• Reduced-capacity costs: Inventory represents a form of waste. Materials that are ordered, held, and produced before they are needed waste production capacity.
• Large-lot quality cost: producing large production lots results in large inventories. On rare occasions, something goes wrong and a large part of a production lots a defective. In such situation, smaller lot sizes can reduce the number of defective products.
• Costs of production problems: Higher in - process inventories camouflage underlying production problems. Problems like machine breakdowns, poor product quality and material shortages never get solved.
At first, these costs may seem indirect, fuzzy and even inconsequential, but reducing these costs by holding fewer inventories can be crucial in the struggle to complete for world markets. Nature of Inventories: Two fundamental issues underline all inventory planning:
• How much to order of each material when orders are placed with either outside suppliers or production departments with organization
• When to place the orders The determination of order quantities, sometimes also called lot sizes, and when to place these orders, called order points, determine in large measure the amount of materials is inventory at any given time. Types of Inventory: Include the following mentioned below:
• Anticipation inventories: When a firm anticipates a rise in prices, it may purchase in bulk quantities and hold the same until the prices rise. Similarly, products having seasonal demand (wool, umbrellas, fans, etc.) need to be produced and stocked in anticipation of sales during the season. These kinds of inventories are called anticipation inventories.
• Fluctuation inventories: Demand fluctuates over time and it is not possible to
predict it accurately. Business firms maintain reserve stocks to meet unexpected demand and thereby to avoid the risk of losing sales. These safety stocks are known as fluctuation inventories; there is a time gap between production and use of certain products. The goods produced in one season are held in stock for sale and use throughout the year. Potato, wheat, rice, etc., are examples of such commodities. When the availability of raw materials is seasonal (e.g., cotton), bulk stocks are purchased for use throughout the year.
• Lot-size inventories: Goods are bought in large lots to get the benefit of discount.
The gods so purchased are stocked until sale or use.
• Transportation inventories: Raw materials and finished goods are sent from one place to another. Some amount of inventory is always in transit. Longer the transportation period, greater is the amount of transportation inventories.
The problem of inventory management (inventory problem) deals with how many units/quantity of inventory should be carried in stock. This problem requires a balance

120
between the risk of being out of stock and the cost of preparing inventory. Out of stock involves the cost of idle men and machines, loss of customers, etc. Too high inventories involve risk of loss due to changes in demand, price, style, technology, etc. The objective here is to minimize the cost of holding inventory without taking undue risks. Inventory decision in an important strategic decision because the level of inventories serves as a guide for production planning. Production and sales policies are closely connected with inventory policy. Too much inventory is a cause for alarm as it may result in the failure of a business. Too low inventory may result in loss of sales. Planning the inventory level is one of the key areas of business decision making. An enlightened inventory policy has favorable effect on the costs of production. Take the case of a firm which is manufacturing umbrellas. The season and demand for umbrellas is from June to September (a four month period). The firm has two alternatives.
• It may produce umbrellas throughout the year and sell them during the four-month period. In this case it will have to incur costs on carrying stock of raw materials and finished goods.
• Alternatively, the firm may produce only during the four months and avoid the costs
of inventory. But this may result in loss of sales and production due to power failure, Strikes, machine breakdowns, etc.
If the cost of carrying inventory is less than these losses it would be preferable to stagger the production throughout the year and maintain inventory. The level of inventory depends upon several factors:
• The rate of inventory turnover, i.e., the time period within which inventory completes the cycle of production and sales. When the turnover rate is high, investment in inventories tends to be low.
• Durable products are more susceptible to inventory holding as the risk of perish
ability and obsolescence is less. Perishable and fashion goods are not stocked in large amounts. Thus, the type of product also influences the inventory level.
• Under conditions of imperfect competition demand is uncertain and stocks must be
held if the firm wants to take advantage of profitable sales opportunities. The optimum level of inventory will demand upon the variability of sales and the cost-revenue relationship. The level of inventory rises with increase in the difference between price and marginal cost. Thus, market structure influences the level of inventories.
• Economies of production runs also determine the inventory level. Modern
machinery is very costly and the cost of idle machine time is considerable. therefore, every business firm likes to maintain sufficient stock of raw materials to ensure uninterrupted production.
• There are certain costs of carrying stock. Some of these costs (STORAGE costs,
setup cost, change-over costs, costs of ordering, spoilage and obsolescence costs) are directly measurable. On the other hand, certain costs (opportunity cost of capital,

121
costs caused by price level changes, cost of loss of sales due to shortage of stock) are not measurable. All these costs influence the level of inventories.
• Financial position of the firm exercises significant influence on inventory levels. A
financially sound company may buy materials in bulk and hold them for future use. A firm starved of funds cannot maintain large stocks.
• The inventory policy and attitude of management also influence the inventory
level. Objectives of inventory Control: The main objectives of controlling inventory are as follows:
• to minimize capital investment in inventory by eliminating excessive stocks, • to ensure availability of needed inventory for uninterrupted production and for
meeting consumer demand; • to provide a scientific basis for planning of inventory needs; • to tiding over the demand fluctuations by maintaining reasonable safety stock; • to minimize risk of loss due to obsolescence, deterioration etc., and • To maintain necessary records for protecting against thefts, wastes, leakages of
inventories and to decide timely replenishment of stocks. Advantages of Inventory Control: Scientific inventory control provides the following benefits:
• It improves the liquidity position of the firm by reducing unnecessary typing up of capital in excess inventories.
• It ensures smooth production operations by maintaining reasonable stocks of materials.
• It facilitates regular and timely supply to customers through adequate stocks of finished products.
• It protects the firm against variation in raw materials delivery time. • It facilitates production scheduling, avoids shortage of materials and duplicates
ordering. • It helps to minimize loss by obsolescence, deterioration, damage, etc. • It enables the firms to take advantage of price fluctuations through economic lot
buying when prices are low. Costs of Holding Inventories: The building up and holding of inventories involves several costs. First of all there is the procurement cost. Procurement costs are of two types. When inventory is procured from outside suppliers, it is known as the ordering cost (expenses incurred on preparing and sending the purchase order). When the inventory is self-supplied by the businessman from his own factory, it is called setup costs. Strictly speaking, setup costs are relevant in job order production only. Setup costs include all the costs components of changing over the production process to manufacture the ordered item. It also comprises cost of time lost in changing the production process and clerical cost involved in sending an order to the production department. The second categories of costs are called carrying costs which comprise the following costs:
122
• Capital cost. • Cost of storage and handling and • Cost of deterioration and obsolescence.
Capital cost: It refers to the cost of the money tied up in inventory. Such cost depends on the prevailing market rate of interest. But in a capital scarce country like India, market rate of interest is not a correct indicator of capital cost. What is relevant is the opportunity cost (loss of earnings of capital which could alternatively be utilized elsewhere). Storage costs: Storage costs include rent of go down where inventories are stored, clerical costs of maintaining stock records, cost of air-conditioning (if any) required to protect the inventory, cost of night watchman, cost of insurance of inventory, etc. Deterioration Costs: Any product or material is likely to deteriorate if stored for a long time. In addition to actual deterioration, there may be pilferage and obsolescence. Such loss is included in deterioration costs. In case of overstock inventory may be left after its demand has terminated. Such overstock cost also represents loss in value. Stock- out Cost: When the inventory is required in factory or for sale to consumers and the company runs out of stock, it losses production or sales. There is the cost of ideal machine time, loss of man hours, failure to supply goods to customers on time and the resulting loss of goodwill. Thus there is a cumulative effect. All such costs are called shortage or penalty costs. There are there aspects of inventory replenishment order - (1) the size of each order (called lot size or reorder quantity), number of orders and the time between the placement and receipt of an order (known as lead time). Lead time: It refers to the interval between placing an order for a particular item and its actual receipt. Suppose, an order is placed for a particular item on Ist January and the material is received on Ist February. In this case the lead time is one month. Longer is the lead time higher will be the average level of inventory. Safety stock: It implies the stock of inventory held as a safety measure against fluctuations in demand and lead time. Safety stock is a function of lead time. The longer the lead time, the greater the safety stock. Safety stock is also known as buffer stock or minimum stock. Safety stock should be differentiated from working stock. Safety stock refers to the stock of inventory which is supposed to take care of shortages. On the other hand, working stock refers to the inventory generated by orders. During a cycle of production, the inventory is depleted. Assuming a constant rate of usage we get the slope of line eb. If inventory is not replenished, inventories will ultimately (time t2) reach zero level. In order to avoid it the firm would place on order in advance at time t1 as order cannot be carried out immediately. Depending on the lead time delivery procedure and daily usage rate of the inventory, the order point for the replenishment of inventory is decided. It is equal to lead time multiplied by the slope of the usage line. While determining the safety stock, reorder cost and reorder quantity should be considered. The cost of reorder and the quantity to be reordered depend upon the following factors:

123
• The minimum level: The minimum level of inventory is decided by taking into account such factors as the usage value of the item, normal lead time, the availability of substitutes, etc. After taking these factors into consideration, a level has to be determined below which the stock of inventory should not fall. This is called the minimums level of inventory.
• The reorder point: The reorder point should obviously be the minimum level plus a safety margin which is kept to ensure that shortages (out of stock situation) do not occur.
• The standard order quantity: In order to minimize the cost of acquiring inventory, the size of order should be decided. Discount offered by suppliers and transport costs should be considered in deciding this quantity.
• The maximum level: This level can be determined by adding up the minimum level of inventory and the standard order quantity.
The actual level of inventory to support the production rate depends upon management policy concerning the cost of carrying inventory, the desired turnover rate, the desired service level, the use of economic ordering quantity, the degree of sales fluctuations and other similar policies. The rules, practices and procedures concerning inventory decide the terms of inventory control. In reviewing stock position, two main factors must be considered:
• When to order; and • How much to order.
Every manufacturing concern must maintain some inventory of materials and parts to ensure uninterrupted production. ---------------------------------------------------------------------------------------------------------------- 8.2 BASIC ECONOMIC ORDER QUANTITY (EOQ) ---------------------------------------------------------------------------------------------------------------- One of the important problems in inventory control is to balance the costs of holding inventories (holding costs) with the costs of placing orders for inventory replenishment (ordering costs). If a firm orders small quantities frequently its holding costs would be low but ordering costs will increase. On the other hand, in case the firm orders large quantities infrequently, its ordering costs will be low but holding costs would rise. A balance should be struck between the ordering costs and holding costs so as to minimize inventory costs. The EOQ (Economic Order quantity) approach is designed to achieve such a balance. Economic order Quantity or optimum order quantity is that size of the order where total inventory costs (holding costs + ordering costs) are minimized. It is also known as "Economic Lot Size". The EOQ approach is based on the following assumptions.
• Inventory is consumed at a constant rate. • Costs do not vary overtime. • Lead Time is known and constant. • Order costs, holding costs and unit price are constant. • Holding costs are proportional to value of stocks held, similarly, order cost varies
proportionately with price.

124
Total cost for managing inventory of an item depends upon 3 factors:
• Ordering cost (OC) • Inventory Carrying Cost (ICC) • Quantity Discounts (QD)
Ordering cost is the cost of placing one order. Total ordering cost per order can be determined by estimating annual cost actually incurred during the past one year against following elements:
• Salaries + Perks paid to all the employees in the purchase department. • Proportionate part of salary + perk of the executives and employees of other
departments spending part of their time in making purchases. This will include accounts personnel associated with purchase department in evaluating quotations and making payments. Also QC department engaged in inspection and testing of purchased items.
• Traveling expenses related to procurement • Telephone, telegram, telex, postage and stationery relating to procurement. • Depreciation of accommodation (or rent of building) and equipment used for
procurement. • Insurance, power, water and other service charges relating to purchase department. • Any other cost (entertainment etc.) incurred for purchasing.
If N is the number of orders placed during the year, ordering cost
Total Ordering Cost/Year N
(S) in Rs. / Order =
Inventory Carrying Cost (ICC): Inventory carrying cost is the cost of holding inventory. Various elements of cost falling under this head are as given below: -
• Interest loss/opportunity loss on the capital locked up in the form of average inventory.
• Salaries and perks of the employees engaged in the stores. • Depreciation of accommodation (or rent of building) occupied by stored and stores
offices. • Depreciation of handling equipment, racks, furniture and other facilities used in
stores. • Obsolescence of items in stores. • Deterioration, damage and pilferage of items during storage. • Telephone, telex, postage and stationery used by stores. • Handling expenses paid to contractors, transporters, etc. • Insurance and taxes on stores. • Electricity, oil, water and other service charges of stores. • Any other cost relating to holding of stocks in the stores.

125
The method of calculating ICC is to estimate cost against each one of the above elements during the past year and divide it with the average inventory during that year. Average inventory can be calculated as follows: -
Opening Stock + Closing Stock 2
Av. Inv. =
A better estimate of average inventory can be made by adding stock balance on the last day of each month of the previous year and dividing it by 12. Let us take an example to explain the method of calculating ICC. If the stock balance on the last day of each month for previous year is 4, 4.5, 3, 6, 5, 4.5, 4, 4.5,5.5,3,3,3 lakhs then
4+4.5+3+6+5+4.5+4+4.5+5.5+3+2+2 12
Av. Inv. =
= 4 Lakhs If the bank interest on working capital is 18% and total inventory holding cost against all elements listed from (ii) to (ix) above is Rs. 40,000 then
40,000
I.C.C.=0.18+ 4,00,000
= 0.18 + 0.1 = 0.28 or 28% of Av. Inv. The I.C.C. has a straight line relationship with the average inventory as shown in figure 8.2 Economic order quantity is defined as the order quantity against which total of OC and ICC is minimum. As shown in figure EOQ will be the order quantity where both ICC and OC curves interest each other. Mathematically this quantity is calculated by the following formula: - 2AS Q = CI Where Q = EOQ A = Annual Consumption of the item in units. S = Ordering Cost in Rs. I = Inventory carrying cost as a fraction of the Iv. Inv. C = Unit cost of the item in Rs.

126
Figure 8.2
Let us say that during the next year forecast of consumption of an item is 5,000 units, S and I calculated on the basis of last year data are Rs. 50/- and 0.25 respectively and the unit price of the item is Rs. 2 then 2 x 5000 x 50 Q = 2 x 0.25 Q = 1000000 Q = 1000 Units. If we assume the ordering cost S = 10 and the inventory carrying cost I = 20 percent or 0.20, for everyday use it is possible to workout EOQ data for different levels of annual consumption. It is not necessary to calculate the EOQ for each and every item, since the ordering cost and carrying cost vary only with number or orders and the value of purchase and not with the nature of the item to be purchased. an illustr4ative table incorporating economic order quantity and cost data for seven values of annual usage is given in table below : -
(EOQ data with = Rs. 10 per order and I = 20 percent or 0.20)

127
Annual-Usage
(A) Rs. Economic Order Quantity (Q) Rs.
Time Supply Number of Orders Per Year
(A/Q) 40,000 2,000 18 days 20 10,000 1,000 5 weeks 10 8,100 900 6 weeks 9 4,900 700 7.5 weeks 7 1,600 400 3 months 4 900 300 4 months 3 100 100 1 Year 1
from the table it can be easily seen that for C items, the cost of carrying inventory is naturally small and, for minimizing total cost, the ordering cost has to be kept low and so these items are ordered as in frequently as once or twice a year. On the other hand, for A items the inventory - carrying cost is high and for minimum total cost, the ordering cost should be very nearly equal to it. This means that the number of orders should be greater and purchases should be made more frequently in small lots so that inventories may be carried at a low level and at a low total cost. While, normally, purchases should be guided by the EOQ data similar to that shown above, departures can be made for god and valid reasons. The practical order quantity may be slightly more or less than that the critically calculated. It should be noted that the total cost curve is flat at the bottom and the total cost is therefore relatively insensitive over an appreciable range around the theoretically calculated quantity. Normally the aim should be to order the nearest practical quantity approximately to the EOQ. Where large deviations are considered necessary, each case should be examined carefully to ensure that the deviation from the EOQ does actually benefit the undertaking in the long run. ---------------------------------------------------------------------------------------------------------------- 8.3 QUANTITY DISCOUNT MODEL ---------------------------------------------------------------------------------------------------------------- Quantity Discounts: Whenever discounts are offered for bulk purchases, each case should be considered in items of its ultimate cost. A rough and ready formula for deciding such cases can be worked out if, to simplify matters, we assume that the ordering cost is negligible compared to the other factors involved. If one month's usage of an item is added to the EOQ by bulk purchase, the average inventory cost of the item is increased by half a month's usage i.e., by A/24 of a year's usage where A is, as before, the annual consumption value of the item. If a month's usage is added to the EOQ the average inventory will be increased by mA/24 rupees. The increase in inventory-carrying cost expressed as a fraction of the inventory cost. The reduction in cost offered by the discount must be more than this increase. If x is the reduction (expressed as a fraction) offered per rupee3-worth of material, the annual cost reduction dure to bulk discount will be x A rupees. XA > mA1/24 x > mI/24

128
If I is taken as 24 percent or 0.24 x > m/100 or 100 x > m This indicated that bulk purchases can be profitably made if the percent discount offered is grater than the number of month's usage added to the EOQ. Example: The price and discount pattern for an item is as follows :
Quantity Unit Price (Rs.) Discount 1-99 100 -
100-999 95 5 per cent 1000 & over 85 15 Per cent
If the monthly usage of the item is 150 and the EOQ is 500, would it be advisable to increase the order quantity to 1000 to take advantage of the bulk discount? Percent discount if 1000 units are ordered at a time instead of
(95-85) 500= 95
x 100 = 10
Number of month's usage added to the EOQ by purchasing 1000 instead of 500 at a
1000-500
time= 150
=3.3 months
As 10.5 is greater than 3.3, order quantity can be raised from 500 to 1000 to take advantage of the discount. ---------------------------------------------------------------------------------------------------------------- 8.4 SPARE PARTS INVENTORY ---------------------------------------------------------------------------------------------------------------- Spare Parts Inventory Management: Spare parts management needs special treatment, somewhat different from the inventory management of regular items. This is because the purpose of keeping a stock of these I different - to serve as a replacement to the worn-out parts in the machinery. The principle that A class items need to be stocked lower than B and C class items, will provide important guidelines to spare parts inventory control. The inventory models we have discussed can also be applied to spare parts control. Just as the behavior of the consumption of spares is different from the consumption of the regular items in inventory, so also the supply of spares is different from the regular items. This being so, some modifications are necessary to the conventional inventory and safety stock models.

129
Spares parts can be classified for stocking policy analysis.
• Maintenance or breakdown spares: There are the spares which are required in large quantities at more or less frequent periodic intervals as and when the breakdowns occur. These resemble, somewhat, the regular inventory items in their consumption patterns. To some extent, the analysis for stocking policies of the spares could be similar to that of the regular items in inventory
. • Insurance spares: The purpose of these spares is to provide an insurance against the
relatively remotely possible breakdown or failure of an equipment / component. The probability that such a component / equipment will survive the life-time of the machinery or plant is quite high. The reliability of such spares has been observed to be as high as 95 to 99% over the life span of the machinery. These spares are sparingly needed. But they are needed all the same because they may hold up production resulting in considerable losses for want of them. Many of these spares are, also high value items. These spares are, by and large, procured along with the capital equipments. At the time of the purchase of the capital equipment itself a decision regarding the purchase of the insurance spare is also made. Generally, the decision with regard to insurance spares may be to buy either no spare or to buy a spare.
• Capital spares: These are also high-reliability spares, but not as high as the insurance
spares. The reliability is not as low as that of the maintenance spares as well. Moreover, these spares have relatively higher purchase cost than the breakdown spares. The decision regarding these spares is usually made at the time of purchase of the capital equipment itself. But the decision may be to buy anywhere from 0 to say 6 or 7 spares.
• Ratable spares: These are the reusable spare parts, which after their breakdown can
be reconditioned and re-used. Typical examples are the step any in the car, jet-engine in aircraft, tyre tubes in cycles, electrical motors, etc. Since these have more than one life, the cycle of their various lives needs to be taken into consideration in the analysis of their inventory policy. After Spare Parts Inventory Management, we now turn our attention to :-
• Maintenance or Breakdown Spares: The rate of consumption or usage of spares can
be derived from historical data regarding failure of the different components in the machinery. Failure statistics is important basic information for this analysis. If the failure times show a negative exponential distribution, the failure rates are distributed by means of Poisson distribution. If the failure times show a normal distribution due to aging or wear, then the failure rates will also show a normal distribution. From the failure statistics one can know the mean consumption rate of these spares and also find the level of consumption expected with a corresponding probability of its occurrence. Based on service level, the inventory level can be easily arrived at. The service level is given by the formula : Service level = Ku/ (Ku+K0) where,
Ku= Opportunity cost of under-stock of one unit K0= Opportunity cost of overstock of one unit
• Capital Spares: As mentioned earlier, the decision here is to buy spares ranging anywhere from 0 to say 7 spares. These spares are bought along with the capital

130
equipment. The reliabilities of such spares are much higher than those of the maintenance spares. Let us have the following notation:
C = Cost of spare parts Cs = Cost of shortage per unit, S = Salvage value of the spare parts when they are salvaged, Pi = Probability that the demand for the capital spare parts is 'i' in number N = Optimal number of spares required, and TC = Total cost for stocking N items.
The demand may be either more than the optimal number N, or less than or equal to optimal number N. These are the two situations that are considered which have their own associated costs. The policy of buying N spare parts should be such that the total costs (i.e. summation for both the aforesaid situations) are minimum. ---------------------------------------------------------------------------------------------------------------- 8.5 MATERIAL RESOURCE PLANNING ---------------------------------------------------------------------------------------------------------------- Material Resource Planning (MRP) has become a centerpiece for all manufacturing system. The key to successful production and operations management in a manufacturing company is the balancing of requirements and capacities. It's that simple and yet very challenging. To understand it is essential and to practice it can be a lot of fun. Remember what you are trying to do: Meet the needs of your customers. How? By having the product available when it is wanted. In production management, we do this by knowing planning ahead to have the capacity available. To begin with we shall define MRP. Material requirements planning (MRP) A system of planning and scheduling the time phased materials requirement for production operations. Planning for Materials Needs: In recent years material requirements planning systems have replaced reactive inventory systems in many organizations. Managers using reactive systems ask,” What should I do now? “Whereas managers using planning systems look ahead and ask," What will I be needing in the future? How much and when?" Improved customer service and other advantages come at a cost, however. They require a system for accurate inventory and product buildup information. They also require a realistic master production schedule (MPS) to specify when various quantities of end items will be completed. Demand Dependency: Demand dependency is an important consideration in choosing between reactive and planning systems. Demand dependency is the degree to which the demand for some item is associated with the demand for another items. With independent demand, demand for one item is unrelated to the demand for others. In the dependent demand situation, if we know the demand for one item, we can deduce the demand for one or more related items.

131
Appling MRP as a Scheduling and Ordering System: MRP is a system of planning and scheduling the time phased materials requirements for production operations. As such, it is geared toward meeting the end item outputs prescribed in the master production schedule. MRP Objectives and Methods: MRP provides the following:
• Inventory reduction: MRP determines how many of a component is needed and when, in order to meet the master schedule.
• Reduction in production and delivery lead times: MRP identifies materials and components quantities, timings, availabilities, and procurement and production actions required to meet delivery dealings.
• Realistic commitments: Realistic delivery promises can enhance customer satisfaction. By using MRP, production can give marketing timely information about likely delivery times to prospective customers.
• Increased efficiency: MRP provides close coordination among various work centers as products progress through the process
MRP System Components: Shows the basic components of an MRP system.
Master production schedule (MPS)
Inventory status files Materials Bill of materials file Requirements planning (MRP) processing logic Order release requirements Order rescheduling planned orders (Orders to be released now) (Expedite, deexpedite, (future) Cancel open orders) Master Production Schedule (MPS): The MPS is initially developed from firm customer orders or from forecasts of demand before the MRP system. Designed to meet market demand, the MPS identifies the quantity of each end product (end item) and when it needs to be produced during each future period in the production planning horizon. Bill of Materials (BOM): The BOM identifies how each end product is manufactured, specifying all subcomponents items, their sequence of buildup, their quantity in each finished unit, and the work centers performing the buildup sequence. Inventory Status File: The MRP system must retain an up to date file of the inventory status of each item in the product structure. This file provides accurate information about the availability of every items controlled by the MRP system which can then maintain an accurate accounting of all inventory transaction, both actual and planned.

132
The MRP Processing Logic: The MRP processing logic accepts the master schedule and determines the components schedules and determines the components schedules for successively lower level items of the product structures. It calculates for each item in each product structure and for each time period (typically one week) in the planning horizon how many of that item are needed (gross requirements), how many units from inventory are already available, the net quantity that must be planned on receiving in new shipments (planned order receipts), and when orders for the new shipments must be placed (planned order releases) so that all materials arrive just when needed. The MRP Computational Procedure: The MRP computational procedure uses the input information to calculate the current records for each component and item. Information Processing Sequence: The MRP processing logic is applied first to the high level items (end products) in the product structure, then to the items on the next lower level. Indented Bill of Materials: To do its level by level calculations, the MRP processing logic obviously needs information about an end item's relationship to all its subcomponents. Product Explosion: To create a parent item we often need multiple units of a lower level item. Low Level Coding: Often a single item is in the product structure of several end items, or it exists in several levels of one product structure. Using MRP Outputs for Materials Decision: MRP merely indicates what actions are needed to meet the MPS goal; now management must act to "Make things happen" to cause (control) the productive system to execute so that management gets the results it wants. Keeping MRP Current in a Changing Environment: MRP is not state; it is responsive to new job orders from customers and current shop conditions, as well as changes anticipated for the future.
• Pegging: The process of tracing through the MRP records and all levels in the product structure to identify how changes in the records of one component will affect the records of other components.
• Cycle counting: Counting on hand inventories at regular intervals to verify inventory quantities shown in the MRP.
• Regenerative method: A procedure, used at regular intervals, to update the MRP by completely reprocessing the entire set of information and recreating the entire MRP.
• Time fence: A designated length of time that must pass without changing the MPS, to stabilize the MRP system; afterward, the MPS is allowed to change.
---------------------------------------------------------------------------------------------------------------- 8.6 MANUFACTURING RESOURCE PLANNING ---------------------------------------------------------------------------------------------------------------- Historically, MRP systems typically were developed on a segregated basis, rather than as part of highly integrated information system. More recently, however, companies are beginning to logically relate many of their information subsystems to the MRP system. Bills of materials data, for example, can be shared with an engineering information system data base; order release and order receipts data can be shared by the order billing and accounts payable information systems; and inventory status data from MRP can be part of marketing or

133
purchasing information system. This type of information integration, in fact, is exactly the impetus for a new generation of manufacturing planning and control systems. Manufacturing resource planning (MRP II, or "closed loop" MRP) is an integrated information system that steps beyond first generation MRP to synchronize all aspects (not just manufacturing) of the business. The MRP II system coordinates sales, purchasing, manufacturing, finance, and engineering by adopting a focal production plan and by using one unified data base to plan and update the activities in all the systems. As shown in figure 8.3 the process involves developing a production plan from the business plan to specify monthly levels of production for each product line over the next one to five years. Since the production plan affects all the functional departments, it is developed by the consensus of executives and becomes their "game plan" for operations. The production department then is expected to produce at the committed levels, the sales department to sell at these levels, and the finance department to ensure adequate financial resource for these levels. Guided by the production plan, the master production schedule specifies the weekly quantities of specific products to be built. At this point a check is made to determine whether the capacity available is roughly adequate to sustain the proposed master schedule. If not, either the capacity or the master schedule must be changed. Once settled, the master schedule is used in the MRP logic, as previously described, to create material requirements and priority schedules for production. Then, an analysis of detailed capacity requirements determines whether capacity is sufficient for producing the specific components at each work center during the scheduled time periods. If not, the master schedule is revised to reflect the limited available capacity. After a realistic, capacity feasible schedule is developed, the emphasis shifts to execution of plan: purchase schedules and shop schedules are generated. From these schedules, work center loadings, shop floor control, and vendor follow-up activities can be determined to ensure that the master schedule is met. One use of the MRP II system is to evaluate various business proposals.
Figure 8.3

134
---------------------------------------------------------------------------------------------------------------- 8.7 PURCHASING OBJECTIVES ---------------------------------------------------------------------------------------------------------------- Materials management brings together under one manager all the planning, organizing, and control activities associated with the planning, organizing, and through an organization. Physical distribution is even broader, encompassing managing materials flow of materials into and through an organization. Physical distribution is even broader, encompassing managing materials storage and transportation flow out as finished products. In the context of operations management, we focus here on the narrower purchasing function, which provides materials, supplies, and services from outside vendors (suppliers). Accordingly, purchasing in an important boundary function that supports operations by acquiring major resources for the conversion process. For manufacturing firms involved in assembly, it is not unusual for the cost of purchased materials to exceed, as a percent of total product cost, the value added internally to the product through manufacturing and assembly. The importance of the purchasing function to the firm's performance and to operations performance is substantial.
• Raw materials and brought-out components usually constitute a high proportion of the total cost of sales of most manufacturing organization. Depending upon the industry, the ratio of materials costs to labor costs varies from 2.5 to 4.0. Manufacturing activities where material is 33 percent or more of total production costs are quite common. the productivity of materials could be more significant than that of labor in reducing overall costs. It justifies a correspondingly high degree of analysis and control.
• Where a concerted effort to improve materials productivity has not been made in the
last five years, gains of 3 to 8 per cent of the total materials bill have been achieved frequently.
• The demanding nature of current production problems leads production and technical
management to concentrate nearly inevitably on industrial relations, payment problems and related output. Investigations to improve materials productivity do not - normally - raise emotional or fundamental industrial relations problems. In practice, therefore, materials improvement is one of the most easily achieved major savings, even in the most belligerent industrial relations environments.
• Experience also suggests that the measurement of materials productivity is best done
as 'material yield'. 'Yield' is the weight of finished products accepted by customers when compared with the weight of all materials issued for production purposes. Percentage yields should be calculated both for individual operations and for each production line being studied.
Materials Productivity - relationships with other measurements and activities:
1. Improving materials productivity is one of the most direct and important ways of enhancing added value.
2. Gaining information on material losses can help in establishing general data for production control and costing purposes, so providing the means to improve the planning and control of production resources generally.

135
3. Material losses can be related to incentive payments and help to increase their effectiveness.
The importance of data in improving materials productivity The data book: Usually where materials productivity has been improved considerably the first step has been to record how much and at what stage in the manufacturing process material loss occurs. Such information is often entered in a 'data book' containing other relevant manufacturing information, which is basis for standard costs. (So considerable relevant information could already be available).
Use of materials productivity data
• By highlighting anomalies that would remain hidden otherwise, data collection often
produces immediate benefits. While line managers are usually aware of their materials productivity in some degree, the 'data book' should provide a studied record and practical evidence of where an immediate improvement could be made.
• Materials productivity data should also provide a means for initiating and guiding action and for measuring and recording improvements.
• The use of information on materials productivity is therefore invaluable in setting objectives and measuring production performance generally.
Considering improvements in materials productivity: Types of information required Material losses mainly result from two causes:
• Technical losses - these are considered to be part of the production process (grinding, pressing, cutting, trimming, etc).
• Operational losses - these occur during the process of manufacturing and can be due to material quality defects, poor workmanship or machine/manufacturing deficiencies.
Information should be collected under these two main headings, as the approach to improving materials productivity could be substantially different in each case. Problems intrinsic to the production activities may require technical improvements to the plant. Operational losses may emphasize the need for tighter control over production and product quality than has existed hitherto and a systems approach may therefore be appropriate.
It is further suggested that data should be collated to answer three questions:
• Do we have a problem? - Often the problem is hidden by a lack of data. For example, 'Yield figures' are not regularly produced. Occasionally the comparative costs of labor and material are not known by the managers who control these resources.
• Where do we have a problem? - Pinpointing where material losses occur is usually halfway towards improving materials productivity.
• Why do we have a problem? - Frequently by far the most difficult question to answer.

136
Do we have a problem? A broad indication of materials productivity and the degree of possible improvement can be acquired by obtaining the value of various major materials from their use, the associated lab our cost and eventually the materials yield. This information could be particularly valuable if it could be calculated for the key products which the organization manufactures. Where do we have a problem?
• Technical and operational losses usually occur unevenly both throughout the product
range and at operations or processes in manufacture. It is important to determine which products have least yield and at what operations or processes most loss occurs.
There is a need to categorize why material losses occur to gain a rough first indication of 'where do we have a problem' - e.g.:
Technical losses Operational losses Machine limitations - (due to machine design) Operative errors Methods failure Machine faults Raw Material quality losses General material chemistry Products design Standards too high for material and products
• Possibilities of obtaining speedy results. Only the products comprising eighty percent
of the product range should initially be measured as proposed. Sampling should be carried out to indicate where main product losses occur. (Process or operation losses should be obtained). All available data should be used to indicate the areas where materials productivity can be improved. (Costing information could be an obvious starting point.) Obtaining appropriate information can be a lengthy and laborious process, but without it signposts will be missing which can direct effort to the most likely opportunities for improving materials productivity. In practice up to one man year has been spent in preparing appropriate information for one product line of twelve operations with approximately 8,000 part numbers. It is possible that experiments will have to be made to provide accurate information.
What do we have as a problem? To determine why material losses occur and establish a cause for each loss is not always as easy as it sounds. The real cause may be hidden until a fairly lengthy technical evaluation has been made. A project team of production, production engineering, quality control and systems / costing personnel is often needed for a 'reasons why evaluation'.
Considerable engineering and technical problems may have to be overcome if materials productivity is to be improved. Many of the solutions will need capital expenditure and the process of implementation may be slow. The total savings to be made will depend upon the type of loss, whether substantial or only minor parts of the loss can be saved and the amount of capital and other expenditure needed to achieve the savings.

137
However, production personnel with comparatively slight technical know-ledge have made significant savings without help once they have produced for themselves, or has produced, appropriate information.
The product mix and materials productivity: Often the product mix and the size of orders have an important effect on materials productivity. One type of produce may, owing to difficulties in making it, have a higher material loss than others. Appropriate information is needed.
The team approach to improving materials productivity: The mixture of 'technical', 'operational' and 'mix' classes of material losses which are usually found suggests that as multi-discipline team will have most immediate and long lasting benefit. Approaches to Improving Materials Productivity
Materials productivity: Materials productivity is the responsibility of production line managers. It should be one of their principal objectives and appropriate targets should be set up. Their responsibilities should include their establishment of materials productivity improvement assignments.
Usually a material record card can travel with the batch or order so that an accurate record can be made of material losses. Sequence numbers can be used to ensure that all material issues have been accounted for.
Batch control is recommended - i.e. one batch or load of a particular weight is monitored and the resulting material yield calculated. A count of work in progress, therefore, becomes less of a problem in providing control over weekly or monthly material issues and receipts.
Control over raw material issues must be efficient. No material should be issued without the sanction of a responsible individual and never in excess of that required by the orders being produced. Material utilization reports: Weekly or monthly reports are required which will record material variances from standard. the input-output records should be used to provide input data for this purpose.
Records providing Information should be produced at intervals which enable managers to increase their performance by taking action to improve materials productivity. Timing therefore is very important in producing control information.
Operational Approaches to improving materials productivity
Quality Control: Enhancing the policeman role of inspection or quality control will have benefits if the enforcement of well-defined quality rules is needed. This could have limited value, however, if the more fundamental causes of quality defects are not tackled. Preventing poor quality products reaching a customer is often a negative approach. A positive method of determining why products are rejected and what can be done to achieve higher materials productivity is often decisive in making quality control a key influence in reducing material losses. The following questions should be answered to provide an appreciation of the effectiveness of the quality control function:

138
• Do we carry out quality control at the key points in the production process which
maximize the possibility of preventing material losses, particularly by operative error? • Is the quality control process geared to catch rejected material early enough in the
manufacturing process to ensure that the maximum amount of recycling of material occurs?
• Are reasons for quality failure so recorded that line managers can take action from time to time?
• Do line managers carry out corrective action once they have been told of causes of rejection?
Are rejections brought to the attention of operatives? Is any disciplinary action taken as a Consequence of major rejects being caused by operative error? Control of Operative performance: The control of operative performance is another vital element in reducing material losses. The following questions ne3ed to be answered to ensure that appropriate control is in operation.
• Is materials productivity part of the bonus system? Do we use standard scrap allowances indiscriminately so that some operative performance is hidden?
• Do we always know which department, shift and individual have caused reject material?
• Are agreed disciplinary procedures activated when operative error causes material losses? Do operatives appreciate the value of material? Is operative training conducive to reducing material losses?
'Participation' in improving materials productivity is often beneficial. Technical approaches to improving materials productivity: Taking a technical view alone of material losses will be ineffective if operational losses are more important and only a small proportion of time is spent on these latter. Often the results of a technically orientated approach to materials productivity are requests for substantial spending on capital equipment or on plant modifications. This may be wrong if output and other factors are not taken into account. Use of value analysis and value engineering: Value analysis and engineering are philosophies, rather than techniques that can be applied to materials productivity. Their intention is to question all facts of products and how they are made, and to determine whether all costs incurred contribute to the final value of the product. "Ten tests for value" have been determined which ostensibly challenge all non-essential product characteristics and operations. However, the following questions may be more relevant.
• Does every facet of the product produce value? Is ever one necessary? • Do we use materials which are too expensive? • Is every operation performed essential? Could nay operation be combined with
another? Why do we need to make the product in the way we do? Are there cheaper ways?

139
Some of the possibilities of applying value analysis might be:
• To challenge the need to add on material, initially, merely to be ground off at a later stage.
• To challenge the finish of a product. For example, should the top and bottom surfaces of a product be treated in the same way although the bottom one is hidden in use?
• To challenge the need to carry out 'finishing operations' at a stage in the process when material recovery is impossible - i.e. after a product has been baked.
Product geometry: In many production processes sheets or blocks are first made from which products are then pressed, stamped or cut. Product geometry analysis should ensure that sheets or blocks are of optimum size i.e. minimum waste ensures from production processes.
As a rule of thumb it is likely that, for the top eighty percent of the product range, product geometry calculations to provide maximum material yield will be needed. However, there may be a wide range of products absorbing marginal production time which could be made from a standard range of blocks or sheets from which two or more products can be made. 'Standard sheets' should be used where the gain in production efficiency exceeds in value the loss in material when using a tailor - made sheet. Such calculations will need the following information:
• Material losses - weight or square meters of standard material value taking account of
related factory marginal costs. • Cost of handling materials lost in production (dust, off cuts, etc.) • Value of recoverable material when standard items are used. • `Gains in efficiency by using standard material, probably measured in better machine
and labor utilization. • Cost of stocking standard materials and risks of obsolescence. • Gains and losses should be calculated in contribution terms if possible. Use marginal
costs in any calculation made. • Yearly off-take for each item will also be needed and calculations of annual losses
and savings made before a product geometry decision is taken. Scrap control and recovery: In many production units a scrap control and recovery unit is usually extremely valuable in reducing material losses. Its main functions might be:
• To provide a scrap collection service. To analyze scrap, grade it and store it for future use, recover it, or dispose of it.
• To know what scrap occurs, its costs, weight, shape, size, type and possible treatment which will ensure its profitable use. To understand why scrap occurs and to suggest changes which will improve materials productivity?
• If material is to be lost inevitably during the production process, production engineering and production planning should ensure that its future use and / or recovery is, in some way, facilitated.

140
Standardization and variety reduction: Reducing material qualities and product sizes should have an inevitable result on materials productivity. Fewer tools, fewer changeovers and set ups will be required, standardized methods of material utilization and control will be possible.
• Leaving the 'cosmetic' operations on a product until the latest possible point in the production process.
• Ensuring that the product mix is based (Partly) on contribution earnings. • Ensuring that product rationalization is based on gradually widening (or enlarging)
product sizes - e.g. using sixteenths instead of thousandths of an inch, providing minimum size tolerances, etc.
• Eliminating as far as possible, low volume and 'one-off' products (volume being one of the many factors in determining the product range).
The comparative importance of each method will differ according to the situation
being investigated. Tool control: Properly sharp tools should be available always. Tool control is vital for this purpose. The relationship between tool control and conversion/yields should be known.
Tool control should cover all items likely to have any effect on materials productivity, including:
• Jigs and fixtures • Grinding wheels • All cutting equipment used generally in production • Drills etc.
Engineering / machine improvements: New machines and equipment can often be justified by the material savings potential alone.
However, it would be erroneous to believe that this should have a high priority in materials productivity. Steps which might be taken are:
• Review machine/equipment standards. What was the material utilization standard
envisaged at the introduction of the equipment? • What modifications are possible to improve materials productivity equipment? What
will they cost? How long will they take to introduce? • What new equipment is desirable?
Materials handling / method study: Handling of materials is often a direct cause of low materials productivity. Products are often chipped, broken or scratched through inadequate materials handling methods. Allied to this will be methods study and how products are handled when in process. Methods study should be used to improve productivity of labour, machines and materials.
Materials Cash Loss: The stores are often cause of materials cash loss. Some of the reasons for this are:

141
• Stocks are too high when measured against demand, cash flow requirements or return on stores investment.
• Stocks are too low for the service levels offered and the restrictions or stoppages in production caused by too little stock of some or all stock items.
• Too much writing off of stock through deterioration caused by poor stores control, bad housekeeping or inadequate storage area. Resting, breakages, materials going beyond normal standing time may all occur.
• Ordering of wrong stores, resulting in obsolescence. • Frequency of ordering too great and administration costs consequence too great and
administration costs consequently too high. • Loss of cash discounts, demurrage, loss or returnable packages, etc. owing to
inefficient system. • Pilferage. The stores are usually a happy hunting ground for the light fingered. • Excessive control. Too much control can often be as bad as too little. Too elaborate
stock control systems may be expensive to administer. But it is better to have a complicated but goods control if these complete the store man’s normal working time.
• Over issues. Frequently material is over issued but unused material not returned to stores.
• Wastage caused by poor stores layout excessive heating and lighting is always a possibility.
• Wrong type of storing and materials handling systems, which are too costly for the use to which they are put. Space planning and location is often a key factor in ensuring that the stores will give an appropriate service to production.
Security: It is sad to record that one of the most important aspects of storekeeping will be to minimize pilfering. Often the 'shrinkage' among tools usable at home is in excess of 20 percent and is very costly to the organization. The objects of stores security will be
• Not to put temptation in the way of employees. • To protect stores so that there is an irreducible minimum of loss.
The various elements in ensuring stores security might be:
• Choose stores personnel of good character, known honesty and trustworthiness. • Physically isolate all stores vulnerable to theft. This may mean erecting wire mesh or
even brick and steel partitioned stores which can only be entered through a lockable door.
• Employees other than store men should not be allowed into the stores. (Occasionally stores are used as a canteen area during lunch breaks and at other times. This should be forbidden).
• All receipts and issues should be covered by proper receipted and numbered records with duplicates.
• As far as possible standards, prepacked quantities should be received and issued to perform a minimum load of stores which need not be opened before use and so should reduce possibilities of theft.
• If possible, a continuous inventory system (where a number of stock items are checked each day of each week) should be introduced, especially on items where pilferage is likely.

142
• The number of people who can sign requisitions for stores items should be a minimum. Operatives should not be allowed to draw items on their signature alone.
• The senior storekeeper should have clear cut accountability for his stores and their losses.
Purchasing Objectives: The objectives of purchasing can be summarized thusly; to efficiently provide fairly valued materials, supplies, and services in a timely manner. The following objectives are particularly important to operations:
• Good value: Value is the combination of price and quality. Good value means a competitive price, though not always the lowest one.
• Reliable schedules: One time, just in time delivery means schedules are reliable, a crucial quality.
• Minimized investment: Through careful analysis, the economics of order size, caring costs, and stock out costs determine the investment level. For example, quantity discounts must justify the larger investment (for a larger order) or investment unnecessarily increases.
• Efficient administration: Included here are executing a low-cost purchasing function, effectively coordinating activities with other internal functions (operations, engineering, etc), and maintaining good relations with vendors.
Effective Purchasing: Effective purchasing means learning the purchase requirements, identifying qualified sources of supplies, minimizing the total cost of supplies and administering the purchase. ---------------------------------------------------------------------------------------------------------------- 8.8 REVIEW QUESTIONS ----------------------------------------------------------------------------------------------------------------
1. Discuss the importance of material management. 2. What is Meaning of EOQ? Draw the model and give the formula for economic order
quantity. 3. Describe quantity discount model. 4. How will you handle spare part inventory? 5. What is MRP I & II? Give the salient feature of both. 6. Why is purchase important and what are its objectives?

143
---------------------------------------------------------------------------------------------------------------- OPERATION PLANING AND SCHEDULING SYSTEMS ---------------------------------------------------------------------------------------------------------------- Structure 9.1 Introduction 9.2 Aggregate Planning and its Process 9.3 Master Scheduling 9.4 Aggregate Planning for Service Organizations 9.5 Operating Schedule 9.6 Sequencing Rules 9.7 Optimized Production Technology and Synchronous Manufacturing 9.8 Just in Time (JIT) Manufacturing System 9.9 Basics of SCM and ERP 9.10 Review Questions ---------------------------------------------------------------------------------------------------------------- 9.1 INTRODUCTION ---------------------------------------------------------------------------------------------------------------- Before discussing the aggregate planning and processes we will spend time in understanding production planning and control. Production planning and Control is the organization and planning of the manufacturing processes, It coordinates supply and movements of materials and labor; ensures economic and balanced utilization of machines and equipments as well as other activities related with production to achieve the desired manufacturing results in terms of quantity, quality, time and place. Production planning implies formulation, coordination and determination of activities in a manufacturing system necessary for the accomplishment of desired objectives whereas production control is the process of maintaining a balance between various activities evolved during production planning providing most effective and efficient utilization of resources. Objectives of production planning and control;
• Determining the nature and magnitude of various inputs factors to manufacture the desired output
• To coordinate labor , machines and equipment in the most effective and economic manner,
• Establishing targets and checking these against performance. • Ensuring smooth flow of material by eliminating bottlenecks, if any, in production. • Utilization of under employed resources. • To manufacture the desired output of right quality and quantity at right time.

144
Production planning is a function of management which decides about the resources which the firm will require for its future manufacturing operations and of allocating these resources to produce the desired output in required amount at least cost. Production planning sets the framework within which detailed schedules and inventory control schemes must operate. The necessity of production planning arises for strictly managing internal operations to manufacture goods / services in the face of outside demand and constraints in multi-plant operations; production planning includes decisions with reference to the amount of each item to be made in of the plant. Pre-requisite for production planning is the decision regarding the method of production, i.e. pre-planning about the type of product and its design and the amount of output. Alternatively, production planning is necessary for directing and controlling the methods used for production and deals with the setting up of production facilities viz. building, machines, equipment etc. in available space. It involves the pre-determination of manufacturing requirements such as materials, money, order priority, production processes. For efficient production of desired goods and services. Planning is projecting appropriate action well in time about some predetermined objectives together with means necessary to achieve the objective. It involves study of various alternatives and to select the best alternative under a set of conditions using logistics. Production planning can be done at three levels, namely
• Factory Planning • Processes Planning • Operation Planning
The fundamental object of production planning is to produce right type of material both in quantity and quality at the right time , using the most appropriate method of production in the most effective manner, The various objectives or goals of production planning are;
• Systematic coordination and regulation of various activities, keeping in view the capacity of the resources and objectives of the organization
• To maintain proper balance of the activities for efficient production • Determination of raw material, machines, equipments etc. and other output
requirements for desired output • Anticipation of business changes and reacting to them in proper manner. • To have optimum use of the resources with optimum cost and time by having. Most
economical combination • To provide alternative production strategies in the case of emergencies
Production planning processes can broadly be divided in three categories;
• Routing—Routing means determination of path or route over which each piece is to travel in being transformed from raw material into the finished product.
• Scheduling is the process of prescribing “when” each operation in a production process is to be executed. In other words it involves designing the time table of manufacturing activities indicating the time required for the production of units in each stage. It is a description of when and where each operation in a production process is to be executed.
• Loading---It studies relationship between load and capacity of work centers in the systems

145
Production Planning only prescribes and outlines the objectives and provides guidelines for various activities involved in the transformation process of inputs into outputs. But it is the production control which directs and regulates all activities of production process it verifies whether the activities are going in accordance with the production plan or not. It is some sort of dynamic activity controlling the production cycle to ensure that the facilities and the personnel are economically utilized and products are manufactured within time and cost limits. Production Control provides the foundation, on which most of the other industrial controls are based, The production control department generally has to perform the following functions;
• Provision of raw materials , equipments , machines and labor, • To organize production schedule in conformity with the demand forecasts • The resources are used in the best possible manner in such a way that the cost of
production is minimized and delivery date is maintained, • Proper coordination of the operations of various sections / departments responsible for
production • Determination of economic production runs with a view to reduce set ups. • Ensure regular and timely supply of raw material at the desired place and prescribed
quality and quantity to avoid delays in production • To perform inspection of semi finished and finished goods and use quality control
techniques to ascertain that the produced goods are of required specifications. • It is also responsible for product design and development.
Thus, the fundamental objective of production control is to regulate and control the various operations of the production process in such a way that orderly flow of material is ensured at different stages of production and the items are produced of right quality in right quantity at the right time with minimum effort and cost. Production Control starts with some particular goals and formulation of some general strategy for accomplishment of desired objectives. There are three levels of production control namely;
• Programming plans the output of products for the factory as a whole. It regulates the supply of finished products in desired amount at the due date in accordance with a production plan. Programming ensures efficient use of labor, equipment and capital
• Ordering plans the output of components from the suppliers and processing departments. It breaks down the requirements for the product to be completed at specific times into orders to materials and processed parts and attempts to do so in such a way that they are available when needed.
• Dispatching is the routine of setting production activities in motion through the release of order and instructions in accordance with previously planned times and sequence embodied in route sheets and schedule charts.
Having learnt about the basics of Production planning and Control, now we can move to ---------------------------------------------------------------------------------------------------------------- 9.2 AGGREGATE PLANNING AND ITS PROCESS ---------------------------------------------------------------------------------------------------------------- Managing companies for success across a range of time frames - a requisite for achieving both performance and health - is one of the toughest challenges in business. The fact that 10

146
of the largest 15 bankruptcies in history have occurred since 2001 is playing up its inherent risks. Managements need to build confidence in their ability to realize longer-term strategies and good short-term results. Planning, for any period including aggregate planning, is possible only when management has information available on tap. This is especially true for batch-based manufacturing planning. Aggregate planning consists of the resource management planning activities that are done after the long-term capacity and capability planning decisions have been made. These planning activities are designed to help the firm achieve its long-term strategic initiatives. The nature of these activities is influenced by the structure of the product delivery systems. What Is Aggregate Planning? Firms make the strategic long-term resource commitments that will enable its operations function to achieve its corporate objective. Most of the decisions needed to create these capabilities involve strategic commitments, i.e., where to site and how to site facilities; how to acquire plant and equipment; what type of information systems to be implemented and executed; and how to create an organization with a culture that serves the corporate strategy well. Aggregate planning is the "big picture" approach to planning for the intermediate term. While strategic planning deals with long range operations of facilities and resources, aggregate planning deals with developing ways to utilize those facilities and resources. In other words, the aggregate plan links strategic goals and objectives of the organization with the plans for individual products, services and their various components. The Aggregate Planning Process The process consists of four basic considerations as follows:
• Concept of Aggregation starts with a meaningful measure of output. In a single product output organization there is no problem with the output measure. Many organizations have multiple products and it is difficult to find a common factor of measure of output.
For e.g. steel producer can plan in terms of tons of steel, gallons of paint in case of paint industry. Service organizations such as transport system may use passenger miles as a common measure, health care facilities may use patient visits, and educational institutes may use student to faculty contact ratio in terms of hours as a reasonable measure. A group of products or services that have similar demand requirements and common processing, labor and materials requirements is called a Product Family. Therefore a firm can aggregate its products or services into a set of relatively broad families, avoiding too much detail at the planning stage. For example consider the Bicycle manufacture that has aggregated all products into two families: mountain bikes and road bikes. This approach aids production planning for the assembly lines in the plants.
• Goals for aggregate planning there are number of goals to be satisfied. It has to
provide the overall levels of output, inventory and backlogs dictated by the business plan. Proper utilization of the plant capacity. It should not be under utilized because it

147
is waste of resources. It is better to operate at a near full capacity. The aggregate plan should be consistent with the company's goals and policies regarding its employees. A firm may like to have employee stability or hire and layoff strategy. Other firms change employees freely as the output level is varied throughout the aggregate planning horizon.
• Aggregate Demand Forecasts The benefits of aggregate planning depends on the
accurate forecasting. Any suitable forecasting model can be used to forecast demand for product groups as well as individual products.
• Interrelationships among decisions Here the managers must consider the future
consequence of current decisions. This is important mainly due to the fact that output plans are developed for a long period of time.
Strategies for Aggregate Planning: There are three pure strategies that the planner could use for the Aggregate Planning. Strategy 1. Vary the number of Productive employees in Response to Varying output Requirements (also known as Chase 1 plan). Here, the average productivity per employee is first calculated which determines the number of employees needed to meet the monthly required output demand. The employees are laid off when the output demand falls. As a result there is always Hiring and laying of employees. Strategy 2. Maintain a Constant Work Force Size but Vary the Utilization of the Work Force (also known as Level # 1). Suppose, for example, we chose the strategy of employing 70 workers per month throughout the year. On an average, this work force would be capable of producing 700 wagons each day. During the lean months (January, February, March, July, October, November, December), the work force would be scheduled to produce only the amount forecasted, resulting in scheduled to produce only the amount forecasted, resulting in same idle working hours. During high demand months (April, May, June, August, September), overtime operations would be needed to meet demand. The work force would therefore be intensely utilized during some months and underutilized in other months. Strategy 3. Vary the Size of Inventory in Response to Varying Demand (also known as Chase # 2 plan). Finished goods inventories in make-to-stock companies can be used as a cushion against fluctuating demand. A fixed number of employees, selected to that little or no overtime or idle time is incurred, can be maintained throughout the planning horizon. Producing at a constant rate, output will exceed demand during slack demand periods, and finished goods inventories will accumulate. During peak periods, when demand is greater than capacity, the demand can be supplied from inventory. This planning strategy results in fluctuating inventory levels throughout the planning horizon.

148
--------------------------------------------------------------------------------------------------------------- 9.3 MASTER SCHEDULING ---------------------------------------------------------------------------------------------------------------- The production plan represents a firm's aggregate measure of manufacturing output. Once this plan is made, it is the responsibility of marketing to sell it and production to implement it. To do so requires a desegregation of the production plan into individual products. The master production schedule (MPS) is a statement of how many finished items are to be produced. Typically the master schedule is developed for weekly time periods over 6-12 months horizon. Master scheduling is generally a complex problem, especially for products with large number of operations For example, in Dow Corning there are 12 MPS; who are responsible for scheduling 400 packed products over a 26-week time horizon. In process industries with only a few different operations, master production scheduling is somewhat easier. Using the Master Schedule: Master scheduling can be a complicated process. Let us summarize some of the observations.
• First, the master production schedule should relate to the aggregate products. • Second, rough-cut capacity planning assists the master scheduler in developing a
feasible schedule by determining potential production bottlenecks. Often, the master scheduled must be revised several times until it is feasible.
• Third, other ways of evaluating a master production schedule include the and cost of setups or product changeovers and short-term inventory fluctuations.
The master schedule is important, since it forms the basis for future production planning activities. Therefore, it must be adaptive to changes in the environment. Seldom will forecasted demands be realized or production plans be adhered to perfectly. As each week passes, operations managers must compare scheduled production with actual results. This may result in changes to the MPS-master scheduling is a full time job! Too many changes, however, indicate that master scheduling is not being performed correctly and can result in poor productivity and low levels of customer service. ---------------------------------------------------------------------------------------------------------------- 9.4 AGGREGATE PLANNING FOR SERVICE ORGANIZATIONS ---------------------------------------------------------------------------------------------------------------- Service organizations can also use aggregate planning. The typical service operation, however, is make -to- order than make-to-stock. Consequently, finished goods are not available for responding to demand fluctuations. Instead, backlogs of customer requests can be increases or decreased to utilize capacity at desired levels. The following example shows how a city's parks and recreation department could use the alternative of full-time employees, part-time employees, and subcontracting to meet its commitment to provide a service to the city. Tucson Parks and Recreation Department has an operation and maintenance budget of $9.760.000. The department is responsible for developing and maintaining open space, all public recreational programs, adult sports leagues, golf courses, tennis courts, pools, and so forth. There are 336 full-time-equivalent employees (FTEs). Of these, 216 are full-time permanent personnel who provide the administration and year round maintenance to ail area. The remaining 120 FTE positions) show up as approximately 800 part-time summer jobs:

149
lifeguards, baseball umpires, and instructors in summer programs for children. Eight hundred part time jobs came from 90 FTEs because many last only for a month or two, while the FTEs are a year long. Currently, the only parks and recreation work subcontracted amounts to less than $100,000. This is for the golf and tennis pros and for grounds maintenance at the libraries and veterans cemetery. Because of the nature of city employment, the probable bad public image, and civil service rules, the option to hire and fire full time help daily or weekly to meet seasonal demand is out of the question. However, temporary part time help is authorized and traditional. Also, it is virtually impossible to have regular (full-time) staff for all the summer jobs. During the summer months, the approximately 800 part-time employees are staffing many programs that occur simultaneously, prohibiting level scheduling over a normal 40 hour week. A wider variety of skills are required (such as umpires, coaches, lifeguards, and teachers of ceramics, guitar, karate, belly dancing, and yoga) that can be expected from full-time employees. Three options are open to the department in its aggregate planning:
• The present methods, which is to maintain a medium level full-time staff and schedule work during off-seasons (such as rebuilding baseball fields during the winter months) and to use part-time help during peak demands.
• Maintain a lower level of staff over the year and subcontract work, including part-time help. (This would entail contracts to landscaping firms and pool maintenance companies as well as to newly create private firms to employ and supply part time help.)
The common unit of measure of work across all areas is full time equivalent jobs or employees. For example, assume in the same week that 30 lifeguards worked 20 hours each, 40 instructors worked 15 hours each, and 35 baseball umpires worked 10 hours each. This is equivalent to (30 x 20) + (40 x 15) + (35 x 10) = 1,550 ÷ 40 = 38.75 FTE positions for that week. Although a considerable amount of workload can be shifted to off-season, most of the work must be done when required. Full time employees consist of three groups;
• the skeleton group of key department personnel coordinating with the city, setting policy, determining budgets, measuring performance, and so forth;
• the administrative group of supervisory and office personnel who are responsible for or whose jobs are directly linked to the direct labor workers; and
• The direct-labor workforce of 116 full time positions. These workers physically maintain the department's areas of responsibility, such as cleaning up, mowing golf greens and ball fields, trimming trees, and watering grass.
---------------------------------------------------------------------------------------------------------------- 9.5 OPERATING SCHEDULE ---------------------------------------------------------------------------------------------------------------- Operating schedules are short term plans even day to day plans designed to implement the master schedule plans. Once a business plan is in place then a master schedule is made showing how many of each product must be produced according to the customer orders and demand forecast.

150
Conversion system can be broadly classified as either continuous or intermittent depending on the conversion process and the product or service. A continuous or assembly type system is one is which a large number or infinite number of units of a homogenous product is produced. An intermittent, on the hand, produces a variety of products one at a time (in which case they are custom made) or in batches to customer order. Many conversion facilities are neither strictly intermittent nor continuous but a combination of both. Implication in a manufacturing context: In the manufacturing context, intermittent systems are traditionally referred as job work or shops. Therefore a number of questions arise such as
• Which work centers will do which job? • When should an operation / job be started? When should it end? • On which shipments should be done, and by whom?
In manufacturing the sequencing in which waiting jobs are processed is critical to the efficiency and effectiveness of the intermittent systems. Sequencing affects how many jobs are completed on time versus late, costs incurred for set up and changeover, delivery lead times, inventory costs, and the degree of congestion in the facility scheduling of the intermittent systems poses a challenge for operations manager. ---------------------------------------------------------------------------------------------------------------- 9.6 SEQUENCING RULES ---------------------------------------------------------------------------------------------------------------- Simulation of Intermittent (job shop) Systems: Simulation techniques can be used to evaluate various sequencing rules in job shop facilities. The following is list of data the modeler must be able to specify in order to stimulate the sequencing problem. The modeler can use historical data and patterns for the purpose and during simulation can use the Monte Carlo method to randomly select portions of the historical data that the simulation requires as it runs.
• Work centers- The number of work centers in the shop must be specified. • Job arrivals- The pattern and timing of jobs "arriving" at the facility must be specified. • Job classification- The processing requirements or routing of jobs must be specified. • Processing time- The time it takes to process jobs must be specified. • Performance parameters-Any number of parameters that gauge the performance at the
facility can be incorporated into the simulation; the quantification of these parameters must be specified. Options include percent idle time, amount of inventory, average lateness of jobs, average job flow, and so on.
• A Sequencing rule must be specified
The simulation known as a simulation run, is conducted over time. The simulation runs through a very large number of jobs, say 10,000 or more. The simulation generates new jobs arriving at various times, determines their routings, loads them to the appropriate work centers, sequences them according to the sequence rule, and determines their processing times. When a work center completes one job, it begins processing the next job in the queue, according to the sequence rule.

151
After all jobs have been processed, the simulation evaluates the performance of the facility according to the parameters specified. The performance statistics are saved for later comparison. The modeler may now run the simulation again, specifying a different sequence rule. When the simulation evaluates the performance of the facility accordingly, the results of both simulation runs can be compared. Any number of sequence rules may be evaluated and compared in this way. Simulation Results for Job Flow Time: One study tested ten sequence rules in six different job shop configurations using computer simulation. The results are based on processing over 2 million jobs through the simulated system. Our main interest in the results has to do with the job flow performance of the rules, an important concern to shop managers. Job flow is commonly measured in two ways : as the average flow time of jobs through the system; and as the dispersion of job flow times through the system (measured by a standard deviation or variance). The simulation study found that average (mean) flow time per job was lowest (0.99) using the SPT rule; using other rules it was as high as 2.54. The standard deviation of flow time ranged from 1.55 to 5.43 using the various rules. Although the standard deviation of flow time was lower using two of the other rules, SPT did well on this parameter also. These results are not surprising when you consider how the SPT rule works. Since the highest priority job is the one whose processing time is the highest priority job is the one whose processing time is shortest, this job does not have to wait long in the queue; its flow time (waiting plus processing time) is low. Simulation results for Job Lateness and Work- in- process Inventories: Using a computer simulation, another researcher examined how well 39 sequencing rules performed in terms of job lateness and inventories. Z In term of percentage of jobs late, SPT performed far better than most other rules tested. This same study found that the SPT rule was not optimal for minimizing in-process inventory, although its performance was still relatively good. The optimal rules were found to be compound rules. They require somewhat more complex calculations than does the SPT rule. These compound rules, all combined into one. In short, the SPT, although not optimal, performed well, and it did so without although not optimal, performed well, and it did so without requiring the extensive calculations of the more complex rules. ---------------------------------------------------------------------------------------------------------------- 9.7 OPTIMIZED PRODUCTION TECHNOLOGY AND
SYNCHRONOUS MANUFACTURING ---------------------------------------------------------------------------------------------------------------- Optimized Production Technology: There is another approach to the planning and scheduling so far presented is Optimized Production Technology. This is a computer based system for planning production, material computer based system for planning production, material needs, and recourse utilization. It was first introduced in the USA in 1979 by Creative Output Inc, a Consulting Firm in Milferd Connecticut. The key feature of OPT is its emphasis on bottleneck center works- people or machines. The OPT philosophy is that managing bottlenecks is the key to successful performance total system output can be maximized and the in-process inventories reduced.

152
The Optimized Production Technology Software consists of four modules.
• BUILDNET • SERVE • SPLIT • OPT
The above mentioned modules creates a model of the shop according to the data provided by the user, how each product is made, its build up sequence, materials, and routing through the shop, the products time requirements (setup, run time, schedule delay), the capacity availability at each resource (work center, machine, worker), and the order quantities. The initial purpose of SERVE is to create a tentative schedule for the jobs waiting in the shop. Later it creates a more refined schedule. The crucial information obtained in the SERVE is an estimate of the percentage utilization of the various shop resources. The SPLIT module distinguishes critical from non critical resources based on their percent utilizations calculated by SERVE. Resources that are near or above 100 percent utilization are the bottleneck operations. These bottlenecks, and the operations that follow them, are the "critical" operations; all others (those with lower percentage utilizations) are "non critical." The OPT module reschedules the critical part of the network using forward scheduling. Then the program cycles back to SERVE to reschedule the non critical resources. The OPT package consists not only of software but of consulting services and training for implementation as well. The specific details of the procedure, especially of SERVE and OPT (the detailed scheduling modules), are proprietary (not published and available to the general public). Consequently, detailed comparative evaluations of its performance with that of other systems are not available. Synchronous Manufacturing: Optimized production Technology (OPT) was evolved through software. This software was developed by Creative Output Inc USA and the person responsible for it is Dr. Eli Goldratt. Here the scheduling logic is based on the separation of "bottleneck" and non-bottleneck operations. Further Dr. Goldratt developed the "Theory of Constraints" (TOC), which has become popular as a problem solving approach that can be applied to many business areas. So let's go through TOC briefly;
• Identify the system constraints (No improvement is possible unless the weak link or constraint is found out)
• Decide how to exploit the system constraints (Make the constraints as effective as possible.
• Subordinate everything to that decision (align every other part of the system to support the constraints even if this reduces the efficiency of non constraint resources).
• Elevate the system constraints (If output is still inadequate acquire more of this resource so that it is no longer a constraint)
• If, in the previous steps, the constraint is broken back, go back to step 1, but do not let inertia become the system constraint (After the constraint problem is solved, go back to the beginning and start all over again. This is a continuous process of improvements.

153
Therefore by removing the constraints and moving forward we get into a situation where the entire operations or production process work in harmony to achieve the ultimate goal of an organization i.e. Profit. From the point of view of operation or pr5oduction management in order to achieve profit, the goal would be increase throughput while simultaneously reducing inventory and reducing operating expenses. ---------------------------------------------------------------------------------------------------------------- 9.8 JUST IN TIME (JIT) MANUFACTURING SYSTEM ---------------------------------------------------------------------------------------------------------------- Origins of JIT: The process of manufacturing has been significantly influenced by the turn of events in history. In the beginning of the 19th Century, Henry Ford pioneered the mass production system as a way for manufacturing organizations to organize, plan, control and evaluate their operations. Several operations management tools developed during that time sought to promote the mass production philosophy. During World War II, flexibility was a key requirement and this altered the manner in which operations management theory and practice developed. However, the events surrounding the oil crisis in 1972 had a significant impact on several of the operations management practices that we practice today. Market recession put new pressures on the manufacturing system and demanded better methods of managing operations in manufacturing organizations. Customers increasingly demanded more options and also commitment to deliver products and services faster. In response to these changing requirements, new principles of managing operations were required. Managing the operations efficiently, developing alternative methods for quality management and creating responsive organizational structures were some of the newer requirements. Notable, Japanese manufacturers developed a set of tools and techniques, over a period of two decades, that addressed many of the above requirements. Using these new capabilities, Japanese manufactures threatened to alter the forces of competition and sought to provide new value to customers. In the automobile sector, passenger car manufacturers such as Toyota and motorcycle manufacturers such as Kawasaki competed effectively with established giants in the US such as GM and Harley Davidson, respectively. While Japanese manufacturers could offer products that were of low cost and high quality, American manufactures were offering exactly the reverse, that is, low cost products at a high cost. The initial success of the Japanese manufacturers in the automotive sector was soon to be replicated in other sectors of the industry. Notable among them include electronic components such as resistors, memory chips and transistors and entertainment electronics products such as cameras and musical systems. Before we understand the logic of JIT, it is important to note that the definition of waste is unique in Japanese manufacturing management literature. Any process or a set of activities that do not add value as perceived by the customer is classified as waste. Adopting such a definition would mean that having an inventory of material, unutilized capacity lost due to poor planning and scheduling or defects and rework are all considered as waste. Just in Time manufacturing is a new philosophy of manufacturing management that provides a set of tools and techniques to compete in the increasingly fierce market and enables organizations to provide better value in their offerings by constantly improving their operations and eliminating waste from the system. Philosophy of JIT: The philosophy of JIT is in contradiction with this traditional thinking on solving such problems encountered in manufacturing systems. It works two ways. In the case of water flow, instead of pouring more water into the system to cover the newly grown

154
structure, efforts will be made to "trim" the new growth and bring it back to a limit whereby the boat can continue to sail smoothly. In our manufacturing example, if there is a problem with the supplier, instead of increasing the safety stock, collaborative efforts will be launched with the suppliers to solve the problem.
However, the crux of JIT philosophy is to go step further and deliberately create some disturbances in the system in order to uncover problem areas. Once the problems are exposed, the organization will work towards solving the problem and restoring smooth production rates. Returning to our water flow example, what it means is that when the boat sails smoothly, pump out some water from the system and expose the tallest rock. Chisel the rock to a level that the boat can resume sailing smoothly. After a few rounds of smooth sailing, pump out some more water and continue the process. In the manufacturing example, what it means is to have a method by which the buffer is withdrawn from the system. By withdrawing the buffer, new problems are exposed. By studying the problem, new methods will be devised to restore smooth production rates. After one cycle of this exercise is satisfactorily completed, begin the next cycle by could be progressively reduced even while smooth production rates are restored. What makes JIT philosophy different from conventional thinking is the "deliberate" choice on the part of management to expose hidden problems even while the production system is operating at a certain level of equilibrium. Therefore, one can define JIT as an organization-wide mandate to systematically expose the hidden problems. Elements of JIT Manufacturing: Although the logic of JIT is intuitively appealing, in reality, to practice JIT and reap the promised benefits, an organization needs to have several key elements in the manufacturing system. Manufacturing Architectural Charges: Manufacturing architecture provides an overall framework in which the various activities, people, and issues that are related to the production and distribution of goods and services either directly or otherwise are organized. Essentially, manufacturing architecture defines the nature of the relationship between the various functional units in an organization and addresses issues relating to structure, systems, procedures and people. Through a careful choice of the system and structure issues, it tries to create a seamless structure that encompasses the entire value stream and brings about physical and logistical linkage among the functional units.

155
The most significant change required to practice JIT is to create a new manufacturing architecture. JIT emphasizes waste elimination and in order to perform this, the manufacturing architecture should be conducive. Figure 9.1.7 conveys the transformation schematically. Principles of making manufacturing architectural changes address two types of issues. The first is the structural issue. Structural issues confine to the physical aspects of carving out the new architecture. This includes the layout of machines and other resources on the shop floor and in the offices, and the organization structure and reporting relationships between employees in an organization. The second is a set of logistical issues. Issues related to the systems, procedures and people are referred to as logistical issues. Organizations need to understand that changes in the structural issues need to be complemented by corresponding changes in logistical issues. Merely changing the physical aspects at the shop floor and the offices do not provided the desired improvements. The actual improvement and the benefits accrued are commensurate tot he corresponding changes made in certain systems, procedures and people related issues. For example, the new structure will demand that skills of people be re-distributed in a different fashion. The predominant customer focus to the whole design will force radical changes in the systems used for measuring the performance and rewarding people in the organization. Making efforts to seamlessly integrate the supplier layer with other layers internal to an organization will call for new systems and procedures. While addressing the various aspects of manufacturing architecture, one should keep in mind that organization exists for customers. The art of creating customer focus is a matter of detail. At the highest level it may call for the creation of divisions and business units. However, at the lowest level it means that there will be dearly defined end results or products that relate directly to a organizational resources as well as to a customer group. Changing the layout, re-deploying the work force and redefining organization structure are not going be to be easy. They result in altered power structure of the various individuals in the organization, and call for a different working style and behavior. Efforts are required to design a better work place organization. Visual boards can play a major motivational role in directing improvements and increasing the ownership of product and process. They can play a leading role in linking all the functional areas of an organization through an information network. Without such exercises, the agenda of waste elimination using JIT may not be feasible. The final outcome of the architectural changes made to a manufacturing organization is that a system having chain of customers-suppliers emerges. Beginning with marketing, which is the internal arm of the ultimate customer, a chain of preceding and succeeding processes is established. Finished goods (FG) stores will have a supplier relationship with marketing. Similarly, final assembly will become a supplier to FG stores. Manufacturing will resemble a linked chain wit several links. Each link will have a supplier-customer relationship and will feed the material from the raw material stores right up to the final assembly. This chain structure will greatly aid material flow, production planning and control functions. Lot Size Reduction: Addressing capacity issues in JIT requires a different approach compared to traditional thinking. Since JIT is about waste elimination, there is a greater emphasis to uncover maintenance. In Japanese manufacturing management, capacity is nothing but a sum of actual production and waste. Thus, if there is a mass manufacturer with an installed capacity for producing 25,00 items per month using a set of resources, but

156
averages a monthly production of only 22,000, then the balance 3000 units lost is accounted as waste. A study of an auto-component manufacturing unit in Tamil Nadu showed that capacity losses in their organization (in monetary terms) were attributed to the following: Underutilization of machine Rs. 14.99 million (which mainly consisted of lost time due to setup of machines) Waste due to non-usage of machine Rs. 2.50 million Not maintaining proper specifications Rs. 0.65 million Total capacity lost Rs. 18.14 million Therefore, one major source for waste elimination is setup time reduction. When setup time is reduced, it is obvious that the lot size will also be smaller. Imagine that there are two identical manufacturing setup. In the first, the setup time is 12 hours and in the second the setup time is 30 minutes. Clearly, in the first case, it makes very little sense to setup a machine for 12 hours and engage in production for anything less than 12 hours. Therefore, the lot size will tend to be at least equal to the production for 12 hours. In contrast, in the second case, it is possible to setup the machine frequently and produce in smaller quantities. This increases the ability of the organization to respond to changes better. We have already seen the benefits that accrue to an organization on account of smaller lot sizes. The earliest success stories in JIT have a strong component of setup time reduction initiatives. Shigeo Shingo developed the Single Minute Exchange Die (SMED) system to drive down setup time. The philosophy behind SMED is that there are internal and external operations involved in any setup of machines. Internal operations are those that require interruption of the machine for performing the setup operation. Therefore, it results in loss of capacity. For example, changing a die in a press or a cutting tool requires stopping of the machine. On the other hard, there are several operations pertaining to setup that could be done off-line. These operations are known as external operations and they do not result in any loss of capacity. Obvious examples include planning the setup operation, obtaining the set of tools and other resources required as well as obtaining the required authorizations. SMED is a systematic method by which internal operations are progressively converted into external operations. Initially, there will be minimum use of technology to achieve this. However, as the SMED process proceeds, it may call for a very close study of the setup process and use of technology to make modifications on the equipment. Setup time reduction involves three stages. In the first stage, obvious imperfections in planning and procedural aspects are addressed. This may bring down the setup time from several hours to about an hour. In the second stage, some technology in introduced to alter the design of fixtures, dies etc. This may bring down the setup time to less than 30 minutes. In the final stage, extensive use of advanced technologies, to make significant design changes on the equipment, will be required to bring down the setup to a "one touch setup" (of having a setup time of about 100 seconds). This results in uncovering large amounts of wasted capacity and making the system flexible and responsive to changes. Batch sizes eventually drop close to one, permitting manufactures to develop single piece flow system.

157
Kanban as Control Tool: Production control is primarily achieved by passing information pertaining to production to the respective work centers. The information typically consists of an authorization to produce a certain quantity of items beginning at a particular time. Although this appears to be a simple task, traditional manufacturing systems have experienced difficulties in performing this task. Traditional manufacturing systems have experienced difficulties in performing this task. This is partly due to bad structure emphasizing functional orientation. However, JIT systems make architectural changes and simplify the planning and control process to a large extent. Therefore, it is possible to devise alternative methods for production control. Typically, JIT manufacturers utilize a concept known as Kanban. Kanban is a Japanese word, which approximately denotes a card or a visible signal. Taichii Ohno, the father of Toyota Production System conceived the logic of Kanban as a production control tool based on the stock replenishment process in a supermarket. In a super market, various goods are displayed on the shelf in limited numbers. As customers "pull out" their requirement, the inventory of items in display depletes. Therefore, at the end of the day (or as soon as the shelf empties), the shelves are refilled to the extent of consumption. The use of Kanban for production control is very similar. A pre-determined quantity of items is to be stacked between every pair of succeeding and preceding processes. As the customer pulls out her requirement, the signal travels along the chain and each link in the chain schedules production only to the extent of refilling the stocking points. The signaling from the customer down to the raw material stores is done through Kanban. Kanban could be a card, an electrical signal or a message flashed through the web. ---------------------------------------------------------------------------------------------------------------- 9.9 BASICS OF SCM AND ERP ---------------------------------------------------------------------------------------------------------------- 'Supply Chain Management' is defined as the integration-oriented skills required for providing competitive advantage to the organization that are basis for successful supply chains. A typical supply chain may involve a variety to stage. These supply chain stages include:
• Customers • Retailers • Wholesaler/ Distributors • Manufacturers • Component/Raw material suppliers
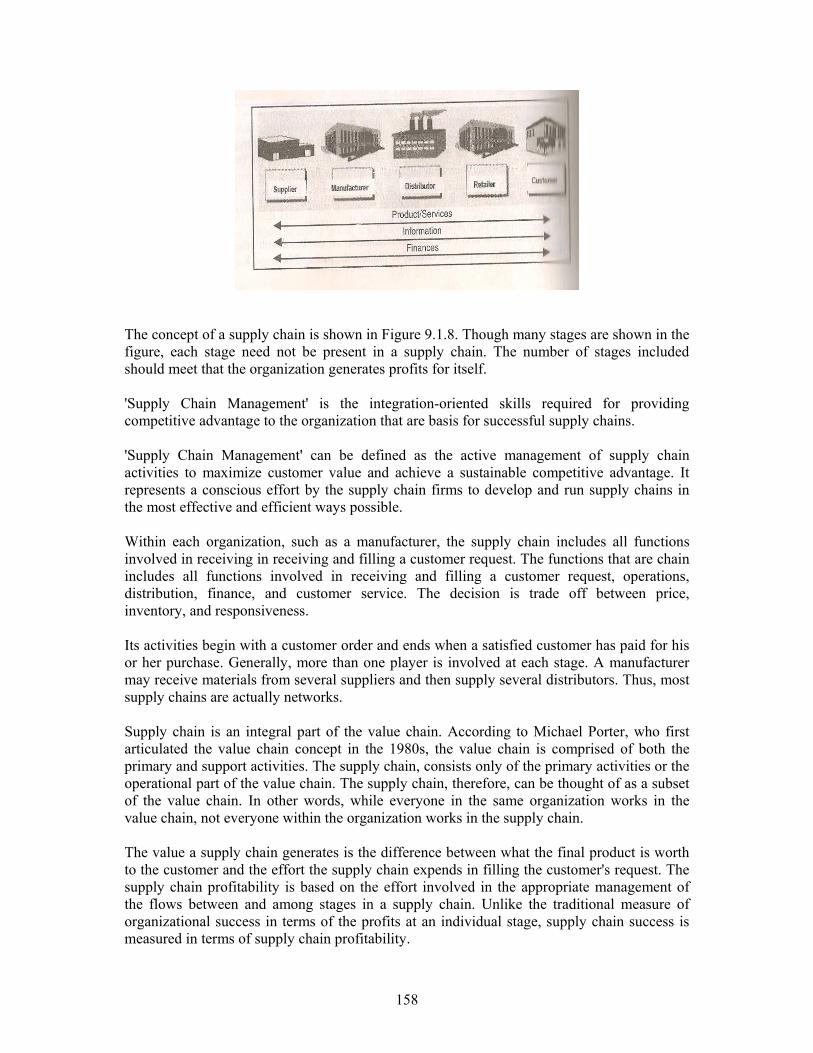
158
The concept of a supply chain is shown in Figure 9.1.8. Though many stages are shown in the figure, each stage need not be present in a supply chain. The number of stages included should meet that the organization generates profits for itself. 'Supply Chain Management' is the integration-oriented skills required for providing competitive advantage to the organization that are basis for successful supply chains. 'Supply Chain Management' can be defined as the active management of supply chain activities to maximize customer value and achieve a sustainable competitive advantage. It represents a conscious effort by the supply chain firms to develop and run supply chains in the most effective and efficient ways possible. Within each organization, such as a manufacturer, the supply chain includes all functions involved in receiving in receiving and filling a customer request. The functions that are chain includes all functions involved in receiving and filling a customer request, operations, distribution, finance, and customer service. The decision is trade off between price, inventory, and responsiveness. Its activities begin with a customer order and ends when a satisfied customer has paid for his or her purchase. Generally, more than one player is involved at each stage. A manufacturer may receive materials from several suppliers and then supply several distributors. Thus, most supply chains are actually networks. Supply chain is an integral part of the value chain. According to Michael Porter, who first articulated the value chain concept in the 1980s, the value chain is comprised of both the primary and support activities. The supply chain, consists only of the primary activities or the operational part of the value chain. The supply chain, therefore, can be thought of as a subset of the value chain. In other words, while everyone in the same organization works in the value chain, not everyone within the organization works in the supply chain. The value a supply chain generates is the difference between what the final product is worth to the customer and the effort the supply chain expends in filling the customer's request. The supply chain profitability is based on the effort involved in the appropriate management of the flows between and among stages in a supply chain. Unlike the traditional measure of organizational success in terms of the profits at an individual stage, supply chain success is measured in terms of supply chain profitability.

159
The objective of every supply chain is to maximize the overall value generated so that the final price of the good covers all of the costs involved plus a profit for each participant in the chain. Figure 9.1.8.2 shows the supply chain as a network and also as a part of the value chain.
The appropriate design of the supply chain will depend on both the customer's needs and the role of the stages involved. In some cases, a manufacturer may fill customer orders directly. For example, Dell has been one of the most successful examples of effective supply chain management. Dell builds-to-order, that is, a customer order initiates manufacturing at Dell. Dell does not have a retailer, wholesaler, or distributor in its supply chain. While other computer companies must stock a month of inventory. Dell carries only a few days worth. In fact, many of the components are delivered within hours of being assembled and shipped to the customer. It plans orders and signals suppliers every two hours, which enables it to manufacture and deliver exactly what its customers want. In other cases, such as in a mail order business like Amazon.com, the company maintains an inventory of product from which they fill customer orders. In the case of retail stores, the supply chain may also contain a wholesaler or distributor between the store and the manufacturer. Decisions in a Supply Chain: Supply chain management involves proactively managing the two-way movement and coordination (that is, the flows) of goods, services, information, and funds from raw material through end user. A company with a "supply chain orientation" is one that recognizes the strategic value of managing operational activities and flows across a supply chain. It s decision fall into three categories of phases: Supply Chain Design: Supply Chain Design is a strategic decision. If reflects the structure of the supply chain over the next several years. It decides what the chain's configuration will be, how resources will be allocated, and what processes each stage will perform.

160
Successful design requires a high degree of functional and organizational integration. In order to do so, it is essential to develop supply chain process maps (flow charts) for major supply chains and their related processes helps establish an understanding of the supply chain. There should be a clearly understood mapping convention to be utilized, along with other information requirements. The objective of this exercise is to develop supply chain maps that present all supply chain entities along with key processes. From this exercise will flow such decisions as the location and capacities of production and warehousing facilities, the products to be manufactured or stored at various locations, the modes of transportation, and the type of information system to be utilized. The organization must also identify key and critical supply chains components. It must be knowledgeable regarding its part of the supply chain and also must understand how the part interfaces with the other parts of the supply chain. The supply chain configuration should support the organization's strategic objectives. In the case of TI Cycles regarding the location and capacity of its manufacturing facilities at Aurangabad, the joint manufacturing agreement with Avon Cycle and distribution network are all supply chain design or strategic decisions. These are long-term decision and are very expensive to alter on short notice. Consequently, when companies make these decisions, they must take into account uncertainty in anticipated market conditions over the next few years. Supply Chain Planning: In the planning phase, companies define a set of operating policies that govern short-term operations and are normally determined on an annual basis. These decisions are made within the supply chain's configuration. Planning starts with a demand forecast for the coming year. Based on the demand, an annual plan is worked out. Decisions regarding which markets will be supplied from which locations, outsourcing and sub-contracting, inventory policies, etc. are made. Planning, in other words, establishes parameters within which a supply chain will function over a specified period of time. One the key supply chains have been identified, one must identify the supply chain member organizations (suppliers and customers) that are considered most critical to the organization's supply chain management efforts. In selecting external members, several issues should be addressed.
• SCM endeavors are likely to be more productive if participating organization are not direct competitors. There may be limits to collaborative supply chain efforts when both buyer-supplier and competitor relationships exist between participating organizations.
• All organizations and their representatives must be pursuing similar goals. This does not mean that each organization should have identical goals, but that their respective goals must be compatible with the overall SCM initiative.
• SCM initiative is unlikely to be successful unless all members from each organization involved feel they are benefiting from participation. SCM efforts have to be focused where the involvement is beneficial to all the members.
In well managed organizations, in the planning phase uncertainty in demand, exchange rates, and competition over this time horizon are included in the decisions. Given a shorter time

161
horizon and better forecasts than the design phase, the planning phase tries to exploit the supply chain design to optimize performance. Supply Chain Operation: This has a short-term time horizon, monthly, weekly or daily. The focus, during this phase, it on individual customer orders. At the operational level, within planning policies, the goal is to handle incoming customer orders in the best possible manner. Firms allocate inventory or production to individual orders, set a date that an order is to be filled, generate pick lists at a warehouse, allocate an order to a particular shipping mode and shipment, set delivery schedules of trucks, and place replenishment orders. Aggregate planning is the basis for decisions at this stage. The aggregate plan serves as a broad blueprint for operations and establishes the parameters within which short-term production and distribution decisions are made. It allows the supply chain to alter capacity allocations and change supply contracts. In addition, man constraints that must be considered in aggregate planning come from supply chain partners outside the enterprise, particularly upstream supply chain partners. Without these inputs from both up and down the supply chain, aggregate planning cannot realize its full potential to create value. The output from aggregate planning is also of value to both upstream and downstream partners. Production plans for an organization define demand from suppliers and establish supply constraint for customers. If a manufacturer has planned an increase in production over a given time period, the supplier, the transporter, and warehousing partner must be aware of this plan and incorporate the increase in their own plans. Because operation decisions are being made in the short term, there is less uncertainty about demand information. Given the constraints established by the configuration and planning policies, the goal during the operation phase is to exploit the reduction of uncertainty and optimize performance. Ideally, all stages of the supply chain should work together to optimize supply chain performance. An important supply chain issue is collaboration with down stream supply chain. Therefore, it is important to perform aggregate plans over as wide a scope of the supply chain as is reasonably possible. Introduction to ERP: In the early 1990s many large companies realized that it was time to update their existing information systems to take advantage of new technologies. Programs written in programming languages such as COBOL, PLI, RPG, and assembler were becoming increasingly expensive to maintain. Further the mainframe computer technology was not cost defective compared to the ever more powerful and inexpensive microprocessor-based computer. Change was inevitable. And SAP offered a comprehensive solution. SAPAG, a German firm, is the world leader in providing ERP software. Its flagship product is known as R/3. The software is designed to operate in a three-tier client / server configuration. The core of the system is a high-speed network of database servers. These database servers are special computers designed to efficiently handle a large database of information. The R/3 applications are fully integrated so that data are shared between all applications. If for example an employee posts a shipping transaction in the sales and Distribution module,

162
the transaction is immediately seen by Accounts payable in the Financial Accounting module, and by inventory management in the materials management module. Much of the success of the product is due to the comprehensive coverage of business applications. In a sense, SAP has changed the face of information technology. R/3 Application Modules: R/3 is built around a comprehensive set of application modules that can be used either alone or in combination. The modules the make up R/3 the emphasis is placed on what these modules actually do, not on the technical aspects of how they communicate with one another. SAP organizes the R/3 modules in a variety of ways in its documents. In general, there are four major elements to the organization: financial accounting, human resources, manufacturing and logistics, and sales and distribution. Financial Accounting: The financial accounting segment of R/3 includes three major categories of functionality needed to run the financial accounts for a company financials (FI), controlling (co), and asset management (AM) As with all the modules in the R/3 system, the user will find all information current and integrated. Thus an individual manufacturing plant or sales organization can run a profit and loss report at any time during the month and be shown the most up to date information. The controlling category includes costing; cost center, profit center, and enterprise accounting and planning; internal order; open item management; posting and allocating ; profitability analysis; and a variety of reporting functions. It also includes a project system to track activity and costs related to major corporate projects, such as the implement of an R/3 system. Also include is a module of all activity based costing (ABC) to other types of costing approaches. The asset management category includes the ability to manage all types of corporate assets, including fixed assets, leased assed, and real estate. It also includes the capital investment management module, which provides the ability to manage, measure, and oversee capital investment programs. Human Resource (HR): The human resource (HR) segment contains the full set of capabilities needed to manage, schedule, pay, and hire the people who make a company run. It includes payroll, benefits administration, applicant data administration, personnel development planning, workforce planning schedule and shift planning, time management, and travel expenses accounting. Because the structure of most companies shifts frequently, one function in the human resource category provides the ability to represent organizational, charts, including organizational units, jobs, positions, workplaces, and tasks. Capturing data from the human resources module, the SAP business workflow system allows management to define and manage the flow of work required in cross functional business process.

163
Manufacturing and Logistics: The manufacturing and logistics segment is the largest and most complex of the module categories. It can be divided into five major components:
• Material Management (MM), • Process Maintenance (PM), • Quality Management (QM), • Production Planning and Control (PP) and • Project Management System (PS).
Each component is divided into a number of subcomponents. Plant maintenance supports the activities associated with planning and performing repairs and preventive maintenances. The quality management capability plans and implement procedures for inspection and quality assurance. It is built on the ISO 9001 standard for quality management. Production planning and control supports both discrete and process manufacturing process. The project management system lets the user set up, manage, and evaluate large, complex, projects, whereas the financial costing project system focuses on costs, the manufacturing project system is used for planning and monitoring dates and resources. The system walks the user through the typical project steps: concept, rough cut planning, details planning approval, execution and closing it manages a sequence of activities each with its interrelationships to the others. Sales and Distribution (SD) : The sales and distribution (SD) set of modules provides customer management; sales order management; configuration management; distribution export controls, shipping and transportation management; and billing, invoicing, and rebate processing. In sales and distribution, produces or services are sold to customers. In implementing and SD module (as in other modules), the company structure must be represented in the system so that for example, R/3 known where and when to recognize revenue. When a sales order is entered it automatically includes the correct information on pricing, promotions, and availability and shipping options. Batch order processing is available for specialized industries such as food, pharmaceutical, or chemical. Lean Manufacturing: Lean manufacturing has emerged as an alternative to mass production techniques. It reflects a totally new approach to operation management and greatly contributes to the addressing of issues in a consumer driven market. In 1990, James Womack wrote a book called “The Machine that Changed the World”. This book was a straight forward account of the history of automobile manufacturing combined with the study of Japanese, American and European automobile assembly plants. He called the system that he described “Lean Manufacturing” It is an incredibly successful System that integrates the ‘routine’ work of producing and delivering products, services and information with ‘problem identification and process improvement’. It is an extension of supply chain concept based on a systematic elimination of unproductive activities identified as wastes.

164
The concept involved in minimizing wastes; all manufacturing processes are either value-added or non value- added. The valor stream includes all activities required to bring a product from vendor’s raw material into the hands of customers. Value –added processes mold, transforms or otherwise change raw material into finished products. Non value –added activities are often necessary, consume time and resources but add little or no value to the product. Such activities include transporting, material, storing material, conducting inspection etc. To provide what the customer is asking for, you need to improve production efficiency. In the past, increasing production efficiency required employees to work harder or longer and machines to run faster. Such methods work in the short run but cause problems. Accident rates increase workers and equipment are overworked and overtaxed equipment and workers revolt. The Lean concept refers to a collection of tools used to promote long-term profitability and growth by more with less. The essential element of Lean Manufacturing is aimed at the elimination of waste at every area of production including customer relations, product design, and supplier network and factory management. Its’ goal is to incorporate less human effort , less inventory, less time to develop products and less space , to become highly responsive to customer demand, while producing top quality products in most efficient and economical manner possible. Total Productive Maintenance (TPM) is a Lean concept based on three simple ideas;
• Preventive maintenance schedules must be developed and adhered to, • Extensive maintenance history exists in a database and equipment failures may be
predicted within reasonable time frames • Simpler maintenance tasks be delegated to those who know the equipment the best..
Establishing a preventive maintenance schedule and Predictive Maintenance Systems are basic requirements of Lean Manufacturing. In addition, the operators should be responsible and have ownership for all maintenance of the equipment they operate. As operators know their machines the best they would be the first to detect variations in operations; unusual sounds, vibrations smell etc. The specific tools of Lean Manufacturing such as
• Pull System, • Kanban Cards, • Kaizen
Are artifacts of a general? Comprehensive approach to managing collaborative work systems that allows frequent fine grained problem identification and improvement in overall organizational structure, coordinated mechanisms and task performance.

165
---------------------------------------------------------------------------------------------------------------- 9.10 REVIEW QUESTIONS ----------------------------------------------------------------------------------------------------------------
1. Discuss what is aggregate planning? Explain is process. 2. Is the aggregate planning different for service organization? Explain 3. What is purpose of master scheduling and how it is important for operation planning? 4. What are operating schedules and where are the uses? 5. What is optimized production technology and synchronous manufacturing? 6. Discuss the importance of JIT and indicate its application. 7. Write notes on the basis of a) Supply Chain Management. b) Enterprise Resource
Planning c) Lean Manufacturing

9, Km Milestone, NH-65, Kaithal - 136027, HaryanaWebsite: www.niilmuniversity.in
“The lesson content has been compiled from various sources in public domain including but not limited to the internet for the convenience of the users. The university has no proprietary right on the same.”