productive entrepreneurship, technology and...
TRANSCRIPT

Productive entrepreneurship, technology and innovation
Mark Dutz, Innovation and Growth, PRMED
April 2011

Outline
I. Concepts• WHAT is innovation
• WHY important
• HOW support innovation – incentives, skills, information & finance
II. Productive entrepreneurship • Transformational vs subsistence
• Alternative measures of entrepreneurship
III. Organizational innovation• Decentralization
• Management practices
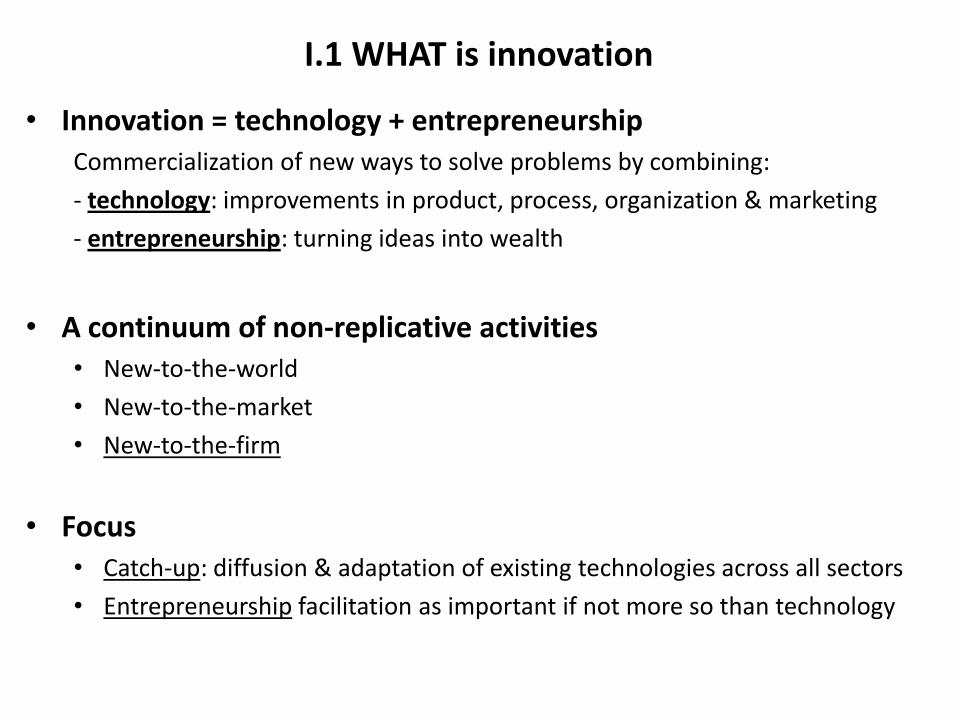
I.1 WHAT is innovation
• Innovation = technology + entrepreneurshipCommercialization of new ways to solve problems by combining:
- technology: improvements in product, process, organization & marketing
- entrepreneurship: turning ideas into wealth
• A continuum of non-replicative activities• New-to-the-world
• New-to-the-market
• New-to-the-firm
• Focus• Catch-up: diffusion & adaptation of existing technologies across all sectors
• Entrepreneurship facilitation as important if not more so than technology

I.1 WHAT is innovation
Private Requiring subsidies/PPPs
Radical
Integrated circuit
Personal computer
Tata’s $2,000 Nano car
Internet
Psoriasis treatment:
$100 vs $15,000 per patient
IncrementalIntel transistors upgrading:
# purchased for $1 – 5 bn % rise 1968-2003
Boeing 747 into 777
Bharti Airtel business model:ARPU to gross profits, outsource functions
Aravind Eyecare Hospital: cataract surgery for $30 rather than $3,000 per patient
Aakash Ganga(“river from sky”) rainwater harvesting system(Lemelson-MIT prize winner)
Green Revolution

I.2 WHY important: to promote growth
• “Differences in measured inputs explain less than half of the enormous cross-country differences in per capita GDP”– Countries are poor because use their inputs less efficiently
0
2000
4000
6000
8000
10000
12000
14000
1960 1965 1970 1975 1980 1985 1990 1995 2000 2005
Real
GD
P p
er
cap
ita (
2000 U
S$)
South Korea
IDA
Difference in output due to
growth in labor and capital
Difference in
output due to
TFP growth

I.2 within-firm innovation often the most important driver of productivity growth
+ India: “productivity growth among formal manufacturing plantsstarting in mid 1990s driven by within-firm productivity growthof larger plants rather than reallocation across plants”(Bollard, Klenow, Sharma 2011)

I.3 HOW: Levers for innovation policies
• Incentives for productive entrepreneurship• Level-playing-field investment climate (rule of law, rewards, competition)
• Protection of IPRs
• Skills• “Absorptive capacity” within firms
• Responsiveness of training to market demands
• Problem solving skills
• Information• Access (ICT; trade, FDI, IP, diaspora; rural-urban relocation)
• Knowledge intermediaries (MNCs/buyers, alliances, TTOs, bus. services)
• Finance• Mix of instruments and institutions to select & support talent

Innovation inputs
Incentives Skills Information Finance
Rule of Law
Closing a
Business
Tertiary
Students
Internet
Users Trade
Use of
banks to
finance
investment
Country
Rating
(0 - 5)
Recovery
rate (cents on
the dollar)
% Gross
Enrollment
Rate
Per 100
Citizens
X+M
(% GDP) % of firms
India 2.6 13 13.5 4.5 51 47
China 2.2 35 22.1 22.5 65 29
Turkey 2.6 20 37.1 34.4 52 52
Brazil 2.2 17 30.0 37.5 29 28
Malaysia 3.0 39 29.7 55.8 110 49
South Korea 3.3 82 96.1 75.8 107 40
Source: WDI, Rule of Law from WB World Governance Indicators; latest year available (2004-2008).

Incentives Skills
0.00 2.00 4.00 6.00 8.00 10.00 12.00
Brazil
China
India
Philippines
Turkey
South Korea
Informal payments as % of sales
0% 20% 40% 60% 80% 100%
India
South Korea
Turkey
Malaysia
Brazil
China
% of firms training workers
Source: World Bank/IFC Enterprise Surveys, 1999-2008

Information Finance
0.00 20.00 40.00 60.00 80.00 100.00
Turkey
South Korea
Brazil
India
Malaysia
China
% firms using foreign technology average % investments financed externally
0% 5% 10% 15% 20% 25%
India
Brazil
Philippines
Turkey
China
Source: World Bank/IFC Enterprise Surveys, 1999-2008

Innovation outputs: IPRs
Country
Patents
Granted by
USPTO +
Patent
Filings
National
Office++
of which
by
Residents
Trademark
Filings Natl
Office++
Industrial
Design
Filings++
Utility
Model
Filings++
South Korea 5,433 172,469 127,114 141,289 54,362 21,084
China 758 245,161 153,060 661,358 267,432 181,324
India 444 28,940 5,314 103,419 5,521 0
Brazil 141 24,074 3,810 105,320 5,929 2,984
Malaysia 112 2,372 670 25,894 1,920 0
Turkey 22 2,021 1,810 72,444 6,868 3,011
+ Source: World Bank KAM Database, 2009. Value is average over 2003-2007.
++ Source: WIPO World Intellectual Property Indicators, 2009 (latest year)

South Asia: impact of policy levers on innovation
0 10 20 30 40 50 60
Physical Infrastructure
Knowledge Spillovers
Finance
Skills & Labor Regulations
Incentives
***IMPACT ON INNOVATION***
Percent Impact
Source: Dutz, O’Connell and Tan (2011), based on Enterprise Surveys across 8 SAR countries

South Asia: marginal effect of innovation & training on TFP, employment growth and wages
Effect of innovation larger when jointly estimated• pay 26% higher wage levels; experience 5% higher employment growth
Innovation even more important for firms that train workers• have twice as high productivity; 8% higher employment growth; pay double wages
105%
26%
102%
5%
8%
0%
1%
2%
3%
4%
5%
6%
7%
8%
9%
0%
20%
40%
60%
80%
100%
120%
Innovation effect, endogenous choice
treatment regression
Effect of innovation + training, jointly determined
Pe
rce
nt
Effe
ct o
n e
mp
loym
en
t gr
ow
th
Pe
rce
nt
Imp
rove
me
nt
in T
FP &
Wag
e
Effect on TFP Effect on Wage Effect on Emp Growth
Source: Dutz, O’Connell and Tan (2011), based on Enterprise Surveys across 8 SAR countries

II. Two types of entrepreneurs
Subsistence Transformational

Share of high-growth enterprises & gazelles (employment)
0% 5% 10% 15% 20%
Southkorea
China
Malaysia
India
Brazil
Turkey
% High Growth
% Gazelles
Source: World Bank Investment Climate Surveys, 1999-2008
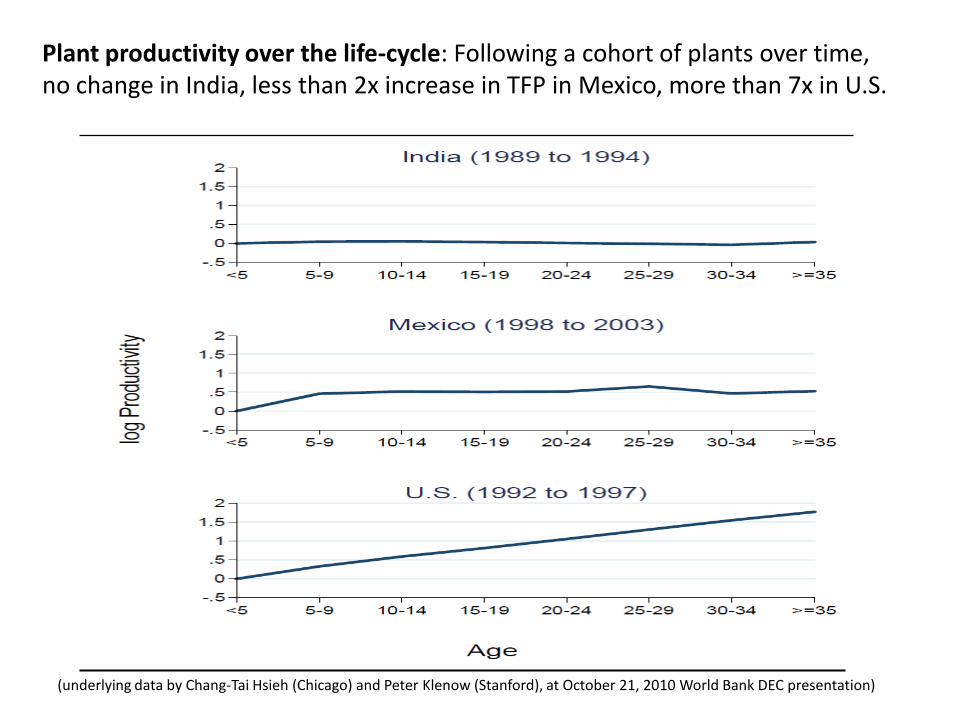
Plant productivity over the life-cycle: Following a cohort of plants over time, no change in India, less than 2x increase in TFP in Mexico, more than 7x in U.S.
(underlying data by Chang-Tai Hsieh (Chicago) and Peter Klenow (Stanford), at October 21, 2010 World Bank DEC presentation)

Young transformational entrepreneurs grow faster in US than Europe
(underlying data by Nicolas Veron, Bruegel)
40 30 20 10 0 10 20 30 40
1976-2000
1951-1975
1926-1950
1901-1925
1876-1900
1851-1875
1826-1850
1801-1825
1776-1800
Before 1775
Number of Firms
Ye
ar o
f Es
tab
lish
me
nt
Age Pyramid of European and U.S. Firms in FT Global 500
Europe U.S.
Based on FT Global 500 ranking of the world largest listed companies, September 30, 2007, published on www.ft.com
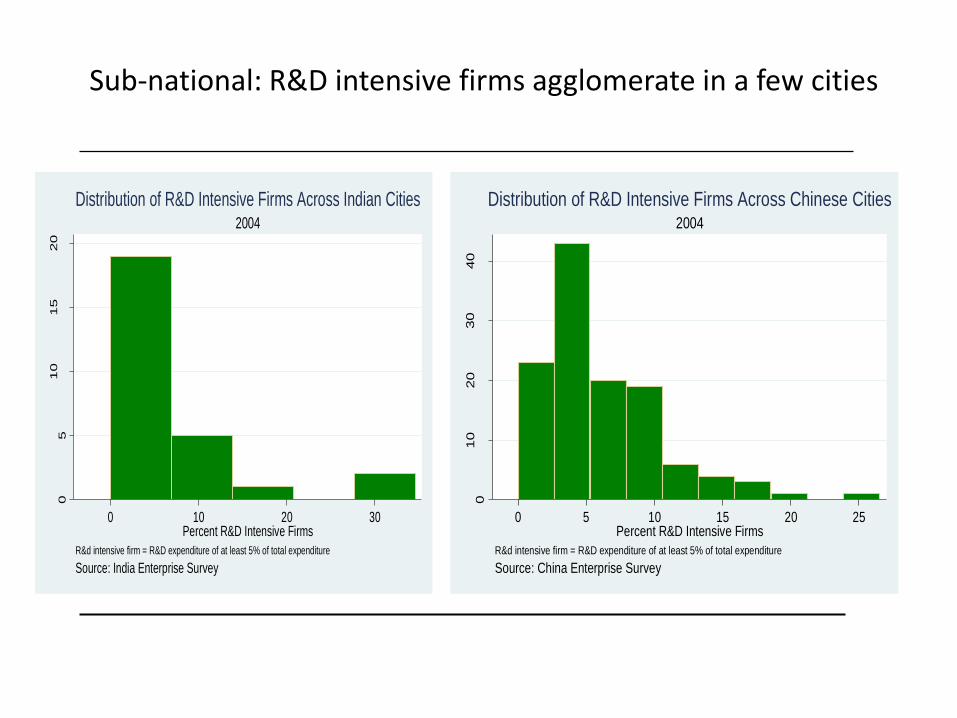
Sub-national: R&D intensive firms agglomerate in a few cities0
510
15
20
Nu
mbe
r o
f C
itie
s
0 10 20 30Percent R&D Intensive Firms
R&d intensive firm = R&D expenditure of at least 5% of total expenditure
Source: India Enterprise Survey
2004
Distribution of R&D Intensive Firms Across Indian Cities
010
20
30
40
Nu
mbe
r o
f C
itie
s
0 5 10 15 20 25Percent R&D Intensive Firms
R&d intensive firm = R&D expenditure of at least 5% of total expenditure
Source: China Enterprise Survey
2004
Distribution of R&D Intensive Firms Across Chinese Cities
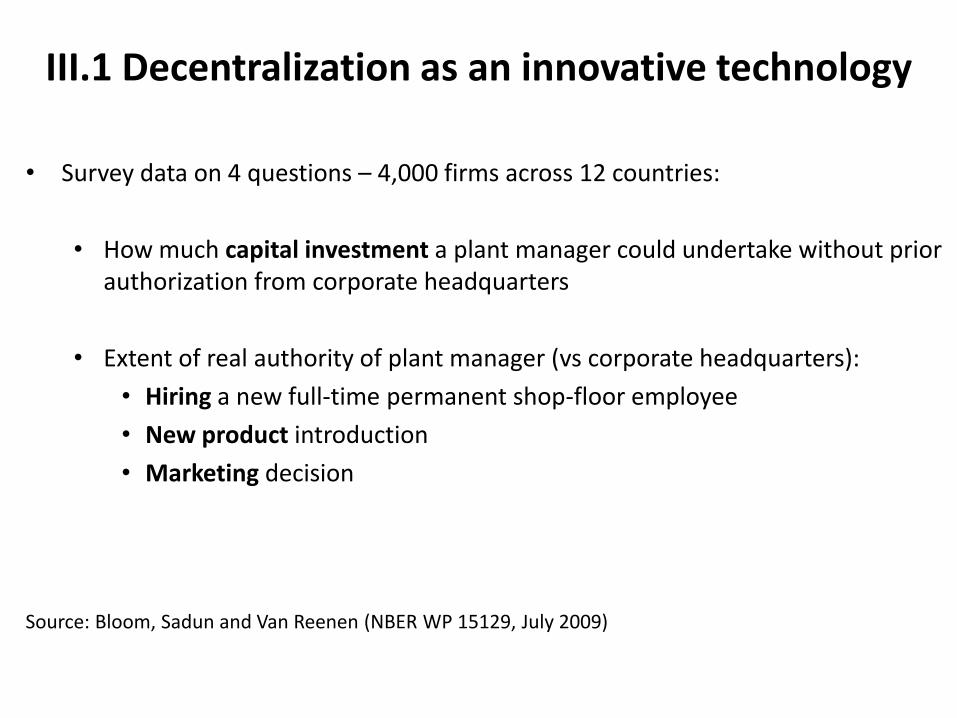
III.1 Decentralization as an innovative technology
• Survey data on 4 questions – 4,000 firms across 12 countries:
• How much capital investment a plant manager could undertake without prior authorization from corporate headquarters
• Extent of real authority of plant manager (vs corporate headquarters):
• Hiring a new full-time permanent shop-floor employee
• New product introduction
• Marketing decision
Source: Bloom, Sadun and Van Reenen (NBER WP 15129, July 2009)

-1 -.5 0 .5mean of zorg
Sweden
US
UK
Germany
Italy
Portugal
France
Poland
China
India
Japan
Greece
-1 -.5 0 .5mean of zorg
Sweden
US
UK
Germany
Italy
Portugal
France
Poland
China
India
Japan
Greece
Decentralization varies across countries
Most centralized
• Asia
• Southern Europe
Least centralized
• Anglo-Saxon countries
• Northern European countries
Decentralization measure

Decentralization can improve TFP
• Rule of law & trust facilitate delegation by improving cooperation
• Competition & non-hierarchical religions (not Catholicism, Eastern Orthodox & Islam) also associated with more decentralization
• account for 4/5 of variation in decentralization
• Allows more efficient firms to grow in scale
• Fosters higher returns from IT
• While info technologies (ERP for plant manager, CAD/CAM for plant workers) increase decentralization, communication technologies (data networks) increase centralization:
increase in ERP usage by 60% (avg diff in ICT b/w US & Europe) equiv to a large increase in S of human capital (=1990-2000 rise in US college grads)

III.2 Management as an innovative technology
• Survey data in medium & large manufacturing firms on 18 practices:
• Monitoring: collection & processing of production information
• Target setting: coherent & binding e.g. operations, inventory, quality control
• People incentives: merit-based pay, promotion, hiring & firing
Source: Bloom and Van Reenen, QJE 2007

2.6 2.8 3 3.2 3.4mean of management
US
Germany
Sweden
Japan
Canada
France
Italy
Great Britain
Australia
Northern Ireland
Poland
Republic of Ireland
Portugal
Brazil
India
China
Greece
23
Overall management is worse in developing countries
Average country management score, manufacturing firms 100 to 5000 employees(monitoring, targets and incentives management scored on a 1 to 5 scale
using the methodology developed in Bloom & Van Reenen (QJE 2007))
69533627012234431218876238292231102140
524171
620559
# firms

24
Firm-Level Management Scores
0.2
.4.6
.8
Dens
ity
1 2 3 4 5management
0.2
.4.6
.8
Dens
ity
1 2 3 4 5management
US manufacturing, mean=3.33 (N=695)
Indian manufacturing, mean=2.69 (N=620)
India’s low score is due to a tail of badly managed firmsD
ensi
tyD
ensi
ty
Firm-level histograms underlying the country averages from the previous figure

Family-owned & managed, founder and government firms have the largest tail of badly-managed firms

Impact of management innovation:Evidence from large Indian textile firms
Randomized experiment:
• treatment plants: 5 mths extensive consulting
• control plants: 1 mth light diagnostic consulting
Causal impact of adopting better management technologies:
• Raised average productivity by 11% in first year– annual profitability increases of $230,000 per firm
(at consulting cost of $250,000, profitable in 16 months given cost of capital of 15%)
• Increased decentralization of decision-making
– better flow of information enabled owners to monitor and delegate more decisions to middle managers
• Increased use of computers
– necessitated by data collection & analysis
Source: Bloom, Eifert, Mahajan, McKenzie and Roberts (mimeo 2010)

Poor quality meant 19% of manpower went on repairs
Workers spread cloth over lighted plates to spot defectsLarge room full of repair workers (the day shift)
Defects lead to about 5% of cloth being scrappedDefects are repaired by hand or cut out from cloth

28
Mending recorded only to cross-check against customers’ rebates claims
Defects log with defects not recorded in an standardized format. These defects were recorded solely as a record in case of customer complaints. The data was not aggregated or analyzed

05
01
00
15
0
-20 -10 0 10 20 30 40timing
Quality defects index for treatment and control plants
2.5th percentile
Control plants
Treatment plants
Weeks after the start of the intervention
Qu
alit
y d
efec
ts in
dex
(h
igh
er s
core
=lo
we
r q
ual
ity)
Start of Diagnostic
Start of Implementation
Average (+ symbol)
97.5th percentile
Average (♦ symbol)
2.5th percentile
97.5th percentile
End of Implementation
Notes: Average quality defects index, which is a weighted index of quality defects, so a higher score means lower quality. Plotted for the 14treatment plants (+ symbols) and the 6 control plants (♦ symbols). Values normalized so both series have an average of 100 prior to the startof the intervention. Confidence intervals from plant block bootstrapped.

Why are so many firms badly managed?
• Limited competition
– 50% tariff on fabric imports insulates textile firms from foreign pressure
– bankruptcy not a threat given low weaver wage of $5/day
• Constrained managerial span of control linked to poor rule of law
– unwillingness to delegate & limited promotion opportunities for middle managers in family-owned firms prevents expansion of good firms, allowing bad firms to survive
– motivated by fear that managers would steal with greater autonomy, given inability to punish without effective legal system, so every decision requires owner sign-off
• Labor regulations constrain hiring/firing & re-assignment
• Insufficient training about management practices
• Worker skills: adaptation easier when workforce more knowledgeable
• Lack of information: too little benchmarking against MNCs
• Finance: hard to borrow for management training (intangible investment difficult to collateralize); lack of financing stifles new entry