productivity growth - 4ltr press online -...
TRANSCRIPT

6Productivity
Growth
Learning OutcomesLO1 Explain the theories of productivity and growth
LO2 Describe productivity and growth in practice
LO3 Discuss other issues of technology and growth
and
C H A P T E R
Why is the standard of living so much higher in some countries than in others? Howdoes an economy increase its living standard? Why is the long-term growth ratemore important than short-term fluctuations in economic activity? What is laborproductivity, why did it slow downfor a while, and why did it pick upagain? What’s been the impact ofcomputers and the Internet onlabor productivity? Answers tothese and other questions areaddressed in this chapter, whichfocuses on arguably the mostimportant criteria for judging aneconomy’s performance—produc-tivity and growth.
The single most important determinant of a nation’s standard of living in thelong run is the productivity of its resources. Even seemingly low growth in produc-tivity, if sustained for years, can have a substantial effect on the average living stan-dard—that is, on the average availability of goods and services per capita. Growingproductivity is therefore critical to a rising standard of living and has kept the U.S.economy a world leader.
Economic growth is a complicated process, one that even experts do not yet fullyunderstand. Since before Adam Smith inquired into the Wealth of Nations, economistshave puzzled over what makessome economies prosper whileothers founder. Because a marketeconomy is not the product ofconscious design, it does notreveal its secrets readily, nor canit be easily manipulated in pur-suit of growth. We can’t simplypush here and pull there toachieve the desired result.Changing the economy is not likeremodeling a home by knocking out a wall to expand the kitchen. Because we haveno clear blueprint of the economy, we cannot make changes to specifications.
Still, there is much economists do know. In this chapter, we first develop a fewsimple models to examine productivity and growth. Then, we use these models tohelp explain why some nations are rich and some poor. U.S. performance gets spe-cial attention, particularly compared with other major economies around the world.We close with some controversies of technology and growth.
The standard of living of the poor countries will eventually catch upwith the standard of living of the rich countries.Strongly Disagree Strongly Agree1 2 3 4 5 6 7
What do youthink?
zzzzzzzzzz
z z z z z z z z z z z z z z z z z z z z z z z z z z z z z z z z z z z z z z z z z z z z z z z
“Why is the long-term growth ratemore important than short-term
fluctuations in economic activity?”©
BU
BB
LES
PH
OTO
LIB
RA
RY
/ALA
MY
Topics discussed in Chapter 6 include:
Labor productivity Technological changeand unemployment
The production functionResearch and development
U.S. productivity and growthConvergence
z z z z z z z z z z z z z z z z z z z z z z z z z z z z z z z z z z z z z z z
CHAPTER 6 Productivity and Growth 8 3
8 4 PART 2 Fundamentals of Macroeconomics
tity of resources in the economy and the level oftechnology are assumed to be fixed. Also assumedfixed during the period are the rules of the game thatfacilitate production and exchange. We classify allproduction into two broad categories—in this case,consumer goods and capital goods. Capital goods areused to produce other goods. For example, the econ-omy can bake pizzas and make pizza ovens. Pizzasare consumer goods and ovens are capital goods.
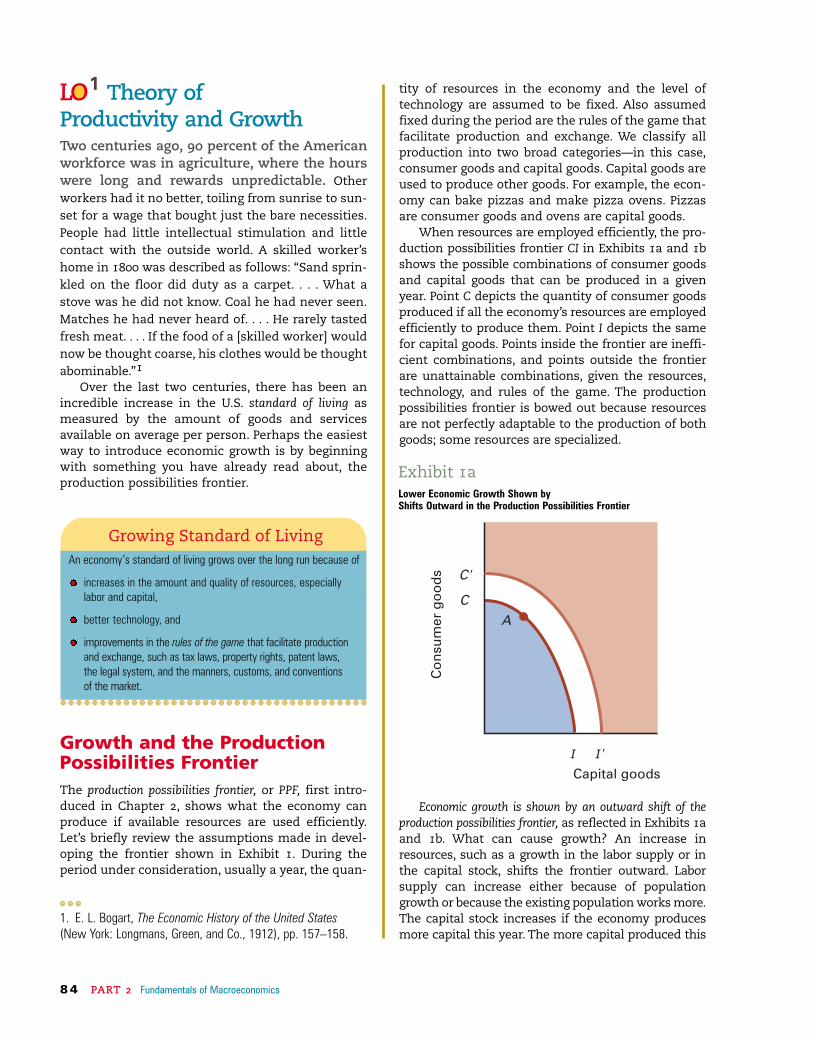
When resources are employed efficiently, the pro-duction possibilities frontier CI in Exhibits 1a and 1bshows the possible combinations of consumer goodsand capital goods that can be produced in a givenyear. Point C depicts the quantity of consumer goodsproduced if all the economy’s resources are employedefficiently to produce them. Point I depicts the samefor capital goods. Points inside the frontier are ineffi-cient combinations, and points outside the frontierare unattainable combinations, given the resources,technology, and rules of the game. The productionpossibilities frontier is bowed out because resourcesare not perfectly adaptable to the production of bothgoods; some resources are specialized.
Economic growth is shown by an outward shift of theproduction possibilities frontier, as reflected in Exhibits 1aand 1b. What can cause growth? An increase inresources, such as a growth in the labor supply or inthe capital stock, shifts the frontier outward. Laborsupply can increase either because of populationgrowth or because the existing population works more.The capital stock increases if the economy producesmore capital this year. The more capital produced this
Theory of Productivity and GrowthTwo centuries ago, 90 percent of the Americanworkforce was in agriculture, where the hourswere long and rewards unpredictable. Otherworkers had it no better, toiling from sunrise to sun-set for a wage that bought just the bare necessities.People had little intellectual stimulation and littlecontact with the outside world. A skilled worker’shome in 1800 was described as follows: “Sand sprin-kled on the floor did duty as a carpet. . . . What astove was he did not know. Coal he had never seen.Matches he had never heard of. . . . He rarely tastedfresh meat. . . . If the food of a [skilled worker] wouldnow be thought coarse, his clothes would be thoughtabominable.”1
Over the last two centuries, there has been anincredible increase in the U.S. standard of living asmeasured by the amount of goods and servicesavailable on average per person. Perhaps the easiestway to introduce economic growth is by beginningwith something you have already read about, theproduction possibilities frontier.
Growth and the ProductionPossibilities FrontierThe production possibilities frontier, or PPF, first intro-duced in Chapter 2, shows what the economy canproduce if available resources are used efficiently.Let’s briefly review the assumptions made in devel-oping the frontier shown in Exhibit 1. During theperiod under consideration, usually a year, the quan-
Growing Standard of LivingAn economy’s standard of living grows over the long run because of
increases in the amount and quality of resources, especially labor and capital,
better technology, and
improvements in the rules of the game that facilitate production and exchange, such as tax laws, property rights, patent laws, the legal system, and the manners, customs, and conventions of the market.
z z z z z z z z z z z z z z z z z z z z z z z z z z z z z z z z z z z z z z z
LO 1
z z z
1. E. L. Bogart, The Economic History of the United States(New York: Longmans, Green, and Co., 1912), pp. 157–158.
Co
nsu
mer
go
od
s C 9
Capital goods
(
I
CA
I 9
Exhibit 1aLower Economic Growth Shown by Shifts Outward in the Production Possibilities Frontier
CHAPTER 6 Productivity and Growth 8 5
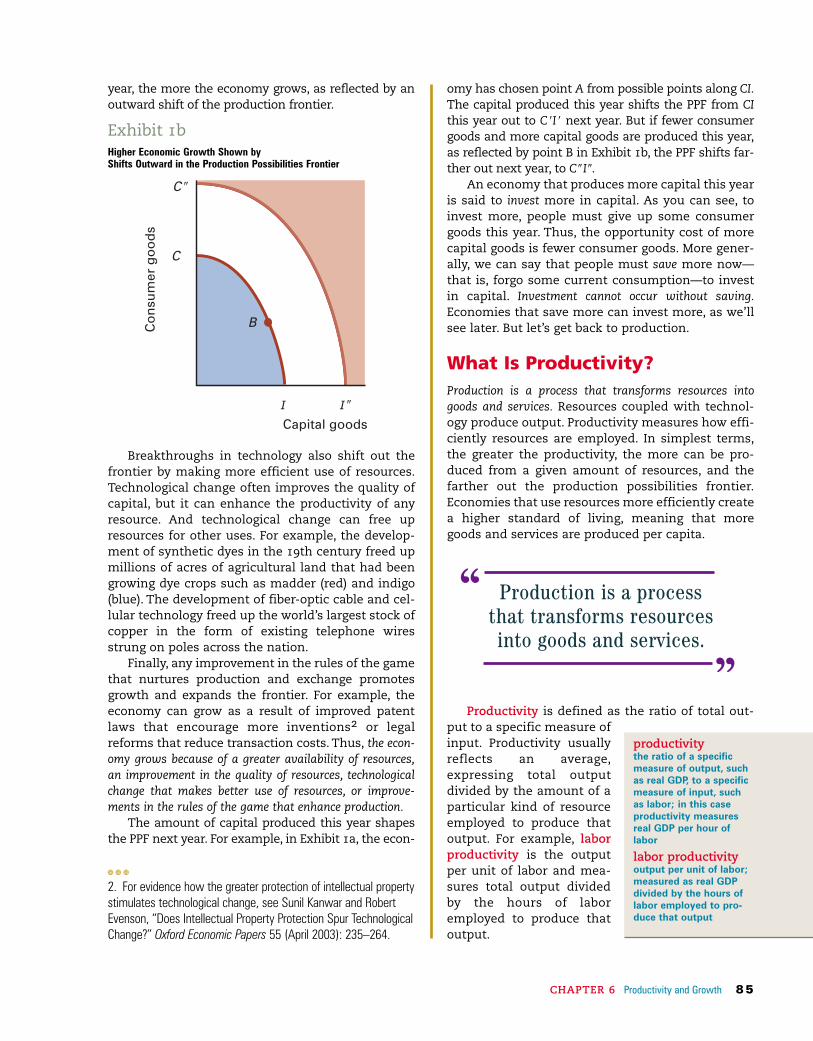
omy has chosen point A from possible points along CI.The capital produced this year shifts the PPF from CIthis year out to C9I9 next year. But if fewer consumergoods and more capital goods are produced this year,as reflected by point B in Exhibit 1b, the PPF shifts far-ther out next year, to C0I0.
An economy that produces more capital this yearis said to invest more in capital. As you can see, toinvest more, people must give up some consumergoods this year. Thus, the opportunity cost of morecapital goods is fewer consumer goods. More gener-ally, we can say that people must save more now—that is, forgo some current consumption—to investin capital. Investment cannot occur without saving.Economies that save more can invest more, as we’llsee later. But let’s get back to production.
What Is Productivity?Production is a process that transforms resources intogoods and services. Resources coupled with technol-ogy produce output. Productivity measures how effi-ciently resources are employed. In simplest terms,the greater the productivity, the more can be pro-duced from a given amount of resources, and thefarther out the production possibilities frontier.Economies that use resources more efficiently createa higher standard of living, meaning that moregoods and services are produced per capita.
Productivity is defined as the ratio of total out-put to a specific measure ofinput. Productivity usuallyreflects an average,expressing total outputdivided by the amount of aparticular kind of resourceemployed to produce thatoutput. For example, laborproductivity is the outputper unit of labor and mea-sures total output dividedby the hours of laboremployed to produce thatoutput.
year, the more the economy grows, as reflected by anoutward shift of the production frontier.
Breakthroughs in technology also shift out thefrontier by making more efficient use of resources.Technological change often improves the quality ofcapital, but it can enhance the productivity of anyresource. And technological change can free upresources for other uses. For example, the develop-ment of synthetic dyes in the 19th century freed upmillions of acres of agricultural land that had beengrowing dye crops such as madder (red) and indigo(blue). The development of fiber-optic cable and cel-lular technology freed up the world’s largest stock ofcopper in the form of existing telephone wiresstrung on poles across the nation.
Finally, any improvement in the rules of the gamethat nurtures production and exchange promotesgrowth and expands the frontier. For example, theeconomy can grow as a result of improved patentlaws that encourage more inventions2 or legalreforms that reduce transaction costs. Thus, the econ-omy grows because of a greater availability of resources,an improvement in the quality of resources, technologicalchange that makes better use of resources, or improve-ments in the rules of the game that enhance production.
The amount of capital produced this year shapesthe PPF next year. For example, in Exhibit 1a, the econ-
C 0
Co
nsu
mer
go
od
s
Capital goodsI
B
C
I 0
z z z
2. For evidence how the greater protection of intellectual propertystimulates technological change, see Sunil Kanwar and RobertEvenson, “Does Intellectual Property Protection Spur TechnologicalChange?” Oxford Economic Papers 55 (April 2003): 235–264.
productivity the ratio of a specificmeasure of output, suchas real GDP, to a specificmeasure of input, suchas labor; in this caseproductivity measuresreal GDP per hour oflabor
labor productivity output per unit of labor;measured as real GDPdivided by the hours oflabor employed to pro-duce that output
“
”
Production is a processthat transforms resourcesinto goods and services.
Exhibit 1bHigher Economic Growth Shown by Shifts Outward in the Production Possibilities Frontier
8 6 PART 2 Fundamentals of Macroeconomics
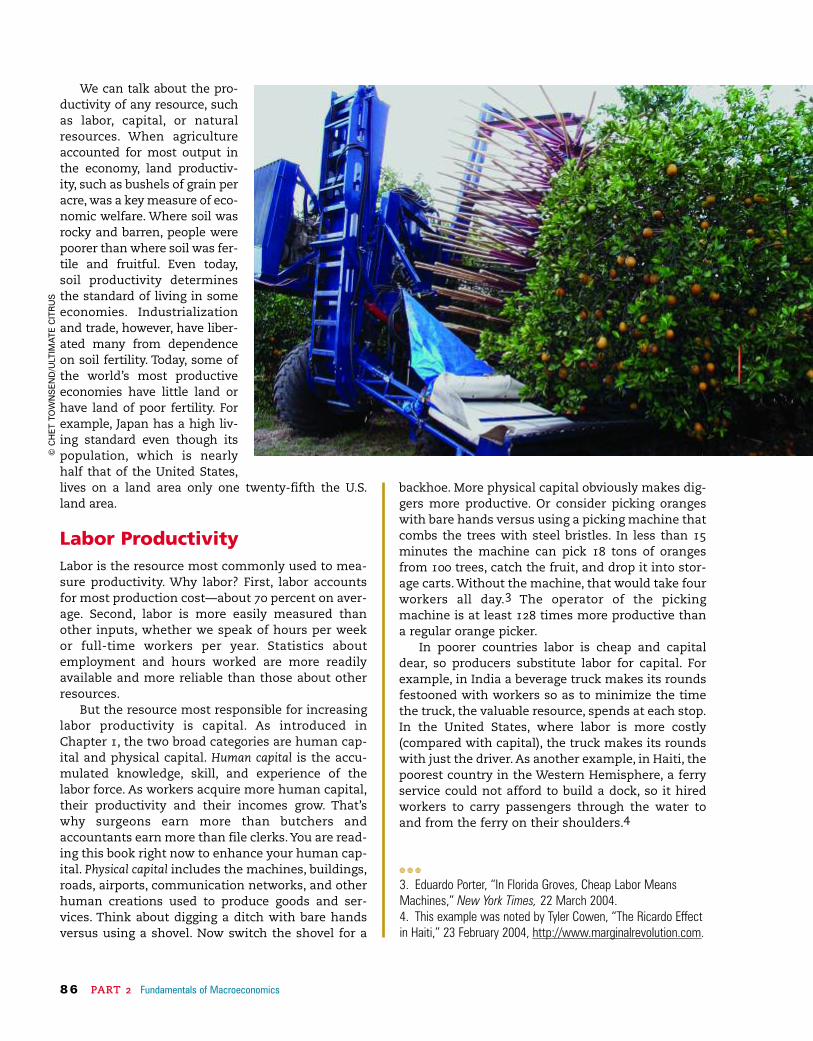
backhoe. More physical capital obviously makes dig-gers more productive. Or consider picking orangeswith bare hands versus using a picking machine thatcombs the trees with steel bristles. In less than 15minutes the machine can pick 18 tons of orangesfrom 100 trees, catch the fruit, and drop it into stor-age carts. Without the machine, that would take fourworkers all day.3 The operator of the pickingmachine is at least 128 times more productive thana regular orange picker.
In poorer countries labor is cheap and capitaldear, so producers substitute labor for capital. Forexample, in India a beverage truck makes its roundsfestooned with workers so as to minimize the timethe truck, the valuable resource, spends at each stop.In the United States, where labor is more costly(compared with capital), the truck makes its roundswith just the driver. As another example, in Haiti, thepoorest country in the Western Hemisphere, a ferryservice could not afford to build a dock, so it hiredworkers to carry passengers through the water toand from the ferry on their shoulders.4
We can talk about the pro-ductivity of any resource, suchas labor, capital, or naturalresources. When agricultureaccounted for most output inthe economy, land productiv-ity, such as bushels of grain peracre, was a key measure of eco-nomic welfare. Where soil wasrocky and barren, people werepoorer than where soil was fer-tile and fruitful. Even today,soil productivity determinesthe standard of living in someeconomies. Industrializationand trade, however, have liber-ated many from dependenceon soil fertility. Today, some ofthe world’s most productiveeconomies have little land orhave land of poor fertility. Forexample, Japan has a high liv-ing standard even though itspopulation, which is nearlyhalf that of the United States,lives on a land area only one twenty-fifth the U.S.land area.
Labor ProductivityLabor is the resource most commonly used to mea-sure productivity. Why labor? First, labor accountsfor most production cost—about 70 percent on aver-age. Second, labor is more easily measured thanother inputs, whether we speak of hours per weekor full-time workers per year. Statistics aboutemployment and hours worked are more readilyavailable and more reliable than those about otherresources.
But the resource most responsible for increasinglabor productivity is capital. As introduced inChapter 1, the two broad categories are human cap-ital and physical capital. Human capital is the accu-mulated knowledge, skill, and experience of thelabor force. As workers acquire more human capital,their productivity and their incomes grow. That’swhy surgeons earn more than butchers andaccountants earn more than file clerks.You are read-ing this book right now to enhance your human cap-ital. Physical capital includes the machines, buildings,roads, airports, communication networks, and otherhuman creations used to produce goods and ser-vices. Think about digging a ditch with bare handsversus using a shovel. Now switch the shovel for a
z z z
3. Eduardo Porter, “In Florida Groves, Cheap Labor MeansMachines,” New York Times, 22 March 2004.4. This example was noted by Tyler Cowen, “The Ricardo Effectin Haiti,” 23 February 2004, http://www.marginalrevolution.com.
©C
HE
TTO
WN
SE
ND
/ULT
IMA
TE
CIT
RU
S
CHAPTER 6 Productivity and Growth 8 7
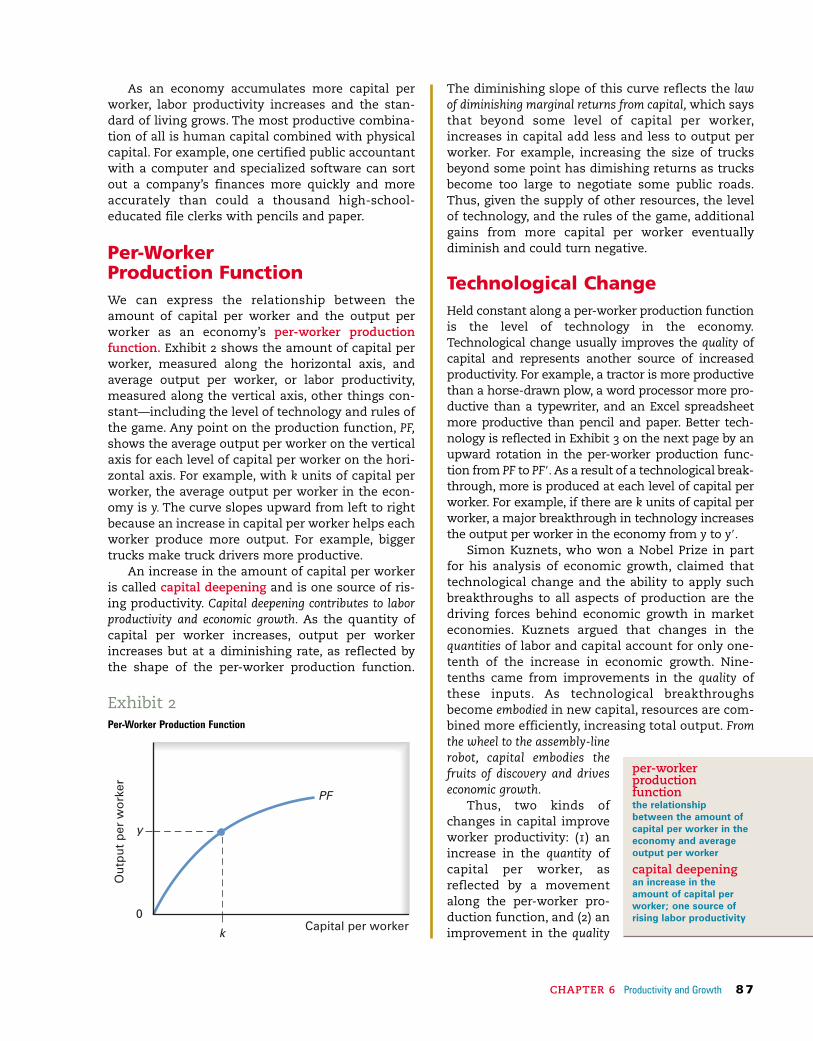
The diminishing slope of this curve reflects the lawof diminishing marginal returns from capital, which saysthat beyond some level of capital per worker,increases in capital add less and less to output perworker. For example, increasing the size of trucksbeyond some point has dimishing returns as trucksbecome too large to negotiate some public roads.Thus, given the supply of other resources, the levelof technology, and the rules of the game, additionalgains from more capital per worker eventuallydiminish and could turn negative.
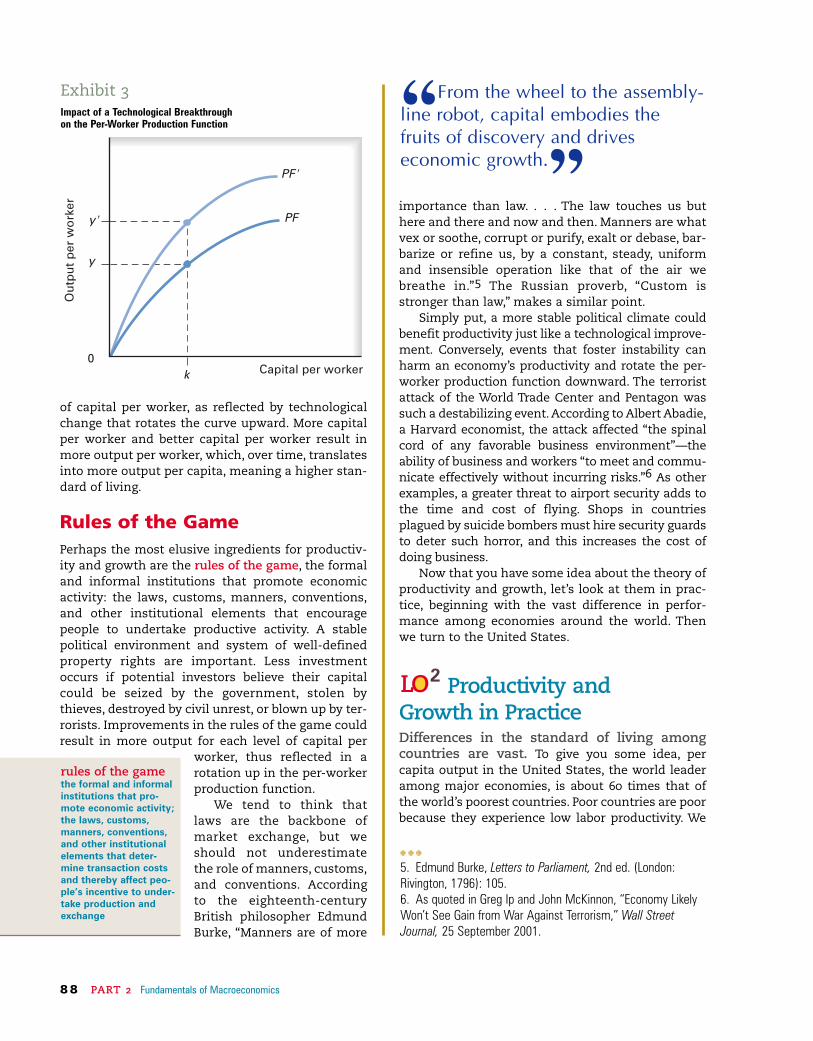
Technological ChangeHeld constant along a per-worker production functionis the level of technology in the economy.Technological change usually improves the quality ofcapital and represents another source of increasedproductivity. For example, a tractor is more productivethan a horse-drawn plow, a word processor more pro-ductive than a typewriter, and an Excel spreadsheetmore productive than pencil and paper. Better tech-nology is reflected in Exhibit 3 on the next page by anupward rotation in the per-worker production func-tion from PF to PF9. As a result of a technological break-through, more is produced at each level of capital perworker. For example, if there are k units of capital perworker, a major breakthrough in technology increasesthe output per worker in the economy from y to y9.
Simon Kuznets, who won a Nobel Prize in partfor his analysis of economic growth, claimed thattechnological change and the ability to apply suchbreakthroughs to all aspects of production are thedriving forces behind economic growth in marketeconomies. Kuznets argued that changes in thequantities of labor and capital account for only one-tenth of the increase in economic growth. Nine-tenths came from improvements in the quality ofthese inputs. As technological breakthroughsbecome embodied in new capital, resources are com-bined more efficiently, increasing total output. Fromthe wheel to the assembly-linerobot, capital embodies thefruits of discovery and driveseconomic growth.
Thus, two kinds ofchanges in capital improveworker productivity: (1) anincrease in the quantity ofcapital per worker, asreflected by a movementalong the per-worker pro-duction function, and (2) animprovement in the quality
As an economy accumulates more capital perworker, labor productivity increases and the stan-dard of living grows. The most productive combina-tion of all is human capital combined with physicalcapital. For example, one certified public accountantwith a computer and specialized software can sortout a company’s finances more quickly and moreaccurately than could a thousand high-school-educated file clerks with pencils and paper.
Per-Worker Production FunctionWe can express the relationship between theamount of capital per worker and the output perworker as an economy’s per-worker productionfunction. Exhibit 2 shows the amount of capital perworker, measured along the horizontal axis, andaverage output per worker, or labor productivity,measured along the vertical axis, other things con-stant—including the level of technology and rules ofthe game. Any point on the production function, PF,shows the average output per worker on the verticalaxis for each level of capital per worker on the hori-zontal axis. For example, with k units of capital perworker, the average output per worker in the econ-omy is y. The curve slopes upward from left to rightbecause an increase in capital per worker helps eachworker produce more output. For example, biggertrucks make truck drivers more productive.
An increase in the amount of capital per workeris called capital deepening and is one source of ris-ing productivity. Capital deepening contributes to laborproductivity and economic growth. As the quantity ofcapital per worker increases, output per workerincreases but at a diminishing rate, as reflected bythe shape of the per-worker production function.
Ou
tpu
tp
erw
ork
er
y
k
PF
0Capital per worker
Exhibit 2Per-Worker Production Function
per-workerproductionfunction the relationshipbetween the amount ofcapital per worker in theeconomy and averageoutput per worker
capital deepening an increase in theamount of capital perworker; one source ofrising labor productivity
8 8 PART 2 Fundamentals of Macroeconomics
importance than law. . . . The law touches us buthere and there and now and then. Manners are whatvex or soothe, corrupt or purify, exalt or debase, bar-barize or refine us, by a constant, steady, uniformand insensible operation like that of the air webreathe in.”5 The Russian proverb, “Custom isstronger than law,” makes a similar point.
Simply put, a more stable political climate couldbenefit productivity just like a technological improve-ment. Conversely, events that foster instability canharm an economy’s productivity and rotate the per-worker production function downward. The terroristattack of the World Trade Center and Pentagon wassuch a destabilizing event. According to Albert Abadie,a Harvard economist, the attack affected “the spinalcord of any favorable business environment”—theability of business and workers “to meet and commu-nicate effectively without incurring risks.”6 As otherexamples, a greater threat to airport security adds tothe time and cost of flying. Shops in countriesplagued by suicide bombers must hire security guardsto deter such horror, and this increases the cost ofdoing business.
Now that you have some idea about the theory ofproductivity and growth, let’s look at them in prac-tice, beginning with the vast difference in perfor-mance among economies around the world. Thenwe turn to the United States.
Productivity and Growth in PracticeDifferences in the standard of living amongcountries are vast. To give you some idea, percapita output in the United States, the world leaderamong major economies, is about 60 times that ofthe world’s poorest countries. Poor countries are poorbecause they experience low labor productivity. We
of capital per worker, as reflected by technologicalchange that rotates the curve upward. More capitalper worker and better capital per worker result inmore output per worker, which, over time, translatesinto more output per capita, meaning a higher stan-dard of living.
Rules of the Game Perhaps the most elusive ingredients for productiv-ity and growth are the rules of the game, the formaland informal institutions that promote economicactivity: the laws, customs, manners, conventions,and other institutional elements that encouragepeople to undertake productive activity. A stablepolitical environment and system of well-definedproperty rights are important. Less investmentoccurs if potential investors believe their capitalcould be seized by the government, stolen bythieves, destroyed by civil unrest, or blown up by ter-rorists. Improvements in the rules of the game couldresult in more output for each level of capital per
worker, thus reflected in arotation up in the per-workerproduction function.
We tend to think thatlaws are the backbone ofmarket exchange, but weshould not underestimatethe role of manners, customs,and conventions. Accordingto the eighteenth-centuryBritish philosopher EdmundBurke, “Manners are of more
Ou
tpu
tp
erw
ork
er
y 9
y
0k Capital per worker
PF 9
PF
Exhibit 3Impact of a Technological Breakthrough on the Per-Worker Production Function
rules of the game the formal and informalinstitutions that pro-mote economic activity;the laws, customs,manners, conventions,and other institutionalelements that deter-mine transaction costsand thereby affect peo-ple’s incentive to under-take production andexchange
z z z
5. Edmund Burke, Letters to Parliament, 2nd ed. (London:Rivington, 1796): 105.6. As quoted in Greg Ip and John McKinnon, “Economy LikelyWon’t See Gain from War Against Terrorism,” Wall StreetJournal, 25 September 2001.
“From the wheel to the assembly-line robot, capital embodies the fruits of discovery and driveseconomic growth.”
LO 2

CHAPTER 6 Productivity and Growth 8 9
Education and Economic DevelopmentAnother important source of productivity is humancapital—the skill, experience, and education of work-ers. If knowledge is lacking, other resources may notbe used efficiently. Education makes workers aware of thelatest production techniques and more receptive to newapproaches and methods. Exhibit 4 shows the percentageof the population ages 25 to 64 who have at least a col-lege education. Figures are presented for the UnitedStates and six other industrial market economies,together called the Group of Seven, or G-7 (sometimesRussia is added to form theG-8, but Russia is not yet anindustrial market economyand has a per capita income60 percent below any G-7country). In 1998, 27 percentof the U.S. adult populationhad at least a college degree,the highest percentage inthe world. Among otheradvanced economies, figuresranged from a low of 9 per-cent in Italy to 19 percent inCanada. The U.S. percentagegrew to 29 by 2003, still top-ping the list. Second-rankedCanada rose to 22 percent.
can sort the world’s economiesinto two broad groups. Industrialmarket countries, or developedcountries, make up about 15 per-cent of the world’s population.They consist of the economicallyadvanced capitalist countries ofWestern Europe, North America,Australia, New Zealand, and Japan,plus the newly industrializedAsian countries of Taiwan, SouthKorea, Hong Kong, and Singapore.Industrial market countries wereusually the first to experiencelong-term economic growth dur-ing the 19th century, and todayhave the world’s highest standardof living based on abundanthuman and physical capital.Industrial market countries pro-duce about 54 percent of theworld’s output. The rest of theworld, the remaining 85 percent ofthe world’s population, consists ofdeveloping countries, which have a lower standard of
living because they have lesshuman and physical capital.
Many workers in develop-ing countries are farm-
ers. Because farmingmethods there are
primitive, labor produc-tivity is low and mostpeople barely subsist,much like Americanstwo centuries ago.Developing countries
produce about 46 per-cent of the world’s
output. industrial marketcountries economically advancedcapitalist countries ofWestern Europe, NorthAmerica, Australia, NewZealand, and Japan,plus the newly industri-alized Asian economiesof Taiwan, South Korea,Hong Kong, andSingapore
developingcountries countries with a low liv-ing standard because ofless human and physicalcapital per worker
0 5 10 15 20 25 30
U.S.
Canada
Japan
U.K.
Germany
France
Italy
20031998
Exhibit 4Average Years of Education of Working-Age Populations in 1998 and 2003
SOURCE: Based on figures in Education at a Glance: 2000 and Education at a Glance: 2006, OECD at http://www.oecd.org.
©B
RA
ND
XP
ICT
UR
ES
/JU
PIT
ER
IMA
GE
S
9 0 PART 2 Fundamentals of Macroeconomics
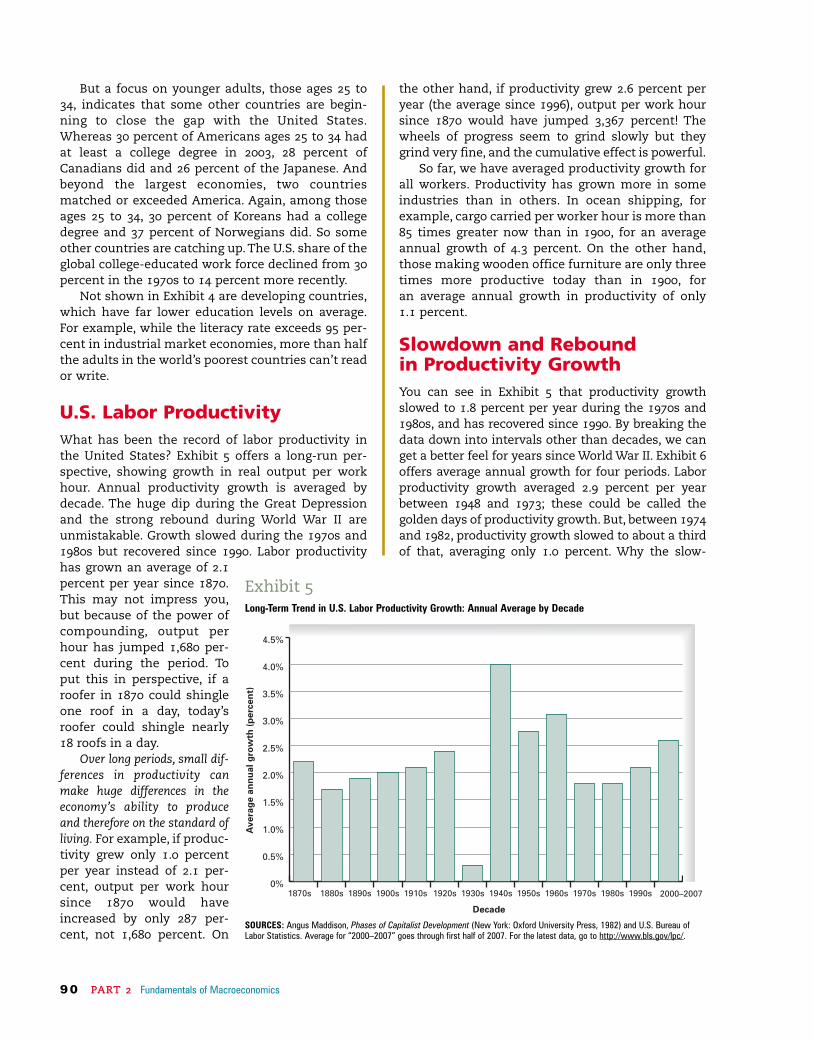
the other hand, if productivity grew 2.6 percent peryear (the average since 1996), output per work hoursince 1870 would have jumped 3,367 percent! Thewheels of progress seem to grind slowly but theygrind very fine, and the cumulative effect is powerful.
So far, we have averaged productivity growth forall workers. Productivity has grown more in someindustries than in others. In ocean shipping, forexample, cargo carried per worker hour is more than85 times greater now than in 1900, for an averageannual growth of 4.3 percent. On the other hand,those making wooden office furniture are only threetimes more productive today than in 1900, for an average annual growth in productivity of only 1.1 percent.
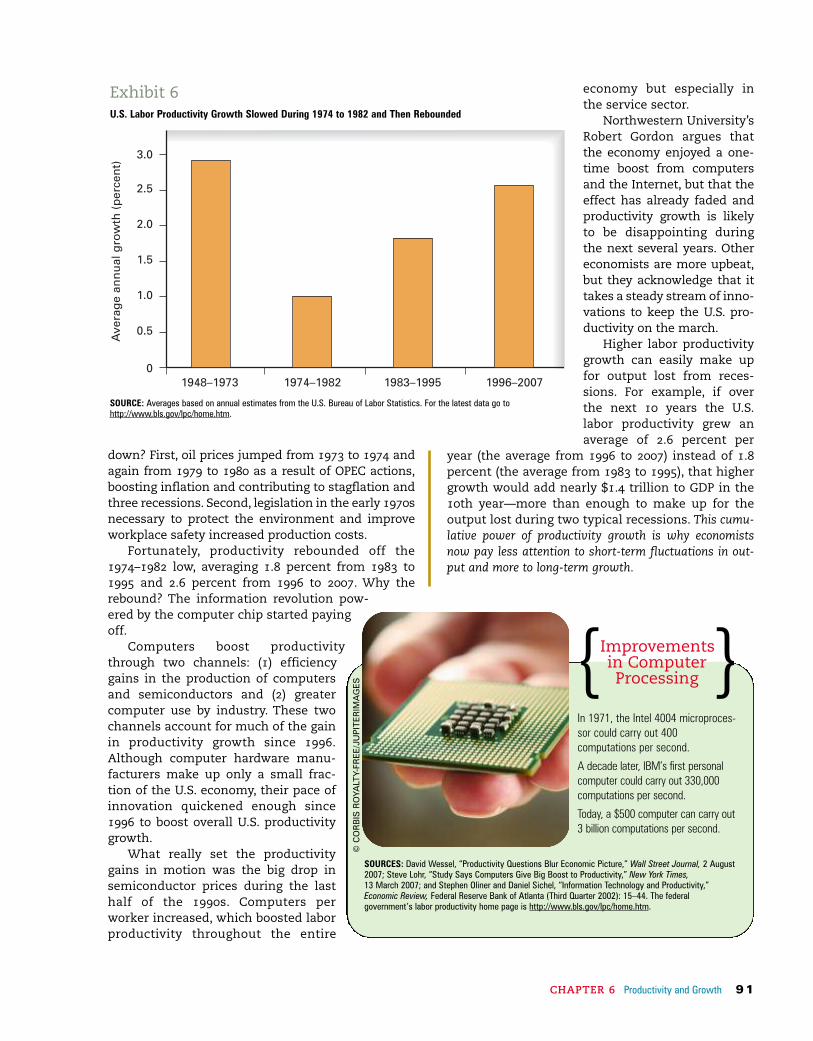
Slowdown and Rebound in Productivity GrowthYou can see in Exhibit 5 that productivity growthslowed to 1.8 percent per year during the 1970s and1980s, and has recovered since 1990. By breaking thedata down into intervals other than decades, we canget a better feel for years since World War II. Exhibit 6offers average annual growth for four periods. Laborproductivity growth averaged 2.9 percent per yearbetween 1948 and 1973; these could be called thegolden days of productivity growth. But, between 1974and 1982, productivity growth slowed to about a thirdof that, averaging only 1.0 percent. Why the slow-
But a focus on younger adults, those ages 25 to34, indicates that some other countries are begin-ning to close the gap with the United States.Whereas 30 percent of Americans ages 25 to 34 hadat least a college degree in 2003, 28 percent ofCanadians did and 26 percent of the Japanese. Andbeyond the largest economies, two countriesmatched or exceeded America. Again, among thoseages 25 to 34, 30 percent of Koreans had a collegedegree and 37 percent of Norwegians did. So someother countries are catching up. The U.S. share of theglobal college-educated work force declined from 30percent in the 1970s to 14 percent more recently.
Not shown in Exhibit 4 are developing countries,which have far lower education levels on average.For example, while the literacy rate exceeds 95 per-cent in industrial market economies, more than halfthe adults in the world’s poorest countries can’t reador write.
U.S. Labor ProductivityWhat has been the record of labor productivity inthe United States? Exhibit 5 offers a long-run per-spective, showing growth in real output per workhour. Annual productivity growth is averaged bydecade. The huge dip during the Great Depressionand the strong rebound during World War II areunmistakable. Growth slowed during the 1970s and1980s but recovered since 1990. Labor productivityhas grown an average of 2.1percent per year since 1870.This may not impress you,but because of the power ofcompounding, output perhour has jumped 1,680 per-cent during the period. Toput this in perspective, if aroofer in 1870 could shingleone roof in a day, today’sroofer could shingle nearly18 roofs in a day.
Over long periods, small dif-ferences in productivity canmake huge differences in theeconomy’s ability to produceand therefore on the standard ofliving. For example, if produc-tivity grew only 1.0 percentper year instead of 2.1 per-cent, output per work hoursince 1870 would haveincreased by only 287 per-cent, not 1,680 percent. On
0%
0.5%
1.0%
1.5%
2.0%
2.5%
3.0%
3.5%
4.0%
4.5%
1870s 1880s 1890s 1900s 1910s 1920s 1930s 1940s 1950s 1960s 1970s 1980s 1990s 2000–2007
Ave
rag
ean
nu
alg
row
th(p
erce
nt)
Decade
E
Exhibit 5Long-Term Trend in U.S. Labor Productivity Growth: Annual Average by Decade
SOURCES: Angus Maddison, Phases of Capitalist Development (New York: Oxford University Press, 1982) and U.S. Bureau ofLabor Statistics. Average for “2000–2007” goes through first half of 2007. For the latest data, go to http://www.bls.gov/lpc/.
CHAPTER 6 Productivity and Growth 9 1
economy but especially inthe service sector.
Northwestern University’sRobert Gordon argues thatthe economy enjoyed a one-time boost from computersand the Internet, but that theeffect has already faded andproductivity growth is likelyto be disappointing duringthe next several years. Othereconomists are more upbeat,but they acknowledge that ittakes a steady stream of inno-vations to keep the U.S. pro-ductivity on the march.
Higher labor productivitygrowth can easily make upfor output lost from reces-sions. For example, if overthe next 10 years the U.S.labor productivity grew anaverage of 2.6 percent per
year (the average from 1996 to 2007) instead of 1.8percent (the average from 1983 to 1995), that highergrowth would add nearly $1.4 trillion to GDP in the10th year—more than enough to make up for theoutput lost during two typical recessions. This cumu-lative power of productivity growth is why economistsnow pay less attention to short-term fluctuations in out-put and more to long-term growth.
down? First, oil prices jumped from 1973 to 1974 andagain from 1979 to 1980 as a result of OPEC actions,boosting inflation and contributing to stagflation andthree recessions. Second, legislation in the early 1970snecessary to protect the environment and improveworkplace safety increased production costs.
Fortunately, productivity rebounded off the1974–1982 low, averaging 1.8 percent from 1983 to1995 and 2.6 percent from 1996 to 2007. Why therebound? The information revolution pow-ered by the computer chip started payingoff.
Computers boost productivitythrough two channels: (1) efficiencygains in the production of computersand semiconductors and (2) greatercomputer use by industry. These twochannels account for much of the gainin productivity growth since 1996.Although computer hardware manu-facturers make up only a small frac-tion of the U.S. economy, their pace ofinnovation quickened enough since1996 to boost overall U.S. productivitygrowth.
What really set the productivitygains in motion was the big drop insemiconductor prices during the lasthalf of the 1990s. Computers perworker increased, which boosted laborproductivity throughout the entire
0.5
0
1.0
1.5
2.0
2.5
3.0
1948–1973 1974–1982 1996–20071983–1995
Ave
rag
ean
nu
alg
row
th(p
erce
nt)
Exhibit 6U.S. Labor Productivity Growth Slowed During 1974 to 1982 and Then Rebounded
SOURCE: Averages based on annual estimates from the U.S. Bureau of Labor Statistics. For the latest data go tohttp://www.bls.gov/lpc/home.htm.
Improvements in ComputerProcessing
In 1971, the Intel 4004 microproces-sor could carry out 400computations per second.
A decade later, IBM’s first personalcomputer could carry out 330,000computations per second.
Today, a $500 computer can carry out3 billion computations per second.
SOURCES: David Wessel, “Productivity Questions Blur Economic Picture,” Wall Street Journal, 2 August2007; Steve Lohr, “Study Says Computers Give Big Boost to Productivity,” New York Times,13 March 2007; and Stephen Oliner and Daniel Sichel, “Information Technology and Productivity,”Economic Review, Federal Reserve Bank of Atlanta (Third Quarter 2002): 15–44. The federalgovernment’s labor productivity home page is http://www.bls.gov/lpc/home.htm.
}{
©C
OR
BIS
RO
YALT
Y-FR
EE
/JU
PIT
ER
IMA
GE
S

9 2 PART 2 Fundamentals of Macroeconomics
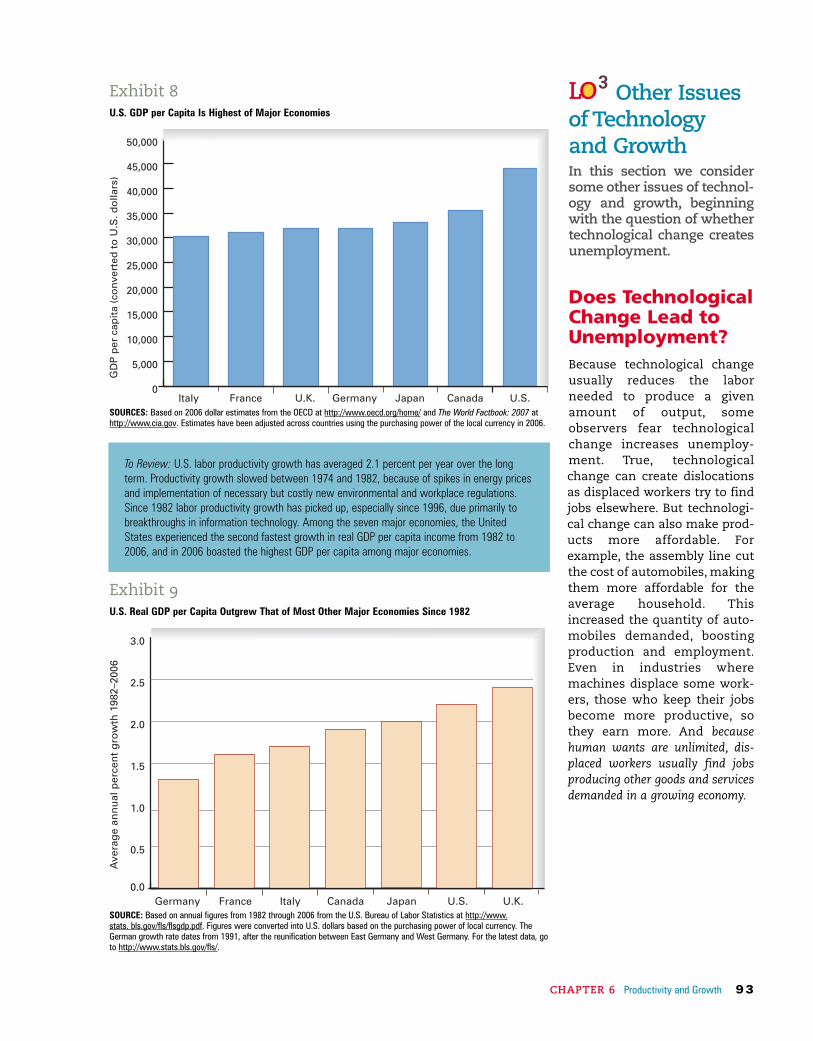
GDP per capita in 2006 for the United States and thesix other leading industrial nations. Local currencieshave been converted to U.S. dollars of 2006 purchas-ing power. With nominal GDP per capita of $44,000 in2006, the United States stood alone at the top, with aper capita income 24 percent above second-rankedCanada and at least 33 percent above the rest. Thus,the United States produced more per capita thanany other major economy.
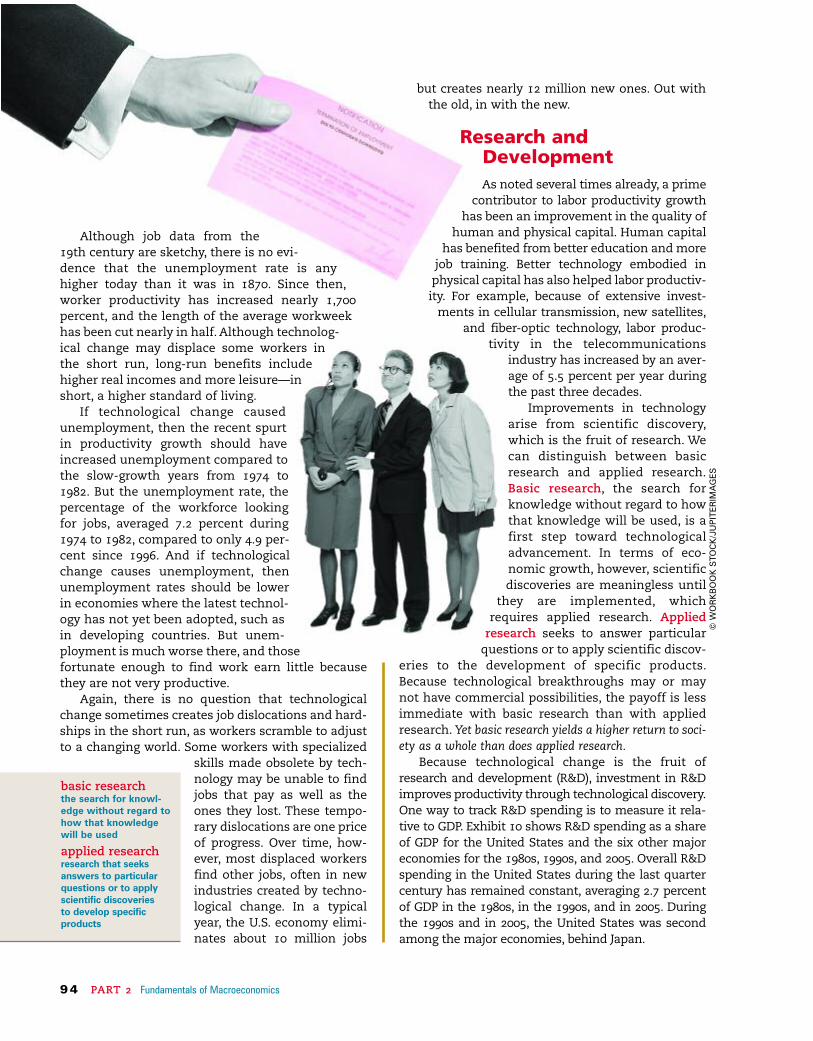
Exhibit 8 looks at the level of output per capita.What about the growth in output per capita?Exhibit 9 shows growth in real GDP per capitafrom 1982 to 2006. With an average growth of 2.2percent per year, the United States ranked secondamong the seven major economies. The UnitedKingdom ranked first, thanks in part to PrimeMinister Margaret Thatcher, who converted somecrusty government enterprises into dynamic for-profit firms. Industries she privatized during the1980s include coal, iron and steel, gas, electricity,railways, trucking, airlines, telecommunications,and the water supply. She also cut income taxrates.
Output per CapitaAs noted earlier, the best measure of an economy’sstandard of living is output per capita. Output percapita, or GDP divided by the population, indicateshow much an economy produces on average perresident. Exhibit 7 presents real GDP per capita forthe United States since 1959. Notice the generalupward trend, interrupted by seven recessions, indi-cated by the pink bars. Real GDP per capita morethan tripled (in 2000 dollars) for an average annualgrowth rate of 2.2 percent. Incidentally, since 1959,labor productivity grew an average of 2.1 percent,which is also the average since 1870. Output percapita since 1959 grew slightly faster than did laborproductivity because the number of workers grewslightly faster than did the population (give that alittle thought).
International ComparisonsHow does U.S. output per capita compare with thatof other industrial countries? Exhibit 8 compares
30,000
35,000
40,000
25,000
Recession
20,000
15,000
10,000
Co
nst
ant
(200
0)d
olla
rs
59 63 65 67 69 71 73 75 77 79 81 83 85 87 89 91 93 95 97 99 01 03 05 0761
Exhibit 7U.S. Real GDP per Capita Has Nearly Tripled Since 1959
SOURCE: Survey of Current Business 87 (July 2007). For the latest data, go to http://www.bea.doc.gov/bea/pubs.htm. Select the most recent month, go tothe “National Data” section toward the end of the page, and then select “Charts.”
Other Issuesof Technology and GrowthIn this section we considersome other issues of technol-ogy and growth, beginningwith the question of whethertechnological change createsunemployment.
Does TechnologicalChange Lead toUnemployment? Because technological changeusually reduces the laborneeded to produce a givenamount of output, someobservers fear technologicalchange increases unemploy-ment. True, technologicalchange can create dislocationsas displaced workers try to findjobs elsewhere. But technologi-cal change can also make prod-ucts more affordable. Forexample, the assembly line cutthe cost of automobiles, makingthem more affordable for theaverage household. Thisincreased the quantity of auto-mobiles demanded, boostingproduction and employment.Even in industries wheremachines displace some work-ers, those who keep their jobsbecome more productive, sothey earn more. And becausehuman wants are unlimited, dis-placed workers usually find jobsproducing other goods and servicesdemanded in a growing economy.
0
5,000
10,000
15,000
20,000
25,000
30,000
35,000
40,000
45,000
50,000
Italy France U.K. Germany Japan Canada U.S.
GD
Pp
erca
pit
a(c
on
vert
edto
U.S
.do
llars
)
0.0
0.5
1.0
1.5
2.0
2.5
3.0
Ave
rag
ean
nu
alp
erce
nt
gro
wth
1982
–200
6
Germany France Italy Canada Japan U.S. U.K.
Exhibit 9U.S. Real GDP per Capita Outgrew That of Most Other Major Economies Since 1982
SOURCE: Based on annual figures from 1982 through 2006 from the U.S. Bureau of Labor Statistics at http://www.stats. bls.gov/fls/flsgdp.pdf. Figures were converted into U.S. dollars based on the purchasing power of local currency. TheGerman growth rate dates from 1991, after the reunification between East Germany and West Germany. For the latest data, goto http://www.stats.bls.gov/fls/.
To Review: U.S. labor productivity growth has averaged 2.1 percent per year over the longterm. Productivity growth slowed between 1974 and 1982, because of spikes in energy pricesand implementation of necessary but costly new environmental and workplace regulations.Since 1982 labor productivity growth has picked up, especially since 1996, due primarily tobreakthroughs in information technology. Among the seven major economies, the UnitedStates experienced the second fastest growth in real GDP per capita income from 1982 to2006, and in 2006 boasted the highest GDP per capita among major economies.
CHAPTER 6 Productivity and Growth 9 3
LO 3Exhibit 8U.S. GDP per Capita Is Highest of Major Economies
SOURCES: Based on 2006 dollar estimates from the OECD at http://www.oecd.org/home/ and The World Factbook: 2007 athttp://www.cia.gov. Estimates have been adjusted across countries using the purchasing power of the local currency in 2006.
9 4 PART 2 Fundamentals of Macroeconomics
but creates nearly 12 million new ones. Out withthe old, in with the new.
Research andDevelopmentAs noted several times already, a prime
contributor to labor productivity growthhas been an improvement in the quality of
human and physical capital. Human capitalhas benefited from better education and more
job training. Better technology embodied inphysical capital has also helped labor productiv-ity. For example, because of extensive invest-
ments in cellular transmission, new satellites,and fiber-optic technology, labor produc-
tivity in the telecommunicationsindustry has increased by an aver-age of 5.5 percent per year duringthe past three decades.
Improvements in technologyarise from scientific discovery,which is the fruit of research. Wecan distinguish between basicresearch and applied research.Basic research, the search forknowledge without regard to howthat knowledge will be used, is afirst step toward technologicaladvancement. In terms of eco-nomic growth, however, scientificdiscoveries are meaningless until
they are implemented, whichrequires applied research. Applied
research seeks to answer particularquestions or to apply scientific discov-
eries to the development of specific products.Because technological breakthroughs may or maynot have commercial possibilities, the payoff is lessimmediate with basic research than with appliedresearch. Yet basic research yields a higher return to soci-ety as a whole than does applied research.
Because technological change is the fruit ofresearch and development (R&D), investment in R&Dimproves productivity through technological discovery.One way to track R&D spending is to measure it rela-tive to GDP. Exhibit 10 shows R&D spending as a shareof GDP for the United States and the six other majoreconomies for the 1980s, 1990s, and 2005. Overall R&Dspending in the United States during the last quartercentury has remained constant, averaging 2.7 percentof GDP in the 1980s, in the 1990s, and in 2005. Duringthe 1990s and in 2005, the United States was secondamong the major economies, behind Japan.
Although job data from the19th century are sketchy, there is no evi-dence that the unemployment rate is anyhigher today than it was in 1870. Since then,worker productivity has increased nearly 1,700percent, and the length of the average workweekhas been cut nearly in half. Although technolog-ical change may displace some workers inthe short run, long-run benefits includehigher real incomes and more leisure—inshort, a higher standard of living.
If technological change causedunemployment, then the recent spurtin productivity growth should haveincreased unemployment compared tothe slow-growth years from 1974 to1982. But the unemployment rate, thepercentage of the workforce lookingfor jobs, averaged 7.2 percent during1974 to 1982, compared to only 4.9 per-cent since 1996. And if technologicalchange causes unemployment, thenunemployment rates should be lowerin economies where the latest technol-ogy has not yet been adopted, such asin developing countries. But unem-ployment is much worse there, and thosefortunate enough to find work earn little becausethey are not very productive.
Again, there is no question that technologicalchange sometimes creates job dislocations and hard-ships in the short run, as workers scramble to adjustto a changing world. Some workers with specialized
skills made obsolete by tech-nology may be unable to findjobs that pay as well as theones they lost. These tempo-rary dislocations are one priceof progress. Over time, how-ever, most displaced workersfind other jobs, often in newindustries created by techno-logical change. In a typicalyear, the U.S. economy elimi-nates about 10 million jobs
©W
OR
KB
OO
KS
TOC
K/J
UP
ITE
RIM
AG
ES
basic research the search for knowl-edge without regard tohow that knowledgewill be used
applied researchresearch that seeksanswers to particularquestions or to applyscientific discoveries to develop specificproducts

CHAPTER 6 Productivity and Growth 9 5
omy’s technological future.One concern is that tech-nologies of the future willrequire huge sums todevelop, sums that an indi-vidual firm cannot easilyraise and put at risk. Anotherconcern is that some techno-logical breakthroughs spillover to other firms and otherindustries, but the firm thatdevelops the breakthroughmay not be in a position toreap benefits from thesespillover effects, so individ-ual firms may underinvest insuch research. One possiblesolution is more governmentinvolvement in economicplanning.
Industrial policy is theidea that government, usingtaxes, subsidies, regulations,and coordination of the pri-vate sector, could help nur-ture the industries andtechnologies of the future togive domestic industries anadvantage over foreign com-petitors. The idea is tosecure a leading role fordomestic industry in theworld economy. One exam-
ple of European industrial policy is Airbus Industrie, afour-nation aircraft consortium. With an estimated$20 billion in government aid, the aircraft maker hasbecome Boeing’s main rival. When Airbus seeks air-craft orders around the world, it can draw on govern-ment backing to promise favorable terms, such aslanding rights at key European airports and an easingof regulatory constraints. U.S. producers get less gov-ernment backing.
U.S. industrial policy over the years was aimed atcreating the world’s mostadvanced military produc-tion capacity. With thedemise of the Soviet Union,however, defense technolo-gies became less important,but the war in Iraq hasshifted some attention backto military applications.Some argue that U.S. indus-trial policy should shift from
Bar segments in the chart distinguish betweenR&D by businesses (shown as green segments) andR&D by governments and nonprofit institutions(shown as orange segments). Business R&D is morelikely to target applied research and innovations.R&D spending by governments and nonprofits, suchas universities, may generate basic knowledge thathas applications in the long run (for example, theInternet sprang from R&D spending on nationaldefense). R&D by U.S. businesses averaged 1.9 per-cent of GDP in all three periods. Again, only Japanhad higher business R&D than the United States inthe 1990s and in 2005. In short, the United Statesdevotes more resources to R&D than most otheradvanced economies, and this helps America main-tain a higher standard of living.
Industrial PolicyPolicy makers have debated whether governmentshould become more involved in shaping an econ-
industrial policy the view that govern-ment—using taxes,subsidies, and regula-tions—should nurturethe industries and tech-nologies of the future,thereby giving thesedomestic industries anadvantage over foreigncompetition
0 0.5 1.0 1.5 2.0 2.5 3.0 3.5
By business By government and nonprofits
1980s
1990sItaly
Canada
UnitedKingdom
France
Germany
UnitedStates
Japan
1980s
1990s
1980s
1990s
1980s
1990s
1980s
1990s
1980s
1990s
1980s
1990s
2005
2005
2005
2005
2005
2005
2005
R&D Spending (percent of GDP)
Exhibit 10R&D Spending as a Percentage of GDP for Major Economies during the 1980s, 1990s, and 2005
SOURCE: Based on estimates developed by the OECD at www.oecd.org.
Do Economies Converge? If given enough time, will poor countries eventuallycatch up with rich ones? The convergence theoryargues that developing countries can grow fasterthan advanced ones and should eventually close thegap. Here’s why: It is easier to copy existing technol-ogy than to develop new technology. Countries thatare technologically backward can grow faster byadopting existing technology. But economies alreadyusing the latest technology must come up with asteady stream of new breakthroughs to grow faster.
Leading countries, such as the United States, findgrowth limited by the rate of creation of new knowl-edge and better technology. But follower countriescan grow more quickly by, for example, adding com-puters where they previously had none. Until 1995,the United States, which makes up just 5 percent ofthe world’s population, accounted for most of theworld’s computer purchases by households. But by2000, most computers were bought by non-U.S.households.
What’s the evidence on convergence? Some poorcountries have begun to catch up with richer ones.For example, the newly industrialized Asianeconomies of Hong Kong, Singapore, South Korea,and Taiwan, by adopting the latest technology andinvesting in human resources, are closing the gapwith the world leaders. Real output per capita inSouth Korea has grown three times faster than theaverage for the seven major economies. These AsianTigers have graduated from developing economies toindustrial market economies. But these are theexceptions. Among the nations that comprise thepoorest third of the world’s population, consump-tion per capita has grown only about 1.0 percent peryear over the past two decades compared with a 2.5percent growth in the rest of the world,7 so the stan-
a military to a civilian focus. Many state governmentsare also trying to identify what industries to support.Economists have long recognized that firms in someindustries gain a performance advantage by cluster-ing—that is, by locating in a region already thick withfirms in the same industry or in related industries.Clusters such as Hollywood studios, Wall Street bro-kers, Broadway theaters, Las Vegas casinos, Bostoncolleges, Orlando theme parks, and Silicon Valley soft-ware makers facilitate communication and promotehealthy competition among cluster members. Theflow of information and cooperation between firms,as well as the competition among firms in close prox-imity, stimulates regional innovation and propelsgrowth. By locating in a region already settled withsimilar firms, a firm can also tap into established localmarkets for specialized labor and for other inputs.
But skeptics wonder whether the governmentshould be trusted to identify emerging technologiesand to pick the industry clusters that will lead theway. Critics of industrial policy believe that marketsallocate scarce resources better than governmentsdo. For example, European governments’ costlyattempt to develop the supersonic transportConcorde never became cost efficient. Airbus hasalso run into financial difficulties, and sponsoringgovernments have tried to distance themselves fromthe company. As a U.S. example, in the early 1980s,the U.S. government spent $1 billion to help militarycontractors develop a high-speed computer circuit.But Intel, a company getting no federal aid, was thefirst to develop the circuit.
There is also concern that an industrial policywould evolve into a government giveaway program.Rather than going to the most promising technologies,the money and the competitive advantages would goto the politically connected. Critics also wonder howwise it is to sponsor corporate research when benefi-ciaries may share their expertise with foreign compa-nies or even build factories abroad. Most economistswould prefer to let Microsoft, General Electric, Google,or some start-up bet their own money on the impor-tant technologies of the future.
convergence a theory predicting thatthe standards of livingin economies aroundthe world will growmore similar over time,with poorer countrieseventually catching upwith richer ones
z z z
7. Based on figures developed by the World Bank in WorldDevelopment Report 2007 (Washington, D.C.: World BankPublications 2006), Tables 1 and 2.
©A
PP
HO
TO/A
IRB
US
IND
US
TR
IE,H
O
9 6 PART 2 Fundamentals of Macroeconomics
tional support that promotes production andexchange. Similarly, an economy with a high-qualityworkforce likely excels in the other sources of pro-ductivity and growth.
We should distinguish between an economy’sstandard of living, as measured by output per capita,and improvements in that standard of living, asmeasured by the growth in output per capita.Growth in output per capita can occur when laborproductivity increases or when the number of work-ers in the economy grows faster than the popula-tion. In the long run, productivity growth and the growthin workers relative to the growth in population will deter-mine whether or not the United States continues to enjoythe world’s highest standard of living.
In the next chapter, you learn how to measureoutput in the economy and how to adjust forchanges in the price level. In later chapters, youdevelop aggregate demand and aggregate supplycurves to build a model of the economy. Once youhave an idea how a healthy economy works, you canconsider the policy options in the face of high unem-ployment, high inflation, or both.
dard of living in the poorest third of the world hasgrown somewhat in absolute terms but has fallenfarther behind in relative terms. Worse yet, a billionpeople seem trapped in poor economies that aregoing nowhere.
One reason per capita consumption has grown soslowly in the poorest economies is that birthratesthere are double those in richer countries, so pooreconomies must produce still more just to keep upwith a growing population. Another reason why con-vergence has not begun, particularly for the poorestthird of the world, is the vast difference in the qual-ity of human capital across countries. Whereas tech-nology is indeed portable, the knowledge, skill, andtraining needed to take advantage of that technologyare not. Countries with a high level of human capitalcan make up for other shortcomings. For example,much of the capital stock in Japan and Germany wasdestroyed during World War II. But the two countriesretained enough of their well-educated and highlyskilled labor force to rejoin elite industrial marketeconomies in little more than a generation. But somecountries, such as those in Africa, simply lack thehuman capital needed to identify and absorb newtechnology. As noted already, such poor economiestend to have low education levels and low literacyrates. What’s more, some countries lack the stablemacroeconomic environment and the establishedinstitutions needed to nurture economic growth.Many developing countries have serious deficienciesin their infrastructures, lacking, for example, the reli-able source of electricity to power new technologies.For example, in Northern Nigeria, near the Sahara, 90percent of the villages have no electricity. Some ofthe poorest nations have been ravaged by civil warfor years. And simply communicating can be chal-lenging in some developing countries. In Nigeria, forexample, more than 400 languages are spoken by 250distinct ethnic groups. (To learn more about the chal-lenges facing the poorest nations, read the finalchapter of this book, entitled “Developing andTransitional Economies.”)
Final WordProductivity and growth depend on the supply andquality of resources, the level of technology, and therules of the game that nurture production andexchange. These elements tend to be correlated withone another. An economy with an unskilled andpoorly educated workforce usually is deficient inphysical capital, in technology, and in the institu-
©A
PP
HO
TO/S
UN
DA
YA
LAM
BA
CHAPTER 6 Productivity and Growth 9 7