productivity of the english - university of york · productivity of the english nhs: 2012/13 update...
TRANSCRIPT

CHE Research Paper 110
Productivity Of The English NHS: 2012/13 Update
Chris Bojke, Adriana Castelli, Katja Grašič, Andrew Street


Productivity of the English NHS: 2012/13 update
Chris Bojke Adriana Castelli Katja Grašič Andrew Street
Centre for Health Economics, University of York, UK March 2015

Background to series
CHE Discussion Papers (DPs) began publication in 1983 as a means of making current research material more widely available to health economists and other potential users. So as to speed up the dissemination process, papers were originally published by CHE and distributed by post to a worldwide readership. The CHE Research Paper series takes over that function and provides access to current research output via web-based publication, although hard copy will continue to be available (but subject to charge). Acknowledgements
We thank John Bates, Keith Derbyshire, Caroline Lee and Shelley Lowe for their assistance. This is an independent study commissioned and funded by the Department of Health in England as part of a programme of policy research at the Centre for Health Economics (070/0081 Productivity; 103/0001 ESHCRU). The views expressed are those of the authors and not necessarily those of the Department of Health. The Hospital Episode Statistics are copyright © 2012/13, re-used with the permission of The Health & Social Care Information Centre. All rights reserved.
Disclaimer
Papers published in the CHE Research Paper (RP) series are intended as a contribution to current research. Work and ideas reported in RPs may not always represent the final position and as such may sometimes need to be treated as work in progress. The material and views expressed in RPs are solely those of the authors and should not be interpreted as representing the collective views of CHE research staff or their research funders. Further copies
Copies of this paper are freely available to download from the CHE website www.york.ac.uk/che/publications/ Access to downloaded material is provided on the understanding that it is intended for personal use. Copies of downloaded papers may be distributed to third-parties subject to the proviso that the CHE publication source is properly acknowledged and that such distribution is not subject to any payment. Printed copies are available on request at a charge of £5.00 per copy. Please contact the CHE Publications Office, email [email protected], telephone 01904 321405 for further details.
Centre for Health Economics Alcuin College University of York York, UK www.york.ac.uk/che © Chris Bojke, Adriana Castelli, Katja Grašič, Andrew Street
Productivity of the English NHS: 2012/13 update i
Contents
1. Introduction ........................................................................................................................................ 1
2. Methods .............................................................................................................................................. 2
2.1 Output growth .............................................................................................................................. 2
2.2 Input growth ................................................................................................................................. 2
2.3 Productivity growth ...................................................................................................................... 3
3. Data issues .......................................................................................................................................... 5
3.1 Measuring output ......................................................................................................................... 5
Hospital Episode Statistics .............................................................................................................. 6
Reference cost data ........................................................................................................................ 7
Primary care activity ..................................................................................................................... 11
3.2 Measuring input .......................................................................................................................... 12
NHS Staff Data ............................................................................................................................... 13
Expenditure data ........................................................................................................................... 14
3.3 Measuring productivity ............................................................................................................... 16
4. Output growth .................................................................................................................................. 17
4.1 Hospital activity ........................................................................................................................... 17
4.2 Inpatient and community mental health .................................................................................... 20
4.3 Community care .......................................................................................................................... 23
4.4 Primary care ................................................................................................................................ 25
4.5 A&E activity and ambulance services ......................................................................................... 29
4.6 Other activities ............................................................................................................................ 32
4.7 Output growth ............................................................................................................................ 35
5. Input growth ..................................................................................................................................... 36
5.1 Staff numbers .............................................................................................................................. 36
5.2 Input use derived from expenditure data ................................................................................... 39
5.3 Input growth ............................................................................................................................... 43
6. Productivity growth .......................................................................................................................... 44
7. Conclusions ....................................................................................................................................... 46
References ............................................................................................................................................ 48

ii CHE Research Paper 110
Productivity of the English NHS: 2012/13 update iii
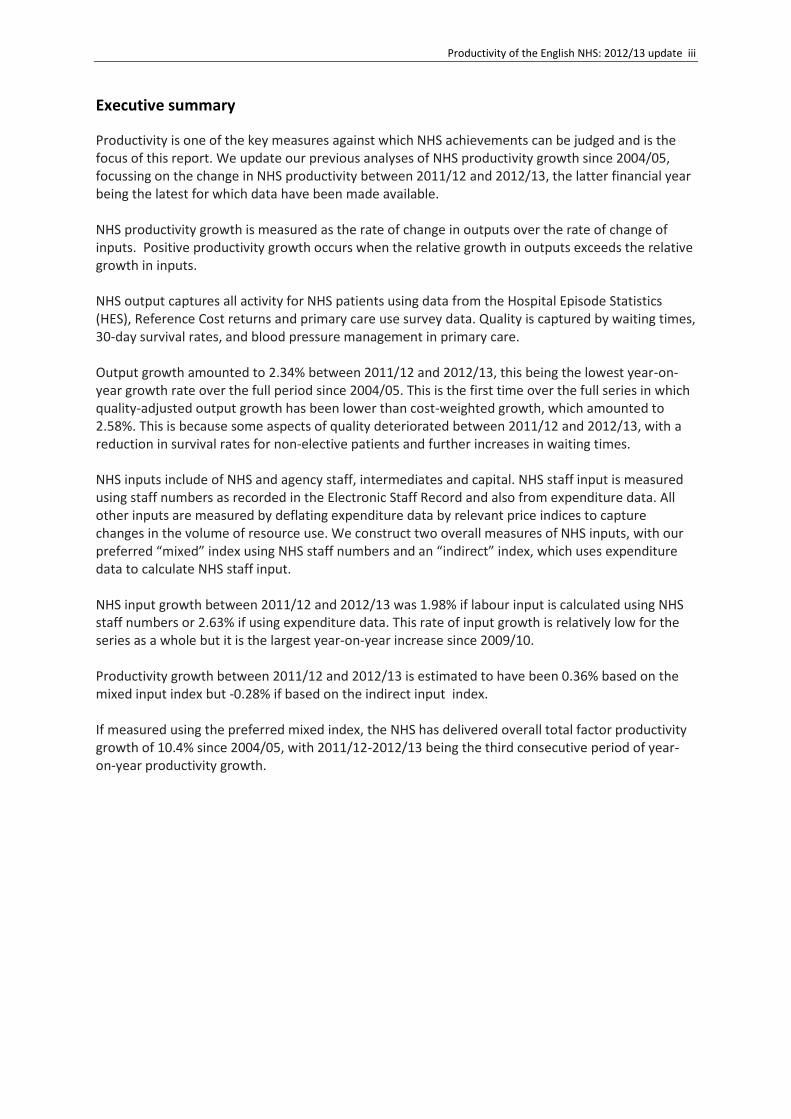
Executive summary
Productivity is one of the key measures against which NHS achievements can be judged and is the focus of this report. We update our previous analyses of NHS productivity growth since 2004/05, focussing on the change in NHS productivity between 2011/12 and 2012/13, the latter financial year being the latest for which data have been made available. NHS productivity growth is measured as the rate of change in outputs over the rate of change of inputs. Positive productivity growth occurs when the relative growth in outputs exceeds the relative growth in inputs. NHS output captures all activity for NHS patients using data from the Hospital Episode Statistics (HES), Reference Cost returns and primary care use survey data. Quality is captured by waiting times, 30-day survival rates, and blood pressure management in primary care. Output growth amounted to 2.34% between 2011/12 and 2012/13, this being the lowest year-on-year growth rate over the full period since 2004/05. This is the first time over the full series in which quality-adjusted output growth has been lower than cost-weighted growth, which amounted to 2.58%. This is because some aspects of quality deteriorated between 2011/12 and 2012/13, with a reduction in survival rates for non-elective patients and further increases in waiting times. NHS inputs include of NHS and agency staff, intermediates and capital. NHS staff input is measured using staff numbers as recorded in the Electronic Staff Record and also from expenditure data. All other inputs are measured by deflating expenditure data by relevant price indices to capture changes in the volume of resource use. We construct two overall measures of NHS inputs, with our preferred “mixed” index using NHS staff numbers and an “indirect” index, which uses expenditure data to calculate NHS staff input. NHS input growth between 2011/12 and 2012/13 was 1.98% if labour input is calculated using NHS staff numbers or 2.63% if using expenditure data. This rate of input growth is relatively low for the series as a whole but it is the largest year-on-year increase since 2009/10. Productivity growth between 2011/12 and 2012/13 is estimated to have been 0.36% based on the mixed input index but -0.28% if based on the indirect input index. If measured using the preferred mixed index, the NHS has delivered overall total factor productivity growth of 10.4% since 2004/05, with 2011/12-2012/13 being the third consecutive period of year-on-year productivity growth.

iv CHE Research Paper 110

Productivity of the English NHS: 2012/13 update 1
1. Introduction
The National Health Service (NHS) provides care to millions of patients every year, with almost everyone having at least some form of contact with the health service annually. The NHS is also the single largest employer in England, accounting for 1 out of 18 in the workforce (Office for National Statistics 2015). In 2012/13 health spending (including spending by central government departments) amounted to £104 billion and accounted for 7.9 per cent of GDP.1 As such an important part of the economy, it is essential to understand what the NHS achieves from the resources devoted to it. Productivity is one of the key measures against which NHS achievements can be judged and is the focus of this report. We update our previous analyses (Bojke et al. 2012; Bojke et al. 2014), focussing on the change in NHS productivity between 2011/12 and 2012/13, the latter financial year being the latest for which data are available. We follow national accounting conventions to measure the change in productivity over time (Eurostat 2001). This involves comparisons of changes in the total amount of health care ‘output’ produced with changes in the total amount of ‘input’ used to produce this output. We construct a set of paired year-on-year comparisons from 2004/05-2005/06 through to 2011/12-2012/13. These paired comparisons are then converted into a chained index that reports productivity change over the entire period. The structure of the report is as follows. The form of the constituent elements of the output and input indices used to construct our productivity measure is presented in section 2. We describe the data used to populate the output and input indices in section 3, detailing the particular challenges that had to be addressed in comparing data between 2011/12 and 2012/13. The output index is populated in section 4 and section 5 reports the elements of the input index. Section 6 reports the productivity growth figures. A summary and concluding remarks are provided in section 7.
1 https://www.gov.uk/government/uploads/system/uploads/attachment_data/file/285632/PSS_February_2014.pdf

2 CHE Research Paper 110
2. Methods
In calculating productivity growth for the health care system, it is necessary to combine the multitude of outputs and inputs into single output and input measures. This requires the construction of an output growth index (𝑋) and an input growth index (𝑍), with total factor productivity growth ∆𝑇𝐹𝑃 calculated by comparing growth in outputs with growth in inputs such that: ∆𝑇𝐹𝑃 = [𝑋/𝑍] − 1 (1) In order to estimate total factor productivity, it is necessary to correctly define and measure the output and input indices.
2.1 Output growth
Quantification of health care output is a challenge because patients have varied health care requirements and receive very different packages of care. To address this, it is necessary to classify patients into reasonably homogenous output groupings, such as Healthcare Resource Groups (HRGs) or Reference Cost (RC) categories. Furthermore, in order to aggregate these diverse outputs into a single index, some means of assessing their relative value is required. Usually prices are used to assess value, but prices are not available for the vast majority of NHS services for which people do not have to pay at point of use. In common with the treatment of other non-market sectors of the economy in the national accounts, costs are used to indicate the value of health services. Costs reflect producer rather than consumer valuations of outputs, but have the advantage of being readily available. As costs are not believed to truly reflect consumers’ valuations, Atkinson suggests supplementing costs with information about the quality of non-market goods and services (Atkinson 2010). One way of doing this is by adding a scalar to the output index that captures changes over time in different dimensions of quality (Castelli et al. 2007). Thus, following Castelli et al (2007), the output growth index (in its Laspeyres form) can be calculated across two time periods as :
𝑋(0,𝑡)𝑐𝑞
=∑ 𝑥𝑗𝑡𝑐𝑗0[
𝑣𝑗0𝑞𝑗𝑡
𝑣𝑗0𝑞𝑗0]
𝐽𝑗=1
∑ 𝑥𝑗0𝑐𝑗0𝐽𝑗=1
(2)
We define jx as the number of patients who have output type j, where j=1…J; jtc indicates the cost
of output j; jq represents a unit of quality for output j, and jv is the value of this unit of quality; and
t indicates time with 0 indicating the first period of the time series. Our measures of quality include inpatient and outpatient waiting times, survival rates following hospitalisation, and blood pressure management in primary care.
2.2 Input growth
Turning to the input growth index (𝑍), inputs into the health care system consist of labour, intermediate goods and capital. Growth in the use of these factors of production can be calculated directly or indirectly (OECD 2001). A direct measure of input growth can be calculated when data on the volume and price of inputs are available. In its Laspeyres form, the input growth index can be calculated as:

Productivity of the English NHS: 2012/13 update 3
𝑍(0,𝑡)𝐷 =
∑ 𝑧𝑛𝑡𝜔𝑛0𝑁𝑛=1
∑ 𝑧𝑛0𝜔𝑛0𝑁𝑛=1
(3)
Where ntz is the volume of input of type n at time t and nt is the price of input type n at time t.
However, data about the volume of inputs are rarely available. It is, therefore, common practice to calculate input growth using expenditure data. Changes in expenditure are driven by both changes in the volume of resource use and in prices. Hence, to isolate the volume effect, it is necessary to wash out price changes by converting ‘current’ monetary values into ‘constant’ expenditure using a deflator 𝜋𝑛𝑡. This deflator reflects the underlying trend in prices for the input in question, such that 𝜔𝑛𝑡+1 = 𝜋𝑛𝑡𝜔𝑛𝑡. If expenditure data and deflators are available, the input growth index can be specified as:
𝑍(0,𝑡)𝐼𝑛𝑑 =
∑ 𝜋𝑛𝑡𝐸𝑛𝑡𝑁𝑛=1
∑ 𝐸𝑛0𝑁𝑛=1
=∑ 𝑧𝑛𝑡𝜋𝑛𝑡𝜔𝑛𝑡
𝑁𝑛=1
∑ 𝑧𝑛0𝜔𝑛0𝑁𝑛=1
=∑ 𝑧𝑛𝑡𝜔𝑛0
𝑁𝑛=1
∑ 𝑧𝑛0𝜔𝑛0𝑁𝑛=1
= 𝑍(0,𝑡)𝐷 (4)
As shown, this is equivalent to using volume data, provided that deflators capture correctly the trend in prices for each input in question.
2.3 Productivity growth
The above equations show output or input growth over two periods from a base (0) to a current period (t). Usually, there is interest in assessing productivity growth over longer periods of time. There are two ways to do this. The first way is by means of a fixed base index, which applies the same set of output weights (cj) and input weights (ωj), usually that of the base year (year 0) throughout the full series. This has the advantage of using a common set of weights across all periods, allowing growth rates to be interpreted solely as changes in volumes. Use of a fixed base index is common when calculating growth rates for a specified basket of goods and services. The drawback of this approach is that it requires the contents of the basket to remain unchanged over the full period. If this requirement cannot be met, the alternative is to use a chained index. This approach has long been recommended (Lehr 1885; Marshall 1887) as a way to overcome the problems arising when new commodities appear and old commodities disappear, making the use of weights of the base year practically impossible. By updating the weights in every period, it is possible to account for ongoing changes in the composition of the outputs and inputs being measured
(Diewert et al. 2010). The main advantages of using a chained index, over a fixed base index are:
ease of handling changes in the type of outputs produced and inputs utilised in production, as these only need to be common across two adjacent periods rather than for the full series (Balk 2010);
regular updates of the weights better reflect actual price and volume changes (de Boer, van Dalen, and Verbiest 1997);
the difference (or spread) between the Laspeyres and Paasche formulations of the indices is lower than it would be if using a base index.
Using the Laspeyres output index as defined in eq. (2), a chained output index takes the following form:

4 CHE Research Paper 110
𝑋(0,𝑇)𝑐𝑞
=∑ 𝑥𝑗𝑡𝑐𝑗0[
𝑣𝑗0𝑞𝑗𝑡
𝑣𝑗0𝑞𝑗0]
𝐽𝑗=1
∑ 𝑥𝑗0𝑐𝑗0𝐽𝑗=1
× ∑ 𝑥𝑗𝑡+1𝑐𝑗𝑡[
𝑣𝑗𝑡𝑞𝑗𝑡+1
𝑣𝑗𝑡𝑞𝑗𝑡]
𝐽𝑗=1
∑ 𝑥𝑗𝑡𝑐𝑗𝑡𝐽𝑗=1
× ∙∙∙ × ∑ 𝑥𝑗𝑇𝑐𝑗𝑇−1[
𝑣𝑗𝑇𝑞𝑗𝑇
𝑣𝑗𝑇𝑞𝑗𝑇−1]
𝐽𝑗=1
∑ 𝑥𝑗𝑇−1𝑐𝑗𝑇−1𝐽𝑗=1
(5)
This can be simplified as:
𝑋(0,𝑇)
𝑐,𝑞= 𝑋(0,𝑡)
𝑐,𝑞× 𝑋(𝑡,𝑡+1)
𝑐,𝑞×∙∙∙× 𝑋(𝑇−1,𝑇)
𝑐,𝑞 (6)
where each link is represented by eq. (2) for the relevant two consecutive years. An analogous construction applies to the chained input index.

Productivity of the English NHS: 2012/13 update 5
3. Data issues
3.1 Measuring output
Our NHS output index is designed to capture all activities provided to NHS patients whether by NHS or private sector organisations. Table 1 below summarises data sources used to measure activity, quality and costs and indicates specific measurement issues that have had to be tackled in constructing the output growth index for 2011/12-2012/13. The data and these specific issues are detailed in the remainder of this section. Table 1 Summary of output data sources
Output type Activity source Cost source Quality Notes for 2012/13 data Elective HES RC 30-day survival;
health outcomes; waiting times
Replacement of HRG4 with HRG4+
Non-elective HES RC 30-day survival;
health outcomes Replacement of HRG4 with HRG4+
Outpatient HES RC Waiting times Mental health HES & RC RC 30-day survival;
health outcomes; waiting times
Community MH re-included, using MH clusters; some categorisation changes
Community care RC RC N/A Changes in organisational coverage;
categorisation changes A&E RC RC N/A Changes in organisational coverage;
categorisation changes Other (1) RC RC N/A Changes in organisational coverage Primary care Pre-2009/10 from
QResearch Post-2009/10 from GP patient survey
PSSRU Unit Costs of Health and Social Care
QOF data Uplift survey responses by population growth
Prescribing Prescription cost
analysis system Prescription cost analysis system
N/A
Ophthalmic and dental services
HSCIC HSCIC N/A
Glossary HES: Hospital Episode Statistics; RC: Reference Costs; MH: Mental Health; PSSRU: Personal & Social Services Research Unit; QOF: Quality and Outcomes Framework; HSCIC: Health and Social Care Information Centre; DH: Department of Health
Note (1) Radiotherapy & High Cost Drugs, Diagnostic Tests, Hospital/patient Transport Scheme, Radiology, Rehabilitation, Renal Dialysis, Specialist Services

6 CHE Research Paper 110
3.1.1 Hospital Episode Statistics
Elective and non-elective activity
The Hospital Episode Statistics (HES) is the source of data for both the amount of activity and for the measures of quality for elective and non-elective activity, including mental health care delivered in hospitals.2 HES comprise almost 19.1 million patient records for 2012/13. We convert HES records, defined as Finished Consultant Episodes (FCEs), into Continuous Inpatient Spells (CIPS), using the official algorithm for calculating CIPS published by the Health and Social Care Information Centre3 for HES inpatient activity from 2010/11 onwards. We then count the number of CIPS in each Healthcare Resource Group (HRG), which form the basic means of describing different types of hospital output. The cost of each CIPS is calculated on the basis of the most expensive FCE within the CIPS, with costs for each HRG derived from the Reference Cost data. We then calculate the national average cost per CIPS in each HRG. Reference Cost data contain their own system of activity classification which closely maps our own. Activities are divided into ‘mapping pots’ which capture which of the services the activity occurs in (e.g. 01_EI for elective and 02_NEI for non-elective services). They are then subdivided into department codes (e.g. DC for Day case, NEI_L for non-elective long stay and NEI_S for non-elective short stay) which capture the Point of Delivery. Full details are available in the Reference Cost documentation (Department of Health 2012). For elective activity, the average cost for an HRG is calculated as the activity weighted average cost of all of the HRG activity contained in the reference cost data in the mapping pot ’01-EI’ and a department code of ‘EI’. This intentionally excludes the use of day case costs in the calculation of average costs to avoid down-weighting the activity due to an increasing use of the less costly point of delivery. For non-elective activity, the average cost is the activity weighted average using both the ‘NEI_S’ and ‘NEI_L’ department codes from the ’02_NEI’ reference cost mapping pot. The HES records include waiting times and can be linked to ONS death registry records. This allows us to calculate waiting times and 30-day survival rates which are used to assess the quality of hospital care. Calculation of growth in hospital output between 2011/12 and 2012/13 is somewhat complicated by the change from HRG4 to HRG4+ to describe activity. HRG4 was first used for the 2006/07 reference cost collection exercise and originally comprised approximately 1,390 groups. HRG4 was designed to evolve year-on-year, allowing for a progressive expansion of categories and by 2011/12 it consisted of 1,657 HRGs. In 2012/13 there was a substantive revision to the HRG classification system, referred to as HRG4+, which greater differentiation for complications and co-morbidities. The number of HRG codes increased to 2,100, with only approximately 600 HRGs being common between HRG4 and HRG4+ and most of the new HRGs dealing with patients requiring costly types of care. The use of the different HRG4 and HRG4+ classification systems for the 2011/12 and 2012/13 HES data creates a challenge in constructing a chained index, as there is a structural break in the output categories. We overcome this by running the 2012/13 HES data through the HRG4 Grouper software, thereby reverting back to the former categorisation system. This approach is feasible because the move from HRG4 to HRG4+ is motivated primarily by a need to obtain greater granulation of patient complexity within the existing HRG4 categories rather than being a completely
2 As in previous years, we exclude patients categorised to HRG SB97Z (same day chemotherapy admission/attendance)
because this is excluded from the hospital Reference Cost collection and is intended to attract a zero tariff under Payment by Results. 3 http://www.hesonline.nhs.uk/Ease/servlet/ContentServer?siteID=1937&categoryID=1072

Productivity of the English NHS: 2012/13 update 7
different way of describing hospital activity. Therefore, the underlying codes for diagnoses and procedures are the same in both HRG4 and HRG4+. Reverting back to HRG4 is not perfect, however, because the Grouper software contains data quality checks which were relevant to the form in which data were coded in 2011/12 but may not apply to the 2012/13 data, for which the underlying primary classification for diagnoses has been updated to the ICD-10 4th Edition (NHS Information Centre 2012). If these quality checks fail, patients are allocated to the unspecified HRG UZ01Z. This applied to 13% of patients in the 2012/13 HES data, compared to 1.3% in 2011/12. We assign average costs to these patients. Outpatient activity In the past we used the Reference Costs (RC) to measure outpatient activity (Castelli, Laudicella, and Street 2008). Due to changes in reporting by Primary Care Trusts (PCTs) which affected the RC measure of outpatient activity in 2011/12, we now use the HES Outpatient Minimum Dataset rather than RC to assess outpatient activity. Comparison of historical values in both datasets prior to 2011/12 indicates a very close match in volume measures and therefore there is no major consequence of this change. The HES Outpatient Minimum Dataset was first made available for the 2007/08 financial year, and contained more than 60 million records. By 2012/13 the data comprised 94 million records, detailing all outpatient appointments by NHS hospital trusts in England and those performed in the independent sector. Details include the type of attendance, main specialty of consultant providing treatment, and waiting time. Outpatient waiting times up until 2009/10 were based on data published on the Department of Health (DH) performance website, but this collection has since been discontinued. From 2010/11, we calculate waiting times for first attendances using the HES Outpatient Minimum Dataset.4 These waiting times are somewhat higher than those reported previously, but year-on-year trends are virtually identical. Consequently, the move to the new data series has not had an impact on the estimates of output growth. However, to ensure consistent comparisons, growth rates up to and including 2008/09 - 2009/10 are based on data published on the DH performance website, whilst the NHS outpatient growth rates from 2010/11 onwards are based on the figures derived from the Outpatient Minimum Dataset. 3.1.2 Reference cost data
The Reference Cost returns are used to capture activity performed in most health care settings other than hospitals, outpatient departments and primary care. They also provide information on unit costs for these activities, including activity performed in hospitals. In particular, RC data cover activity conducted in accident and emergency (A&E) departments, mental health and community care settings, and diagnostic facilities. Activities are reported in various ways: attendances, bed days, contacts and number of tests. In order to aggregate these diverse activities and convert them into a common metric, we use unit costs as weights. General RC data validation checks
There is a series of mandatory and non-mandatory validations of the Reference Cost data returned by NHS Trusts, as follows (Department of Health 2012):
Mandatory validations included checks that all data (both activity and cost) are reported, unit costs are reported as positive integers to two decimal places, no fields are missing, etc.
4 http://www.hesonline.nhs.uk/Ease/servlet/ContentServer?siteID=1937&categoryID=890.

8 CHE Research Paper 110
Non-mandatory validations include checking whether unit costs below £5 or over £50,000 are accurate and whether single professional outpatient attendance unit costs were less than multi-professional unit costs.
Finally, checks on ‘year on year changes’ are carried out. In particular, any change in total cost or activity greater than 25% is flagged and followed up. The check is carried out by department code and HRG sub-chapter for acute services, or service code for non-acute services (only for outpatient attendances, outpatient procedures and emergency medicine).
Over and above these checks, we have implemented our own validation process (Bojke et al. 2014). These focus on identifying large increases/decreases in either volume or unit costs of activity for all non-acute services. In particular, we check 1) whether volumes of activity have registered either an increase or decrease of more than 500,000 units and 2) whether the value of such activity has changed by more than £25 million, either way. The validation checks performed with the RC 2012/13 data do not show any such unusual or implausible large changes. RC data are always subject to some degree of change over time. Major changes from 2011/12 to 2012/13 involved changes in organisation coverage and changes in categorisation of some types of activity. Organisational coverage
Table 2 provides details of the number and type of organisations submitting RC data since 2010/11. The 2011/12 data cover activity provided by NHS trusts (both Foundation and non-Foundation), Community and Mental Health Trusts, including activity sub-contracted out to independent sector organisations.5 Prior to 2011/12 the RC data also included data submitted by Primary Care Trusts (PCTs), which no longer exist, and Personal Medical Services (PMS). The 2012/13 RC data cover only activity provided by NHS trusts (both Foundation and non-Foundation). Table 2 Organisations making Reference Cost returns
2010/11 2011/12 2012/13
Primary Care Trusts 23 0 0
Acute Trusts 167 165 161
Community Trusts 2 5 5
Mental Health Trusts 0 9 9
All Trusts 192 179 175
In constructing our chained index of output growth, we include activity that is recorded by common organisations across adjacent periods. This minimises the risk of the output input index falsely capturing changes in activity that are actually due to changes over time in organisational coverage. Mental health care
In 2011/12 there was a major overhaul of the way in which mental health care activity was defined in the RC data collection with the introduction of new mental health clusters. These ‘reflect patient need over specific periods of time that range from four weeks to 12 months, and apply to both admitted patient and community care. The care clusters cover working age adults and older people only, and replace previous reference cost currencies for adult and elderly mental health services. They also include some services previously reported as specialist mental health services or mental health specialist teams. Existing reference cost currencies for children and adolescent, drug and alcohol, and
5 In this case unit costs submitted are ‘in effect the price paid by the NHS for the service and not the cost to independent
sector organisations (Reference costs 2011-12, p. 11 (2012))’ (emphasis added).

Productivity of the English NHS: 2012/13 update 9
some specialist mental health services remain, but we have refined these in light of the introduction of the care clusters.’ (Department of Health 2012). Our comparative analyses of data for 2011/12 with that for previous years suggested that the introduction of clusters was not simply a reclassification of RC activity recorded in previous time periods, but also captured newly recorded activity. As we were unable to isolate newly recorded activity from redefined but previously recorded activity, it was necessary to omit RC Mental Health activity from the output growth calculation for 2010/11-2011/12. However, now that mental health clusters have been recorded in a consistent fashion for two consecutive years, it has been possible to include these activities in the construction of output growth for 2011/12-2012/13. Although clusters have remained the same, there has been, however, a change in the way that other community mental health care activities are reported. The change has affected some of the service types and all the currency codes in which activity is recorded and reported. Up until 2011/12, ‘other mental health care’ activities were reported by the type of setting (e.g. inpatient) and then sub-divided by the type of patients treated (eg. children and adolescents, adults). In 2012/13, activity was reported by type of service/client group and then sub-divided by the type of setting in which the activity takes place. Examples of the old and new classification systems are shown in Table 3. About 80% of categories reported in 2012/13 can be mapped to the classification system used in 2011/12, with 12 new categories left unmapped. Similarly, 96% of categories used in 2011/12 can be mapped to the new categories introduced in 2012/13, leaving only two unmapped categories recorded in 2011/12. Table 4 lists the categories unmapped, respectively for 2011/12 and 2012/13. Table 3 Community mental health, ‘Other mental health activity’, old and new classification systems with mapping
NHS
setting -
11/12
Currency
Code -
11/12
Currency Description - 11/12
Service
Code -
12/13
Currency
Code -
12/13
Currency Description - 12/13
MHIP MHIPC1 Children and Adolescents CAMHS CAMHSAPCChildren and Adolescent Mental Health Services, Admitted
Patients
MHCOMM MHCOM05 Children and Adolescent Other Services CAMHS CAMHSCCChildren and Adolescent Mental Health Services, Community
Contacts
MHDCFRAD DCF42Mental Health Patients: Children and
AdolescentCAMHS CAMHSDC
Children and Adolescent Mental Health Services, Day Care
Facilities
MHOP MHOP05 Children and Adolescent Other Services CAMHS CAMHSOPChildren and Adolescent Mental Health Services, Outpatient
Attendances
MHIPSS MHIPA2 Alcohol Services: Adult DAS ALCAAP Alcohol Services, Adult, Admitted Patient
MHCOMM MHCOM02 Alcohol Services : Adult DAS ALCACC Alcohol Services, Adult, Community Contacts
MHOP MHOP02 Alcohol Services : Adult DAS ALCAOP Alcohol Services, Adult, Outpatient Attendances
MHCOMM MHCOM04Alcohol Services: Children and
AdolescentsDAS ALCCCC
Alcohol Services, Children and Adolescents, Community
Contacts
- - DAS ALCCOPAlcohol Services, Children and Adolescents, Outpatient
Attendances
MHIPSS MHIPA1 Drug Services: Adult DAS DRUAAP Drug Services, Adult, Admitted Patient
MHCOMM MHCOM01 Drug Services : Adult DAS DRUACC Drug Services, Adult, Community Contacts
MHOP MHOP01 Drug Services : Adult DAS DRUAOP Drug Services, Adult, Outpatient Attendances
MHCOMM MHCOM03 Drug Services: Children and Adolescents DAS DRUCCCDrug Services, Children and Adolescents, Community
Contacts
MHOP MHOP03 Drug Services: Children and Adolescents DAS DRUCOPDrug Services, Children and Adolescents, Outpatient
Attendances

10 CHE Research Paper 110
Table 4 Unmapped RC community ‘other mental health care’ categories, 2011/12 and 2012/13
Community care
In 2012/13, four new community services groupings were created: Allied Health Professionals, Health Visiting and Midwifery, Medical and Dental, and Nursing. These amalgamated the 17 different groups in which community care services were previously categorised. Table 5 below lists the old and new groupings and provides a mapping of the old groups to the new ones. However, service codes used to classify community services within the different groupings have changed, so no further mapping of activity has been possible and we use the imputation method to impute missing cost information (Castelli et al. 2011).
Table 5 Community Services, new and old groupings with mapping
* Activity recorded under grouping 'Other Community Services' are now split between 'Community Health Services - Allied Health Professionals' and 'Community Health Services - Medical and Dental'
Service
codeService description Currency code Currency description
- - MHIPC2 Drug Services: Children and adolescents
- - MHIPC3 Alcohol Services: Children and adolescents
Service
codeService description Currency code Currency description
DAS Drug and Alcohol Services ALCCOP Alcohol Services, Children and Adolescents, Outpatient Attendances
MHST Mental Health Specialist Teams MHSTDAA Drug and Alcohol Services, Adult and Elderly
MHST Mental Health Specialist Teams MHSTDAC Drug and Alcohol Services, Children and Adolescents
MHST Mental Health Specialist Teams MHSTEDA Eating Disorder Services, Adult and Elderly
MHST Mental Health Specialist Teams MHSTEDC Eating Disorder Services, Children and Adolescents
MHST Mental Health Specialist Teams MHSTFA Forensic Community, Adult and Elderly
MHST Mental Health Specialist Teams MHSTFC Forensic Community, Children and Adolescents
MHST Mental Health Specialist Teams MHSTIAPTA IAPT, Adult and Elderly
MHST Mental Health Specialist Teams MHSTIAPTC IAPT, Children and Adolescents
SCU Secure Mental Health Services SCU12 High Secure Unit: Dangerous and Severe Personality Disorder
SPMHS Specialist Mental Health Services SPHMSEDSACC Eating Disorder Services, Adults, Community Contacts
SPMHS Specialist Mental Health Services SPHMSEDSAOP Eating Disorder Services, Adults, Outpatient Attendances
2011/12
2012/13
Community Services groupings, 2012/3 Community Services groupings, 2004/5 - 2011/2
Community Health Services - Allied Health Professionals Community Therapy Services
Community Rehabilitation Teams
Other Community Services*
Community Health Services - Health Visiting and Midwifery Community Nursing Services: Health Visiting Services: Core Services
Community Nursing Services: Health Visiting Services: All Other Services
Community Nursing Services: Health Visiting Services: Vaccination and Immunisation
Community Nursing Services: Health Visiting Services: Post-Natal Visits
Community Midwifery Services: Visits
Community Health Services - Medical and Dental Community Medical Services: Other Services
Other Community Services*
Community Health Services - Nursing Community and Outreach Nursing Services: Specialist Nursing
Community Nursing Services: Nursing Services for Children
Community Nursing Services: District Nursing Services
Community Nursing Services: School-based Children's Health Services: Core Services
Community Nursing Services: School-based Children's Health Services: Other Services
Community Nursing Services: School-based Children's Health Services: Vaccinations

Productivity of the English NHS: 2012/13 update 11
Accident & emergency
In 2004/05 and 2005/06 Accident & Emergency services were recorded under only three macro categories: ‘Accident & Emergency HRG data’, ‘Minor Injury Unit Data’ and ‘Observation/Pre-admission/Medical Assessments Units (HRG codes)’. In 2006/07 a complete overhaul of A&E categorisation took place, with the introduction of four macro categories: ‘Emergency Departments’, ‘Minor Injury Units’, ‘NHS Walk in Centres’ and ‘Specialist Emergency Departments’. A&E activity leading to admission to hospital is recorded separately from activity that does not lead to admission. Patients treated in observation wards, whether subsequently admitted to hospital or not, continued to be reported. The four major A&E categories have since remained in place but in 2012/13, the RC data collection substituted the ‘headings’ for four categories using generic T01 – T04 codes, each of which continued to be sub-divided into patients that were subsequently admitted to hospital (AD) and those that were not (NA). The definition of type of Accident and Emergency departments provided in the HES A&E dictionary have allowed us to correctly map A&E activity reported in the RC 2012/13 collection to the categorisation system used in previous years. In 2011/12 for Accident & Emergency services, paramedic activity was discontinued and replaced with a new set of ambulance service currencies. The ‘Reference costs 2011-12’ document states that ‘these currencies have been developed and agreed with ambulance trusts and commissioners to support the contracting and payment of emergency and urgent ambulance services from April 2012. The four currencies are: (a) calls; (b) hear and treat or refer; (c) see and treat or refer; and (d) see and treat and convey’. (Department of Health 2012)(1, p. 46). The 2011/12 classification was also used for the 2012/13 RC data collection. 3.1.3 Primary care activity
Comprehensive data on the activities performed in primary care settings remain unavailable. In their absence, nationally representative survey data have been used instead. For the period 2004/05 to 2008/09 the volume of GP consultations was obtained from QResearch (Fenty et al. 2006; QResearch 2009). When this survey was discontinued, we used the General Lifestyle Survey instead, from 2009/10 to 2010/11 (Bojke et al. 2012) and since 2010/11 we have used data from the GP Patient Survey (https://gp-patient.co.uk/). The survey has been conducted twice a year since 2011, with 1,380,000 patients sent an invitation every six months. The current response rate is around 35%.6 To assess how much activity is undertaken in primary care, we look at the percentage of participants who answered that they had seen or spoken to their GP in the last 3 months. The responses are weighted to ensure they are representative of the general population. Survey data maintain the same target sample size over time. Consequently, there is an argument for adjusting responses for population growth, estimates for which are available from the Office of National Statistics.7 We derive information on costs of primary care activity from the annual estimates calculated by PSSRU, which is available online.8 We use blood pressure measurement results for three specific conditions for which data are collected as part of the Quality Outcomes Framework (QOF) as our proxy for quality measurement. The selected conditions are:
6 http://gp-survey-production.s3.amazonaws.com/archive/2013/June/June%202013%20Technical%20Annex.pdf
7 http://www.ons.gov.uk/ons/rel/pop-estimate/population-estimates-for-uk--england-and-wales--scotland-and-northern-
ireland/2013/sty-population-changes.html 8 The following link is for 2012/13 edition: http://www.pssru.ac.uk/project-pages/unit-costs/2013/

12 CHE Research Paper 110
1. Coronary heart disease (CHD06)
2. Stroke (Stroke06)
3. Hypertension (BP05)
The numbers for prevalence come from Annex 1 of QOF report.9 Data about success rates come from the Clinical results tables, available in the same report. Community prescribing
Data about community prescribing are taken from the Prescription Cost Analysis (PCA) system, supplied by the Prescription Pricing Authority via the HSCIC Prescription Drugs Team. The data are based on a full analysis of all prescriptions dispensed in the community, summarised into almost 8,000 categories defined according to chemical composition. The data include information about the Drug code (PropGenLinkCode), Net Ingredient Cost (NIC), Quantity of Drug Dispensed in 1000’s and Number of Prescription Items . The data are complete and prices are available for all items across the years. The number of categories changes throughout the years, with the peak in 2001/02 (9,512 categories) and the low in 2012/13 (7,699 categories used). We impute past prices when new chemical compositions appear.
3.2 Measuring input
Inputs into the health care system consist of:
Labour, such as doctors, nurses, technicians and managers;
Intermediate goods and services, such as drugs and clinical supplies;
Capital, such as buildings and equipment with an asset life of more than a year.
Table 6 Summary of input data sources
Input type Data source Deflator Notes for 2011/12-2012/13
NHS staff Electronic staff record CHE pay index from ESR data NHS staff Organisational accounts CHE pay index from ESR data Agency staff Organisational accounts
DH CHE pay index from ESR data No longer possible to identify agency
spend from accounts Intermediates Organisational accounts NHS prices index Capital Organisational accounts NHS prices index No longer possible to identify
expenditure on specific capital items General medical, dental, ophthalmic care
DH NHS pay index and NHS pay & prices index
Prescribing Prescription cost analysis
system CHE pharmacy price index
Central Administration
DH NHS pay & prices index
We construct a comprehensive index of input growth, using the workforce data and organisational accounts submitted by all NHS organisations to quantify the amount of all inputs used in the production of health care provided to NHS patients. These data sources are summarised in Table 6.
9 http://www.hscic.gov.uk/catalogue/PUB12262

Productivity of the English NHS: 2012/13 update 13
3.2.1 NHS Staff Data
Workforce and earnings data are obtained from the NHS iView database https://iview.ic.nhs.uk/ which draws data directly from the Electronic Staff Records (ESR), and combined Payroll and Human Resources system for the NHS. The data contain numbers of full time equivalent (FTEs) staff and earnings by 480 different occupational groups for all staff employed in the NHS, by organisation.10 Where 5 or less staff members are employed in a particular staff group, the organisation randomly reports either 5 or 0. For this reason, the reported total number of staff constructed using the ESR source data differs from the aggregated figures published by the HSCIC.11 The number of organisations captured in ESR changes every year (Table 7). This is partly due to creation of new organisations, discontinuation of others, and mergers. However, the difference is also due to increasing scope of organisations that report to ESR. Table 7 Number of reporting entities by organisation type
Organisation type 2007/08 2008/09 2009/10 2010/11 2011/12 2012/13
Care Trusts 10 10 11 11 10 10 NHS Bodies
a 3 3 5
Non-geographical staffb 1 1
PCTs 147 147 147 148 143 133 SHA 10 10 10 10 10 10 Special Health Authorities
c 12 12 12 10 10 12
NHS Trusts 230 230 231 236 249 249 CCGs 9 a NHS Bodies include Choose and Book (X09), NHS England (X24), HSCIC (X26), Primary Care Support Service (YDD85), Sussex Health Informatics Service (YDD81). b Non-Geographic Central Staff; code AHO c Examples of Special Health Authorities included in the list are NICE, National Patient Safety Agency, NHS Blood and Transplant and National Treatment Agency.
There have also been changes in the number of occupational codes used over years. Table 8 presents the mean number of occupational codes used by different organisational types. Table 8 Mean number occupational codes
Organisation type 2007/08 2008/09 2009/10 2010/11 2011/12 2012/13
Care Trust 39.4 41.9 41.2 42.1 36.5 30.4 NHS Bodies 3 2.7 2.8 Non-geographical staff 91 73 PCTs 44.3 45.9 46.3 45.3 36.1 14.5 SHA 5.2 6 5.7 5.1 5 4.7 Special Health Authorities 8.8 9.27 9.2 10.4 8.3 7.83 NHS Trusts 77.3 79.7 81.3 83.2 88.6 91.4 CCG 7.2
Incidently it is possible to look at individual occupational codes over time. We observe increases in FTEs for several occupational codes; one of the biggest increases is for N6A (1st level Acute, elderly & general nurses), with an average increase of around 3,000 FTEs per year.
10
We drop ESR returns made by private providers. 11
https://iview.hscic.gov.uk/DomainInfo/WorkforceMonthly. Note that HSCIC does publish small numbers in some of their workforce
data releases, for examples visit http://www.hscic.gov.uk/catalogue/PUB13776/comp-of-neur-data-work_V2.xlsx

14 CHE Research Paper 110
Table 9 Expenditure on labour in current prices (£m)
Organisation type 2007/08 2008/09 2009/10 2010/11 2011/12 2012/13
Care Trust 374 402 444 466 380 365 NHS Bodies 54 65 61 Non-geographical staff
146 138
PCT 5,022 5,490 5,994 5,851 3,792 1,320 SHA 90 113 129 131 112 109 Special Health Authorities
493 524 576 502 424 435
NHS Trusts 23,790 25,514 27,171 28,160 31,196 33,269 CCG 7
The data on staff earnings come from a separate dataset, also provided by HSCIC, which includes all earnings data submited by NHS organisations for staff paid directly by the NHS. This dataset contains average earnings by occupational group. The following fields are available:12
- Basic Pay Per Fte 12 Month
- Total Earnings 12 Month
- Basic Pay 12 Month
- Non Basic Pay 12 Month
In our calculation we sum together Basic Pay Per Fte 12 Month and non-basic pay to get total earnings for a particular staff group. As non-basic pay is no longer reported by FTEs, but only by headcount, we multiply that number first by an appropriate ratio to get the equivalent FCE number (as advised by HSCIC). With the earnings information, we can also observe the change in associated cost by different organisation types, as summarised in Table 9. 3.2.2 Expenditure data
The source of expenditure data has changed over time, by type of organisation, as summarised in Table 10. Data for Foundation Trusts is derived from the Consolidated NHS Financial Trust Accounts, the format of which has remained unchanged over the full period. These accounts are less detailed than Trust Financial Returns (TFRs), which were reported by NHS trusts, PCTs and SHAs up to and including 2011/12 and provided a detailed breakdown of expenditure on different types of NHS and agency staff, intermediate inputs and capital items. The TFRs were discontinued in 2011/12 for PCTs and SHAs. For these organisations we have relied on aggregated information as reported in the DH Annual Report and Accounts. For NHS Trusts, TFRs were replaced with Financial Monitoring and Accounts, with both reporting systems used in 2011/12. The Financial Monitoring and Accounts are much less detailed than the TFRs, reporting information for very broad categories of input type, making it no longer possible to report time series for input types. For instance, it is not possible to identify expenditure by NHS Trusts on agency staff from this information.13 Instead, we have used data provided by the Department of Health to identify recent expenditure on agency staff.
12
In the past we had information on total earnings per month, without separation in basic/non-basic 13
http://www.parliament.uk/business/publications/written-questions-answers-statements/written-question/Commons/2014-10-
22/211600/

Productivity of the English NHS: 2012/13 update 15
Table 10 Source of financial information
Other than loss of detail, the more aggregated data has two major implications for the construction of the input index:
1. Rather than input-specific price deflators, we now have to apply deflators for each aggregated input category. This may generate inaccuracy in distinguishing the contributions of changes in volume and prices to expenditure growth.
2. The detail in the financial returns made it possible to account for utilisation of different types of capital in each period, albeit subject to various assumptions about asset life and depreciation (Street and Ward 2009). The annual accounts, however, do not identify all items of capital. This makes it impossible to ascertain how much has been spent on capital in each period, let alone how much of the capital acquired has been utilised.
The financial reporting lines designated as intermediate and capital items in the most recent financial data are listed in Table 11 for NHS Trusts and PCTs/SHAs.
Table 11 Intermediate and capital items
Intermediates Capital
NHS Trusts Source: Financial Monitoring & Accounts
Services from Other NHS Trusts Services from PCTs Services from Other NHS Bodies Services from Foundation Trusts Purchase of Healthcare from Non-NHS Bodies Supplies & Services - Clinical Supplies & Services - General Consultancy Services Transport Audit fees Other Auditors Remuneration Clinical Negligence Research & Development (excluding staff costs) Education & Training Other
Establishment Premises Impairments & Reversals of Receivables Inventories write downs Depreciation Amortisation Impairments & Reversals of Property, Plant & Equipment Impairments & Reversals of Intangible Assets Impairments & Reversals of Financial Assets Impairments & Reversals for Non Current Assets held for sale Impairments & Reversals for Investment Properties
PCTs/SHAs Source: DH Annual Report & Accounts
Consultancy Services Transport Clinical Negligence Costs Education, Training & Conferences Supplies & Services - Clinical Supplies & Services - General Inventories consumed Research & Development Expenditure Other
Establishment Premises Impairment of Receivables Rentals under operating leases Depreciation Amortisation Impairments & reversals
Foundation Trusts
NHS Trusts
PCTs/SHAs Trust Financial ReturnsDH Annual Report and
Accounts
2004/5 - 2011/12 2011/12 - 2012/13
2004/5 - 2012/13
Financial Monitoring
and AccountsTrust Financial Returns
Consolidated NHS Financial Trust Accounts

16 CHE Research Paper 110
Reassuringly, at national level the TFRs, FT consolidated accounts and Financial Monitoring and Accounts provide a similar indication of the total amount of expenditure for aggregated types of input as does the DH Annual Report and Accounts. This is shown for comparison of expenditure on NHS staff in 2010/11 and 2011/12 in Table 12, although the Financial Monitoring and Accounts tend to record slightly higher amounts of expenditure. Table 12 Comparison of alternative sources of financial information
2010/11 2011/12 2012/13
TFRs or FTAs DH Accounts %diff TFRs or FTAs DH Accounts %diff
FMA or FTAs
DH Accounts
%diff
Trusts (+) 18,848,608 18,774,442 0.40% 19,708,849 19,821,928 -0.57% 19,239,185 19,321,825 -0.43%
FT (*) 19,374,343 19,654,469 -1.43% 22,939,040 23,140,959 -0.87% 24,558,750 24,667,368 -0.44%
PCTs (+) 7,175,399 7,362,709 -2.54% 2,328,314 2,358,373 -1.27% n/a n/a n/a
SHAs (+) 243,378 263,983 -7.81% 256,504 259,805 -1.27% n/a n/a n/a
TOTAL 45,641,728 46,055,603 -0.90% 45,232,708 45,581,065 -0.76%
Note: (+) TFRs: Trust Financial Returns; (*) FTA: Consolidated NHS Financial Trust Accounts; FMA Financial Monitoring and Accounts; DH Accounts: DH Annual Report and Accounts.
3.3 Measuring productivity
We report estimates for two different formulations of the productivity index. These differ in how they account for growth in NHS labour inputs. Our MIXED index uses information recorded in the Electronic Staff Records; our INDIRECT method uses expenditure data only.

Productivity of the English NHS: 2012/13 update 17
4. Output growth
4.1 Hospital activity
Summary statistics about the volume of and quality of elective, non-elective and outpatient activity are reported in Tables 13-15. Trends in the volume of activity, 30-day survival rates and waiting times from a baseline of 2004/05 are shown in Figures 1-3. Note that there is a break in the data series in 2011/12 for elective and non-elective activity, due to a change in the method used to calculate continuous inpatient spells (CIPS). We present figures using both methods for 2011/12, and the dual set of figures ensures that year-on-year comparisons are not compromised by the change in the CIPS methodology. Table 13 Hospital output: electives and day cases
Year Hospital output
Elective and day cases
Volume of activity
Average cost (c)
Quality indicators
30-day survival
rate Mean age
Mean life expectancy
80th
percentile
waiting times
Mean waiting times
2004/05 6,433,933 1,031 99.38% 53.6 23.7 104 71
2005/06 6,864,612 1,041 99.47% 53.9 23.7 95 67
2006/07 7,194,697 1,036 99.51% 54.4 23.6 89 65
2007/08 7,598,796 1,091 99.72% 54.6 23.5 74 57
2008/09 8,148,229 1,147 99.74% 55.0 23.2 60 51
2009/10 8,465,757 1,227 99.76% 55.3 23.4 65 57
2010/11(a) 8,755,081 1,263 99.78% 55.7 23.4 76 62
2011/12(a) 8,947,134 1,287 99.78% 56.0 23.3 85 67
2011/12(b) 8,946,909 1,287 99.45% 56.0 23.19 85 67
2012/13 (b) 9,030,530 1,341 99.50% 56.0 23.18 119 73
Notes: (a) Volume of NHS activity using CIPS calculated with the new method; (b) 2012/13 update of methodology to calculate CIPS; (c) The reported average cost does not include high-volume HRGs LA08E, PB03Z and SB97Z as they are excluded from RC;

18 CHE Research Paper 110
Table 14 Hospital output: non-electives
Year Hospital output
Non-electives
Volume of activity
Average cost (c)
Quality indicators
30-day survival
rate
Mean age
Mean life expectancy
2004/05 6,009,802 1,210 95.16% 41.6 34.1
2005/06 6,291,117 1,241 95.49% 41.6 34.3
2006/07 6,363,388 1,244 95.65% 41.6 34.6
2007/08 6,593,136 1,237 95.79% 41.4 34.7
2008/09 6,826,035 1,354 95.85% 41.9 34.4
2009/10 6,951,379 1,413 96.07% 42.1 34.6
2010/11(a) 7,109,358 1,460 96.05% 42.2 34.8
2011/12(a) 7,054,224 1,506 96.12% 42.7 34.7
2011/12(b) 7,049,528 1,498 96.62% 43.0 34.6
2012/13 (b) 7,327,228 1,532 96.45% 44.0 34.1
Notes: (a) Volume of NHS activity using CIPS calculated with the new method; (b) 2012/13 update of methodology to calculate CIPS; (c) The reported average cost does not include high-volume HRGs LA08E, PB03Z and SB97Z as they are excluded from RC
Table 15 Hospital output: outpatients
Year Hospital Output
Outpatient
Volume of activity
Volume of activity (b)
Average cost
Quality indicator
Mean waiting times
2004/05 52,724,302
106 52
2005/06 60,541,477
103 46
2006/07 63,453,507
93 41
2007/08 69,678,564
94 24 37
2008/09 74,421,017
98 22 34
2009/10 76,761,100
99 24 36
2010/11(a) 81,263,904 80,404,193 105
37
2011/12(a) 75,863,819 82,197,237 108
37
2012/13 77,222,725 83,853,264 111
38
Notes: (a) Due to changes in PCT reporting, the activity numbers for 2011/12 are not comparable to data reported in previous years; (b) Derived from the HES Outpatient Minimum Database.
Table 13 and Figure 1 show a 40.4% increase in the volume of elective activity between 2004/05 and 2012/13, with the increase amounting to 0.9% in the final pair of years. In terms of quality, 30-day survival rates have continued to improve year-on-year, as indicated in Figure 2. For elective patients, the 30-day survival rate was 99.78% in 2011/12, up from 99.38% in 2004/05. The change in how CIPS are calculated means that survival rates are not comparable to previous years, but elective survival rates continued to improve between 2011/12 and 2012/13, from 99.45% to 99.50%.
Trends in inpatient and outpatient waiting times are depicted in Figure 3. Waiting times declined year-on-year from 2004/05 to 2008/09, when they reached their lowest level, amounting to 51 days

Productivity of the English NHS: 2012/13 update 19
at the mean and 60 days at the 80th percentile of the distribution. But, as can be seen, inpatient waiting times (measured at both the mean and the 80th percentile) have been lengthening year by year since 2008/09, the mean being 73 days and the 80th percentile being 119 days in 2012/13. Outpatient waiting times also fell year-on-year between 2004/05 and 2008/09, before starting to increase in 2009/10; in 2012/13 the wait was 38 days compared to 34 days in 2008/09. As shown in Table 14, the volume of non-elective activity increased by 21.9% between 2004/05 and 2012/13, the increase amounting to 3.9% between 2011/12 and 2012/13. 30-day survival rates improved year on year up to 2011/12. The rate for non-elective patients was 96.12% in 2011/12 compared to 95.16% in 2004/05. However, survival rates based on CIPS constructed with the new methodology decreased between 2011/12 and 2012/13, from 96.62% to 96.45%. Data about outpatient attendances is summarised in Table 15. There has been a 28.3% growth in outpatient attendances over the period 2004/5 to 2012/13, with a 2.0% increase between 2011/12 and 2012/13.
Figure 1 Trends in hospital activity
0.9
1
1.1
1.2
1.3
1.4
1.5
1.6
1.7
20
04
/5
20
05
/6
20
06
/7
20
07
/8
20
08
/9
20
09
/10
20
10
/11
20
11
/12
20
12
/13
Elective and day cases (a) Elective and day cases (b)
Non-electives (a) Non-electives (b)
Outpatient - RC Outpatient - HES OMD

20 CHE Research Paper 110
Figure 2 30-day survival rates
Figure 3 Trends in mean waiting times
4.2 Inpatient and community mental health
Summary statistics reporting the constituent elements used to assess the output of care delivered to mental health patients treated in hospital following elective admission are shown in Table 16, with similar statistics for non-elective admissions in Table 17 and for those treated in community and mental health trusts in Table 18. In all three tables there is a break in how data were reported in 2011/12. For elective and non-elective activity, this was due to the change in the CIPS methodology, as explained in the previous section. The ability to calculate CIPS in 2011/12 using both methods means that the change can easily be accommodated in our calculation of output growth. Unfortunately, the same cannot be said of the change in the approach to the Reference Costs collection of activity in community and mental health trusts. The approach was subject to a
94%
95%
96%
97%
98%
99%
100%
20
04
/5
20
05
/6
20
06
/7
20
07
/8
20
08
/9
20
09
/10
20
10
/11
20
11
/12
20
12
/13
Elective and day cases (a) Elective and day cases (b)
Non-electives (a) Non-electives (b)
0
10
20
30
40
50
60
70
80
20
04
/5
20
05
/6
20
06
/7
20
07
/8
20
08
/9
20
09
/10
20
10
/11
20
11
/12
20
12
/13
Elective and day cases (a) Elective and day cases (b)
Outpatient - old source Outpatient - new source
Productivity of the English NHS: 2012/13 update 21
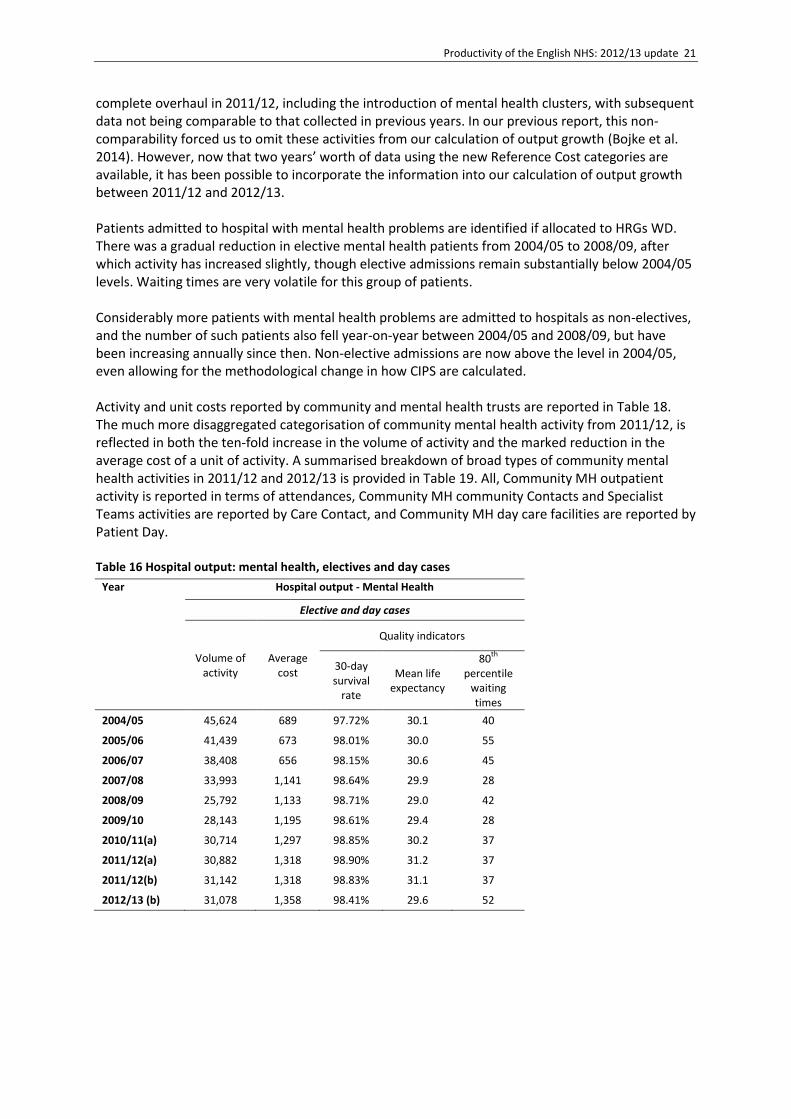
complete overhaul in 2011/12, including the introduction of mental health clusters, with subsequent data not being comparable to that collected in previous years. In our previous report, this non-comparability forced us to omit these activities from our calculation of output growth (Bojke et al. 2014). However, now that two years’ worth of data using the new Reference Cost categories are available, it has been possible to incorporate the information into our calculation of output growth between 2011/12 and 2012/13. Patients admitted to hospital with mental health problems are identified if allocated to HRGs WD. There was a gradual reduction in elective mental health patients from 2004/05 to 2008/09, after which activity has increased slightly, though elective admissions remain substantially below 2004/05 levels. Waiting times are very volatile for this group of patients. Considerably more patients with mental health problems are admitted to hospitals as non-electives, and the number of such patients also fell year-on-year between 2004/05 and 2008/09, but have been increasing annually since then. Non-elective admissions are now above the level in 2004/05, even allowing for the methodological change in how CIPS are calculated. Activity and unit costs reported by community and mental health trusts are reported in Table 18. The much more disaggregated categorisation of community mental health activity from 2011/12, is reflected in both the ten-fold increase in the volume of activity and the marked reduction in the average cost of a unit of activity. A summarised breakdown of broad types of community mental health activities in 2011/12 and 2012/13 is provided in Table 19. All, Community MH outpatient activity is reported in terms of attendances, Community MH community Contacts and Specialist Teams activities are reported by Care Contact, and Community MH day care facilities are reported by Patient Day. Table 16 Hospital output: mental health, electives and day cases
Year Hospital output - Mental Health
Elective and day cases
Volume of activity
Average cost
Quality indicators
30-day survival
rate
Mean life expectancy
80th
percentile
waiting times
2004/05 45,624 689 97.72% 30.1 40
2005/06 41,439 673 98.01% 30.0 55
2006/07 38,408 656 98.15% 30.6 45
2007/08 33,993 1,141 98.64% 29.9 28
2008/09 25,792 1,133 98.71% 29.0 42
2009/10 28,143 1,195 98.61% 29.4 28
2010/11(a) 30,714 1,297 98.85% 30.2 37
2011/12(a) 30,882 1,318 98.90% 31.2 37
2011/12(b) 31,142 1,318 98.83% 31.1 37
2012/13 (b) 31,078 1,358 98.41% 29.6 52

22 CHE Research Paper 110
Table 17 Hospital output: mental health, non-electives
Year Hospital output - Mental Health
Non-electives
Volume of activity
Average cost
Quality indicators
30-day survival
rate
Mean life expectancy
2004/05 123,983 1,012 96.96% 28.7
2005/06 120,203 1,012 97.22% 28.9
2006/07 115,560 1,012 97.38% 29
2007/08 112,475 1,364 97.65% 27.7
2008/09 109,636 1,319 97.56% 27.3
2009/10 121,610 1,365 97.68% 27.7
2010/11(a) 125,823 1,445 97.63% 27.8
2011/12(a) 130,654 1,489 97.70% 27.8
2011/12(b) 135,315 1,318 97.78% 27.3
2012/13 (b) 150,382 1,358 97.61% 26.9
Notes:(a) 2011/12 update of methodology to calculate CIPS; (b) 2012/13 update of methodology to calculate CIPS; (c) Due to reclassification of activity in Community Mental Health 2011/12 data are not comparable with data reported in previous years.
Table 18 Community mental health
Year Community Mental Health
Volume of activity
Volume of activity (a)
Average cost
2004/05 16,389,891
164
2005/06 17,738,894
170
2006/07 19,259,205
167
2007/08 21,751,043
153
2008/09 22,674,811
157
2009/10 23,440,616
161
2010/11 24,341,950
159
2011/12
224,329,080 28
2012/13
260,266,214 24
Notes: (a) Due to reclassification of activity in Community Mental Health, data is not directly comparable with data reported in previous years.

Productivity of the English NHS: 2012/13 update 23
Table 19 Community mental health activity, 2011/12 & 2012/13
Community mental health
2011/12 2012/13
Volume of activity
Average cost (£)
Volume of activity
Average cost (£)
Care Clusters
Mental Health – Care Clusters – Admitted Patient Care 5,900,173 334 5,548,751 348
Mental Health - Care Clusters - Non-Admitted Patient Care
208,657,970 11 244,072,900 9
Mental Health – Care Clusters – Initial Assessment 418,356 251 816,112 264
Total volume ‘Mental Health Care Clusters’ 214,976,499 20 250,437,763 17
Other Mental Health
Secure Units 1,537,140 523 1,526,840 532
Day Care Facilities: Regular Attendances 28,782 294 34,969 294
Outpatient Attendances* 1,343,458 156 615,632 217
Community Contacts 3,309,410 135 2,970,529 161
Specialist Teams 3,133,791 140 4,680,481 120
Total volume Other Mental Health 9,352,581 204 9,828,451 203.28
Total volume of Community MH activity 224,329,080 28 260,266,214 24
Community mental health outpatient attendances (marked with *) were reported for the first time in 2011/12. With two years’ worth of data, we are now able to include this activity in the productivity measure for 2011/12 – 2012/13. Figure 4 shows the trends in the volume of both elective and non-elective MH activity.
Figure 4 Trends in mental health activity
4.3 Community care
While the provision of community care has increased over time, the year-on-year trends in activity have not always been positive (Table 20 and Figure 5). Indeed, activity declined between 2005/06 and 2006/07 and then again between 2009/10 and 2010/11. There was a steep decline between
0
0.2
0.4
0.6
0.8
1
1.2
1.4
20
04
/5
20
05
/6
20
06
/7
20
07
/8
20
08
/9
20
09
/10
20
10
/11
20
11
/12
20
12
/13
Elective and day cases (a) Elective and day cases (b)
Non-electives (a) Non-electives (b)

24 CHE Research Paper 110
2010/11 and 2011/12, with the number of contacts declining from 90.7m to 78.3m. Some of this decrease may have been genuine, but some may have been due to less comprehensive data collection in the NHS, with data previously reported by the since abolished PCTs not being captured fully in the data returns made by the organisations that took over responsibility for this activity (Bojke et al. 2014). Organisational coverage is more likely to have been consistent between 2011/12 and 2012/13, the data suggesting a 1.8% increase in community care activity. Table 20 Community care activity
Year Community care
Volume of activity (a)
Average cost
2004/05 75,673,792 39
2005/06 85,092,838 38
2006/07 83,895,139 40
2007/08 85,470,688 42
2008/09 88,513,663 45
2009/10 92,412,727 46
2010/11 90,724,524 47
2011/12 (a) 78,315,576 50
2012/13 (a) 79,709,044 52
Notes: (a) In 2011/12, PCTs and PMS ceased to report activity about community care. Total volume of activity from 2011/12 is, therefore, not comparable with previous years.
Figure 5 Trends in community care activity
60,000,000
65,000,000
70,000,000
75,000,000
80,000,000
85,000,000
90,000,000
95,000,000
20
04
/5
20
05
/6
20
06
/7
20
07
/8
20
08
/9
20
09
/10
20
10
/11
20
11
/12
20
12
/13
Community Care

Productivity of the English NHS: 2012/13 update 25
4.4 Primary care
Primary Care consultations
Data about the number and cost of consultations are reported in Table 21, broken down by consultation type. Prior to 2008/09, data about the volume and type of consultations were derived from QResearch (Fenty et al. 2006). After 2008/09, we have had access only to aggregated data from the GP Patient Survey from which it is possible to derive estimates of the number but not the type of consultations by survey respondents. Consequently, the breakdown of consultation types is based on the 2008/09 QResearch data with the assumption that the mix of consultations has remained constant over time. From 2009/10 we have used the weighted GP Patient Survey responses, which are adjusted to make the data more representative of the population as a whole. Responses are weighted by local factors including deprivation, crime levels, ethnicity, marital status, overcrowding in households, household tenure and employment status.14 The GP Patient Survey suggests that the number of consultations fell between 2009/10 and 2010/11 but have increased subsequently. Trends in the volume of primary care activity are depicted in Figure 6. Table 21 Primary care consultations derived from survey data
GP Home
visit GP
Telephone GP
Surgery GP Other
Practice Nurse
Other Clinicians
Total
2004/05 Activity 5,800 12,500 148,300 4,200 84,600 10,200 265,600
Cost 69 30 24 24 10 15 20
2005/06 Activity 6,000 14,000 153,900 4,800 93,700 10,700 283,100
Cost 69 27 24 24 10 15 20
2006/07 Activity 5,900 15,100 156,600 5,000 99,000 11,400 293,000
Cost 55 21 34 34 9 14 25
2007/08 Activity 5,900 16,200 155,800 4,800 98,500 11,300 292,500
Cost 58 22 36 36 11 15 26
2008/09 Activity 6,000 18,700 158,800 5,500 100,600 10,800 300,400
Cost 117 21 35 35 11 14 27
2009/10(a) Activity 6,000 18,700 158,800 5,500 100,600 10,800 300,400
Cost 120 22 36 36 12 17 28
2010/11(a) Activity 5,844 18,212 154,659 5,357 97,977 10,518 292,567
Cost 121 22 36 36 13 25 29
2011/12(a) Activity 6,067 18,909 160,578 5,562 101,726 10,921 303,764
Cost 110 26 43 43 14 25 33
2012/13(a) Activity 6,160 19,200 163,047 5,647 103,290 11,089 308,433
Cost 114 27 45 45 13 25 34
Note: (a) General Practice consultations are estimated using the GP Patient Survey
14
https://gp-patient.co.uk/faq/weighted-data

26 CHE Research Paper 110
Figure 6 Trends In primary care consultations and prescribing
The GP patient survey aims to maintain a constant sample size in successive waves, and responses need to be scaled up by population size in order to derive annual estimates of the number of consultations for the English population as a whole. The ONS estimates for population growth for the last 10 years for the UK as a whole are in Table 22. After taking account of increases in the size of the population, growth in the volume of consultations between 2011/12 and 2012/13 is estimated to be 2.39% rather than 1.54%. Table 22 Estimates of population growth
Mid-Year Mid-Year Population (millions)
Annual Percentage Change
2004 60.0 0.53
2005 60.4 0.77
2006 60.8 0.68
2007 61.3 0.81
2008 61.8 0.82
2009 62.3 0.71
2010 62.8 0.80
2011 63.3 0.84
2012 63.7 0.66
2013 64.1 0.63
Our estimates of primary care activity also allow for changes in the quality of consultation. This is captured by improvements in blood pressure control for patients with coronary heart disease (CHD), stroke and hypertension. Table 23 reports the trends in prevalence and achievement as measured in the Quality and Outcomes Framework (QOF) for these conditions. The trend in QOF achievement has been positive for all three conditions since 2004/05, with almost universal year-on-year improvements.
0.9
1
1.1
1.2
1.3
1.4
1.5
Number of consultations - old source
Number of consultations - new source
Number of prescriptions

Productivity of the English NHS: 2012/13 update 27
Table 23 Rates of prevalence and achievement in reducing blood pressure
Year Prevalence QOF achievement
CHD Stroke Hypertension CHD Stroke Hypertension
2004/05 3.57 1.63 10.41 78.60 73.13 64.33
2005/06 3.57 1.66 11.48 84.44 81.22 71.05
2006/07 3.54 1.61 12.49 88.86 86.92 77.62
2007/08 3.50 1.63 12.79 89.41 87.51 78.35
2008/09 3.47 1.66 13.13 89.68 87.88 78.56
2009/10 3.44 1.68 13.35 89.77 88.12 78.72
2010/11 3.40 1.71 13.52 90.16 88.57 79.30
2011/12 3.38 1.74 13.63 90.14 88.61 79.65
2012/13 3.40 1.70 13.68 90.57 89.26 80.79
Growth in primary care consultations is reported in Table 24. The survey data suggest that the number of primary care consultations increased by 1.54% between 2011/12 and 2012/13. Scaled up to account for the population growth, such activity is estimated to have increased by 2.39%. Finally after taking account of the quality of consultations, the growth in primary care consultations amounts to 2.45%. Table 24 Growth in primary care consultations
Number of
visits
Population adjusted
number of visits
Population and quality
adjusted number of
visits
Growth rate Population
adjusted growth rate
Population and quality and quality
adjusted growth rate
2004/05 265,600* 265,600 274,122
2005/06 283,100* 283,100 295,289 6.59% 6.59% 7.15%
2006/07 293,000* 293,000 309,501 3.50% 3.50% 4.01%
2007/08 292,500* 292,500 311,375 -0.17% -0.17% -0.07%
2008/09 300,400* 300,400 322,662 2.70% 2.70% 2.79%
2009/10 300,400 311,959 325,487 0.00% 2.75% 2.82%
2010/11 292,567 305,435 319,456 -2.61% -1.11% -0.99%
2011/12 303,764 319,661 334,468 3.83% 4.66% 4.70%
2012/13 308,433 327,301 342,667 1.54% 2.39% 2.45%
* These figures, derived from QResearch, are already population adjusted
28 CHE Research Paper 110
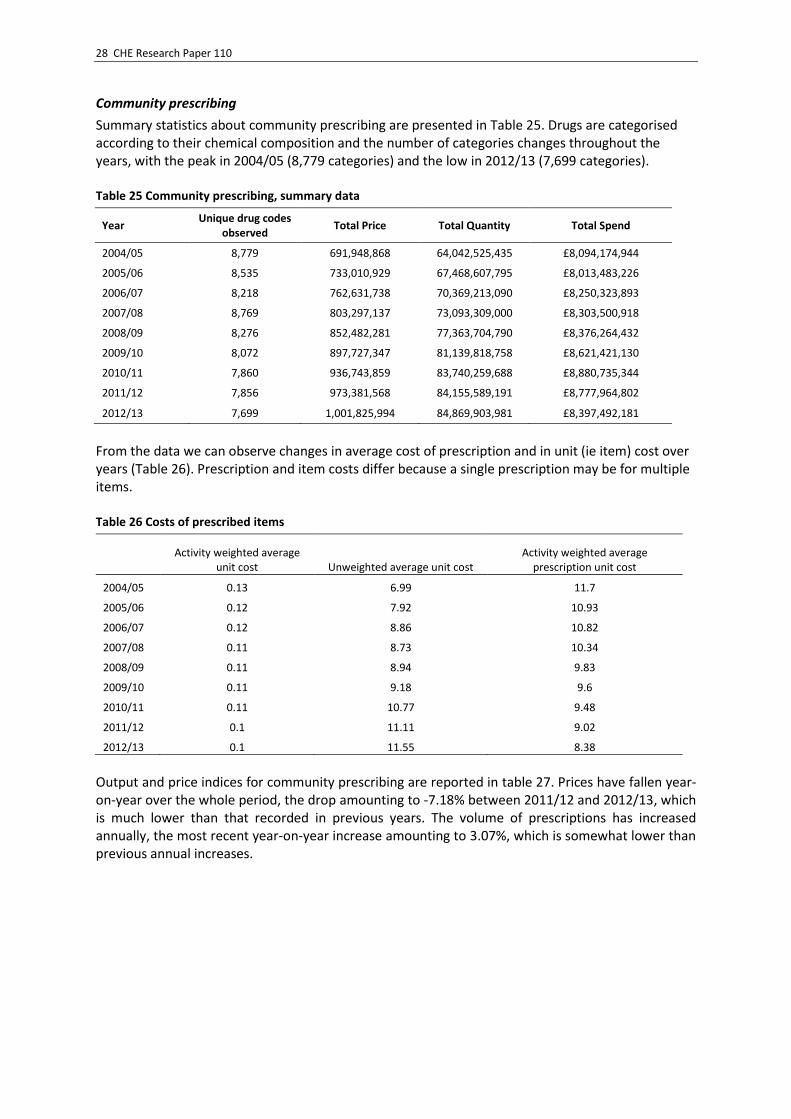
Community prescribing
Summary statistics about community prescribing are presented in Table 25. Drugs are categorised according to their chemical composition and the number of categories changes throughout the years, with the peak in 2004/05 (8,779 categories) and the low in 2012/13 (7,699 categories). Table 25 Community prescribing, summary data
Year Unique drug codes
observed Total Price Total Quantity Total Spend
2004/05 8,779 691,948,868 64,042,525,435 £8,094,174,944
2005/06 8,535 733,010,929 67,468,607,795 £8,013,483,226
2006/07 8,218 762,631,738 70,369,213,090 £8,250,323,893
2007/08 8,769 803,297,137 73,093,309,000 £8,303,500,918
2008/09 8,276 852,482,281 77,363,704,790 £8,376,264,432
2009/10 8,072 897,727,347 81,139,818,758 £8,621,421,130
2010/11 7,860 936,743,859 83,740,259,688 £8,880,735,344
2011/12 7,856 973,381,568 84,155,589,191 £8,777,964,802
2012/13 7,699 1,001,825,994 84,869,903,981 £8,397,492,181
From the data we can observe changes in average cost of prescription and in unit (ie item) cost over years (Table 26). Prescription and item costs differ because a single prescription may be for multiple items. Table 26 Costs of prescribed items
Activity weighted average unit cost Unweighted average unit cost
Activity weighted average prescription unit cost
2004/05 0.13 6.99 11.7
2005/06 0.12 7.92 10.93
2006/07 0.12 8.86 10.82
2007/08 0.11 8.73 10.34
2008/09 0.11 8.94 9.83
2009/10 0.11 9.18 9.6
2010/11 0.11 10.77 9.48
2011/12 0.1 11.11 9.02
2012/13 0.1 11.55 8.38
Output and price indices for community prescribing are reported in table 27. Prices have fallen year-on-year over the whole period, the drop amounting to -7.18% between 2011/12 and 2012/13, which is much lower than that recorded in previous years. The volume of prescriptions has increased annually, the most recent year-on-year increase amounting to 3.07%, which is somewhat lower than previous annual increases.

Productivity of the English NHS: 2012/13 update 29
Table 27 Community prescribing: price and volume growth
Year Paasche
Price Laspeyres Volume
2004/05 to 2005/06 -9.87% 9.84%
2005/06 to 2006/07 -3.41% 6.59%
2006/07 to 2007/08 -6.24% 7.35%
2007/08 to 2008/09 -5.15% 6.36%
2008/09 to 2009/10 -3.74% 6.93%
2009/10 to 2010/11 -1.67% 4.76%
2010/11 to 2011/12 -4.36% 3.35%
2011/12 to 2012/13 -7.18% 3.07%
Taking the base year as 2004/05, trends in the volume and prices of pharmaceuticals are shown in Figure 7.
Figure 7 Price and volume changes for community prescribed pharmaceuticals
4.5 A&E activity and ambulance services
Table 28 reports summary statistics for A&E services provided in Emergency Departments and Other A&E services according to whether patients were subsequently admitted to hospital (AD) or not (NAD). Emergency departments offer a consultant-led 24 hour service with full resuscitation facilities and designated accommodation for the reception of A&E patients.15 Between 2011/12 and2012/13 there was a slight increase (1.3%) in the total number of emergency department attendances, but a substantial shift toward more people being admitted. Other A&E services capture activities carried out in either of the following departments: ‘Consultant led mono specialty accident and emergency services (e.g. ophthalmology, dental) with designated accommodation for the reception of patients’, ‘Other type of A&E/minor injury activity with designated accommodation for the reception of accident and emergency patients’ and ‘NHS Walk-in-Centres’.
15
http://www.hscic.gov.uk/article/3966/HES-AE-Data-Dictionary

30 CHE Research Paper 110
Table 28 A&E activity
Year Emergency Departments Other A&E services
AD NAD AD NAD
Volume of activity
Average cost
Volume of activity
Average cost
Volume of activity
Average cost
Volume of activity
Average cost
2006/07 3,464,869 107 10,327,147 83 281,135 50 3,900,718 36
2007/08 3,326,719 121 9,058,765 89 531,498 70 3,769,765 43
2008/09 3,566,642 118 9,708,958 99 1,000,986 49 4,184,796 49
2009/10 4,047,176 134 10,075,701 103 1,090,650 49 3,628,469 50
2010/11 4,004,868 141 9,881,747 108 1,145,125 62 3,800,261 55
2011/12 4,040,760 157 10,405,762 108 616,812 83 3,253,452 52
2012/13 4,345,100 160 10,292,933 115 362,656 90 3,426,231 59
Legend: AD – leading to admitted patient care; NAD – Not leading to admitted patient care Table 29 provides further details of about the particular location in which A&E attendances took place. It is notable that the amount of recorded activity in each location is often subject to considerable year-on-year volatility, the exception being for Emergency Departments. This volatility might not reflect true variations in activity within each location but, instead, may be reflective of other factors, including:
1. Re-organisation of A&E services, particularly Minor Injuries Units and Walk in Centres. 2. With PCTs being replaced by CCGs in 2011/12, comprehensive data returns cannot be
guaranteed, and data quality may have suffered. Note that the HSCIC think that this might also have affected A&E HES: “During the period covered (2011-12 and 2012-13) not all NHS trusts have provided data submissions to A&E HES and data quality can be poor for some fields.”16
3. There may have been changes in policy regarding admission.
16
http://www.hscic.gov.uk/searchcatalogue?productid=14120&q=title%3a%22accident+and+emergency+attendances%22&topics=0%2fHospital+care&sort=Relevance&size=10&page=1#top

Productivity of the English NHS: 2012/13 update 31
Table 29 A&E activity, by setting
2006/7 2007/8 2008/9 2009/10 2010/11 2011/12 2012/13
Volume of activity 3,464,869 3,326,719 3,566,642 4,047,176 4,004,852 4,040,760 4,345,100
Average cost (£) 107 121 129 134 141 150 160
Tot nr data
submissions761 1,264 1,375 1,397 1,440 1,454 1,451
Max nr categories 12 12 12 12 12 11 11
Volume of activity 10,327,147 9,058,765 9,708,958 10,075,701 9,881,745 10,405,762 10,292,933
Average cost (£) 83 89 95 103 108 108 115
Tot nr data
submissions1,239 1,238 1,389 1,389 1,417 1,447 1,476
Max nr categories 12 12 12 12 12 11 11
Volume of activity 157,485 229,423 445,511 526,556 555,123 199,816 203,738
Average cost (£) 51 82 50 48 64 74 64
Tot nr data
submissions162 162 200 155 193 153 184
Max nr categories 12 12 10 10 11 11 10
Volume of activity 1,777,341 1,719,295 2,082,587 1,765,714 1,982,216 1,606,657 1,917,816
Average cost (£) 43 51 53 55 61 60 63
Tot nr data
submissions298 241 357 325 335 330 386
Max nr categories 12 12 12 12 12 11 11
Volume of activity 103,148 201,979 454,852 392,242 306,514 92,610 9,397
Average cost (£) 39 51 36 48 31 42 128
Tot nr data
submissions24 20 19 26 26 6 18
Max nr categories 18 10 5 10 12 3 10
Volume of activity 1,955,262 1,635,562 1,675,406 1,605,476 1,557,066 1,251,374 1,002,613
Average cots (£) 29 34 37 40 40 42 43
Tot nr data
submissions83 59 86 96 118 36 35
Max nr categories 18 10 11 11 11 11 10
Volume of activity 20,640 100,096 100,623 171,852 283,488 324,386 149,521
Average cost (£) 95 81 105 54 90 100 122
Tot nr data
submissions34 56 50 67 63 24 104
Max nr categories 10 10 10 11 11 11 11
Volume of activity 167,977 414,908 426,803 257,279 260,979 246,717 505,802
Average cost (£) 42 44 70 75 88 53 77
Tot nr data
submissions42 79 82 103 82 25 151
Max nr categories 10 10 12 12 11 11 11
Specialist Emergency Departments (AD)
Specialist Emergency Departments (NAD)
NHS Walk in centre (AD)
NHS Walk in centre (NAD)
Emergency Departments (AD)
Emergency Departments (NAD)
Minor injury unit (AD)
Minor injury unit (NAD)

32 CHE Research Paper 110
Ambulance services were first reported using the current classification system in 2011/12. Table 30 reports summary statistics for 2011/12 and 2012/13. The unit of activity is measured in terms of calls received for the category ‘Calls; Patients for the category ‘Hear’ and Incidents for the category ‘See’. Table 30 Ambulance services
4.6 Other activities
Other types of activity reported in the Reference Costs are summarised in the following tables (31-37). The way of classifying these activities has changed somewhat over time, so rarely are the series recorded in a consistent fashion across all years. Sometimes, some recording of some types are activity are discontinued, or subsumed under other broad categories. Table 31 Chemotherapy, radiotherapy, high cost drugs, bone marrow transplant
Year Chemotherapy Radiotherapy High Cost Drugs
Bone Marrow Transplant
Volume of activity
Average cost
Volume of activity
Average cost
Volume of activity
Average cost
Volume of activity
Average cost
2004/05 777,312 363 1,622,278 113 - - 1,855 37,363
2005/06 763,806 432 1,634,156 126 - - 1,955 39,834
2006/07 1,642,444 280 1,743,490 123 26,277,491 17 - -
2007/08 846,425 406 1,613,135 559 1,332,996 305 - -
2008/09 1,428,561 448 1,710,525 157 1,322,354 473 - -
2009/10 1,414,872 505 1,835,695 163 2,412,988 384 - -
2010/11 1,515,845 515 2,001,798 161 1,288,460 818 - -
2011/12 1,769,727 505 2,492,431 137 1,372,131 902 - -
2012/13 2,525,935 387 2,717,024 127 1,511,644 878 - -
Note: In 2006/7, high cost drugs were recorded as number of procurements, after which recording was by number of patients
2011/12 2012/13
Ambulance Services
Calls
Volume of activity 8,530,563 9,120,422
Average cost (£) 8 7
Hear and treat or refer
Volume of activity 338,022 423,821
Average cost (£) 44 47
See and treat or refer
Volume of activity 1,862,892 1,997,327
Average cost (£) 173 174
See and treat and convey
Volume of activity 4,895,376 4,984,296
Average cost (£) 230 230

Productivity of the English NHS: 2012/13 update 33
Table 32 Directly accessed services and radiology
Year Directly Accessed Diagnostic Services
Directly Accessed Pathology Services
Radiology
Volume of activity
Average cost
Volume of activity
Average cost
Volume of activity
Average cost
2004/05 369,988 44 180,676,234 3 5,152,720 31
2005/06 465,622 44 221,966,384 2 5,784,605 33
2006/07 735,569 41 236,269,050 2 23,918,500 59
2007/08 776,368 41 257,249,379 2 7,614,437 103
2008/09 804,607 46 278,917,852 2 7,852,498 102
2009/10 1,063,744 43 300,010,031 2 8,347,404 104
2010/11 1,458,025 39 320,418,662 2 8,491,834 97
2011/12 5,640,762 34 333,108,317 2 8,758,136 93
2012/13 6,339,016 30 335,941,593 2 9,381,616 92
Note: In 2004/05 and 2005/05, radiology was recorded as number of tests; in 2006/7 it comprised number of tests and interventions; from 2007/08 it was number of patients.
Table 33 Rehabilitation, renal dialysis, critical care, palliative care, cystic fibrosis
Year Rehabilitation Renal Dialysis Critical Care
Specialist Palliative Care
Cystic Fibrosis
Volume of activity
Average cost
Volume of activity
Average cost
Volume of activity
Average cost
Volume of activity
Average cost
Volume of activity
Average cost
2004/05 4,095,087 178 8,232,432 52 2,184,333 828 - - 16,317 1,919
2005/06 4,509,489 185 6,819,136 64 2,197,135 895 - - 13,704 2,316
2006/07 3,028,598 241 4,200,298 104 2,468,777 840 93,880 269 13,944 2,290
2007/08 2,732,048 259 3,980,793 114 2,165,060 931 208,410 219 15,383 2,349
2008/09 3,277,757 265 4,091,245 120 2,354,447 967 262,305 216 20,756 2,116
2009/10 3,277,430 279 4,050,658 129 2,439,661 1,003 359,121 192 20,323 2,468
2010/11 3,314,085 285 4,088,817 129 2,470,065 1,011 512,972 162 19,942 2,631
2011/12 2,897,721 278 4,166,150 129 2,570,571 998 550,417 166 9,852 8,476
2012/13 2,715,650 301 4,135,914 128 2,669,343 984 600,848 169 9,735 8,709
Table 34 Coronary care, spinal injuries, cancer team meetings
Year Coronary Care Units Specialist Spinal Injuries
Cancer Multi-Disciplinary Team
Meetings
Volume of activity
Average cost
Volume of activity
Average cost
Volume of activity
Average cost
2004/05 - - 112,149 412 - -
2005/06 - - 109,292 438 - -
2006/07 381,993 450 - - - -
2007/08 393,790 465 - - - -
2008/09 415,446 451 - - - -
2009/10 425,055 453 - - - -
2010/11 462,474 436 - - - -
2011/12 - - - - 837,418 114
2012/13 - - - - 1,079,297 106

34 CHE Research Paper 110
Table 35 Regular admissions, ward attenders and day care
Year Regular admissions Ward attenders Day Care
Volume of activity
Average cost
Volume of activity
Average cost
Volume of activity
Average cost
2004/05 122,447 248 846,342 95 735,070 124
2005/06 177,131 245 - - 649,963 131
2006/07 179,927 271 694,667 93 439,932 135
2007/08 164,651 324 - - 384,048 137
2008/09 198,573 341 - - 345,371 159
2009/10 152,079 393 - - 319,706 156
2010/11 176,169 431 - - 321,386 148
2011/12 176,877 428 - - 275,819 140
2012/13 210,984 371 - - 237,040 157
Table 36 Hospital at home, transport services
Year Hospital at Home/Early Discharge Schemes
Patient Transport Services
Hospital Travel Cost Scheme
Volume of activity
Average cost
Volume of activity
Average cost
Volume of activity
Average cost
2004/05 434,698 73 - - - -
2005/06 593,586 60 - - - -
2006/07 470,737 74 6,421,047 26 275,478 14
2007/08 405,271 73 7,046,578 29 607,712 18
2008/09 522,047 68 6,808,600 28 749,833 18
2009/10 495,961 81 435,669 13 427,766 12
2010/11 364,352 91 - - 435,669 13
2011/12 323,213 113 - - - -
2012/13 285,754 108 - - - -
Table 37 Audiological services, dietetics, ophthalmology
Year Audiological Services Dietetics Ophthalmology
Volume of activity
Average cost
Volume of activity
Average cost
Volume of activity
Average cost
2004/05 1,902,390 41 151,191 35 10,148,978 33
2005/06 1,692,721 40 - - 10,354,682 35
2006/07 2,905,175 50 - - 10,484,922 36
2007/08 3,447,049 51 - - 11,047,890 28
2008/09 3,716,333 51 - - 11,278,474 28
2009/10 3,807,539 52 - - 11,811,651 28
2010/11 3,927,780 51 - - 11,938,529 28
2011/12 4,033,290 50 - - 12,305,727 28
2012/13 4,030,693 52 - - 12,339,253 28
Information about dentistry is derived from the HSCIC website17 with dental activity differentiated into dental bands, reflecting the relative costs of different courses of treatments, as shown in Table 38. The HSCIC publication on NHS Dental Statistics also reports a weighted measure of courses of
17
http://www.hscic.gov.uk/catalogue/PUB11625

Productivity of the English NHS: 2012/13 update 35
treatments, Units of Dental Activity (UDA), which we use in our output growth measure. The UDA is also used in the funding of NHS dental activity. Up until 2011/12, we have used unit costs of dental treatment as weights. We found that actual unit costs are equivalent to the underlying weights used by the NHS to determine the UDAs.
Table 38 Dental services
Year Dentistry
Band 1 Band 2 Band 3 Urgent Other Total
(UDA) 2004/05
* - - - - - 68,983,268
2005/06* - - - - - 69,863,311
2006/07 19,012,890 32,063,007 18,349,548 3,457,446 767,309 73,650,200
2007/08 19,275,334 32,975,610 20,214,444 3,759,851 735,804 76,961,043
2008/09 19,803,371 34,468,755 22,314,288 4,012,151 755,832 81,354,397
2009/10 20,346,012 35,098,905 25,034,148 4,210,866 767,980 85,457,911
2010/11 20,718,874 35,414,322 26,249,796 4,338,032 743,265 87,464,289
2011/12 20,886,648 35,586,987 26,604,720 4,422,493 742,657 88,243,506
2012/13 21,016,444 35,252,547 26,871,444 4,454,437 502,932 88,097,804
* Units of Dental Activity are reported from 2006/7 onwards, for 2004/5 and 2005/6 we calculated equivalent UDAs by multiplying volumes of activity by the average weight for dental courses of treatment for 2006/7
4.7 Output growth
Output growth is measured by combining activities of different types into a single index using costs to reflect their values. This generates our cost-weighted output growth index, which increased by 2.58% between 2011/12 and 2012/13. We then re-scale each type of cost-weighted output according to changes in survival rates, health improvements and waiting times. This generates our quality-adjusted index, which increased by 2.34% between 2011/12 and 2012/13. Table 39 Output growth
Output growth All NHS
Cost-weighted growth Quality adjusted CW growth
2004/05-2005/06 6.48% 7.11%
2005/06-2006/07 5.81% 6.50%
2006/07-2007/08 3.42% 3.66%
2007/08-2008/09 5.34% 5.73%
2008/09-2009/10 3.44% 4.11%
2009/10-2010/11 3.61% 4.57%
2010/11-2011/12 2.38% 3.15%
2011/12-2012/13 2.58% 2.34%
This is the first time over the full data series in which quality-adjusted output growth is lower than cost-weighted growth. There are two explanations as to why the quality-adjustment is negative. First, quality deteriorated between 2011/12 and 2012/13 because of further increases in waiting times and a reduction in survival rates for non-elective patients. Second, we overcame the problem of HRG4 being replaced by HRG4+ by grouping all hospital activity in 2012/13 using the HRG4 grouper, thereby maintaining a consistent categorisation system. However, because of changes to diagnostic and procedure coding in the most recent year of data, 13% of patients in 2012/13 could not be allocated to an HRG, and were allocated instead to the UZ01Z code. As costs are not reported for patients in this ungrouped HRG, we assigned average cost and quality values to them. If true (unobserved) values are higher than average, this would depress the quality-adjusted estimates of productivity growth.

36 CHE Research Paper 110
5. Input growth
5.1 Staff numbers
The number of NHS staff, measured as Full Time Equivalents (FTEs), is reported in Table 40. Numbers of GPs and practice is taken from the Workforce Census. The method used to count practice staff was revised in 2011/12, though the counts for both methods are available for this year. We do not use the numbers of GPs and practice staff directly in our calculation of input growth but use expenditure data instead, as will be described in section 5.2. The numbers are presented in the table for information only. Prior to 2007/08, we also used data from the Workforce Census to count the number of other types of staff working in the NHS. But, since it was made available in 2007/08, we have used the Electronic Staff Record (ESR) data to calculate growth in labour inputs.18 Information in the ESR is summarised from 480 staff categories which are aggregated into major staff groups in Table 40 . Figures 8 and Figure 9 present this information graphically. The number of staff working for the NHS peaked in 2010/11, at 1,169,872 FTEs, including GPs and practice staff. Since then, numbers have declined year on year, but not across all staff groups. Between 2010/11 and 2012/13, the number of hospital Medical staff increased by 5.6%, GPs by 2.2% and practice staff by 3.3%, and there was a large increase of 18.3% in Nursing, Midwifery and Health Visiting Learners (albeit this category comprising relatively small numbers, increasing from 2,644 to 3,115). There have been decreases in all other staff groups, most notably reductions of 7.8% in Administration and Estates and 4.5% for Nursing, Midwifery and Health Visiting. Overall, the number of NHS staff fell by 2.1% between 2010/11 and 2012/13, with the reduction in FTEs amounting to 2.5% between 2011/12 and 2012/13, as shown in the penultimate row of Table 40. The final row of Table 40 reports the growth in labour input, which takes account of both the number of FTEs and the wage rate for each occupational group. Over time there may have been changes in the staffing mix, and a simple count of the numbers employed fails to capture changes in the composition of staffing. The index of labour input growth overcomes this by weighting the number of staff of each type by their respective wages. This shows a reduction in labour input of 1.95% between 2011/12 and 2012/13. For the entire period since 2004/05, the year-on-year index of labour input growth is often greater than the growth in FTEs. This occurs if there is a shift of staff toward higher wage categories, as seems to be the case over much of the period including between 2011/12 and 2012/13 (with -1.95>-2.5).
18
We excluded one organisation from the ESR data reported in 2011/12 that had not appeared in previous years.

Productivity of the English NHS: 2012/13 update 37
Table 40 NHS Staff numbers
2004/5 2005/6 2006/7 2007/8 2008/9 2009/10 2010/11 2011/12 2012/13
GPs (a) 33,564 34,855 35,944 36,420 37,720 40,269 39,409 39,780 40,265
GP Practice staff 69,140 72,006 72,990 75,085 73,292 72,153 73,306
GP Practice staff – new method
82,802 84,609 85,546
Medical staff (b) 78,462 82,568 85,975 84,811 90,460 93,393 95,531 99,331 100,878
Ambulance staff 21,149 23,084 24,489 25,056 24,908 24,566
Administration and Estates staff
237,264 243,018 262,479 263,723 250,539 242,980
Health care assistants and other support staff
101,114 106,406 112,710 114,786 116,643 116,018
Nursing, midwifery and health visiting staff and learners
366,520 372,132 379,841 380,114 377,948 363,781
Scientific, therapeutic and technical staff and healthcare scientists
141,754 150,056 159,538 165,454 168,750 164,312
Unknown and Non-funded staff
4,327 3,595 3,462 3,351 3,055 2,652
Professionally qualified clinical staff
412,013 425,044 425,983
Support to clinical staff
271,347 278,994 273,202
NHS infrastructure support staff
178,530 186,510 178,230
Volume Index FTE
3.32% -0.39% -0.63% 2.88% 4.24% 1.50% -0.21% -2.50%
Labour Index 3.44% 0.64% 0.64% 4.22% 4.55% 1.29% -0.24% -1.95%
Notes: (a) Data for GPs and GP practice staff is not available from ESR; Workforce Census data is used instead; there were also changes in counting of GP Practice staff therefore 2010/11 and 2011/12 years are not comparable to previous years. This includes GPs and GP trainees working in hospital http://www.hscic.gov.uk/media/9377/NHS-Occupation-Code-Manual-v10/pdf/NHS_Occupation_Code_Manual_Ver_10.pdf (b) FTE data prior to 2007/08 is taken from the Workforce Census data. FTE data from 2007/08 onwards is taken from organisational returns of Electronic Staff Records. When there are 5 or less people employed in an occupational group, organisations report either 5 or 0; these totals therefore will differ from those derived from national level data. Data reported by private providers for 2011/12 and 2012/13 are excluded.

38 CHE Research Paper 110
Figure 8 Trends in numbers of medical staff, GPs and practice staff
Figure 9 Growth in non-medical staff
0
20,000
40,000
60,000
80,000
100,000
120,000
Medical staff GPs
GP Practice staff GP Practice staff – new method
0.95
1
1.05
1.1
1.15
1.2
2007/08 2008/09 2009/10 2010/11 2011/12 2012/13
Administration and Estates
Health Care Assisstants and Other Support
Nursing, Midwifery and Health Visiting
Healthcare Scientists

Productivity of the English NHS: 2012/13 update 39
5.2 Input use derived from expenditure data
In Tables 41 and Table 42 we present a breakdown of expenditure by broad types of input for PCTs and all Trusts, respectively. Table 41 Current expenditure by PCTs (£000)
Current Labour Intermediates Capital
2007/08 6,701,228 2,617,114 1,174,841
2008/09 7,478,953 2,526,610 1,247,997
2009/10 8,230,341 2,623,459 1,703,974
2010/11 7,175,399 2,638,638 1,171,813
2011/12 2,328,314 2,052,029 892,604
2011/12* 2,358,373 860,860 1,721,795
2012/13* 1,938,770 885,265 1,814,809
Note: * Data prior to 2011/12 from Financial Returns and from 2011/12 data from DH Annual Report and Accounts. Intermediate and capital items are identified differently in each source
Table 42 Current expenditure by NHS Trusts (£000)
Current Labour Intermediates Capital
2007/08 30,884,556 10,140,836 6,452,630
2008/09 33,435,219 11,322,441 6,340,019
2009/10 35,983,781 12,115,273 6,529,977
2010/11 38,222,951 12,961,217 6,839,898
2011/12 42,647,889 14,941,588 7,278,435
2011/12* 42,701,684 17,477,370 12,097,485
2012/13* 43,797,935 19,681,855 12,377,259
Note: * For NHS Trusts, data from prior to 2011/12 from Financial Returns and from 2011/12 data from Financial Monitoring and Accounts. Intermediate and capital items are identified differently in each source
As would be expected, there has been a substantial reduction in expenditure by PCTs, especially in terms of staffing. The drop is mirrored by a substantial increase in expenditure by Trusts, which partly reflects a transfer of personnel from PCTs to Trusts. We report expenditure in current (Table 43) and constant (Table 44) terms across all the major expenditure categories. To derive estimates of volume growth in input use from the expenditure data, it is necessary to wash out price changes from the expenditure series. By applying a price deflator, current expenditure is converted into constant expenditure. Consequently, changes in constant expenditure are driven by changes in the volume not the price of inputs. The constant expenditure series shows that total input use increased considerably over time, from £70.4bn in 2004/05 to £88.9bn in 2011/12, an increase of 26.4%. Input growth amounted to 2.6% from 2011/12 to 2012/13. The different data sources used to measure inputs from 2011/12 mean that they are not directly comparable to previous years. Nevertheless, over the full series, from 2004/05 to 2012/13, input growth amounted to 29.3%.

40 CHE Research Paper 110
Table 43 Total NHS current expenditure (£000)
Current NHS Staff Agency Intermediate Capital Prescribing Primary Care DH Admin TOTAL
2004/05 31,334,252 1,557,282 8,757,990 5,115,514 8,094,175 9,569,836 278,000 64,707,050
2005/06 33,926,746 1,459,936 10,271,344 5,839,664 8,013,483 11,162,141 262,000 70,935,314
2006/07 35,177,509 1,185,244 11,378,727 6,568,363 8,250,324 11,209,422 229,000 73,998,589
2007/08 36,561,167 1,207,654 13,036,200 7,784,592 8,303,501 11,697,639 226,000 78,816,753
2008/09 39,264,185 1,895,423 13,991,803 7,426,031 8,376,264 12,074,672 242,958 83,271,336
2009/10 42,104,673 2,302,578 14,911,074 7,635,390 8,621,421 12,683,418 241,608 88,500,162
2010/11 43,513,839 2,127,889 16,077,609 8,025,361 8,880,735 12,962,081 212,245 91,799,759
2011/12 43,360,622 1,872,598 17,221,673 8,265,079 8,777,965 13,250,874 453,000 93,201,811
2011/12* 43,457,477 1,862,385 19,154,991 13,892,358 8,777,965 13,250,874 453,000 100,849,049
2012/13* 43,654,591 2,345,552 21,442,537 14,273,017 8,397,492 13,419,803 457,000 103,989,992
* For NHS Trusts, data from prior to 2011/12 from Financial Returns and from 2011/12 data from Financial Monitoring and Accounts. Agency costs, intermediate and capital items are identified differently in each source Table 44 Total NHS constant expenditure (base year 2011/12) (£000)
Current NHS Staff Agency Intermediate Capital Prescribing Primary Care DH Admin TOTAL
2004/05 38,346,300 1,674,940 9,095,402 3,308,036 5,931,102 11,670,405 331,183 70,357,368
2005/06 39,655,155 1,445,800 10,873,689 3,578,676 6,514,497 13,001,164 300,986 75,369,967
2006/07 39,497,699 1,093,340 11,885,321 4,190,683 6,944,133 12,542,013 253,689 76,406,878
2007/08 39,664,411 1,310,158 13,647,977 4,292,293 7,229,236 12,911,230 248,419 79,303,724
2008/09 41,345,323 1,995,888 14,437,459 4,134,163 7,655,849 12,939,203 257,034 82,764,919
2009/10 43,559,337 2,382,128 15,751,862 4,568,449 8,168,866 13,351,213 254,082 88,035,937
2010/11 43,666,672 2,135,363 16,388,184 4,120,671 8,524,415 13,234,285 216,702 88,286,292
2011/12 43,360,622 1,872,598 17,221,673 4,013,538 8,777,965 13,250,874 453,000 88,950,270
2011/12* 43,457,477 1,862,385 19,154,991 13,892,358 8,777,965 13,250,874 453,000 100,849,049
2012/13* 43,311,466 2,327,116 21,063,396 14,020,645 9,046,974 13,273,791 452,028 103,498,236
* For NHS Trusts, data from prior to 2011/12 from Financial Returns and from 2011/12 data from Financial Monitoring and Accounts. Agency costs, intermediate and capital items are identified differently in each source Trends in the volume of inputs, derived from the expenditure data, are shown in the figures below. Figure 10 shows that trends in estimates of growth in labour input vary according to the data source used, with ESR and expenditure series suggesting different year-on-year changes in growth. Given the importance of labour input, we produce two estimates of overall input and productivity growth that differ according to how labour input is calculated. The use of agency staff is subject to considerable year-on-year variation, as shown in Figure 11. The substantial increase of 24% between 2011/12 and 2012/13 will contribute to increased overall input growth. Figure 12 shows that the use of intermediate input has increased progressively year-on-year, while the estimated consumption of capital is subject to volatility, part of which will be due to how capital is accounted for in the organisational financial returns. Although the smallest element of inputs, there is a notable increase in DH administration spending (Figure 13), which is taken from the Department of Health annual accounts spend tables. As the format of the tables changed in 2011/12, this might have affected the categorisation of individual spending lines, contributing to the apparent growth in DH administration spend over the last three years.

Productivity of the English NHS: 2012/13 update 41
Figure 10 Trends in NHS staff growth, by data source
Figure 11 Trends in use of agency staff
0.9
0.95
1
1.05
1.1
1.15
1.2
2004/052005/062006/072007/082008/092009/102010/112011/122012/13
Expenditure Workforce Census/ESR
0.6
0.7
0.8
0.9
1
1.1
1.2
1.3
1.4
1.5
Agency - old source Agency - new source

42 CHE Research Paper 110
Figure 12 Trends in growth of intermediate and capital inputs
Figure 13 Trends in primary care inputs and DH administration
0.5
0.6
0.7
0.8
0.9
1
1.1
1.2
2004/5 2005/6 2006/7 2007/8 2008/9 2009/10 2010/11 2011/12 2012/13
Intermediates Intermediates - new series
Capital Capital - new series
0
0.2
0.4
0.6
0.8
1
1.2
1.4
1.6
1.8
Prescribing
Primary Care
DH Core

Productivity of the English NHS: 2012/13 update 43
5.3 Input growth
Our measures of input growth are reported in Table 45, differentiated according to the use of the mixed or indirect index. Estimates of input growth have generally been higher if using the mixed rather than the indirect input index. However, that is not the case for 2011/12-2012/13, where the mixed index suggests a growth rate of 1.98% while the indirect index suggests that input growth amounted to 2.63%. Table 45 Input growth
Input Growth All NHS
Mixed Indirect
2004/05 – 2005/06 7.19% 7.10%
2005/06 – 2006/07 1.92% 1.36%
2006/07 – 2007/08 3.88% 3.70%
2007/08 – 2008/09 4.23% 4.24%
2008/09 – 2009/10 5.43% 5.83%
2009/10 – 2010/11 1.33% 0.80%
2010/11 – 2011/12 1.00% 0.75%
2011/12 – 2012/13 1.98% 2.63%
The difference between the mixed and indirect input indices is due to the fact the growth rates in labour input differ if based on data from ESR rather than on expenditure data. The differences are shown in Table 46. Consider the change from 2011/12 to 2012/13,according to the expenditure data reported in Table 44, expenditure on NHS staff in constant terms appears to have decreased by -0.33%, while the ESR data suggest that staffing inputs decreased by -1.95%. Table 46 Differences in estimates of labour input growth
Years Expenditure
growth Expenditure
growth index ESR FTE growth
ESR FTE growth index
ESR growth
ESR growth index
Labour expenditure
as a % of total
expenditure
2004/05 - 2006/07 2.96% 1.03 3.32% 1.03 3.44% 1.03 55%
2005/06 - 2006/07 -0.96% 1.02 -0.39% 1.03 0.64% 1.04 53%
2006/07 - 2007/08 -0.40% 1.02 -0.63% 1.02 0.64% 1.05 52%
2007/08 - 2008/09 4.18% 1.06 2.88% 1.05 4.22% 1.09 50%
2008/09 - 2009/10 5.30% 1.11 4.24% 1.10 4.55% 1.14 50%
2009/10 - 2010/11 0.62% 1.12 1.50% 1.11 1.29% 1.16 50%
2010/11 - 2011/12 -0.70% 1.11 -0.21% 1.11 -0.24% 1.15 49%
2011/12 - 2012/13* -0.33% 1.11 -2.50% 1.08 -1.95% 1.13 49% * The drop in the Labour % is primarily due to the change in the source data for NHS Trusts, from Financial Returns to Financial Monitoring and Accounts.
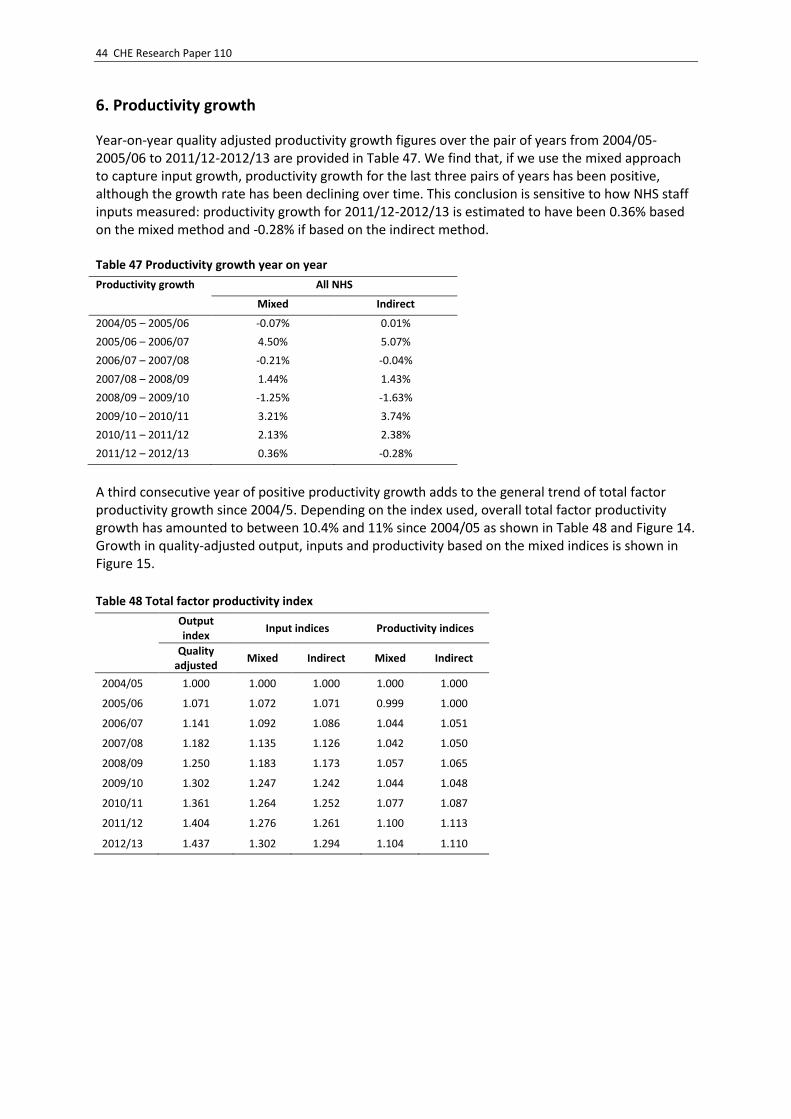
44 CHE Research Paper 110
6. Productivity growth
Year-on-year quality adjusted productivity growth figures over the pair of years from 2004/05-2005/06 to 2011/12-2012/13 are provided in Table 47. We find that, if we use the mixed approach to capture input growth, productivity growth for the last three pairs of years has been positive, although the growth rate has been declining over time. This conclusion is sensitive to how NHS staff inputs measured: productivity growth for 2011/12-2012/13 is estimated to have been 0.36% based on the mixed method and -0.28% if based on the indirect method. Table 47 Productivity growth year on year
Productivity growth All NHS
Mixed Indirect
2004/05 – 2005/06 -0.07% 0.01%
2005/06 – 2006/07 4.50% 5.07%
2006/07 – 2007/08 -0.21% -0.04%
2007/08 – 2008/09 1.44% 1.43%
2008/09 – 2009/10 -1.25% -1.63%
2009/10 – 2010/11 3.21% 3.74%
2010/11 – 2011/12 2.13% 2.38%
2011/12 – 2012/13 0.36% -0.28%
A third consecutive year of positive productivity growth adds to the general trend of total factor productivity growth since 2004/5. Depending on the index used, overall total factor productivity growth has amounted to between 10.4% and 11% since 2004/05 as shown in Table 48 and Figure 14. Growth in quality-adjusted output, inputs and productivity based on the mixed indices is shown in Figure 15.
Table 48 Total factor productivity index
Output index
Input indices Productivity indices
Quality adjusted
Mixed Indirect Mixed Indirect
2004/05 1.000 1.000 1.000 1.000 1.000
2005/06 1.071 1.072 1.071 0.999 1.000
2006/07 1.141 1.092 1.086 1.044 1.051
2007/08 1.182 1.135 1.126 1.042 1.050
2008/09 1.250 1.183 1.173 1.057 1.065
2009/10 1.302 1.247 1.242 1.044 1.048
2010/11 1.361 1.264 1.252 1.077 1.087
2011/12 1.404 1.276 1.261 1.100 1.113
2012/13 1.437 1.302 1.294 1.104 1.110

Productivity of the English NHS: 2012/13 update 45
Figure 14 Total factor productivity growth
Figure 15 Growth in NHS output, input, and productivity; mixed indices
0.95
1.00
1.05
1.10
1.15
20
04
/5
20
04
/5 -
20
05
/6
20
05
/6 -
20
06
/7
20
06
/7 -
20
07
/8
20
07
/8 -
20
08
/9
20
08
/9 -
20
09
/10
20
09
/10
-20
10
/11
20
10
/11
-20
11
/12
20
11
/12
-20
12
/13
Indirect Mixed
0.90
1.00
1.10
1.20
1.30
1.40
1.50
20
04
/5
20
04
/5 -
20
05
/6
20
05
/6 -
20
06
/7
20
06
/7 -
20
07
/8
20
07
/8 -
20
08
/9
20
08
/9 -
20
09
/10
20
09
/10
-20
10
/11
20
10
/11
-20
11
/12
20
11
/12
-20
12
/13
Output index Input index Productivity index

46 CHE Research Paper 110
7. Conclusions
The following key elements have contributed to output growth since 2004/05:
A 40% increase in the volume of elective activity, from 6.4m patients in 2004/05 to 9m in 2012/13.
Annual improvements in 30-day survival rates for elective patients.
Reductions in elective waiting times between 2004/05 and 2008/09, although these gains have since been largely eroded.
An increase of 21% in the volume of non-elective hospital activity, from 6m patients in 2004/05 to 7.3m in 2012/13
Annual improvements in 30-day survival rates up to 2011/12, though these deteriorated slightly in 2012/13.
A 46% increase in outpatient activity, from 53m attendances in 2004/05 to 77m in 2012/13.
Reductions in outpatient waiting times between 2004/05 and 2008/09, although waiting times have increased subsequently.
Increases in the overall volume of mental health care provision. 7% more patients were treated in hospitals over the full period. Community MH activity grew by 49% 2004/05 and 2010/11, and by 16% between 2011/12 and 2012/13.
Increases in the amount of community care activity (although it is not possible to generate a complete data series, given regular revisions to how such activities are defined).
Increases in the volume and quality of primary care consultations, amounting to a 30% increase between 2004/05 and 2012/13, and year-on-year in community prescribing.
Overall growth in A&E activity of 9% between 2004/05 and 2012/13.
General increases in most other types of health care provision.
Overall, output growth between 2004/05 and 2012/13 amounted to 44%.
Output growth between 2011/12 and 2012/13 was 2.34%. Although output growth amounted to 2.34% between 2011/12 and 2012/13, this is the first time over the full data series in which quality-adjusted output growth has been lower than cost-weighted growth. This is a consequence primarily of further increases in waiting times and a reduction in survival rates for non-elective patients. The following elements have contributed to input growth since 2004/05:
The number of NHS staff has increased by 16% between 2004/05 and 2010/11, but has decreased subsequently. Reductions between 2010/11 and 2011/12 are concentrated among administrative and estates staff, nurses, midwives, and health visitors, and healthcare assistants. Since 2004/05, labour input measured using Workforce Census and ESR data, has increased by 13%.
A slightly different picture of year-on-year labour input growth appears from looking at expenditure data. These data suggest that labour input increased by 11% since 2004/05, with recent reductions less pronounced than for the Workforce Census/ESR series.
There have been substantial annual increases in the use of intermediate inputs.
The use of capital inputs has increased over time, though not always year-on-year.
Overall, input growth between 2004/05 and 2012/13 amounted to 30%.
Input growth between 2011/12 and 2012/13 was 1.98% if labour input is calculated using NHS staff data or 2.63% if using expenditure data.
If measured using our preferred mixed index, the NHS has delivered overall total factor productivity growth of 10.4% since 2004/05, with 2011/12-2012/13 being the third consecutive period of year-

Productivity of the English NHS: 2012/13 update 47
on-year productivity growth. Our figures are consistent in qualitative terms, though not quantitative terms, to the most recent estimates published by the Office of National Statistics (Office for National Statistics 2015).19 Productivity growth between 2011/12 and 2012/13 is estimated to have been 0.36% based on our mixed index which uses NHS staff numbers to calculate labour input but -0.28% if based on the indirect index, which uses expenditure data to calculate labour input.
19
http://www.ons.gov.uk/ons/dcp171766_393405.pdf

48 CHE Research Paper 110
References
Atkinson T. 2010. Measuring Health Output, Productivity and Equity. London: Office of Health Economics. Balk BM. 2010. Direct and chained indices: a review of two paradigms. In Price and Productivity Measurement: Volume 6 - Index Number Theory, edited by WE Diewert, BM Balk, D Fixler, KJ. Fox and AO Nakamura: Trafford Press. Bojke C, A Castelli, R Goudie, A Street and P Ward. 2012. Productivity of the English National Health Service 2003-4 to 2009-10. York: Centre for Health Economics Research Paper 76, University of York. Bojke C, A Castelli, K Grašič and A Street. 2014. Productivity of the English National Health Service from 2004/5: updated to 2011/12. York: Centre for Health Economics Research Paper 94, University of York. Castelli A, D Dawson, H Gravelle, R Jacobs, P Kind, P Loveridge, S Martin, M O'Mahony, P Stevens, L Stokes, A Street and M Weale. 2007. A new approach to measuring health system output and productivity. National Institute Economic Review 200: 105-17. Castelli A, M Laudicella and A Street. 2008. Measuring NHS output growth. York: Centre for Health Economics research paper 43. Castelli A, M Laudicella, A Street and P Ward. 2011. Getting out what we put in: productivity of the English National Health Service. Health Economics, Policy and Law 6: 313-35 de Boer S, J van Dalen and P Verbiest. 1997. Chain indices in the national accounts: the Dutch experience. Heerlen, Netherlands: Statistics Netherlands. Department of Health. 2012. Reference Costs 2011-12. Leeds: NHS Information Centre. Diewert WE, BM Balk, D Fixler, KJ Fox and AO Nakamura. 2010. Price and Productivity Measurement: Volume 6 -- Index Number Theory: Trafford Press. Eurostat. 2001. Handbook on price and volume measures in national accounts: Luxembourg: Office for Official Publications of the European Communities. Fenty J, C Coupland, J Hippisley-Cox and H Gravelle. 2006. Determinants of consultation rates over time: Implications for estimating the national volume of consultations. Nottingham: QRESEARCH University of Nottingham. Lehr J. 1885. Beiträge zur Statistik der Preise insbesondere des Geldes und des Holzes. Frankfurt a. M: F. D. Sauerländer Verlag. Marshall, A. 1887. Remedies for Fluctuations of General Prices. Contemporary Review 51: 355-75. NHS Information Centre. 2012. ICD-10 4th Edition HRG4 2012/13 Local Payment changes Leeds: NHS Information Centre. OECD. 2001. “OECD Productivity Manual: a guide to the measurement of industry-level and aggregate productivity growth.” Paris: Organisation for Economic Cooperation and Development.

Productivity of the English NHS: 2012/13 update 49
Office for National Statistics. 2015. Public Service Productivity Estimates: Healthcare, 2012. Newport, Wales: Office for National Statistics. QResearch. 2009. Trends in Consultations Rates in General Practice 1995-2008 Tables. NHS Information Centre for Health and Social Care. Street A, P Ward. 2009. NHS Input and Productivity Growth 2003/4 - 2007/8. York: Centre for Health Economics research paper 47.