products, platforms, and open innovation: three essays on
TRANSCRIPT
Products, Platforms, and Open Innovation: Three Essays on
Technology Innovation
By
Shivendu Pratap Singh
B.E., South Gujarat University, 2005
M.B.A., Indian Institute of Technology, New Delhi, 2008
Submitted to the Graduate Faculty of the
Joseph M. Katz Graduate School of Business in
partial fulfillment
of the requirements for the degree of Doctor of Philosophy
University of Pittsburgh
2020

ii
UNIVERSITY OF PITTSBURGH
JOSEPH M. KATZ GRADUATE SCHOOL OF BUSINESS
This dissertation was presented
by
Shivendu Pratap Singh
It was defended on
April 24, 2020
and approved by
Dr Anol Bhattacherjee, Professor, Muma College of Business, University of South
Florida
Dr Zia Hydari, Assistant Professor of Business Administration, Joseph M. Katz
Graduate School of Business, University of Pittsburgh
Dissertation Advisors:
Dr Chris F. Kemerer, David M. Roderick Professor of Information Systems and
Professor of Business Administration, Katz Graduate School of Business, University of
Pittsburgh
Dr Narayan Ramasubbu, Associate Professor of Business Administration, Joseph M.
Katz Graduate School of Business, University of Pittsburgh

iii
Copyright © by Shivendu Pratap Singh
2020

iv
Table of Contents
Contents
List of Tables ............................................................................................................................................ vi
List of Figures .......................................................................................................................................... ix
1 Introduction ....................................................................................................................................... 1
2 Essay 1: Design in Complex Assembled Digital Products: A Longitudinal Analysis of
Television Components ......................................................................................................................... 8
2.1 INTRODUCTION ........................................................................................................................ 8
2.2 CONCEPTUAL DEVELOPMENT .......................................................................................... 15
2.2.1 Entry and Exit of a Component in a Dominant Design Configuration ...................... 16
2.2.2 Pleiotropy and component adoption .............................................................................. 19
2.2.3 Open Standards and Component Adoption ................................................................. 22
2.2.4 Innovation Source and Component Adoption .............................................................. 24
2.3 VARIABLE OPERATIONALIZATION AND MODEL ESTIMATION.................................. 27
2.3.1 Data Collection ................................................................................................................. 27
2.3.2 Variables ............................................................................................................................ 28
2.3.3 Estimation Models ............................................................................................................ 31
2.4 ANALYSIS ................................................................................................................................. 34
2.4.1 Descriptive Statistics ........................................................................................................ 34
2.4.2 Hypothesis Test Results .................................................................................................. 34
2.5 DISCUSSION ............................................................................................................................ 44
2.6 CONCLUSION .......................................................................................................................... 49
3 Essay 2: Product Market Competition, Platform Business Model and, Firm
Performance ............................................................................................................................................ 51
3.1 INTRODUCTION ...................................................................................................................... 51
3.2 CONCEPTUAL DEVELOPMENT .......................................................................................... 56
3.2.1 Product Market Fluidity and Firm Performance ........................................................... 56
3.2.2 Product Market Fluidity and Firm Performance ........................................................... 59
3.3 VARIABLE OPERATIONALIZATION AND ESTIMATION ................................................. 65
3.3.1 Data .................................................................................................................................... 65
3.3.2 Variables ............................................................................................................................ 66

v
3.3.3 Estimation Model .............................................................................................................. 76
3.3.4 Identification Strategy ...................................................................................................... 77
3.4 RESULTS .................................................................................................................................. 79
3.4.1 Descriptive Statistics ........................................................................................................ 79
3.4.2 System GMM estimations ............................................................................................... 81
3.4.3 Additional Analysis ........................................................................................................... 85
3.4.4 Robust Analysis ................................................................................................................ 89
3.5 DISCUSSION ............................................................................................................................ 93
3.6 CONCLUSION .......................................................................................................................... 96
4 Essay 3: Open Innovation, Absorptive Capacity, and Firm Performance. ..................... 98
4.1 INTRODUCTION ...................................................................................................................... 98
4.2 CONCEPTUAL DEVELOPMENT ........................................................................................ 103
4.3 EMPIRICAL METHOD AND DATA ..................................................................................... 113
4.3.1 Data and variables ......................................................................................................... 113
4.3.2 Estimation Model ............................................................................................................ 119
4.3.3 Identification Strategy .................................................................................................... 120
4.4 RESULTS ................................................................................................................................ 126
4.4.1 Descriptive Statistics ...................................................................................................... 126
4.4.2 Open-source engagement and firm performance ..................................................... 130
4.4.3 Open-source engagement intensity and firm performance ..................................... 134
4.4.4 Open-source engagement and firm performance ..................................................... 137
4.4.5 Robust Analysis .............................................................................................................. 141
4.5 DISCUSSION .......................................................................................................................... 149
4.6 CONCLUSION ........................................................................................................................ 152
5 Thesis Conclusion ....................................................................................................................... 154
6 References ..................................................................................................................................... 159
7 Appendices .................................................................................................................................... 174
7.1 Appendix A .............................................................................................................................. 174
7.2 Appendix B .............................................................................................................................. 182
7.3 Appendix C .............................................................................................................................. 191

vi
List of Tables
Table 1: Survival Model Results: Component Dominance ............................................ 36
Table 2: Censored Negative Binomial Regression: Component Longevity ................... 39
Table 3: Sensitivity Analysis: Component Dominance .................................................. 41
Table 4: Additional Models to Check Robustness of Results ........................................ 43
Table 5: Naïve-Bayes classification for measuring platform .......................................... 72
Table 6: Variable Descriptions ...................................................................................... 76
Table 7: Descriptive Statistics: Product Market Fluidity, Platform, and Firm Performance
...................................................................................................................................... 79
Table 8: Correlation Matrix: Product Market Fluidity, Platform and, Firm Performance . 80
Table 9: Fixed Effect Models: Product Market Fluidity, Platform, and Firm Performance
...................................................................................................................................... 82
Table 10: System GMM Estimates: Product Market Fluidity, Platform, and Firm
Performance .................................................................................................................. 83
Table 11: Interaction effect model with product market fluidity, platform, and firm size . 87
Table 12: OLS regression: hand-coded platform business model ................................. 90
Table 13: CEM and IPW OLS regression ...................................................................... 91
Table 14: Fixed-effect reverse causality results ............................................................ 92
Table 15: Variable Descriptions Essay 3 ..................................................................... 119
Table 16: Open Innovation, Absorptive Capacity, and Firm Performance ................... 127
vii
Table 17: Summary Comparison Between Treated and Non-treated Firms (All dollar
values are deflated to 2012 dollar values) ................................................................... 127
Table 18: Open innovation, Absorptive Capacity, and Firm Performance ................... 129
Table 19: GSynth results: Open-source engagement and firm performance .............. 132
Table 20: Open Source Engagement Intensity and Firm Performance ....................... 135
Table 21: Split index of effect heterogeneity ............................................................... 139
Table 22: Regression Results: Robust Analysis .......................................................... 142
Table 23: Comparison of Average Treatment Effect (ATE) Calculated Using Different
Estimation Approaches ............................................................................................... 142
Table 24: Regression results: Dependent variable: Tobin’s Q .................................... 144
Table 25: Regression results: Various measures of open-source engagement .......... 146
Table 26: Appendix: List of components with corresponding variable values (the year
2017) ........................................................................................................................... 174
Table 27: Appendix: List of Components and Variables .............................................. 175
Table 28: Appendix: Component Classification Examples .......................................... 178
Table 29: Appendix: Example of Words to Component Matching ............................... 181
Table 30: Appendix: Text Classification Algorithm Result Comparison ....................... 182
Table 31: Appendix: Platform Business Model Firms .................................................. 183
Table 32: Appendix: Non-platform Business Model Firms ........................................... 184
Table 33: Firms That Transitioned from Non-Platform to Platform Business Model .... 189
Table 34: Firm Maturity, Platform Business Model and Firm Performance ................. 190

viii
Table 35: Regression Results: With and Without Advertising Stock ........................... 190
Table 36: Appendix: Open-source – 10-K Classification ............................................. 191
Table 37: Appendix: firms with homepage on GitHub 2017 ........................................ 192
Table 38: Appendix: Firms not engaged in open source innovation (the year 2017) .. 194
Table 39: Effect of Open-source Engagement on Firm Performance (Excluding
Microsoft and Alphabet Inc.) ........................................................................................ 197
Table 40: Appendix: Aggregate project variables of a firm and their effect on firm
performance ................................................................................................................ 198
Table 41: Appendix: Aggregate project variables of a firm and their effect on firm
performance ................................................................................................................ 199
ix
List of Figures
Figure 1: Entry and Exit of Components in TV Dominant Design Configuration ............ 18
Figure 2: Pleiotropy Example (Component designs in the year 2011) .......................... 20
Figure 3: Research Model ............................................................................................. 26
Figure 4: Adoption of Audio-Video Components in TV Design ...................................... 29
Figure 5: Survival Graphs .............................................................................................. 38
Figure 6: Research Model: Product Market Competition, Platform Business Model and
Firm Performance.......................................................................................................... 65
Figure 7: Marginal Effects of Product Market Fluidity and Platform Business Model on
Firm Performance.......................................................................................................... 84
Figure 8: Interaction margin plot: Product market fluidity, platform business model and
firm size. ........................................................................................................................ 86
Figure 9: Top 20 for profit firms by GitHub engagement ............................................. 102
Figure 10: For-Profit Firms with Most Number of Projects on GitHub.......................... 102
Figure 11: Facebook Homepage on GitHub ................................................................ 107
Figure 12: Research Model:Open Innovation, Absorptive Capacity and Firm
Performance. ............................................................................................................... 113
Figure 13: Average Treatment Effect of Open-source Innovation ............................... 133
Figure 14: Treated Average and Counterfactual Average ........................................... 133
Figure 15: Average Treatment Effect vs. Average no. of Projects ............................... 137
Figure 16: Heterogeneity in Effect of Open-source Innovation on Firm Performance . 138
Figure 17: Heterogeneous Treatment Effect ............................................................... 140

x
Figure 18: Least and Most Frequently Used Words in TV Specification...................... 179
Figure 19: Appendix: Comparison of Classification Models ........................................ 183
1
1 Introduction
High technology industries, where IT artifacts are core to the business model of a
firm, are marked by a high level of market competition and uncertainty. Firms within these
industries are constantly evolving at a swift pace. Products and services developed in
these industries have the shortest life cycle from product development to maturity,
compared to those developed in other industries. According to a 2015 KPMG report,
products and services in the high technology industry have an average maturity life cycle
of 0.5 - 5 years, which is the shortest among all sectors (KPMG, 2015). Value generation
and capture from these products and services must happen in a shorter duration
compared to those from other industries. Imitation of products and services in these
industries is also rampant, diminishing opportunities to generate value from innovative
products and services. According to extant research, imitation among vendors in the IT
sector is widespread, and firms mimic direct competitors in the introduction and
withdrawal of products and services (Ruckman et al., 2015; Rhee et al., 2006). While the
inherent nature of products developed in the IT industry and the associated incremental
innovation leads to better performance gains, these gains erode quickly via imitation from
firms competing in the same domain (Ethiraj et al., 2008). For many firms, these issues
lead to a shift in their revenue generation model. Rather than appropriating the value from
direct sales of products and services, firms have slowly started opting for innovation
strategies that allow rent-seeking through opening up the business and revenue models
of the firm. These strategies may include but are not limited to, adopting open standards

2
for their products and services, establishing platform business models and engaging in
open innovation. In this thesis, I assess these three innovation strategies and their value
to a firm in terms of product and services and related value performance.
In the first essay of this thesis, I start by examining the lifecycle of products in
information technology-intensive firms, which is deemed to be shorter compared to other
industries. I call these products complex assembled digital products (CADP). In the
product innovation literature, the emergence of a dominant design configuration in a
product category is seen as the start of a technological lifecycle that allows winners of the
industry to appropriate long-term returns through incremental innovation. In the context
of a complex assembled digital product, a dominant design will manifest itself as a single
dominant design configuration or a narrow set of configurations that represent a majority
of the products manufactured in a product category (Tushman & Murmann, 1998; Cecere
et al., 2015). However, in technology-intensive firms, two challenges need further
exploration. Firstly, due to the pace of innovation in technology-intensive industries, it is
highly likely that a dominant design configuration never emerges (Srinivasan et al., 2006).
Secondly, due to the modular nature of the products, even if a dominant design is
achieved, it is achieved at the configurational level. It manifests itself as the set of
components that achieves dominance in a product configuration (Murmann & Frenken,
2006).

3
In the first essay, I examine the evolutionary attributes of the components of a
CADP, which enable the components to become and remain part of the dominant design
configuration of the product for a longer duration. I model the entry and survival of a
component in a dominant design configuration using three evolutionary attributes: (1)
pleiotropy of the component, (2) openness of the standard supporting the component,
and (3) innovation source of the component. Pleiotropy as a construct is adapted from
evolutionary biology and defined as the number of functionalities supported by a
component. The standard supporting a component can be open or proprietary. The
innovation source can be internal to the industry or external. I empirically test my
hypotheses using a rich, longitudinal dataset of TV models spanning 15 years (2002-
2016). The results show that components that have higher pleiotropy and that are
supported by open standards not only have a higher chance of being selected into the
dominant design configuration of TVs but also remain in the TV market for a longer time.
However, while components developed through endogenous innovation efforts were
nearly four times more likely to enter the dominant design configuration of TVs, their
longevity was not significantly different from that of the components sourced exogenously.
In the first essay, I look at how adopting components with specific sets of attributes
allows firms to win a product market and appropriate value for a long duration from
product development. In the second essay, I shift my focus from a product-based
business model to a platform business model as an innovation strategy to achieve a
competitive advantage. In recent years we have observed the emergence of platform
4
businesses across domains of information technology-intensive industries (van Alystyne
and Parker 2016). Firms are either completely shifting to platform business models or
starting to include platform business models as part of their business strategy portfolios.
Newer firms in these industries are more likely to adopt a platform business model as the
core model for value generation and value capture. Seven of the ten most valuable
companies in the world have opted for a platform business model as part of their overall
business strategy (Cusumano et al., 2019). However, not all firms adopting the platform
business model succeed in dominating the market. An exploratory study examined the
success of platform businesses in terms of the number of years the firm remained in
business. Taking a 20 years dataset of the firms in US markets, it was observed that only
43 out of 252 platform firms flourished are still active (Yoffie et al., 2019). Most of the
surviving firms have to spend a considerable amount of resources in incentivizing the
stakeholders of the platform, R&D, and marketing activities to stay relevant in the market
(Cusumano, 2020).
In Essay Two, I investigate the effect of a platform innovation on a firm’s
performance under competitive threats. As argued earlier, technology-intensive firms
operate in an ever-changing environment where competition is continuously evolving and
mimicking the products of the focal firm. This constantly evolving product market
competition is inherent in high technology industries. While product market competition
encourages the overall pace of innovation as seen in technology-intensive industries, we
are not aware of its effect on value generated by the firms operating in those industries.
5
In the second Essay, I model the effect of product market competition on a firm’s
performance. I look at how adopting a platform business model mitigates the effect of
product market competition on a firm’s value generation. I use a machine learning-based
firm classification method to measure the business model adopted by a firm. I extracted
data from 10-K annual reports of the sample firms and classified the firms as platform or
non-platform based on the supervised classification of 10-K annual reports of the firm.
Using a 20-year panel of the firm’s financial data and their business classification, I
explore the effect of a platform business model on a firm’s performance under high
product market competition. My results suggest that adopting a platform business model
can be an effective business strategy in delivering better value in general and under high
market competition in particular.
A third innovation strategy that has found favor with firms in recent years to build
a competitive advantage over rivals is engaging in open innovation. Open innovation is
defined as “a paradigm that assumes that firms can and should use external ideas as well
as internal ideas, and internal and external paths to market, as the firms look to advance
their technology” (Chesbrough, 2003). In the context of information technology-intensive
firms, open innovation manifests itself in many ways. In recent years, for-profit firms have
started engaging with open-source communities to develop products and services on
social coding platforms like GitHub. According to my investigation, 41 of the top 100 firms
by market valuation have a direct presence on GitHub and actively develop their products
with support from open-source developer communities. Opening up open software
6
products and services for the world is another way that allows for faster development and
propagation of products across user and developer communities (Khan, 2018). Firms also
sponsor open source community developed products and regularly sponsor summer
coding schools and hackathons (Mitchell, 2012). These open innovation events have
shown promise in the collaborative development of products and services (Tereweisch
and Xu, 2008). Firms appropriate rents by selling complementary services for the
products they are developing as open-source. In his famous 1997 book, “The Cathedral
and the Bazaar,” Eric Raymond coined the term “Cathedral” model of software
development to represent the closed sourced, hierarchical and proprietary model of
software development and “Bazaar” to represent the open-source, free and equality
based software development model (Raymond, 1997). However, there is limited empirical
evidence to suggest that firms create and capture value on open innovation platforms like
GitHub (West et al., 2014). We do know that firms have started selective revealing of their
accumulated knowledge and started engaging with open source communities (Fosfuri et
al., 2008; Henkel et al., 2014; Alexy et al., 2018). In the third Essay, I investigate the effect
of open-source engagement on the economic outcomes of a firm. More specifically, I look
at how engagement on the open-source platform and intensity of that engagement
influence the financial performance of a firm. To investigate the influence of open-source
innovation on a firm’s financial performance, I created a data set containing all continuous
open-source engagements of firms in high technology sectors. I collected this data from
multiple sources, including GitHub, 10-K reports, and a search of innovation contests

7
organized by firms. I then matched this data set with the financial information of the firms.
I employed the generalized synthetic control method (GSynth) to estimate the model. I
estimated the dynamic panel data regression model to measure the influence of open-
source engagement intensity on financial performance.
Additionally, I also investigated the heterogeneity in the effect of open-source
engagement on the financial performance of the firm using the random causal forest. My
results suggest that open-source engagement and its intensity positively influence the
financial performance of a firm. The effects are heterogeneous and based on the
absorptive capacity of the firm, market competition, and other environmental factors. I
explore and discuss the implications of my findings on open-source engagement choices
by firms.
Finally, I conclude this dissertation with the findings of my essays and their
implications on information technology-intensive firms. I provide additional details about
my studies in the Appendices. The Appendices also highlight the additional analysis done
during the research to test the robustness of the results. Overall, this dissertation has
broader implications for research and practice alike. There are opportunities for future
research and investigation into various innovation strategies adopted by firms in high
technology industries. This research also provides directions for applying novel research
methods, like the generalized synthetic control method and machine learning algorithms,
in IS research.

8
2 Essay 1: Design in Complex Assembled Digital Products: A Longitudinal
Analysis of Television Components
2.1 INTRODUCTION
When an innovative technology or product category emerges, competing firms typically
introduce several alternate designs that vie for market share (Anderson & Tushman, 1990;
Murmann & Frenken, 2006). It has been observed that such competing designs evolve
incrementally over time, and typically, for successful innovations, eventually a specific
design, referred to as the dominant design, achieves allegiance from a majority of the
firms in the industry (Abernathy & Utterback, 1978; Suarez et al., 2015). Complex
assembled products are characterized by a set of components and interfaces arranged
together in a hierarchy of subsystems, and dominant designs in these products can
emerge at multiple levels of product design (Clark, 1985; Christensen, 1992a). The
process of selection, arrangement and design of components and interfaces is critical for
product management and collaborative productive development, as it gives rise to
multiple, alternate design and assembly options for the same category of products
(Mishra & Shah, 2009; Chao et al., 2008). In the context of a complex assembled product,
then, a dominant design will tend to manifest itself as a single dominant design
configuration, or a narrow set of configurations which represent a majority of the products
manufactured in a product category (Tushman & Murmann, 1998; Cecere et al., 2015).
The emergence of the dominant design configuration, where product variation is
limited to peripheral components, brings stability to a firm’s multi-partner collaboration
and learning, R&D efforts, and its operational performance (Yao et al., 2013; Mishra et
9
al., 2015). For designers and manufacturers of complex assembled products the
emergence of dominant design configuration reduces the cost of sourcing of non-
dominant components and narrows product offerings, leading to better management of
product rollovers, substitution, and diffusion into global markets (Koca et al., 2010;
Schmidt et al., 2005). Narrow product offerings lead to better firm performance in
unpredictable environments and firms can better manage competition and coopetition in
their supply chains (Wilhelm, 2011; Kovach et al., 2015). As component mix changes and
product variety increases, the operational efficiency of a firm’s assembly operations tends
to decrease due to increased manufacturing costs, higher manufacturing overhead,
longer shipping times, and additional expenses related to stock management and
enforcing conformance quality (Mukherjee et al., 2000; Salvador et al., 2002). The
emergence of the dominant design configuration also reduces the stress on the
component supply chain. In the absence of a stable core product configuration, suppliers
may experience scale diseconomies due to component variety, which has a negative
effect on the component sourcing performance of a firm (Wacker & Trelevan, 1986). It
also increases standardization efforts and improves the effectiveness of component
supply chains, further reducing the overall operational costs of manufacturing complex
assembled products (Wakharia et al., 1996; Park & Ro, 2010; Park et al., 2018). In order
to consider these implications on the operational performance of firms and their supply
chains, it is first important to understand the dynamics related to component selection
strategy in the context of complex assembled products.
10
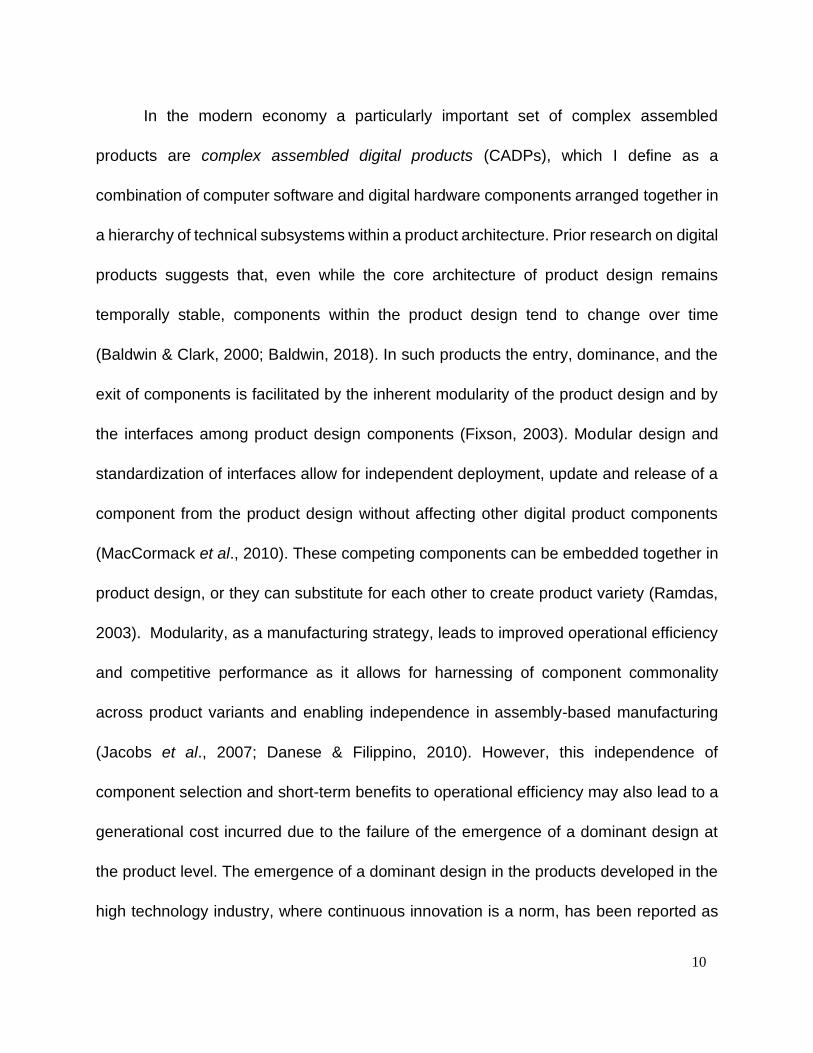
In the modern economy a particularly important set of complex assembled
products are complex assembled digital products (CADPs), which I define as a
combination of computer software and digital hardware components arranged together in
a hierarchy of technical subsystems within a product architecture. Prior research on digital
products suggests that, even while the core architecture of product design remains
temporally stable, components within the product design tend to change over time
(Baldwin & Clark, 2000; Baldwin, 2018). In such products the entry, dominance, and the
exit of components is facilitated by the inherent modularity of the product design and by
the interfaces among product design components (Fixson, 2003). Modular design and
standardization of interfaces allow for independent deployment, update and release of a
component from the product design without affecting other digital product components
(MacCormack et al., 2010). These competing components can be embedded together in
product design, or they can substitute for each other to create product variety (Ramdas,
2003). Modularity, as a manufacturing strategy, leads to improved operational efficiency
and competitive performance as it allows for harnessing of component commonality
across product variants and enabling independence in assembly-based manufacturing
(Jacobs et al., 2007; Danese & Filippino, 2010). However, this independence of
component selection and short-term benefits to operational efficiency may also lead to a
generational cost incurred due to the failure of the emergence of a dominant design at
the product level. The emergence of a dominant design in the products developed in the
high technology industry, where continuous innovation is a norm, has been reported as

11
less likely relative to traditional products (Srinivasan et al., 2006). To address such
scenarios of product development I adopt the configurational view of the product. At the
granular level, a CADP is represented by a set of components that complete the
functionality of a product in a specific configuration. I posit that, in the context of CADPs,
the competition among components to address specific functionalities of the product
leads to the emergence of a dominant design configuration.
In this paper I explore two ideas: (1) the factors that influence the entry of a
component into a dominant design configuration of a CADP, and (2) the factors that
influence the longevity of a component in the product market. I define component
dominance as the inclusion of a component in the dominant design configuration. As
explained before, the entry of a component into the dominant design configuration of a
CADP is an important event in the component’s lifecycle, because it allows for
standardization of the component within a product category and shifts the innovation
focus to incremental improvements and cost optimization. It also allows for more stability
in the component’s evolution and in the development of complementary services around
the component technology and improves both manufacturing efficiencies and supply
chain collaboration (Anderson & Tushman, 1990; Mishra & Shah, 2009).
I also examine component longevity, the number of years a component is included
in any of the models in production within the CADP market. Typically, product markets
are modeled as a technological cycle of an incumbent technology followed by a
technological discontinuity due to the emergence of a new technology (Tushman &
12
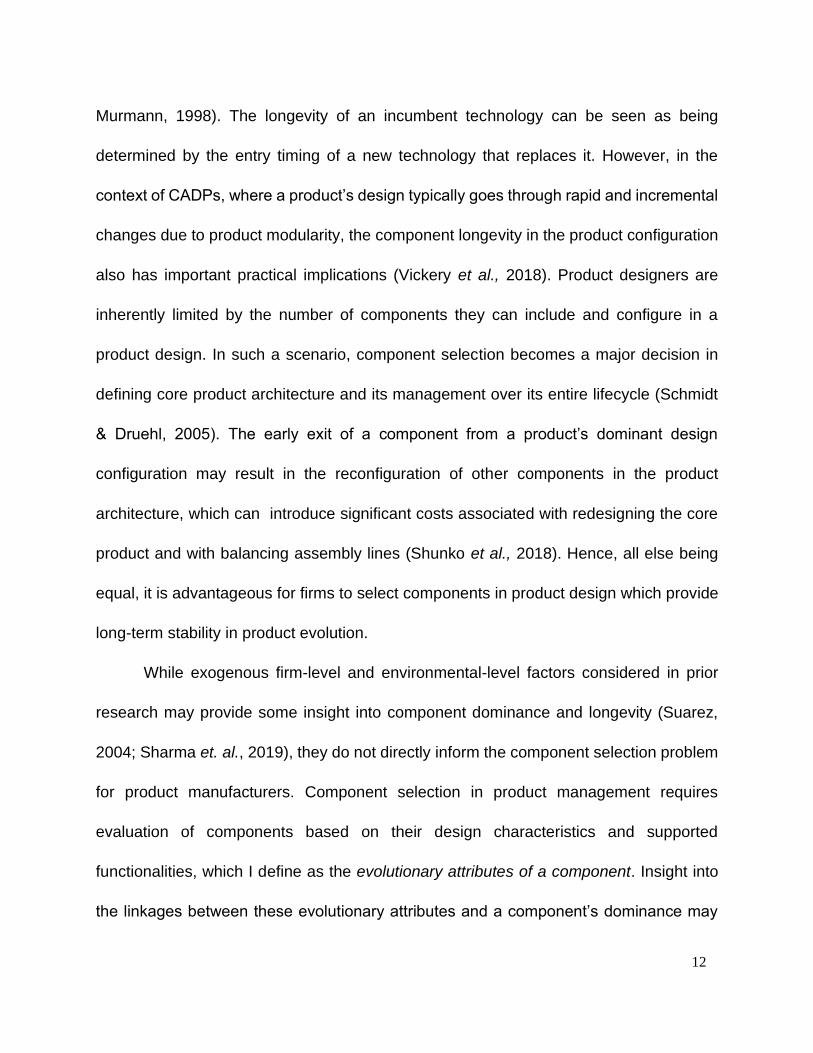
Murmann, 1998). The longevity of an incumbent technology can be seen as being
determined by the entry timing of a new technology that replaces it. However, in the
context of CADPs, where a product’s design typically goes through rapid and incremental
changes due to product modularity, the component longevity in the product configuration
also has important practical implications (Vickery et al., 2018). Product designers are
inherently limited by the number of components they can include and configure in a
product design. In such a scenario, component selection becomes a major decision in
defining core product architecture and its management over its entire lifecycle (Schmidt
& Druehl, 2005). The early exit of a component from a product’s dominant design
configuration may result in the reconfiguration of other components in the product
architecture, which can introduce significant costs associated with redesigning the core
product and with balancing assembly lines (Shunko et al., 2018). Hence, all else being
equal, it is advantageous for firms to select components in product design which provide
long-term stability in product evolution.
While exogenous firm-level and environmental-level factors considered in prior
research may provide some insight into component dominance and longevity (Suarez,
2004; Sharma et. al., 2019), they do not directly inform the component selection problem
for product manufacturers. Component selection in product management requires
evaluation of components based on their design characteristics and supported
functionalities, which I define as the evolutionary attributes of a component. Insight into
the linkages between these evolutionary attributes and a component’s dominance may

13
assist product designers in making informed component selections and provide more
control over the product technological life cycle. For firms, it can mean both lower costs
in product design and the opportunity for strategic investment into technologies which,
based on their technical attributes, are expected to dominate in the future. At the industry
level this results in faster standardization of the core product design configuration and a
shift in emphasis towards incremental innovations in the product category.
In particular, I identified three specific evolutionary attributes of components to
model the technological cycle of components: (1) pleiotropy of a component, (2)
openness of the standard supporting the component, and (3) innovation source of the
component. The total number of functions performed by a component is known as its
pleiotropy (Frenken, 2006). A standard defining the technical specification of a component
can be open or closed. Suitability and acceptance of a technological component may
also be dependent on the innovation source of the technology. A component can be
developed either within the technological paradigm in which the component is embedded
or outside of it. I posit that the pleiotropy of a component, the openness of the standard
supporting the component and the innovation source of the component influences both
the acceptance of a component into the dominant design configurations of CADPs and
its longevity in the product market.
To empirically test my propositions, I selected the modern television (TV) product
category as the product domain for my analysis of CADPs. The television product domain
is an especially attractive one for the study because this domain has seen rapid changes

14
due to the entry and exit of a variety of components. For instance, the dominant design
configuration of a TV in 2002 was an analog input-based CRT screen television. By 2016,
a majority of the components found in the 2002 dominant design configuration of a TV
had been replaced by newer components, such as LED displays, HDMI ports, and
wireless connectors. Using a longitudinal dataset collected specifically for this research
of 2,830 TV models produced from 2002 to 2016, I model the inclusion of a component
into the dominant design configuration of a TV as a function of its evolutionary attributes.
my results suggest that all three factors significantly predict a component’s entry into the
dominant design configuration, with open standards as the single biggest influencer.
Further, I model component longevity as the number of years a component is present in
the TV market, and I find that both open standards and a component’s pleiotropy to be
positively associated with component longevity.
My research contributes to the operations management literature in at least three
ways. First, I empirically model the technological cycle of a CADP in terms of its
constituent components and highlight the relevance of this approach for CADP
manufacturing and supply chains. I consider technological cycles at the component level
in order to provide insight into how product managers can adopt a lifecycle approach for
managing CADPs, which are modular and fast-changing, and can evolve over time
without encountering architectural transformation. Second, complementing extant
market-level and product-level studies in the literature (e.g., Li & Liu, 2018), I provide
insight into the entry and exit of the technological components in a dominant design
15
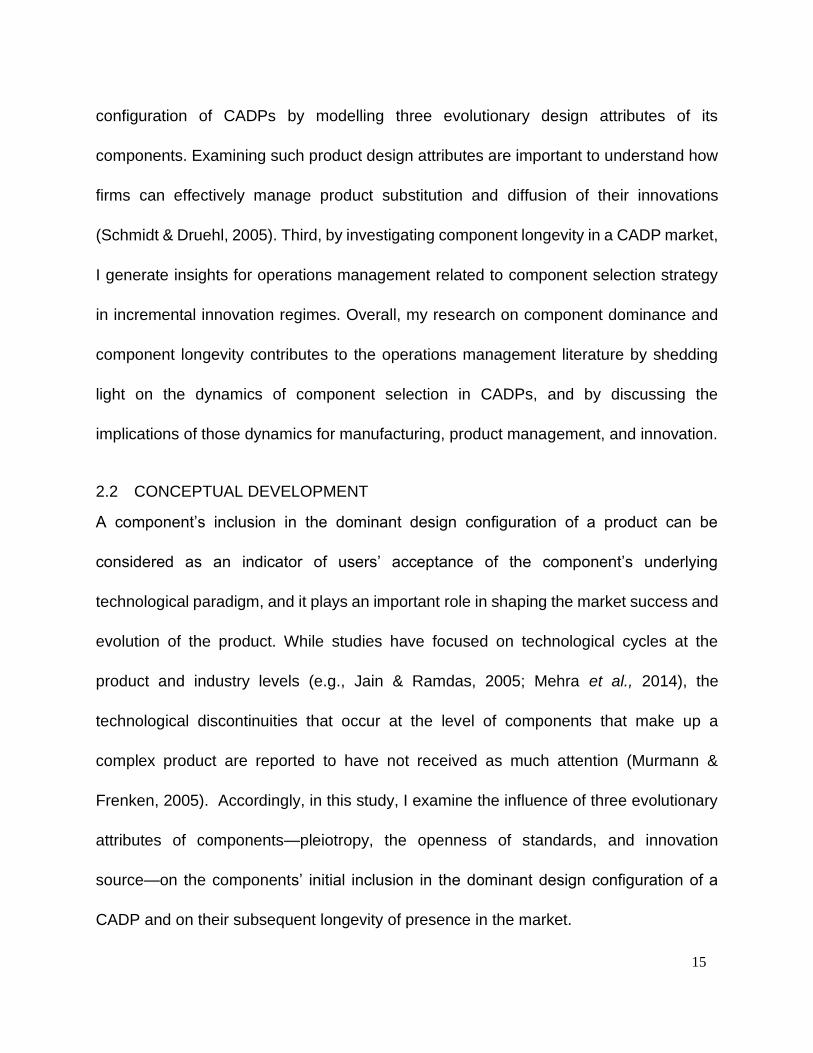
configuration of CADPs by modelling three evolutionary design attributes of its
components. Examining such product design attributes are important to understand how
firms can effectively manage product substitution and diffusion of their innovations
(Schmidt & Druehl, 2005). Third, by investigating component longevity in a CADP market,
I generate insights for operations management related to component selection strategy
in incremental innovation regimes. Overall, my research on component dominance and
component longevity contributes to the operations management literature by shedding
light on the dynamics of component selection in CADPs, and by discussing the
implications of those dynamics for manufacturing, product management, and innovation.
2.2 CONCEPTUAL DEVELOPMENT
A component’s inclusion in the dominant design configuration of a product can be
considered as an indicator of users’ acceptance of the component’s underlying
technological paradigm, and it plays an important role in shaping the market success and
evolution of the product. While studies have focused on technological cycles at the
product and industry levels (e.g., Jain & Ramdas, 2005; Mehra et al., 2014), the
technological discontinuities that occur at the level of components that make up a
complex product are reported to have not received as much attention (Murmann &
Frenken, 2005). Accordingly, in this study, I examine the influence of three evolutionary
attributes of components—pleiotropy, the openness of standards, and innovation
source—on the components’ initial inclusion in the dominant design configuration of a
CADP and on their subsequent longevity of presence in the market.
16
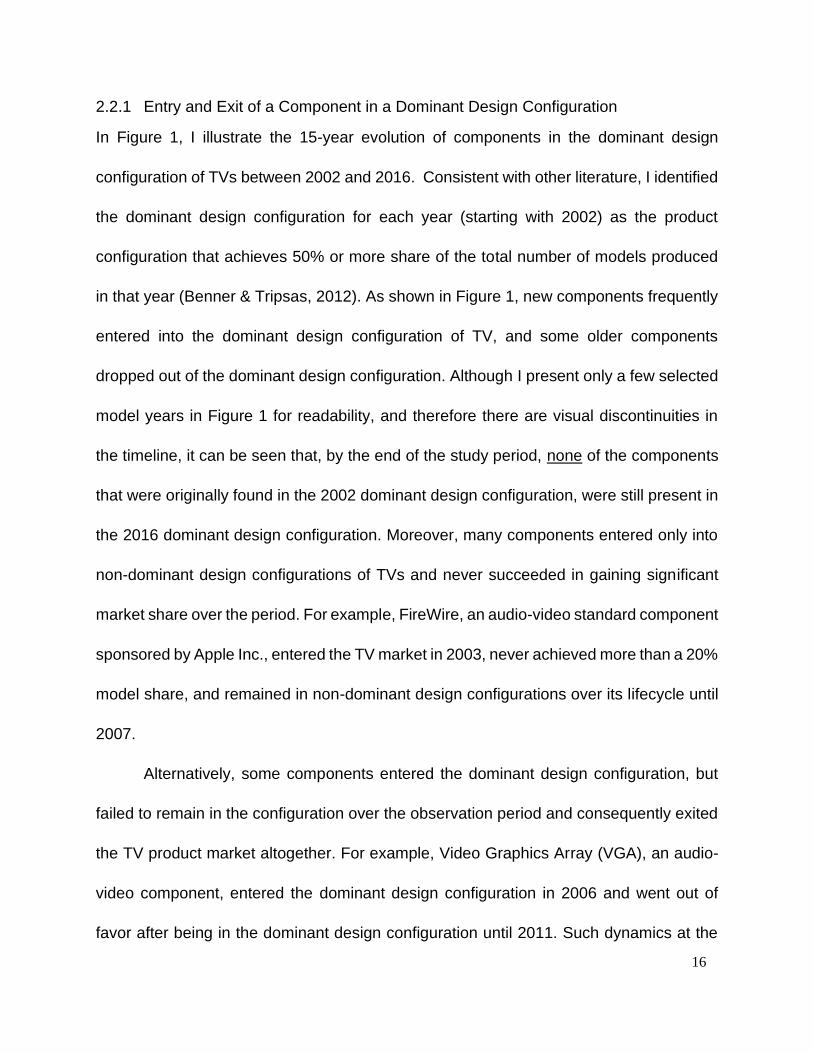
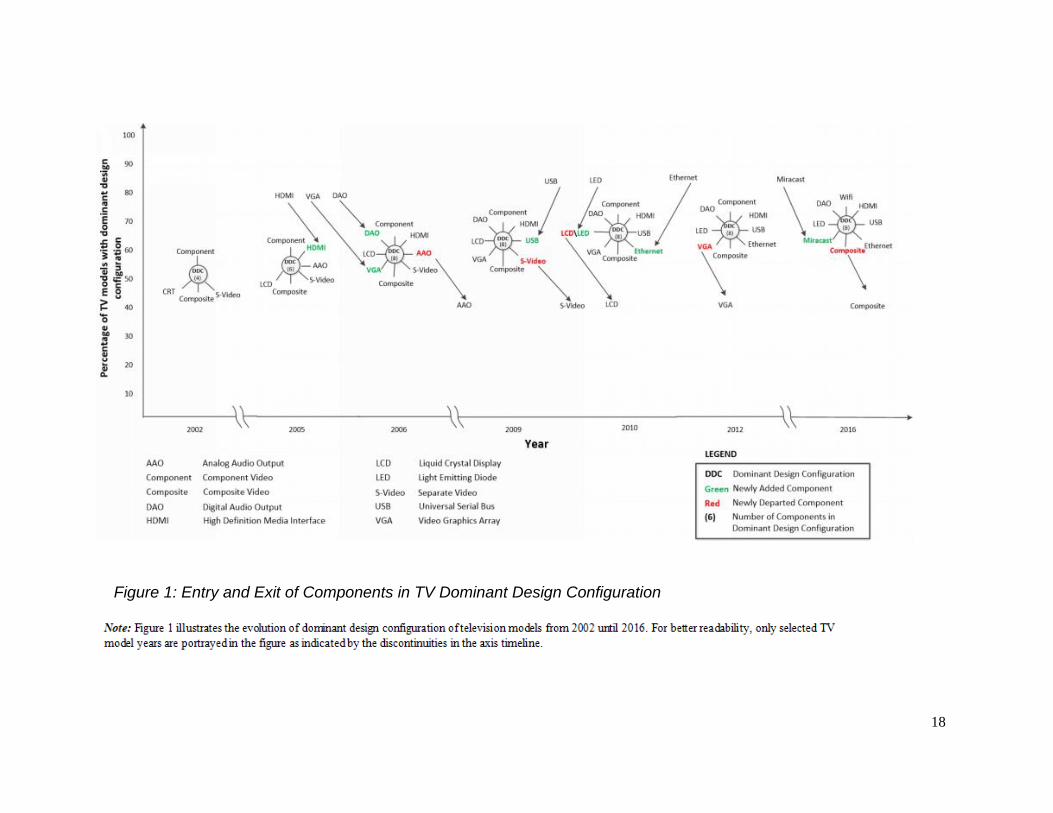
2.2.1 Entry and Exit of a Component in a Dominant Design Configuration
In Figure 1, I illustrate the 15-year evolution of components in the dominant design
configuration of TVs between 2002 and 2016. Consistent with other literature, I identified
the dominant design configuration for each year (starting with 2002) as the product
configuration that achieves 50% or more share of the total number of models produced
in that year (Benner & Tripsas, 2012). As shown in Figure 1, new components frequently
entered into the dominant design configuration of TV, and some older components
dropped out of the dominant design configuration. Although I present only a few selected
model years in Figure 1 for readability, and therefore there are visual discontinuities in
the timeline, it can be seen that, by the end of the study period, none of the components
that were originally found in the 2002 dominant design configuration, were still present in
the 2016 dominant design configuration. Moreover, many components entered only into
non-dominant design configurations of TVs and never succeeded in gaining significant
market share over the period. For example, FireWire, an audio-video standard component
sponsored by Apple Inc., entered the TV market in 2003, never achieved more than a 20%
model share, and remained in non-dominant design configurations over its lifecycle until
2007.
Alternatively, some components entered the dominant design configuration, but
failed to remain in the configuration over the observation period and consequently exited
the TV product market altogether. For example, Video Graphics Array (VGA), an audio-
video component, entered the dominant design configuration in 2006 and went out of
favor after being in the dominant design configuration until 2011. Such dynamics at the

17
component level can be expected to challenge the optimization of product design and
cost efficiencies in production cycles. All else being equal, a desirable configuration of a
product for a production line entails a stable set of core components and reconfigurable
peripherals. However, the modular nature of CADPs demands a selection strategy of
components at the product design stage, which minimizes production-related re-
configurations and potentially limits that activity to the peripherals. Understanding the
factors that influence the inclusion of components in the dominant design configuration
can provide insight into this selection strategy.
18
Figure 1: Entry and Exit of Components in TV Dominant Design Configuration
19
2.2.2 Pleiotropy and component adoption
The concept of pleiotropy was developed more than 100 years ago in biology and referred
to the phenomenon of a single gene affecting multiple traits (Curtsinger, 2001). It is the
basis of current genome mappings and gene editing technologies. Every organism is
made up of many genes, and these genes affect one or more traits in that organism. High
pleiotropy genes, or genes which affect multiple traits, influence an organism’s growth
and evolution in more ways than low pleiotropy genes, and some research suggests that
the pleiotropy of a gene is the single most contributing function of its adaptation, survival
and success in the long term evolutionary process of an organism (Dubcovsky & Dvorak,
2007).
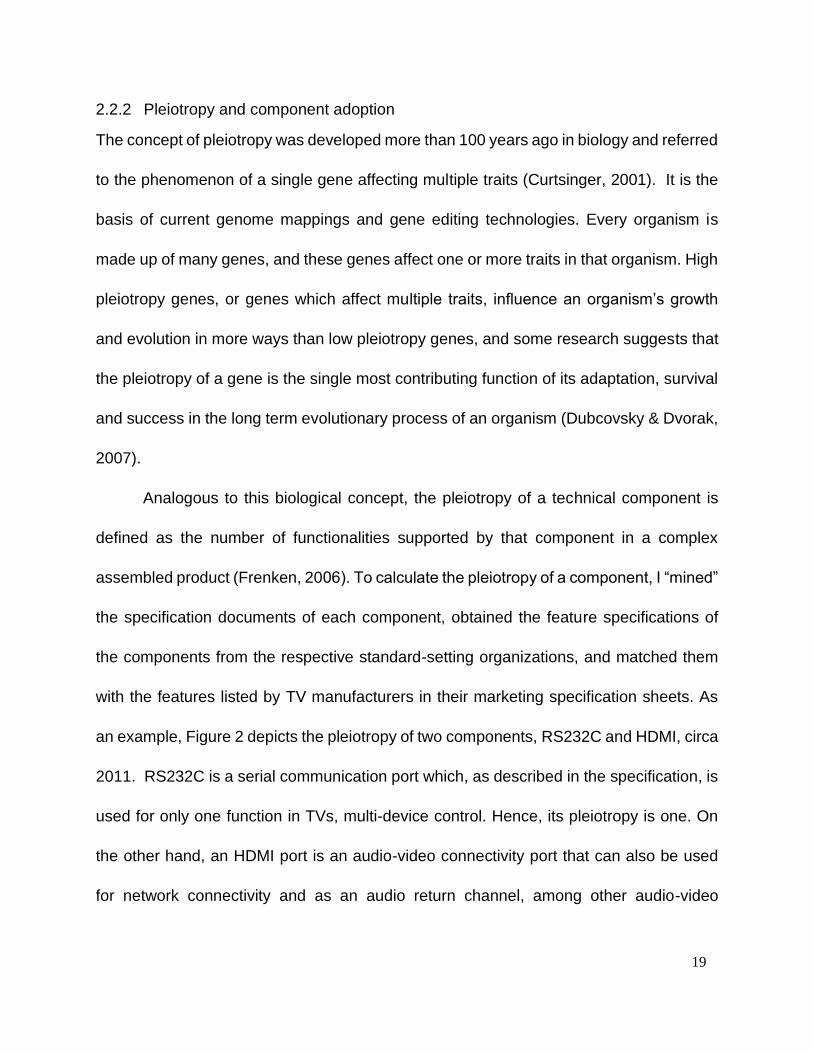
Analogous to this biological concept, the pleiotropy of a technical component is
defined as the number of functionalities supported by that component in a complex
assembled product (Frenken, 2006). To calculate the pleiotropy of a component, I “mined”
the specification documents of each component, obtained the feature specifications of
the components from the respective standard-setting organizations, and matched them
with the features listed by TV manufacturers in their marketing specification sheets. As
an example, Figure 2 depicts the pleiotropy of two components, RS232C and HDMI, circa
2011. RS232C is a serial communication port which, as described in the specification, is
used for only one function in TVs, multi-device control. Hence, its pleiotropy is one. On
the other hand, an HDMI port is an audio-video connectivity port that can also be used
for network connectivity and as an audio return channel, among other audio-video
20
functionalities. Counting all of HDMI’s available functions in 2011 gives it a pleiotropy
score of 10.
Figure 2: Pleiotropy Example (Component designs in the year 2011)
There are a number of reasons to select evolutionary biology, and, more
specifically, pleiotropy, as a basis for my study. As per the cited researchers, I see multiple
similarities between the evolution of an organism with respect to gene pleiotropy and
innovation progress with respect to the technical design of a CADP. For instance, similar
to technical design, gene-trait relationships are modular in nature - a mutation in one gene
has a greater influence on closely related traits in an organism than it does on dissimilar
traits (Wang et al., 2010). Second, a gene influencing multiple traits has a greater per trait
influence, and its deletion may lead to sabotaging of the whole production function of an
organism (Lilburn et al., 1992). Similarly, high pleiotropy components are harder to
replace and change, as even a minor change in a high pleiotropy component affects
multiple functionalities. This strengthens the position of such a component in product
design, tending to support the early dominance of that component and component
longevity (Murmann & Frenken, 2006).
21
Biological studies have shown that organisms generally have fewer high pleiotropy
genes than low ones. A high pleiotropic gene has the capability of constraining and
stabilizing the evolution of an organism over multiple generations, since a high pleiotropic
gene can tie up the greater part of evolutionary variance by linking multiple traits to a
single mutation cycle; the rate of evolution is then determined by the remaining free
genetic variance (Hansen, 2003). Similar to this, in the product design of CADPs, the
constraining effect of a high pleiotropy component can lead to a stable core design
configuration, and variations occur only among the peripheral, low pleiotropy components
of the product design. High-pleiotropy components are attractive in a regime of
incremental innovation in CADPs because their inclusion in a CADP configuration
reduces the search cost for designers seeking novelty (Murmann & Frenken, 2006). This
means a higher pleiotropic component should have a higher likelihood of achieving a core
position in the dominant design configuration and remaining in the CADP market for a
longer period of time, which is my first set of hypotheses:
(H1a): All else being equal, a high pleiotropy component is more likely to be part of the
dominant design configuration of a complex assembled digital product, compared to a
low pleiotropy component.
(H1b): All else being equal, a high pleiotropy component has greater longevity in a
complex assembled digital product market, compared to a low pleiotropy component.

22
2.2.3 Open Standards and Component Adoption
As noted earlier, an open standard is defined as a technical specification which is made
available to all participating firms and is developed and maintained via a collaborative and
consensus-driven process (ITU, 2017). Closed standards, on the contrary, are developed
by individual firms and those firms have proprietary control over the development,
maintenance, and licensing of the standard (Zhu et al., 2006). Sponsoring an open
standard both enables and constrains the evolution of a technology at the same time. On
the one hand, it allows for distributed development of the standard and any
complementary goods and services. On the other hand, it constrains the direction of
standard development by moving the trajectory of innovation from the hands of its
institutional sponsors to the community and standard-setting organizations (Garud et al.,
2002).
However, in networked technological ecosystems, the benefits of sponsoring and
adopting open standards often outweigh the benefits of a proprietary standard. While
committing to open standards might lead to a poor appropriability regime for a firm, it
allows for faster adoption of technology by rival firms and complementary service creators
by reducing network-related entry thresholds and by stimulating cooperative input to
advance the technological offerings of a standard (West, 2003). This, in turn, can lead to
a larger user base of the technology and a network large enough to accommodate
multiple competing players, generating revenues by differentiating their services and
products or developing complementary products and services. For example, Khazam and
Mowery found that in the case of Sun Microsystems, an open standard strategy
23
contributed to the establishment of Sun’s SPARC architecture as the dominant design in
the workstation market (Khazam & Mowery, 1994). Supporting and sponsoring an open
standard also provides benefits to both incumbent and new entrant firms (Greul et al.,
2017). Incumbents who have resources and the expertise to develop complementary
products around an open standard can benefit from the reduced cost base, weakening
competitors, faster adoption, and dominance and longevity of the technology (Alexy et al.,
2018). For example, IBM’s leadership in open standard sponsorship and development
generates the majority of its profits by selling complementary products, like software and
consulting services (Berlind, 2002). Finally, it has also been observed that the emergence
of a dominant design is more likely in the case where the standards are set by a
collaborative process (Srinivasan et al., 2006).
In high technology product domains, it is also possible that a dominant design
never emerges if the firms do not converge on a common standard and develop it as an
open standard under the aegis of a standard-setting organization. According to Tushman
& Rosenkopf (1992), acceptance of a component into a dominant design configuration is
a community level socio-political process that advocates “a negotiated logic enlivened by
actors with interests in competing technical regimes” (p.322). So, I posit that in the CADP
context components supported by open standards have a higher likelihood of adoption
by vendors and users, and a collaborative development environment for a standard lead
to the longer presence of the standard in a technological ecosystem. Accordingly, I
propose the following testable hypotheses:

24
(H2a): All else being equal, a component supported by open standards is more likely to
be part of the dominant design configuration, compared to a component supported by
closed standards.
(H2b): All else being equal, a component that is supported by open standards, has greater
longevity in a complex assembled digital product market, compared to a component
supported by closed standards.
2.2.4 Innovation Source and Component Adoption
An innovation artifact can be endogenous (internal) or exogenous (external) to a firm, a
specific industry (Andergassen & Nardini, 2005), or even a country (Gu & Lundvall, 2016).
Endogenous innovation is defined here as the development of a component by firms
operating within the domain of a product in which it is introduced. For example, the Mobile
High definition Link (MHL), which is an audio-video streaming standard, was developed
by Samsung and Sony who are insiders in the television industry, whereas the Wireless
Display (WiDi), also an audio-video streaming standard, was developed by Intel
Corporation, which is an outsider to the television market. Hence, MHL is identified as
an endogenous innovation, whereas WirelessHD is categorized as an exogenous
innovation. All else being equal, product managers of CADPs are likely to have better
knowledge about, and control over, the evolution of components originating in their focal
industries versus those originating in external industries.
Endogenous innovation has been seen to trigger industry-level growth in many
sectors because it is easier to adopt knowledge from a related firm than to adopt
knowledge from a vastly different technological domain. An entity learns by associating
ideas with what they already know (Fichman & Kemerer, 1997). It has been observed that
25
firms operating in one industry sector tend to form closely knit and vertically integrated
export economies which tend to have rapid formal and informal exchanges of ideas due
to a common knowledge base, employees and communities (Tallman et al., 2004). It is
relatively easier to transfer knowledge in a cohesive environment compared to a
disassociated setting, and common knowledge plays a role in amplifying such effects
(Reagans & McEvily, 2003). For example, in the context of the computer industry, the
R&D spillovers effects are larger in “home” (internal) industries as compared to “foreign”
(external) industries (Griliches, 1991). Another example of the type of firms that benefit
from endogenous innovation within the industry would be those developing on open
source platforms like GitHub, where it has been shown that it is easier to absorb
knowledge and innovate from a similar development environment than a dissimilar
development environment, as the cost and administrative effort to search and absorb
knowledge is much lower in a similar environment. (Daniel et al., 2018).
Building on this prior research I posit that the components developed by firms
internal to the industry will have a relatively higher adaptability and acceptance in a
dominant design configuration. This adoption of an endogenously developed component
is expected to be much faster within the industry as the new component is more likely to
be aligned with the current design, as compared to an innovation coming from another
industry. The functionalities of a component developed within an industry have been
shown to be more aligned to the requirements of firms in that focal industry relative to
exogenous ones, which has the effects of both reducing organizational restructuring costs
26
for firms (Andergassen & Nardini, 2005) and increasing acceptance by peer firms from
the same industry (Benner & Tripsas, 2012). From the perspective of product architecture
I posit that adoption of innovation from within the industry will require less reconfiguration
of the product design, resulting in less restructuring of organizational processes and
research and development functions within the organization. Since a stable product
design is a prerequisite to emergence of a dominant design (Murmann & Frenken, 2006),
I posit that firms would tend to choose components internal to the focal industry to be part
of the dominant product design configuration. As a result, I propose the following testable
hypotheses:
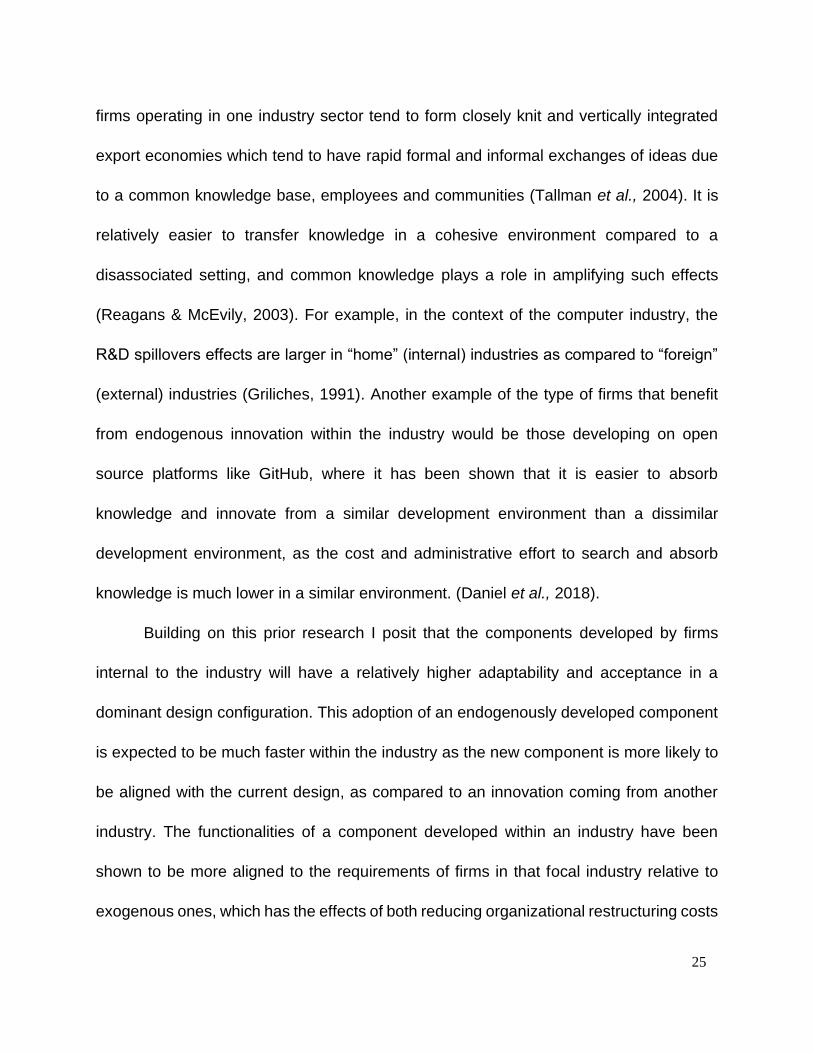
(H3a): All else being equal, a component developed endogenously is more likely to be
part of the dominant design configuration, compared to a component developed
exogenously.
(H3b): All else being equal, a component developed endogenously has greater longevity
in a complex assembled digital product market, compared to a component developed
exogenously.
Figure 3 summarizes these relationships into the research model that will be empirically
tested.
Figure 3: Research Model

27
2.3 VARIABLE OPERATIONALIZATION AND MODEL ESTIMATION
2.3.1 Data Collection
My study of CADPs is set in the context of the evolution of digital televisions and their
components. Since I am interested in the dominance and longevity of components in
television design, I constructed a unique multi-level dataset of TV models, their
components and functionalities through multiple sources. I collected specification data of
all TV models produced by the top seven TV manufacturers in North America between
2002 and 2016. These seven manufacturers consistently lead the TV industry in market
share and held nearly 85 % of the total market share in 2015 (Statista, 2017). The rest of
the market is distributed across many small manufacturers at the low end of the market,
and most of these firms do not have an online presence. Therefore the availability of
detailed specifications data about the TV models manufactured by them is limited and
inconsistent. For the years 2008–2016, data about TV models were secured from the
national Consumer Electronics Show (CES) announcements and later verified from model
lists available on manufacturers’ websites and the website Flatpanelshd.com. CES is
traditionally organized in the first week of every year, where top manufacturers of digital
electronics announce their products to be released that year. In any case of an inexact
match between CES announcements and the lists on the manufacturers’ websites, I
selected the models available on manufacturers’ websites. For the years 2002 to 2007, I
visited the historical websites of TV firms using Wayback Machine and collected the list
of all TVs marketed for those six years. Most of the firms changed their domain names in
the last ten years, and hence archival search using tools such as the Wayback Machine

28
is an appropriate way to extract data about legacy systems including TV models (Arora
et al., 2016). This effort resulted in a comprehensive database of 2,830 TV models. For
each television model, its technical specifications were obtained from the website of the
manufacturing firm, and this data is cross-validated using specification information
available for the same model on www.cnet.com. For each component, the standards
documentation was downloaded from their respective special interest group portals, or
from portals of component sponsors. Overall, my dataset consists of 46 components that
were introduced in TV models at various points in time over a period of 15 years.
2.3.2 Variables
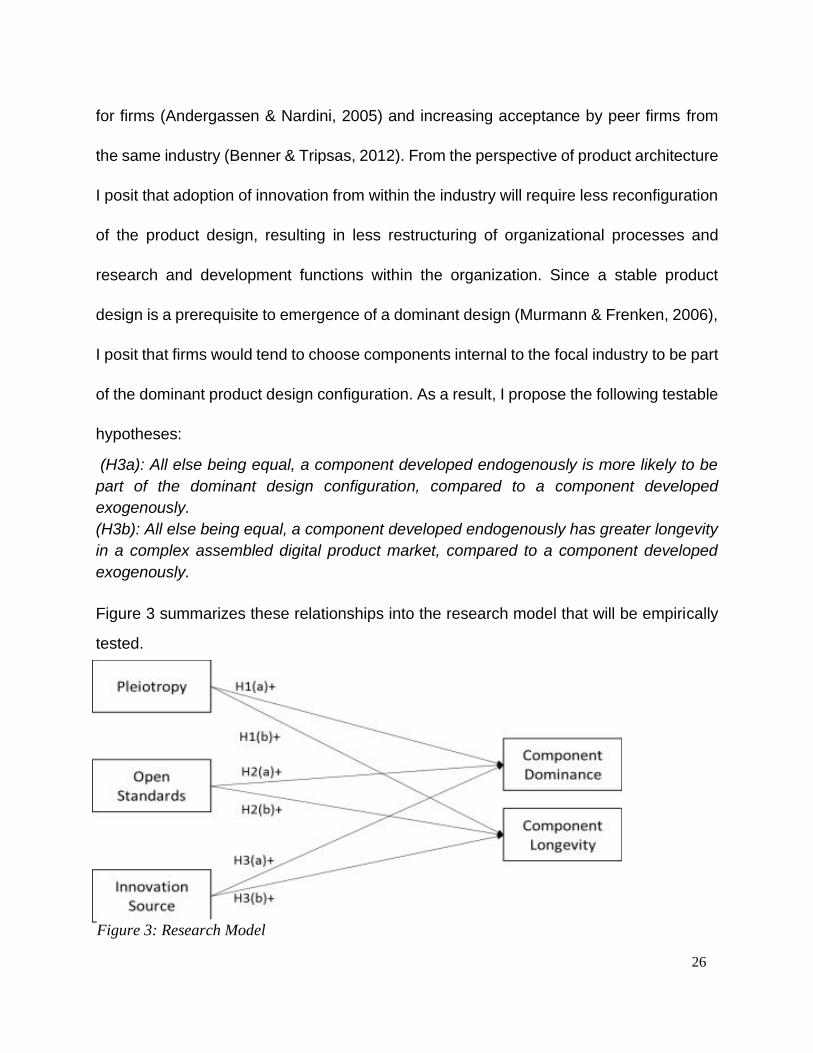
Consistent with prior empirical research, in a given year a component is said to be part of
the dominant design configuration when it is present in the majority (50% or more) of
television product models produced in that year (Suarez, 2004; Benner & Tripsas, 2012).
Figure 4 shows the model share of audio/video connectivity components in TV designs
between 2002 and 2016 which illustrates the variance in component dominance. For
example, the first component in the legend, DVI, a proprietary audio-video connectivity
port introduced in 2002, achieved a peak model share of 35% and exited the TV market
in 2008. In contrast, HDMI, which was also introduced in 2002, evolved to achieve a
model share of greater than 90% since 2006 and was still present in the dominant design
configuration of TVs in 2016. The dependent variable component longevity is measured
as the number of years a component remains in a given product category, and it is
operationalized by counting the number of years a component had been included in any
of the TV models produced by the top seven manufacturers in North America. For
29
example, the HDMI component has a longevity of greater than 15 years, whereas the DVI
port only had a longevity of 6 years.
Figure 4: Adoption of Audio-Video Components in TV Design
Pleiotropy measurement
I created pleiotropy maps for each year for each component, as components were
introduced over a period of time. The steps involved in this derivation are detailed in the
supplement Appendix A. In brief, to draw pleiotropy maps and to measure the pleiotropy
score of each component I conducted a detailed text mining analysis on the specification
documents of TV models. I first extracted all the features listed in specification documents
using word frequency analysis. Based on most frequently occurring word combinations, I
clustered the words and identified the main features in the TV models. I then extracted
component occurrence in TV models using manual coding, and cross-validated it by
conducting word frequency analysis on the specification documents. After matching

30
specifications of components and TV features extracted from text mining analysis, I
developed the pleiotropy map for each of the 15 years (2002-2016) in my observation
period. There is a significant variance in the pleiotropy score of different components in a
given year. For example, the pleiotropy scores in 2011 range from 1 (component: AAO)
to 10 (component: HDMI).
Open standards and Innovation source
The other two main variables are binary predictors. Open standards capture the
openness of the standard supporting a component. A component can either be
developed based on an open standard or a proprietary standard and therefore it is
measured as a binary predictor. The identification of a component as an open standard
or proprietary standard is based on the description provided in the component’s
specification document. Innovation source is a similar binary variable, where a
component developed within an industry domain is scored as a 1, or 0 otherwise. I used
component specification documents and press releases to make this assessment.
Control variables
The research models also include a set of control variables based on a review of the
literature, including (a) the type of the component (digital vs analog, software vs
hardware, etc.), (b) the number of firms introducing a component in the first year, (c) the
introductory footprint of the component, and (d) the royalty (licensing) fees associated
with a component. After the digitalization of television content in 2008 most television
manufacturers transitioned from analog-based to digital product design by introducing
more digital components, either through software or hardware (Livingston et al., 2013).

31
Initial adopters of a technology are key determinants in the success or failure of a
technology. The speed of innovation adoption and its dominance is directly related to
the adoption timing of firms. All else being equal, higher initial adoption leads to faster
market dominance (Christensen, 1992a). I control for initial adoption as the number of
firms adopting a component in its first year of introduction. The introductory footprint is
the initial model share of a component averaged across all firms, and it is argued to be
a strong determinant for the successful adoption of a technological artifact (Kishore &
McLean, 1998). Licensing a technology for royalties to competitors and industry
partners results in a reduction in the likelihood of the emergence of a competing
technology, and in the dominance of a focal technology in the industry (Hill, 1992). I
control for licensing in my models as a binary predictor. Finally, I used dummy variables
to account for the fixed effects of the component type. Table 27 in Appendix A lists all
the variables of interest with additional details of their measurements.
2.3.3 Estimation Models
Component Dominance
Overall, I am interested in identifying the influence of a component’s evolutionary
attributes on component dominance and component longevity. Component dominance
may not occur for some components due to left and right censoring of the data collected
during my observation period. Left censoring may occur due to the withdrawal of a
component by firms before it ever achieves dominance. On the other hand, limited
observations on a newly introduced component due to the truncation of the study period

32
may result in right censoring. Hence, similar to other studies in the literature, I employ
hazard models to analyze the entry of components in the dominant design configuration
of TVs (Ramasubbu & Kemerer, 2015). I selected a semi-parametric Cox-proportional
hazard model for my analysis over other parametric proportional hazard models, and
accelerated failure time models as it does not require the assumption of an underlying
distribution for the base hazard or survival function (Wuttke et al., 2019). My first
specification is related to a component entering into a dominant design configuration, and
is shown in Equation (1).
hi(t/X) = λ0(t). exp {α1(pleiotropyi ) + α2(open standardi) + α3(innovation sourcei) +
β(control variablesi)} (1)
Where, hi(t/X): The hazard of dominance for the ith component at year t, given a set of
covariates X; λ0(t): a baseline hazard that is a function of time, but does not vary by
individual component; αs: the coefficients of the study variables; and β: a vector of
coefficients of the control variables.
Note that in this application of hazard models, the “hazard rate” and “failure event” are
interpreted as positive and desirable outcomes of the phenomenon. A higher hazard rate
signifies a higher likelihood of a component entering into the dominant design
configuration at a given point in time. The occurrence of a “failure event” in the analysis
is interpreted as a component’s successful entrance into the dominant design
configuration (i.e., the ‘failure’ of the replaced component). This is consistent with their
use in this literature (Fichman & Kemerer, 1999).

33
Component Longevity – Count Model Specification
In addition to whether a component becomes part of the dominant design configuration, I
am also interested in predicting a component’s longevity in product design, based on the
evolutionary attributes of the component. Recall that component longevity is defined as
the number of years a component is included in any TV model, and this number is always
greater than or equal to one.
As component longevity is a count variable, count models, such as Poisson and
negative binomial regressions, are best suited for this type of analysis rather than ordinary
least squares regression. And, in cases where the assumption of the equality of the
conditional mean and variance function is violated, negative binomial regression is
preferred over the Poisson regression (Wooldridge, 2002). First, I compared the
conditional mean of the dependent variable, component longevity, with its variance, and
then conducted a likelihood ratio test. These tests indicated that the assumptions of the
Poisson model are violated and showed the presence of over-dispersion for component
longevity, and therefore the negative binomial regression model was chosen as the
appropriate approach for my analysis. Additionally, recall that my data is right-censored,
as many of the components continued to stay in product design post my observation
period. To account for this right censoring, I estimated a censored negative binomial
regression model (Hilbe, 2011). I used component fixed-effect models, and to account for
heteroscedasticity, robust standard errors were used during hypothesis testing.

34
𝐿𝑜𝑔(𝑋𝛽; 𝑌, 𝛼) = 𝛿 {𝑌𝑖 ln (𝑒𝑥𝑝(𝑋𝑖𝛽)
1 + 𝑒𝑥𝑝(𝑋i𝛽)) −
ln(1 + exp(𝑋𝑖𝛽))
𝛼+ 𝑙𝑛𝛤 (𝑌𝑖 +
1
𝛼) − ln 𝛤(𝑌𝑖 + 1)
− 𝑙𝑛𝛤 (1
𝛼)} + τ {ln (𝛽1 (𝐶𝑖 − 1,
1
𝛼,
1
1 + exp(𝑋𝑖𝛽) − ln(𝛼)))}
The specification for estimating component longevity is shown in Equation (2): where, δ:
1 if observation not censored, 0 otherwise; τ: 1 if observation is right censored, 0
otherwise; α = heterogeneity parameter; β1 = incomplete beta function; Xi = Vector of
exogenous variables; β = Parameter vector; Ci = 1, if latest year of component i is equal
to 2017; 0 otherwise.
2.4 ANALYSIS
2.4.1 Descriptive Statistics
A total of 46 components introduced during 15 years of observation were used for my
analysis. Since not all components entered into the television models in the same year,
I have an unbalanced longitudinal data set, resulting in 708 total observations. Out of
these 708 observations, 179 observations began on or after the first “failure event”,
resulting in 529 observations for analysis.
2.4.2 Hypothesis Test Results
In the first set of hypotheses, I am interested in identifying the influence of pleiotropy of a
component (H1a), the type of standard supporting the component (H2a), and its
innovation source (H3a) on its likelihood of entering the dominant design configuration.
Table 1 presents results from a Cox proportional hazard estimation model. The first model

35
in Table 1 is a controls-only model, whereas the second model includes the hypothesized
variables for predicting component dominance.
Results presented in Table 1 support my hypotheses. Hypothesis 1a proposed that
ceteris paribus, at any given point in time, the Pleiotropy of a component significantly
influences the likelihood of dominance of the component. For every unit increase in the
functionality of a component, it is estimated to be nearly three times more likely to achieve
dominance in complex assembled digital products (H.R. = 2.82, p < 0.001). My second
hypothesis (2a) posited that components supported by open standards are more likely to
achieve dominance than components supported by proprietary standards. My results
show a significant hazard ratio for Open standard (H.R. = 4.44, p < 0.05). This result
suggests that components supported by open standards are almost four times more likely
to achieve dominance than components supported by closed standards. Innovation
source (H3a) also positively influenced the likelihood of dominance of a component (H.R.
= 4.40, p < 0.01). Components developed by firms within the focal industry are also about
four times more likely to achieve dominance compared to components developed by
external firms.
36
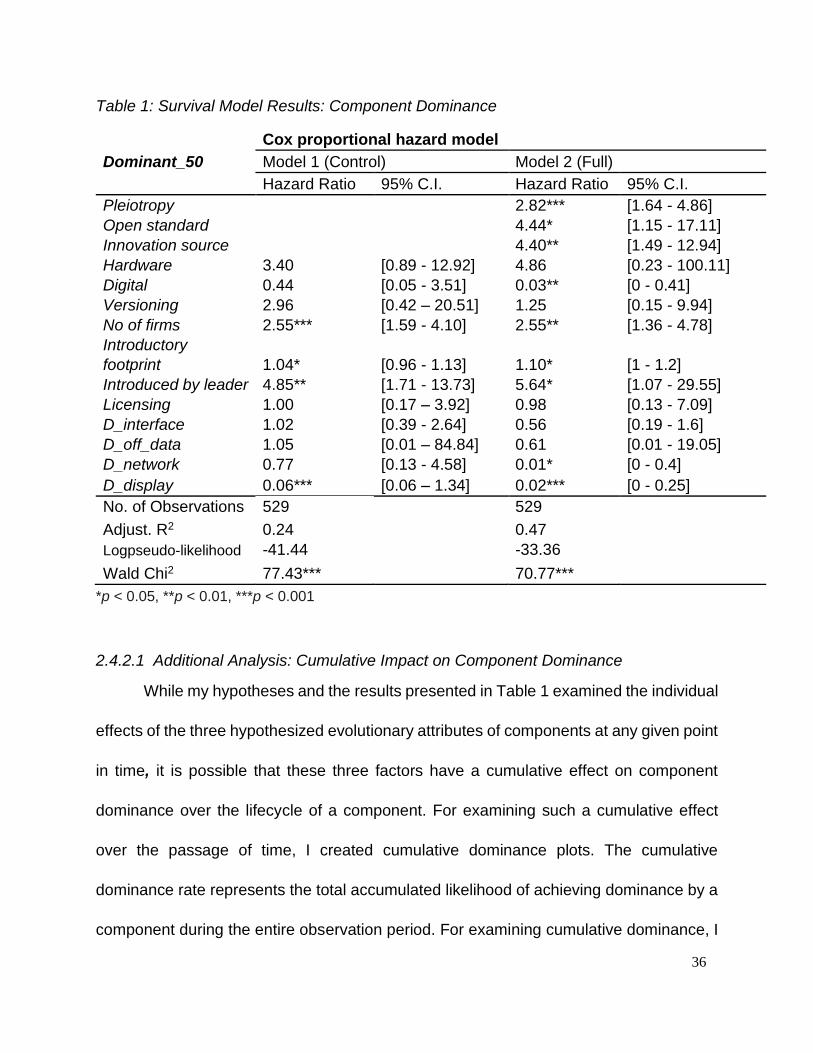
Table 1: Survival Model Results: Component Dominance
Cox proportional hazard model
Dominant_50 Model 1 (Control) Model 2 (Full)
Hazard Ratio 95% C.I. Hazard Ratio 95% C.I.
Pleiotropy 2.82*** [1.64 - 4.86]
Open standard 4.44* [1.15 - 17.11]
Innovation source 4.40** [1.49 - 12.94]
Hardware 3.40 [0.89 - 12.92] 4.86 [0.23 - 100.11]
Digital 0.44 [0.05 - 3.51] 0.03** [0 - 0.41]
Versioning 2.96 [0.42 – 20.51] 1.25 [0.15 - 9.94]
No of firms 2.55*** [1.59 - 4.10] 2.55** [1.36 - 4.78]
Introductory
footprint 1.04* [0.96 - 1.13] 1.10* [1 - 1.2]
Introduced by leader 4.85** [1.71 - 13.73] 5.64* [1.07 - 29.55]
Licensing 1.00 [0.17 – 3.92] 0.98 [0.13 - 7.09]
D_interface 1.02 [0.39 - 2.64] 0.56 [0.19 - 1.6]
D_off_data 1.05 [0.01 – 84.84] 0.61 [0.01 - 19.05]
D_network 0.77 [0.13 - 4.58] 0.01* [0 - 0.4]
D_display 0.06*** [0.06 – 1.34] 0.02*** [0 - 0.25]
No. of Observations 529 529
Adjust. R2 0.24 0.47
Logpseudo-likelihood -41.44 -33.36
Wald Chi2 77.43*** 70.77***
*p < 0.05, **p < 0.01, ***p < 0.001
2.4.2.1 Additional Analysis: Cumulative Impact on Component Dominance
While my hypotheses and the results presented in Table 1 examined the individual
effects of the three hypothesized evolutionary attributes of components at any given point
in time, it is possible that these three factors have a cumulative effect on component
dominance over the lifecycle of a component. For examining such a cumulative effect
over the passage of time, I created cumulative dominance plots. The cumulative
dominance rate represents the total accumulated likelihood of achieving dominance by a
component during the entire observation period. For examining cumulative dominance, I

37
treated Pleiotropy to be dichotomous, similar to Open standard and Innovation source,
and created a binary variable representing low and high levels of Pleiotropy. The
average pleiotropy in my sample is 2.82. Therefore, I defined pleiotropy scores of less
than three as low pleiotropy, and any score greater than three as high pleiotropy. Figures
5(a), 5(b) and 5(c) represent the cumulative dominance rate plots by pleiotropy, open
standards and innovation source, respectively.
As seen in Figure 5(a), the cumulative likelihood of achieving dominance by a
component is consistently higher for the high pleiotropy group compared to the low
pleiotropy group over the 15 years of my observation period. At the same time, the low
pleiotropy group has a flat accumulated likelihood to dominance, suggesting that, for low
pleiotropy components, the likelihood of entering the dominant design configuration does
not increase with the passage of time. Similarly, Figure 5(b) suggests that, while the
accumulated likelihood of entering into dominant design configuration increases for both
closed and open standard over the lifecycle of a component, the increase in dominance
likelihood is much higher for components supported by open standards. A similar trend is
noticeable in Figure 5(c) for components with exogenous vs endogenous innovation
source. In summary, even when modelled in this alternative way to account for cumulative
accumulation of dominance likelihood over the lifecycles of components, I see that the
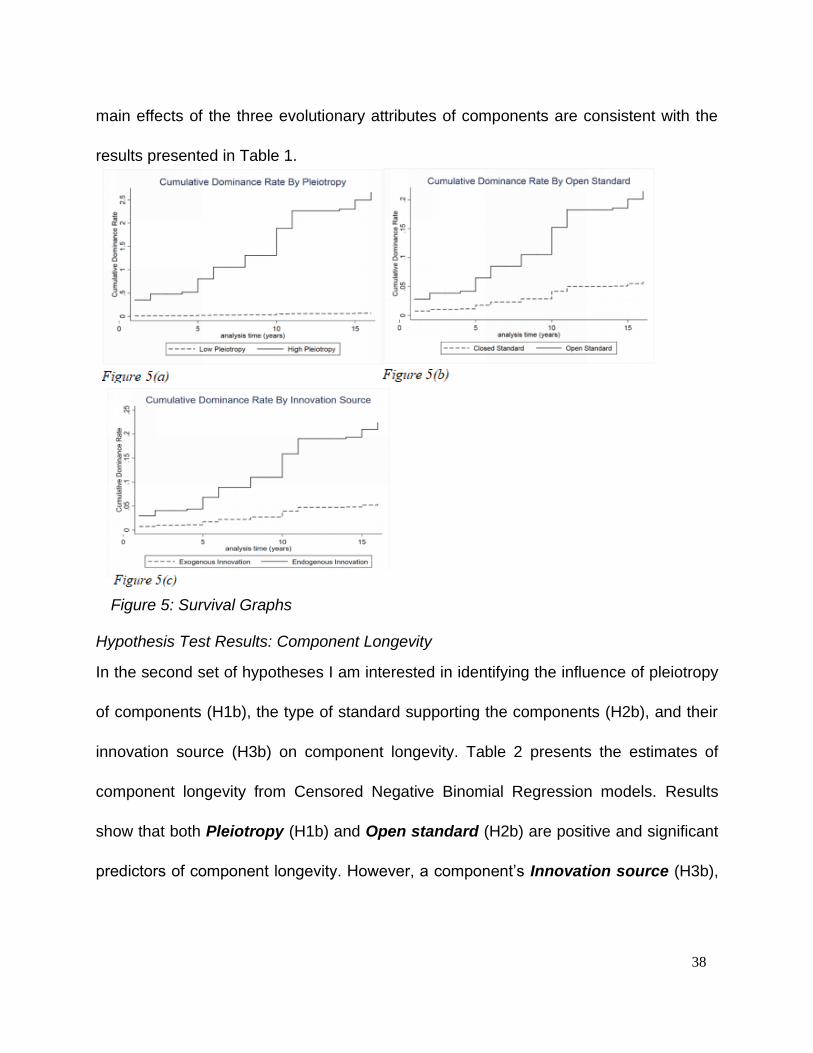
38
main effects of the three evolutionary attributes of components are consistent with the
results presented in Table 1.
Hypothesis Test Results: Component Longevity
In the second set of hypotheses I am interested in identifying the influence of pleiotropy
of components (H1b), the type of standard supporting the components (H2b), and their
innovation source (H3b) on component longevity. Table 2 presents the estimates of
component longevity from Censored Negative Binomial Regression models. Results
show that both Pleiotropy (H1b) and Open standard (H2b) are positive and significant
predictors of component longevity. However, a component’s Innovation source (H3b),
Figure 5: Survival Graphs
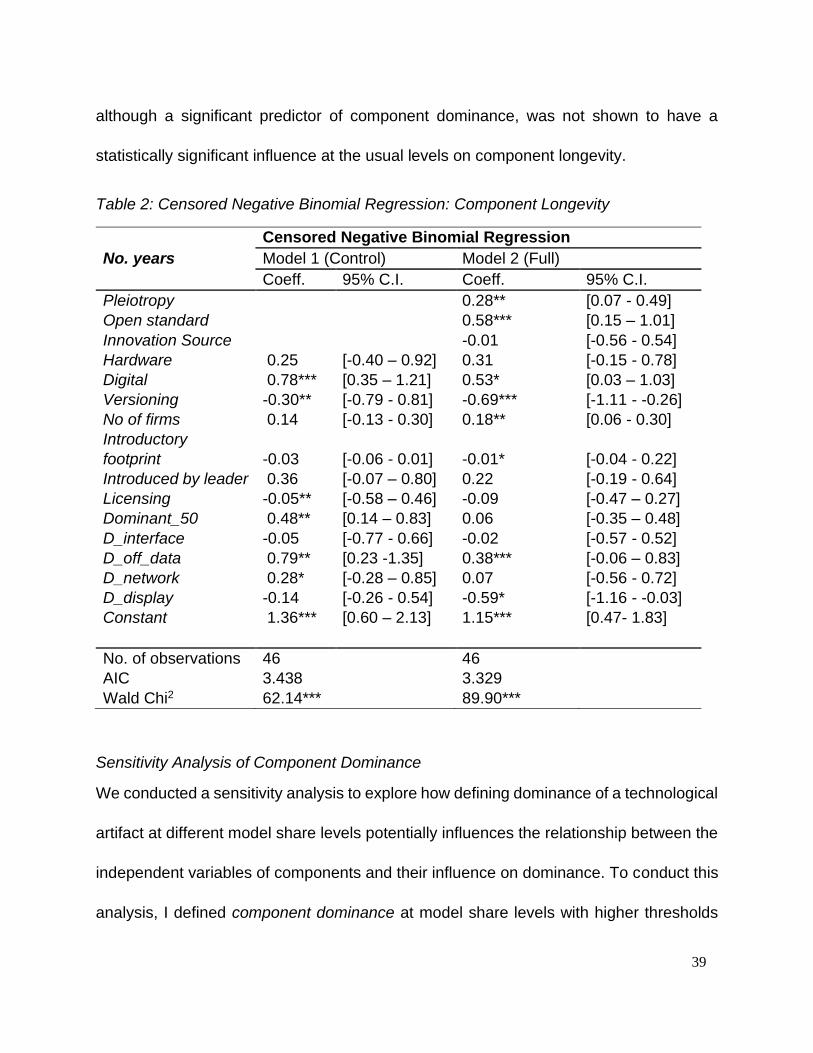
39
although a significant predictor of component dominance, was not shown to have a
statistically significant influence at the usual levels on component longevity.
Table 2: Censored Negative Binomial Regression: Component Longevity
Censored Negative Binomial Regression
No. years Model 1 (Control) Model 2 (Full)
Coeff. 95% C.I. Coeff. 95% C.I.
Pleiotropy 0.28** [0.07 - 0.49]
Open standard 0.58*** [0.15 – 1.01]
Innovation Source -0.01 [-0.56 - 0.54]
Hardware 0.25 [-0.40 – 0.92] 0.31 [-0.15 - 0.78]
Digital 0.78*** [0.35 – 1.21] 0.53* [0.03 – 1.03]
Versioning -0.30** [-0.79 - 0.81] -0.69*** [-1.11 - -0.26]
No of firms 0.14 [-0.13 - 0.30] 0.18** [0.06 - 0.30]
Introductory
footprint -0.03 [-0.06 - 0.01] -0.01* [-0.04 - 0.22]
Introduced by leader 0.36 [-0.07 – 0.80] 0.22 [-0.19 - 0.64]
Licensing -0.05** [-0.58 – 0.46] -0.09 [-0.47 – 0.27]
Dominant_50 0.48** [0.14 – 0.83] 0.06 [-0.35 – 0.48]
D_interface -0.05 [-0.77 - 0.66] -0.02 [-0.57 - 0.52]
D_off_data 0.79** [0.23 -1.35] 0.38*** [-0.06 – 0.83]
D_network 0.28* [-0.28 – 0.85] 0.07 [-0.56 - 0.72]
D_display -0.14 [-0.26 - 0.54] -0.59* [-1.16 - -0.03]
Constant 1.36*** [0.60 – 2.13] 1.15*** [0.47- 1.83]
No. of observations 46 46
AIC 3.438 3.329
Wald Chi2 62.14*** 89.90***
Sensitivity Analysis of Component Dominance
We conducted a sensitivity analysis to explore how defining dominance of a technological
artifact at different model share levels potentially influences the relationship between the
independent variables of components and their influence on dominance. To conduct this
analysis, I defined component dominance at model share levels with higher thresholds

40
than the standard 50%, including 55%, 60%, 65%, and 70% (Models 3, 4, 5, and 6,
respectively). The results of these sensitivity analyses are listed in Table 3.
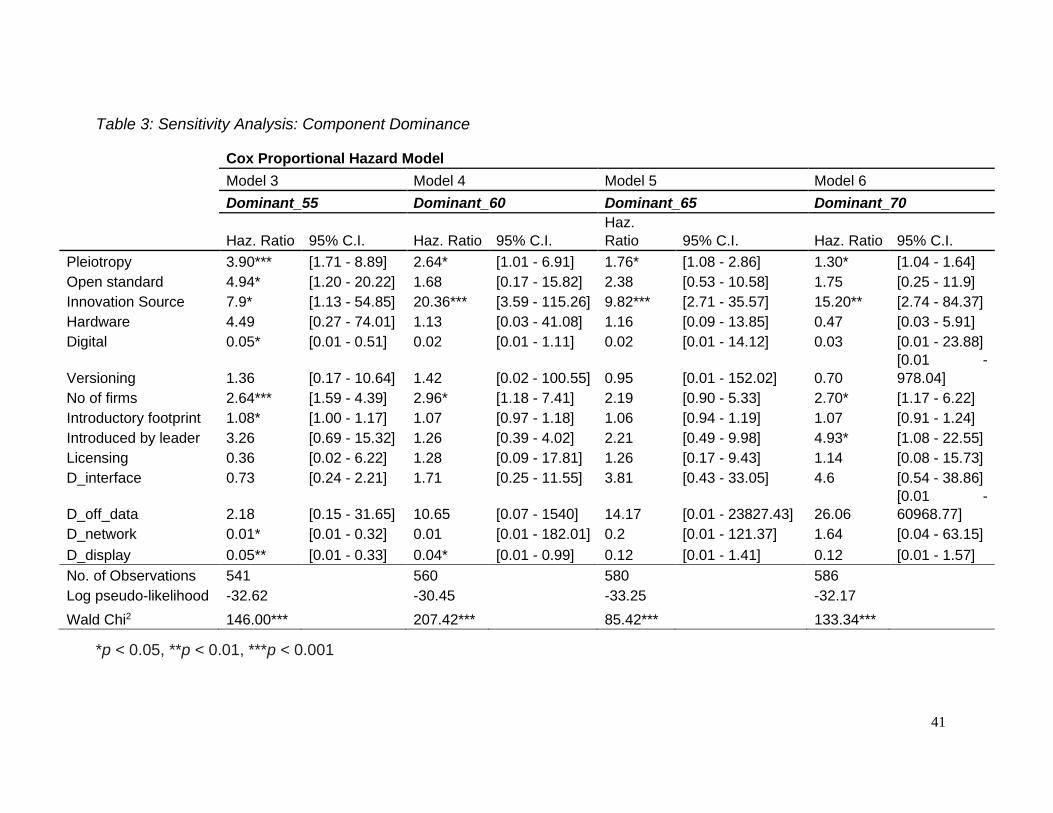
41
Table 3: Sensitivity Analysis: Component Dominance
Cox Proportional Hazard Model
Model 3 Model 4 Model 5 Model 6
Dominant_55 Dominant_60 Dominant_65 Dominant_70
Haz. Ratio 95% C.I. Haz. Ratio 95% C.I.
Haz.
Ratio 95% C.I. Haz. Ratio 95% C.I.
Pleiotropy 3.90*** [1.71 - 8.89] 2.64* [1.01 - 6.91] 1.76* [1.08 - 2.86] 1.30* [1.04 - 1.64]
Open standard 4.94* [1.20 - 20.22] 1.68 [0.17 - 15.82] 2.38 [0.53 - 10.58] 1.75 [0.25 - 11.9]
Innovation Source 7.9* [1.13 - 54.85] 20.36*** [3.59 - 115.26] 9.82*** [2.71 - 35.57] 15.20** [2.74 - 84.37]
Hardware 4.49 [0.27 - 74.01] 1.13 [0.03 - 41.08] 1.16 [0.09 - 13.85] 0.47 [0.03 - 5.91]
Digital 0.05* [0.01 - 0.51] 0.02 [0.01 - 1.11] 0.02 [0.01 - 14.12] 0.03 [0.01 - 23.88]
Versioning 1.36 [0.17 - 10.64] 1.42 [0.02 - 100.55] 0.95 [0.01 - 152.02] 0.70
[0.01 -
978.04]
No of firms 2.64*** [1.59 - 4.39] 2.96* [1.18 - 7.41] 2.19 [0.90 - 5.33] 2.70* [1.17 - 6.22]
Introductory footprint 1.08* [1.00 - 1.17] 1.07 [0.97 - 1.18] 1.06 [0.94 - 1.19] 1.07 [0.91 - 1.24]
Introduced by leader 3.26 [0.69 - 15.32] 1.26 [0.39 - 4.02] 2.21 [0.49 - 9.98] 4.93* [1.08 - 22.55]
Licensing 0.36 [0.02 - 6.22] 1.28 [0.09 - 17.81] 1.26 [0.17 - 9.43] 1.14 [0.08 - 15.73]
D_interface 0.73 [0.24 - 2.21] 1.71 [0.25 - 11.55] 3.81 [0.43 - 33.05] 4.6 [0.54 - 38.86]
D_off_data 2.18 [0.15 - 31.65] 10.65 [0.07 - 1540] 14.17 [0.01 - 23827.43] 26.06
[0.01 -
60968.77]
D_network 0.01* [0.01 - 0.32] 0.01 [0.01 - 182.01] 0.2 [0.01 - 121.37] 1.64 [0.04 - 63.15]
D_display 0.05** [0.01 - 0.33] 0.04* [0.01 - 0.99] 0.12 [0.01 - 1.41] 0.12 [0.01 - 1.57]
No. of Observations 541 560 580 586
Log pseudo-likelihood -32.62 -30.45 -33.25 -32.17
Wald Chi2 146.00*** 207.42*** 85.42*** 133.34***
*p < 0.05, **p < 0.01, ***p < 0.001

In all of the models in Table 3, Pleiotropy is still significant in predicting the
likelihood of dominance of a component. These results suggest that the influence of
pleiotropy on prediction likelihood of component dominance holds over a range of model
share values, not just at the traditional 50% threshold. Components supported by an open
standard also retain their positive dominance rate over the sensitivity analysis in all four
models. However, the coefficient is only statistically significant at usual levels in Model 3,
the 55% threshold (H.R. = 4.94, P< 0.05). Finally, like pleiotropy, innovation source is a
significant predictor of component dominance at all four thresholds of model share.
Robustness Checks
We conducted a series of empirical checks to verify the robustness of the results
presented in Section 3. First, to address the possible issues of unobserved heterogeneity
in the selection of components I used the frailty hazard model, assuming a Weibull
distribution for the base hazard or survival function (Carlin & Solid, 2014). The results of
this estimation are similar to the ones reported in Table 1 and confirm my three
component dominance hypotheses. Next, I performed a lead-lag analysis to verify the
causal directions in my analysis. In this analysis, I assessed how the hypothesized
variables predicted dominance of components at t+1 (lead) and t-1 (lag) time periods. As
expected, the hypothesized variables remained statistically significant in the model
predicting a future period component dominance (t+1), but they were insignificant in the
model predicting past period component dominance (t-1), which provides a successful
falsification test. In the next set of models, I used the actual percentage of market share
of the TV models as the dependent variable and replicated my analysis. The results
utilizing this alternative dependent variable once again confirmed my component
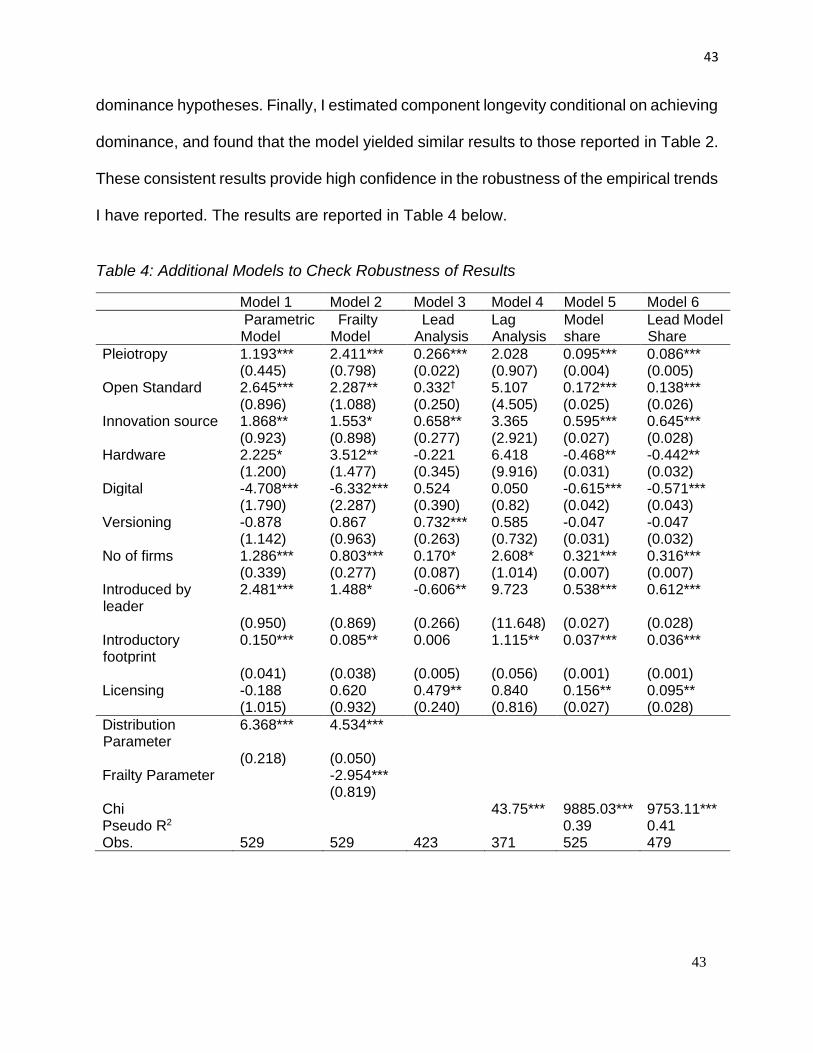
43
43
dominance hypotheses. Finally, I estimated component longevity conditional on achieving
dominance, and found that the model yielded similar results to those reported in Table 2.
These consistent results provide high confidence in the robustness of the empirical trends
I have reported. The results are reported in Table 4 below.
Table 4: Additional Models to Check Robustness of Results
Model 1 Model 2 Model 3 Model 4 Model 5 Model 6
Parametric Model
Frailty Model
Lead Analysis
Lag Analysis
Model share
Lead Model Share
Pleiotropy 1.193*** 2.411*** 0.266*** 2.028 0.095*** 0.086*** (0.445) (0.798) (0.022) (0.907) (0.004) (0.005) Open Standard 2.645*** 2.287** 0.332† 5.107 0.172*** 0.138*** (0.896) (1.088) (0.250) (4.505) (0.025) (0.026) Innovation source 1.868** 1.553* 0.658** 3.365 0.595*** 0.645*** (0.923) (0.898) (0.277) (2.921) (0.027) (0.028) Hardware 2.225* 3.512** -0.221 6.418 -0.468** -0.442** (1.200) (1.477) (0.345) (9.916) (0.031) (0.032) Digital -4.708*** -6.332*** 0.524 0.050 -0.615*** -0.571*** (1.790) (2.287) (0.390) (0.82) (0.042) (0.043) Versioning -0.878 0.867 0.732*** 0.585 -0.047 -0.047 (1.142) (0.963) (0.263) (0.732) (0.031) (0.032) No of firms 1.286*** 0.803*** 0.170* 2.608* 0.321*** 0.316*** (0.339) (0.277) (0.087) (1.014) (0.007) (0.007) Introduced by leader
2.481*** 1.488* -0.606** 9.723 0.538*** 0.612***
(0.950) (0.869) (0.266) (11.648) (0.027) (0.028) Introductory footprint
0.150*** 0.085** 0.006 1.115** 0.037*** 0.036***
(0.041) (0.038) (0.005) (0.056) (0.001) (0.001) Licensing -0.188 0.620 0.479** 0.840 0.156** 0.095** (1.015) (0.932) (0.240) (0.816) (0.027) (0.028)
Distribution Parameter
6.368*** 4.534***
(0.218) (0.050) Frailty Parameter -2.954*** (0.819) Chi 43.75*** 9885.03*** 9753.11*** Pseudo R2 0.39 0.41 Obs. 529 529 423 371 525 479

44
44
2.5 DISCUSSION
Summary of Contributions
The original development of the notion of a dominant design was an important milestone
in the innovation literature, and remains a valuable concept, as it tends to drive both
product design and product manufacturing. The early work was followed by research
designed to more rigorously define the concept and to go beyond the firm and
environmental factors with a proposal to investigate dominance at multiple levels of
product design. Some of these extensions imported theory from biology (ecology) on
factors affecting survival in an ecosystem, including pleiotropy.
The ecological lens views design innovation as the evolution of a product configuration,
with components competing to secure a dominant position in the product design
configuration. This approach facilitates the study of design innovation at a more granular
level and allows the empirical investigation of the emergence of a dominant design at the
sub-system and component levels of a product design. This approach is appropriate for
CADPs as these products are modular in nature, and their designs can be abstracted to
the set of components and their functionalities.
I bring these two views together in my model and empirically test whether a
component becomes part of a dominant design configuration in a CADP. I test this in a
modern and important context, that of digital televisions. I validate that variables identified
by previous research are important factors in influencing whether or not a component
becomes part of the dominant design configuration of a CADP, but go beyond this to find
that components with high pleiotropy, based on open standards, and developed from

45
45
endogenous sources are more likely to become part of the dominant design configuration
in digital televisions.
I then extended this work by taking advantage of the longitudinal nature of my
dataset by also measuring and testing the concept of component longevity in the digital
design, which has its own important economic implications for a technology. I find that
open standards and pleiotropy are both significantly associated with component longevity
in the dominant design configuration of digital televisions.
Discussion of Results
There are a number of natural constituencies for these results. On the supply side,
designers and manufacturers of CADPs can consider the three factors when selecting
components for their devices. The empirical results for the television domain suggest
that, all else being equal, vendors would prefer that their new product become the next
dominant design and by selecting components that have high pleiotropy, are based on
open standards, and are developed within the industry, these components are more likely
to become part of the dominant design configuration, all else being equal. And, high
pleiotropy and open standards components are likely to remain in the dominant design
configuration for a longer period of time. Absent this information, manufacturers may
perceive there to be tension between developing a product with a stable architecture,
versus being flexible for changing features or user preferences. By choosing high
pleiotropy components this tension is eased, as such components are likely to be both in
the dominant design configuration for a relatively long period of time, and, given the
greater number of functions/features that they support, will be more likely to address a
future market need.

46
46
Analogously, on the demand side, consumers of these products would also, all
else being equal, prefer to choose products that end up being in the dominant design
configuration. Such products will, for example, be more likely to have compatible,
complementary products developed for them. And, for durable goods, longevity in the
dominant design configuration implies that the product will tend to have a longer useful
life.
Other stakeholders are likely to find these results of interest as well. For example,
standards-setting organizations may be able to cite the importance of open standards in
their deliberations. And organizations that are considering so-called ‘coopetition’
relationships with other firms may see value in biasing the choice of such relationships to
within-industry relationships, rather than choosing alliances external to their industry.
Such a choice might otherwise be more difficult, as such a choice might otherwise be
somewhat non-intuitive in the sense of a competitive market. Similarly, governments who
are trying to choose among competing technology designs for products that have public
goods implications, as was the case in the “Grand Alliance” process to select a high-
definition television standard in the United States, would be well advised to consider these
factors (Dowell et al. 2002). Finally, research labs or startup high technology firms might
use these results to assess the market and identify components that are relatively weaker,
in terms of their dominant design desirability, and choose those as targets for replacement.
Televisions as CADPs and Related Model Results Discussion
While the research relies on theories which are expected to be widely applicable to a
variety of products, the empirical test was conducted in the television domain. The
empirical results are consistent with the commonly observed failure of a number of touted,

47
47
but ultimately unsuccessful, components in the dominant television design. To name just
three, NFC (near field communication), the RS232C port, and the webcam image
recognition system, are all components that exhibit attributes that have been shown to be
not associated with entry into the dominant design, i.e. are low pleiotropy, represent
closed standards, and are from a source external to the television industry. However,
given their use in other contexts, they could have been argued to be ‘the next big thing’
in digital televisions. In fact, in 2013, NFC was promoted as the top differentiating feature
for TV models developed by top manufacturers (Denison, 2013). Similarly, 3D video and
imaging, another technology predicted by some to be the ‘next big thing’ (Burrows, 2010)
in television design, never materialized as being part of the dominant design configuration,
presumably due, at least in part, to its low pleiotropy and failure to achieve standardization
across TV manufacturers (Silva, 2019).
In the recent past, several technologies have made their entry into television
design configurations, including two display standards: QLED (Quantum-dot Light
Emitting Diode) and OLED (Organic Light Emitting Diode). QLED is supported by the
Open Dynamic HDR (High Dynamic Range) Standard, and Samsung Corporation opened
the QLED trademark for other TV manufacturers, presumably expecting a larger alliance
of TV manufacturers supporting QLED as the display for dominant design configuration
(Palenchar, 2017). QLED was developed by Samsung, which is a major player in the
television market, making QLED an endogenously developed technology. OLED, on the
other hand, is supported by multiple patented standards, with the most important of them
held by UDC (Universal Display Corporation), making it a closed standard, exogenously
developed, component technology. In 2015 LG Electronics signed a long-term agreement
48
48
with UDC to deploy OLED technology in TV display panels. Both display types are
supported by leaders in the television market and have been adopted by other players in
the TV market. Therefore, either could be intuitively anticipated to do well in the market.
my partial research model in 2019 would suggest that QLED and related technologies,
assuming equivalent pleiotropy, would improve their market share vs. OLED, and become
part of the dominant design configuration in coming years, in the absence of any
exogenous shocks to the equilibrium.
Future Research
This research was driven by a desire to extend the current understanding about (1) what
drives component dominance and (2) what drives component longevity in a dominant
design in the context of complex assembled products. Within the television domain, I
examined forty-six components, a sample which was a function of the components
chosen by manufacturers. However, like any such empirical research, other research
objectives might drive other data collection choices. For example, in the empirical work
of Benner & Tripsas (2012), they note that the dominant design literature reflects two
views, the Technological (supply-side) view and the Market (demand-side) view. The
research focused on the Market view might choose to, for example, attempt to estimate
the value to the consumer of individual components’ inclusion in the product. Such
research could be modelled via hedonic regression (Brynjolfsson & Kemerer, 1996).
My research focused on components, following on the research literature in applying
pleiotropy to CADPs. A relatively orthogonal extension would be to take a different focus,
for example, looking at the eco-system of products and their complements and substitutes.

49
49
This could be an additional important dimension in predicting the success of a component
in the dominant design.
Finally, of course, the empirical analysis here selected televisions as the CADP, an
industry with considerable economic significance, and one that has undergone a
substantial amount of innovation in recent years. One possible avenue for future research
would be to apply this model to another digital product, for example, smartphones, or an
Internet of Things (IoT) product
2.6 CONCLUSION
The phenomenon of configurational changes in dominant design at the component level
is unique to CADPs, as the modular architecture of these products facilitates the inclusion,
substitution, and elimination of components. The architecture change, including
components, is achieved without detrimentally affecting the stability of the overall
functionalities embedded in the dominant design of the product. A key goal of this paper
is to investigate the selection, substitution, and elimination of components in CADPs by
utilizing both an evolutionary theoretical lens and a configurational perspective on the
emergence of dominant designs. Specifically, I hypothesized the effects of three
evolutionary attributes of components (1) pleiotropy (2) open standards, and (3)
innovation source on their participation in the dominant design configurations of CADPs.
Empirical analysis using a longitudinal dataset of TV models supported my hypotheses,
and I conclude that components with high pleiotropy, that are supported by open
standards, and that originate within the industry, have a higher chance of being included
in the dominant design configurations of CADPs and, for pleiotropy and open standards,
remaining in the configuration for a longer time. The study provides prescriptions for

50
50
product designers and manufacturers for managing their component selection strategies
and highlights the theoretical and empirical relevance of both the evolutionary and
configurational perspectives for further research on the emergence of dominant designs
in CADPs.
51
51
3 Essay 2: Product Market Competition, Platform Business Model and, Firm
Performance
3.1 INTRODUCTION
“In business, the competition will bite you if you keep running; if you stand still, they will
swallow you.”
Victor Kiam, Ex. Chairman, Remington.
Market competition is inherently a dynamic process in which product technologies in
the market continuously emerge, evolve, and fade via the process of creative
destruction (Schumpeter 1950, Futia 1980). While these dynamics of product markets
bring significant benefits to society through innovation, in the long run, firms competing
in these markets have to continually find ways to differentiate and improve their products
to stay ahead of the competition. The constant churn of innovation is especially
significant in high technology, internet-based industry sectors. According to a 2019
survey of CIOs and top tech leaders conducted by the IDG (International Data Group),
two-thirds of technology leaders shared the concern about market stability, digital
transformation, and declining competitiveness of their firms (Heltzel 2019). Market
competitiveness also emerged as the single most significant concern by another survey
of marketing executives in European countries (Gaspar and Stürmer 2016).
High technology industries have the shortest product lifecycle, from infancy to
maturity. According to a 2015 KPMG report, products, and services in the high
technology industry have an average maturity life cycle of 0.5- 5 years, which is the
shortest among all sectors (KPMG 2015). Value generation and capture from these
products and services have to happen in a shorter duration compared to products and
services from other industries. Additionally, product and services imitation is salient and
52
52
rampant in the technology sector. Imitation among vendors in the IT sector is
widespread, and firms mimic the direct competitors in the introduction and withdrawal
of services (Ruckman et al. 2015, Rhee et al. 2006). While the modular nature of
products developed in the IT industry and associated incremental innovation leads to
better performance gains, these gains erode quickly via imitation from firms competing
in the same domain (Ethiraj et al. 2008). With short appropriation cycles, high research
and development expenses, and potential risk of imitation, firms need to continually
think about tackling evolving market threats by enabling appropriate business strategies.
In this study, using product market fluidity as a measure of evolving product market
threats, I estimate the effect of the evolving market threats on the financial performance
of a firm (Hoberg et al. 2014). Product market fluidity is a measure developed by
extracting business descriptions from annual 10K-reports using computational
linguistics. It measures the change in a firm’s product space due to moves made by
competitors in the firm’s product markets. Measuring competitive moves made by rival
firms is essential as all new product developments, and performance improvements in
the existing product should be seen relative to the progress made by rival firms in the
product space. This measure is a meaningful way to capture market stability (instability)
around a firm and product differentiation achieved by firm compared to its rival firms.
The measure is also robust since firms are legally bound to accurately describe the
products and services in 10-K annual reports filed with the Security and Exchange
Commission (SEC), USA.
One of the innovation strategies that might provide stability in firm performance
during evolving market competition is the adoption of the platform business model as
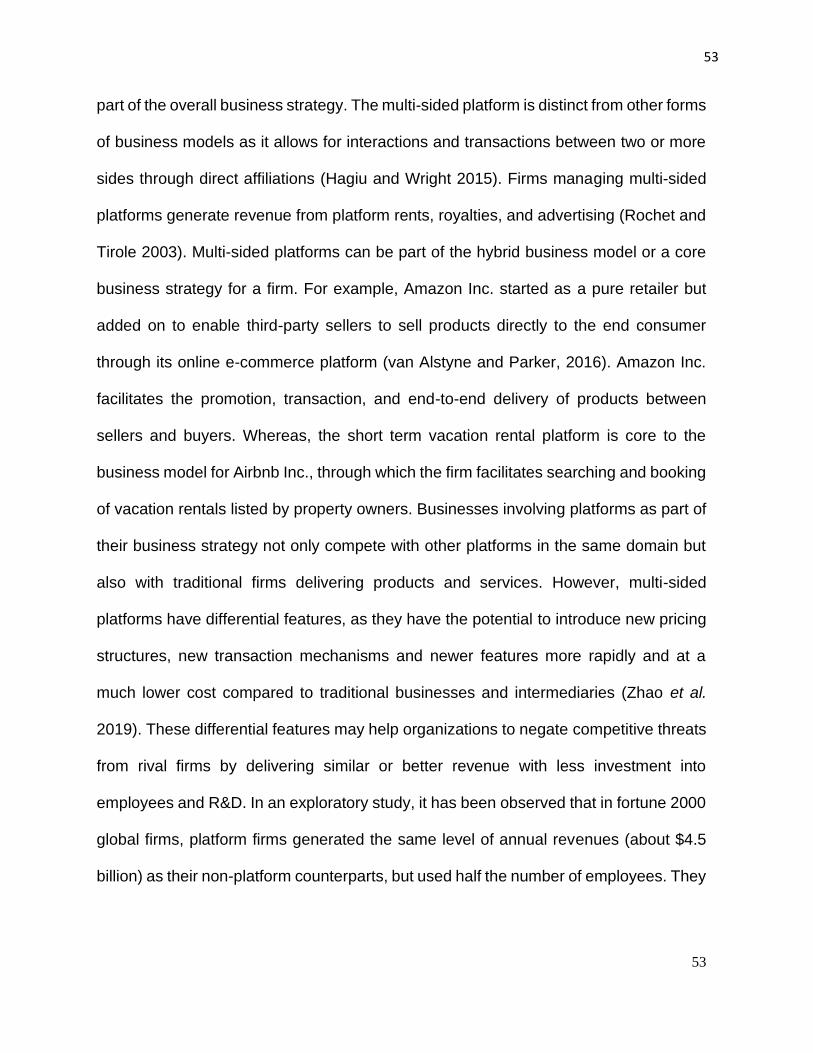
53
53
part of the overall business strategy. The multi-sided platform is distinct from other forms
of business models as it allows for interactions and transactions between two or more
sides through direct affiliations (Hagiu and Wright 2015). Firms managing multi-sided
platforms generate revenue from platform rents, royalties, and advertising (Rochet and
Tirole 2003). Multi-sided platforms can be part of the hybrid business model or a core
business strategy for a firm. For example, Amazon Inc. started as a pure retailer but
added on to enable third-party sellers to sell products directly to the end consumer
through its online e-commerce platform (van Alstyne and Parker, 2016). Amazon Inc.
facilitates the promotion, transaction, and end-to-end delivery of products between
sellers and buyers. Whereas, the short term vacation rental platform is core to the
business model for Airbnb Inc., through which the firm facilitates searching and booking
of vacation rentals listed by property owners. Businesses involving platforms as part of
their business strategy not only compete with other platforms in the same domain but
also with traditional firms delivering products and services. However, multi-sided
platforms have differential features, as they have the potential to introduce new pricing
structures, new transaction mechanisms and newer features more rapidly and at a
much lower cost compared to traditional businesses and intermediaries (Zhao et al.
2019). These differential features may help organizations to negate competitive threats
from rival firms by delivering similar or better revenue with less investment into
employees and R&D. In an exploratory study, it has been observed that in fortune 2000
global firms, platform firms generated the same level of annual revenues (about $4.5
billion) as their non-platform counterparts, but used half the number of employees. They
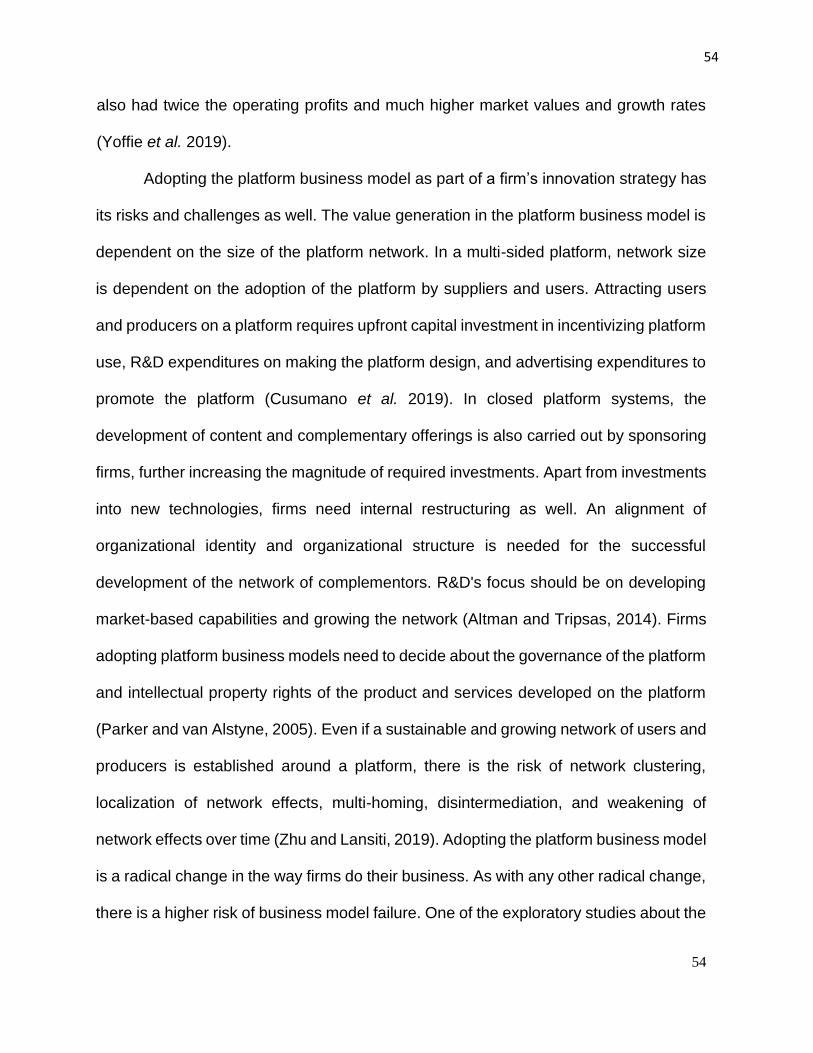
54
54
also had twice the operating profits and much higher market values and growth rates
(Yoffie et al. 2019).
Adopting the platform business model as part of a firm’s innovation strategy has
its risks and challenges as well. The value generation in the platform business model is
dependent on the size of the platform network. In a multi-sided platform, network size
is dependent on the adoption of the platform by suppliers and users. Attracting users
and producers on a platform requires upfront capital investment in incentivizing platform
use, R&D expenditures on making the platform design, and advertising expenditures to
promote the platform (Cusumano et al. 2019). In closed platform systems, the
development of content and complementary offerings is also carried out by sponsoring
firms, further increasing the magnitude of required investments. Apart from investments
into new technologies, firms need internal restructuring as well. An alignment of
organizational identity and organizational structure is needed for the successful
development of the network of complementors. R&D's focus should be on developing
market-based capabilities and growing the network (Altman and Tripsas, 2014). Firms
adopting platform business models need to decide about the governance of the platform
and intellectual property rights of the product and services developed on the platform
(Parker and van Alstyne, 2005). Even if a sustainable and growing network of users and
producers is established around a platform, there is the risk of network clustering,
localization of network effects, multi-homing, disintermediation, and weakening of
network effects over time (Zhu and Lansiti, 2019). Adopting the platform business model
is a radical change in the way firms do their business. As with any other radical change,
there is a higher risk of business model failure. One of the exploratory studies about the
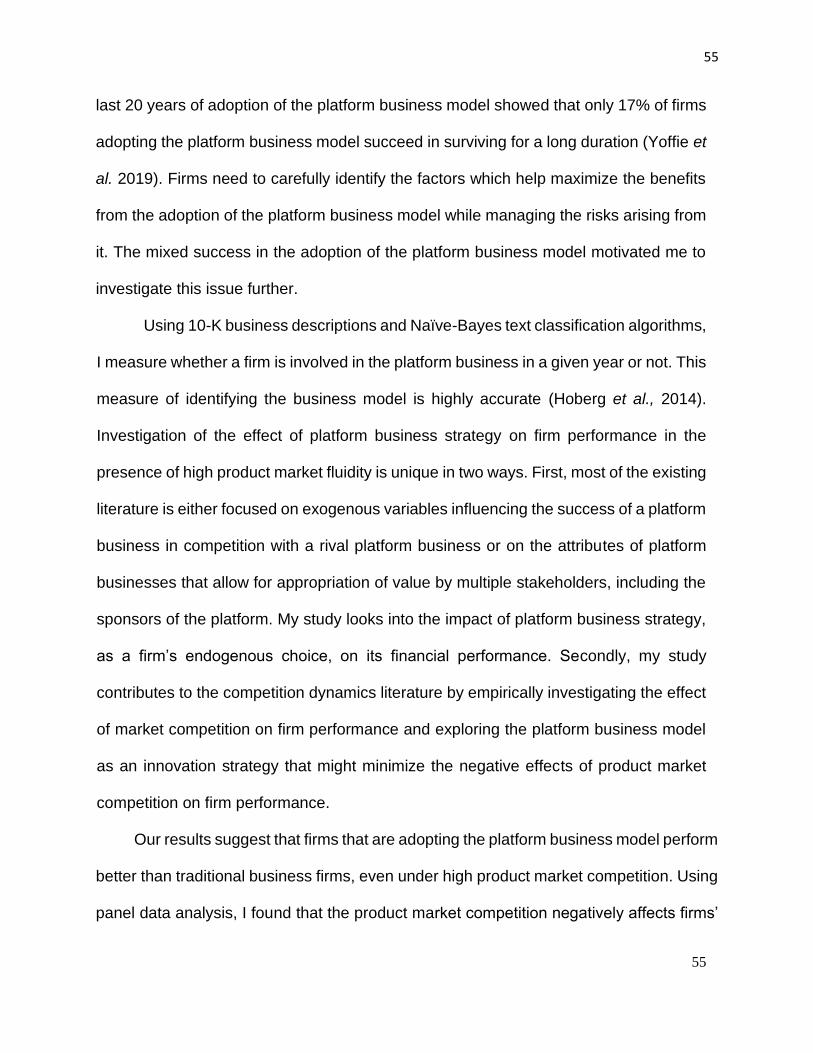
55
55
last 20 years of adoption of the platform business model showed that only 17% of firms
adopting the platform business model succeed in surviving for a long duration (Yoffie et
al. 2019). Firms need to carefully identify the factors which help maximize the benefits
from the adoption of the platform business model while managing the risks arising from
it. The mixed success in the adoption of the platform business model motivated me to
investigate this issue further.
Using 10-K business descriptions and Naïve-Bayes text classification algorithms,
I measure whether a firm is involved in the platform business in a given year or not. This
measure of identifying the business model is highly accurate (Hoberg et al., 2014).
Investigation of the effect of platform business strategy on firm performance in the
presence of high product market fluidity is unique in two ways. First, most of the existing
literature is either focused on exogenous variables influencing the success of a platform
business in competition with a rival platform business or on the attributes of platform
businesses that allow for appropriation of value by multiple stakeholders, including the
sponsors of the platform. My study looks into the impact of platform business strategy,
as a firm’s endogenous choice, on its financial performance. Secondly, my study
contributes to the competition dynamics literature by empirically investigating the effect
of market competition on firm performance and exploring the platform business model
as an innovation strategy that might minimize the negative effects of product market
competition on firm performance.
Our results suggest that firms that are adopting the platform business model perform
better than traditional business firms, even under high product market competition. Using
panel data analysis, I found that the product market competition negatively affects firms’

56
56
financial performance. Choosing a platform business model as an innovation strategy
allows a firm to grow its revenue at a considerably higher rate compared to non-platform
firms even under increasing competitive threats from rival firms. Additionally, I found that
larger firms are better in harnessing the value from platform business models, even under
higher competition. In subsequent sections, I conceptualize and estimate the model,
interpret the results, and discuss the implications of my findings.
3.2 CONCEPTUAL DEVELOPMENT
3.2.1 Product Market Fluidity and Firm Performance
Two essential elements of innovation economics are the central tenet of my conceptual
development: economies of scale and economies of learning (Gilbert and Harris 1981,
Gaynor et al. 2005). I argue that product market fluidity disrupts value gains from both
scale and learning for a firm.
Economies of scale or increasing returns to scale refer to the position of strength
for a firm as it captures increasing value from a product or service by decreasing the
cost of the product resulting from the increased volume of production (Arrow 1996).
Most of the cost advantage gained in economies of scale is achieved in the maturity
phase of a product lifecycle. In the product maturity phase, there are fewer competing
firms in the product market, which means lower product market fluidity, and the focus
of competing firms has shifted from product innovation to process innovation (Utterback
and Suarez, 1993). Improvement in the production process and incremental innovation
leading to product differentiation are essential for capturing the market in the maturity
phase of the product lifecycle. For a firm to benefit from economies of scale, the product
maturity phase should be a long uninterrupted phase of the product life cycle where

57
57
firms appropriate returns for the high investment made in research and development
during the product innovation cycle (Utterback and Abernathy, 1975).
Similarly, economies of learning or learning economies refer to the value created
by knowledge accrued during the repetitive production process (Macher and Boerner,
2006). There are many ways in which this learning helps drive down cost: boosting
efficiency and reducing waste in production by R&D synergies and productivity by better
management, which helps coordinate and balance the different functions and by speeding
up the production process. Learning reflected at the labor productivity level is known as
a learning curve, and learning reflected at the organization level is known as experience
curve. Training and specialization through learning lead to efficiency and growth in an
organization, resulting in profitable, high added value goods and services.
In high technology industries, rival firms choose to compete back by either
innovating or imitating, both of which hurt the value generated from scale and learning.
More often, in the high technology industry, a significant technological change or
innovation interrupts the maturity phase of the product life cycle by introducing a
discontinuity to the marketplace. This technological discontinuity, in turn, reinitiates a
new cycle, limiting the gains from economies of scale from previous innovation
(Anderson and Tushman 1990, Cusumano et al. 2007). Competing firms try to develop
product features similar to existing innovation resulting in high market fluidity. These
technological discontinuities also allow new entrants and smaller firms to compete
effectively with larger firms, reducing the value proposition for established firms (Acs
and Audretsch 1987). This constant churn of innovation reduces the product life cycle
and hence lowers the value captured from scaled production, for firms in a highly
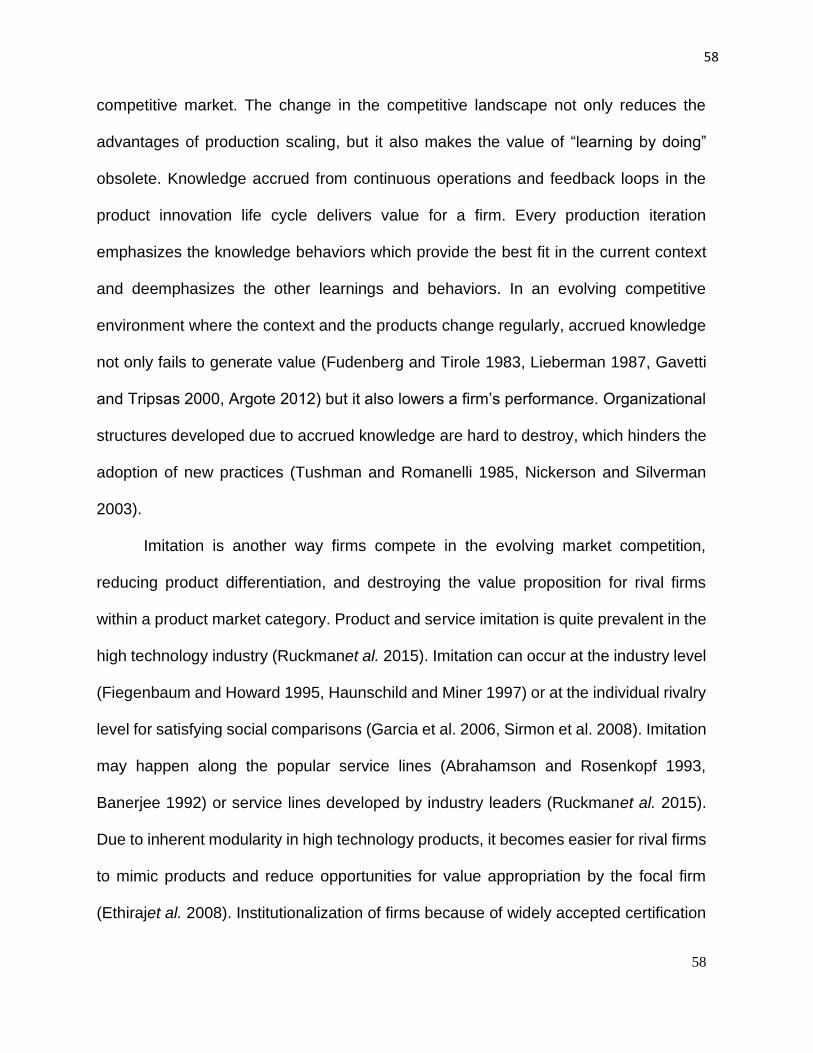
58
58
competitive market. The change in the competitive landscape not only reduces the
advantages of production scaling, but it also makes the value of “learning by doing”
obsolete. Knowledge accrued from continuous operations and feedback loops in the
product innovation life cycle delivers value for a firm. Every production iteration
emphasizes the knowledge behaviors which provide the best fit in the current context
and deemphasizes the other learnings and behaviors. In an evolving competitive
environment where the context and the products change regularly, accrued knowledge
not only fails to generate value (Fudenberg and Tirole 1983, Lieberman 1987, Gavetti
and Tripsas 2000, Argote 2012) but it also lowers a firm’s performance. Organizational
structures developed due to accrued knowledge are hard to destroy, which hinders the
adoption of new practices (Tushman and Romanelli 1985, Nickerson and Silverman
2003).
Imitation is another way firms compete in the evolving market competition,
reducing product differentiation, and destroying the value proposition for rival firms
within a product market category. Product and service imitation is quite prevalent in the
high technology industry (Ruckmanet al. 2015). Imitation can occur at the industry level
(Fiegenbaum and Howard 1995, Haunschild and Miner 1997) or at the individual rivalry
level for satisfying social comparisons (Garcia et al. 2006, Sirmon et al. 2008). Imitation
may happen along the popular service lines (Abrahamson and Rosenkopf 1993,
Banerjee 1992) or service lines developed by industry leaders (Ruckmanet al. 2015).
Due to inherent modularity in high technology products, it becomes easier for rival firms
to mimic products and reduce opportunities for value appropriation by the focal firm
(Ethirajet al. 2008). Institutionalization of firms because of widely accepted certification
59
59
standards (Gopal and Gao 2009), a high degree of inter-firm mobility of employees
(Audretsch and Feldman 1996, Ranganathan and Kuruvilla 2008) and multi-sourcing
approaches followed by clients (Bapna et al. 2010) makes it easier to imitate. Imitation
may not necessarily eliminate all the value gained from “learning by doing,” however, it
limits the quantum of rent expected from a product or services when similar products
and services are available at competitive pricing.
Two things are salient in the arguments presented above. First, both innovation
and imitation result in competitive parity among competing firms and increase the
product market fluidity encountered by a firm. Secondly, this constant change in the
competition landscape, which is the core element of competitive markets, limits the
value generated by a firm through scale and learning.
3.2.2 Product Market Fluidity and Firm Performance
In a high technology industry, firms can choose to compete as a traditional pipe business
model, a pure platform business, or as a hybrid business model (Van Alystyne and Parker,
2016). For example, Walmart Inc., Amazon Inc., and Ebay Inc. compete in the retail sector
with contrasting business models. Walmart opted for a traditional pipe business model
with both retail and internet stores (Van Alystyne and Parker, 2016). eBay is a pure
platform business providing business to consumer and consumer to consumer services
on its e-commerce platform. Amazon operates on a hybrid business model where its e-
commerce platform allows for direct and third-party, consumer to consumer transactions.
Hence, platforms not only compete with other platform businesses but also with firms
selling products and services directly to consumers. Apple Inc. is another example of a
60
60
pure pipeline firm which incorporated platform business models as part of their overall
business with the advent of the iPhone and the App-store (Cusumano and Gawer 2013).
Platform businesses have to make a significant strategic shift in all dimensions of
businesses to become less sensitive to market threats. Most platforms are two-sided,
where platform sponsors facilitate the transactions between consumers and producers
(Cusunamo, 2020). Platform businesses do not generate their value from supply-side
economies of scale, but rather from network effects (demand-side economies of scale)
and economies of scope. Focus shifts from selling products to enabling the community to
connect and transact—this change in focus results in the reduction of variable production
costs. External producers handle most of the core production related to transactions on
the platform. Producers and consumers on a platform become an essential asset for the
firm (Van Alstyne et al. 2015). The relationship between participants of a platform is
transparent and fluid to the extent that they can swiftly change the role based on network
requirements. For example, Uber users can be drivers sometimes, and vice versa; and
Airbnb hosts can be travelers in different settings. Additionally, this fluidity in a consumer-
producer relationship makes it easier to discover changing consumer needs and fulfilling
them. The focus of platform businesses turns from marketing products to incentivizing the
platform for increasing the scale of the network.
Another aspect of platforms, which makes them superior in creating higher value,
is expanding scope and platform envelopment. Platform can extend the scope of their
platform by either adding newer features quickly (Zhao et al. 2019) or extend the reach
of the platform by enveloping services from the related product and services sectors
(Eisenmann et al. 2011). The network effect from the existing platform allows for easier
61
61
adoption and propagation of new features and services, including features from unrelated
domains. For example, Fitbit engulfed the functions of sports and healthcare performance
monitors while providing the core functionality of a smartwatch (Purdy, 2016). The
learning accrued in the pipeline business is context- and market-dependent, and is not
only obsolete under increased market threats, but also slows down the business transition
required to mitigate the risks arising from the heightened market threats. The core
learning developed in generating and managing a network of users, producers, and
communities can be applied in a completely different context and product market category.
The transitions of a firm to the platform business model comes with its own
challenges and risks. Firms assume that early entry into the new business opportunity,
exploiting the network effects, and raising barriers to entry of rival firms are key to the
successful deployment of the platform business model (Yoffie et al. 2019). However, the
transition to the platform business model requires firms to reimagine the organization
structure and operational strategy. Firms that move from a technology-oriented focus to
the a business development-oriented focus are more likely to succeed in deploying the
platform business model. Successful platform firms develop a collective identity of the
platform ecosystem by sharing risks and surplus-value arising from the platform with the
stakeholders of the platform (Gawer and Cusumano, 2013; van Alstyne et al., 2016).
Firms adopting platform business models need to decide about the governance structure
of the platform, openness of the platform, intellectual property rights of the product, and
services developed on the platform and issues related to free-riding on the platform
(Parker and Van Alystyne, 2005). Firms also need to invest continuously into incentivizing
parties of the platform, R&D and branding, and marketing at least until a tipping point is
62
62
reached and network effects take over. Once the network tipping point is reached, the
firm can generate long term value from direct and indirect network effects of the platform
(van Alstyne et al. 2016). The larger the network gets, the more the investment required
in continuing the action on the platform. For example, Uber and Lyft, share riding
platforms, are still incentivizing both driver and rider sides of the platform to promote the
use of their platforms, burning millions of dollars of cash every month (Cusumano 2020).
Salesforce.com and other service platform firms spend large sums of money relative to
their revenues on marketing and administrative expenses (Cusumano et al. 2019). In the
initial stages of platform developments, firms do not have a large ecosystem of
complementors. The dearth of complementors compels firms to develop the
complementary offerings themselves, leading to additional R&D expenses. Failing that,
the platform is less likely to take off and achieve the user growth required to gain any
value from network effects. For example, Canonical Ltd, developer of the Ubuntu
operating system, failed to develop a mobile operating system platform due to a lack of
investment in the developer network (Hartley, 2017). All these examples indicate that,
while entry barriers to platform businesses is low, to develop any meaningful network,
firms need to invest a vast amount of capital for a longer period. Even if firms develop the
network of producers and consumers around a platform, complacency can be dangerous
in the presence of high product market competition. The same low barriers to entry into a
platform business afford competing firms to fight back and capture the market share from
early movers. For example, Internet Explorer was the largest browsing platform in 2004,
with a market share of 95%. However, by the year 2015, Google Chrome became the
market leader in browsing platforms. The fall of Internet Explorer is attributed to the
63
63
complacency about the product execution and inferior product innovation by the sponsors
of the platform (Yoffie et al. 2019). The network developed by a firm around its platform
can itself be fragile and prone to clustering, localization of network effects, multi-homing,
disintermediation, and weakening of network effects over time (Zhu and Lansiti, 2019).
Firms bringing in new policies and structure to an existing business due to their transition
to a platform business model may also run into problems with legal and regulatory
regimes. They also may have to deal with a lack of underlying infrastructure like internet
bandwidth (Cusumano et al. 2019).
The risks and challenges faced by firms adopting the platform business model are
visible in practice, as well. An exploratory study (spanning 20 years, 1995-2015)
conducted by Yoffie et al. (2019) found that only 43 firms out of 252 platform firms
succeeded in continuously operating until the year 2015. The rest of the firms had an
average life of 4.9 years. More firms disappeared from the market due to a shorter
investment horizon, failing to capture the market share, merger with another platform, or
moving out of the platform business (Cusumano et al. 2019). It is in stark contrast with
the finding that five out of the top 10 firms by market value are platform firms. They have
a combined market value of more than 3 Trillion USD. The percentage of failed platform
firms may be likely to be comparable to the percentage of failed non-platform firms. The
researchers also included firms from all industry domains that may have skewed the
numbers, as firms in high technology industries may have expertise and relevance for
platform businesses compared to traditional firms. The same study also highlighted the
fact that the average revenue generated by platform firms is higher or comparable to non-
platform firms, even when their overall expenditure is considerably lower.These findings
64
64
suggest that the average value-added productivity (revenue – total expense) of platform
firms is higher than the value-added productivity of the non-platform firms. These
contrasting findings provide an opportunity to empirically investigate the performance
superiority of platform firms to non-platform firms.
Additionally, as platform firms grow larger in network size, they become harder to
compete by rivals or new entrants, with the growing number of complements acting like
a barrier to entry (Gawer and Cusumano, 2013). Platforms supported by a large
ecosystem of complementors and strong network effects make it more difficult for
competitors to dislodge (Cusumano 2011). The dominance of a platform with strong
network effects encourages competition within the platform between complementors for
incremental innovation, but hinders competition from rival firms, discouraging and
delaying any radical innovation arising from outside the platform (Gawer and Cusumano,
2013). It has been argued theoretically that network effects may confer some market
power to the firms, that firms can strategically exploit to reduce competition and thus
increase profits (Fuentelsaz et al. 2012). This should lead to a longer maturity phase for
the platform ecosystem and better-continued performance by a firm with a platform
business model even under high product market fluidity. Hence, I expect platform
businesses to deliver higher value-added productivity compared to non-platform firms,
even under high product market competition.
I present the basic research model for this investigation in Figure 6 below. I expect
product market fluidity to have a negative influence on the value-added productivity of a
firm. However, platform businesses should perform better than non-platform businesses,
even under high product market fluidity. In this study, I also investigate how investment
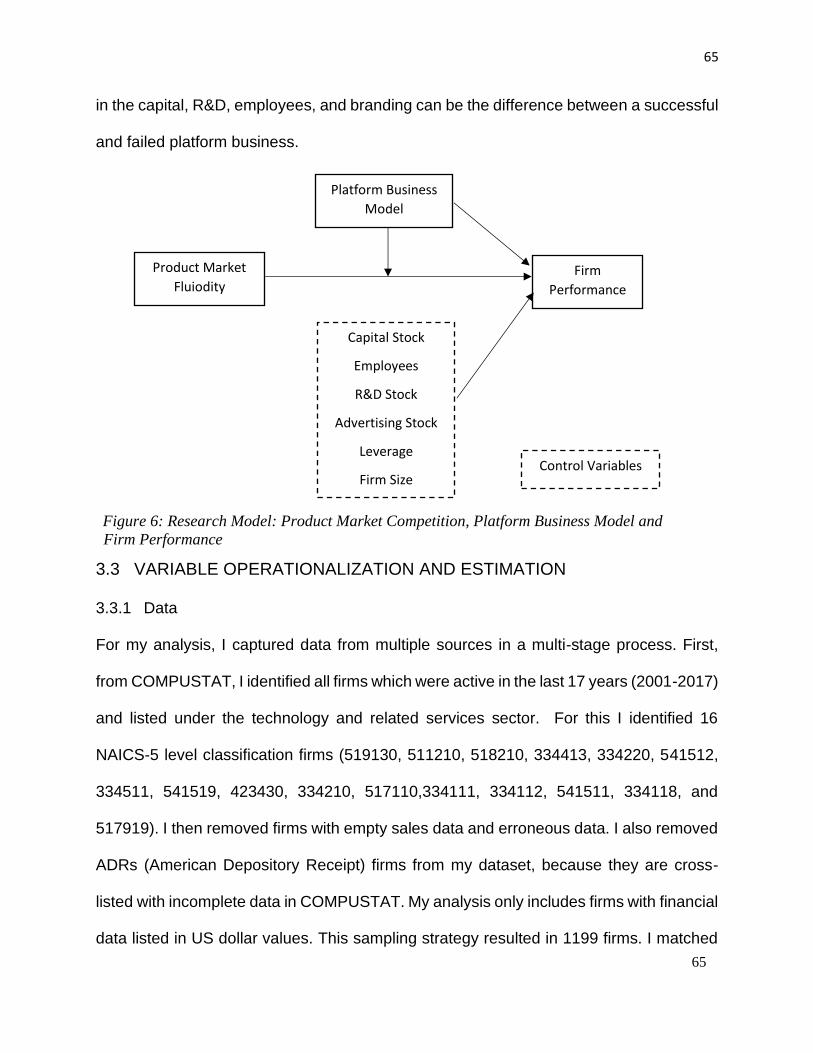
65
65
in the capital, R&D, employees, and branding can be the difference between a successful
and failed platform business.
3.3 VARIABLE OPERATIONALIZATION AND ESTIMATION
3.3.1 Data
For my analysis, I captured data from multiple sources in a multi-stage process. First,
from COMPUSTAT, I identified all firms which were active in the last 17 years (2001-2017)
and listed under the technology and related services sector. For this I identified 16
NAICS-5 level classification firms (519130, 511210, 518210, 334413, 334220, 541512,
334511, 541519, 423430, 334210, 517110,334111, 334112, 541511, 334118, and
517919). I then removed firms with empty sales data and erroneous data. I also removed
ADRs (American Depository Receipt) firms from my dataset, because they are cross-
listed with incomplete data in COMPUSTAT. My analysis only includes firms with financial
data listed in US dollar values. This sampling strategy resulted in 1199 firms. I matched
Figure 6: Research Model: Product Market Competition, Platform Business Model and
Firm Performance
Product Market
Fluiodity
Platform Business
Model
Firm
Performance
Capital Stock
Employees
R&D Stock
Advertising Stock
Leverage
Firm Size Control Variables

66
66
this data with the Hoberg et al. 2014 product market fluidity dataset. I then extracted 10-
K reports for the resulting 654 firms from the EDGAR database and calculated binary
variables for the business model using the Naïve-Bayes algorithm, as described in the
next section.
3.3.2 Variables
Dependent Variable
Value-added productivity: Value-added productivity, a measure of financial
performance, is measured as deflated sales less deflated materials. I deflated net sales
using the Bureau of Economic Association (BEA) gross domestic product price index for
gross output at the 2-digit NAICS level. Materials cost is calculated as total expenses
minus labor expenses. Total expenses data is available in COMPUSTAT (Data item
XOPR). Wherever it is not present, I calculated it as the difference between sales and
operating income before depreciation (COMPUSTAT item OIBDP). Staff expense total
listed in COMPUSTAT measures labor expenses. Only a few data points are available on
COMPUSTAT for staff expenses. For the rest of the firm years, the average sector labor
cost is computed at 2-digit NAICS level using annual sector-level wage data (salary plus
benefits) from the BLS (Bureau of Labor Statistics). The per-hour labor compensation is
multiplied by 2040 hours of work (51 weeks * 40 hours a week) per year to approximate
average yearly expenses for an employee in a year (Brynjolfsson and Hitt 2003). The
result is then multiplied by the total number of employees to calculate total staff expenses.

67
67
Independent Variables
Product market fluidity: Product market fluidity, as a measure of market threats, is the
degree of volatility (change) in the product mix of the competitors of the focal firm with
respect to a focal firm (Hoberg et al. 2014). The method to calculate this measure is
described in detail in Hoberg et al. 2014. In brief, 10-K annual reports are captured for all
firms of interest from the Edgar database, maintained by the Securities and Exchange
Commission, USA. The product description is parsed from 10-K reports of each firm.
Product market fluidity captures how rivals are changing the product words that overlap
with firm i’s vocabulary. Specifically, let Jt denote a scalar equal to the number of all unique
words used in the product descriptions of all firms in year t. Let Wit denote an ordered
Boolean vector of length Jt identifying which of the Jt words are used by firm i in year t.
Element j of Wit equals one if firm i uses word j in its product description and zero
otherwise. Wit is normalized to unit length and defines the result as Ni,t. To capture the
changes in the overall use of a given word j in year t, Hoberg at al. 2014 define the
aggregate vector Dt−1, t as
𝐷𝑡−1,𝑡 ≡ |∑(𝑊𝑗,𝑡 − 𝑊𝑗,𝑡−1)
𝑗
|
A firm’s product market fluidity is simply the dot product between its word vector Nit and
normalized Dt−1, t :
𝑃𝑟𝑜𝑑𝑢𝑐𝑡 𝑀𝑎𝑟𝑘𝑒𝑡 𝐹𝑙𝑢𝑖𝑑𝑖𝑡𝑦 ≡ ⟨𝑁𝑖,𝑡 ⋅𝐷𝑡−1,𝑡
‖𝐷𝑡−1,𝑡‖⟩
68
68
In summary, if the change in product vocabulary of rival firms makes the products of rival
firms more similar to the firm of interest, then the firm has high market threat and hence
high product market fluidity.
Platform Business Model: Platform business model is a binary variable. This variable
capture whether a firm has a platform business as part of its overall business model. I
calculated this variable using the Naïve-Bayes text classification algorithm. The variable
was developed in multiple stages, as described below:
Data Collection and pre-processing: To calculate this variable, I first extracted and
parsed 10-K annual reports using the EdgarWebR library, available for the R language.
The 10-K annual reports ranged from 2001 to 2018 for 684 firms in my dataset. I extracted
7250 firm-year 10-K reports averaging 11 annual reports per firm. Using get_filings
function from EdgarWebR library, I extracted “Item 1: Business Description” from these
parsed 10-K reports. Business Description section details the type of businesses a firm
is engaged in, including products and services. This section may also include information
about recent events, the competition the company faces, regulations that apply to it, labor
issues, special operating costs, or seasonal factors (SEC 2019). The business description
section is used by Hoberg et al. 2014 to develop product market fluidity measures. Using
the tm library in R, I pre-processed the text using standard preprocessing steps, including
removal of white spaces, lowering the uppercase letters, removing numbers, removing
stop words, and stemming the document.
Sub-sampling for training, testing and labeling: For labeling a business as platform
or non-platform, I used the definition of multi-sided platforms from Hagiu and Wright 2015:
“Multi-sided platforms (MSPs) are technologies, products or services that create value
69
69
primarily by enabling direct interactions between two or more customer or participant
groups”(p. 163). I labeled 934 firm-year business descriptions as either platform or non-
platform by reading business descriptions and collecting information from the internet. I
arrived at this number after carefully searching the business profile of each firm through
the popular press, including the firm's website, www.bloomberg.com,
www.finance.yahoo.com, www.money.cnn.com, www.medium.com, www.forbes.com,
www.applicoinc.com, and other research outlets. In this comprehensive search, I
combined the observations from the popular press, company profile, and research
outputs to identify firms that have a platform business model as part of their business
strategy and others that do not. For example, according to a report published by Applico
Inc. in 2015, 20% of the total income generated by S&P500 firms came from firms
engaging the platform business model, including Apple, Google, Facebook, Yahoo, eBay,
Microsoft, Adobe, ICE, Red Hat and Amazon (Moazed 2015). Similarly, researchers have
highlighted Facebook, Uber, Twitter, Microsoft, LinkedIn, Expedia, Alibaba, Snapchat and
Zillow as some of the famous examples of the platform business model (McIntyre 2019,
Zhao et al. 2019, Knee 2018, and Parker et al. 2016). I also identified firms which are
non-platforms like AMD and Analog Devices and labelled them as non-platforms. I used
700 firm-year business descriptions for training and 234 firm-years business description
for testing.
Naïve Bayes prediction and Classification: The Naïve Bayes classification
algorithm is a supervised learning text classification method used widely in social and
management research (Li, 2010, Aggarwal et al. 2016, Mejia et al. 2019). Li(2010) used
a Naive Bayesian classifier to classify the tone and content of forward-looking statements

70
70
in corporate 10-K and 10-Q filings. The Naïve Bayes classifier was used to classify
linguistic tone in credit rating action reports and used as a robust alternative measure to
mitigate measurement error of simple counting of negative or positive words as a
measure of linguistic tone (Aggarwal et al. 2016). Using the Naïve Bayes algorithm, Mejia
et al. (2019) measured the sentiment tone of online reviews of New York City restaurants.
In my research, I first vectorized the pre-processed 10-K documents into a corpus of
words. Then I created a sparse Document-Term Matrix using the term frequency method.
For the main analysis, I dropped words that occur less than 20 times.1 The five most
commonly used words for platform business firms are online, products, services,
information, and business. The five most commonly used words for non-platform
businesses are customers, technology, solutions, software, and business. I converted the
rest of the words into categorical features. Using the law of total probability (Ross 1986)
and under the assumption of conditional independence among the features (Mejia et al.
2019, Hand et al. 2001), the probability that a firm is into platform business (based on the
features extracted from the 10-K business description) is given by the expression:
P (Platform/x1, x2……, xn) = (∏ 𝑃(𝑥𝑗
𝑃𝑙𝑎𝑡𝑓𝑜𝑟𝑚)). (
𝑃(𝑃𝑙𝑎𝑡𝑓𝑜𝑟𝑚)
𝑃(𝑥1,𝑥2,….𝑥𝑛))𝑛
𝑗=1
Where P (Platform) is the prior probability of a firm to be platform business model and
∏ P(xj
Platform))n
j=1 is the conditional probability defined as the likelihood of observing a
feature(x1, x2,…,xn) value given the firm is a platform (non-platform) business.
P(x1,x2,…..,xn) is predictor features. I trained the model using the e1071 package
available in R. I predicted the business model classification on test data. I evaluated the
1 I also varied number of frequent words used per document from 5 to 100 (with an interval of 5). The best results
were achieved with term frequency of 20.

71
71
results of the prediction model using CrossTable and ConfusionMatrix functions in R.
The results are reported in the first two columns of Table 9 below. The overall accuracy
of the base model is 83% [confidence interval between 77% and 88%]. A kappa
measure of 0.63 is acceptable (Landis and Koch 1977). However, a large number of
platform businesses were classified as non-platform (36 out of 95).
Fine-Tuning the base Naïve Bayes model: To reduce the measurement error and
increase the accuracy of the classification model, I introduce Laplace smoothing to my
model. Since Naïve Bayes uses the product of feature probabilities conditioned on each
class in classification (platform or non-platform), a feature value in new data that never
occurred in the existing classification response will render the whole posterior probability
as zero. To improve my measurement of classification, I add a small number (in my case
1) to all the terms, resulting in non-zero posterior probability (Wu et al. 2012). The results
of Laplace smoothing are presented in columns 3 and 4 of Table 5. The updated text
classification model achieved a validation accuracy of 98%. Out of 95 platform firm-year
descriptions in the testing set, the model was accurately able to predict 93 as platform
firm-year descriptions. The comparative results of the two models are presented in Table
5.
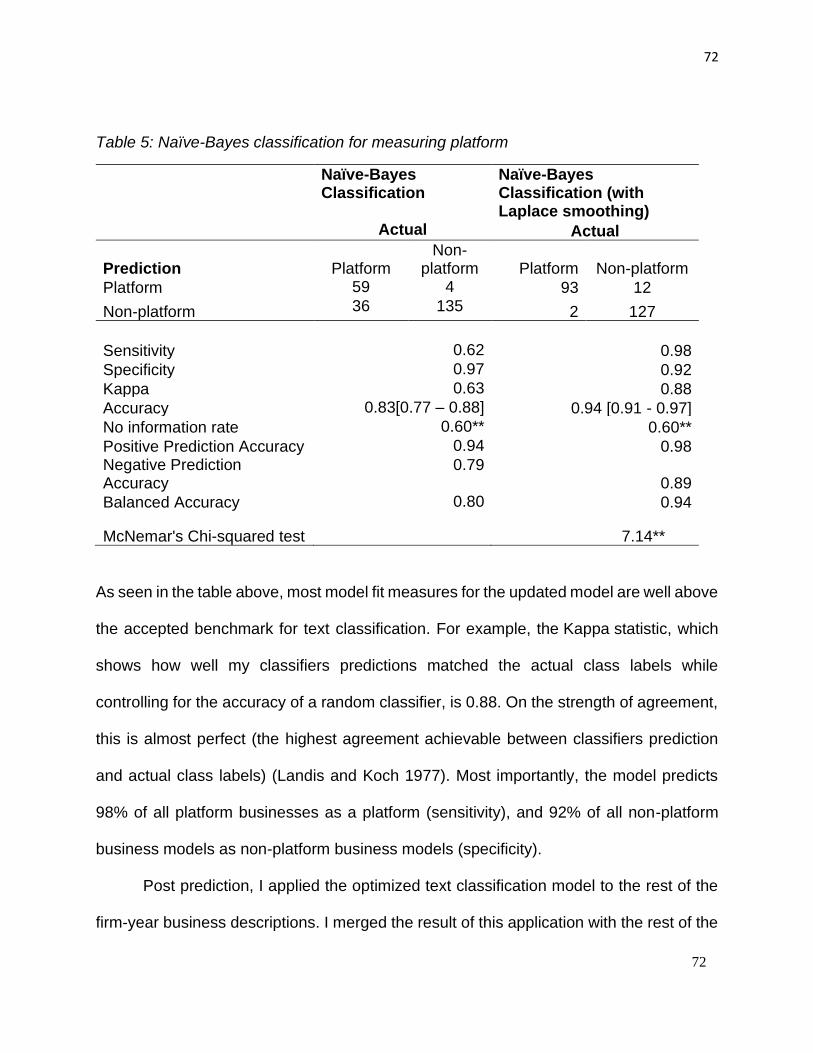
72
72
Table 5: Naïve-Bayes classification for measuring platform
Naïve-Bayes Classification
Naïve-Bayes Classification (with Laplace smoothing)
Actual Actual
Prediction Platform Non-
platform Platform Non-platform
Platform 59 4 93 12
Non-platform 36 135 2 127
Sensitivity 0.62 0.98
Specificity 0.97 0.92
Kappa 0.63 0.88
Accuracy 0.83[0.77 – 0.88] 0.94 [0.91 - 0.97]
No information rate 0.60** 0.60**
Positive Prediction Accuracy 0.94 0.98 Negative Prediction Accuracy
0.79 0.89
Balanced Accuracy 0.80 0.94
McNemar's Chi-squared test
7.14**
As seen in the table above, most model fit measures for the updated model are well above
the accepted benchmark for text classification. For example, the Kappa statistic, which
shows how well my classifiers predictions matched the actual class labels while
controlling for the accuracy of a random classifier, is 0.88. On the strength of agreement,
this is almost perfect (the highest agreement achievable between classifiers prediction
and actual class labels) (Landis and Koch 1977). Most importantly, the model predicts
98% of all platform businesses as a platform (sensitivity), and 92% of all non-platform
business models as non-platform business models (specificity).
Post prediction, I applied the optimized text classification model to the rest of the
firm-year business descriptions. I merged the result of this application with the rest of the
73
73
financial dataset. Additionally, I compared the Naïve Bayes algorithm with other
competing text classification algorithms. Results of the comparison are available in
Appendix B. I found that the naive Bayes classifier is the most accurate on my data set
among competing machine learning methods for text classification.
External Validity: To further validate my classification of firms as platform and non-
platform business models, I selected all firms listed in my dataset, which were active in
2017. I manually checked their business model using the sources identified in the earlier
section. I compared this list with the predicted classification. Out of 520 active firms, I
identified 73 firms as having a platform business model as part of their business strategy.
The matching rate is 100%, with no missing match. The list of firms with their business
models is available in Appendix B.
Control Variables
To address the risks and challenges related to the adoption of the platform business
model, we controlled for firm-level variables in the model. Existing research has
highlighted the importance of capital investment during the early phases of platform
development (Cusumano et al. 2019). Firms with deeper pockets and long term
investment plans are more likely to adopt the platform business model and able to capture
value compared to cash-strapped firms. These firms are also more likely to beat the
competing firms and become larger market players. To control for the effect of the size
and spending capacity of a firm, I added capital stock, the number of employees, and
percentile sales (as a proxy for firm size) in my estimation model. To make the platform
attractive for the prospective stakeholders of the platform, firms need to invest in R&D
activities to develop a feature-rich platform (van Alstyne et al., 2016). However, a highly
74
74
leveraged firm finds it hard to invest in R&D activities, resulting in a decline of innovation
outputs (Desyllas and Hughes, 2010). High leveraged firms are more likely to deliver
lower profits and go bankrupt under high product market competition (Maksimovi, 2010).
It has also been observed that some firms adopting the platform business model spend
a considerably higher proportion of their revenue in branding and advertising of the
platform (Cusumano et al. 2019). Advertising and branding expenditure makes sense for
platform firms, as the value proposition of a platform is dependent on its network size,
which in itself is dependent on attracting consumers and producers to the platform.
Advertising, in general, has also shown to impact the competitiveness of a firm, helping
a firm to generate a higher market share (Das et al. 1993). I controlled for all these
variables in my estimation model. I calculated the variables as follows:
Capital Stock: I calculated Capital stock (Kit) as per the procedure explained in Hall 1990,
and Brynjolfsson and Hitt 2003. I collected financial data of firms from as far back as 1947
from COMPUSTAT and deflated gross property, plant, and equipment (PPEGT) by the
non-residential investment price deflator from NIPA table 5.3.4. For the first year of the
appearance of a firm in COMPUSTAT, capital stock is fixed as the deflated PPEGT from
COMPUSTAT. For other years, since investment is made at various times in the past, I
calculated the average age of capital every year for each company by dividing
accumulated depreciation (DPACT) by current depreciation (DP), from COMPUSTAT.
Wherever missing, accumulated depreciation is the difference between PPEGT and net
property, plant, and equipment from COMPUSTAT (PPENT). Capital age is taken as a
three-year moving average of capital investment. The resulting capital stock is lagged by
one period to measure the available capital stock at the beginning of the period (Hall 1990,
75
75
Brynjolfsson and Hitt 2003, İmrohoroğlu and Tüzel 2014). The capital stock calculation
program used is adapted from İmrohoroğlu and Tüzel 2014.2
Research and Development Stock: I calculated research and development stock using
the perpetual inventory method as following:
Rit = (1-δ) Rit-1 * RNDDEFit-1+ Iit
Similar to the capital stock calculation, research and development stock for the first year
of a firm in my dataset is equal to research and development expenditures. For the rest
of the years, I first depreciated R&D stock from the previous year (Rit-1) by a standard 15%
(δ) (Villalonga 2004, Saunders and Brynjolfsson 2016) and then deflated by using the
values for private businesses from table 4.1 of the BEA R&D Satellite Account (RNDDEFit-
1). This depreciated and deflated previous year’s research and development stock is then
added to research and development expenses incurred in the current year (Iit) to arrive at
research and development stock for the current year (Rit)
Advertising Stock: I calculated advertising stock using a perpetual inventory method
similar to research and development expenses and using the same formula. However,
standard depreciation used for advertising stock is 45%. I used the producer price index
(PPI) for advertising agencies to deflate values to current-year dollars (Villalonga 2004,
Nagle 2018).
Firm Size: For the main analysis, firm size is a binary variable where big indicates a firm
in the top 75 percentile of sales in a given year, and small in the bottom three quarters.
This measure is consistent with existing microeconomic literature (Nagle 2018). Some
2 The STATA program to calculate capital stock is available on Şelale Tüzel’s website :
https://drive.google.com/drive/folders/10qhOBpBKvrfhjQXaXBUucKr3WLUNxPWX
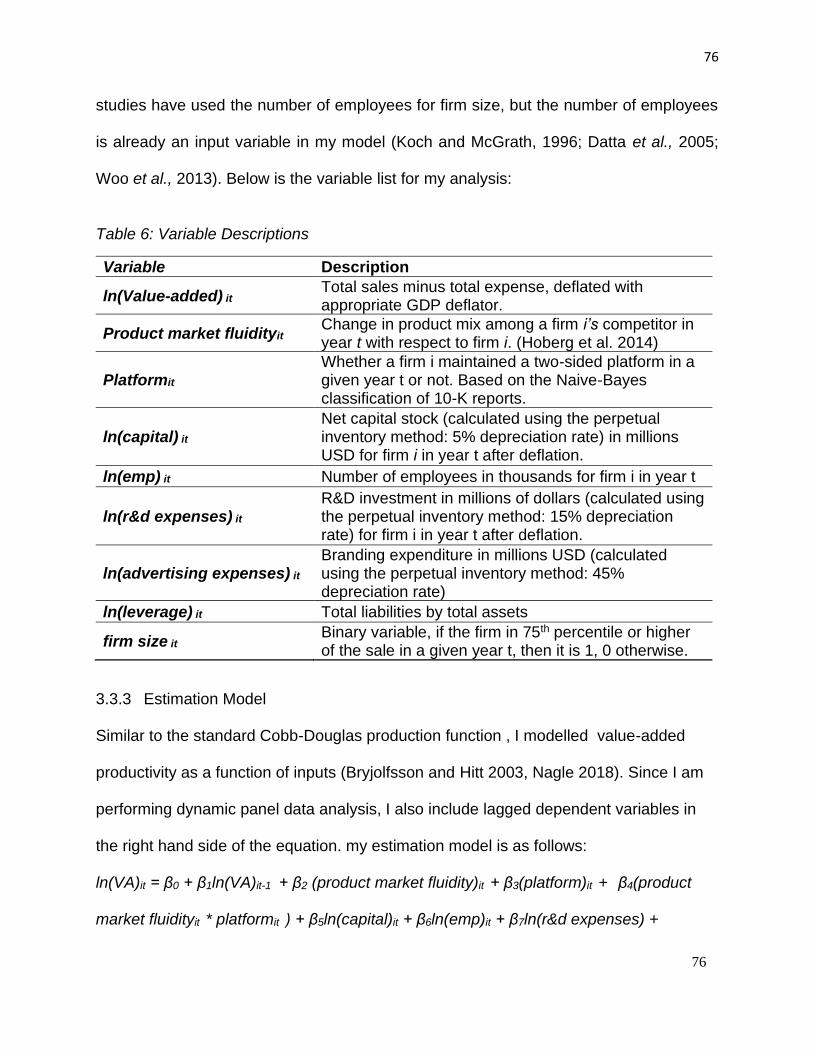
76
76
studies have used the number of employees for firm size, but the number of employees
is already an input variable in my model (Koch and McGrath, 1996; Datta et al., 2005;
Woo et al., 2013). Below is the variable list for my analysis:
Table 6: Variable Descriptions
Variable Description
ln(Value-added) it Total sales minus total expense, deflated with appropriate GDP deflator.
Product market fluidityit Change in product mix among a firm i’s competitor in year t with respect to firm i. (Hoberg et al. 2014)
Platformit Whether a firm i maintained a two-sided platform in a given year t or not. Based on the Naive-Bayes classification of 10-K reports.
ln(capital) it Net capital stock (calculated using the perpetual inventory method: 5% depreciation rate) in millions USD for firm i in year t after deflation.
ln(emp) it Number of employees in thousands for firm i in year t
ln(r&d expenses) it R&D investment in millions of dollars (calculated using the perpetual inventory method: 15% depreciation rate) for firm i in year t after deflation.
ln(advertising expenses) it Branding expenditure in millions USD (calculated using the perpetual inventory method: 45% depreciation rate)
ln(leverage) it Total liabilities by total assets
firm size it Binary variable, if the firm in 75th percentile or higher of the sale in a given year t, then it is 1, 0 otherwise.
3.3.3 Estimation Model
Similar to the standard Cobb-Douglas production function , I modelled value-added
productivity as a function of inputs (Bryjolfsson and Hitt 2003, Nagle 2018). Since I am
performing dynamic panel data analysis, I also include lagged dependent variables in
the right hand side of the equation. my estimation model is as follows:
ln(VA)it = β0 + β1ln(VA)it-1 + β2 (product market fluidity)it + β3(platform)it + β4(product
market fluidityit * platformit ) + β5ln(capital)it + β6ln(emp)it + β7ln(r&d expenses) +
77
77
β8ln(advertising expenses) + β9ln(leverage) + β10(firm_size) + (firm fixed effect)i + (year
fixed effect)t + εit (4)
3.3.4 Identification Strategy
With observational data in hand, I decided to conduct panel data analysis. However, this
method of analysis is subject to endogeneity concerns (Wooldrige, 2005; Aral et al., 2012;
Nagle, 2018). For example, as discussed earlier, actions taken by a firm to develop their
product and service portfolio has an indirect effect on the imitation and innovation carried
out by rival firms which increase the product market fluidity for a firm. Similarly, the firm’s
capabilities, production inputs, and previous year’s performance, among other things,
may influence the decision by the firm to include the platform business model as part of
the business strategy or not. At the same time, increased product market fluidity in itself
might change the mix of product inputs for a firm, which in turn might affect the value-
added productivity of a firm. Adopting a platform business strategy to negate the effects
of product market fluidity requires restructuring of organizational resources. Rather than
utilizing resources for operational efficiency within the firm, the restructuring and
deployment of resources should focus on attracting platform participants and facilitating
the transaction between them. This may lead to heterogeneity in the effect of product
market fluidity and the adoption of the platform business model on the firm’s value-added
productivity. Any identification strategy needs to address these concerns of endogeneity
and individual firm-level effects. To address these concerns, I have taken many steps.
First, to control for unobserved heterogeneity due to time-varying and firm-level
unobserved effects, I used year and firm fixed effects in my panel data analysis. I used a
dynamic panel data model for estimation, where the past performance of a firm (captured

78
78
by lagged value-added productivity) has an effect on the current performance of a firm.
By adding lagged value-added productivity in the model, we control for the effect of the
historical performance of a firm, including the historical inputs (past performance is also
a function of production inputs). However, the past performance of a firm is correlated
with the current observed and unobserved variables in the model (individual firm effects).
For example, a firm's decision to invest in research and development may be based on
its ability to do the same, which will be based on the financial performance of previous
years. There is also the concern of causal direction: value-added productivity affects the
choice of the business model, and other parameters or choice of the business model and
other parameters lead to value-added productivity. To address these concerns of
endogeneity, I used the Arellano–Bond method (ABOND) (Arellano and Bond 1991) for
dynamic panel analysis. In this method, we start by taking first differences of the original
model. This wipes out any individual-level effects of the firm from the model. However,
the differenced lagged value-added productivity is still correlated with the differenced
error term. We use second lagged value-added productivity as an instrumental variable
for the difference equation to calculate parameter estimates for the model. We used the
Blundell-Bond (BBOND) method as a robustness check for ABOND method. The
Blundell–Bond (BBOND) method extends ABOND to create a system estimator that only
requires a one-period lag for the instruments and reduces a small downward bias that
occurs in ABOND when the actual value of a coefficient is high. These lagged
instrumental variable-based methods of analysis are prevalent in addressing endogeneity
concerns in micro-productivity research (Nagle 2018). To check for the robustness of the
results, I allowed BBOND (system GMM) estimators to choose the maximum lags (up to
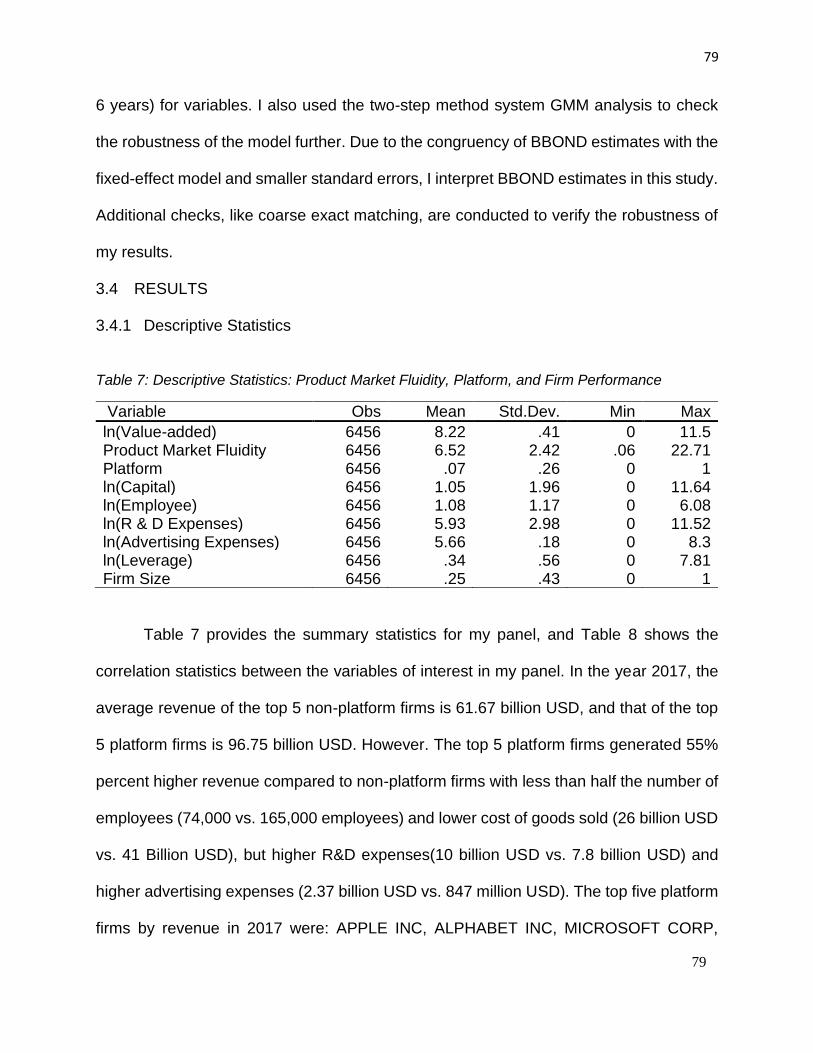
79
79
6 years) for variables. I also used the two-step method system GMM analysis to check
the robustness of the model further. Due to the congruency of BBOND estimates with the
fixed-effect model and smaller standard errors, I interpret BBOND estimates in this study.
Additional checks, like coarse exact matching, are conducted to verify the robustness of
my results.
3.4 RESULTS
3.4.1 Descriptive Statistics
Table 7: Descriptive Statistics: Product Market Fluidity, Platform, and Firm Performance
Variable Obs Mean Std.Dev. Min Max
ln(Value-added) 6456 8.22 .41 0 11.5 Product Market Fluidity 6456 6.52 2.42 .06 22.71 Platform 6456 .07 .26 0 1 ln(Capital) 6456 1.05 1.96 0 11.64 ln(Employee) 6456 1.08 1.17 0 6.08 ln(R & D Expenses) 6456 5.93 2.98 0 11.52 ln(Advertising Expenses) 6456 5.66 .18 0 8.3 ln(Leverage) 6456 .34 .56 0 7.81 Firm Size 6456 .25 .43 0 1
Table 7 provides the summary statistics for my panel, and Table 8 shows the
correlation statistics between the variables of interest in my panel. In the year 2017, the
average revenue of the top 5 non-platform firms is 61.67 billion USD, and that of the top
5 platform firms is 96.75 billion USD. However. The top 5 platform firms generated 55%
percent higher revenue compared to non-platform firms with less than half the number of
employees (74,000 vs. 165,000 employees) and lower cost of goods sold (26 billion USD
vs. 41 Billion USD), but higher R&D expenses(10 billion USD vs. 7.8 billion USD) and
higher advertising expenses (2.37 billion USD vs. 847 million USD). The top five platform
firms by revenue in 2017 were: APPLE INC, ALPHABET INC, MICROSOFT CORP,
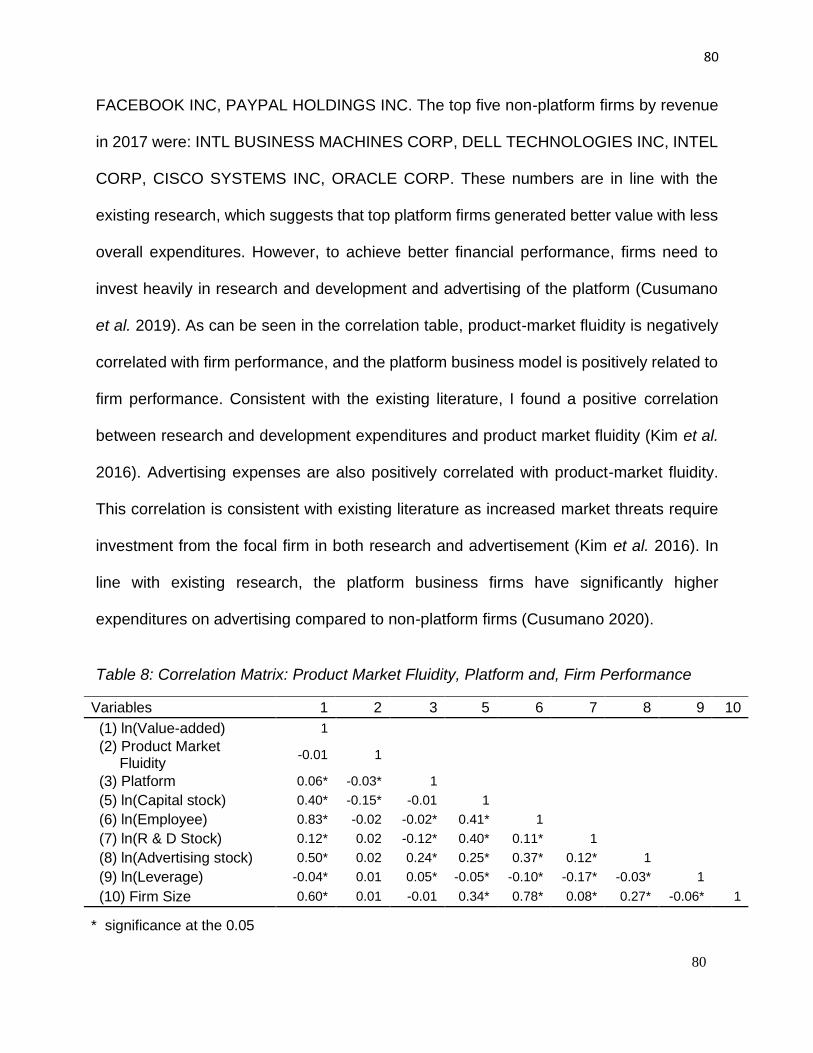
80
80
FACEBOOK INC, PAYPAL HOLDINGS INC. The top five non-platform firms by revenue
in 2017 were: INTL BUSINESS MACHINES CORP, DELL TECHNOLOGIES INC, INTEL
CORP, CISCO SYSTEMS INC, ORACLE CORP. These numbers are in line with the
existing research, which suggests that top platform firms generated better value with less
overall expenditures. However, to achieve better financial performance, firms need to
invest heavily in research and development and advertising of the platform (Cusumano
et al. 2019). As can be seen in the correlation table, product-market fluidity is negatively
correlated with firm performance, and the platform business model is positively related to
firm performance. Consistent with the existing literature, I found a positive correlation
between research and development expenditures and product market fluidity (Kim et al.
2016). Advertising expenses are also positively correlated with product-market fluidity.
This correlation is consistent with existing literature as increased market threats require
investment from the focal firm in both research and advertisement (Kim et al. 2016). In
line with existing research, the platform business firms have significantly higher
expenditures on advertising compared to non-platform firms (Cusumano 2020).
Table 8: Correlation Matrix: Product Market Fluidity, Platform and, Firm Performance
Variables 1 2 3 5 6 7 8 9 10
(1) ln(Value-added) 1
(2) Product Market Fluidity
-0.01 1
(3) Platform 0.06* -0.03* 1 (5) ln(Capital stock) 0.40* -0.15* -0.01 1 (6) ln(Employee) 0.83* -0.02 -0.02* 0.41* 1 (7) ln(R & D Stock) 0.12* 0.02 -0.12* 0.40* 0.11* 1 (8) ln(Advertising stock) 0.50* 0.02 0.24* 0.25* 0.37* 0.12* 1 (9) ln(Leverage) -0.04* 0.01 0.05* -0.05* -0.10* -0.17* -0.03* 1 (10) Firm Size 0.60* 0.01 -0.01 0.34* 0.78* 0.08* 0.27* -0.06* 1
* significance at the 0.05

81
81
3.4.2 System GMM estimations
Table 9 represents the fixed effect estimations for the effect of product market fluidity and
platform business model on firms' performance. Model 1 in Table 9 is the basic production
function model. Model 2 presents the effect of Product market fluidity on firm performance.
Model 3 presents the effect of the platform business model on firm performance. Model
4 presents the main effects of product market fluidity and platform business model on firm
performance. Model 5 is the interaction model. The same set of models are repeated in
Table 10 with the system GMM estimator. System GMM models are appropriate for my
analysis as there is a significant first-order autocorrelation and insignificant second-order
autocorrelation. I will interpret the full interaction model (Model 5) from Table 10. The
results in Model 5 suggest that product market fluidity negatively affects the value-added
productivity of a firm. The average value-added productivity in my sample is 4.4 billion
USD. The product market fluidity measure is scaled from 0 ~ 20. So, all else being
constant, for every 5% increase in product market fluidity (increase in product offerings
from rival firms which are similar to focal firm), value-added productivity is estimated to
decrease by 0.2 %, 8.8 million USD. The firms engaged in the platform business model
have 1.9% higher value-added productivity compared to non-platform businesses, which
on average, equals 64 million USD. Finally, the interaction between product market fluidity
and platform is positively significant, suggesting platform businesses mitigate the market
threats better compared to non-platform businesses. To better understand the main and
interaction effects, I created marginal plots.
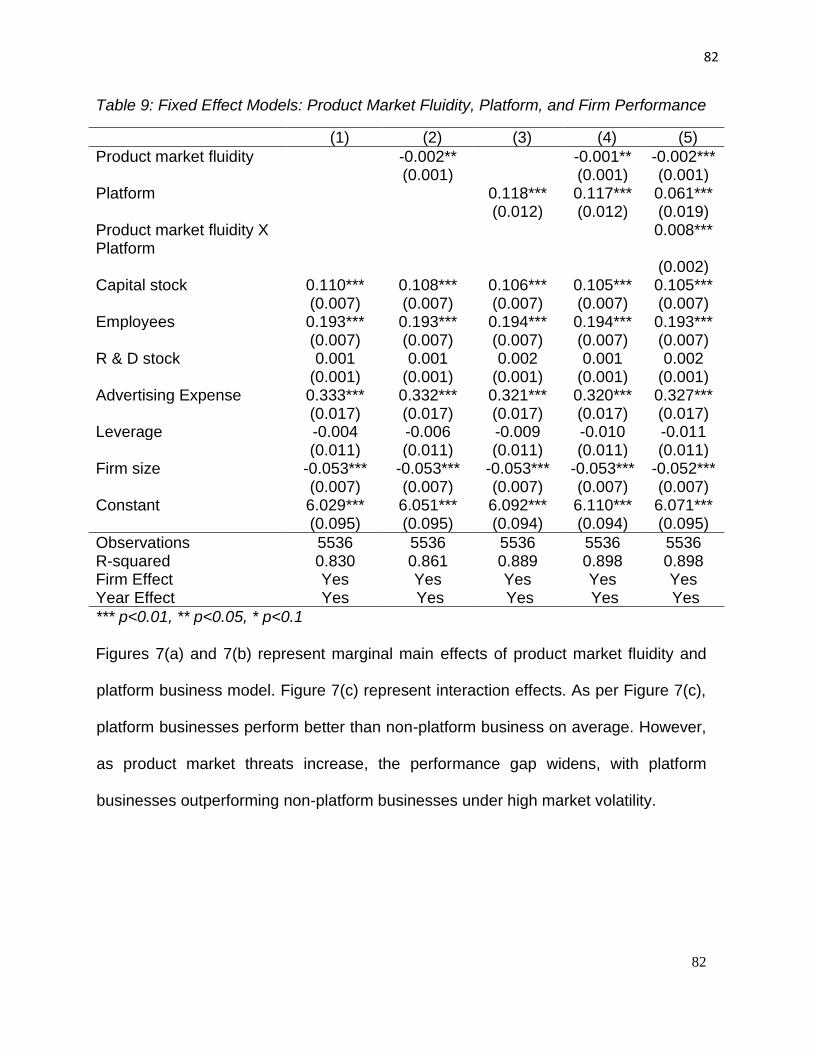
82
82
Table 9: Fixed Effect Models: Product Market Fluidity, Platform, and Firm Performance
(1) (2) (3) (4) (5)
Product market fluidity -0.002** -0.001** -0.002*** (0.001) (0.001) (0.001) Platform 0.118*** 0.117*** 0.061*** (0.012) (0.012) (0.019) Product market fluidity X Platform
0.008***
(0.002) Capital stock 0.110*** 0.108*** 0.106*** 0.105*** 0.105*** (0.007) (0.007) (0.007) (0.007) (0.007) Employees 0.193*** 0.193*** 0.194*** 0.194*** 0.193*** (0.007) (0.007) (0.007) (0.007) (0.007) R & D stock 0.001 0.001 0.002 0.001 0.002 (0.001) (0.001) (0.001) (0.001) (0.001) Advertising Expense 0.333*** 0.332*** 0.321*** 0.320*** 0.327*** (0.017) (0.017) (0.017) (0.017) (0.017) Leverage -0.004 -0.006 -0.009 -0.010 -0.011 (0.011) (0.011) (0.011) (0.011) (0.011) Firm size -0.053*** -0.053*** -0.053*** -0.053*** -0.052*** (0.007) (0.007) (0.007) (0.007) (0.007) Constant 6.029*** 6.051*** 6.092*** 6.110*** 6.071*** (0.095) (0.095) (0.094) (0.094) (0.095)
Observations 5536 5536 5536 5536 5536 R-squared 0.830 0.861 0.889 0.898 0.898 Firm Effect Yes Yes Yes Yes Yes Year Effect Yes Yes Yes Yes Yes
*** p<0.01, ** p<0.05, * p<0.1
Figures 7(a) and 7(b) represent marginal main effects of product market fluidity and
platform business model. Figure 7(c) represent interaction effects. As per Figure 7(c),
platform businesses perform better than non-platform business on average. However,
as product market threats increase, the performance gap widens, with platform
businesses outperforming non-platform businesses under high market volatility.
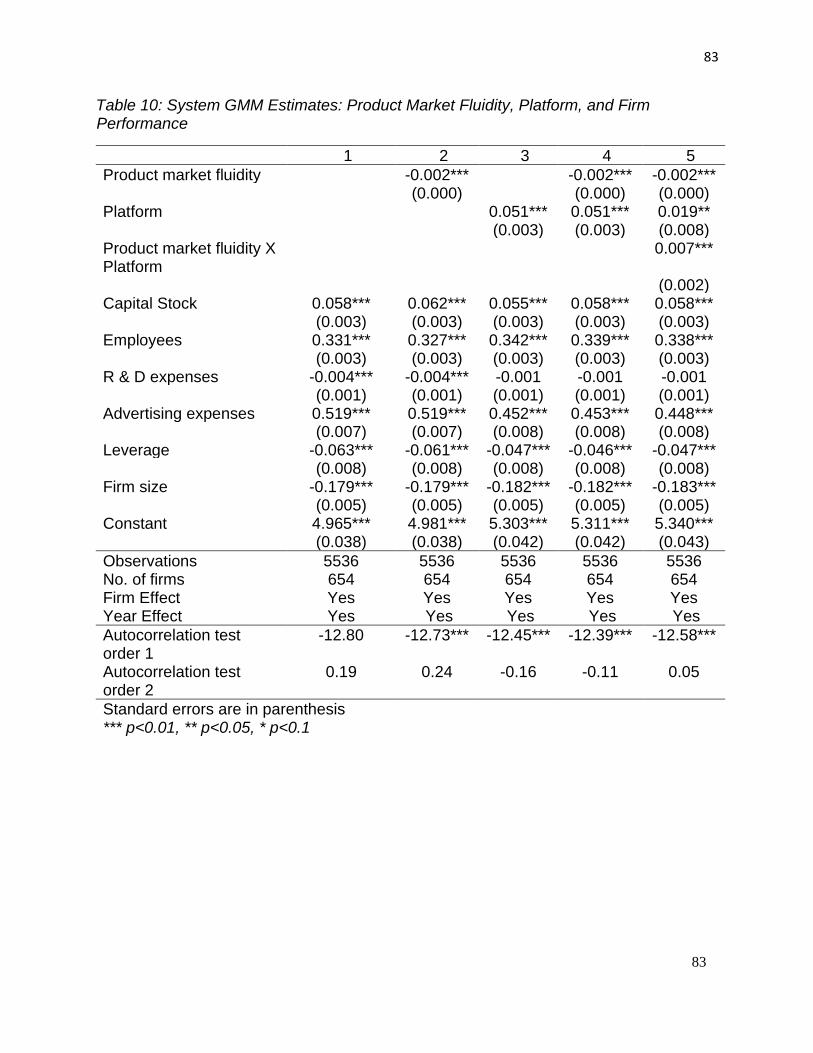
83
83
Table 10: System GMM Estimates: Product Market Fluidity, Platform, and Firm Performance
1 2 3 4 5
Product market fluidity -0.002*** -0.002*** -0.002*** (0.000) (0.000) (0.000) Platform 0.051*** 0.051*** 0.019** (0.003) (0.003) (0.008) Product market fluidity X Platform
0.007***
(0.002) Capital Stock 0.058*** 0.062*** 0.055*** 0.058*** 0.058*** (0.003) (0.003) (0.003) (0.003) (0.003) Employees 0.331*** 0.327*** 0.342*** 0.339*** 0.338*** (0.003) (0.003) (0.003) (0.003) (0.003) R & D expenses -0.004*** -0.004*** -0.001 -0.001 -0.001 (0.001) (0.001) (0.001) (0.001) (0.001) Advertising expenses 0.519*** 0.519*** 0.452*** 0.453*** 0.448*** (0.007) (0.007) (0.008) (0.008) (0.008) Leverage -0.063*** -0.061*** -0.047*** -0.046*** -0.047*** (0.008) (0.008) (0.008) (0.008) (0.008) Firm size -0.179*** -0.179*** -0.182*** -0.182*** -0.183*** (0.005) (0.005) (0.005) (0.005) (0.005) Constant 4.965*** 4.981*** 5.303*** 5.311*** 5.340*** (0.038) (0.038) (0.042) (0.042) (0.043)
Observations 5536 5536 5536 5536 5536 No. of firms 654 654 654 654 654 Firm Effect Yes Yes Yes Yes Yes Year Effect Yes Yes Yes Yes Yes
Autocorrelation test order 1
-12.80 -12.73*** -12.45*** -12.39*** -12.58***
Autocorrelation test order 2
0.19 0.24 -0.16 -0.11 0.05
Standard errors are in parenthesis *** p<0.01, ** p<0.05, * p<0.1
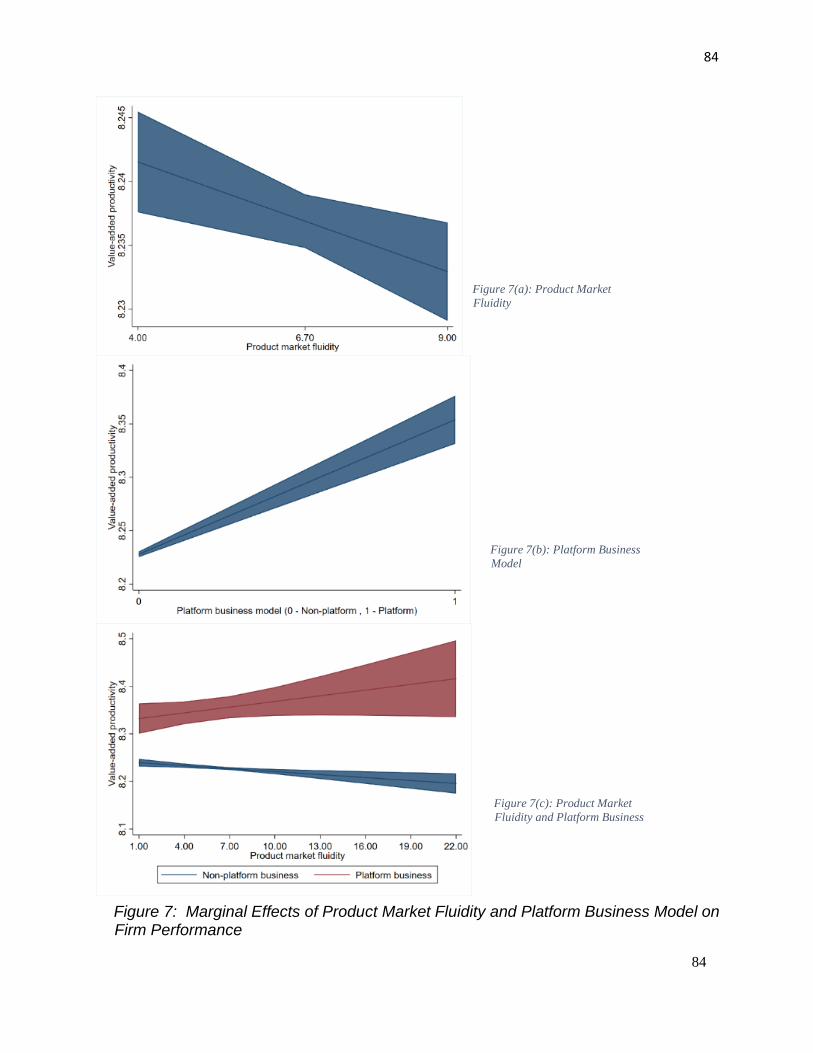
84
84
Figure 7(a): Product Market
Fluidity
Figure 7(b): Platform Business
Model
Figure 7(c): Product Market
Fluidity and Platform Business
Figure 7: Marginal Effects of Product Market Fluidity and Platform Business Model on Firm Performance
85
85
3.4.3 Additional Analysis
Moderating effect of firm size on product-market fluidity and firm performance
Relationship
To further explore the moderation effect of the platform business model on firm
performance, I conducted further analysis. It is unlikely that all firms will be impacted by
the adoption of the platform business model similarly (Cusumano et al 2019). Firms that
are larger and have better preparedness for transitioning to a platform business model
are likely to perform better under high market fluidity. Larger firms can develop
necessary complements and services faster than smaller firms and can utilize the
existing customer and supplier base to develop larger network effects (Rogers 2004),
which is essential for the success of the platform business model. On the other hand,
smaller firms are more agile and deliver higher innovation performance compared to
larger firms (Stock et al. 2002). It has also been observed that some smaller platform
firms are extremely profitable as they have still not incurred the cost of expanding their
platform network (Cusumano et al. 2019). To explore this, I interacted firm size with
platform business model and product market fluidity. I also expanded the portfolio of
variables representing firm size to build robustness in the analysis. Existing literature
has used the number of employees as alternative measures of firm size. I created a
binary variable using the number of employees, with firms in the 75th percentile and
above in a given year as 1 and 0, otherwise. I ran the interaction analysis with both firm
size variables. Results are consistent with the main analysis. Firms which are larger and
adopt a platform business model have better firm performance under high product
market fluidity than firms which are smaller in size and have a traditional pipe business
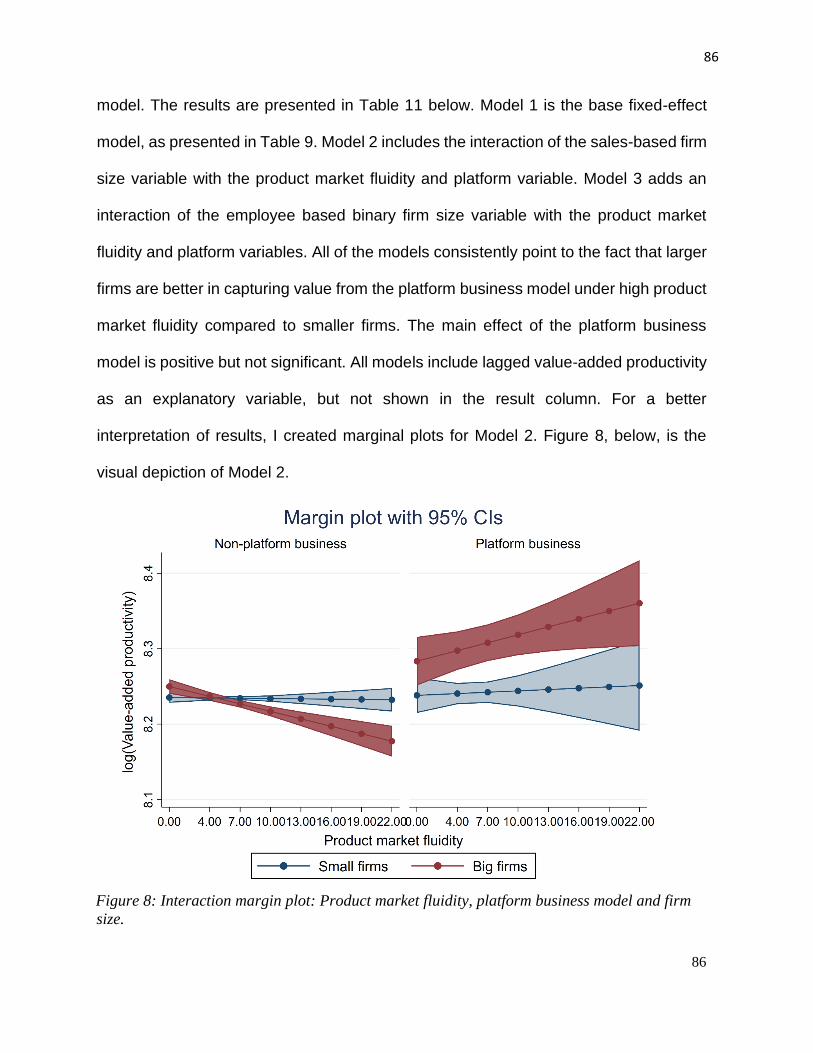
86
86
model. The results are presented in Table 11 below. Model 1 is the base fixed-effect
model, as presented in Table 9. Model 2 includes the interaction of the sales-based firm
size variable with the product market fluidity and platform variable. Model 3 adds an
interaction of the employee based binary firm size variable with the product market
fluidity and platform variables. All of the models consistently point to the fact that larger
firms are better in capturing value from the platform business model under high product
market fluidity compared to smaller firms. The main effect of the platform business
model is positive but not significant. All models include lagged value-added productivity
as an explanatory variable, but not shown in the result column. For a better
interpretation of results, I created marginal plots for Model 2. Figure 8, below, is the
visual depiction of Model 2.
Figure 8: Interaction margin plot: Product market fluidity, platform business model and firm
size.
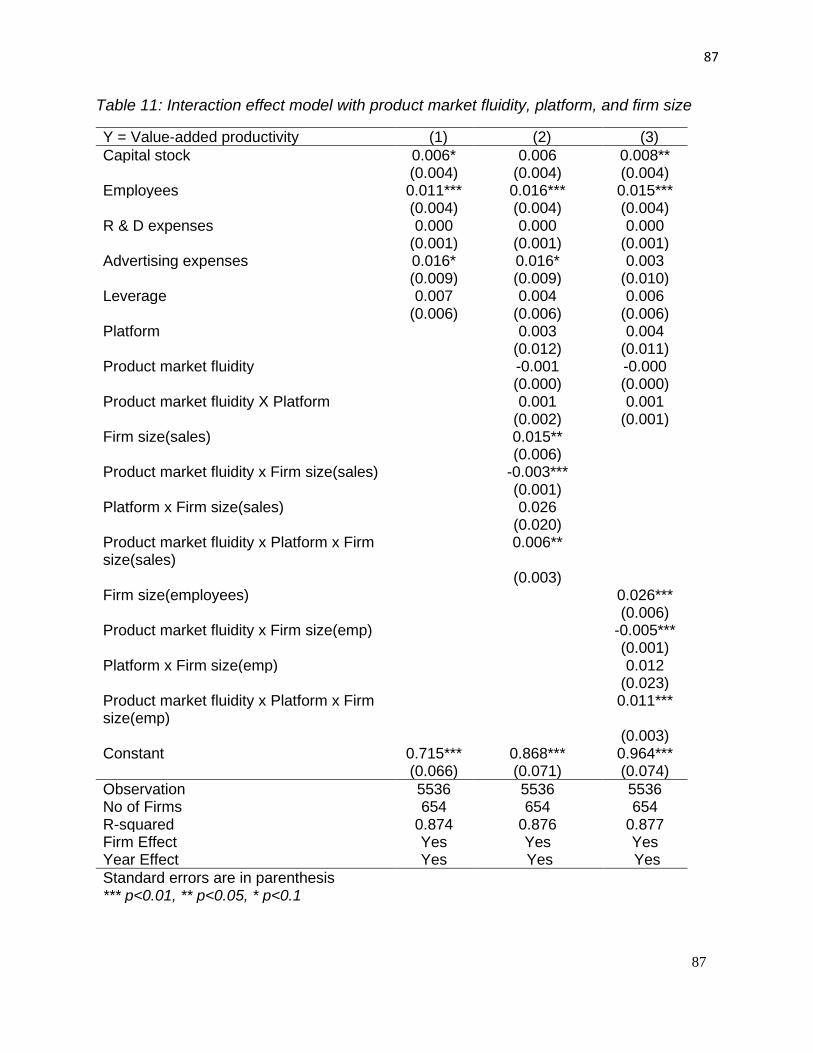
87
87
Table 11: Interaction effect model with product market fluidity, platform, and firm size
Y = Value-added productivity (1) (2) (3)
Capital stock 0.006* 0.006 0.008** (0.004) (0.004) (0.004) Employees 0.011*** 0.016*** 0.015*** (0.004) (0.004) (0.004) R & D expenses 0.000 0.000 0.000 (0.001) (0.001) (0.001) Advertising expenses 0.016* 0.016* 0.003 (0.009) (0.009) (0.010) Leverage 0.007 0.004 0.006 (0.006) (0.006) (0.006) Platform 0.003 0.004 (0.012) (0.011) Product market fluidity -0.001 -0.000 (0.000) (0.000) Product market fluidity X Platform 0.001 0.001 (0.002) (0.001) Firm size(sales) 0.015** (0.006) Product market fluidity x Firm size(sales) -0.003*** (0.001) Platform x Firm size(sales) 0.026 (0.020) Product market fluidity x Platform x Firm size(sales)
0.006**
(0.003) Firm size(employees) 0.026*** (0.006) Product market fluidity x Firm size(emp) -0.005*** (0.001) Platform x Firm size(emp) 0.012 (0.023) Product market fluidity x Platform x Firm size(emp)
0.011***
(0.003) Constant 0.715*** 0.868*** 0.964*** (0.066) (0.071) (0.074)
Observation 5536 5536 5536 No of Firms 654 654 654 R-squared 0.874 0.876 0.877 Firm Effect Yes Yes Yes Year Effect Yes Yes Yes
Standard errors are in parenthesis *** p<0.01, ** p<0.05, * p<0.1
88
88
As can be seen in the graph above, for non-platform businesses, the value-
added productivity of larger firms declines with the increase in product market fluidity.
Smaller non-platform firms are indifferent in their performance under increased
product market fluidity, resulting in higher marginal performance compared to bigger
non-platform businesses. On the other hand, the average platform business's
performance is consistently better than that of the non-platform business, even under
higher product market fluidity. The average performance difference between platform
and non-platform business increases with increasing product market fluidity. However,
contrary to the trend in non-platform businesses, bigger platform businesses perform
better than smaller platform businesses, with the performance gap widening with
increasing fluidity. Larger firms with platform business models improve their value-
added productivity under higher product competition.
Moderating effect of firm maturity on product market fluidity and firm performance
Relationship
Firm maturity, as measured by firm age, has a dichotomous influence on a firm’s
performance. Mature firms tend to be more stable and absorb uncertainty in the markets
better than newer firms (Bulan and Yan 2010). Older firms tend to be more diverse in the
product portfolio, which also leads to stable performance during the aggressive market
competition (Habib et al. 2013). If a firm's maturity influence the stability of a firm in the
market, firm maturity should moderate the effect of high market fluidity on firm
performance. At the same time, older firms are also less likely to adopt radical innovation
initiatives, and they grow significantly slower than younger firms. This phenomenon is
especially true for firms engaged in the technical domain (Balasubramanian and Lee
2008). Younger firms also generate higher value from their R&D investment, even though

89
89
the R&D investments of younger firms may be riskier than those of mature firms (Coad et
al. 2016). A likely outcome of this reluctance to innovate may be an unsuccessful attempt
at transitioning to a platform business model from the traditional business model. A
mature firm is apt at transitioning the technological structure of the firm but finds it difficult
to change the inorganic organizational structure of the firm.
To explore the effect of firm maturity on firm performance under high market fluidity and
platform business model strategy, I ran the fixed effect interaction model, with firm
maturity as a moderating variable. I did not find any significant interaction of firm maturity
with product market fluidity or platform in influencing firms’ performance. The results are
presented in Appendix B.
3.4.4 Robust Analysis
I conducted three main robustness analyses to validate my analysis further. First, I used
a Naïve-Bayes algorithm to classify a business as a platform or a non-platform business
model. While my classification is highly accurate, it is prone to measurement error. So,
I ran the main effect OLS model using hand-coded firms only. To be consistent with the
existing specification, I used lagged value-added productivity as an explanatory variable
in the model. I have a total of 934 hand-coded firm-years in my dataset. With lagged
value-added variable as an explanatory variable, 775 firm –year’s observations are
available for this analysis. The results of this analysis are presented in Table 12. I used
all production input variables for the analysis. Model 1 is the base model. Model 2 and
Model 3 includes product market fluidity and platform variables, respectively. Model 4
includes both product market fluidity and platform in the model. In Model 5, I included a
one-way time fixed effect. The results are consistent with the main analysis.
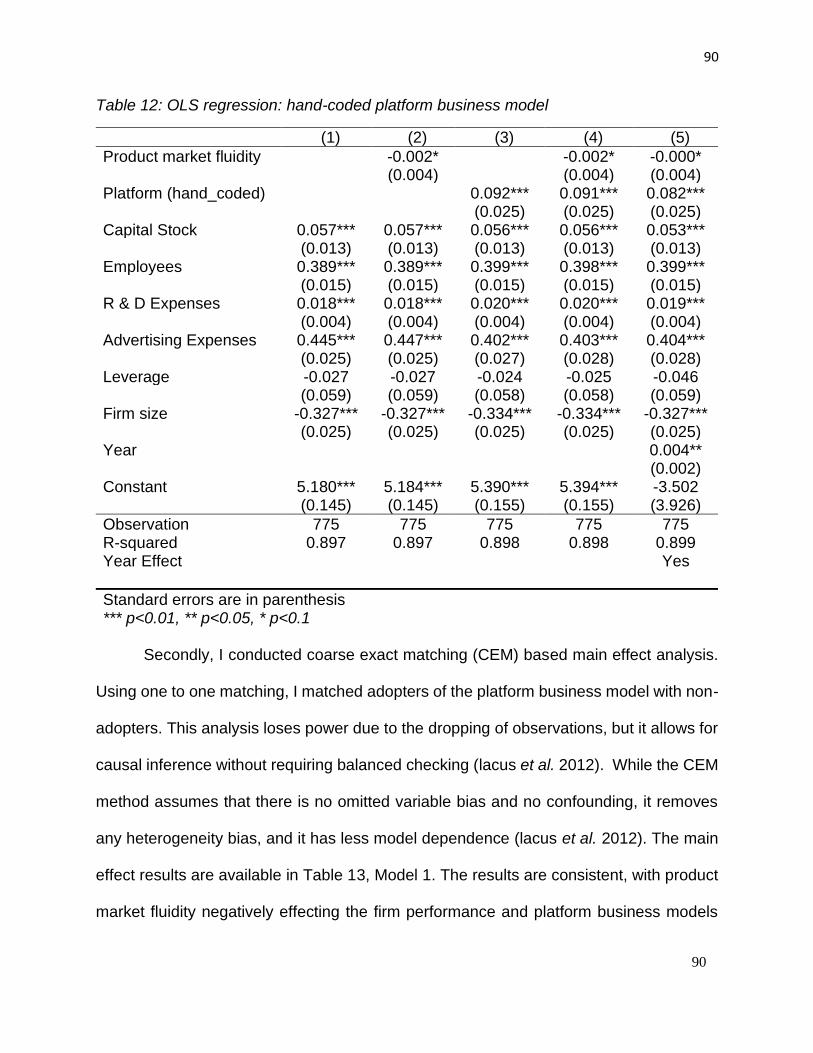
90
90
Table 12: OLS regression: hand-coded platform business model
(1) (2) (3) (4) (5)
Product market fluidity -0.002* -0.002* -0.000* (0.004) (0.004) (0.004) Platform (hand_coded) 0.092*** 0.091*** 0.082*** (0.025) (0.025) (0.025) Capital Stock 0.057*** 0.057*** 0.056*** 0.056*** 0.053*** (0.013) (0.013) (0.013) (0.013) (0.013) Employees 0.389*** 0.389*** 0.399*** 0.398*** 0.399*** (0.015) (0.015) (0.015) (0.015) (0.015) R & D Expenses 0.018*** 0.018*** 0.020*** 0.020*** 0.019*** (0.004) (0.004) (0.004) (0.004) (0.004) Advertising Expenses 0.445*** 0.447*** 0.402*** 0.403*** 0.404*** (0.025) (0.025) (0.027) (0.028) (0.028) Leverage -0.027 -0.027 -0.024 -0.025 -0.046 (0.059) (0.059) (0.058) (0.058) (0.059) Firm size -0.327*** -0.327*** -0.334*** -0.334*** -0.327*** (0.025) (0.025) (0.025) (0.025) (0.025) Year 0.004** (0.002) Constant 5.180*** 5.184*** 5.390*** 5.394*** -3.502 (0.145) (0.145) (0.155) (0.155) (3.926)
Observation 775 775 775 775 775 R-squared 0.897 0.897 0.898 0.898 0.899 Year Effect Yes
Standard errors are in parenthesis *** p<0.01, ** p<0.05, * p<0.1
Secondly, I conducted coarse exact matching (CEM) based main effect analysis.
Using one to one matching, I matched adopters of the platform business model with non-
adopters. This analysis loses power due to the dropping of observations, but it allows for
causal inference without requiring balanced checking (lacus et al. 2012). While the CEM
method assumes that there is no omitted variable bias and no confounding, it removes
any heterogeneity bias, and it has less model dependence (lacus et al. 2012). The main
effect results are available in Table 13, Model 1. The results are consistent, with product
market fluidity negatively effecting the firm performance and platform business models
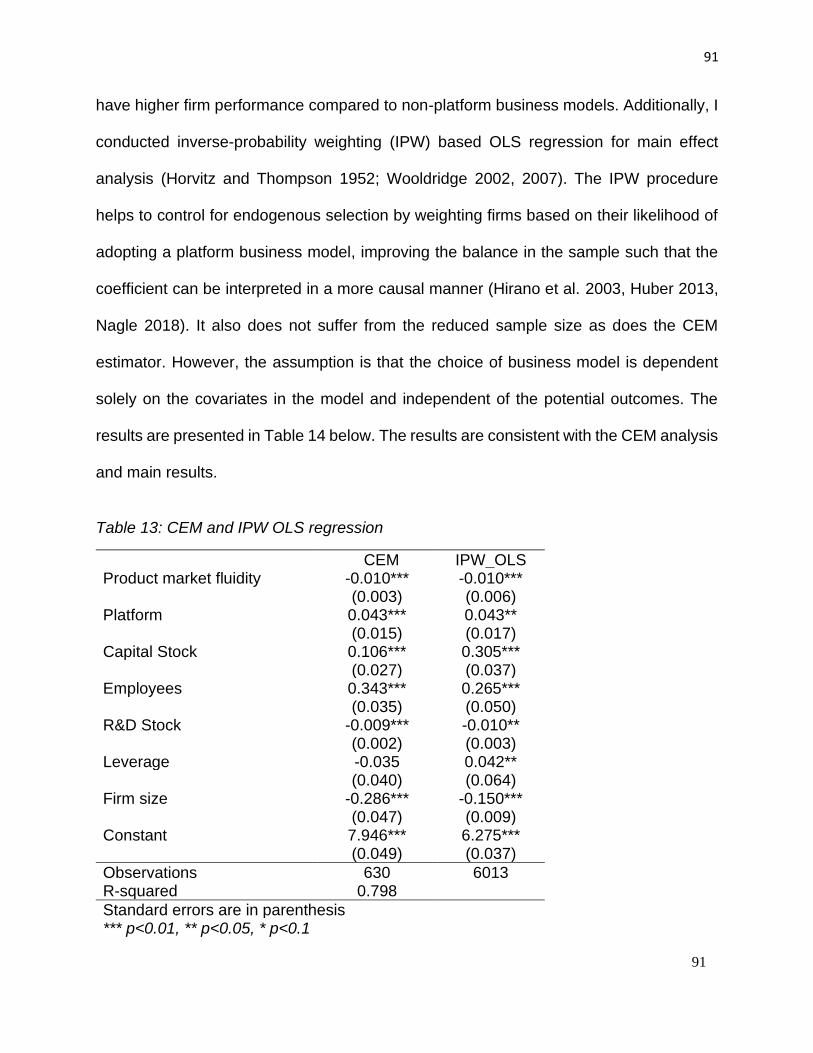
91
91
have higher firm performance compared to non-platform business models. Additionally, I
conducted inverse-probability weighting (IPW) based OLS regression for main effect
analysis (Horvitz and Thompson 1952; Wooldridge 2002, 2007). The IPW procedure
helps to control for endogenous selection by weighting firms based on their likelihood of
adopting a platform business model, improving the balance in the sample such that the
coefficient can be interpreted in a more causal manner (Hirano et al. 2003, Huber 2013,
Nagle 2018). It also does not suffer from the reduced sample size as does the CEM
estimator. However, the assumption is that the choice of business model is dependent
solely on the covariates in the model and independent of the potential outcomes. The
results are presented in Table 14 below. The results are consistent with the CEM analysis
and main results.
Table 13: CEM and IPW OLS regression
CEM IPW_OLS Product market fluidity -0.010*** -0.010*** (0.003) (0.006) Platform 0.043*** 0.043** (0.015) (0.017) Capital Stock 0.106*** 0.305*** (0.027) (0.037) Employees 0.343*** 0.265*** (0.035) (0.050) R&D Stock -0.009*** -0.010** (0.002) (0.003) Leverage -0.035 0.042** (0.040) (0.064) Firm size -0.286*** -0.150*** (0.047) (0.009) Constant 7.946*** 6.275*** (0.049) (0.037)
Observations 630 6013 R-squared 0.798
Standard errors are in parenthesis *** p<0.01, ** p<0.05, * p<0.1
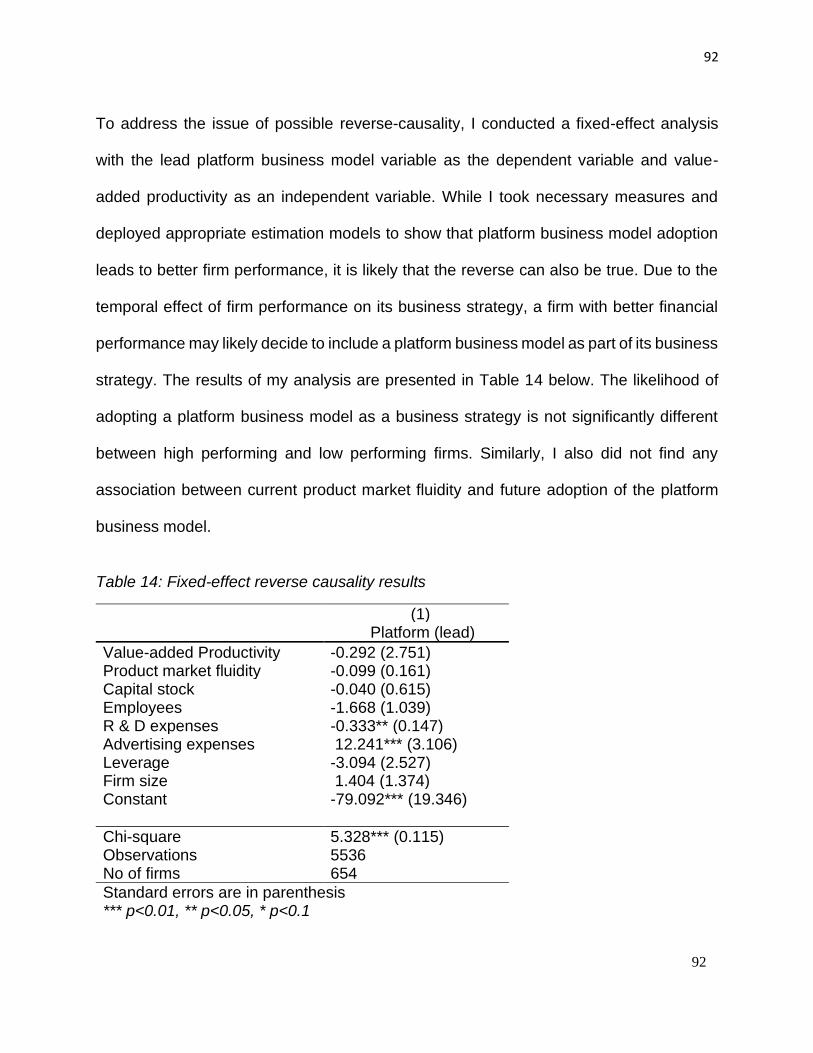
92
92
To address the issue of possible reverse-causality, I conducted a fixed-effect analysis
with the lead platform business model variable as the dependent variable and value-
added productivity as an independent variable. While I took necessary measures and
deployed appropriate estimation models to show that platform business model adoption
leads to better firm performance, it is likely that the reverse can also be true. Due to the
temporal effect of firm performance on its business strategy, a firm with better financial
performance may likely decide to include a platform business model as part of its business
strategy. The results of my analysis are presented in Table 14 below. The likelihood of
adopting a platform business model as a business strategy is not significantly different
between high performing and low performing firms. Similarly, I also did not find any
association between current product market fluidity and future adoption of the platform
business model.
Table 14: Fixed-effect reverse causality results
(1) Platform (lead)
Value-added Productivity -0.292 (2.751) Product market fluidity -0.099 (0.161) Capital stock -0.040 (0.615) Employees -1.668 (1.039) R & D expenses -0.333** (0.147) Advertising expenses 12.241*** (3.106) Leverage -3.094 (2.527) Firm size 1.404 (1.374) Constant -79.092*** (19.346)
Chi-square 5.328*** (0.115) Observations 5536 No of firms 654
Standard errors are in parenthesis *** p<0.01, ** p<0.05, * p<0.1
93
93
In our dataset, more than 50% of the firms have missing advertising expense data. Hence
it is highly likely that the advertising stock is not reflecting the actual effect on a firm's
performance. To address this issue, we ran two additional models. In first, we excluded
all the firms with missing data and ran the model with current advertising expenditure
(deflated to 2012-dollar value). In the second model, I removed the advertising stock
variable and ran the model without it. Results for the effect of product market fluidity and
platform business model on firm performance are still consistent with the main analysis.
The results of these models are updated in Appendix B
3.5 DISCUSSION
Drawing upon the text-based measure of competitive market threats, product-
market fluidity, developed by Hoberg et al. 2014, I argue that a firm’s performance is
diminished with increasing market threats. The diminishing financial returns might be
an unavoidable situation for many firms operating in the high technology industries like
digital goods, where innovation and imitation play a central role in the evolution of the
industry. I further tested the role of platform business model in moderating the effect of
product market fluidity on firm performance. In this essay I used a text-based measure
for measuring the involvement of a firm in the platform business using a Naïve-Bayes
text classification model. I found out that including platform business as part of the
overall business model helps negate the effects of product market threats. Additionally,
this effect is stronger for larger firms compared to smaller firms.
Summary of Contributions
My research establishes the relationship between product market threats
(product-market fluidity) and firm performance. In this research I account for temporal
94
94
variations of market competition and how they influence a firm’s performance, using
text-based market competitiveness measures. Among other things, the extant research
has looked into the effect of evolving product market threats on a firm’s payout policy,
its financial flexibility, cash holdings, innovation, stock crash risk and on analyst forecast
precision (Hoberg et al. 2014, Li and Zhan 2018, Mattei and Platikanova 2017, Lyandres
and Palazzo 2016). Researchers have also looked at how market competition
influences managerial compensation, corporate venture capital investment decisions,
research and development expenses, advertisement effectiveness, and organizational
governance (Kim et al. 2016, Chattopadhyay et al. 2001, Ghosh and Stock 2010,
Subramaniyam 2013). However, understanding the influence of evolving market
competition on firm performance allows firms to be better prepared with appropriate
business strategies to mitigate the negative effects of the ever-evolving competition
landscape.
Using text-based measure of platform business model, I found out that platform
businesses not only do better compared to non-platform business, but the performance
gaps also widen with the increase in product market fluidity. As identified in the
conceptual development section, the strength of platform businesses lies in the two-
sided network effect they can generate through their platform. Firms can utilize this
network further to strengthen the performance within a product market or expand to
related and unrelated product markets. Firms find ways of generating value by selling
complementarities and services — competition shifts from product to the platform. The
most valuable asset in the firm’s value chain is not the product but the producers and
consumers of the platform. The shift in value-proposition leads to the development of a
95
95
different kind of competitive strength, which is not affected by high product market
fluidity. With this result, I recommend that firms find ways to include a platform business
strategy as part of their overall business model. Some firms have already started
moving in that direction. Early adopters like Amazon Inc., and Apple Inc. started shifting
towards a platform model as the core element of their overall business model in the
early 2000s. Firms are continuously investigating ways to make the platform part of their
core business strategy. In 2019, 50 large corporations like Allianz, Booking Inc,
Deutsche Bank, GE, Henkel, and Huawei participated in the World Economic Forum’s
Digital Platforms & Ecosystems executive working group to discuss future of the digital
world and ways to leverage the digital platform and ecosystem models (Schenker 2019).
Limitations and Future Research
This essay provides insight into the relationship between product market fluidity,
the platform business, and firm performance. However, some limitations of this research
provide opportunities for future research. While I looked at the importance of platform
business strategy in mitigating the effect of product market fluidity, I was not able to
unfold the within-platform competition dynamics. What if all the firms in a product space
are platform businesses? What endogenous qualities of a platform help in successfully
competing with rival platform business under high product market threats? As more and
more firms opt for a platform strategy as part of their overall business model, the
research focus should shift to inter-platform dynamics under a competitive environment.
Additionally, not all platform business models are constructed in the same way. Some
platform businesses are based on innovation platforms where the development of
products and services, transaction, and delivery occurs on the platform itself. Other
platform businesses can be only transactional platforms where delivery is physical, and
96
96
the platform is limited to transactions between the parties (Cusukmano, 2020). For
example, Airbnb and Uber are transactional platforms, whereas Apple and Google Inc
have innovation platforms. In innovation platforms, digital goods are developed on the
platform and transacted to the consumer. This allows for greater control of the platform
owner on the platform and the transactions, allowing for increasing returns with increasing
size of the platform network (Yoffie et al., 2019). Similarly, not all firms are pure platform
firms. Most existing firms adopt the platform business model as part of their overall
business model resulting in a hybrid business model (Van Alystyne and Parker, 2016).
Future research may look into how different firms generate value by including the platform
business model as part of their overall strategy. Finally, variables like advertising stock
might affect the success of the platform business model, and may not have been
sufficiently explored in this essay due to the limited availability of data from COMPUSTAT.
Future research might look into extracting these variables directly from 10-K annual
reports and explore their relevance in the success of the platform business model
3.6 CONCLUSION
As high technology firms continue to embrace the effects of the fast-changing
competitive landscape, there is a need to revisit some of the propositions of early
innovation research. The product innovation cycles are getting shorter, and the
opportunity to appropriate value from the product fermentation phase is limited. In the
digital landscape, firms cannot escape the effects of innovation and imitation by rival
firms. Firms need to find new mechanisms to sustain growth and capture value when
the competitive landscape is dynamic.

97
97
We need future research to focus on the business strategies and their elements,
which can help firms navigate through evolving competitive threats. This research is an
effort to explore one such business strategy and its impact on firm performance under
high product market fluidity. With this research I add to the existing literature on platform
business models and competitive threats by exploring their impact on firm performance.
I expect future research to investigate other strategies at the micro-level and add other
dimensions of business strategies to the research literature.
98
98
4 Essay 3: Open Innovation, Absorptive Capacity, and Firm Performance.
4.1 INTRODUCTION
In his famous 1997 article, “The Cathedral and the Bazaar,” Eric Raymond coined the
term “Cathedral” model of software development to represent a closed sourced,
hierarchical and proprietary model of software development by firms, and “Bazaar” for the
open-source, free and equality based software development model by communities
(Raymond 1997). According to early research in open innovation, the two models of
software development are incongruent, and different motives drive them. The Cathedral
model of development is extrinsically motivated, profit-driven, and competence-
enhancing. The Bazaar model of software development is intrinsically motivated,
community-driven, and competence-destroying. The debate is still open about the role of
open innovation as part of the innovation strategy of a firm. The jury is still out on how
different internal and external drivers of open innovation like absorptive capacitive of the
firm and network effects influence the value capture from an open innovation strategy
(West et al., 2014; West and Bogers, 2016; Bogers et al., 2017) However, in the last
decade, some for-profit firms have started co-adopting open innovation as a method of
innovation and product development. For example, during my exploration of open-source
social coding platform GitHub, I found that 41 of the top 100 firms by market capitalization,
have established firm-level presence on the platform with multiple open-source projects
under development. It is in stark contrast with the position most for-profit firms took during
the early days of open-source project development. In 2001, Steve Ballmer, ex-CEO of
Microsoft Corporation, who said, "Linux is [a] cancer that attaches itself in an intellectual
property sense to everything it touches"(Greene, 2001). In general, exploring the external
99
99
sources of innovation and opening the internal innovation to the external world is seen as
a riskier proposition, the one marked with barriers. For example, one survey of European
SMEs and large enterprises, undertaken in 2008, found that the risk of loss of knowledge,
higher coordination costs, loss of control, and higher complexity as frequent risks
connected to open innovation activities. Additionally, it also appeared in the same survey
that open innovation activities also face internal and external barriers, such as the
difficulty in finding the right partner, imbalance between open innovation activities and
daily business, and insufficient time and financial resources for open innovation activities
(Enkel et al. 2009).
Even with the established risks and barriers, firms engage with open innovation
communities to filter and acquire external sources of innovations by either allowing its
employees to engage with the communities or sponsoring the communities in return for
improvement to their products (West et al. 2014). For example, Under the same Steve
Ballmer, who called Linux cancer, Microsoft started open sourcing their .NET framework
in 2011, and in 2016 he said, “I may have called Linux cancer, but now I love it”(Tung,
2016). As of today, Microsoft is not only developing more than 2000 software projects on
GitHub; it has joined the Open-source Innovation Network (OIN) in 2018 and opened
60,000 of its patents to support Linux development and protect it from litigation (Khan,
2018).
However, our understanding of its impact on a firm’s financial performance is
limited. Advancement in open-source innovation research is encouraging with empirical
studies on supply-side user engagement in open-source development (Ho and Rai 2017)
and demand-side strategies firms employ in competing scenarios, including the

100
100
deployment of open-source systems (Nagle 2018). For example, on the supply side, it
has been observed that the sponsorship of projects and licensing regiment influences
user’s engagement in open-source projects (Stewart et al. 2006, August et al. 2017).
Other studies examined the effect of licensing, collaborative norms, and open-source
identity on user engagement and software projects. Another set of studies investigated
user engagement in open-source projects in the context of social network embeddedness
and team diversity (Grewal et al. 2006, Singh et al. 2011, Daniel et al. 2013). On the
demand side, researchers developed analytical models to understand firms’ business
strategy under different business models: proprietary, open, and hybrid (Economides and
Katsamakas 2006, Kumar et al. 2011). For example, it has been observed that when a
firm’s software product is of high (low) quality, the firm is more open when it is
incompatible (compatible) with open-source competitor than under a compatibility
(incompatibility) condition (Casadesus-Masanell and Llanes 2011). The open-source
innovation has moved from the domain of non-commercial community-based
development to a collaborative private-collective model of development, which requires
further understanding of a firm’s engagement in open-source communities and its direct
impact on their performance.
Another aspect of open-source engagement that I study in this essay is the direct
engagement of a firm in open-source communities. Rather than employee-based or
sponsorship-based participation in the open-source communities, for-profit firms have
started engaging on open-source social coding platform directly. Firms are actively
developing their projects, also known as repositories, on these platforms with involvement
from voluntary contributors. Figure 9 shows the number of repositories currently hosted

101
101
by the top 20 for-profit firms on GitHub. As observed in the literature, a firm’s choice of
opening up innovation is not a binary choice. There are trade-offs in terms of revenue
models and a shift in competence enhancing assets. Our current understanding of the
impact of this mode of open-source engagement on a for-profit firm’s financial
performance is limited. One exception to this is a study by Nagle, which showed that
open-source operating systems as input to production activities significantly increase the
overall firm performance (Nagle 2018). A firm’s direct engagement in the development of
open-source projects creates additional strategic decision choices that I investigated in
this essay. Specifically, at the firm level, 1) does engagement on an open-source
development platform improve a firm’s financial performance? 2). How does increasing a
firm’s presence on open-source development platforms affect the firm’s performance? 3).
Does a firm’s size and absorptive capacity, defined by the research and development
capability, change the benefits achieved from open-source innovation? 4). How does the
market competitiveness and industry concentration moderate the effect of open-source
innovation on a firm’s financial performance?
To answer these research questions, I developed a panel dataset by identifying a
firm’s active involvement in open-source innovation. Active participation of a firm in open-
source innovation is determined based on a firm's explanation of its open-source
innovation strategy in 10-K reports, annual reports, firm’s organization of open-source
initiatives for idea generation like code schools and hackathons, and its direct presence
on social coding platforms like GitHub. GitHub is especially crucial as most for-profit firms
with even a basic open-source innovation strategy have a direct presence on GitHub.
GitHub, as a distributed social coding platform, started in 2009, and first firm-level
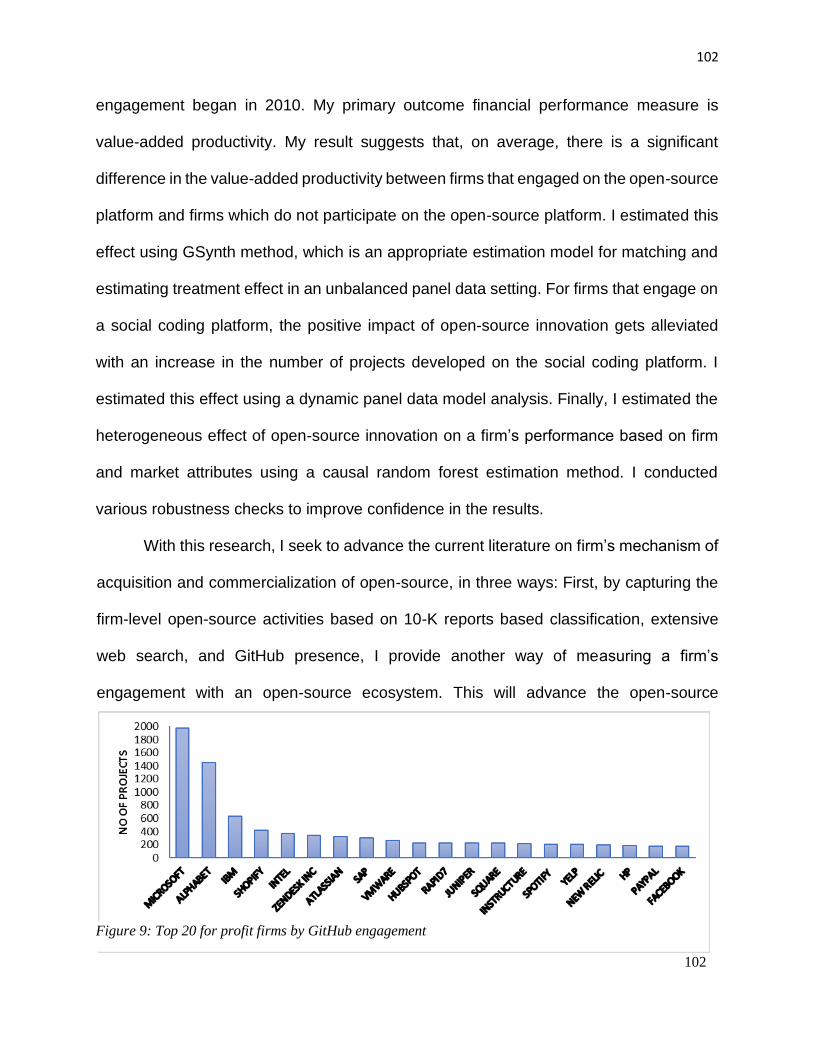
102
102
engagement began in 2010. My primary outcome financial performance measure is
value-added productivity. My result suggests that, on average, there is a significant
difference in the value-added productivity between firms that engaged on the open-source
platform and firms which do not participate on the open-source platform. I estimated this
effect using GSynth method, which is an appropriate estimation model for matching and
estimating treatment effect in an unbalanced panel data setting. For firms that engage on
a social coding platform, the positive impact of open-source innovation gets alleviated
with an increase in the number of projects developed on the social coding platform. I
estimated this effect using a dynamic panel data model analysis. Finally, I estimated the
heterogeneous effect of open-source innovation on a firm’s performance based on firm
and market attributes using a causal random forest estimation method. I conducted
various robustness checks to improve confidence in the results.
With this research, I seek to advance the current literature on firm’s mechanism of
acquisition and commercialization of open-source, in three ways: First, by capturing the
firm-level open-source activities based on 10-K reports based classification, extensive
web search, and GitHub presence, I provide another way of measuring a firm’s
engagement with an open-source ecosystem. This will advance the open-source
Figure 10: For-Profit Firms with Most Number of Projects on GitHub Figure 9: Top 20 for profit firms by GitHub engagement
103
103
innovation literature with emphasis on open-source development in the context of for-
profit firms. Secondly, I model and analyze the effect of firm-level open-source
engagement on its financial performance. I capture multiple measures of firm-level
engagement on the GitHub platform and estimate their impact on the financial outcome
of the focal firms. With this study, I aim to contribute to production economics in general
and economics of IS research in particular. Finally, I also explore heterogeneity in the
effect of open-source innovation on firm performance based on firm and competition
attributes, advancing the research on IT and business strategy to provide guidelines
around open-source innovation strategy.
4.2 CONCEPTUAL DEVELOPMENT
Traditionally, for-profit firms have been reluctant to embrace the open sourcing of
software movement, which began in the early 1990s. The reluctance was mostly born
out of the fact that in a disconnected technological ecosystem, free revealing of source
code diminished private profits and limited the returns to research and development
investment.
The earliest discussion on open-source innovation model as a private-collective
model started in 2003. Researchers proposed that firms can benefit from selective
engagement with open-source ecosystems for faster diffusion of innovation, and firms
can harness innovation-related profits through network effect (von Hippel and Krogh
2003). Early research focused on two types of scenarios: one in which firms co-exist
with open-source competitors (Bonaccorsi and Rossi 2003, Mustonen 2003) and
second where firms develop a profitable relationship with open-source communities by
contributing back to open-source communities and embedding open-source code in the
104
104
product development process (Grand et al. 2004, Dahlander and Magnusson 2006).
Researchers also observed that technology platforms mediate the competition between
different software regimes (Cusumano and Gawer 2002, West 2003). For example, in
a two-sided platform, when the platform is proprietary, equilibrium prices for the platform,
the applications, and fee for application access may vary below marginal cost. Whereas,
when proprietary software is based on an open-source platform, the application sector
of the industry may be more profitable than the total profits of a proprietary platform
industry (Economides and Katsamakas 2006). Most of this early research on firm-open-
source nexus were simulations or case studies based on open-source innovation as an
inbound knowledge source for commercial firms.
In later years we saw a strategic movement by established for-profit firms to
sponsor open-source projects, releasing software under open-source licensing and
encouraging their employees to engage with open-source communities, resulting in
opening up of the outbound knowledge transfer pathways. Firms started engaging with
open-source communities and considered them as a viable part of their extensive
research and development capacity. Firms started sharing their non-differentiating
design artifacts with open-source communities under common licensing agreements
through standard-setting organizations (Germonprez et al. 2017). It is was observed
that firms with a large set of software patents and trademarks are more likely to release
source code under open-source licenses (Fosfuri et al. 2008). Opening up software
source code by big firms also induces other firms to introduce open-source software
and increase the cumulativeness of innovation in the market (Wen et al. 2016). Firms
contributing to software development of open-source communities via their employees

105
105
also generate more productive value from such engagement compared to their free-
riding peers by learning through the development process (Nagle 2018b). To achieve
these productivity benefits firms should deploy specific employee policies and
incentives which enhance employees’ careers and achieve desirable firm goals (Mehra
et al. 2011). Employees who engage in open-source communities independent of their
firm are also more likely to earn higher wages in the future compared to other employees
(Hann et al. 2013).
In recent years we observed a new model of engagement by firms with open-source
communities, which involves both releasing source code on open coding platforms like
GitHub and also developing projects collaboratively with external developers. Firms are
also disclosing their open-source involvement to the stakeholders. For example, the 2018
10-K annual report of Microsoft Inc. states that “At times, we make select intellectual
property broadly available at no or low cost to achieve a strategic objective, such as
promoting industry standards, advancing interoperability, or attracting and enabling our
external development community. Our increasing engagement with open source software
will also cause us to license our intellectual property rights broadly in certain situations”
(Microsoft, 2018, p. 11). After reading some more annual reports of high technology firms,
it was clear to me that firms are not hesitant to develop and disclose innovation on open-
source platforms, which can be of material importance to the business. For example, in
the 2018 annual report, Facebook Inc. stated: “As a result of our open-source
contributions and the use of open source in our products, we may license or be required
to license or disclose code and/or innovations that turn out to be material to our business”
(Facebook, 2018, p. 23). Firms are continuously adapting and evolving their open-source
106
106
innovation strategy using organic and inorganic growth paths. IBM Inc. acquired the
biggest commercial open-source operating platform Redhat Inc. in 2018. It is also the
founder partner of call for code, a global initiative that works with software developers to
create solutions that can help save lives3. In the year 2018, almost 100,000 developers
responded to the call, creating more than 2,500 applications to help communities recover
from natural disasters4. Similarly, Alphabet Inc. has organized annual hackathons starting
in 2012 to develop application programming interfaces with open communities
collaboratively (Mitchell, 2012). This style of engagement and openings about open-
source innovation strategy may be superior to the other ways of engagement with open-
source communities. Rather than sponsoring projects for other communities, firms have
started directly developing their source code on social coding platforms. Employees get
an opportunity to work in the open-source environment deployed by their firms. This mode
of engagement addresses both intrinsic and extrinsic motivation employees may have
with regards to developing code for open-source projects. Figure 12 depicts an official
homepage for Facebook Inc. on the GitHub social coding platform. Facebook is
developing more than 157 projects, including REACT, the most widely adopted user
interface library, on GitHub.
3 https://callforcode.org/
4 https://www.ibm.com/annualreport/assets/downloads/IBM_Annual_Report_2018.pdf
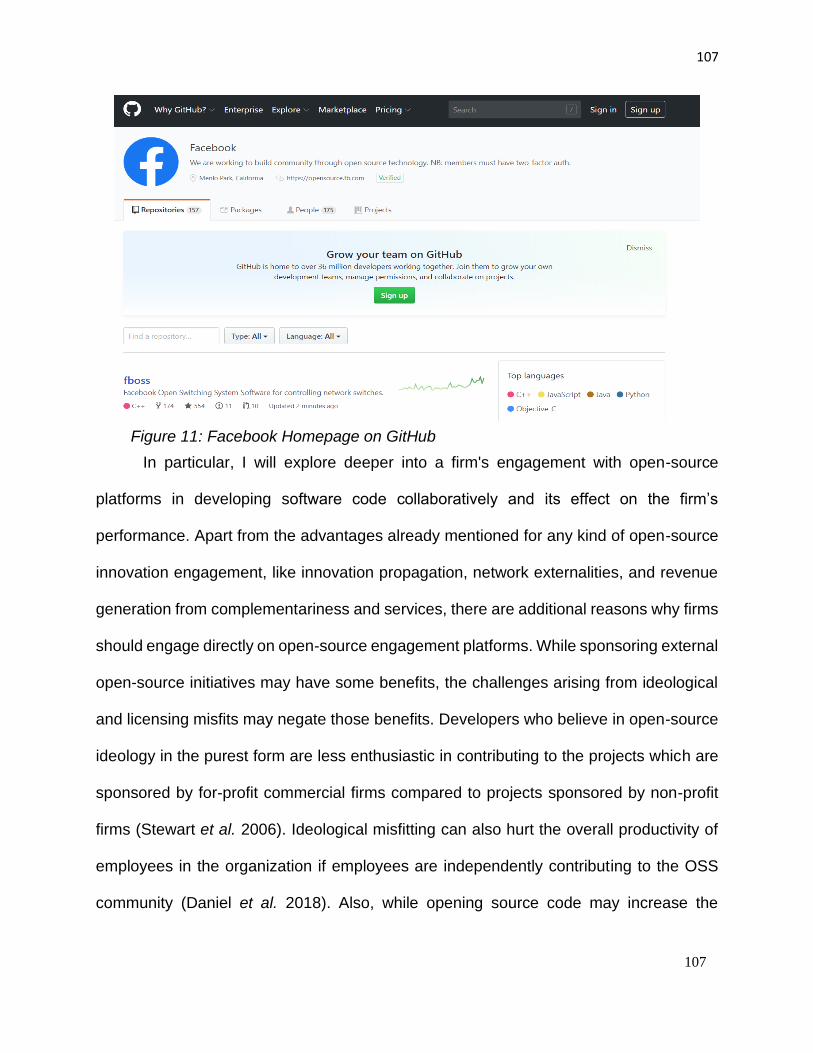
107
107
In particular, I will explore deeper into a firm's engagement with open-source
platforms in developing software code collaboratively and its effect on the firm’s
performance. Apart from the advantages already mentioned for any kind of open-source
innovation engagement, like innovation propagation, network externalities, and revenue
generation from complementariness and services, there are additional reasons why firms
should engage directly on open-source engagement platforms. While sponsoring external
open-source initiatives may have some benefits, the challenges arising from ideological
and licensing misfits may negate those benefits. Developers who believe in open-source
ideology in the purest form are less enthusiastic in contributing to the projects which are
sponsored by for-profit commercial firms compared to projects sponsored by non-profit
firms (Stewart et al. 2006). Ideological misfitting can also hurt the overall productivity of
employees in the organization if employees are independently contributing to the OSS
community (Daniel et al. 2018). Also, while opening source code may increase the
Figure 11: Facebook Homepage on GitHub
108
108
adoption of software, it may not bring the necessary learning and engagement for future
development.
Competing firms have started establishing firm-level presence on social coding
platform with multiple projects developed on these platforms. These initiatives put
downward pressure on other firms to follow suit. Competing firms gain a larger market
share by opening up their technology by attracting free riders to use the technology away
from proprietary, costly technologies. This increase in free-riders not only improves the
market share; it reduces the average cost of development due to economies of scale
(Gambardella and von Hippel 2019). Competing and non-competing institutions that have
established open-source repositories are closing down on commercial use of their open
software by other firms. For example, Facebook Inc. has modified its license for the
REACT framework to avoid any counter-litigation and restricting future competitors to use
the software commercially without licensing agreement (Kriplani 2017). Due to the
emergence of cloud-based technologies, it is easier to identify commercial use of a firm’s
open-source software, enabling firms to restrict the use of technology by competitors.
Amazon, for example, sells a cloud-hosted service based on the popular open-source
database Redis, which competes with a similar cloud-hosted service offered by Redis
Labs, the sponsor of the open-source project (Finely 2019). I expect these types of
restrictions to get deeper in the future, where firms continue to develop software on open-
source platforms for the public good and faster adoption but restrict competitors from
using it without appropriate licensing contracts.
Traditional engagement with open-source communities was limited to either
acquiring knowledge from these communities or acquiring open-source expertise from
109
109
the marketplace. This off the shelf procurement of software has its limitations. First, the
search cost related to the identification of such opportunities diminishes the returns from
the possible engagements (Laursen and Salter 2006). Similarly, acquiring external
products from the marketplace may lead to a longer learning curve compared to the
systems developed by firms as the underlying structures required to absorb the external
source of innovation may not be available within the organization. Since most of the value
creation and capture in open-source innovation happens through complementary
products and services, it is easier to create these products and services when the
software is openly developed by the focal firm. The knowledge acquired through the
development process prepares the firm to create high-quality complementariness and
deliver quality services (Dahlander and Gann 2010). Establishing an open-source
portfolio is also seen to be positive in terms of corporate branding so much so that it is
argued that “Open-source represents a final phase in the evolution of corporate brands
from closed to open brands” (Pitt et al. 2006). Direct open-source engagement also
provides the opportunity not only to identify talented developers but train them through
the development cycle on open-source platforms. Firms get a fair assessment of
individuals while collaborating with them on projects before formally recruiting them
(Linksvayer 2018).
However, there are reasons why for-profit firms are still reluctant adopters of open
innovation. First, firms that are engaging in open innovation for new ideas tend to incur
considerable search and transaction costs without fully knowing the quality and the fit of
outputs with their organization goals (Keupp and Gassman, 2009; Borgers et al. 2018).
This high transaction cost is also identified in a survey as one of the biggest hindrances
110
110
for firms that want to engage in open source innovation (Enkel et al. 2019). While opening
up the technology and co-developing it with open innovation communities enables faster
propagation of the technology, increasing the market share through technology
propagation comes with the risk of sharing the intellectual property rights of the
technology with co-developers and free riders (Gan and Stern, 2003; Chesbrough, 2006).
Younger firms are more at risk in collaborating with open innovation communities as they
are prone to arm twisting by larger firms (Shane, 2003). For example, Elastic Inc. (a start-
up from the Netherlands) developed ElasticSearch (used to search and analyze data) as
an open-source tool. Amazon Inc. copied the tool for its cloud service commercial use,
and Elastic Inc. is still fighting for the trademark with no success (Wakabayashi, 2019).
Similar to platform business model adoption, firms adopting open innovation, as part of
their overall innovation strategy, need to restructure the organization in a way that makes
it receptive to external sources of knowledge. The flexibility in organizational structure
can be achieved by developing absorptive capacity, services, and complementarities
around the openly developed products (Alexy et al., 2013; Salter et al. 2014; West et al.
2014). Absorptive capacity is difficult to develop if employees of the firm refuse to
integrate the novel external ideas and solutions and stick with the inferior homegrown
solution (also known as a not-invented-here syndrome) (Hannen et al. 2019). Firms also
need to decide about governance structure when collaborating and resourcing knowledge
from open innovation communities (Shaikh and Henfridsson, 2017). Members of open
innovation communities desire to share authority in the development process, which
includes shared decision making, open communication, democratic design decisions, and
sharing in the intellectual property of the developed product (shah 2006; O’Mahony and
111
111
Ferraro; 2007). The open collaborators likely share a different trajectory for openly
developed products that limit the value-generation opportunities for the focal firm (Almirall
and Casadesus-Masanell, 2010). The development complexity and limited
financial/technical resources available with firms are some of the challenges identified by
practitioners and researchers in adopting open innovation as part of innovation strategy
(Enkel et al. 2009). Even if firms can establish meaningful engagement with open
innovation communities, value capture from the products developed is difficult. Value from
openly developed products cannot be captured like closed and proprietary products.
Firms mostly benefit from giving away the openly developed product for free and charging
for the related services and complementarity. Some of the successful business models
based on openly developed products are RedHat, Cloudera, Hortonworks, and MongoDB
(Asay 2018). However, to achieve any meaningful value from openly developed products,
firms need to wait for the development of large enough network of users (and sometime
complementors) (Ozam, 2011). In the absence of any other innovation strategy, this can
be a slow path to the growth and development of the firm.
In light of these contrasting observations, I decided to investigate the effect of open-
source innovation on the performance of a firm. I first identified firms that are involved in
open-source innovation by capturing data from three different sources: GitHub, 10-K
annual reports, and online web search. I investigated the main effect of a firm’s
involvement in open-source communities on its performance. Additionally, I examined
how the increased intensity of commitment affects firm performance. Finally, I inspected
heterogeneity in the effect of open-source innovation on a firm’s performance. This study
is relevant for both researchers as well as practitioners. From the researcher’s

112
112
perspectives, in general, there is a dearth of studies that assessed the impact of any
open-source innovation engagement on firms’ financial performance. In particular, direct
engagement of firms on open-source platforms is a new paradigm that requires further
investigation and understanding from researchers about its implications on a firm’s
performance. Researchers have also theorized that a firm's absorptive capacity in terms
of research and development expenditures and capital investment may have a significant
role to play in maximizing value captured from open innovation (King and Lakhani, 2011;
West et al. 2014, Flor et al., 2018). In this essay, I also investigate if the absorptive
capacity of a firm plays a role in value captured from open innovation. Figure 16
represents the base model of the investigation. If the direct engagement of firms’ open-
source platforms are the future of the open-source movement in for-profit firms, then we
need to have a better understanding of strategic choices a firm should make to maximize
its financial success. With competitors quickly setting up shops on open-source platforms
and a renewed focus on the viability of open-source software-based business models
(Mark 2019), this research aims to provide insight into the feasibility of open-source
engagement in terms of financial performance. I explain my data, estimation strategy, and
results in the next sections, followed by the discussion and implication of my results.
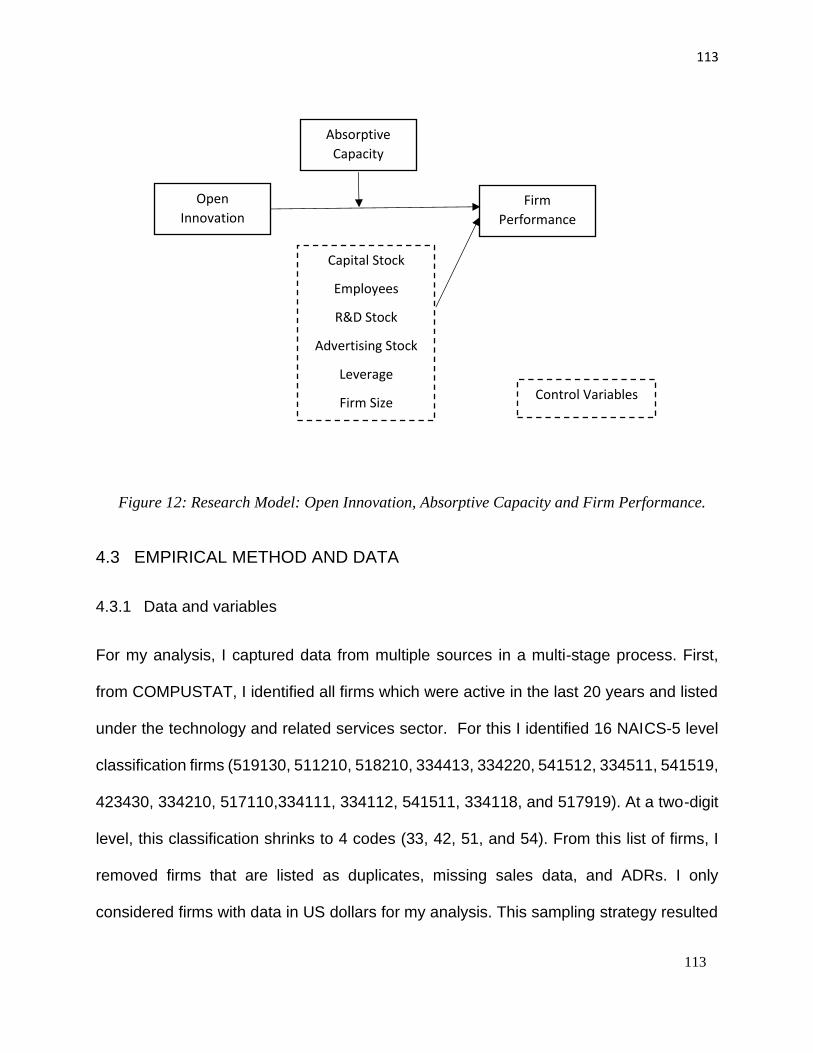
113
113
4.3 EMPIRICAL METHOD AND DATA
4.3.1 Data and variables
For my analysis, I captured data from multiple sources in a multi-stage process. First,
from COMPUSTAT, I identified all firms which were active in the last 20 years and listed
under the technology and related services sector. For this I identified 16 NAICS-5 level
classification firms (519130, 511210, 518210, 334413, 334220, 541512, 334511, 541519,
423430, 334210, 517110,334111, 334112, 541511, 334118, and 517919). At a two-digit
level, this classification shrinks to 4 codes (33, 42, 51, and 54). From this list of firms, I
removed firms that are listed as duplicates, missing sales data, and ADRs. I only
considered firms with data in US dollars for my analysis. This sampling strategy resulted
Figure 12: Research Model: Open Innovation, Absorptive Capacity and Firm Performance.
Open
Innovation Firm
Performance
Absorptive
Capacity
Capital Stock
Employees
R&D Stock
Advertising Stock
Leverage
Firm Size Control Variables

114
114
in 1199 firms. I then captured financial data for all these firms from COMPUSTAT. I also
extracted these firms’ 10-K annual reports from the EDGAR online database. I parsed
these reports and created a database of Item 1 (Business description) from these reports.
Then all those firms were searched on Google to check for their involvement in open-
source development, including on platforms like GitHub, Gitlab, and bitbucket. I found
291 firms on these platforms out of 1199 firms identified in the first phase. All these firms
are developing their open-source projects on the GitHub platform. Next, I used the GitHub
API to collect firm-level engagement data, including the number of projects, project
registration date, and firm registration date. The first registered firm and project occurred
in the year 2010. I also searched for reports about firms conducting hackathons, summer
code schools, and other open innovation challenges. The details about the development
of the variables are as follows:
Dependent Variable
Value-added productivity (l_VA_bryn): Value-added productivity as a measure of
financial performance is used extensively in microeconomic research (Nagle 2018,
Brynjolffson and Hitt 2003). I measured it as deflated sales minus deflated materials. The
same procedure calculates Value-added productivity as in Essay 2 of the dissertation.
Main Independent Variables
Open-source Engagement (post): Open-source engagement is a binary variable. This
variable captures whether a firm has engaged in open-source development or not. I
developed this variable through the following three-stage process:

115
115
a. GitHub Extraction: For all the firms in my sample, I did an extensive search of
its involvement in open-source development, mainly on the GitHub platform. I labeled all
firms that are directly developing open-source projects on the GitHub platform in any
given year as 1. For the rest of the firms, I actively searched for their involvement in open-
source innovation. For firms where I did not find any evidence of open-source innovation,
I marked them as 0.
b. 10-K report based classification: Using GitHub observations and a Google
search, I labeled 1000 firm-year 10-K reports as open-source, indicating that the firm is
involved in open-source innovation in a given year and few others as non-open. I ran the
Naïve-Bayes classification algorithm to train a classification model to predict the
involvement of a firm in open-source innovation based on the business description on the
10-K reports. The model achieved over 99% accuracy on the testing dataset. The details
of the Naïve-Bayes analysis and results are available in Appendix C. I also compared the
outcome of the Naïve-Bayes algorithm with the SVM classification algorithm. The results
were qualitatively similar, but the results of the Naïve-Bayes algorithm with cross-
validation and Laplace transformation were quantitatively better than SVM or any other
variation of the Naïve-Bayes. Then I classified the rest of the firm-years in my dataset as
open or non-open based on the predictor.
c. Hackathons and summer schools of coding: Researchers have previously
highlighted the importance of innovation contests like hackathons, as a tool of open
innovation, in ideation, and multi-agent problem solving (Terweisch & Xu 2008). I
conducted an Internet search to identify firms which held hackathons or summer schools
of coding to help with ideation of product development. my observation suggests that
116
116
open innovation contests are the extension of a firm's overall open innovation strategy
and the only subset of firms previously identified as engaged in open-source innovation
conducted or sponsored open innovation contests.
We labeled any firm involved in open-source innovation (based on social coding
platform activities, 10-K report disclosures, and innovation contests) as 1 for open-source
innovation engagement; 0 otherwise. Social coding platform activities and 10-K
disclosure-based measurement are 88% correlated with only 11 firm-years misaligned. I
investigated these 11 firm-years and resolved that measurement for these after an
exhaustive internet search. None were found to be engaged in open-source innovation. I
explained the theoretical underpinnings of the Naïve-Bayes algorithm in Essay 3 of the
dissertation.
Open-source Engagement Intensity: I observed that for all the firms, open-source
development on a social coding platform is centered on GitHub. I measured open-source
engagement intensity as the log of the cumulative number of actively-developed projects
for a firm in a given year.
Control Variables
Apart from open innovation engagement and standard capital and labor inputs (Berndt
1991), many other factors may affect a firm’s value-added productivity. Some of these
factors may also affect the open innovation engagement and firm performance
relationship. For example, investment in R&D and branding have shown to affect the
value-added productivity of a firm (Brynjolfsson et al., 2002; Villalonga, 2004; Hall et al.,
2005). The absorptive capacity of a firm, as measured by R&D expenditures, and firm
size have been shown to increase the capitalization of the external sources of innovation

117
117
(Cohen and Levinthal,1990). Absorptive capacity amplifies the effects of external
innovation sourcing, both on innovation productivity and on financial performance
(Rothaermel and Alexandre, 2009). The overall engagement of a firm with open
innovation communities increases with firm size and R&D expenditures (Mina et al. 2014).
Firms with a high capital investment are better placed to engage with open innovation
communities and develop products as open innovation engagements incur high search
and transaction costs (Keupp and Gassman, 2009; Borgers et al. 2018). It has also been
observed that firms competing based on innovation should have low financial leverage to
succeed in highly competitive markets (O’Brien, 2003). All these variables that may affect
the engagement of a firm in open innovation and hence affect open innovation and firm
performance relationships are modeled and controlled in the analysis. I measure these
control variables as follows:
Capital Stock: I calculated Capital stock (Kit) as per the procedure explained in Hall 1990,
and Brynjolfsson and Hitt 2003. I explained this procedure in Essay 2 of the dissertation.
Research and Development Stock: I calculated research and development stock using
the perpetual inventory method as follows:
Rit = (1-δ) Rit-1 * RNDDEFit-1+ Iit (1)
The detailed calculation of this measure is available in Essay 2 of the dissertation.
Advertising Stock: I calculated advertising stock using a perpetual inventory method
similar to research and development expenses and using the same formula. However,
standard depreciation used for advertising stock is 45%, and I used the producer price
index (PPI) for advertising agencies to deflate values to current-year dollars (Villalonga
2004, Nagle 2018).

118
118
Firm Size: For the primary analysis, firm size is a binary variable where large indicates
firm in the top 25 percent of sales in a given year and small in the bottom 75 percent. This
measure is consistent with the microeconomic literature (Nagle 2018). I used an
alternative measure for robustness, which is based on the number of employees rather
than sales.
Product market fluidity: Product market fluidity, as a measure of market threats, is the
degree of volatility (change) in the product mix of the competitors of the focal firm. The
method to calculate this measure is described in detail in Hoberg et al. 2014. I provided
details of this measure in Essay 3 of the dissertation.
Industry Concentration: Industry concentration is a measure adapted from Hoberg et
al. 2014, which identifies the industry of a firm based on the pairwise cosine similarity
between the 10-K business descriptions of a firm with another firm. All firms with cosine
similarity above a specific threshold are classified under the same industry, and the
industry concentration is calculated accordingly. This method of industry classification is
better than the traditional way of labeling firms under NAICS and SIC codes, as they have
superior “ability to explain differences in key characteristics such as profitability, sales
growth, and market risk across industries. They also better explain the extent to which
managers mention the high competition in the Management’s Discussion and Analysis
section of the 10-K, the specific firms mentioned by managers as being competitors, and
how advertising and R&D investments relate to future product differentiation. ” (Hoberg
et al., 2014).

119
119
We summarized variables and their description in table 16 below:
Table 15: Variable Descriptions Essay 3
Variable Description
Open-source engagement (Post)it
Binary variable denoting a firm i was engaged in open-source innovation in year t.
Open_engagement_intensityit Log of no. of cumulative open-source projects developed by a firm i in year t.
Value-added it Log of total sales minus total expense.
Capital stock it Log of net capital stock (calculated using the perpetual inventory method: 5% depreciation rate) in millions USD for firm i in year t after deflation.
ln(emp) it Number of employees in thousands for firm i in year t
R&D stockit R&D investment in millions of dollars (calculated using the perpetual inventory method: 15% depreciation rate) for firm i in year t after deflation.
Advertising expenses it Branding expenditure in millions USD (calculated using the perpetual inventory method: 45% depreciation rate)
leverage it Total liabilities by total assets
Firm size it Binary variable, if the firm is in the top 25 percentile of sales (or employees) in a given year, 0 otherwise.
Product market fluidity it Change in product mix among a firm i’s competitor in year t with respect to firm i. (Hoberg et al. 2014)
Industry Concentration it The measure of relatedness among firms in a given industry.
4.3.2 Estimation Model
We use the standard Cobb-Douglas production method for my estimation with value-
added productivity as a financial measure of output (Bryjolfsson and Hitt 2003, Nagle
2018). I include a log-form of the independent variable of interest, along with other
control variables. This results in the following estimation equation

120
120
ln(Value-added productivity)it = β0 + β1ln(open_engagement)it + β2ln(capital)it +
β3ln(emp)it + β4ln(r&d expenses) + β5ln(advertising expenses) + β6ln(Leverage) +
β7(firm_size) + β8(product market fluidity) + (industry fixed effect) + (firm fixed effect)i +
(year fixed effect)t + εit (2)
Where the independent variable of interest is either a firm’s choice to engage directly
with an open-source community or the quantum of engagement, which I define as open-
source engagement intensity: number of projects actively developed by a firm i in year t
on the GitHub platform. I defined the rest of the variables in Table 16.
4.3.3 Identification Strategy
Continuous Open-source Engagement and firm performance
The continuous open-source engagement model is used to identify the impact of a
firm’s choice to engage in an open-source platform on the firm’s performance. This is a
binary choice. In an experimental design, subjects are randomly selected and assigned
randomly to the treatment and control group. However, in a natural setting, this is not
possible. So I explored econometric tools to examine the effect of such a choice.
We identified Generalized Synthetic Control (GSynth) method as the main
estimation method for the continuous open-source engagement model (Xu, 2017). This
method is better suited for my analysis of the more popular difference-in-difference (DID)
estimator with the propensity score matching method. First, the GSynth method provides
valid and precise estimates when the assumption of parallel trend and pre-treatment trend
for the treated firm is violated in DID estimation. Currently, there is no statistical way to
test for a parallel assumption, and it is practically difficult to find an exact matching pair
121
121
for treated firm resulting in violation of this assumption in most cases (Xu, 2017). Secondly,
GSynth is more adept at handling unbalanced data panels with different treatment periods
for various firms compared to a standard DID procedure. As is the case in organizational
ecosystems, not all firms adopt a new system or policy at the same time, which makes it
difficult to estimate the actual effect of treatment over time. Observational longitudinal
data is also prone to missing data at random, resulting in an unbalanced panel. While the
generalized DID method can accommodate different treatment periods for different firms,
the estimates are not precise when the panel is unbalanced. The GSynth procedure can
also handle multiple treatments over multiple periods with estimates more accurate than
generalized DID and PSM with DID. Thirdly, by modeling the underlying unobserved
latent factors, which are the main reason for the violation of the parallel trend assumption,
it addresses the concerns related to heterogeneity and omitted variable bias. It first
estimates an IFE (interactive fixed-effect) model using only the control group data,
obtaining a fixed number of latent factors. It then estimates factor loadings for each
treated unit by linearly projecting pretreatment prescribed outcomes onto the space
spanned by these factors. In the end, it imputes treated counterfactuals based on the
estimated coefficients and factor loadings. Finally, since no observations are discarded
from the control group, this method uses more information from the control group and
thus is more efficient than the other matching methods when the model is correctly
specified.
Overall, GSynth is a more suitable estimation method for my case, and it provides
more efficient estimates over PSM with the DID method. DID is a special case of GSynth.
However, for a robustness check, I estimated a generalized DID model and DID model

122
122
with coarse exact matching as well, which provided similar results. One of the limitations
of the GSynth method is that it still cannot estimate parameters for treatment intensity
and heterogeneity in the treatment effect. To assess the effect of engagement intensity
on financial performance, I identified a second estimation model, which is explained in
the next section. I also estimated heterogeneous effects using the random causal forest
as described in the next few sections.
The econometric model for the GSynth method is:
Yit = δit Dit + x’it β + λ’i ft + εit, (3)
where the treatment indicator Dit equals one if firm i is engaged in open-source
development before time t and equals 0 otherwise (i.e., Dit = 1 when i ∈ T and t > open
engagement year and Dit = 0 otherwise). δit is the heterogeneous treatment effect on unit
i at time t ; xit is a (k × 1) vector of observed covariates, β = [ β 1, . . . , βk ]’ is a (k × 1)
vector of unknown parameters, ft = [ f1t , . . . , frt ]’ is an (r × 1) vector of unobserved
common factors, λ i = [ λi1, . . . , λir ]’ is an (r × 1) vector of unknown factor loadings, and
εit represents unobserved idiosyncratic shocks for unit i at time t and has zero mean. The
main quantity of interest of this research is the average treatment effect on the treated
(ATT) at time t (when t>T0)
ATTt,t>T0 = 1/Ntr ∑ i∈T [Yit(1) −Yit(0)] = 1/Ntr ∑ i∈T δit (4)
This method allows for the use of all firm-year data in the model. However, there
are a few conditions. The estimates are precise when at least six pretreatment periods
of data are available for a firm. For my analysis, I based my main results on a minimum
of 8 pretreatment periods, for more precise estimates. Also, I cannot use firms with a

123
123
single data point in pre or post-treatment in the analysis. This condition eliminates some
of the control and treated firms from the analysis. However, I have included these treated
firms in open-source engagement intensity analysis. I used firm and time fixed effects to
control for the unobserved variance. I bootstrapped the estimation to 1000 subsamples
to check the robustness of the results. For checking the sensitivity of the analysis, I
included results with 7 and 9 pretreatment periods. The results are statistically similar.
Open-source Engagement Intensity and firm performance
The open-source engagement intensity model investigates the quantitative effect of the
depth of open-source engagement on the performance of the engaged firm. Firms may
have a different degree of engagement on open-source platforms. With observational
data in hand from the GitHub platform, I decided to conduct panel data analysis. However,
this method of analysis is subject to endogeneity concerns. Firms may not only decide to
engage in open-source development but also how many projects to develop each year.
Among other things, this decision may be based on a firm’s capabilities and the previous
year’s performance. Without an appropriate identification strategy, it is difficult to establish
causality and estimate the proper effect size. To address these concerns, I have taken
many steps.
First, to control for unobserved time, firm, and industry effects, I use year, firm, and
industry fixed (at industry concentration) 5 results. I used robust standard errors (or
standard errors clustered by industry level) to alleviate concerns of heteroscedasticity.
Finally, to address the main concerns of endogeneity, I use the Arellano–Bond (ABOND)
5 I also used NACIS 2 digit classification for robustness check.

124
124
method (Arellano and Bond 1991) and the Blundell–Bond method (BBOND) (Blundell and
Bond 1998) for dynamic panel analysis. ABOND uses one-period lag of the dependent
variable as control and uses two-period, or longer lags, as instruments in a generalized
method of moments (GMM) estimation. The Blundell–Bond (BBOND) method extends
ABOND to create a system estimator that only requires a one-period lag for the
instruments and reduces a small downward bias that occurs in ABOND when the actual
value of a coefficient is high. These lagged instrumental variable-based methods of
analysis are prevalent in addressing endogeneity concerns in micro-productivity research
(Nagle 2018). To check for the robustness of the results, I allowed ABOND and BBOND
estimators to choose the maximum lags (up to 6 years) for variables. I also used the two-
step method in ABOND and BBOND to further check the robustness.
4.3.3.1 Heterogeneity in effect of open-source engagement
To estimate the average treatment effect of open-source innovation on a firm’s
performance, I used GSynth. GSynth is robust against unbalanced panels and missing
observations. It is also robust when parallel and pre-treatment trend condition is violated
for treatment-control groups (Xu, 2017). However, there are still a few limitations to the
method. First, it loses analysis power as it discards the observations with no or limited
pre-treatment and post-treatment observations (Xu, 2017). It also cannot accommodate
interaction between variables, especially treatment and covariates. These limitations
restrict the exploration of heterogeneity in treatment effect, limiting understanding of
policy estimation and evaluation of a given strategic change like engagement in open
innovation, for a firm. Traditional panel data analysis methods are inefficient in extracting
heterogeneous treatment effects, as most methods expect a priori information about

125
125
possible heterogeneity, which is not always possible in microeconomic research (Wagner
and Athey, 2018). It is also challenging to estimate all possible interactions, given the no
of covariates in the model, due to loss of statistical power and difficulty in interpreting
them. Recent developments in machine learning space have made it possible to evaluate
possible heterogeneity in treatment effects using algorithms like decision trees, random
causal forests, Bayesian regression trees, and others (Wagner and Athey, 2018).
For this research, I am using a causal random forest-based heterogeneous treatment
effect framework as my identification strategy for treatment heterogeneity (Wager and
Athey 2018). Under this framework, for a set of independent and identically distributed
subjects i=1,2,3….,n, I observe a tuple of three parameters where :
Xi is a feature vector containing the set of covariates listed in Table 19.
Yi is the response: Log of Value-added.
Wi is the treatment assignment: A firm is engaged in open-source innovation or not
(variable: post)
Our goal is to estimate the conditional average treatment effect
τ(x)=E[Y(1)−Y(0)∣∣X=x]τ(x)=E[Y(1)-Y(0)|X=x] , (5)
at a pre-specified test point x.
To achieve this, I grow a causal forest CF from causal trees. Trees in the context of
machine learning are the sample partitions created based on specific values and groups
of covariates, which leads to the greatest variance in the treatment effects. A tree is called
a causal tree when it not only split the sample based on covariates but also estimates

126
126
treatment effect. Since I cannot observe the counterfactual for a treated subject, I
calculate the difference in outcome between the treatment and control
conditions within a leaf of the tree (similar to nearest neighbor matching), and I label that
the treatment effect. A causal forest is a random forest created by averaging treatment
estimates from causal trees. The output of such a framework is a causal model that can
be tested for goodness of fit using the testing sub-sample. I also compute the rank
ordering of covariates, which are influential for the treatment effect to materialize. I use
this rank ordering of covariates to explore the heterogeneity of the effect of open-source
innovation engagement on the firm’s performance. The treatment effects estimated by
the causal forest method are asymptotically normal, allowing us to calculate the standard
error and 95% confidence intervals (Athey et al. 2019).
4.4 RESULTS
4.4.1 Descriptive Statistics
Table 16 shows the descriptive statistics of the firms in the data set. Table 17 shows a
summary comparison between firms engaged in open source innovation and control firms
for the years 2010 and 2017. Table 18 shows the correlation between variables of interest.
The final sample contained a total of 6456 observations of 713 firms. I have not assumed
any pattern about missing data as some variables have missing data, not at random. I
excluded these firm-year observations from the data. I have focused on all the firms in
specific NAICS codes. The focus on all firms from specific sectors allows for better
generalizability of the results while maintaining internal validity.
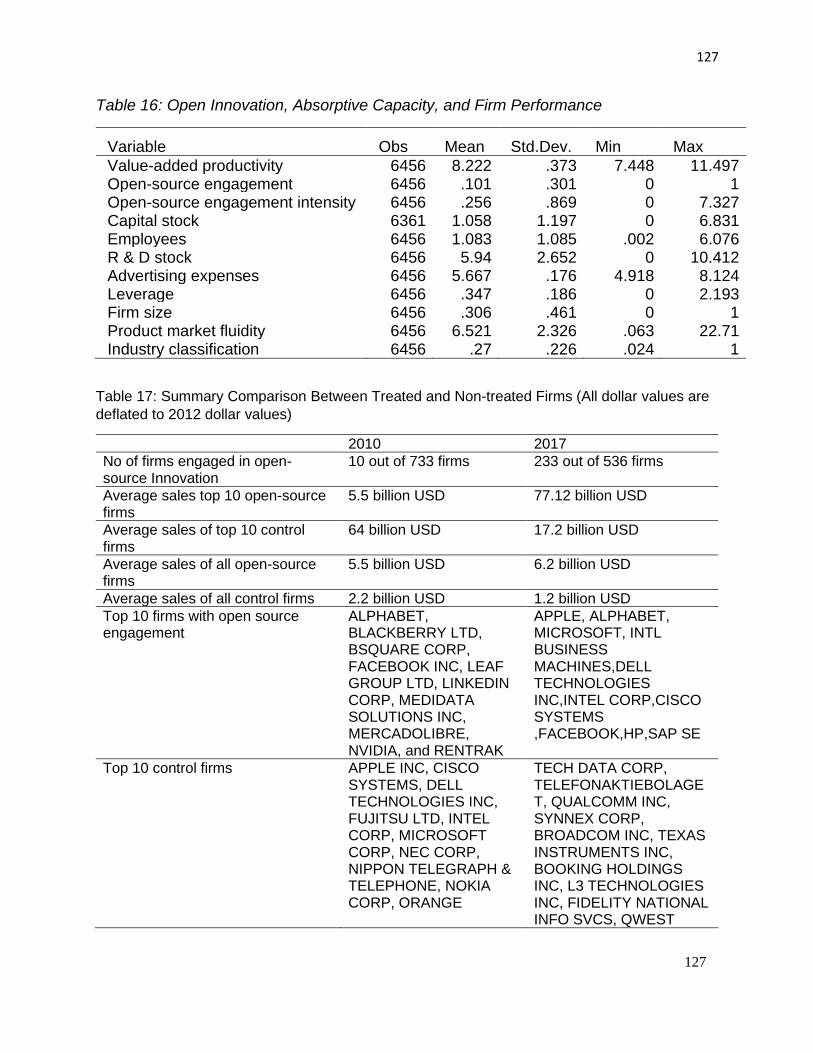
127
127
Table 16: Open Innovation, Absorptive Capacity, and Firm Performance
Variable Obs Mean Std.Dev. Min Max
Value-added productivity 6456 8.222 .373 7.448 11.497 Open-source engagement 6456 .101 .301 0 1 Open-source engagement intensity 6456 .256 .869 0 7.327 Capital stock 6361 1.058 1.197 0 6.831 Employees 6456 1.083 1.085 .002 6.076 R & D stock 6456 5.94 2.652 0 10.412 Advertising expenses 6456 5.667 .176 4.918 8.124 Leverage 6456 .347 .186 0 2.193 Firm size 6456 .306 .461 0 1 Product market fluidity 6456 6.521 2.326 .063 22.71 Industry classification 6456 .27 .226 .024 1
Table 17: Summary Comparison Between Treated and Non-treated Firms (All dollar values are
deflated to 2012 dollar values)
2010 2017
No of firms engaged in open-source Innovation
10 out of 733 firms 233 out of 536 firms
Average sales top 10 open-source firms
5.5 billion USD 77.12 billion USD
Average sales of top 10 control firms
64 billion USD 17.2 billion USD
Average sales of all open-source firms
5.5 billion USD 6.2 billion USD
Average sales of all control firms 2.2 billion USD 1.2 billion USD
Top 10 firms with open source engagement
ALPHABET, BLACKBERRY LTD, BSQUARE CORP, FACEBOOK INC, LEAF GROUP LTD, LINKEDIN CORP, MEDIDATA SOLUTIONS INC, MERCADOLIBRE, NVIDIA, and RENTRAK
APPLE, ALPHABET, MICROSOFT, INTL BUSINESS MACHINES,DELL TECHNOLOGIES INC,INTEL CORP,CISCO SYSTEMS ,FACEBOOK,HP,SAP SE
Top 10 control firms APPLE INC, CISCO SYSTEMS, DELL TECHNOLOGIES INC, FUJITSU LTD, INTEL CORP, MICROSOFT CORP, NEC CORP, NIPPON TELEGRAPH & TELEPHONE, NOKIA CORP, ORANGE
TECH DATA CORP, TELEFONAKTIEBOLAGET, QUALCOMM INC, SYNNEX CORP, BROADCOM INC, TEXAS INSTRUMENTS INC, BOOKING HOLDINGS INC, L3 TECHNOLOGIES INC, FIDELITY NATIONAL INFO SVCS, QWEST

128
128
Table 17 shows that the average sales of the top 10 firms engaged in open source
innovation surpassed the average sales of controlled firms from the year 2010 to the year
2017. A list of all firms engaged in the year 2017 in open source innovation and firms not
engaged in open source innovation is available in Appendix C. As per table 19, both
binary and intensity variables representing open-source innovation are significantly
correlated with value-added productivity. As expected, usual productivity function
variables like capital stock, employee stock, and research and development expenses
are significantly correlated with value-added productivity. The average number of projects
actively developed by firms on GitHub is 45. Microsoft Inc. hosted the highest number of
projects (2941, at the time of writing of this thesis) on GitHub. The correlation table shows
a significant correlation between open-source engagement and value-added productivity.
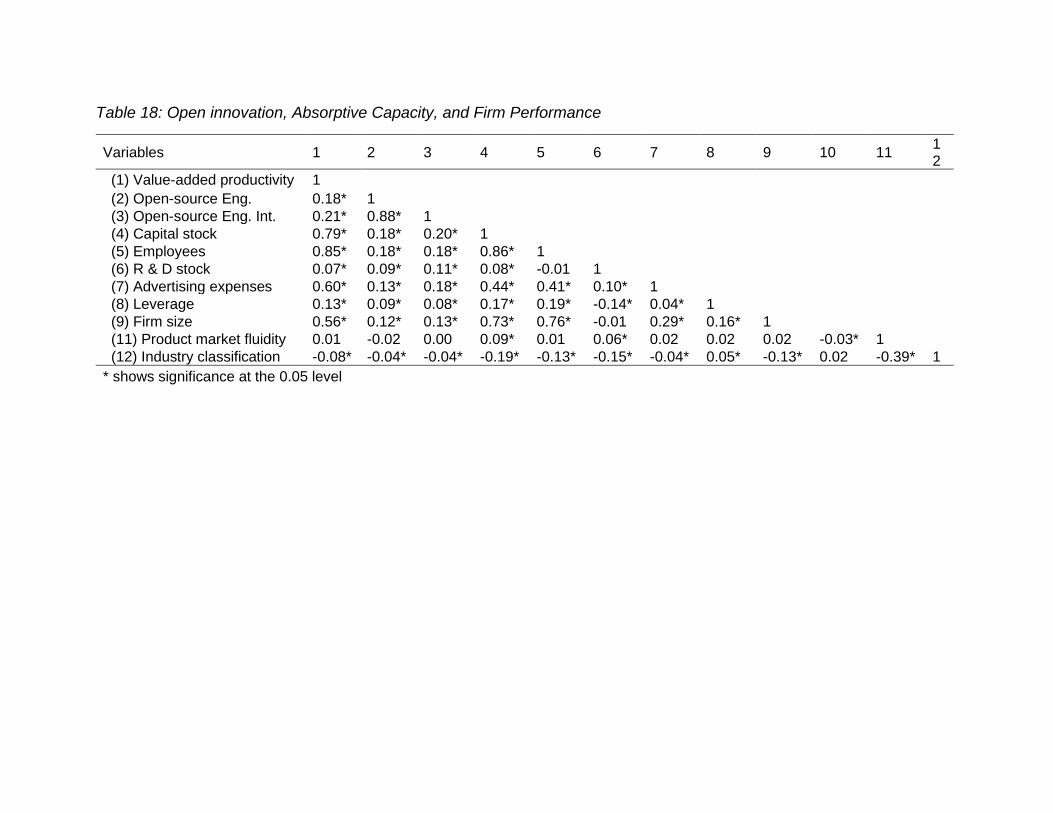
Table 18: Open innovation, Absorptive Capacity, and Firm Performance
Variables 1 2 3 4 5 6 7 8 9 10 11 12
(1) Value-added productivity 1
(2) Open-source Eng. 0.18* 1 (3) Open-source Eng. Int. 0.21* 0.88* 1 (4) Capital stock 0.79* 0.18* 0.20* 1 (5) Employees 0.85* 0.18* 0.18* 0.86* 1 (6) R & D stock 0.07* 0.09* 0.11* 0.08* -0.01 1 (7) Advertising expenses 0.60* 0.13* 0.18* 0.44* 0.41* 0.10* 1 (8) Leverage 0.13* 0.09* 0.08* 0.17* 0.19* -0.14* 0.04* 1 (9) Firm size 0.56* 0.12* 0.13* 0.73* 0.76* -0.01 0.29* 0.16* 1 (11) Product market fluidity 0.01 -0.02 0.00 0.09* 0.01 0.06* 0.02 0.02 0.02 -0.03* 1 (12) Industry classification -0.08* -0.04* -0.04* -0.19* -0.13* -0.15* -0.04* 0.05* -0.13* 0.02 -0.39* 1
* shows significance at the 0.05 level

130
130
4.4.2 Open-source engagement and firm performance
Table 19 shows the result of the GSynth model, which examines the effect of engaging
in open-source innovation on firm performance. The first model in the table is the basic
GSynth model with 1000 bootstrap samples and with firms having at least eight pre-
treatment years. The second model in the table adds cross-validation of factors. I will
interpret Model 2 here. Model 3 replaces industry concentration measures adapted from
Hoberg et al. 2014 with two-digit NAICS code to test for robustness. I used Models 4 and
5 to test the sensitivity of the results. Models 4 and 5 include firms with seven pre-
treatment period data and nine pre-treatment period data, respectively. All the models
include two-way interactive fixed effects. I report bootstrapped standard errors for all the
models. I plotted the model results in Figure 13 and Figure 14. Figure 13 shows the
average treatment effect on treated, and Figure 14 shows the difference between value-
added productivity between treated and counterfactual. From Table 19, we can see that
product market fluidity negatively affects firm performance. This observation is consistent
with Essay 3 of the thesis. Capital and labor measures are significantly positive in
explaining firm performance, which is in line with existing literature. Firm size negatively
affects the growth of value-added productivity, which is also observed in recent literature
(Nagle 2018). The effect of financial leverage on firm performance is negative and
significant, in line with existing literature (Raza 2013). In general, high financial leverage
negatively affects research and development expenditure of a firm, which is also visible
in my correlation table (Singh and Faircloth 2006). Research and development stock has
131
131
a positive effect on value-added productivity; however, it is marginally significant. Overall,
my model and results are consistent with existing literature on microeconomic research.
All the models in Table 19 consistently reflect the importance of adopting an open-source
innovation strategy. On average, a firm can increase its value-added productivity by 1.6%
by adopting open-source innovation as part of their innovation strategy compared to not
adopting it. In Figures 13 and 14, I summarize that the effect on value-added productivity
continues to increase over time as more and more products get developed as open-
source projects, and with the acceleration in project development. To re-iterate, the open-
source engagement variable used for this analysis is created by looking at a firm’s social
coding platform involvement, 10-K report observations about open-source innovation,
and participation in open-source innovation contests.
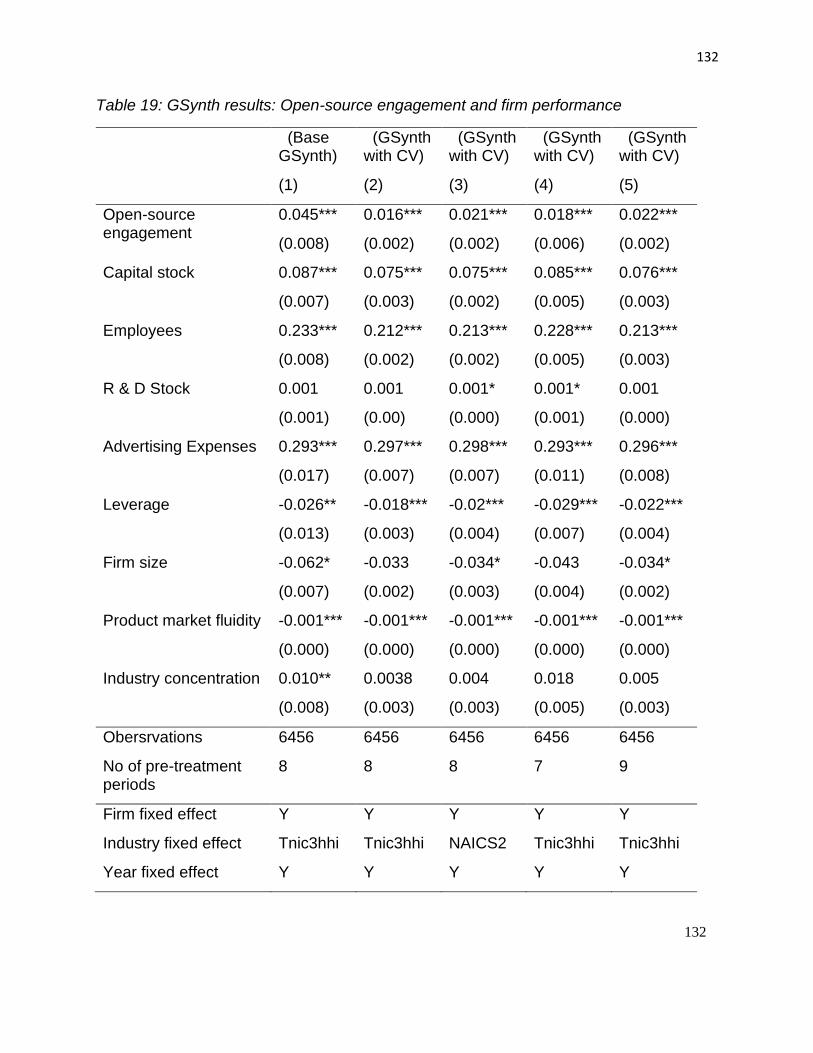
132
132
Table 19: GSynth results: Open-source engagement and firm performance
(Base GSynth)
(GSynth with CV)
(GSynth with CV)
(GSynth with CV)
(GSynth with CV)
(1) (2) (3) (4) (5)
Open-source engagement
0.045***
(0.008)
0.016***
(0.002)
0.021***
(0.002)
0.018***
(0.006)
0.022***
(0.002)
Capital stock 0.087***
(0.007)
0.075***
(0.003)
0.075***
(0.002)
0.085***
(0.005)
0.076***
(0.003)
Employees 0.233***
(0.008)
0.212***
(0.002)
0.213***
(0.002)
0.228***
(0.005)
0.213***
(0.003)
R & D Stock 0.001
(0.001)
0.001
(0.00)
0.001*
(0.000)
0.001*
(0.001)
0.001
(0.000)
Advertising Expenses 0.293***
(0.017)
0.297***
(0.007)
0.298***
(0.007)
0.293***
(0.011)
0.296***
(0.008)
Leverage -0.026**
(0.013)
-0.018***
(0.003)
-0.02***
(0.004)
-0.029***
(0.007)
-0.022***
(0.004)
Firm size -0.062*
(0.007)
-0.033
(0.002)
-0.034*
(0.003)
-0.043
(0.004)
-0.034*
(0.002)
Product market fluidity -0.001***
(0.000)
-0.001***
(0.000)
-0.001***
(0.000)
-0.001***
(0.000)
-0.001***
(0.000)
Industry concentration 0.010**
(0.008)
0.0038
(0.003)
0.004
(0.003)
0.018
(0.005)
0.005
(0.003)
Obersrvations 6456 6456 6456 6456 6456
No of pre-treatment periods
8 8 8 7 9
Firm fixed effect Y Y Y Y Y
Industry fixed effect Tnic3hhi Tnic3hhi NAICS2 Tnic3hhi Tnic3hhi
Year fixed effect Y Y Y Y Y
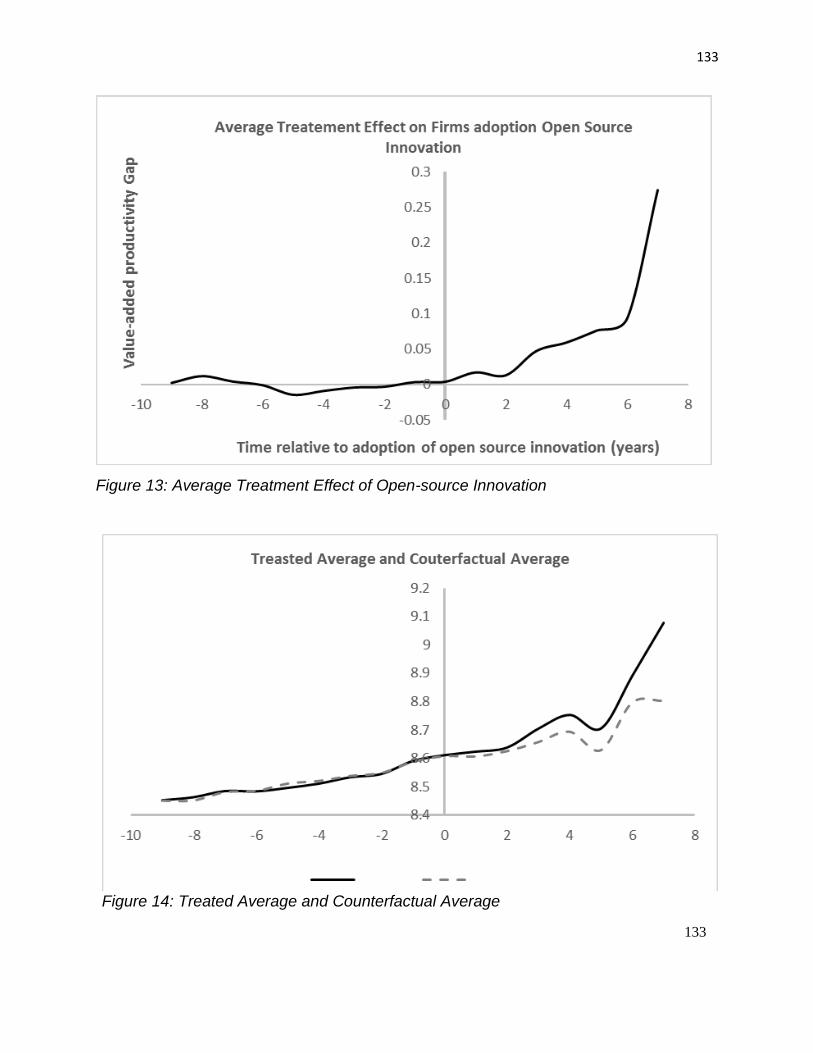
133
133
Figure 13: Average Treatment Effect of Open-source Innovation
Figure 14: Treated Average and Counterfactual Average

134
134
4.4.3 Open-source engagement intensity and firm performance
In the previous section, I established the effect of open-source engagement on firm
performance. In this section, I report results about a specific type of open-source
innovation: broadcasting and developing open-source projects on the social coding
platform. As discussed earlier, most firms engaged in open-source innovation have a
presence on the GitHub social coding platform. Firms post software projects and
program code on these platforms under their homepage. They also actively develop
these projects on GitHub. To analyze the importance of such initiatives on firm
performance, I measure open-source engagement intensity as the log of the number of
actively posted or developed projects by a firm per year on GitHub and regressed it
against firm performance.
Table 20 shows the result of the panel data analysis. Model 1 is the basic
productivity model without open-source engagement intensity. Model 2 is the fixed effect
regression model with open-source engagement as an explanatory variable. Model 3 is
the ABOND model with industry effect measured by network-based industry
concentration measure (Hoberg et al. 2014). In Model 4, industry concentration is
measured by the two-digit NAICS classification. Finally, I present the BBOND model for
robustness checks. I will interpret Model 3 for this analysis. My estimates for all control
measures are qualitatively consistent with existing literature and the ones reported in
Table 19 above. The effect of open-source engagement intensity is positive and highly
significant. The elasticity of open-source intensity is 0.4 %. To interpret the coefficient of
open-source engagement intensity, I convert the estimate back to the actual numbers.
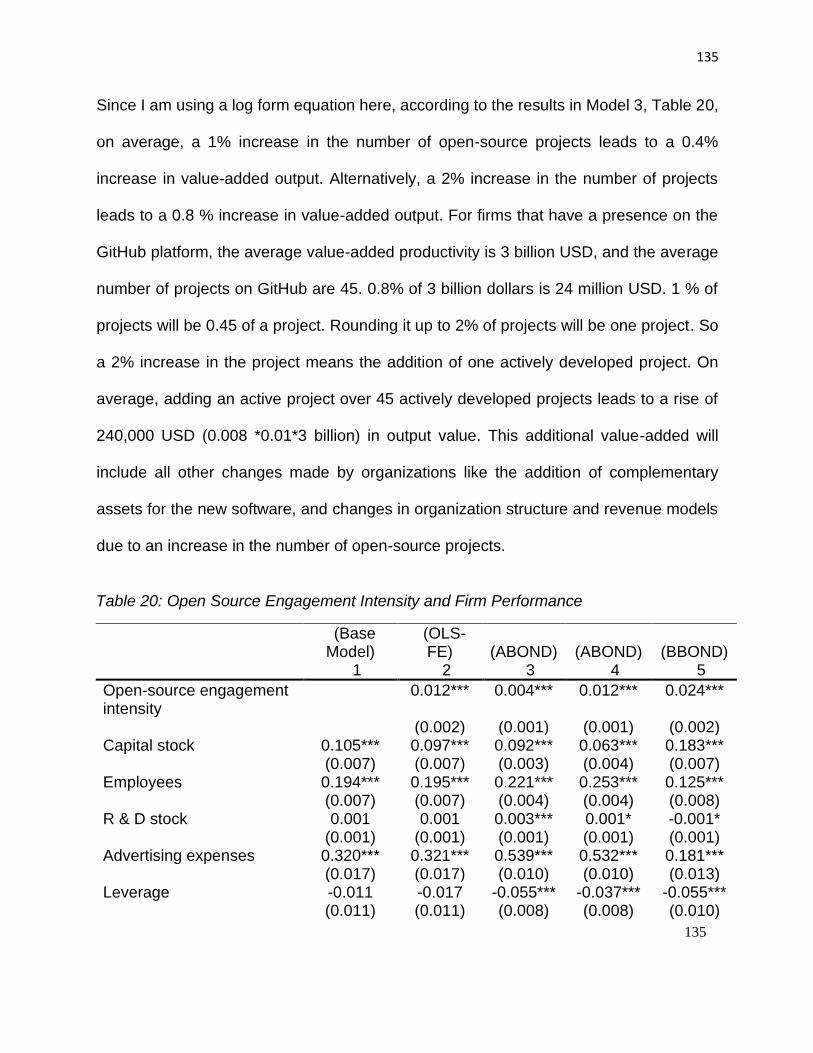
135
135
Since I am using a log form equation here, according to the results in Model 3, Table 20,
on average, a 1% increase in the number of open-source projects leads to a 0.4%
increase in value-added output. Alternatively, a 2% increase in the number of projects
leads to a 0.8 % increase in value-added output. For firms that have a presence on the
GitHub platform, the average value-added productivity is 3 billion USD, and the average
number of projects on GitHub are 45. 0.8% of 3 billion dollars is 24 million USD. 1 % of
projects will be 0.45 of a project. Rounding it up to 2% of projects will be one project. So
a 2% increase in the project means the addition of one actively developed project. On
average, adding an active project over 45 actively developed projects leads to a rise of
240,000 USD (0.008 *0.01*3 billion) in output value. This additional value-added will
include all other changes made by organizations like the addition of complementary
assets for the new software, and changes in organization structure and revenue models
due to an increase in the number of open-source projects.
Table 20: Open Source Engagement Intensity and Firm Performance
(Base Model)
(OLS-FE)
(ABOND)
(ABOND)
(BBOND)
1 2 3 4 5
Open-source engagement intensity
0.012*** 0.004*** 0.012*** 0.024***
(0.002) (0.001) (0.001) (0.002) Capital stock 0.105*** 0.097*** 0.092*** 0.063*** 0.183*** (0.007) (0.007) (0.003) (0.004) (0.007) Employees 0.194*** 0.195*** 0.221*** 0.253*** 0.125*** (0.007) (0.007) (0.004) (0.004) (0.008) R & D stock 0.001 0.001 0.003*** 0.001* -0.001* (0.001) (0.001) (0.001) (0.001) (0.001) Advertising expenses 0.320*** 0.321*** 0.539*** 0.532*** 0.181*** (0.017) (0.017) (0.010) (0.010) (0.013) Leverage -0.011 -0.017 -0.055*** -0.037*** -0.055*** (0.011) (0.011) (0.008) (0.008) (0.010)
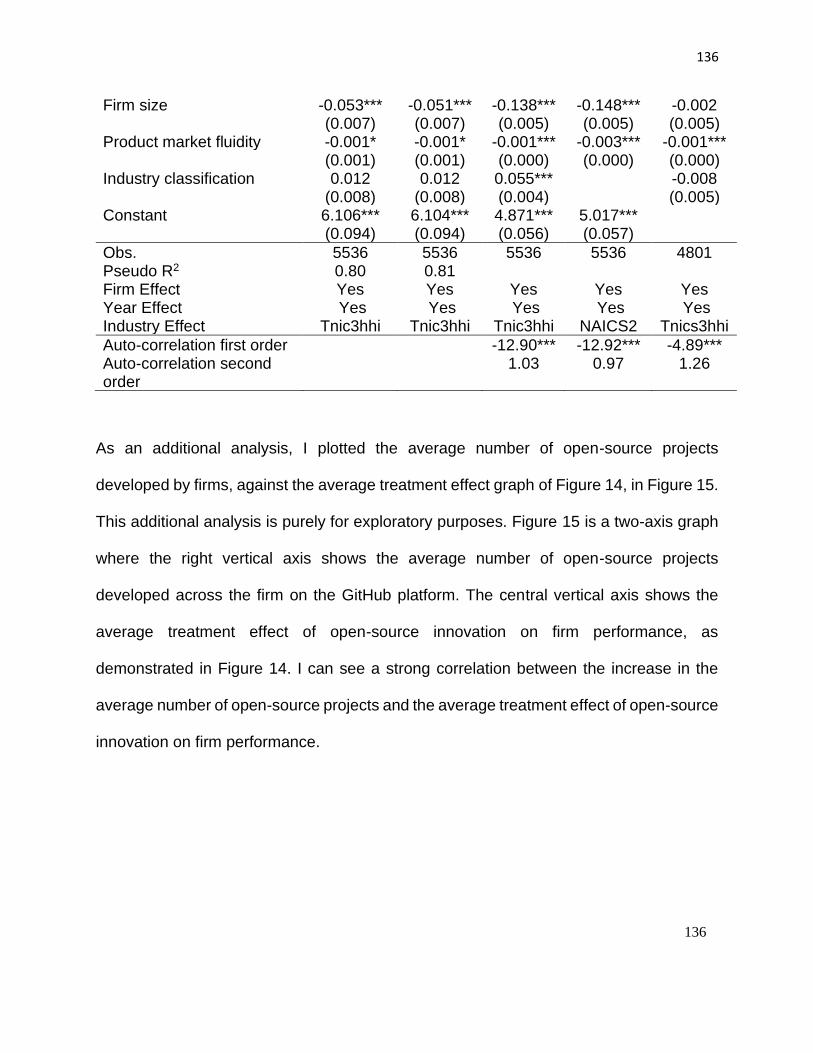
136
136
Firm size -0.053*** -0.051*** -0.138*** -0.148*** -0.002 (0.007) (0.007) (0.005) (0.005) (0.005) Product market fluidity -0.001* -0.001* -0.001*** -0.003*** -0.001*** (0.001) (0.001) (0.000) (0.000) (0.000) Industry classification 0.012 0.012 0.055*** -0.008 (0.008) (0.008) (0.004) (0.005) Constant 6.106*** 6.104*** 4.871*** 5.017*** (0.094) (0.094) (0.056) (0.057)
Obs. 5536 5536 5536 5536 4801 Pseudo R2 0.80 0.81 Firm Effect Yes Yes Yes Yes Yes Year Effect Yes Yes Yes Yes Yes Industry Effect Tnic3hhi Tnic3hhi Tnic3hhi NAICS2 Tnics3hhi
Auto-correlation first order -12.90*** -12.92*** -4.89*** Auto-correlation second order
1.03 0.97 1.26
As an additional analysis, I plotted the average number of open-source projects
developed by firms, against the average treatment effect graph of Figure 14, in Figure 15.
This additional analysis is purely for exploratory purposes. Figure 15 is a two-axis graph
where the right vertical axis shows the average number of open-source projects
developed across the firm on the GitHub platform. The central vertical axis shows the
average treatment effect of open-source innovation on firm performance, as
demonstrated in Figure 14. I can see a strong correlation between the increase in the
average number of open-source projects and the average treatment effect of open-source
innovation on firm performance.
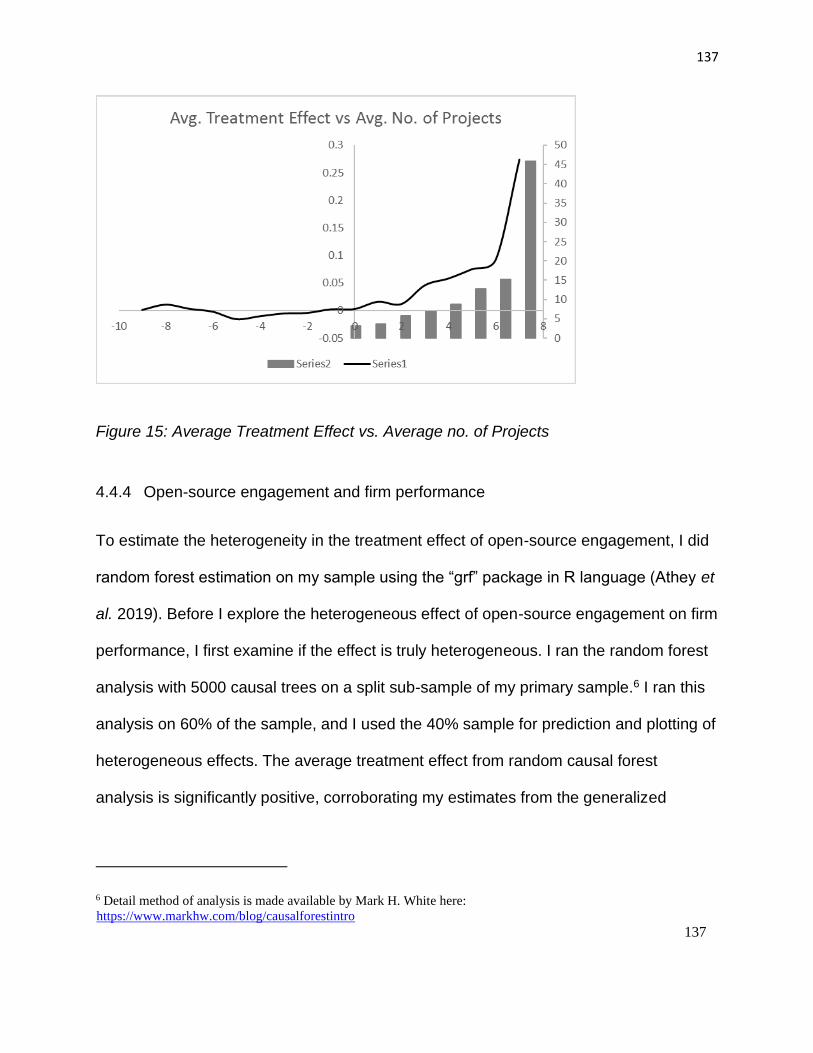
137
137
Figure 15: Average Treatment Effect vs. Average no. of Projects
4.4.4 Open-source engagement and firm performance
To estimate the heterogeneity in the treatment effect of open-source engagement, I did
random forest estimation on my sample using the “grf” package in R language (Athey et
al. 2019). Before I explore the heterogeneous effect of open-source engagement on firm
performance, I first examine if the effect is truly heterogeneous. I ran the random forest
analysis with 5000 causal trees on a split sub-sample of my primary sample.6 I ran this
analysis on 60% of the sample, and I used the 40% sample for prediction and plotting of
heterogeneous effects. The average treatment effect from random causal forest
analysis is significantly positive, corroborating my estimates from the generalized
6 Detail method of analysis is made available by Mark H. White here:
https://www.markhw.com/blog/causalforestintro
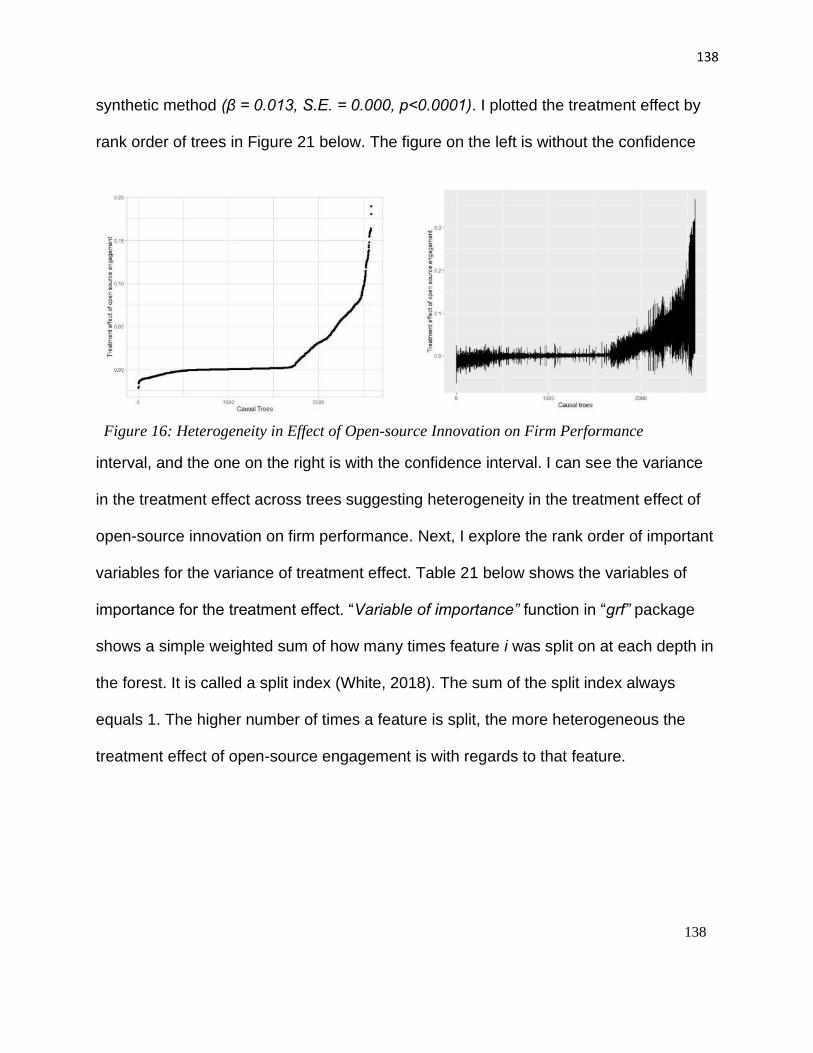
138
138
synthetic method (β = 0.013, S.E. = 0.000, p<0.0001). I plotted the treatment effect by
rank order of trees in Figure 21 below. The figure on the left is without the confidence
interval, and the one on the right is with the confidence interval. I can see the variance
in the treatment effect across trees suggesting heterogeneity in the treatment effect of
open-source innovation on firm performance. Next, I explore the rank order of important
variables for the variance of treatment effect. Table 21 below shows the variables of
importance for the treatment effect. “Variable of importance” function in “grf” package
shows a simple weighted sum of how many times feature i was split on at each depth in
the forest. It is called a split index (White, 2018). The sum of the split index always
equals 1. The higher number of times a feature is split, the more heterogeneous the
treatment effect of open-source engagement is with regards to that feature.
Figure 16: Heterogeneity in Effect of Open-source Innovation on Firm Performance
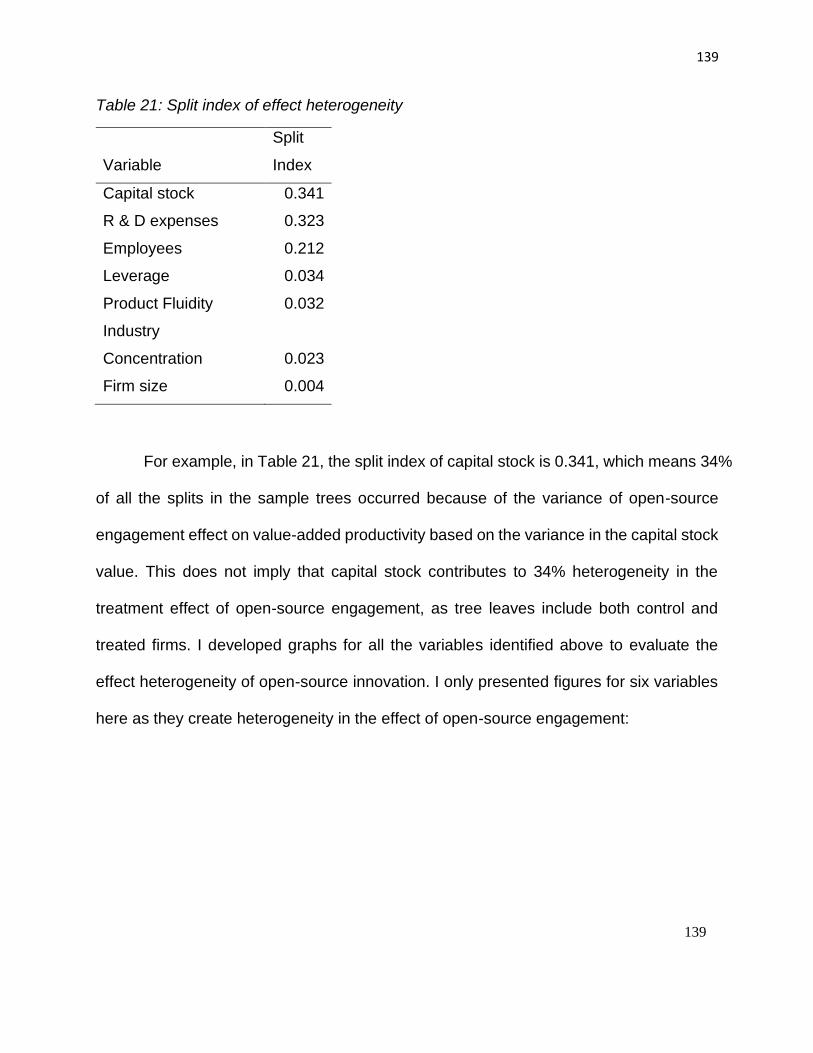
139
139
Table 21: Split index of effect heterogeneity
Variable
Split
Index
Capital stock 0.341
R & D expenses 0.323
Employees 0.212
Leverage 0.034
Product Fluidity 0.032
Industry
Concentration 0.023
Firm size 0.004
For example, in Table 21, the split index of capital stock is 0.341, which means 34%
of all the splits in the sample trees occurred because of the variance of open-source
engagement effect on value-added productivity based on the variance in the capital stock
value. This does not imply that capital stock contributes to 34% heterogeneity in the
treatment effect of open-source engagement, as tree leaves include both control and
treated firms. I developed graphs for all the variables identified above to evaluate the
effect heterogeneity of open-source innovation. I only presented figures for six variables
here as they create heterogeneity in the effect of open-source engagement:
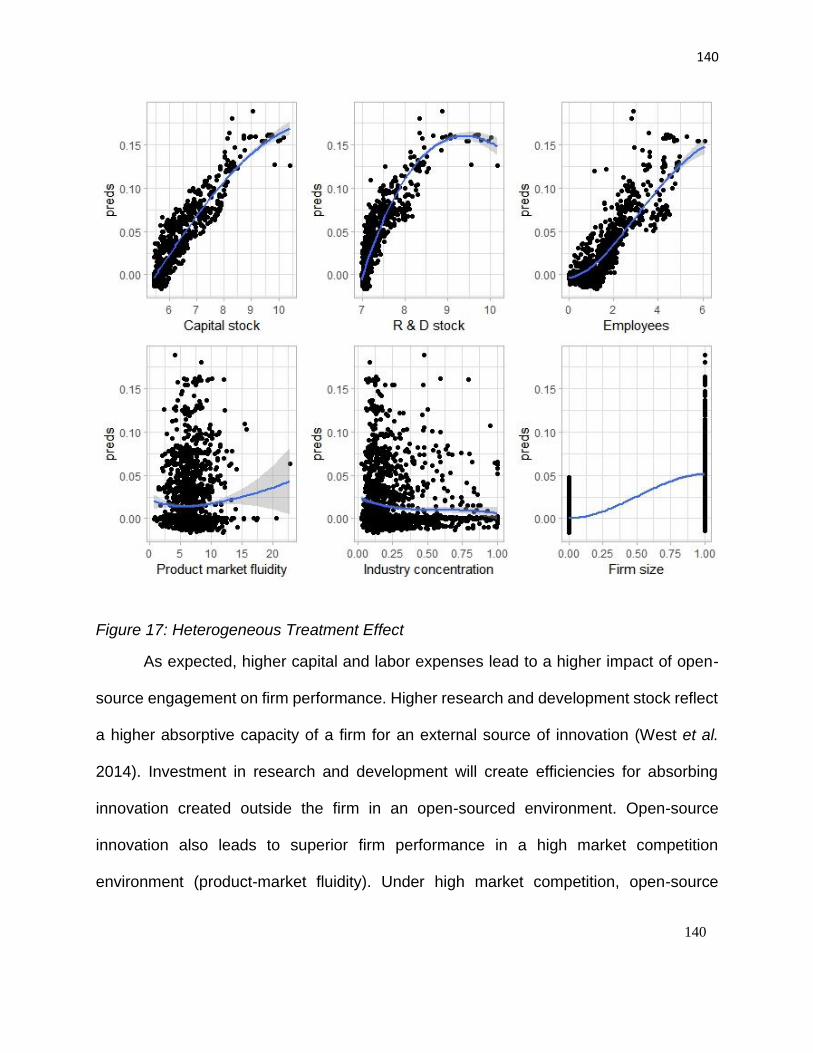
140
140
Figure 17: Heterogeneous Treatment Effect
As expected, higher capital and labor expenses lead to a higher impact of open-
source engagement on firm performance. Higher research and development stock reflect
a higher absorptive capacity of a firm for an external source of innovation (West et al.
2014). Investment in research and development will create efficiencies for absorbing
innovation created outside the firm in an open-sourced environment. Open-source
innovation also leads to superior firm performance in a high market competition
environment (product-market fluidity). Under high market competition, open-source
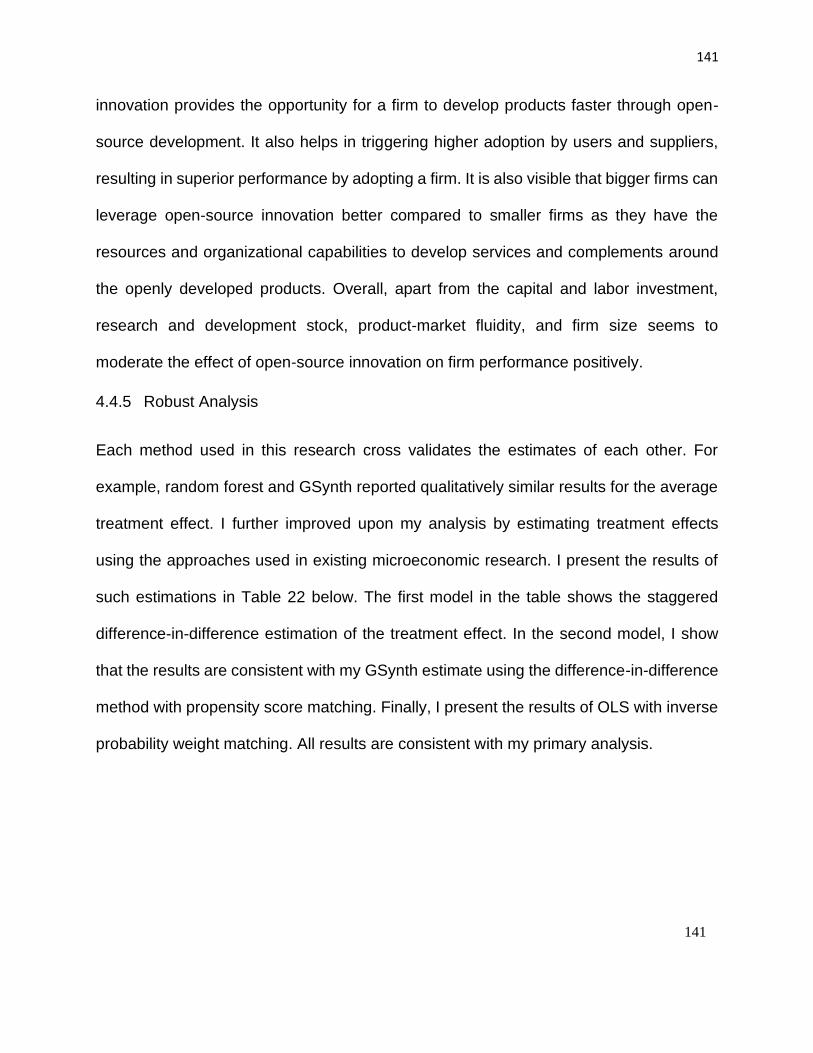
141
141
innovation provides the opportunity for a firm to develop products faster through open-
source development. It also helps in triggering higher adoption by users and suppliers,
resulting in superior performance by adopting a firm. It is also visible that bigger firms can
leverage open-source innovation better compared to smaller firms as they have the
resources and organizational capabilities to develop services and complements around
the openly developed products. Overall, apart from the capital and labor investment,
research and development stock, product-market fluidity, and firm size seems to
moderate the effect of open-source innovation on firm performance positively.
4.4.5 Robust Analysis
Each method used in this research cross validates the estimates of each other. For
example, random forest and GSynth reported qualitatively similar results for the average
treatment effect. I further improved upon my analysis by estimating treatment effects
using the approaches used in existing microeconomic research. I present the results of
such estimations in Table 22 below. The first model in the table shows the staggered
difference-in-difference estimation of the treatment effect. In the second model, I show
that the results are consistent with my GSynth estimate using the difference-in-difference
method with propensity score matching. Finally, I present the results of OLS with inverse
probability weight matching. All results are consistent with my primary analysis.
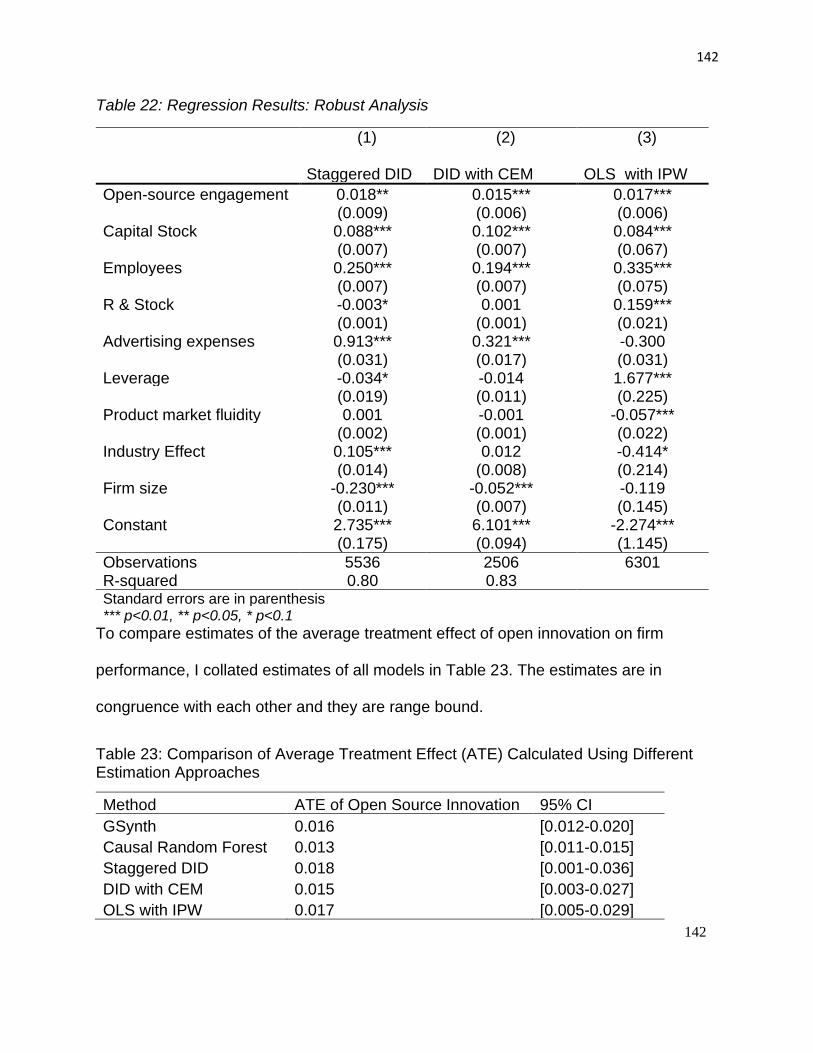
142
142
Table 22: Regression Results: Robust Analysis
(1) (2) (3)
Staggered DID DID with CEM OLS with IPW
Open-source engagement 0.018** 0.015*** 0.017*** (0.009) (0.006) (0.006) Capital Stock 0.088*** 0.102*** 0.084*** (0.007) (0.007) (0.067) Employees 0.250*** 0.194*** 0.335*** (0.007) (0.007) (0.075) R & Stock -0.003* 0.001 0.159*** (0.001) (0.001) (0.021) Advertising expenses 0.913*** 0.321*** -0.300 (0.031) (0.017) (0.031) Leverage -0.034* -0.014 1.677*** (0.019) (0.011) (0.225) Product market fluidity 0.001 -0.001 -0.057*** (0.002) (0.001) (0.022) Industry Effect 0.105*** 0.012 -0.414* (0.014) (0.008) (0.214) Firm size -0.230*** -0.052*** -0.119 (0.011) (0.007) (0.145) Constant 2.735*** 6.101*** -2.274*** (0.175) (0.094) (1.145)
Observations 5536 2506 6301 R-squared 0.80 0.83 Standard errors are in parenthesis *** p<0.01, ** p<0.05, * p<0.1
To compare estimates of the average treatment effect of open innovation on firm
performance, I collated estimates of all models in Table 23. The estimates are in
congruence with each other and they are range bound.
Table 23: Comparison of Average Treatment Effect (ATE) Calculated Using Different Estimation Approaches
Method ATE of Open Source Innovation 95% CI
GSynth 0.016 [0.012-0.020]
Causal Random Forest 0.013 [0.011-0.015]
Staggered DID 0.018 [0.001-0.036]
DID with CEM 0.015 [0.003-0.027]
OLS with IPW 0.017 [0.005-0.029]

143
143
To further test the robustness of my results, I ran the main analysis with Tobin’s q
as the dependent financial performance measure. Apart from economic productivity
improvements gained by a firm by utilizing a social coding community, I argued in the
conceptual development section that the open-source innovation also helps a firm to gain
larger market share through faster propagation of products and services, which is
essential for the market success of a firm in the long run. Tobin’s q is the measure of
market performance of a firm, and it is defined as the ratio of the market value of a firm
to the replacement cost of its asset (Chung and Pruitt 1984). Consistent with the literature
(Bhardwaj et al. 1999), I calculated Tobin’q as
Tobin’s Q = ((Common shares outstanding * Price of a share ) + Liquidating value of
firm’s preferred stocks + Debt )/ Total assets (6)
For this analysis, I estimated market value function with Tobin’s Q as the dependent
variable (Hall et al. 2005) :
Log(Tobin’s Q) = β0 + β1ln(open_engagement)it + β2ln(capital intensity)it + β3ln(emp)it +
β4ln(r&d intensity) + β5ln(advertising intensity) + β6ln(Leverage) + β7(firm_size) +
β8(product-market fluidity) + (industry fixed effect) + (firm fixed effect)i + (year fixed
effect)t + εit
Here capital intensity, R & D intensity, and advertising intensity are capital stock,
R&D stock, and advertising expenses scaled by sales of a firm. I extracted all the
variables for Tobin's Q from COMPUSTAT. To test the effect of open-source
engagement (intensity) or a firm’s financial performance, I ran four models. The results
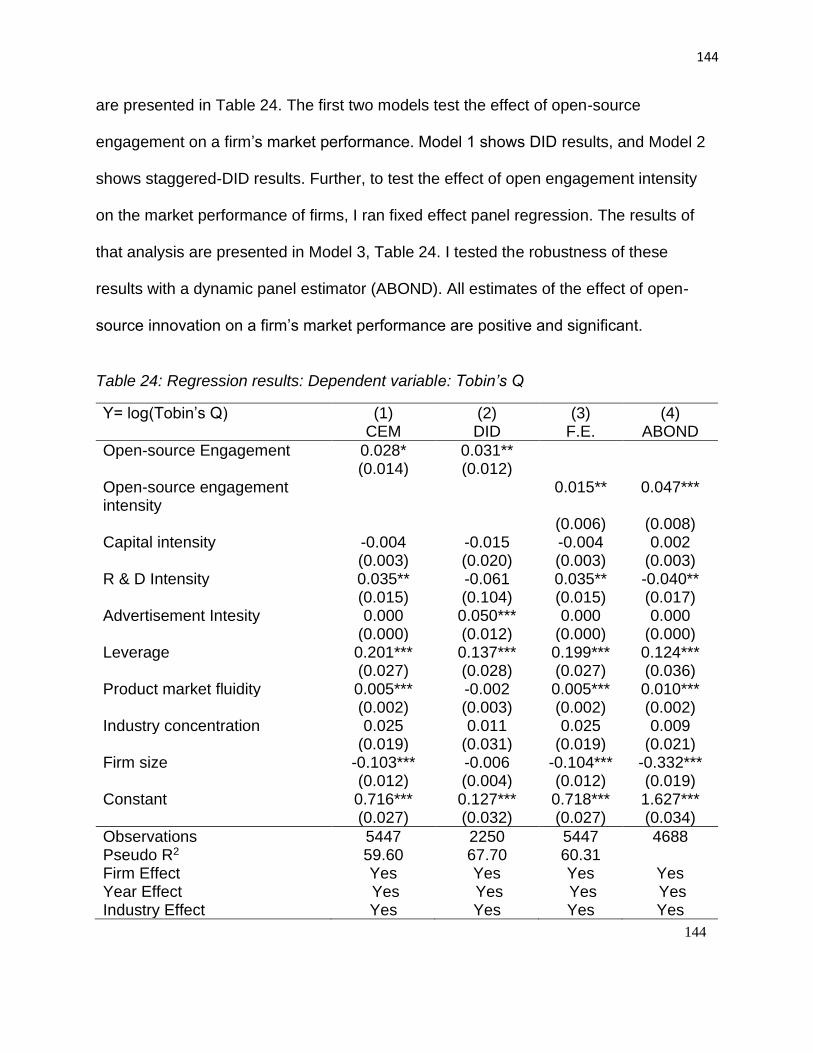
144
144
are presented in Table 24. The first two models test the effect of open-source
engagement on a firm’s market performance. Model 1 shows DID results, and Model 2
shows staggered-DID results. Further, to test the effect of open engagement intensity
on the market performance of firms, I ran fixed effect panel regression. The results of
that analysis are presented in Model 3, Table 24. I tested the robustness of these
results with a dynamic panel estimator (ABOND). All estimates of the effect of open-
source innovation on a firm’s market performance are positive and significant.
Table 24: Regression results: Dependent variable: Tobin’s Q
Y= log(Tobin’s Q) (1) CEM
(2) DID
(3) F.E.
(4) ABOND
Open-source Engagement 0.028* 0.031** (0.014) (0.012) Open-source engagement intensity
0.015** 0.047***
(0.006) (0.008) Capital intensity -0.004 -0.015 -0.004 0.002 (0.003) (0.020) (0.003) (0.003) R & D Intensity 0.035** -0.061 0.035** -0.040** (0.015) (0.104) (0.015) (0.017) Advertisement Intesity 0.000 0.050*** 0.000 0.000 (0.000) (0.012) (0.000) (0.000) Leverage 0.201*** 0.137*** 0.199*** 0.124*** (0.027) (0.028) (0.027) (0.036) Product market fluidity 0.005*** -0.002 0.005*** 0.010*** (0.002) (0.003) (0.002) (0.002) Industry concentration 0.025 0.011 0.025 0.009 (0.019) (0.031) (0.019) (0.021) Firm size -0.103*** -0.006 -0.104*** -0.332*** (0.012) (0.004) (0.012) (0.019) Constant 0.716*** 0.127*** 0.718*** 1.627*** (0.027) (0.032) (0.027) (0.034)
Observations 5447 2250 5447 4688 Pseudo R2 59.60 67.70 60.31 Firm Effect Yes Yes Yes Yes Year Effect Yes Yes Yes Yes Industry Effect Yes Yes Yes Yes

145
145
Alternative measures of open source engagement and removing high leverage subjects
To further assess the robustness of the results, I explored alternative measures of open
source engagement and normalized them by firm size. I identified three additional
measures as an alternative to open engagement and normalized them by the number of
employees of a firm. These three measures are the total number of projects, the total
number of commits across all projects developed by a firm, and the total number of events
across all projects developed by a firm. The unnormalized value of the first measure is
used in the main analysis. Furthermore, we removed Alphabet Inc. and Microsoft Inc.
from our sample, as the combined total number of projects developed by these two firms
on the GitHub platform is more than the remaining 18 firms in the top 20 most engaged
firms. Table 25 shows the system GMM estimation of this analysis. The first model
includes the total number of projects developed on the GitHub platform, the second model
includes the number of commits, and the third model includes the number of events. All
three measures are normalized by the number of employees (a measure of firm size).
The results are statistically significant and in line with the main analysis. Finally, we looked
at the effect of open source engagement on firm performance without Microsoft and
Alphabet Inc. Here we are using the binary open source engagement variable. I estimated
both generalized synthetic control model and staggered-DID model. Both the results still
show a significant effect of open source engagement on firm performance. The results
are qualitatively similar to the one Table 20. The results are described in Appendix C.
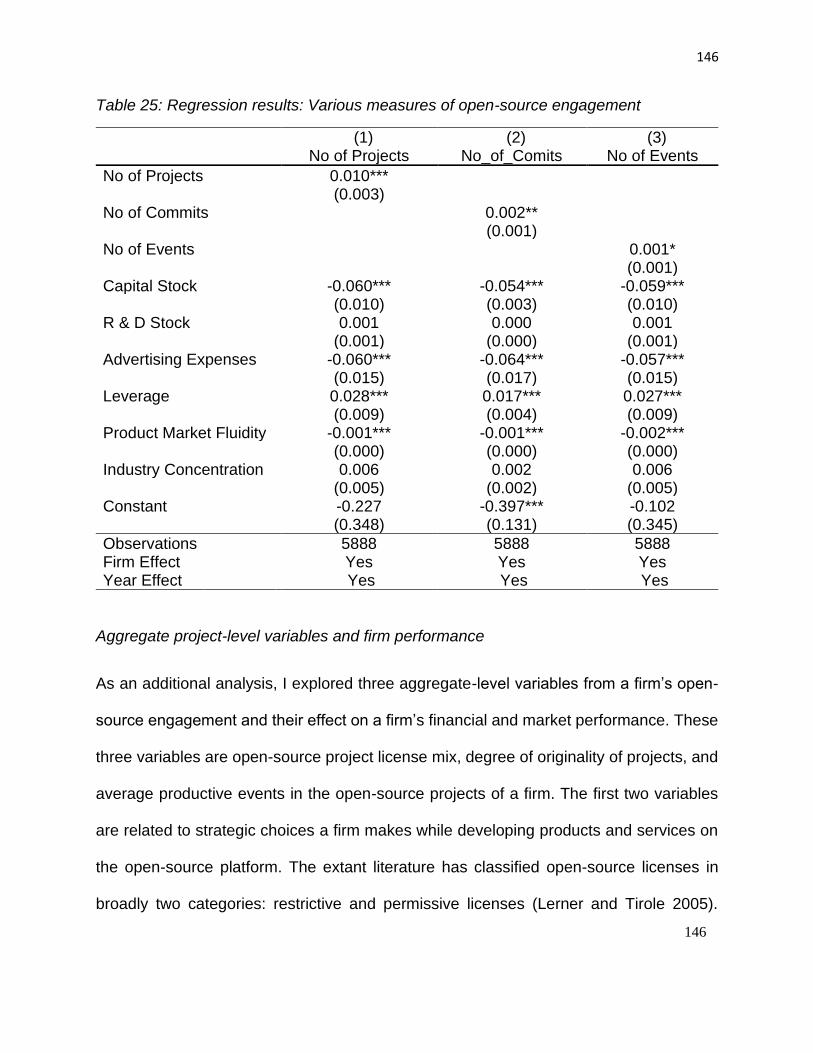
146
146
Table 25: Regression results: Various measures of open-source engagement
(1) (2) (3) No of Projects No_of_Comits No of Events
No of Projects 0.010*** (0.003) No of Commits 0.002** (0.001) No of Events 0.001* (0.001) Capital Stock -0.060*** -0.054*** -0.059*** (0.010) (0.003) (0.010) R & D Stock 0.001 0.000 0.001 (0.001) (0.000) (0.001) Advertising Expenses -0.060*** -0.064*** -0.057*** (0.015) (0.017) (0.015) Leverage 0.028*** 0.017*** 0.027*** (0.009) (0.004) (0.009) Product Market Fluidity -0.001*** -0.001*** -0.002*** (0.000) (0.000) (0.000) Industry Concentration 0.006 0.002 0.006 (0.005) (0.002) (0.005) Constant -0.227 -0.397*** -0.102 (0.348) (0.131) (0.345)
Observations 5888 5888 5888 Firm Effect Yes Yes Yes Year Effect Yes Yes Yes
Aggregate project-level variables and firm performance
As an additional analysis, I explored three aggregate-level variables from a firm’s open-
source engagement and their effect on a firm’s financial and market performance. These
three variables are open-source project license mix, degree of originality of projects, and
average productive events in the open-source projects of a firm. The first two variables
are related to strategic choices a firm makes while developing products and services on
the open-source platform. The extant literature has classified open-source licenses in
broadly two categories: restrictive and permissive licenses (Lerner and Tirole 2005).

147
147
Restrictive licenses like GPL (GNU Public Licences) are copyleft licenses that restrict the
license choice of any derivative work from the open-source project to be licensed under
the same open-source license. Permissive licenses like MIT open licenses permit the
flexibility of license choices for derivative and original work. Licensing an open-source
project is a strategic choice for a firm. A firm has the option of using restrictive licenses
for all their projects, permissive licenses for all their projects or a mix of two. A non-
restrictive or permissive license for a project makes it more attractive for users and
developers alike as they perceive the higher utility of the project (Stewart et al. 2006). It
has been observed that a restrictive licensing strategy is better for generating value when
a firm is better at leveraging investments and service costs are high. A permissive
licensing choice for a project is better when competing contributors are good at reaping
benefits from the development efforts of a firm as it allows for broader market consensus
(August et al. 2018). I extend the open-source licensing literature by studying the effect
of license mix choice at the aggregate portfolio level of a firm on its performance. I coded
the open-source project license mix for a firm as the percentage of projects deployed by
a firm with restrictive licenses on the GitHub platform. A value of 0 suggests that all the
projects developed by a firm on GitHub use permissive licenses like MIT and BSD. A
value of 1 suggests that all the projects deployed by a firm on GitHub use restrictive
licenses like AGPL and GPL. The closer the value is to 1, the more projects with restrictive
licenses is implemented by a firm.
Degree of originality is the percentage of original projects developed by a firm on
a social coding platform like GitHub. A firm has a choice of forking an existing project

148
148
from the social coding platform and developing it further or to start an open-source
project anew with its seed code. Derivative work in this domain is typically referred to as
projects that are “forked” from an existing project. On the negative side, original work
takes longer to develop and lacks quality control in the beginning. However, there is no
restriction of licensing choice and design scope, which can be a constraint if a firm
decides to derive source code from an existing project for further development.
Finally, I examined the average number of productive events happening across
the projects developed by a firm on GitHub. In GitHub, every action in a project is recorded
as an event. There are more than 20 types of events listed on the GitHub platform.
However, only a few of them are productive events, affecting the productivity of a project
directly. For example, creating an issue, sending a pull request and pushing a commit in
project code are all productive events as they contribute to the quality and the feature set
of the project. Examples of non-productive events for a project will be someone
downloading the project, forking the project, watching the project, or recognizing the
project by upvoting it. While these events might have an indirect long-term effect, but
these are not directly visible in the development of a project on the platform. Measuring
the average number of productive events across projects of a firm supplements my
primary measure of open-source engagement intensity (number of projects actively
developed on the GitHub platform). It goes beyond just counting the number of actively
developed projects by taking the average of all the events happening across these
projects.

149
149
We included all these three variables in the production function (Equation 1) and
market value function (Equation 6) to estimate the models. To calculate license, mix and
degree of originality, I filtered those years where a firm is developing 5 or more projects
actively. A lower limit of 5 projects to calculate measures at the aggregate level is well
established in the open-source literature (Daniel et al. 2013). The filter reduced my
sample to 455 firm-years. I ran the panel data regression analysis on this dataset. I listed
the results in Appendix C. The results are not qualitatively different from my main analysis.
In both production and market value functions, open engagement intensity is still
significant. From the project level aggregate variables, only average productive events
are significant and positive in the production function model. As expected, this variable
captures additional productive gains not explained by open engagement intensity. The
remainder of all of the project-level aggregate variables are insignificant in both models.
Having more original projects in the mix may result in production and market gains.
However, the effect is not significant. The effect of licensing mix strategy by a firm on its
performance is also inconclusive. This analysis may be limited by the power of the sample
and requires further investigation in the future.
4.5 DISCUSSION
The existing research has examined open-source innovation through the lens of
community-based development models, and it has largely ignored the mainstreaming of
open-source innovation as a strategic innovation choice. The limited attention it received
from researchers as a business strategy choice came in the form of game-theoretic
models, where multiple aspects of open-source vs. closed source competition were
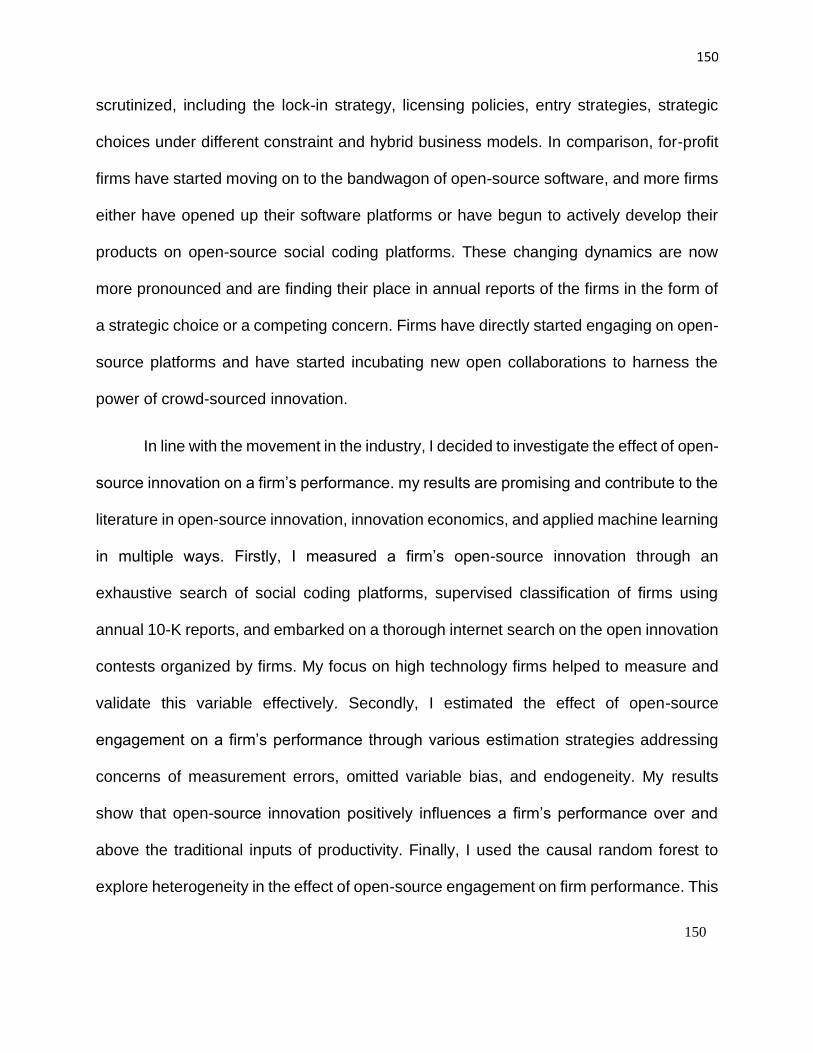
150
150
scrutinized, including the lock-in strategy, licensing policies, entry strategies, strategic
choices under different constraint and hybrid business models. In comparison, for-profit
firms have started moving on to the bandwagon of open-source software, and more firms
either have opened up their software platforms or have begun to actively develop their
products on open-source social coding platforms. These changing dynamics are now
more pronounced and are finding their place in annual reports of the firms in the form of
a strategic choice or a competing concern. Firms have directly started engaging on open-
source platforms and have started incubating new open collaborations to harness the
power of crowd-sourced innovation.
In line with the movement in the industry, I decided to investigate the effect of open-
source innovation on a firm’s performance. my results are promising and contribute to the
literature in open-source innovation, innovation economics, and applied machine learning
in multiple ways. Firstly, I measured a firm’s open-source innovation through an
exhaustive search of social coding platforms, supervised classification of firms using
annual 10-K reports, and embarked on a thorough internet search on the open innovation
contests organized by firms. My focus on high technology firms helped to measure and
validate this variable effectively. Secondly, I estimated the effect of open-source
engagement on a firm’s performance through various estimation strategies addressing
concerns of measurement errors, omitted variable bias, and endogeneity. My results
show that open-source innovation positively influences a firm’s performance over and
above the traditional inputs of productivity. Finally, I used the causal random forest to
explore heterogeneity in the effect of open-source engagement on firm performance. This
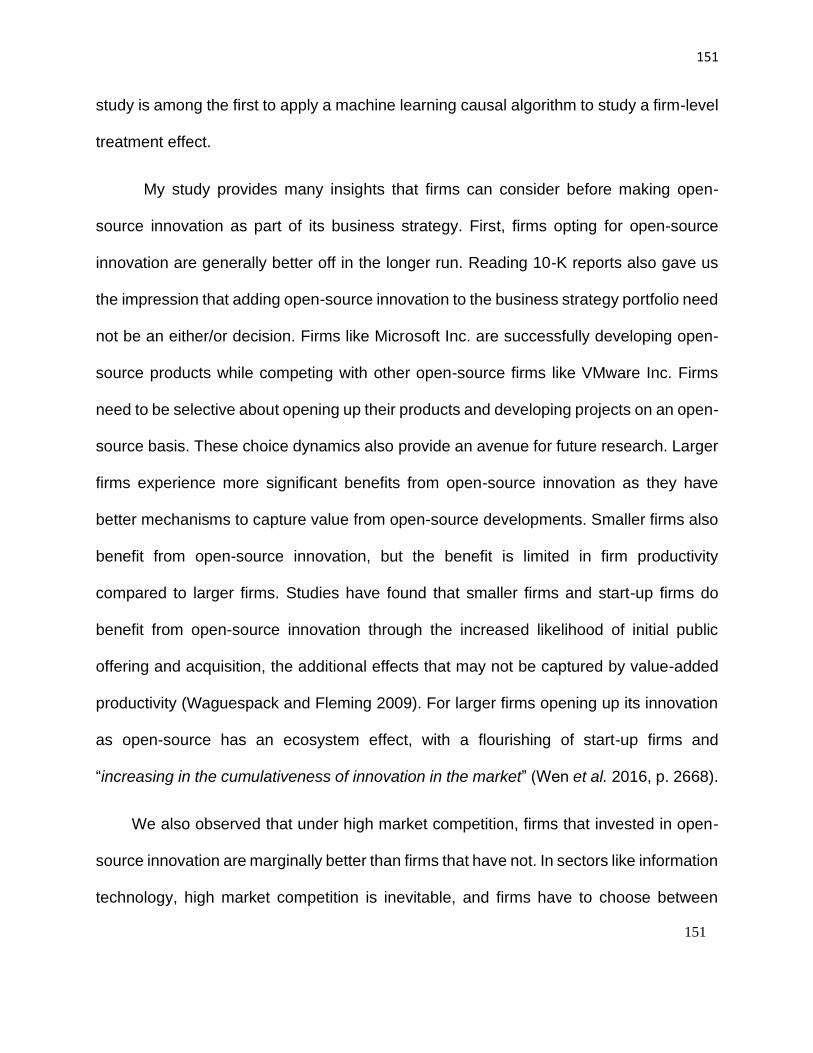
151
151
study is among the first to apply a machine learning causal algorithm to study a firm-level
treatment effect.
My study provides many insights that firms can consider before making open-
source innovation as part of its business strategy. First, firms opting for open-source
innovation are generally better off in the longer run. Reading 10-K reports also gave us
the impression that adding open-source innovation to the business strategy portfolio need
not be an either/or decision. Firms like Microsoft Inc. are successfully developing open-
source products while competing with other open-source firms like VMware Inc. Firms
need to be selective about opening up their products and developing projects on an open-
source basis. These choice dynamics also provide an avenue for future research. Larger
firms experience more significant benefits from open-source innovation as they have
better mechanisms to capture value from open-source developments. Smaller firms also
benefit from open-source innovation, but the benefit is limited in firm productivity
compared to larger firms. Studies have found that smaller firms and start-up firms do
benefit from open-source innovation through the increased likelihood of initial public
offering and acquisition, the additional effects that may not be captured by value-added
productivity (Waguespack and Fleming 2009). For larger firms opening up its innovation
as open-source has an ecosystem effect, with a flourishing of start-up firms and
“increasing in the cumulativeness of innovation in the market” (Wen et al. 2016, p. 2668).
We also observed that under high market competition, firms that invested in open-
source innovation are marginally better than firms that have not. In sectors like information
technology, high market competition is inevitable, and firms have to choose between

152
152
protecting proprietary rights and capturing higher market share. It appears that in highly
competitive markets where firms have to innovate quickly, and competitors also mimic
them quickly, open-source innovation gives a slight edge to firms due to more rapid
development cycles and a higher likelihood of adoption from customers and freeloaders
alike. Again, balancing between open sourcing and proprietary rights seems to be the
magic potion here. Firms also need to expand their research and development investment
if they want to optimize value captured from open-source innovation. The absorptive
capacity of a firm plays an essential role in harnessing innovation from outside, and this
has been impressed upon by extant literature in varied contexts. (West et al. 2014). Finally,
I expect that this study will trigger the use of machine learning-based causal algorithms
in applied social science research settings as they are robust, produce asymptotically
normal outputs and provide the opportunity to explore heterogeneous treatment effects.
4.6 CONCLUSION
Open-source innovation will inevitably be one of the central innovation strategies for most
for-profit firms. In a philosophical sense, open-source innovation is a central tenet to the
globalized economy. In a globalized economy, firms want to buy global, sell global, and
innovate globally. In line with decentralized buying and selling of goods and services,
innovation may help in faster development and adoption of goods and services. It is not
only about information technology firms. Tesla, the highest valued car manufacturer of
North America, has opened all its patents for faster adoption of its technology (Musk 2014).
We as academics cannot fall behind in addressing challenges and opportunities which
come along with open-source innovation.

153
153
As researchers, this will require a shift in our thinking and research. We need to
shift our research focus from user-driven open-source software to firm driven open-source
innovations. This study is a step in that direction. I expect future studies to focus on
strategic choices a firm makes while including open-source innovation as part of its
innovation strategy and how that affects various aspects of its business, including capital
and labor investment. I expect this study to re-invigorate researchers to study economic
issues of open-source innovation and its multi-dimensional effect.

154
154
5 Thesis Conclusion
Firms in high-technology industries are continuously battling the challenges from the
nature of the industry they are in and competitive forces exerted by rival firms within the
industry. Due to a dearth of time and resources, firms tend to mimic the innovation
strategies adopted by rival firms without empirically evaluating the consequences of
adopting the strategy. In this thesis, I looked at three such innovation strategies a firm
might adopt to develop competitive advantage over all rival firms and their effects of a
firm's position in the industry, in terms of dominance and value generation.
According to innovation theory, traditionally firms generated value mainly by
economies of scale and economies of learning. For economies of scale and economies
of learning to deliver sizeable returns, the products need to be adopted by the majority of
the users in the market. The product manufacturing cycle should be repeated multiple
times for higher returns. Hence the learning and scale can only be achieved when a
product developed by a firm is dominant in the market, and it has a long technological
cycle. Both these conditions are difficult to achieve in fast-paced, high technology
industries. The first essay in this thesis address this challenge of dominance and longevity
by looking at the technological factors which influence the dominance of the components
in the configuration of product design. In this essay, I also explored how these
evolutionary factors affect the longevity of these components in the product design.
We found that the evolving number of functionalities supported by a component
(pleiotropy of the component) significantly affects the induction of a component in
dominant design configuration and its stay in the configuration. Similarly, a component

155
155
supported by open standards is more likely to be included in a dominant design
configuration compared to a component supported by closed standards. Specifically,
every additional functionality associated with a component increases its likelihood of
entering the dominant design configuration by approximately three times, and its longevity
by about a year. Similarly, a component supported by an open standard is approximately
four times more likely to be part of the dominant design configuration compared to a
component supported by a closed standard, and it remains in the TV market for
approximately an additional two years.
In the second essay, I looked at novel ways of capturing value through network
effects and economies of scope. Firms continuously try to find ways of increasing the
customer base for their product and services. A large network of consumers of
technology has a multiplicative effect on the overall value generated by the firms active
in the product domain. One of the strategies to achieve network effects is to develop a
multi-sided platform that allows for the exchange of value between multiple stakeholders.
A successful platform business model not only allows for the creation of a large value
network of associated stakeholders, but it also allows for expanding the scope of services
on the platform. This combination of network effects and economies of scope has the
potential to generate higher value for the sponsoring firm and the firms engaged in the
platform ecosystem. My study suggests that firms adopting the platform business model
deliver better value compared to non-platform business. They are also more successful
in delivering value under high market competition compared to non-platform firms.
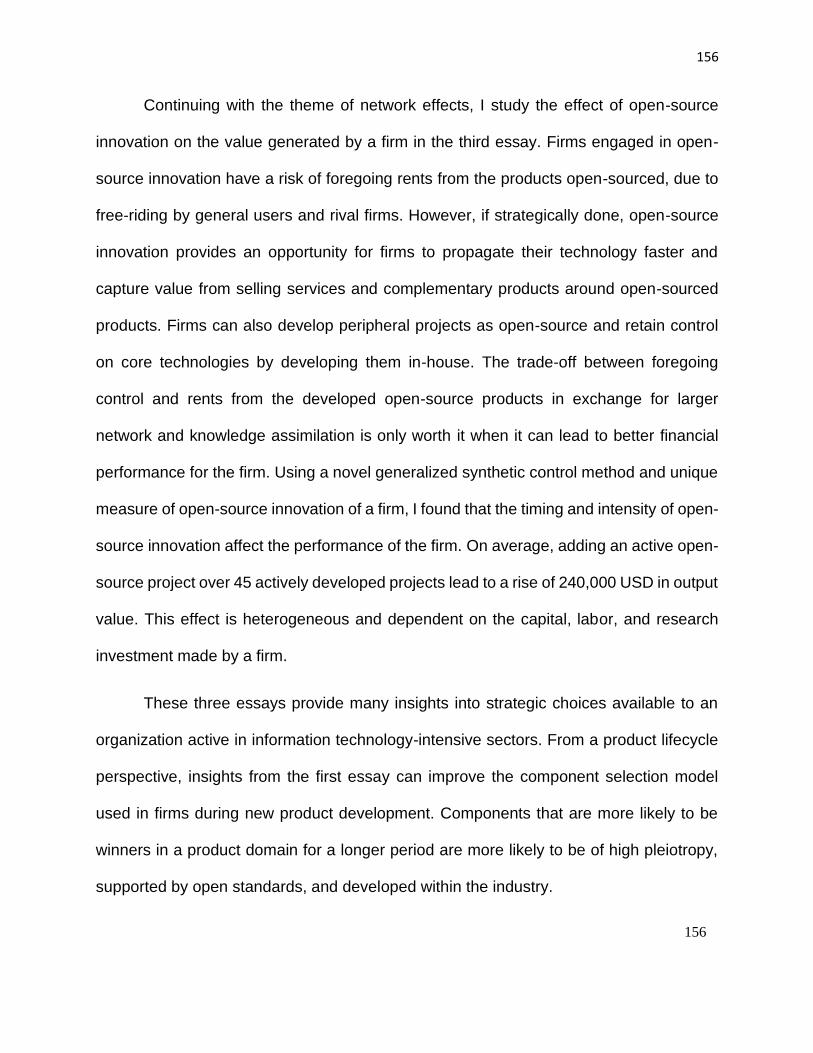
156
156
Continuing with the theme of network effects, I study the effect of open-source
innovation on the value generated by a firm in the third essay. Firms engaged in open-
source innovation have a risk of foregoing rents from the products open-sourced, due to
free-riding by general users and rival firms. However, if strategically done, open-source
innovation provides an opportunity for firms to propagate their technology faster and
capture value from selling services and complementary products around open-sourced
products. Firms can also develop peripheral projects as open-source and retain control
on core technologies by developing them in-house. The trade-off between foregoing
control and rents from the developed open-source products in exchange for larger
network and knowledge assimilation is only worth it when it can lead to better financial
performance for the firm. Using a novel generalized synthetic control method and unique
measure of open-source innovation of a firm, I found that the timing and intensity of open-
source innovation affect the performance of the firm. On average, adding an active open-
source project over 45 actively developed projects lead to a rise of 240,000 USD in output
value. This effect is heterogeneous and dependent on the capital, labor, and research
investment made by a firm.
These three essays provide many insights into strategic choices available to an
organization active in information technology-intensive sectors. From a product lifecycle
perspective, insights from the first essay can improve the component selection model
used in firms during new product development. Components that are more likely to be
winners in a product domain for a longer period are more likely to be of high pleiotropy,
supported by open standards, and developed within the industry.
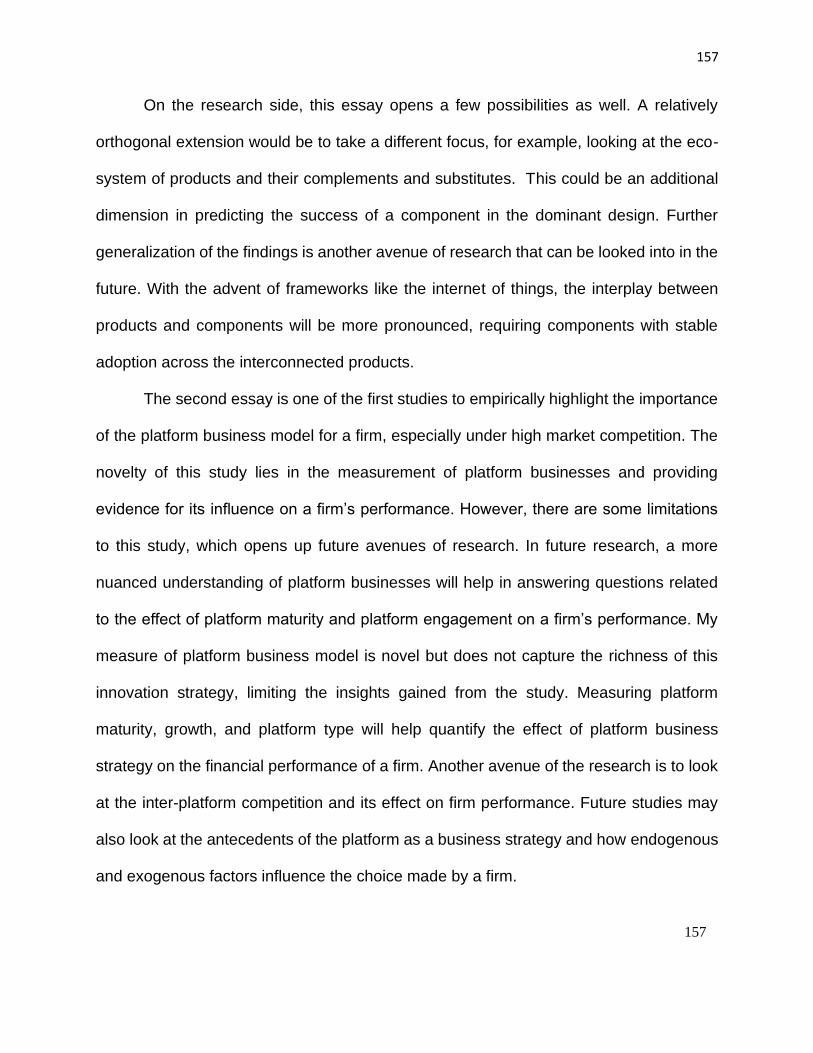
157
157
On the research side, this essay opens a few possibilities as well. A relatively
orthogonal extension would be to take a different focus, for example, looking at the eco-
system of products and their complements and substitutes. This could be an additional
dimension in predicting the success of a component in the dominant design. Further
generalization of the findings is another avenue of research that can be looked into in the
future. With the advent of frameworks like the internet of things, the interplay between
products and components will be more pronounced, requiring components with stable
adoption across the interconnected products.
The second essay is one of the first studies to empirically highlight the importance
of the platform business model for a firm, especially under high market competition. The
novelty of this study lies in the measurement of platform businesses and providing
evidence for its influence on a firm’s performance. However, there are some limitations
to this study, which opens up future avenues of research. In future research, a more
nuanced understanding of platform businesses will help in answering questions related
to the effect of platform maturity and platform engagement on a firm’s performance. My
measure of platform business model is novel but does not capture the richness of this
innovation strategy, limiting the insights gained from the study. Measuring platform
maturity, growth, and platform type will help quantify the effect of platform business
strategy on the financial performance of a firm. Another avenue of the research is to look
at the inter-platform competition and its effect on firm performance. Future studies may
also look at the antecedents of the platform as a business strategy and how endogenous
and exogenous factors influence the choice made by a firm.

158
158
The third and final essay in the thesis expands the discussion on open-source
innovation in the context of for-profit firms. For years, open-source development has
been discussed in the realm of collaborative innovation by open-source communities for
non-profit and personal usage. However, in the last ten years, open-source innovation
has taken center stage as a strategic innovation choice a firm has to capture and deliver
value. Academic research is slowly waking up to the possibilities of looking at open-
source innovation in the context of revenue-generating for-profit firms. I expect that this
study will reinvigorate the research in this area.
Overall, this thesis provides insights for both academic research and practice. Our
approach of identifying and evaluating the strategic choices a firm has to gain a
competitive advantage in information technology-intensive industries is novel. The
analysis for each of the research problems identified in this thesis is carried out with
several robustness checks to test the validity of the results. This thesis has the ambition
to influence future research in areas of innovation, market competition, digital platforms,
and dominant design theory.

159
159
6 References
Abernathy, W. J., & Utterback, J. M. (1978). Patterns of industrial innovation.
Technology Review, 80(7), 40–47.
Abrahamson, E., and Rosenkopf, L., 1993. Institutional and competitive bandwagons: Using mathematical modeling as a tool to explore innovation diffusion. Academy of management review, 18(3), 487-517.
Acs, Z.J., and Audretsch, D.B., 1987. Innovation, market structure, and firm size. The review of Economics and Statistics, 567-574.
Aggarwal, N., Q. Dai, & Walden, E. A. (2012). Are open standards good business?
Electronic Markets, 22(1), 63–68.
Alexy, O., J. West, H. Klapper, & Reitzig, M. (2018). Surrendering control to gain
advantage: Reconciling openness and the resource‐based view of the firm.
Strategic Management Journal, 39(6), 1704-1727.
Almirall, E. and Casadesus-Masanell, R. (2010). Open versus closed innovation: A
model of discovery and divergence. Academy of Management Review, 35(1), 27-
47.
Altenberg, L. (1995). Genome growth and the evolution of the genotype-phenotype
map. Evolution and Biocomputation. Ed. by W. Banzhaf and F. H. Eeckman.
Springer, 205–259.
Andergassen, R., & Nardini, F. (2005). Endogenous innovation waves and economic
growth. Structural Change and Economic Dynamics, 16(4), 522–539.
Anderson, P., & Tushman M. L. (1990). Technological discontinuities and dominant
designs : A cyclical model of technological change. Administrative Science
Quarterly, 35(4), 604–633.
Aral, S., Brynjolfsson, E. and Wu, D.J., 2006, October. Which Came First, IT or Productivity? The Virtuous Cycle of Investment and Use In Enterprise Systems. In ICIS (p. 110).
Aral, S., Brynjolfsson, E. and Van Alstyne, M., 2012. Information, technology, and information worker productivity. Information Systems Research, 23(3-part-2), 849-867.
Arellano, M. and Bond, S., 1991. Some tests of specification for panel data: Monte Carlo evidence and an application to employment equations. The review of economic studies, 58(2), 277-297.
Argote, L., 2012. Organizational learning: Creating, retaining, and transferring knowledge. Springer Science & Business Media
Arora, S. K., Li, Y., Youtie, J., Shapira, P. (2016). Using the wayback machine to mine
websites in the social sciences: A methodological resource. Journal of the
Association for Information Science and Technology, 67(8), 1904–1915.
Athey, S., Tibshirani, J. and Wager, S., 2019. Generalized random forests. The Annals of Statistics, 47(2), 1148-1178.
Asay, M.,2018. Here's Red Hat's open secret on how to make $3B selling free stuff
160
160
Retrieved from https://www.techrepublic.com/article/heres-red-hats-open-secret-on-how-to-make-3b-selling-free-stuff/
Audretsch, D.B., and Feldman, M.P., 1996. R&D spillovers and the geography of innovation and production. The American economic review, 86(3), 630-640.
August, T., Shin, H. and Tunca, T.I., 2013. Licensing and competition for services in open-source software. Information Systems Research, 24(4), 1068-1086.
August, T., Shin, H. and Tunca, T.I., 2018. Generating Value Through Open-source: Software Service Market Regulation and Licensing Policy. Information Systems Research, 29(1), 186-205.
Bakker, S., van Lente, H., & Meeus, M.T. (2012). Dominance in the prototyping phase—
The case of hydrogen passenger cars. Research Policy, 41(5), 871-883.
Balasubramanian, N. and Lee, J., 2008. Firm age and innovation. Industrial and Corporate Change, 17(5), 1019-1047.
Baldwin, C. Y. (2018). The value structure of technologies, part 1: mapping functional
relationships. Harvard Business School Working Paper, Paper no. 19-037.
Baldwin, C. Y., & Clark, K. B. (2000). Design rules Vol.1: The power of modularity. MIT
Press, Cambridge, MA.
Baldwin, C.Y., MacCormack, A., & Rusnak, J. (2014). Hidden structure: using network
methods to map system architecture, Research Policy, 43(8), 1381–1397.
Bapna, R., Barua, A., Mani, D. and Mehra, A., 2010. Research commentary—cooperation, coordination, and governance in multisourcing: an agenda for analytical and empirical research. Information Systems Research, 21(4), 785-795.
Benner, M. J., Tripsas, M. (2012). The infleunce of prior industry affiliation on framing in
nascent industries : The evolution of digital cameras. Strategic Management
Journal, 33(3), 277–302.
Bergek, A., Berggren, C., Magnusson, T., & Hobday M. (2013). Technological
discontinuities and the challenge for incumbent firms: Destruction, disruption or
creative accumulation?, Research Policy, 42(6-7), 1210-1224.
Berlind, D. (2002). Open-source: IBM’s deadly weapon, ZDNet, Retrieved February 5,
2019 (https://www.zdnet.com/article/open-source-ibms-deadly-weapon/).
Bharadwaj, A.S., Bharadwaj, S.G. and Konsynski, B.R., 1999. Information technology effects on firm performance as measured by Tobin's q. Management science, 45(7), 1008-1024.
Blundell, R. and Bond, S., 1998. Initial conditions and moment restrictions in dynamic panel data models. Journal of econometrics, 87(1), 115-143.
Bogers, M., Zobel, A.K., Afuah, A., Almirall, E., Brunswicker, S., Dahlander, L., Frederiksen, L., Gawer, A., Gruber, M., Haefliger, S. and Hagedoorn, J., 2017. The open innovation research landscape: Established perspectives and emerging themes across different levels of analysis. Industry and Innovation, 24(1), 8-40.
Bonaccorsi, A., Giannangeli, S. and Rossi, C., 2006. Entry strategies under competing standards: Hybrid business models in the open-source software industry. Management science, 52(7), 1085-1098.
Boudreau, K. and Lakhani, K., 2009. How to manage outside innovation. MIT Sloan

161
161
management review, 50(4), 69. Bradley, J.R., & H.H. Guerrero. (2008). Product design for life‐cycle mismatch.
Production and Operations Management, 17(5), 497-512.
Brynjolfsson, E. and Hitt, L.M., 2003. Computing productivity: Firm-level evidence. Review of economics and statistics, 85(4), 793-808.
Brynjolfsson, E., & Kemerer, C. (1996). Network externalities in microcomputer
software: An econometric analysis of the spreadsheet market. Management
Science, 42(12), 1627-1647.
Bulan, L.T. and Yan, Z., 2010. Firm maturity and the pecking order theory. Available at SSRN 1760505.
Burrows, T. (2010). 3D TV next big thing in home entertainment. www.mumbrella.com,
Retrieved July 25, 2019 (https://mumbrella.com.au/3d-tv-next-big-thing-in-home-
entertainment-15253).
Carlin, C.S., & Solid, C.A. (2014). An approach to addressing selection bias in survival
analysis. Statistics in medicine, 33(23), 4073-4086.
Casadesus-Masanell, R. and Llanes, G., 2011. Mixed source. Management Science, 57(7), 1212-1230.
Cecere, G., Corrocher, & N. Battaglia, R. D. (2015). Innovation and competition in the
smartphone industry: Is there a dominant design? Telecommunications Policy,
39(3–4), 162–175.
Chao, R.O. and Kavadias, S., 2008. A theoretical framework for managing the new product development portfolio: When and how to use strategic buckets. Management Science, 54(5),907-921.
Chattopadhyay, P., Glick, W.H. and Huber, G.P., 2001. Organizational actions in response to threats and opportunities. Academy of Management Journal, 44(5), 937-955.
Chevalier‐Roignant, B., Flath, C. M., & Trigeorgis L. (2019). Disruptive innovation,
market entry and production flexibility in heterogeneous oligopoly. Production and
Operations Management, Forthcoming.
Christensen, C. M. (1992a). Exploring the limits of the technology s-curve. part I:
Component technologies. Production and Operations Management, 1(4), 334–357.
Christensen, C.M., (1992b). Exploring the limits of the technology S‐curve. Part II:
Architectural technologies. Production and Operations Management, 1(4), 358-366.
Chung, K.H. and Pruitt, S.W., 1994. A simple approximation of Tobin's q. Financial management, 70-74.
Clark, K. B. (1985). The interaction of design hierarchies and market concepts in
technological evolution. Research Policy, 14(5), 235–251.
Cooper, R. B., & Zmud R. W. (1990). Information technology implementation research:
A technological diffusion approach. Management Science. 36(2), 123–139.
Curtsinger, J. W. (2001). Senescence: Genetic theories. International encyclopedia of
the social & behavioral sciences. Ed. By N. J. Smelser and P. B. Baltes. Elsevier,
11, 13897–13902.
162
162
Cusumano MA 2020. “’Platformizing’ a Bad Business Does Not Make It a Good
Business” Communications of the ACM, (63:1), 23-25.
Cusumano, M., Kahl, S. and Suarez, F.F., 2006. Product, process, and service: a new industry lifecycle model. A research and education initiative at the MIT, Sloan School of Management, Working Paper No, 228.
Cusumano, M.A., Gawer, A. and Yoffie, D.B., 2019. 3.4 Platform versus Non-Platform Company Performance: Some Exploratory Data Analysis, 1995-2015. Software
Business, Platforms, and Ecosystems: Fundamentals of Software Production Research, 171.
Dahlander, L. and Gann, D.M., 2010. How open is innovation?. Research policy, 39(6), 699-709.
Danese, P., & Filippini, R., (2010). Modularity and the impact on new product
development time performance. International Journal of Operations & Production
Management.
Daniel, S., Agarwal, R. and Stewart, K.J., 2013. The effects of diversity in global, distributed collectives: A study of open-source project success. Information Systems Research, 24(2), 312-333.
Daniel, S., Midha, V., Bhattacherhjee, A. , & Singh, S. P. (2018). Sourcing knowledge in
open-source software projects: The impacts of internal and external social capital
on project success—Journal of Strategic Information Systems, 27(3), 237–256.
Daniel, S.L., Maruping, L.M., Cataldo, M. and Herbsleb, J., 2018. The Impact of Ideology Misfit on Open-source Software Communities and Companies. MIS Quarterly, 42(4), 1069-1096.
Datta, D.K., Guthrie, J.P. and Wright, P.M., 2005. Human resource management and labor productivity: does industry matter?. Academy of management Journal, 48(1), 135-145.
Das, B.J., Chappell, W.F. and Shughartii, W.F., 1993. Advertising, competition and market share instability. Applied Economics, 25(11), 1409-1412.
David, P. A., & Greenstein, S. (1990). The economics of compatibility standards: An
introduction to recent research. Economics of Innovation and New Technology,
1(1–2), 3–41.
Denison, C. (2013). Sony’s Banks on NFC and 4K, Teases 4K OLED TV | Digital
Trends, Retrieved January 24, 2019 (https://www.digitaltrends.com/home-
theater/sonys-banks-on-nfc-and-4k-teases-4k-oled-tv/).
Desyllas, P. and Hughes, A., 2010. Do high technology acquirers become more innovative?. Research Policy, 39(8), 1105-1121.
Dosi, G. (1982). Technological paradigms and technological trajectories: A suggested
interpretation of the determinants and directions of technical change. Research
Policy, 11(3), 147–162.
Dowell, G., Swaminathan, A., & Wade, J. (2002). Pretty pictures and ugly scenes:
Political and technological maneuvers in high definition television. The New
Institutionalism in Strategic Management. Ed. By P. Ingram and B.S. Silverman.
Emerald Group Publishing Limited, 19, 97-133.
163
163
Dranove, D., & Gandal, N. (2005).Surviving a standards war: Lessons learned from the
life and death of DIVX. Advances in the Economics of Information Systems. Ed. By
K. Tomak. IGI Global, 1-14.
Dubcovsky, J., & Dvorak, J. (2007). Genome plasticity a key factor in the success of
polyploid wheat under domestication. Science, 316(5833), 1862–1866.
Eaton, B., Elaluf-Calderwood, S., Sorensen, C. and Yoo, Y., 2015. Distributed tuning of boundary resources: the case of Apple's iOS service system. MIS Quarterly: Management Information Systems, 39(1), 217-243.
Economides, N. and Katsamakas, E., 2006. Two-sided competition of proprietary vs. open-source technology platforms and the implications for the software industry. Management Science, 52(7),1057-1071.
Eisenmann, T., Parker, G. and Van Alstyne, M., 2011. Platform envelopment. Strategic Management Journal, 32(12), 1270-1285.
Enkel, E., Gassmann, O. and Chesbrough, H., 2009. Open R&D and open innovation: exploring the phenomenon. R&d Management, 39(4), 311-316.
Eynan, A., & Rosenblatt, M.J. (1997). An analysis of purchasing costs as the number of
products' components is reduced. Production and Operations Management, 6(4),
388-397.
Fichman, R. G., & Kemerer, C. F. (1997). The assimilation of software process
innovations: An organizational learning perspective. Management Science, 43(10),
1345–1363.
Fichman, R. G., & Kemerer, C. F. (1999). The illusory diffusion of innovation: An
examination of assimilation gaps. Information Systems Research, 10(3), 255–275.
Fiegenbaum, A. and Thomas, H., 1995. Strategic groups as reference groups: Theory, modeling and empirical examination of industry and competitive strategy. Strategic Management Journal, 16(6), pp.461-476.
Finely K., 2019. When Open-source Software Comes With a Few Catches. retrieved on August 4, 2019 (https://www.wired.com/story/when-open-source-software-comes-with-catches)
Fisher, M.L., & Ittner, C.D. (1999). The impact of product variety on automobile
assembly operations: Empirical evidence and simulation analysis. Management
Science, 45(6), 771-786.
Fixson, S. (2003). The Multiple Faces of Modularity: A literature analysis of a product
concept for assembled hardware products. Technical Report, (5), 1–87.
Flor, M.L., Cooper, S.Y. and Oltra, M.J., 2018. External knowledge search, absorptive capacity and radical innovation in high-technology firms. European Management Journal. 36(2), 183-194.
Fosfuri, A., Giarratana, M.S. and Luzzi, A., 2008. The penguin has entered the building: The commercialization of open-source software products. Organization science, 19(2), 292-305.
Frenken, K. (2001). Fitness landscapes, heuristics and technological paradigms: A
critique on random search models in evolutionary economics. American Institute of
Physics Proceedings, 573(1), 558–565.

164
164
Frenken, K. (2006). A fitness landscape approach to technological complexity,
modularity, and vertical disintegration. Structural Change and Economic Dynamics,
17(3), 288–305.
Fudenberg, D. and Tirole, J., 1983. Learning-by-doing and market performance. The
Bell Journal of Economics, 522-530.
Fuentelsaz, L., Maicas, J.P. and Polo, Y., 2012. Switching costs, network effects, and
competition in the European mobile telecommunications industry. Information
Systems Research, 23(1), 93-108.
Futia, C.A., 1980. Schumpeterian competition. The Quarterly Journal of Economics, 94(4), pp.675-695.
Gaimon, C. (2008). The management of technology: A production and operations
management perspective. Production and Operations Management, 17(1), 1-11.
Gambardella, A. and Von Hippel, E., 2019. Open Sourcing as a Profit-Maximizing Strategy for Downstream Firms. Strategy Science, 4(1), pp.41-57.
García-Villaverde, P.M., Ruiz-Ortega, M.J. and Canales, J.I., 2013. Entrepreneurial orientation and the threat of imitation: The influence of upstream and downstream capabilities. European Management Journal, 31(3), pp.263-277.
Garud, R., Jain, S., & Kumaraswamy, A.(2002). Institutional entrepreneurship in the
sponsorship of common technological standards: The case of sun microsystems
and JAVA. Academy of Management Journal, 45(1), 196–214.
Gaspar, C. and Stürmer C., 2016. Marketing challenges: stay competitive. Retrieved on November 5, 2019 (https://www.nim.org/en/compact/focustopics/marketing-challenges-stay-competitive).
Gawer, A., 2014. Bridging differing perspectives on technological platforms: Toward an integrative framework. Research policy, 43(7), pp.1239-1249.
Gaynor, M., Seider, H. and Vogt, W.B., 2005. The volume-outcome effect, scale economies, and learning-by-doing. American Economic Review, 95(2), pp.243-247.
Geels, F. W. (2002). Technological transitions as evolutionary reconfiguration
processes: A multi-level perspective and a case-study. Research Policy, 31(8–9),
1257–1274.
Germonprez, M., Kendall, J.E., Kendall, K.E., Mathiassen, L., Young, B. and Warner, B., 2016. A theory of responsive design: A field study of corporate engagement with open-source communities. Information Systems Research, 28(1), pp.64-83.
Ghosh, B. and Stock, A., 2010. Advertising effectiveness, digital video recorders, and product market competition. Marketing Science, 29(4),.639-649.
Gilbert, R.J. and Harris, R.G., 1981. Investment decisions with economies of scale and learning. The American Economic Review, 71(2), 172-177.
Gopal, A. and Gao, G., 2009. Certification in the Indian offshore IT services industry. Manufacturing & service operations management, 11(3), pp.471-492.
Greul, A., West J., & Bock, S. (2018). Open at birth? Why new firms do (or don’t) use
open innovation. Strategic Entrepreneurship Journal, 12(3), 392-420.
Grewal, R., Lilien, G.L. and Mallapragada, G., 2006. Location, location, location: How

165
165
network embeddedness affects project success in open-source systems. Management science, 52(7), pp.1043-1056.
Griliches, Z. (1991). The search for R&D spillovers. National Bureau of Economic
Research, Paper no. w3768.
Grindley, P. (1995). Standards, strategy, and policy: cases and stories. Oxford
University Press, NY.
Gu, S., & Lundvall, B. Å. (2016). China’s innovation system and the move towards
harmonious growth and endogenous innovation. The Learning Economy and the
Economics of Hope, 18(10), 269-304.
Habib, M.A., Hege, U. and Mella-Barral, P., 2013. Entrepreneurial spawning and firm characteristics. Management Science, 59(12), 2790-2804.
Hagiu, A. and Wright, J., 2015. Multi-sided platforms. International Journal of Industrial Organization, 43,162-174.
Hall, B.H., Jaffe, A. and Trajtenberg, M., 2005. Market value and patent citations. RAND Journal of economics, 16-38.
Hann, I.H., Roberts, J.A. and Slaughter, S.A., 2013. All are not equal: An examination of the economic returns to different forms of participation in open-source software communities. Information Systems Research, 24(3), 520-538.
Hannen, J., Antons, D., Piller, F., Salge, T.O., Coltman, T., & Devinney, T.M. (2019).
Containing the Not-Invented-Here Syndrome in external knowledge absorption and
open innovation: The role of indirect countermeasures. Research Policy, 48(9),
p.103822.
Hansen, T. F. (2003). Is modularity necessary for evolvability?: Remarks on the
relationship between pleiotropy and evolvability. Biosystems, 69(2–3), 83–94.
Haunschild, P.R. and Miner, A.S., 1997. Modes of interorganizational imitation: The effects of outcome salience and uncertainty. Administrative science quarterly, 472-500.
Heltzel, P., 2019. The 11 biggest issues IT faces today. Retrieved on November 5, 2019 (https://www.cio.com/article/3245772/the-12-biggest-issues-it-faces-today.html),
Henderson, R. M., & Clark, K. B. (1990). Architectural innovation: The reconfiguration of
existing product technologies and the failure of established firms. Administrative
Science Quarterly, 35(1), 9–30.
Hilbe, J. M. (2011). Negative binomial regression. Cambridge University Press,
Cambridge.
Hill, C. W. L. (1992). Strategies for exploiting technological innovations: When and when
not to license. Organization Science, 3(3), 428–441.
Hippel, E.V. and Krogh, G.V., 2003. Open-source software and the “private-collective” innovation model: Issues for organization science. Organization science, 14(2), 209-223.
Ho, S.Y. and Rai, A., 2017. Continued voluntary participation intention in firm-participating open-source software projects. Information Systems Research, 28(3), 603-625.

166
166
Hoberg, G., Phillips, G., and Prabhala, N., 2014. Product market threats, payouts, and financial flexibility. The Journal of Finance, 69(1), 293-324.
Hora, M., & Dutta, D. K. (2013). Entrepreneurial firms and downstream alliance
partnerships: Impact of portfolio depth and scope on technology innovation and
commercialization success. Production and Operations Management, 22(6), 1389–
1400.
İmrohoroğlu, A. and Tüzel, Ş., 2014. Firm-level productivity, risk, and return. Management Science, 60(8), 2073-2090.
ITU. (2017). Definition of “Open Standards,” IPR Ad Hoc Group. Retrieved August 28,
2017 (http://www.itu.int/en/ITU-T/ipr/Pages/open.aspx).
Jacobs, M., Droge, C., Vickery, S.K., & Calantone, R. (2011). Product and process
modularity's effects on manufacturing agility and firm growth performance. Journal
of Product Innovation Management, 28(1), 123-137.
Jacobs, M., Vickery, S.K., & Droge, C. (2007). The effects of product modularity on
competitive performance. International Journal of Operations & Production
Management.
Jain, S., & Ramdas, K. (2005). Up or out—or stay put? Product positioning in an
evolving technology environment. Production and Operations Management, 14(3),
362-376.
Katz, M. L., & Shapiro, C. (1992). Product introduction with network externalities. The
Journal of Industrial Economics, 40(1), 55–83.
Keupp, M.M. and Gassmann, O., 2009. Determinants and archetype users of open innovation. R&D Management, 39(4), 331-341.
Khazam, J., & Mowery, D. (1994). The commercialization of RISC: Strategies for the
creation of dominant designs. Research Policy, 23(1), 89–102.
Kim, K., Gopal, A. and Hoberg, G., 2016. Does product market competition drive CVC investment? Evidence from the US IT industry. Information Systems Research, 27(2), pp.259-281.
King, A.A. and Lakhani, K.R., 2011. The contingent effect of absorptive capacity: an
open innovation analysis. Boston: Harvard Business School.
Kishore, R., & McLean, E. (1998). Diffusion and infusion: Two dimensions of "Success
of Adoption" of IS innovations. Americas Conference on Information Systems
Proceedings, 245.
Kleis, L., Chwelos, P., Ramirez, R.V. and Cockburn, I., 2012. Information technology and intangible output: The impact of IT investment on innovation productivity. Information Systems Research, 23(1), 42-59.
Klepper, S., & Simons K. L. (2000). Dominance by birthright: entry of prior radio
producers and competitive ramifications in the US television receiver industry.
Strategic Management Journal, 21(10-11), 997–1016.
Koca, E., Souza, G.C., & Druehl, C.T. (2010). Managing product rollovers. Decision
Sciences, 41(2), 403-423.
Kovach, J.J., Hora, M., Manikas, A., & Patel P.C. (2015). Firm performance in dynamic
167
167
environments: The role of operational slack and operational scope. Journal of
Operations Management, 37, 1-12.
KPMG, 2015. Remaining Competitive in the Technology Industry. Retrieved on November 5, 2019 (https://home.kpmg/content/dam/kpmg/pdf/2015/10/remaining-competitive.pdf).
Kriplani R., 2017. If you’re a startup, you should not use React (reflecting on the BSD + patents license). Retrieved on 4 Aug, 2019 (https://medium.com/@raulk/if-youre-a-startup-you-should-not-use-react-reflecting-on-the-bsd-patents-license-b049d4a67dd2).
Krishnan V., & Gupta S. (2001). Appropriateness and impact of platform-based product
development. Management Science, 47(1), 52-68.
Kumar, V., Gordon, B.R. and Srinivasan, K., 2011. Competitive strategy for open-source software. Marketing Science, 30(6), 1066-1078.
Kuruvilla, S. and Ranganathan, A., 2008. Economic development strategies and macro-and micro-level human resource policies: The case of India's “outsourcing” industry. ILR Review, 62(1), 39-72.
Landis, J.R. and Koch, G.G., 1977. The measurement of observer agreement for categorical data. biometrics, 159-174.
Lerner, J. and Tirole, J., 2005. The scope of open-source licensing. Journal of Law, Economics, and Organization, 21(1), 20-56.
Li, K. J., Liu Y. (2019). Same or different? An aesthetic design question. Production and
Operations Management, Forthcoming.
Li, S. and Zhan, X., 2018. Product market threats and stock crash risk. Management Science.
Lieberman, M.B. and Kang, J., 2008. How to measure company productivity using value-added: A focus on Pohang Steel (POSCO). Asia Pacific Journal of Management, 25(2), 209-224.
Lieberman, M.B., 1987. Excess capacity as a barrier to entry: An empirical appraisal. The Journal of Industrial Economics,607-627.
Lieberman, M.B., Lau, L.J. and Williams, M.D., 1990. Firm-level productivity and management influence: A comparison of US and Japanese automobile producers. Management Science, 36(10), 1193-1215.
Lilburn, T. G., Haith, C. E., Prince, R. C. , & Beatty, J. T. (1992). Pleiotropic effects of
PufX gene deletion on the structure and function of the photosynthetic apparatus of
rhodobacter capsulatus. Biochimica et Biophysica Acta (BBA)-Bioenergetics,
1100(2), 160–170.
Linksvayer M.,2018. Recruiting open-source developers. Retrieved on August 4, 2019 (https://github.com/todogroup/guides/blob/master/recruiting-developers.md).
Livingston, J. A., Ortmeyer, D. L., Scholten, P. A., & Wong, W. (2013). A hedonic
approach to testing for indirect network effects in the LCD television market.
Applied Economics Letters, 20(1), 76–79.
Loten, A. (2019). IBM Strengthens Hybrid Cloud With Red Hat Acquisition. Wall Street
Journal. Retrieved July 19, 2019 (https://www.wsj.com/articles/ibm-strengthens-

168
168
hybrid-cloud-with-red-hat-acquisition-11562967857).
Lyandres, E. and Palazzo, B., 2016. Cash holdings, competition, and innovation. Journal of Financial and Quantitative Analysis, 51(6), 1823-1861.
MacCormack, A., Baldwin, C., & Rusnak, J. (2010). The architecture of complex
systems : Do core-periphery structures dominate? Academy of Management
Proceedings, 2010(1), 1–6.
Macher, J.T. and Boerner, C.S., 2006. Experience and scale and scope economies: trade‐offs and performance in development. Strategic Management Journal, 27(9), 845-865.
Maksimovic, V., 1995. Financial structure and product market competition. Handbooks in operations research and management science, 9,887-920.
Mark J., 2019. Open-source Business Models Considered Harmful. Retrieved on August 4, 2019 (https://blog.usejournal.com/open-source-business-models-considered-harmful-2e697256b1e3)
Mattei, M.M., and Platikanova, P., 2017. Do product market threats affect analyst forecast precision?. Review of Accounting Studies, 22(4), 1628-1665.
McCutcheon, D.M., Raturi, A.S., & Meredith, J.R. (1994). The customization-
responsiveness squeeze. MIT Sloan Management Review, 35(2), 89.
Mehra, A., Dewan, R. and Freimer, M., 2011. Firms as incubators of open-source software. Information Systems Research, 22(1), 22-38.
Mehra, A., Seidmann, A., & Mojumder, P. (2014). Product life‐cycle management of
packaged software. Production and Operations Management, 23(3), 366-378.
Melnyk, S.A., Pagell, M., Jorae, G., & Sharpe A.S. (1995). Applying survival analysis to
operations management: Analyzing the differences in donor classes in the blood
donation process. Journal of Operations Management, 13(4), 339-356.
Mishra, A., Chandrasekaran, A. and MacCormack, A., 2015. Collaboration in multi- partner R&D projects: The impact of partnering scale and scope. Journal of Operations Management, 33, 1-14.
Mishra, A.A. and Shah, R., 2009. In union lies strength: Collaborative competence in new product development and its performance effects. Journal of Operations Management, 27(4), 324-338.
Mitchell, G. (2012). The Hackathon Is On: Pitching and Programming the Next Killer
App. Retrieved from https://www.wired.com/2012/02/ff_hackathons/
Mukherjee, A., Mitchell W., & Talbot, F. B. (2000). The impact of new manufacturing
requirements on production line productivity and quality at a focused factory.
Journal of Operations Management, 18(2), 139-168.
Murmann, J. P., & Frenken, K. (2005). New directions in research on dominant designs.
Academy of Management Proceedings, 2005(1), G1-G6.
Murmann, J. P., & Frenken, K. (2006). Toward a systematic framework for research on
dominant designs, technological innovations, and industrial change. Research
Policy, 35(7), 925–952.
Musk, E. (2014). All our patent are belong to you. Retrieved on April 4, 2020
( https://www.tesla.com/en_NZ/blog/all-our-patent-are-belong-you)

169
169
Nagle, F., 2018. Learning by contributing: Gaining competitive advantage through contribution to crowdsourced public goods. Organization Science, 29(4), 569-587.
Nagle, F., 2018. Open-source software and firm productivity. Management Science, 65(3), 1191-1215.
Narayanan, V. K., & Chen, T. (2012). Research on technology standards:
Accomplishment and challenges. Research Policy, 41(8), 1375–1406.
Nickerson, J.A. and Silverman, B.S., 2003. Why firms want to organize efficiently and what keeps them from doing so: Inappropriate governance, performance, and adaptation in a deregulated industry. Administrative science quarterly, 48(3), 433-465.
Ozman, M., 2011. Modularity, industry life cycle and open innovation. Journal of
technology management & innovation, 6(1), 26-34.
Palenchar J. (2017). Samsung Opens Up QLED Trademark; Pushes for Open Dynamic
HDR Standard. CEPro. Retrieved on July 20, 2019
(https://www.cepro.com/article/samsung_qled_hdr_open_standard).
Park W. Y., Ro, Y. K., & Kim, N. (2018). Architectural innovation and the emergence of
a dominant design: The effects of strategic sourcing on performance. Research
Policy, 47(1), 326-341.
Park, J. K., & Ro, Y. K. (2011). The impact of a firm's make, pseudo-make, or buy
strategy on product performance. Journal of Operations Management, 29(4), 289-
304.
Parker, G. G., & Van Alstyne M. W. (2005). Two-sided network effects: A theory of
information product design. Management Science, 51(10), 1494–1504.
Pitt, L.F., Watson, R.T., Berthon, P., Wynn, D. and Zinkhan, G., 2006. The penguin’s window: Corporate brands from an open-source perspective. Journal of the Academy of Marketing Science, 34(2), 115-127.
Prud’Homme, B., Gompel, N., Rokas, A., Kassner, V. A., Williams, T. M., Yeh, S.-D.,
True, J. R., S. B. Carroll. 2006. Repeated morphological evolution through CIS-
regulatory changes in a pleiotropic gene. Nature, 440(7087), 1050.
Ramasubbu, N., C. F. Kemerer. 2015. Technical debt and the reliability of enterprise
software systems: A competing risks analysis. Management Science, 62(5), 1487–
1510.
Ramdas, K., 2003. Managing product variety: An integrative review and research
directions. Production and Operations Management, 12(1), 79-101.
Raymond, Eric S. 1997 Revision 1.5124, August 24, 2000, The Cathedral and the Bazaar [http://tuxedo.org/~esr/writings/cathedral-bazaar/ ]
Raza, M.W., 2013. Affect of financial leverage on firm performance. Empirical evidence from Karachi Stock Exchange.
Reagans, R., & McEvily, B. (2003). Network structure and knowledge transfer: The
effects of cohesion and range. Administrative Science Quarterly, 48(2), 240–267.
Rhee, M., Kim, Y.C. and Han, J., 2006. Confidence in imitation: Niche-width strategy in the UK automobile industry. Management Science, 52(4), 501-513.
Rochet, J.C., and Tirole, J., 2003. Platform competition in two-sided markets. Journal

170
170
of the European Economic Association, 1(4), 990-1029. Rogers, M., 2004. Networks, firm size and innovation. Small business economics, 22(2),
141-153. Rosenbloom, R. S., & Cusumano, M. A. (1987). Technological pioneering and
competitive advantage: The birth of the VCR industry. California Management
Review, 29(4), 51–76.
Ruckman, K., Saraf, N. and Sambamurthy, V., 2015. Market positioning by IT service vendors through imitation. Information Systems Research, 26(1), 100-126.
Salvador F., Forza, C., & Rungtusanatham, M. (2002). Modularity, product variety,
production volume, and component sourcing: theorizing beyond generic
prescriptions. Journal of operations management, 20(5), 549-575.
Saviotti, P. P., & Metcalfe, J. S. (1984). A theoretical approach to the construction of
technological output indicators. Research Policy, 13(3), 141–151.
Schenker L. J., 2019. The platform economy. Retrieved on November 13, 2019. (https://innovator.news/the-platform-economy-3c09439b56). Schmidt, G.M., & Druehl, C.T. (2005). Changes in product attributes and costs as
drivers of new product diffusion and substitution. Production and Operations
Management, 14(3), 272-285.
Schumpeter, J.A., 1950. Capitalism, Socialism, and Democracy & E 3rd Ed. Shaikh, M. and Henfridsson, O., 2017. Governing open source software through
coordination processes. Information and Organization, 27(2), 116-135.
Sharma, A., Pathak, S., Borah, S.B., & Adhikary, A. (2019). Is it too complex? The
curious case of supply network complexity and focal firm innovation. Journal of
Operations Management.
Shunko, M., Yunes, T., Fenu, G., Scheller‐Wolf, A., Tardif, V., & Tayur, S. (2018).
Product portfolio restructuring: methodology and application at caterpillar.
Production and Operations Management, 27(1), 100-120.
Silva, R. (2019). 3D TV Dies - Is it Really The End? www.lifewire.com. Retrieved July
25, 2019 (https://www.lifewire.com/why-3d-tv-died-4126776).
Singh, M., & Faircloth, S. (2005). The impact of corporate debt on long term investment and firm performance. Applied Economics, 37, 875–883.
Singh, P.V., Tan, Y. and Mookerjee, V., 2011. Network effects: The influence of structural capital on open-source project success. Mis Quarterly, pp.813-829.
Sirmon, D.G., Arregle, J.L., Hitt, M.A. and Webb, J.W., 2008. The role of family influence in firms’ strategic responses to threat of imitation. Entrepreneurship Theory and Practice, 32(6),979-998.
Skilton, P.F., & Bernardes, E. (2015). Competition network structure and product market
entry. Strategic Management Journal, 36(11), 1688-1696.
Shah, S.K., 2006. Motivation, governance, and the viability of hybrid forms in open
source software development. Management Science, 52(7), 1000-1014.
Srinivasan, R., Lilien, G. L., & Rangaswamy, A. (2006). The emergence of dominant
designs. Journal of Marketing, 70(2), 1–17.

171
171
Statista. (2017).TV Brands Market Share in North America 2015 | Statistic, Statista.
Retrieved on August 17, 2017 (https://www.statista.com/statistics/533880/north-
america-tvs-market-share-by-brand/).
Stewart, K.J., Ammeter, A.P. and Maruping, L.M., 2006. Impacts of license choice and organizational sponsorship on user interest and development activity in open-source software projects. Information Systems Research, 17(2), 126-144.
Stock, G.N., Greis, N.P. and Fischer, W.A., 2002. Firm size and dynamic technological innovation. Technovation, 22(9), 537-549.
Suarez, F. F. (2004). Battles for technological dominance: An integrative framework.
Research Policy, 33(2), 271–286.
Suarez, F. F., Grodal, S., & Gotsopoulos, A.(2015) Perfect timing? Dominant category,
dominant design, and the window of opportunity for firm entry. Strategic
Management Journal, 36(3), 437–448.
Subramanian, A., 2013. Product market competition, managerial compensation, and firm size in market equilibrium. Management Science, 59(7), 1612-1630.
Tallman, S., Jenkins, M., Henry, N., & Pinch, S. (2004). Knowledge, clusters, and
competitive advantage. Academy of Management Review. 29(2), 258–271.
Teece, D. J. (1986). Profiting from technological innovation: Implications for integration,
collaboration, licensing and public policy. Research Policy, 15(6), 285–305.
Tripsas, M. and Gavetti, G., 2000. Capabilities, cognition, and inertia: Evidence from digital imaging. Strategic management journal, 21(10‐11), 1147-1161.
Tushman, M. L., & Murmann, J. P. (1998). Dominant designs, technology cycles, and
organization outcomes. Academy of Management Proceedings, 1998(1), A1–A33.
Tushman, M. L., & Rosenkopf, L.(1992). Organizational determinants of technological-
change-toward a sociology of technological evolution. Research in Organizational
Behavior, 14(1992), 311–347.
Tushman, M.L., and Romanelli, E., 1985. Organizational evolution: A metamorphosis model of convergence and reorientation. Research in organizational behavior.
Vakharia, A. J., Parmenter, D. A., & Sanchez, S.M. (1996). The operating impact of
parts commonality. Journal of Operations Management, 14(1), 3-18.
Van Alstyne, M.W., Parker, G.G. and Choudary, S.P., 2016. Pipelines, platforms, and the new rules of strategy. Harvard business review, 94(4), 54-62.
Vickery, S.K., Koufteros, X., Dröge, C., & Calantone, R. (2016). Product modularity,
process modularity, and new product introduction performance: Does complexity
matter? Production and Operations Management, 25(4), 751-770.
Wacker, J.G., & Treleven, M. (1986). Component part standardization: an analysis of
commonality sources and indices. Journal of Operations Management, 6(2), 219-
244.
Wager, S. and Athey, S., 2018. Estimation and inference of heterogeneous treatment effects using random forests. Journal of the American Statistical Association, 113(523), 1228-1242.
Wagner, G. P., & Zhang, J. (2011). The pleiotropic structure of the genotype–phenotype
map: The evolvability of complex organisms. Nature Reviews Genetics, 12(3), 204.

172
172
Waguespack, D.M. and Fleming, L., 2009. Scanning the commons? Evidence on the benefits to startups participating in open standards development. Management Science, 55(2), 210-223.
Wang, Z., B.-Y. Liao, & Zhang, J. (2010). Genomic patterns of pleiotropy and the
evolution of complexity. Proceedings of the National Academy of Sciences,
107(42), 18034-18039.
Wakabayaschi, D. (2018). Prime Leverage: How Amazon Wields Power in the
Technology World. Retrieved on April 5, 2020
(https://www.nytimes.com/2019/12/15/technology/amazon-aws-cloud-
competition.html).
Wen, W., Ceccagnoli, M. and Forman, C., 2016. Opening up intellectual property
strategy: Implications for open source software entry by start-up firms.
Management Science, 62(9), 2668-2691.
Welch, C. (2019). Samsung’s 75-inch MicroLED 4K TV is a huge step into the future.
www.theverge.com. Retrieved on July 25, 2019
(https://www.theverge.com/2019/1/6/18168793/samsungs-75-inch-microled-4k-tv-
pitcure-quality-ces-2019).
West, J. (2003). How open is open enough?: Melding proprietary and open-source
platform strategies.
West, J. and Bogers, M., 2017. Open innovation: current status and research
opportunities. Innovation, 19(1), 43-50.
West, J. (2004). What are open standards? implications for adoption, competition and
policy. Standards and Public Policy conference, Federal Reserve Bank of Chicago,
Chicago, IL.
White, M. (2018). Explicitly Optimizing on Causal Effects via the Causal Random
Forest: A Practical Introduction and Tutorial. Retrieved from
https://www.markhw.com/blog/causalforestintro
Wooten, J. O., & Ulrich, K. T. (2017). Idea generation and the role of feedback:
Evidence from field experiments with innovation tournaments. Production and
Operations Management, 26(1), 80–99.
Wu, L., Jin, F. and Hitt, L.M., 2017. Are All Spillovers Created Equal? A Network Perspective on Information Technology Labor Movements. Management Science, 64(7), 3168-3186.
Wu, M.Y., Dai, D.Q., Shi, Y., Yan, H. and Zhang, X.F., 2012. Biomarker identification and cancer classification based on microarray data using laplace naive bayes model with mean shrinkage. IEEE/ACM transactions on computational biology and bioinformatics, 9(6), 1649-1662.
Wuttke, D.A., Rosenzweig, E.D., & Heese, H.S. (2019). An empirical analysis of supply
chain finance adoption. Journal of Operations Management, 65(3), 242-261.
Xu, Y., 2017. Generalized synthetic control method: Causal inference with interactive fixed effects models. Political Analysis, 25(1), 57-76.
Zhao, Y., Von Delft, S., Morgan-Thomas, A. and Buck, T., 2019. The evolution of
173
173
platform business models: Exploring competitive battles in the world of platforms. Long Range Planning, p.101892.
Zheng, S., Tucker, A. L., Ren, Z. J., Heineke, J., Mclaughlin, A. & Podell, A. L. (2018).
The Impact of internal service quality on preventable adverse events in hospitals.
Production and Operations Management, 27(12), 2201–2212.
Zhu, K., Kraemer, K. L., Gurbaxani, V., & Xu, S. X.. (2006). Migration to open-standard
interorganizational systems: network effects, switching costs, and path
dependency. MIS Quarterly, 30(2006), 515–539.
Zhu, K.X. and Zhou, Z.Z., 2012. Research note—Lock-in strategy in software competition: Open-source software vs. proprietary software. Information Systems Research, 23(2), 536-545.

174
174
7 Appendices
7.1 Appendix A
Table 26: Appendix: List of components with corresponding variable values (the year 2017)
Variables Column Number in Table 26
Year of introduction 1
Dominant 2
Pleiotropy score 3
Open standard 4
Endogenous innovation 5
Hardware 6
Digital 7
Versioning 8
Number of firms 9
Introductory footprint (%) 10
Introduced by leader 11
Royalty fees 12
D_Interface 13
D_Data_management 14
D_Network 15
D_Display 16
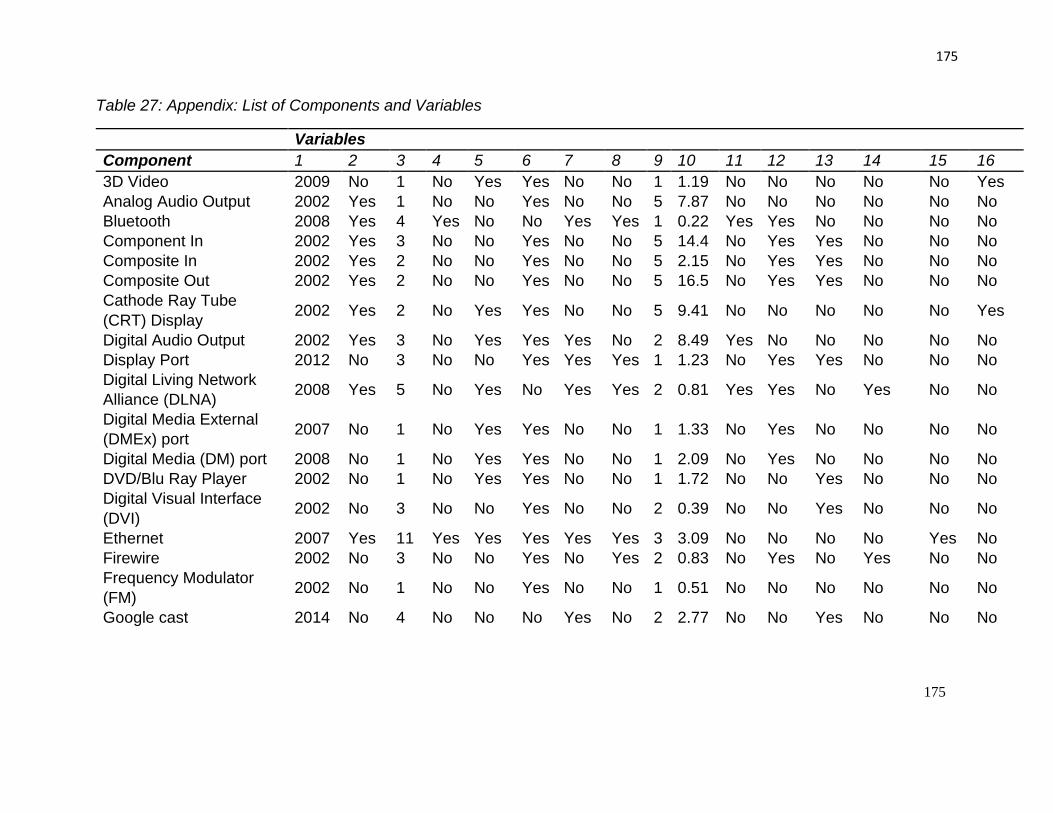
175
175
Table 27: Appendix: List of Components and Variables
Variables
Component 1 2 3 4 5 6 7 8 9 10 11 12 13 14 15 16
3D Video 2009 No 1 No Yes Yes No No 1 1.19 No No No No No Yes
Analog Audio Output 2002 Yes 1 No No Yes No No 5 7.87 No No No No No No
Bluetooth 2008 Yes 4 Yes No No Yes Yes 1 0.22 Yes Yes No No No No
Component In 2002 Yes 3 No No Yes No No 5 14.4 No Yes Yes No No No
Composite In 2002 Yes 2 No No Yes No No 5 2.15 No Yes Yes No No No
Composite Out 2002 Yes 2 No No Yes No No 5 16.5 No Yes Yes No No No
Cathode Ray Tube
(CRT) Display 2002 Yes 2 No Yes Yes No No 5 9.41 No No No No No Yes
Digital Audio Output 2002 Yes 3 No Yes Yes Yes No 2 8.49 Yes No No No No No
Display Port 2012 No 3 No No Yes Yes Yes 1 1.23 No Yes Yes No No No
Digital Living Network
Alliance (DLNA) 2008 Yes 5 No Yes No Yes Yes 2 0.81 Yes Yes No Yes No No
Digital Media External
(DMEx) port 2007 No 1 No Yes Yes No No 1 1.33 No Yes No No No No
Digital Media (DM) port 2008 No 1 No Yes Yes No No 1 2.09 No Yes No No No No
DVD/Blu Ray Player 2002 No 1 No Yes Yes No No 1 1.72 No No Yes No No No
Digital Visual Interface
(DVI) 2002 No 3 No No Yes No No 2 0.39 No No Yes No No No
Ethernet 2007 Yes 11 Yes Yes Yes Yes Yes 3 3.09 No No No No Yes No
Firewire 2002 No 3 No No Yes No Yes 2 0.83 No Yes No Yes No No
Frequency Modulator
(FM) 2002 No 1 No No Yes No No 1 0.51 No No No No No No
Google cast 2014 No 4 No No No Yes No 2 2.77 No No Yes No No No
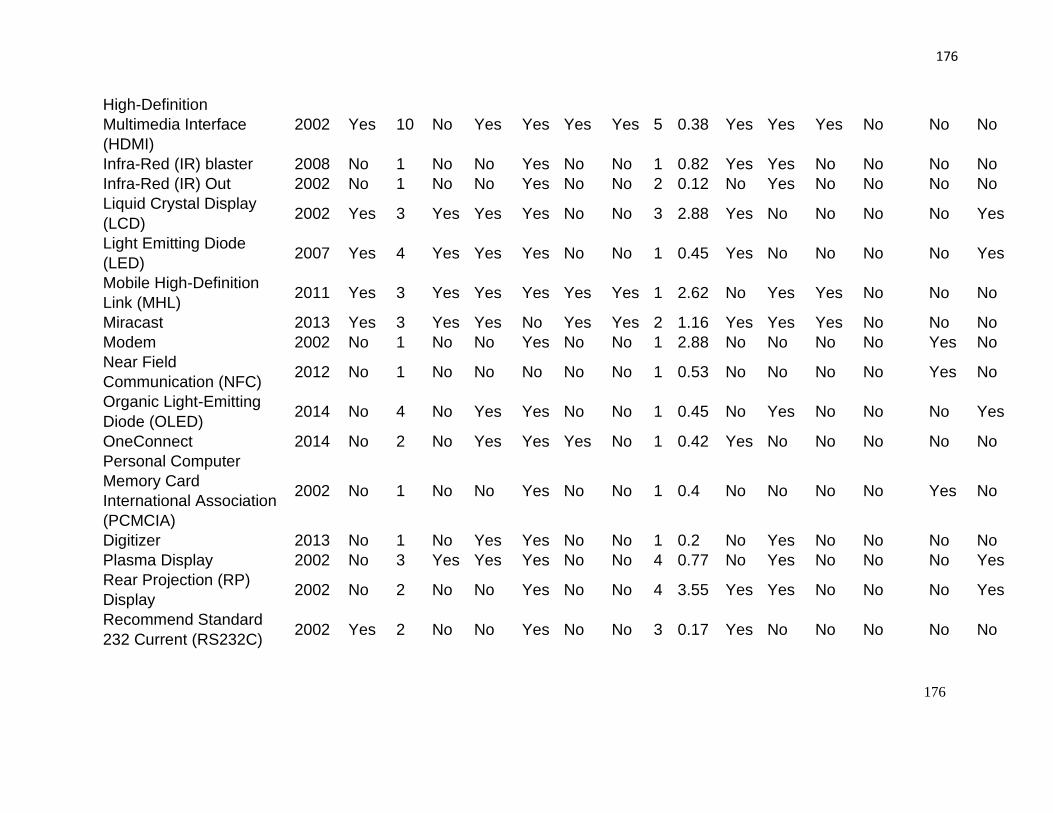
176
176
High-Definition
Multimedia Interface
(HDMI)
2002 Yes 10 No Yes Yes Yes Yes 5 0.38 Yes Yes Yes No No No
Infra-Red (IR) blaster 2008 No 1 No No Yes No No 1 0.82 Yes Yes No No No No
Infra-Red (IR) Out 2002 No 1 No No Yes No No 2 0.12 No Yes No No No No
Liquid Crystal Display
(LCD) 2002 Yes 3 Yes Yes Yes No No 3 2.88 Yes No No No No Yes
Light Emitting Diode
(LED) 2007 Yes 4 Yes Yes Yes No No 1 0.45 Yes No No No No Yes
Mobile High-Definition
Link (MHL) 2011 Yes 3 Yes Yes Yes Yes Yes 1 2.62 No Yes Yes No No No
Miracast 2013 Yes 3 Yes Yes No Yes Yes 2 1.16 Yes Yes Yes No No No
Modem 2002 No 1 No No Yes No No 1 2.88 No No No No Yes No
Near Field
Communication (NFC) 2012 No 1 No No No No No 1 0.53 No No No No Yes No
Organic Light-Emitting
Diode (OLED) 2014 No 4 No Yes Yes No No 1 0.45 No Yes No No No Yes
OneConnect 2014 No 2 No Yes Yes Yes No 1 0.42 Yes No No No No No
Personal Computer
Memory Card
International Association
(PCMCIA)
2002 No 1 No No Yes No No 1 0.4 No No No No Yes No
Digitizer 2013 No 1 No Yes Yes No No 1 0.2 No Yes No No No No
Plasma Display 2002 No 3 Yes Yes Yes No No 4 0.77 No Yes No No No Yes
Rear Projection (RP)
Display 2002 No 2 No No Yes No No 4 3.55 Yes Yes No No No Yes
Recommend Standard
232 Current (RS232C) 2002 Yes 2 No No Yes No No 3 0.17 Yes No No No No No
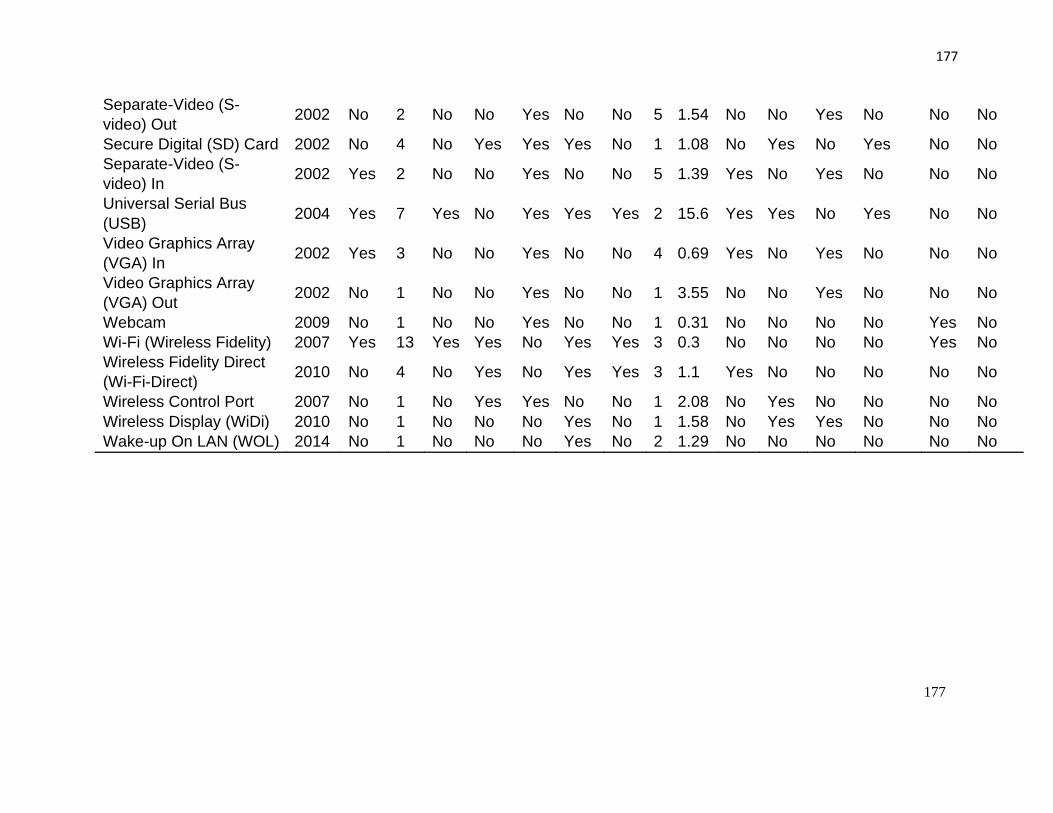
177
177
Separate-Video (S-
video) Out 2002 No 2 No No Yes No No 5 1.54 No No Yes No No No
Secure Digital (SD) Card 2002 No 4 No Yes Yes Yes No 1 1.08 No Yes No Yes No No
Separate-Video (S-
video) In 2002 Yes 2 No No Yes No No 5 1.39 Yes No Yes No No No
Universal Serial Bus
(USB) 2004 Yes 7 Yes No Yes Yes Yes 2 15.6 Yes Yes No Yes No No
Video Graphics Array
(VGA) In 2002 Yes 3 No No Yes No No 4 0.69 Yes No Yes No No No
Video Graphics Array
(VGA) Out 2002 No 1 No No Yes No No 1 3.55 No No Yes No No No
Webcam 2009 No 1 No No Yes No No 1 0.31 No No No No Yes No
Wi-Fi (Wireless Fidelity) 2007 Yes 13 Yes Yes No Yes Yes 3 0.3 No No No No Yes No
Wireless Fidelity Direct
(Wi-Fi-Direct) 2010 No 4 No Yes No Yes Yes 3 1.1 Yes No No No No No
Wireless Control Port 2007 No 1 No Yes Yes No No 1 2.08 No Yes No No No No
Wireless Display (WiDi) 2010 No 1 No No No Yes No 1 1.58 No Yes Yes No No No
Wake-up On LAN (WOL) 2014 No 1 No No No Yes No 2 1.29 No No No No No No

178
178
Table 28: Appendix: Component Classification Examples
Component Example of The basis for the classification
RS-232c Low
Pleiotropy
https://www.analog.com/media/en/technical-
documentation/product-selector-
card/RS232%20Quick%20Guide.pdf
HDMI 1.4
High
Pleiotropy
https://www.hdmi.org/spec/hdmi1_4b
Bluetooth Open
Standard
https://www.techopedia.com/definition/26198/bluetooth
HDMI 1.4 Closed
Standard
https://www.semiconductorstore.com/blog/2014/licensing-
costs-HDMI/654/
WiDi Exogenous
Innovation
https://www.wired.com/2010/09/intel-widi-streaming-media/
HDMI 1.4 Endogenous
Innovation
http://bfiles.chinaaet.com/whpt/blog/20170919/1000008562-
6364143185282736974850538.pdf
Pleiotropy Map and pleiotropy score
To develop the pleiotropy map and calculate the pleiotropy score from it, I first
extracted specifications for every TV in my dataset. Specifications are typically listed
on the TV manufacturers' website. For example, specifications of Sony’s TV model
46hx720 are presented here:
https://www.sony.com.au/electronics/support/televisions-projectors-lcd-tvs/kdl-
46hx700/specifications. Using such specification documents and component
specification sheets, I created the pleiotropy map using the following procedure:
Step-1. Extract TV Features:
Using rvest and rcurl packages in R, I assimilated all TV specifications from TV
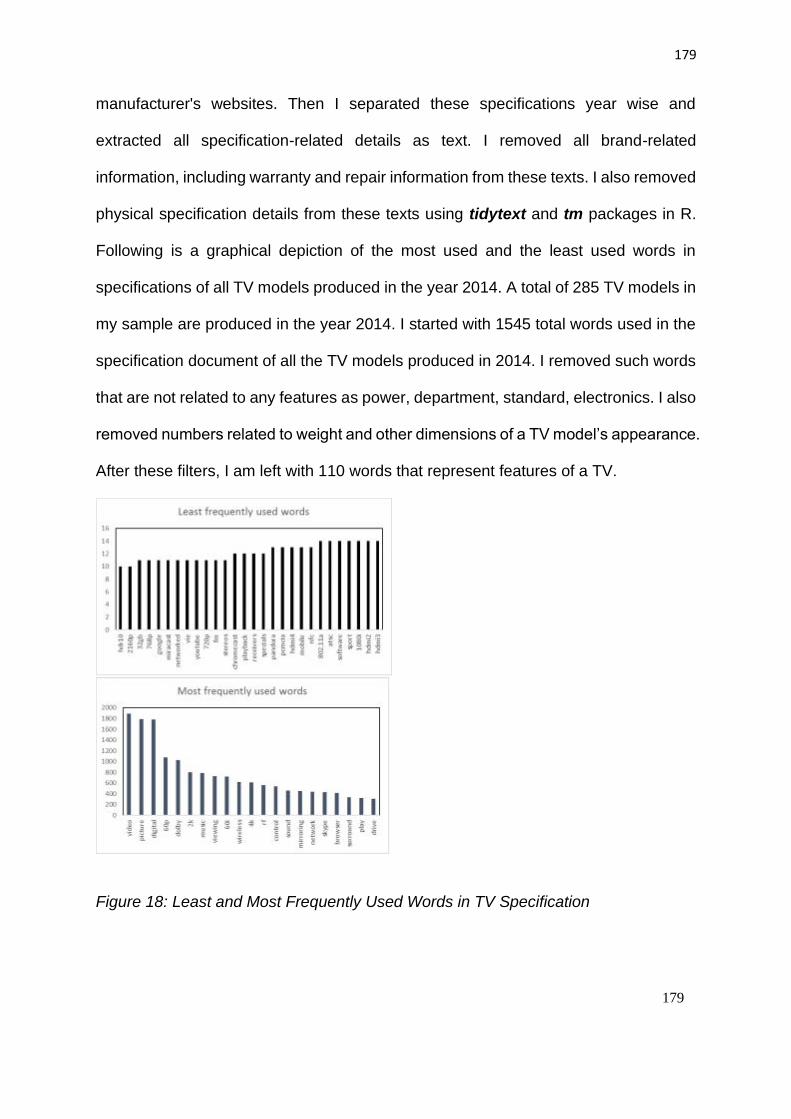
179
179
manufacturer's websites. Then I separated these specifications year wise and
extracted all specification-related details as text. I removed all brand-related
information, including warranty and repair information from these texts. I also removed
physical specification details from these texts using tidytext and tm packages in R.
Following is a graphical depiction of the most used and the least used words in
specifications of all TV models produced in the year 2014. A total of 285 TV models in
my sample are produced in the year 2014. I started with 1545 total words used in the
specification document of all the TV models produced in 2014. I removed such words
that are not related to any features as power, department, standard, electronics. I also
removed numbers related to weight and other dimensions of a TV model’s appearance.
After these filters, I am left with 110 words that represent features of a TV.
Figure 18: Least and Most Frequently Used Words in TV Specification

180
180
Step-2. Normalizing and combining the words to extract the feature set:
Features in a TV specification are represented with different and related words in
specifications of TVs from different manufacturers. For example, 1080p, 60i and 60p
all represent full high definition video. 4K, 2160p, and ultra hd all represent ultra-high-
definition video. Similarly, 802.11a, networked, network, and wireless all represent an
Ethernet network. CEC (consumer electronic control) and control represent multi-
device control. I combined such related words to create the representative feature set
for each TV model year. These words and their word count are presented in Table B2
below.
Table 29: Appendix: Word frequencies from specifications of all TVs in the sample (the year 2014)
word count word count
word count
hdr10 10 twitter 16 viewer 170
2160p 10 480p 16 naturalizer 180
32gb 11 hdr 17 social 190
768p 11 smartphone 17 fat16 200
google 11 spotify 17 fat32 200
miracast 11 processors 18 web 200
networked 11 hdcp1.4 19 stereo 230
vie 11 480i 19 interface 240
youtube 11 hdmi1 19 smart 240
720p 11 netflix 20 special 240
fm 11 processor 20 cec 250
stereos 11 quickflix 20 tuners 260
chromecast 12 hdd 35 internet 270
playback 12 hdcp 35 cinemotion 300
receivers 12 mirror 40 dlna 300
specials 12 android 47 drive 310
pandora 13 speakers 50 play 320
pcmcia 13 chrome 53 surround 340
hdmi4 13 tweet 65 browser 420
mobile 13 new 73 skype 430
nfc 13 smartlink 82 network 440

181
181
802.11a 14 radio 84 mirroring 450
atsc 14 sorry 84 sound 460
software 14 bluetooth 85 control 540
sport 14 ultrahd 100 rf 560
1080i 14 glasses 110 4k 610
hdmi2 14 tuner 110 wireless 620
hdmi3 14 1080p 120 60i 720
view 15 3d 120 viewing 730
tweeter 15 processing 140 music 790
videos 15 dimming 150 2k 800
mhl2.0 16 exfat 170
Step-3. Matching components with the feature set
Finally, for every year, I matched the component features (derived from component
specification documents) with the TV features extracted in step 2 above to derived
pleiotropy map. I derived pleiotropy scores from these pleiotropy maps (as presented
in Figure 5). I cross-validated these scores with the hand-coded features list derived
from component specification documents. For example,
Table 29: Appendix: Example of Words to Component Matching
Words Feature Component
4K, 2160p, Ultrahd, 60i, Ultra-high definition video HDMI
2K, 1080i, 1080p, 720p Full-high definition video HDMI,
Component
32 GB, exFAT, FAT16, FAT32 Multimedia storage SD Card
Web, networked, 802.11ac,
internet, network
Internet connectivity Wi-Fi, LAN
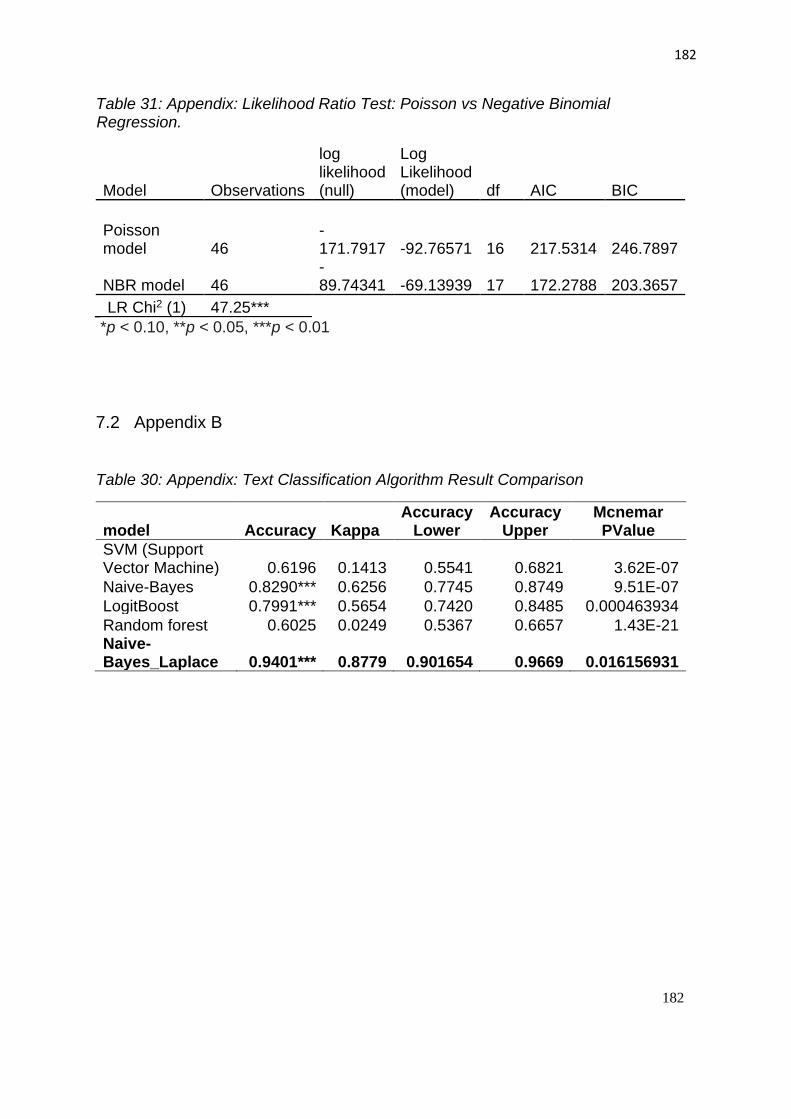
182
182
Table 31: Appendix: Likelihood Ratio Test: Poisson vs Negative Binomial Regression.
Model Observations
log likelihood (null)
Log Likelihood (model) df AIC BIC
Poisson model 46
-171.7917 -92.76571 16 217.5314 246.7897
NBR model 46 -89.74341 -69.13939 17 172.2788 203.3657
LR Chi2 (1) 47.25***
*p < 0.10, **p < 0.05, ***p < 0.01
7.2 Appendix B
Table 30: Appendix: Text Classification Algorithm Result Comparison
model Accuracy Kappa Accuracy
Lower Accuracy
Upper Mcnemar PValue
SVM (Support Vector Machine) 0.6196 0.1413 0.5541 0.6821 3.62E-07
Naive-Bayes 0.8290*** 0.6256 0.7745 0.8749 9.51E-07
LogitBoost 0.7991*** 0.5654 0.7420 0.8485 0.000463934
Random forest 0.6025 0.0249 0.5367 0.6657 1.43E-21 Naive-Bayes_Laplace 0.9401*** 0.8779 0.901654 0.9669 0.016156931
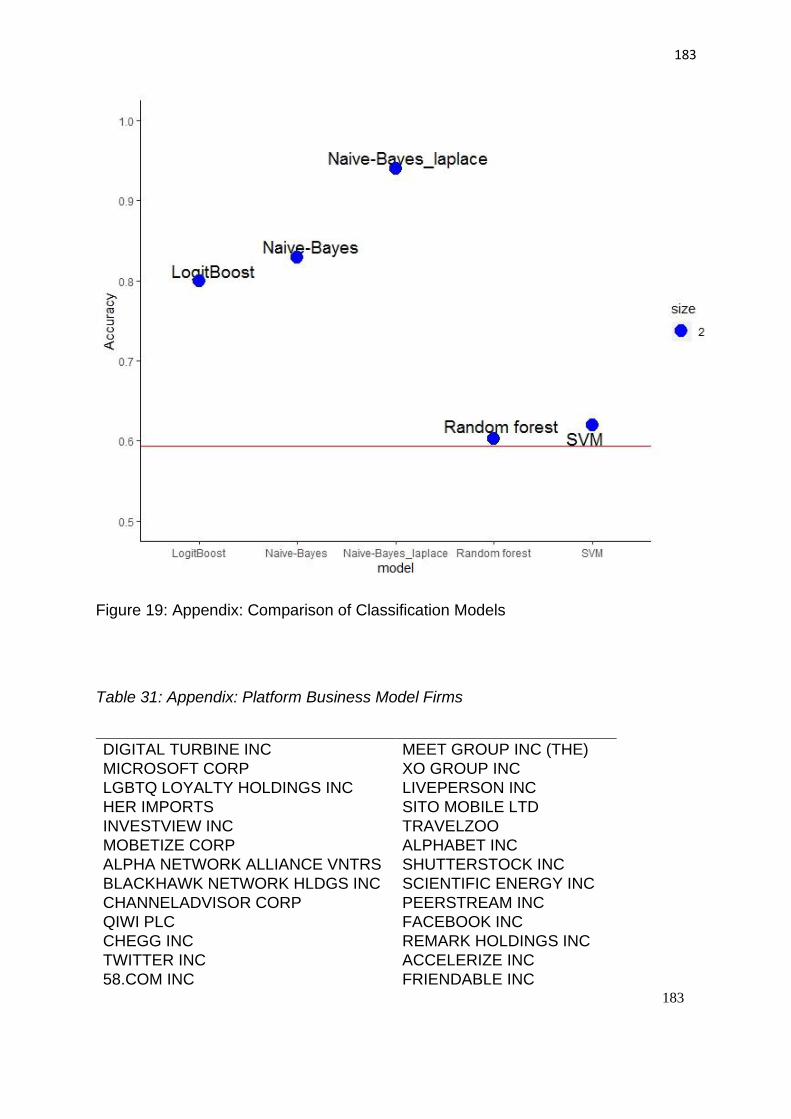
183
183
Figure 19: Appendix: Comparison of Classification Models
Table 31: Appendix: Platform Business Model Firms
DIGITAL TURBINE INC MEET GROUP INC (THE)
MICROSOFT CORP XO GROUP INC
LGBTQ LOYALTY HOLDINGS INC LIVEPERSON INC
HER IMPORTS SITO MOBILE LTD
INVESTVIEW INC TRAVELZOO
MOBETIZE CORP ALPHABET INC
ALPHA NETWORK ALLIANCE VNTRS SHUTTERSTOCK INC
BLACKHAWK NETWORK HLDGS INC SCIENTIFIC ENERGY INC
CHANNELADVISOR CORP PEERSTREAM INC
QIWI PLC FACEBOOK INC
CHEGG INC REMARK HOLDINGS INC
TWITTER INC ACCELERIZE INC
58.COM INC FRIENDABLE INC

184
184
MOXIAN INC REGO PAYMENT ARCHITECTES INC
CARE.COM INC NORTHSIGHT CAPITAL INC
SNAP INC QUINSTREET INC
QUOTIENT TECHNOLOGY INC LEAF GROUP LTD
RIMINI STREET INC PANDORA MEDIA INC
GRUBHUB INC ZILLOW GROUP INC
TRUECAR INC GROUPON INC
LIBERTY TRIPADVISOR HOLDINGS BRIGHTCOVE INC
TRAVELPORT WORLDWIDE LTD YELP INC
GODADDY INC TRIPADVISOR INC
ETSY INC PAID INC
MINDBODY INC SHOTSPOTTER INC
PAYPAL HOLDINGS INC SPYR INC
IAC/INTERACTIVECORP CIPHERLOC CORP
SQUARE INC PAYSIGN INC
MATCH GROUP INC EBAY INC
ZEDGE INC KIDOZ INC
COMMERCEHUB INC AUTOWEB INC
VIVA ENTERTAINMENT GROUP INC BOOKING HOLDINGS INC
TRADE DESK INC THESTREET INC
Table 32: Appendix: Non-platform Business Model Firms
INTL BUSINESS MACHINES CORP SYMANTEC CORP ECHOSTAR CORP DELL TECHNOLOGIES INC DIEBOLD NIXDORF INC SUNPOWER CORP
INTEL CORP COMMSCOPE HOLDING CO INC VERIFONE SYSTEMS INC
CISCO SYSTEMS INC SCIENCE APPLICATIONS INTL CP CORELOGIC INC
ORACLE CORP CACI INTL INC -CL A MICROSEMI CORP
FUJITSU LTD CA INC ALLSCRIPTS HEALTHCARE SOLTNS
TECH DATA CORP AMKOR TECHNOLOGY INC FLIR SYSTEMS INC HEWLETT PACKARD ENTERPRISE
BROADRIDGE FINANCIAL SOLUTNS
TAKE-TWO INTERACTIVE SFTWR
NORTHROP GRUMMAN CORP JINKOSOLAR HOLDING CO PALO ALTO NETWORKS INC
RAYTHEON CO MICROCHIP TECHNOLOGY INC SYNAPTICS INC
QUALCOMM INC ZEBRA TECHNOLOGIES CP -CL A MANTECH INTL CORP

185
185
MICRON TECHNOLOGY INC
SKYWORKS SOLUTIONS INC
SS&C TECHNOLOGIES HLDGS INC
WESTERN DIGITAL CORP IHS MARKIT LTD ARISTA NETWORKS INC SYNNEX CORP SABRE CORP FITBIT INC CDW CORP SCANSOURCE INC VIASAT INC TEXAS INSTRUMENTS INC TRINET GROUP INC SYKES ENTERPRISES INC COGNIZANT TECH SOLUTIONS GARMIN LTD CIRRUS LOGIC INC AUTOMATIC DATA PROCESSING SCIENTIFIC GAMES CORP FORTINET INC FIRST DATA CORP QORVO INC CREE INC
AU OPTRONICS CORP FIRST SOLAR INC HENRY (JACK) & ASSOCIATES
SEAGATE TECHNOLOGY PLC RED HAT INC EPLUS INC SALESFORCE.COM INC CITRIX SYSTEMS INC IPG PHOTONICS CORP NVIDIA CORP CIENA CORP NETGEAR INC NXP SEMICONDUCTORS NV UNISYS CORP TREND MICRO INC FIDELITY NATIONAL INFO SVCS GENPACT LTD
NATIONAL INSTRUMENTS CORP
VMWARE INC -CL A SYNOPSYS INC SPLUNK INC ALLIANCE DATA SYSTEMS CORP
TELEDYNE TECHNOLOGIES INC WEX INC
CHUNGHWA TELECOM LTD
LOGITECH INTERNATIONAL SA
FACTSET RESEARCH SYSTEMS INC
ADOBE INC XILINX INC VERISIGN INC ACTIVISION BLIZZARD INC
AKAMAI TECHNOLOGIES INC PTC INC
INSIGHT ENTERPRISES INC
MARVELL TECHNOLOGY GROUP LTD VERINT SYSTEMS INC
ARRIS INTERNATIONAL PLC
CYPRESS SEMICONDUCTOR CORP ANSYS INC
BOOZ ALLEN HAMILTON HLDG CP
MAXIM INTEGRATED PRODUCTS MITEL NETWORKS CORP
CONDUENT INC OPEN TEXT CORP DIODES INC
NETAPP INC FLEETCOR TECHNOLOGIES INC BLACK KNIGHT INC
HARRIS CORP CDK GLOBAL INC ACI WORLDWIDE INC FISERV INC DST SYSTEMS INC PURE STORAGE INC ON SEMICONDUCTOR CORP
ZAYO GROUP HOLDINGS INC VIRTUSA CORP
ADVANCED MICRO DEVICES WORKDAY INC
DONNELLEY FINANCIAL SOLTNS
INTUIT INC F5 NETWORKS INC VONAGE HOLDINGS CORP ELECTRONIC ARTS INC AUTODESK INC LUMENTUM HOLDINGS INC

186
186
CERNER CORP ESTERLINE TECHNOLOGIES CORP
ELECTRONICS FOR IMAGING INC
ANALOG DEVICES CADENCE DESIGN SYSTEMS INC LOGMEIN INC
ESSENDANT INC NUANCE COMMUNICATIONS INC NETSCOUT SYSTEMS INC
JUNIPER NETWORKS INC SERVICENOW INC CAVIUM INC
COSTAR GROUP INC FINJAN HOLDINGS INC BOTTOMLINE TECHNOLOGIES INC
ULTIMATE SOFTWARE GROUP INC
FRANKLIN WIRELESS CORP INPHI CORP
FAIR ISAAC CORP REIS INC ALARM.COM HOLDINGS INC
BLACKBERRY LTD VISLINK TECHNOLOGIES INC NIC INC
SYNTEL INC WIRELESS TELECOM GROUP INC UNIVERSAL DISPLAY CORP
GCI LIBERTY INC -OLD INPIXON TUCOWS INC LIVERAMP HOLDINGS INC LANTRONIX INC PFSWEB INC
MORNINGSTAR INC TELARIA INC ALJ REGIONAL HOLDINGS INC
LUXOFT HOLDING INC GSI TECHNOLOGY INC QAD INC TABLEAU SOFTWARE INC DAILY JOURNAL CORP
COMPUTER TASK GROUP INC
PLANTRONICS INC I D SYSTEMS INC PAYLOCITY HOLDING CORP INTEGRATED DEVICE TECH INC BK TECHNOLOGIES CORP AMBARELLA INC TYLER TECHNOLOGIES INC NETLIST INC NEOPHOTONICS CORP
PEGASYSTEMS INC GLASSBRIDGE ENTERPRISES INC 2U INC
GTT COMMUNICATIONS INC DATAWATCH CORP INTERNAP CORP
TIVO CORP EVERSPIN TECHNOLOGIES INC
COMPUTER PROGRAMS & SYSTEMS
VIAVI SOLUTIONS INC IMMERSION CORP INFORMATION SERVICES GROUP
CSG SYSTEMS INTL INC GLOBALSCAPE INC HORTONWORKS INC SILICON LABORATORIES INC MTBC INC BENEFITFOCUS INC NUTANIX INC ECHELON CORP CPI CARD GROUP INC EXLSERVICE HOLDINGS INC
MAM SOFTWARE GROUP INC
VISHAY PRECISION GROUP INC
KRATOS DEFENSE & SECURITY NVE CORP CALLIDUS SOFTWARE INC FIREEYE INC ZOOM TELEPHONICS INC HEALTHSTREAM INC

187
187
WEB.COM GROUP INC EVOLVING SYSTEMS INC DASAN ZHONE SOLUTIONS INC
INFINERA CORP GAIA INC AVIAT NETWORKS INC OMNICELL INC QUMU CORP SERVICESOURCE INTL INC COMMVAULT SYSTEMS INC DETERMINE INC
MONOTYPE IMAGING HOLDINGS
GOGO INC KOPIN CORP ITURAN LOCATION & CONTROL
VEEVA SYSTEMS INC ASTEA INTERNATIONAL INC PAR TECHNOLOGY CORP
HIMAX TECHNOLOGIES INC
FALCONSTOR SOFTWARE INC QUALYS INC
MAGNACHIP SEMICONDUCTOR CORP
STREAMLINE HEALTH SOLUTIONS HEALTHEQUITY INC
REALPAGE INC NXT-ID INC SPS COMMERCE INC
ADTRAN INC BLONDER TONGUE LABS INC INSEEGO CORP
NET 1 UEPS TECHNOLOGIES INC
SMITH MICRO SOFTWARE INC VARONIS SYSTEMS INC
OCLARO INC PROFESSIONAL DIVERSITY NETWK WORKIVA INC
MANHATTAN ASSOCIATES INC SOCKET MOBILE INC RIGNET INC INTERXION HOLDING NV NTN BUZZTIME INC BOINGO WIRELESS INC
SEMTECH CORP DOCUMENT SECURITY SYS INC RAPID7 INC
CHANGYOU.COM LTD MICT INC FIVE9 INC COMTECH TELECOMMUN
CODA OCTOPUS GROUP INC Q2 HOLDINGS INC
MEDIDATA SOLUTIONS INC AWARE INC APPTIO INC NEXTGEN HEALTHCARE INC
INNOVATIVE SOLTNS & SUPP INC COUPA SOFTWARE INC
PROOFPOINT INC BRIDGELINE DIGITAL INC ROSETTA STONE INC CALIX INC GLOWPOINT INC DIGI INTERNATIONAL INC BOX INC PARETEUM CORP BLACKLINE INC
MICROSTRATEGY INC LIBERTY BROADBAND CORP MOBILEIRON INC
RINGCENTRAL INC TAKUNG ART CO LTD QUANTENNA COMMUNICATIONS INC
PERFICIENT INC ISSUER DIRECT CORP TELENAV INC ASPEN TECHNOLOGY INC COUNTERPATH CORP PROS HOLDINGS INC CORNERSTONE ONDEMAND INC QUICKLOGIC CORP INSTRUCTURE INC

188
188
MONOLITHIC POWER SYSTEMS INC
SPECTRA7 MICROSYSTEMS INC
CAMBIUM LEARNING GROUP INC
SECUREWORKS CORP HELIOS AND MATHESON ANALYTIC RUBICON PROJECT INC
PHOTRONICS INC CREXENDO INC AEROHIVE NETWORKS INC INOVALON HOLDINGS INC NEONODE INC MIX TELEMATICS LTD KEYW HOLDING CORP QUOTEMEDIA INC IDEANOMICS INC
STEEL CONNECT INC INTELLIGENT SYSTEM CORP APPFOLIO INC
EVOLENT HEALTH INC SEMILEDS CORP TABULA RASA HEALTHCARE INC
PAYCOM SOFTWARE INC MOSYS INC RADISYS CORP POWER INTEGRATIONS INC
MOBIVITY HOLDINGS CORP CASTLIGHT HEALTH INC
ZENDESK INC ANDREA ELECTRONICS CORP MODEL N INC
WIX.COM LTD PDVWIRELESS INC IMPINJ INC
MAXLINEAR INC RUBICON TECHNOLOGY INC AGILYSYS INC
GLOBANT SA ACORN ENERGY INC DSP GROUP INC MERCURY SYSTEMS INC
TECHNICAL COMMUNICATIONS CP MAJESCO
EVERTEC INC INTELLICHECK INC EMCORE CORP SYNCHRONOSS TECHNOLOGIES
PARALLAX HEALTH SCIENCES INC OOMA INC
TWILIO INC AUDIOEYE INC FRONTEO INC PROGRESS SOFTWARE CORP
SKKYNET CLOUD SYSTEMS INC ASTRONOVA INC
CRAY INC NANO DIMENSION LTD AMERICAN SOFTWARE -CL A
LATTICE SEMICONDUCTOR CORP
ONE HORIZON GROUP INC
EDGEWATER TECHNOLOGY INC
ACACIA COMMUNICATIONS INC RESONANT INC CSP INC ALPHA AND OMEGA SEMICONDUCTR
ASCENT SOLAR TECHNOLOGIES TECHTARGET INC
APPLIED OPTOELECTRONICS INC
MARATHON PATENT GROUP INC EVERBRIDGE INC
MAHANAGAR TELEPHONE NIGAM RIOT BLOCKCHAIN INC PLUG POWER INC XPERI CORPORATION NANOFLEX POWER CORP AXT INC HAWAIIAN TELCOM HOLDCO INC
KINGTONE WIRELESS -ADR -OLD UPLAND SOFTWARE INC
CALAMP CORP ATOMERA INC PCTEL INC

189
189
EBIX INC PARKERVISION INC MAGICJACK VOCALTEC LTD DAQO NEW ENERGY CORP UMEWORLD LTD
XPLORE TECHNOLOGIES CORP
HARMONIC INC MAX SOUND CORP NANTHEALTH INC
NEW RELIC INC WORLDS INC COMMUNICATIONS SYSTEMS INC
SPHERE 3D CORP WIDEPOINT CORP SUPPORT.COM INC BSQUARE CORP MARIN SOFTWARE INC WESTELL TECH INC -CL A PIXELWORKS INC CYNERGISTEK INC EGAIN CORP SEACHANGE INTERNATIONAL INC SIGMA DESIGNS INC
TRANSACT TECHNOLOGIES INC
INUVO INC ZIX CORP ADESTO TECHNOLOGIES CORP
REALNETWORKS INC TSR INC ASURE SOFTWARE INC SUNWORKS INC INNODATA INC IPASS INC CONNECTURE INC IDENTIV INC
Table 33: Firms That Transitioned from Non-Platform to Platform Business Model
APPLE INC
CHANNELADVISOR
CORP
CLEARONE INC
SABRECORP
MGT CAPITAL
INVESTMENTS INC
STAMP.COM INC
J2 GLOBAL INC
UNITED ONLINE INC
CONVERSANT INC
NET ELEMENT INC
LEIDOS HOLDINGS
INC
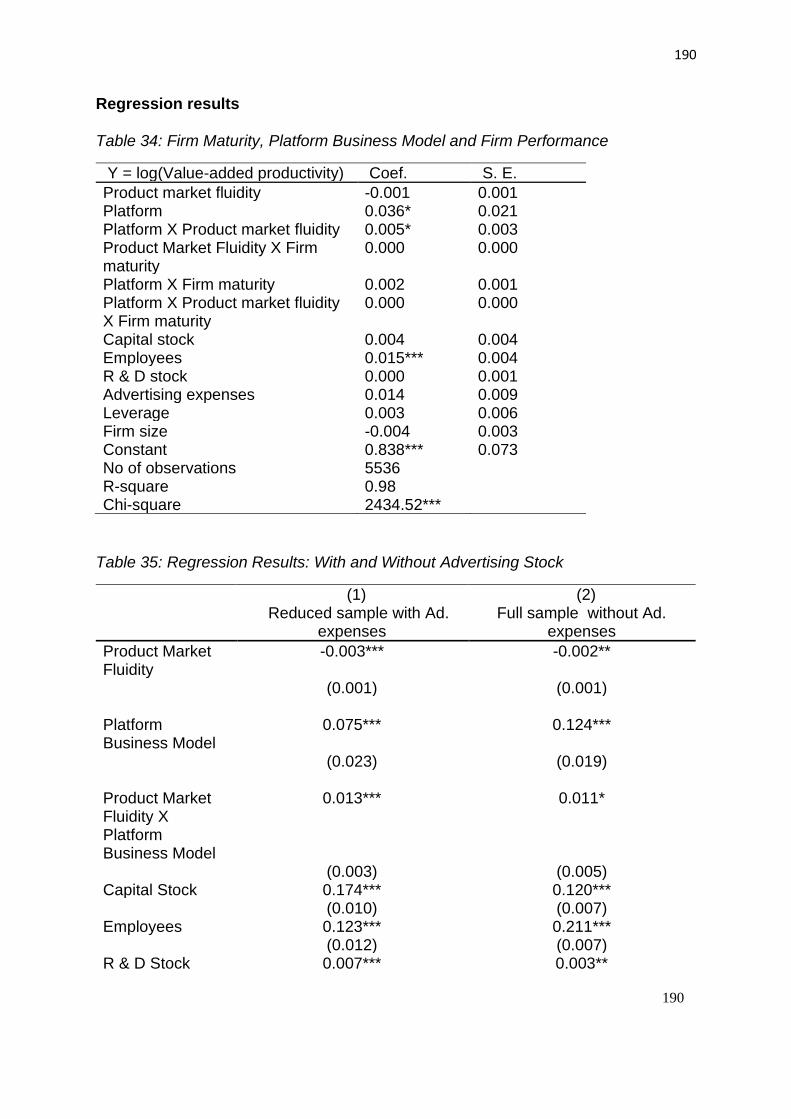
190
190
Regression results
Table 34: Firm Maturity, Platform Business Model and Firm Performance
Y = log(Value-added productivity) Coef. S. E.
Product market fluidity -0.001 0.001 Platform 0.036* 0.021 Platform X Product market fluidity 0.005* 0.003 Product Market Fluidity X Firm maturity
0.000 0.000
Platform X Firm maturity 0.002 0.001 Platform X Product market fluidity X Firm maturity
0.000 0.000
Capital stock 0.004 0.004 Employees 0.015*** 0.004 R & D stock 0.000 0.001 Advertising expenses 0.014 0.009 Leverage 0.003 0.006 Firm size -0.004 0.003 Constant 0.838*** 0.073 No of observations 5536 R-square 0.98 Chi-square 2434.52***
Table 35: Regression Results: With and Without Advertising Stock
(1) (2) Reduced sample with Ad.
expenses Full sample without Ad.
expenses
Product Market Fluidity
-0.003*** -0.002**
(0.001) (0.001) Platform Business Model
0.075*** 0.124***
(0.023) (0.019) Product Market Fluidity X Platform Business Model
0.013*** 0.011*
(0.003) (0.005) Capital Stock 0.174*** 0.120*** (0.010) (0.007) Employees 0.123*** 0.211*** (0.012) (0.007) R & D Stock 0.007*** 0.003**
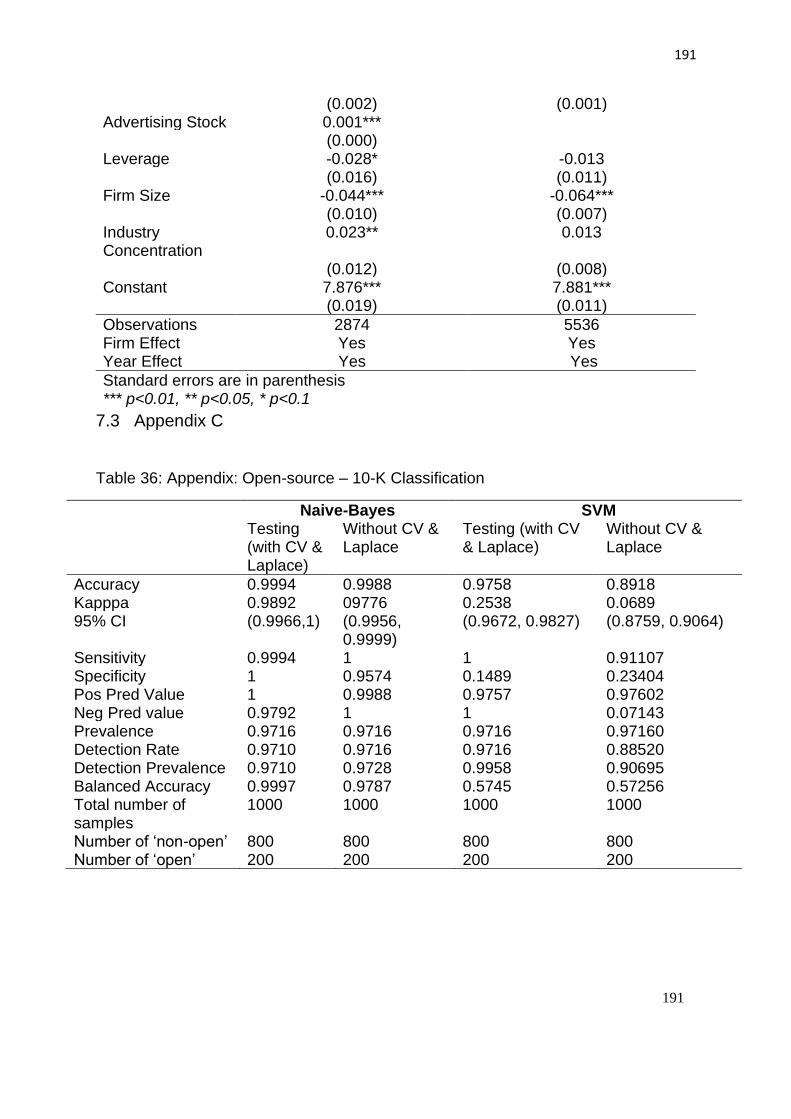
191
191
(0.002) (0.001) Advertising Stock 0.001*** (0.000) Leverage -0.028* -0.013 (0.016) (0.011) Firm Size -0.044*** -0.064*** (0.010) (0.007) Industry Concentration
0.023** 0.013
(0.012) (0.008) Constant 7.876*** 7.881*** (0.019) (0.011)
Observations 2874 5536 Firm Effect Yes Yes Year Effect Yes Yes
Standard errors are in parenthesis *** p<0.01, ** p<0.05, * p<0.1
7.3 Appendix C
Table 36: Appendix: Open-source – 10-K Classification
Naive-Bayes SVM Testing (with CV & Laplace)
Without CV & Laplace
Testing (with CV & Laplace)
Without CV & Laplace
Accuracy 0.9994 0.9988 0.9758 0.8918 Kapppa 0.9892 09776 0.2538 0.0689 95% CI (0.9966,1) (0.9956,
0.9999) (0.9672, 0.9827) (0.8759, 0.9064)
Sensitivity 0.9994 1 1 0.91107 Specificity 1 0.9574 0.1489 0.23404 Pos Pred Value 1 0.9988 0.9757 0.97602 Neg Pred value 0.9792 1 1 0.07143 Prevalence 0.9716 0.9716 0.9716 0.97160 Detection Rate 0.9710 0.9716 0.9716 0.88520 Detection Prevalence 0.9710 0.9728 0.9958 0.90695 Balanced Accuracy 0.9997 0.9787 0.5745 0.57256 Total number of samples
1000 1000 1000 1000
Number of ‘non-open’ 800 800 800 800 Number of ‘open’ 200 200 200 200

192
192
Table 37: Appendix: firms with homepage on GitHub 2017
2U INC DXC TECHNOLOGY CO MEDIDATA SOLUTIONS INC
ACTIVISION BLIZZARD INC EBAY INC MEET GROUP INC (THE)
ADOBE INC EGAIN CORP MELLANOX TECHNOLOGIES LTD ADVANCED MICRO DEVICES ELBIT SYSTEMS LTD MERCADOLIBRE INC AKAMAI TECHNOLOGIES INC ELECTRONIC ARTS INC MICROCHIP TECHNOLOGY INC
ALIBABA GROUP HLDG ELLIE MAE INC MICRON TECHNOLOGY INC
ALPHABET INC ENDURANCE INTL GRP HLDGS INC MICROSEMI CORP
ALTERYX INC ENPHASE ENERGY INC MICROSOFT CORP
AMDOCS EPAM SYSTEMS INC MICROSTRATEGY INC
ANALOG DEVICES ETSY INC MINDBODY INC
APPFOLIO INC EVERBRIDGE INC MIX TELEMATICS LTD
APPIAN CORPORATION EVOLENT HEALTH INC MOBILEIRON INC
APPLE INC EXTREME NETWORKS INC MOBILESMITH INC
APPTIO INC F5 NETWORKS INC MOBIVITY HOLDINGS CORP
ATHENAHEALTH INC FACEBOOK INC MODEL N INC
ATLASSIAN CORP PLC FACTSET RESEARCH SYSTEMS INC MONOTYPE IMAGING HOLDINGS
AUTODESK INC FIREEYE INC MORNINGSTAR INC AUTOMATIC DATA PROCESSING FIRST DATA CORP MOTOROLA SOLUTIONS INC
BAIDU INC FITBIT INC NANTHEALTH INC
BILIBILI INC -ADS FIVE9 INC NATIONAL INSTRUMENTS CORP
BLACKBAUD INC FLIR SYSTEMS INC NETAPP INC
BLACKBERRY LTD FUJITSU LTD NETEASE INC
BLACKLINE INC GARMIN LTD NETSCOUT SYSTEMS INC BOOZ ALLEN HAMILTON HLDG CP GLOBAL PAYMENTS INC NEW RELIC INC BOTTOMLINE TECHNOLOGIES INC GLOBANT SA NOKIA CORP
BOX INC GODADDY INC NORTHROP GRUMMAN CORP
BRIGHTCOVE INC GROUPON INC NUANCE COMMUNICATIONS INC BROADRIDGE FINANCIAL SOLUTNS GRUBHUB INC NUTANIX INC
BSQUARE CORP GUIDEWIRE SOFTWARE INC NVIDIA CORP
CA INC HARRIS CORP NXP SEMICONDUCTORS NV
CANADIAN SOLAR INC HEWLETT PACKARD ENTERPRISE OKTA INC
CARE.COM INC HORTONWORKS INC OMNICELL INC
CASTLIGHT HEALTH INC HUBSPOT INC ON SEMICONDUCTOR CORP
CDK GLOBAL INC IHS MARKIT LTD OPEN TEXT CORP
CDW CORP IMPINJ INC ORACLE CORP
CELESTICA INC INFINEON TECHNOLOGIES AG PAGSEGURO DIGITAL LTD
CERNER CORP INFOSYS LTD PALO ALTO NETWORKS INC
CHECK POINT SOFTWARE INNODATA INC PANDORA MEDIA INC

193
193
TECHN
CIRRUS LOGIC INC INSTRUCTURE INC PAYLOCITY HOLDING CORP
CISCO SYSTEMS INC INTEL CORP PAYPAL HOLDINGS INC
CITRIX SYSTEMS INC INTERNAP CORP PEGASYSTEMS INC
CLOUDERA INC INTL BUSINESS MACHINES CORP PERFICIENT INC
COGNIZANT TECH SOLUTIONS INTUIT INC PERION NETWORK LTD
COMMERCEHUB INC ISIGN SOLUTIONS INC PROGRESS SOFTWARE CORP COMMVAULT SYSTEMS INC IZEA WORLDWIDE INC PROOFPOINT INC
COMSCORE INC JACADA LTD PTC INC
CORELOGIC INC JUNIPER NETWORKS INC PURE STORAGE INC CORNERSTONE ONDEMAND INC KEYW HOLDING CORP QIWI PLC
COSTAR GROUP INC LANTRONIX INC QUALYS INC
COUNTERPATH CORP LEAF GROUP LTD QUMU CORP
COUPA SOFTWARE INC LEIDOS HOLDINGS INC RAPID7 INC
CRAY INC LINE CORP RAYTHEON CO
CREATIVE REALITIES INC LIVEPERSON INC REALPAGE INC CYBERARK SOFTWARE LTD LIVERAMP HOLDINGS INC RED HAT INC CYPRESS SEMICONDUCTOR CORP
LOGITECH INTERNATIONAL SA RINGCENTRAL INC
DELL TECHNOLOGIES INC LUXOFT HOLDING INC ROSETTA STONE INC
DESPEGAR COM CORP MARVELL TECHNOLOGY GROUP LTD RUBICON PROJECT INC
DSP GROUP INC MAXIM INTEGRATED PRODUCTS SABRE CORP
SAILPOINT TECHNO HLDG YELP INC TENABLE HOLDINGS INC
SALESFORCE.COM INC TUCOWS INC THESTREET INC
SAP SE TWILIO INC THOMSON-REUTERS CORP SEAGATE TECHNOLOGY PLC TWITTER INC TRAVELPORT WORLDWIDE LTD
SECUREWORKS CORP UBIQUITI NETWORKS INC TREND MICRO INC
SERVICENOW INC ULTIMATE SOFTWARE GROUP INC TRIPADVISOR INC
SHARPSPRING INC VARONIS SYSTEMS INC STMICROELECTRONICS NV
SHOPIFY INC VERISIGN INC SYMANTEC CORP
SHOTSPOTTER INC VERITONE INC SYNACOR INC
SHUTTERSTOCK INC VIASAT INC SYNCHRONOSS TECHNOLOGIES SMITH MICRO SOFTWARE INC VIAVI SOLUTIONS INC TABLEAU SOFTWARE INC
SOCKET MOBILE INC VMWARE INC -CL A TECHTARGET INC
SOGOU INC WEIBO CORP YEXT INC
SOHU COM LTD WESTERN DIGITAL CORP ZEBRA TECHNOLOGIES CP -CL A
SONIC FOUNDRY INC WIPRO LTD ZEDGE INC
SPARK NETWORKS SE WIX.COM LTD ZENDESK INC
SPINDLE INC WORKDAY INC ZILLOW GROUP INC
SPLUNK INC WORKIVA INC ZYNGA INC

194
194
SPOTIFY TECHNOLOGY SA XILINX INC SQUARE INC
SPS COMMERCE INC XO GROUP INC
Table 38: Appendix: Firms not engaged in open source innovation (the year 2017)
TECH DATA CORP NET 1 UEPS TECHNOLOGIES INC MARIN SOFTWARE INC
TELEFONAKTIEBOLAGET LM ERICS
SOLAREDGE TECHNOLOGIES INC REMARK HOLDINGS INC
QUALCOMM INC INTERXION HOLDING NV ZIX CORP
SYNNEX CORP OCLARO INC NETSOL TECHNOLOGIES INC
BROADCOM INC SEMTECH CORP SUPPORT.COM INC
TEXAS INSTRUMENTS INC COMTECH TELECOMMUN O2MICRO INTERNATIONAL LTD
BOOKING HOLDINGS INC 21VIANET GROUP INC TRANSACT TECHNOLOGIES INC
L3 TECHNOLOGIES INC CALIX INC ADESTO TECHNOLOGIES CORP
FIDELITY NATIONAL INFO SVCS ASPEN TECHNOLOGY INC ASURE SOFTWARE INC
QWEST CORP WAYSIDE TECHNOLOGY GROUP INC AMERI HOLDINGS INC
ALLIANCE DATA SYSTEMS CORP STAMPS.COM INC FINJAN HOLDINGS INC
INSIGHT ENTERPRISES INC MONOLITHIC POWER SYSTEMS INC INPIXON
ARRIS INTERNATIONAL PLC INOVALON HOLDINGS INC FRANKLIN WIRELESS CORP
CONDUENT INC PHOTRONICS INC WIRELESS TELECOM GROUP INC
FISERV INC STEEL CONNECT INC TELARIA INC SCIENCE APPLICATIONS INTL CP PAYCOM SOFTWARE INC AURORA MOBILE -ADR
CACI INTL INC -CL A POWER INTEGRATIONS INC DAILY JOURNAL CORP
DIEBOLD NIXDORF INC SEA LTD - ADR RADCOM COMMSCOPE HOLDING CO INC MAXLINEAR INC BK TECHNOLOGIES CORP
AMKOR TECHNOLOGY INC EVERTEC INC NETLIST INC
WORLDPAY INC MERCURY SYSTEMS INC INTERMOLECULAR INC
JINKOSOLAR HOLDING CO LATTICE SEMICONDUCTOR CORP DATAWATCH CORP
SCANSOURCE INC ACACIA COMMUNICATIONS INC
EVERSPIN TECHNOLOGIES INC
SKYWORKS SOLUTIONS INC ALPHA AND OMEGA SEMICONDUCTR IMMERSION CORP
IAC/INTERACTIVECORP APPLIED OPTOELECTRONICS INC GLOBALSCAPE INC
TRINET GROUP INC XPERI CORPORATION MTBC INC

195
195
SCIENTIFIC GAMES CORP EBIX INC MAM SOFTWARE GROUP INC
UNISYS CORP CALAMP CORP CLPS INC
QORVO INC RIBBON COMMUNICATIONS INC CYREN LTD
FIRST SOLAR INC DAQO NEW ENERGY CORP NVE CORP
GENPACT LTD HARMONIC INC GAIA INC
CIENA CORP POINTS INTERNATIONAL LTD FALCONSTOR SOFTWARE INC
SYNOPSYS INC INPHI CORP KOPIN CORP
IQIYI INC -ADR ALARM.COM HOLDINGS INC ASTEA INTERNATIONAL INC
TELEDYNE TECHNOLOGIES INC NIC INC RADA ELECTRONIC INDS FLEETCOR TECHNOLOGIES INC UNIVERSAL DISPLAY CORP PEERSTREAM INC
ZAYO GROUP HOLDINGS INC PFSWEB INC SIMULATIONS PLUS INC
INTELSAT SA ALJ REGIONAL HOLDINGS INC BLONDER TONGUE LABS INC
ESTERLINE TECHNOLOGIES CORP CERAGON NETWORKS LTD ON TRACK INNOVATIONS CADENCE DESIGN SYSTEMS INC QUOTIENT TECHNOLOGY INC NTN BUZZTIME INC
ATENTO SA TRADE DESK INC MICROPAC INDUSTRIES INC
MANTECH INTL CORP QAD INC PARK CITY GROUP INC
ECHOSTAR CORP COMPUTER PROGRAMS & SYSTEMS MIND CTI LTD
SUNPOWER CORP QUINSTREET INC AWARE INC ALLSCRIPTS HEALTHCARE SOLTNS AMBARELLA INC
CODA OCTOPUS GROUP INC
TAKE-TWO INTERACTIVE SFTWR GLU MOBILE INC
INNOVATIVE SOLTNS & SUPP INC
SYNAPTICS INC NEOPHOTONICS CORP BRIDGELINE DIGITAL INC SS&C TECHNOLOGIES HLDGS INC
GILAT SATELLITE NETWORKS LTD
WHERE FOOD COMES FROM INC
YANDEX N.V. INFORMATION SERVICES GROUP PAYSIGN INC
ARISTA NETWORKS INC SAPIENS INTERNATIONAL CORP GLOWPOINT INC
SYKES ENTERPRISES INC SERVICESOURCE INTL INC PASSUR AEROSPACE INC
SINA CORP BENEFITFOCUS INC PARETEUM CORP LIBERTY TRIPADVISOR HOLDINGS CHEGG INC
LIBERTY BROADBAND CORP
HENRY (JACK) & ASSOCIATES CPI CARD GROUP INC ISSUER DIRECT CORP
FORTINET INC VISHAY PRECISION GROUP INC OPTIMIZERX CORP
CREE INC HEALTHSTREAM INC QUICKLOGIC CORP
IPG PHOTONICS CORP DASAN ZHONE SOLUTIONS INC GIGAMEDIA LTD

196
196
NETGEAR INC CARBONITE INC SPECTRA7 MICROSYSTEMS INC
TOWER SEMICONDUCTOR LTD AVIAT NETWORKS INC CREXENDO INC BITAUTO HOLDINGS LTD -ADR
ITURAN LOCATION & CONTROL NEONODE INC
NICE LTD RIMINI STREET INC QUOTEMEDIA INC
MATCH GROUP INC A10 NETWORKS INC INTELLIGENT SYSTEM CORP
MOMO INC -ADR HEALTHEQUITY INC SEMILEDS CORP
WEX INC PAR TECHNOLOGY CORP MOSYS INC
TRIVAGO N.V. -ADR ENDAVA PLC -ADR GOLDEN BULL LTD
VERINT SYSTEMS INC JIANPU TECH -ADR INTRUSION INC
J2 GLOBAL INC RADWARE LTD ANDREA ELECTRONICS CORP
ANSYS INC RIGNET INC RUBICON TECHNOLOGY INC
MEDIACOM BROADBAND LLC BOINGO WIRELESS INC IMAGEWARE SYSTEMS INC
BLACK KNIGHT INC XUNLEI LTD -ADS ACORN ENERGY INC
DIODES INC Q2 HOLDINGS INC HOPTO INC
ACI WORLDWIDE INC DIGI INTERNATIONAL INC INTELLICHECK INC
FAIR ISAAC CORP QUANTENNA COMMUNICATIONS INC
DESTINY MEDIA TECHNOLOGIES
DONNELLEY FINANCIAL SOLTNS TELENAV INC
MICROWAVE FILTER CO INC
VONAGE HOLDINGS CORP PROS HOLDINGS INC TRXADE GROUP INC
LOGMEIN INC VOCERA COMMUNICATIONS INC AUDIOEYE INC
LUMENTUM HOLDINGS INC AUDIOCODES LTD POET TECHNOLOGIES INC ELECTRONICS FOR IMAGING INC AEROHIVE NETWORKS INC VIRNETX HOLDING CORP
AUTOHOME INC -ADR AUTOWEB INC CICERO INC
TYLER TECHNOLOGIES INC TABULA RASA HEALTHCARE INC
ELECTRONIC SYSTEM TECH INC
KIMBALL ELECTRONICS INC KINAXIS INC SKKYNET CLOUD SYSTEMS INC
ULTRA CLEAN HOLDINGS INC ZSCALER INC NANO DIMENSION LTD
YIRENDAI LTD -ADR CHANNELADVISOR CORP DRONE AVIATION HOLDING CORP
PLANTRONICS INC CSP INC MARATHON PATENT GROUP INC
GTT COMMUNICATIONS INC EMCORE CORP CIPHERLOC CORP
TIVO CORP TELOS CORP/MD VERITEC INC
SNAP INC OOMA INC DIGERATI TECHNOLOGIES INC
KRATOS DEFENSE & SECURITY ASTRONOVA INC DATASEA INC
CSG SYSTEMS INTL INC TRAVELZOO ATOMERA INC
EXLSERVICE HOLDINGS INC PLUG POWER INC KIDOZ INC
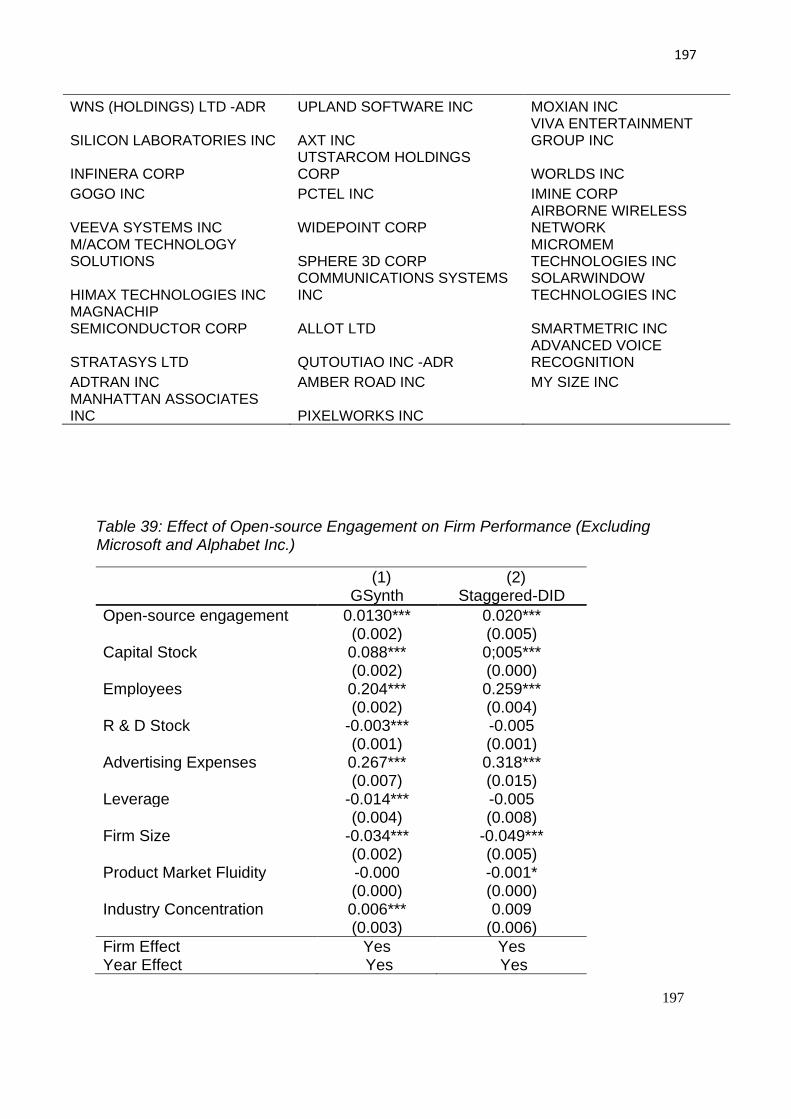
197
197
WNS (HOLDINGS) LTD -ADR UPLAND SOFTWARE INC MOXIAN INC
SILICON LABORATORIES INC AXT INC VIVA ENTERTAINMENT GROUP INC
INFINERA CORP UTSTARCOM HOLDINGS CORP WORLDS INC
GOGO INC PCTEL INC IMINE CORP
VEEVA SYSTEMS INC WIDEPOINT CORP AIRBORNE WIRELESS NETWORK
M/ACOM TECHNOLOGY SOLUTIONS SPHERE 3D CORP
MICROMEM TECHNOLOGIES INC
HIMAX TECHNOLOGIES INC COMMUNICATIONS SYSTEMS INC
SOLARWINDOW TECHNOLOGIES INC
MAGNACHIP SEMICONDUCTOR CORP ALLOT LTD SMARTMETRIC INC
STRATASYS LTD QUTOUTIAO INC -ADR ADVANCED VOICE RECOGNITION
ADTRAN INC AMBER ROAD INC MY SIZE INC MANHATTAN ASSOCIATES INC PIXELWORKS INC
Table 39: Effect of Open-source Engagement on Firm Performance (Excluding Microsoft and Alphabet Inc.)
(1) (2) GSynth Staggered-DID
Open-source engagement 0.0130*** 0.020*** (0.002) (0.005) Capital Stock 0.088*** 0;005*** (0.002) (0.000) Employees 0.204*** 0.259*** (0.002) (0.004) R & D Stock -0.003*** -0.005 (0.001) (0.001) Advertising Expenses 0.267*** 0.318*** (0.007) (0.015) Leverage -0.014*** -0.005 (0.004) (0.008) Firm Size -0.034*** -0.049*** (0.002) (0.005) Product Market Fluidity -0.000 -0.001* (0.000) (0.000) Industry Concentration 0.006*** 0.009 (0.003) (0.006)
Firm Effect Yes Yes Year Effect Yes Yes
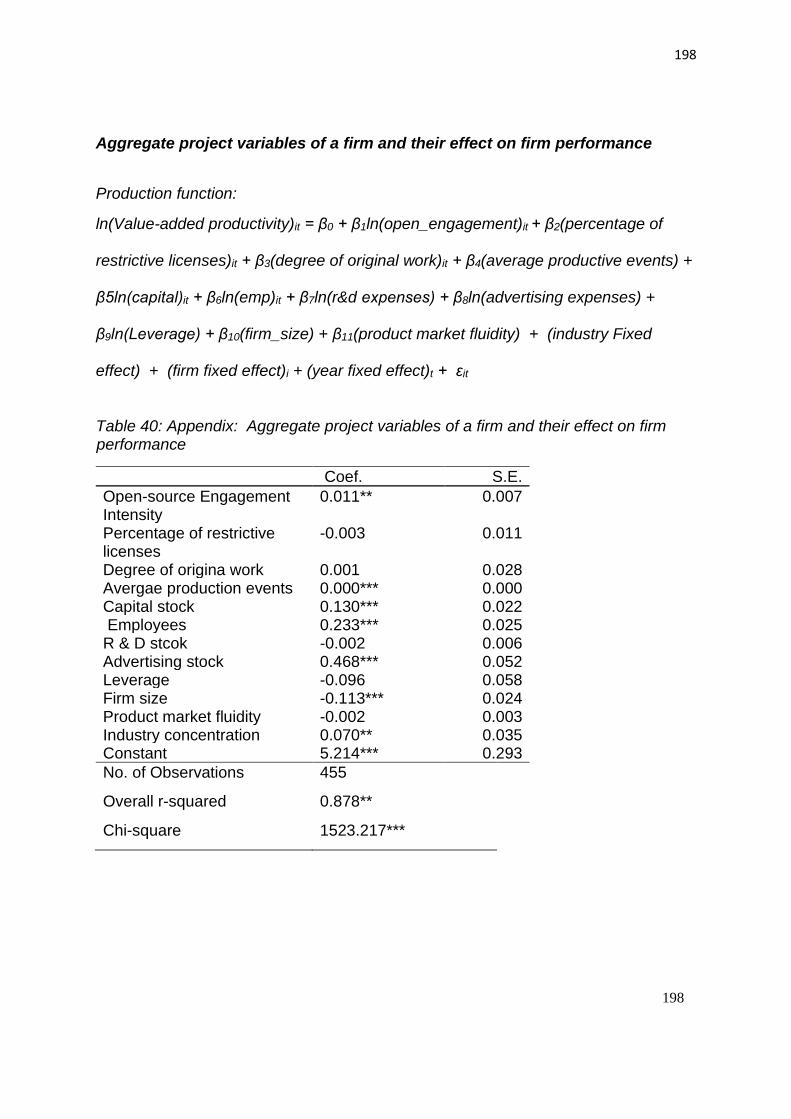
198
198
Aggregate project variables of a firm and their effect on firm performance
Production function:
ln(Value-added productivity)it = β0 + β1ln(open_engagement)it + β2(percentage of
restrictive licenses)it + β3(degree of original work)it + β4(average productive events) +
β5ln(capital)it + β6ln(emp)it + β7ln(r&d expenses) + β8ln(advertising expenses) +
β9ln(Leverage) + β10(firm_size) + β11(product market fluidity) + (industry Fixed
effect) + (firm fixed effect)i + (year fixed effect)t + εit
Table 40: Appendix: Aggregate project variables of a firm and their effect on firm performance
Coef. S.E.
Open-source Engagement Intensity
0.011** 0.007
Percentage of restrictive licenses
-0.003 0.011
Degree of origina work 0.001 0.028 Avergae production events 0.000*** 0.000 Capital stock 0.130*** 0.022 Employees 0.233*** 0.025 R & D stcok -0.002 0.006 Advertising stock 0.468*** 0.052 Leverage -0.096 0.058 Firm size -0.113*** 0.024 Product market fluidity -0.002 0.003 Industry concentration 0.070** 0.035 Constant 5.214*** 0.293
No. of Observations 455
Overall r-squared 0.878**
Chi-square 1523.217***
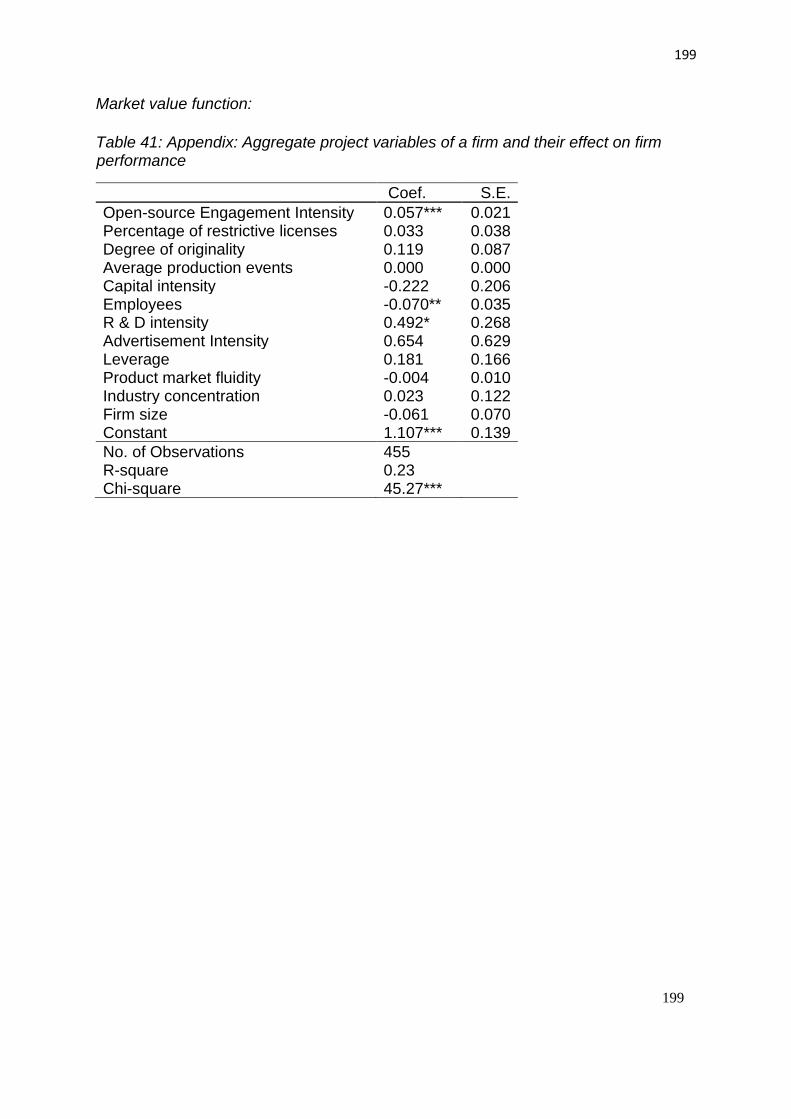
199
199
Market value function:
Table 41: Appendix: Aggregate project variables of a firm and their effect on firm performance
Coef. S.E.
Open-source Engagement Intensity 0.057*** 0.021 Percentage of restrictive licenses 0.033 0.038 Degree of originality 0.119 0.087 Average production events 0.000 0.000 Capital intensity -0.222 0.206 Employees -0.070** 0.035 R & D intensity 0.492* 0.268 Advertisement Intensity 0.654 0.629 Leverage 0.181 0.166 Product market fluidity -0.004 0.010 Industry concentration 0.023 0.122 Firm size -0.061 0.070 Constant 1.107*** 0.139
No. of Observations 455 R-square 0.23 Chi-square 45.27***

200
200