prof. paulo seleghim jr. universidade de são paulo
TRANSCRIPT
Energy Planning and Investments in Brazil
Prof. Paulo Seleghim Jr.
Universidade de São Paulo
LBE5010 Renewable Energies and Energy Planning
What is energy planning ?

Different perspectives, different
meanings...

“Strategies for the development
of local, regional, national and
global energy systems…”
Different perspectives, different
meanings...
Case studies:
A plan for fostering social and economical developments in
Piauí/Brazil (energy investments portfolio)
Multiobjective optimization of 1G2G sugarcane mill integrated to
an oxyfuel boiler for the production of scCO2
Energetic optimization and rationalization at the production and
distribution of water in São Carlos/ SP - Brazil
Energy planning strategies may involve:
“The evolution of energy systems is slow
(markets, technologies, regulation, etc.)
and subjected to objective as well as
subjective aspects...”
Fostering / sustainability... “yes, but not in my back yard”
Energy optimization.... “no red ribbons to cut”
Energy rationalization... “make it cheaper”
Three important questions in energy planning:
Growth of supply to meet demands…“Will there be enough
energy to sustain the quality of life for everybody ?”
Energy security... “How susceptible are the energy systems ?”
Climate changes... “The intensive and increasing
consumption of energy will trigger climate changes that
threaten our existence ?”

Growth of supply to meet
demands
Case study: A plan for the fostering of social and
economical developments in Piauí/Brazil (energy
investments portfolio)
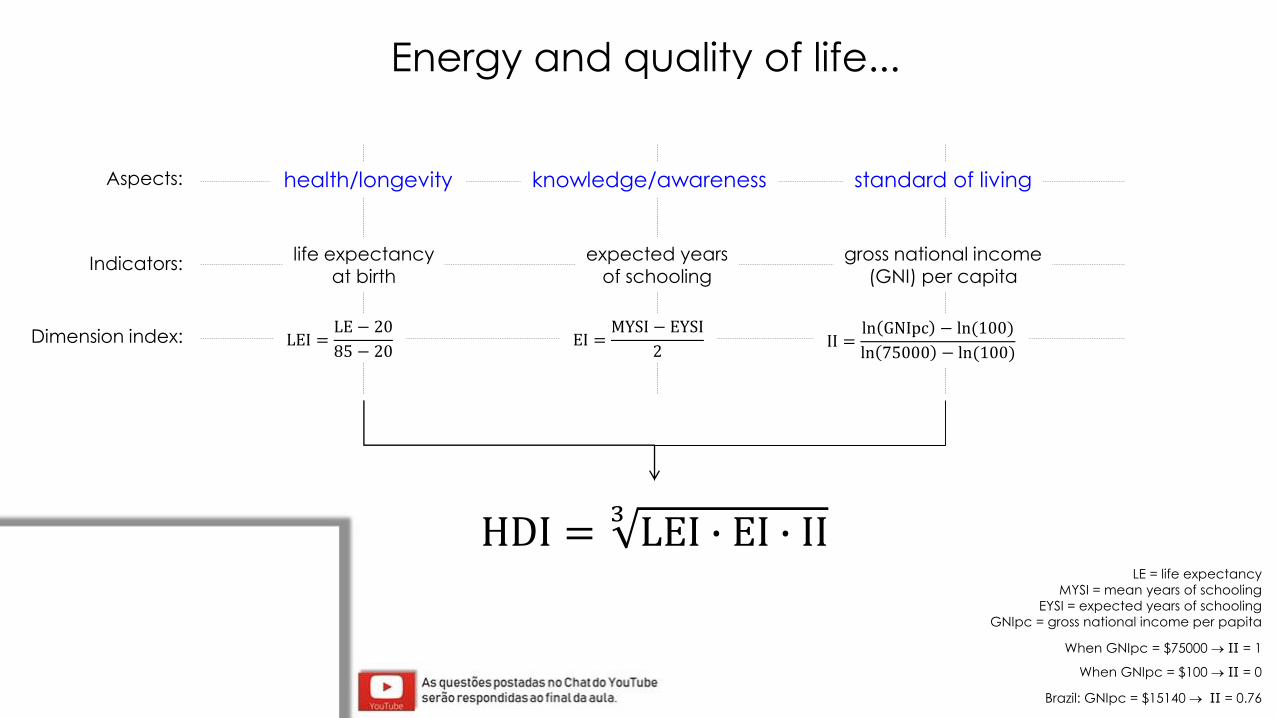
Energy and quality of life...
Aspects:
Indicators:
Dimension index:
life expectancyat birth
expected yearsof schooling
gross national income(GNI) per capita
health/longevity knowledge/awareness standard of living
LEI =LE − 20
85 − 20EI =
MYSI − EYSI
2II =
ln GNIpc − ln(100)
ln 75000 − ln(100)
LE = life expectancy
MYSI = mean years of schooling
EYSI = expected years of schooling
GNIpc = gross national income per papita
When GNIpc = $75000 → II = 1
When GNIpc = $100 → II = 0
Brazil: GNIpc = $15140 → II = 0.76
HDI =3LEI ∙ EI ∙ II
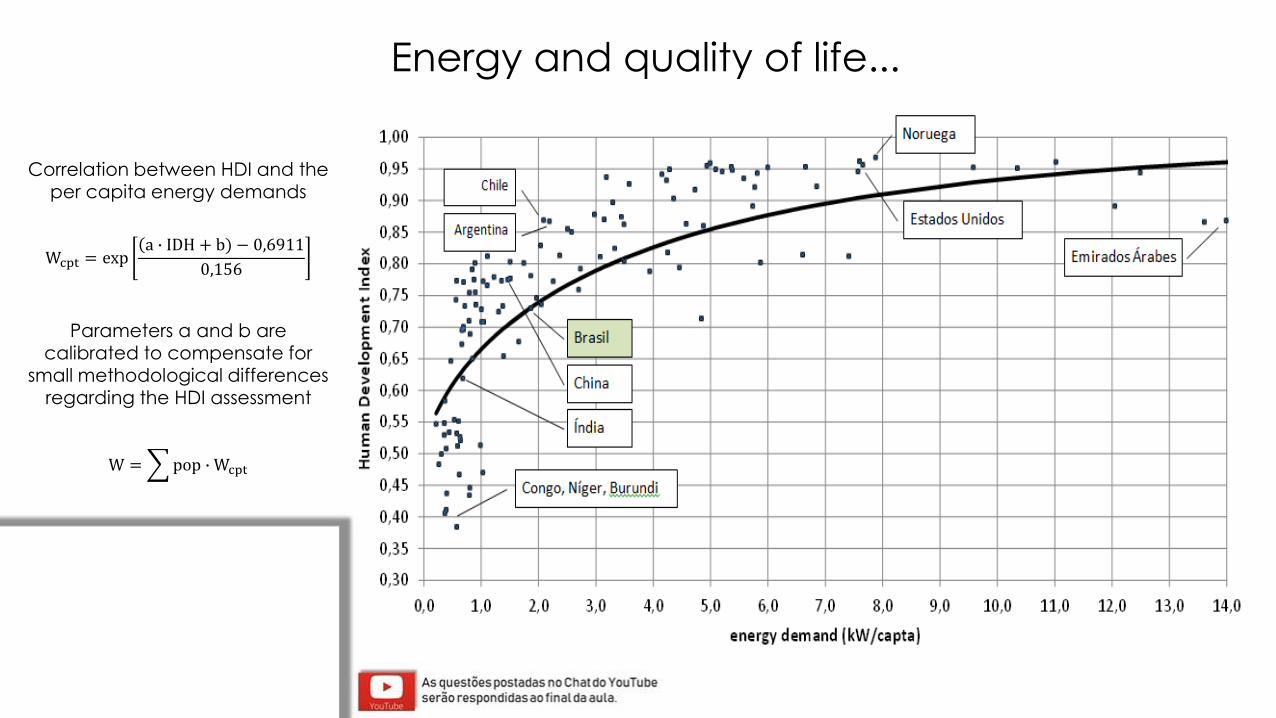
Energy and quality of life...
Wcpt = exp(a ∙ IDH + b) − 0,6911
0,156
Correlation between HDI and the per capita energy demands
W =pop ∙ Wcpt
Parameters a and b are calibrated to compensate for
small methodological differences regarding the HDI assessment
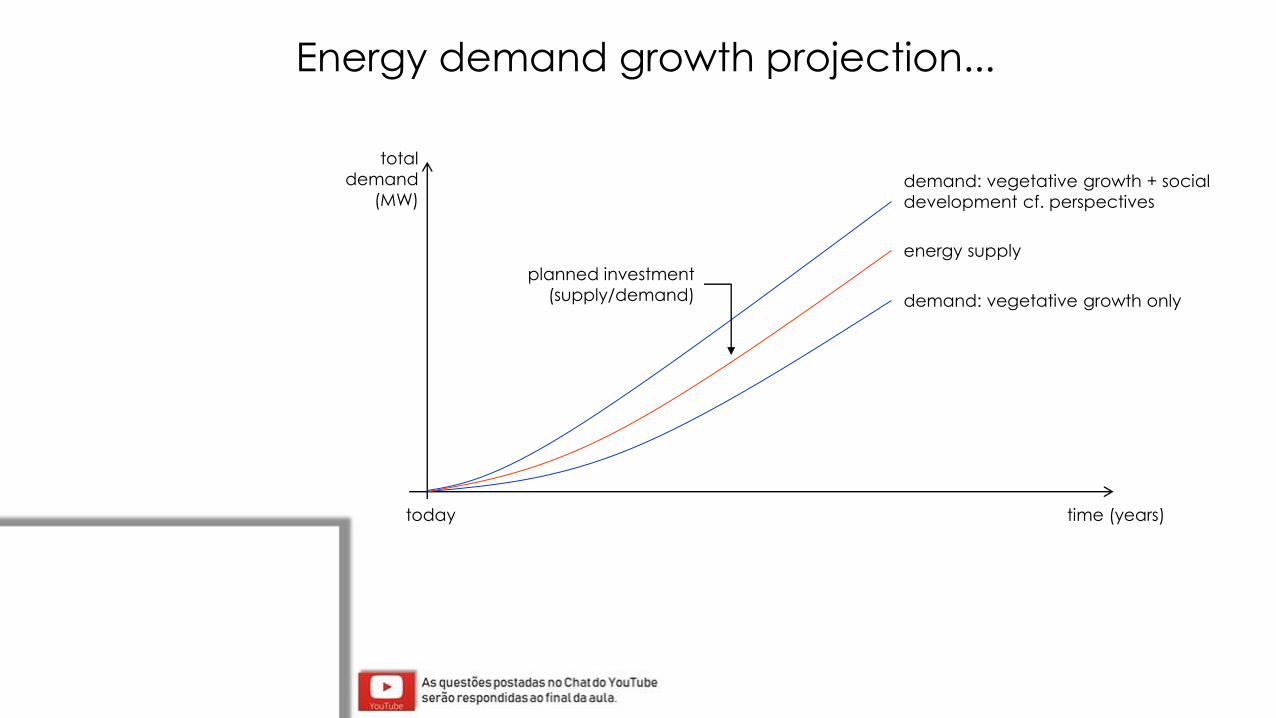
time (years)
demand: vegetative growth + social
development cf. perspectives
energy supply
Energy demand growth projection...
planned investment
(supply/demand)
total
demand
(MW)
demand: vegetative growth only
today
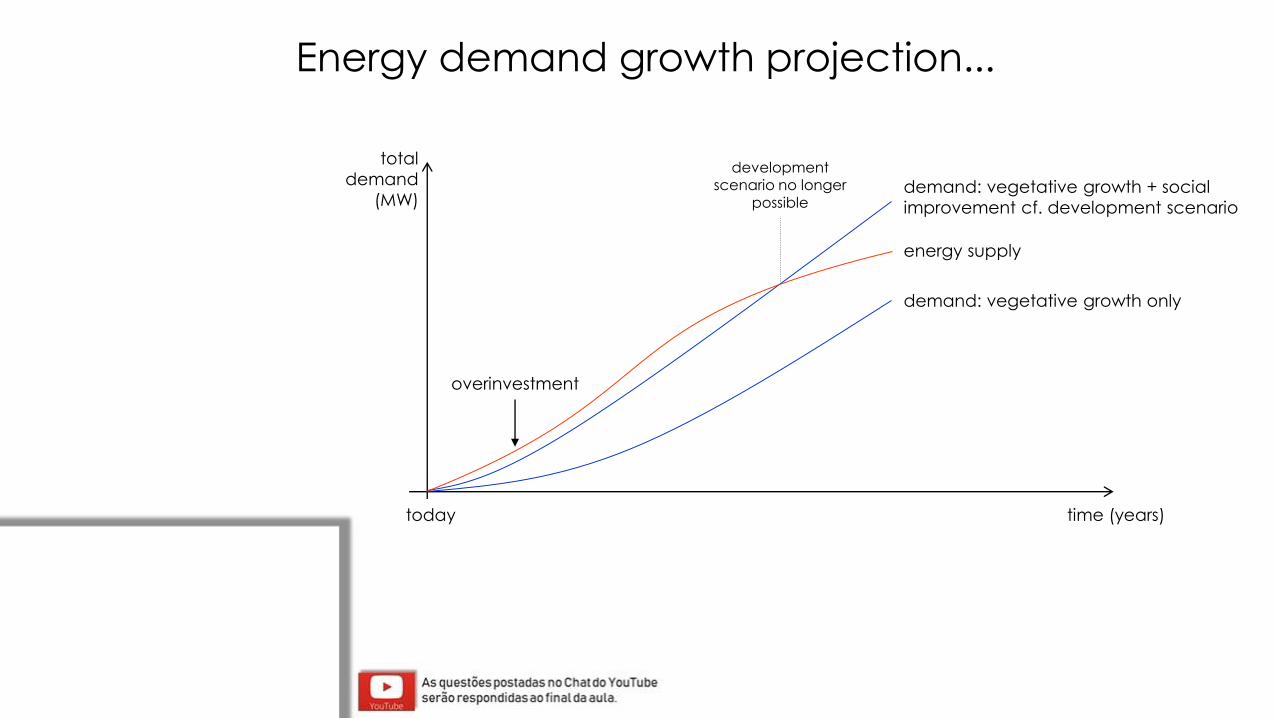
development scenario no longer
possible
overinvestment
demand: vegetative growth + social
improvement cf. development scenario
energy supply
total
demand
(MW)
demand: vegetative growth only
Energy demand growth projection...
time (years)today
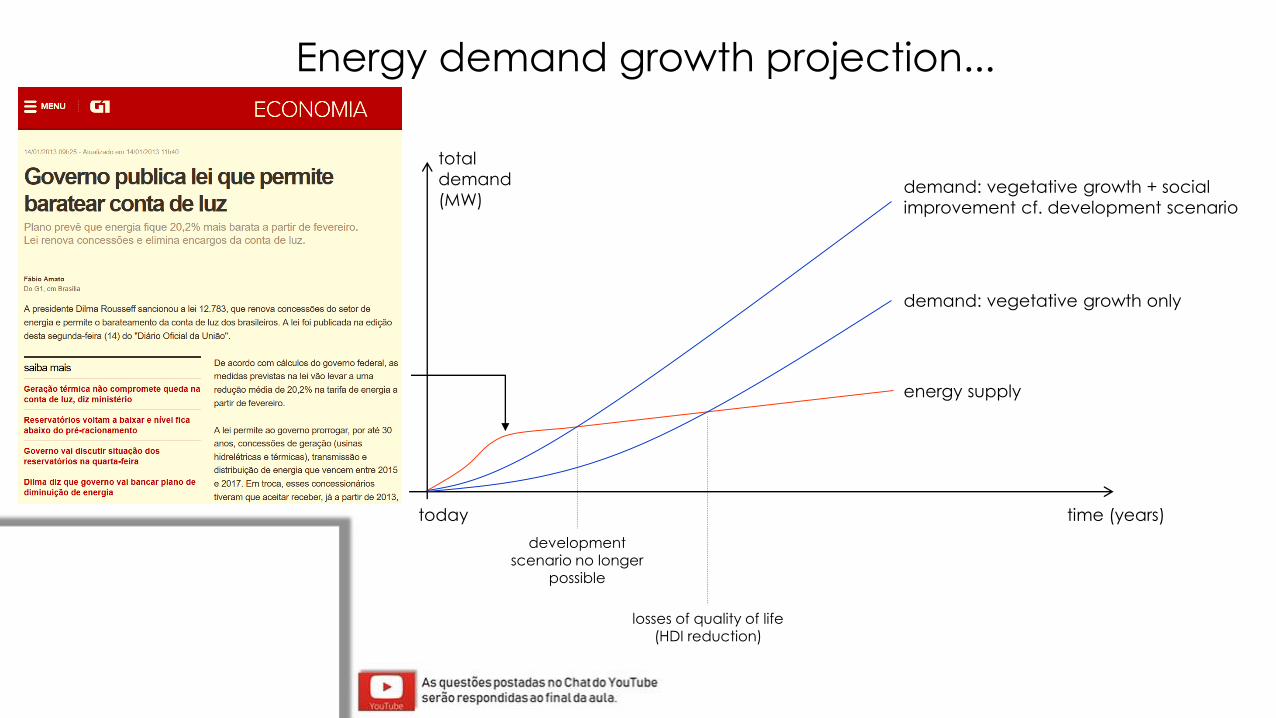
time (years)today
losses of quality of life (HDI reduction)
demand: vegetative growth + social
improvement cf. development scenario
energy supply
total
demand
(MW)
demand: vegetative growth only
Energy demand growth projection...
development scenario no longer
possible
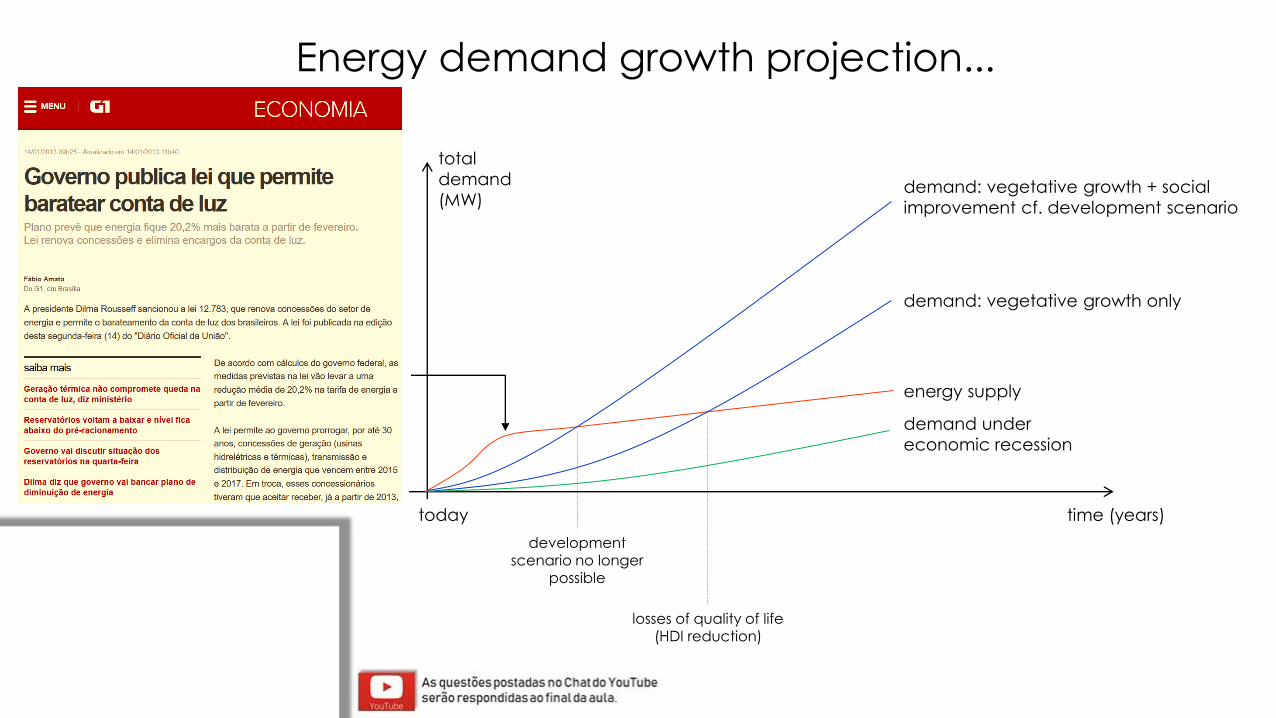
time (years)today
losses of quality of life (HDI reduction)
demand: vegetative growth + social
improvement cf. development scenario
energy supply
total
demand
(MW)
demand: vegetative growth only
Energy demand growth projection...
development scenario no longer
possible
demand under
economic recession
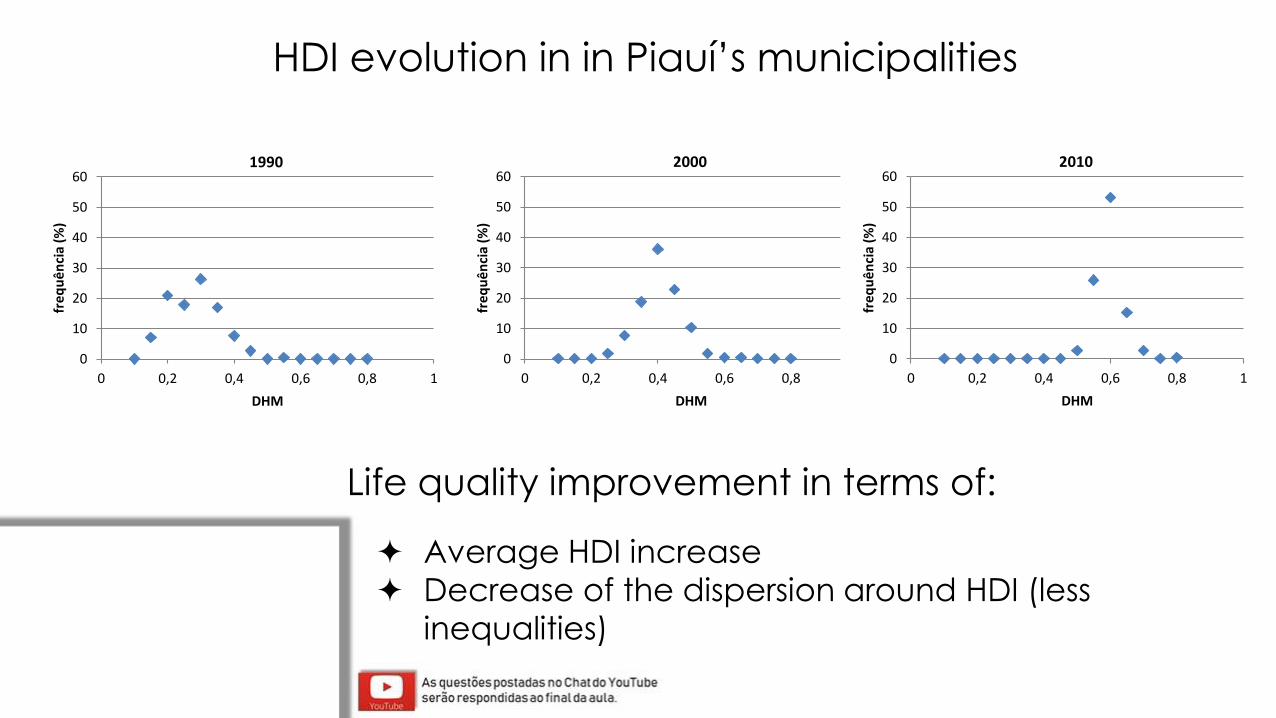
HDI evolution in in Piauí’s municipalities
0
10
20
30
40
50
60
0 0,2 0,4 0,6 0,8 1
fre
qu
ên
cia
(%)
DHM
1990
0
10
20
30
40
50
60
0 0,2 0,4 0,6 0,8 1
fre
qu
ên
cia
(%)
DHM
2000
0
10
20
30
40
50
60
0 0,2 0,4 0,6 0,8 1
fre
qu
ên
cia
(%)
DHM
2010
Life quality improvement in terms of:
Average HDI increase
Decrease of the dispersion around HDI (less
inequalities)
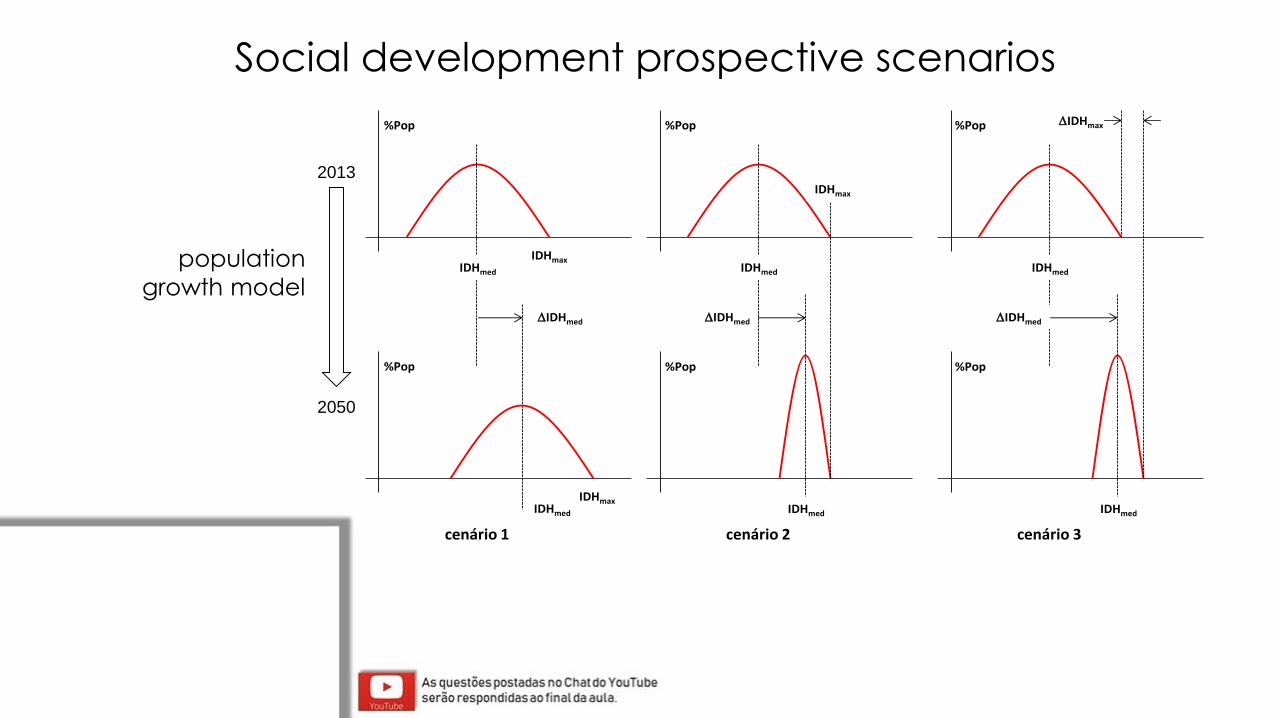
Social development prospective scenarios
%Pop
%Pop
DIDHmed
%Pop
IDHmed
%Pop
IDHmed
IDHmax
%Pop
IDHmed
%Pop
IDHmed
IDHmax
IDHmax
DIDHmed
DIDHmax
IDHmed
IDHmed
DIDHmed
cenário 1 cenário 2 cenário 3
2013
2050
population
growth model
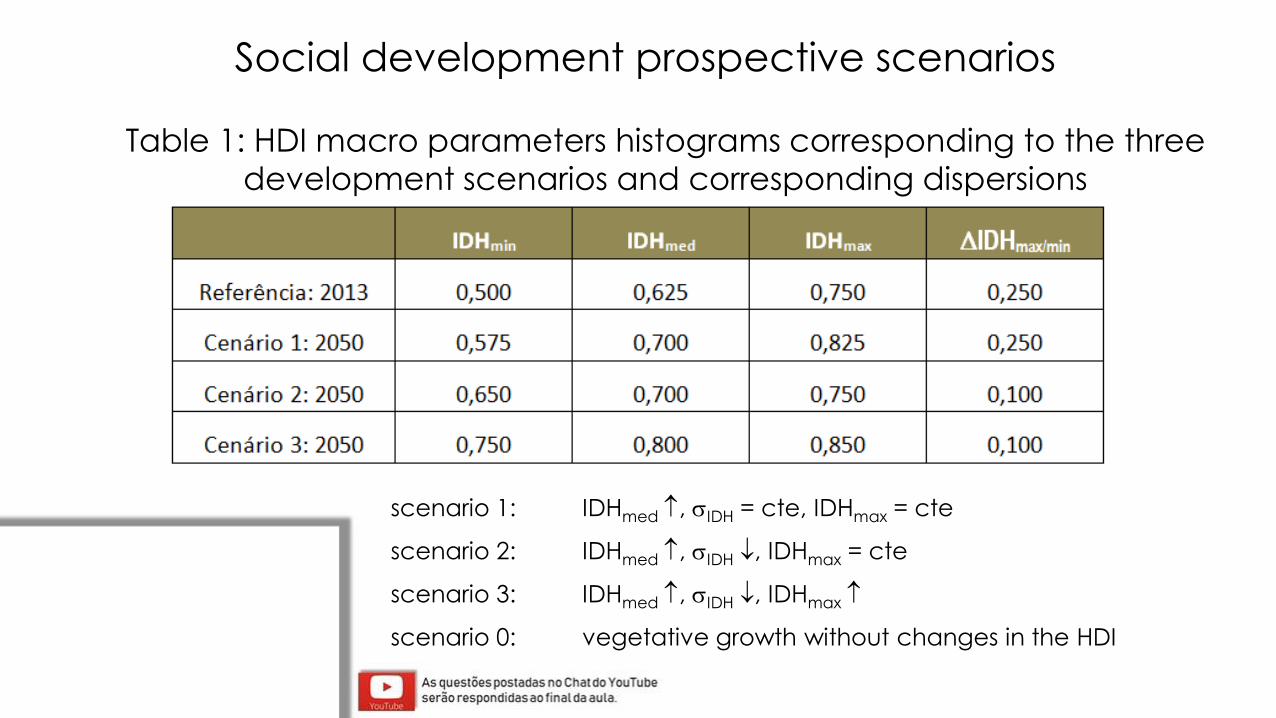
scenario 1: IDHmed , IDH = cte, IDHmax = cte
scenario 2: IDHmed , IDH , IDHmax = cte
scenario 3: IDHmed , IDH , IDHmax
scenario 0: vegetative growth without changes in the HDI
Social development prospective scenarios
Table 1: HDI macro parameters histograms corresponding to the three
development scenarios and corresponding dispersions
0
1 000
2 000
3 000
4 000
5 000
6 000
7 000
8 000
9 000
10 000
2010 2015 2020 2025 2030 2035 2040 2045 2050 2055
de
man
da
tota
l po
r e
ne
rgia
(M
W)
ano referência
scenario 3
scenario 1
scenario 2
scenario 0
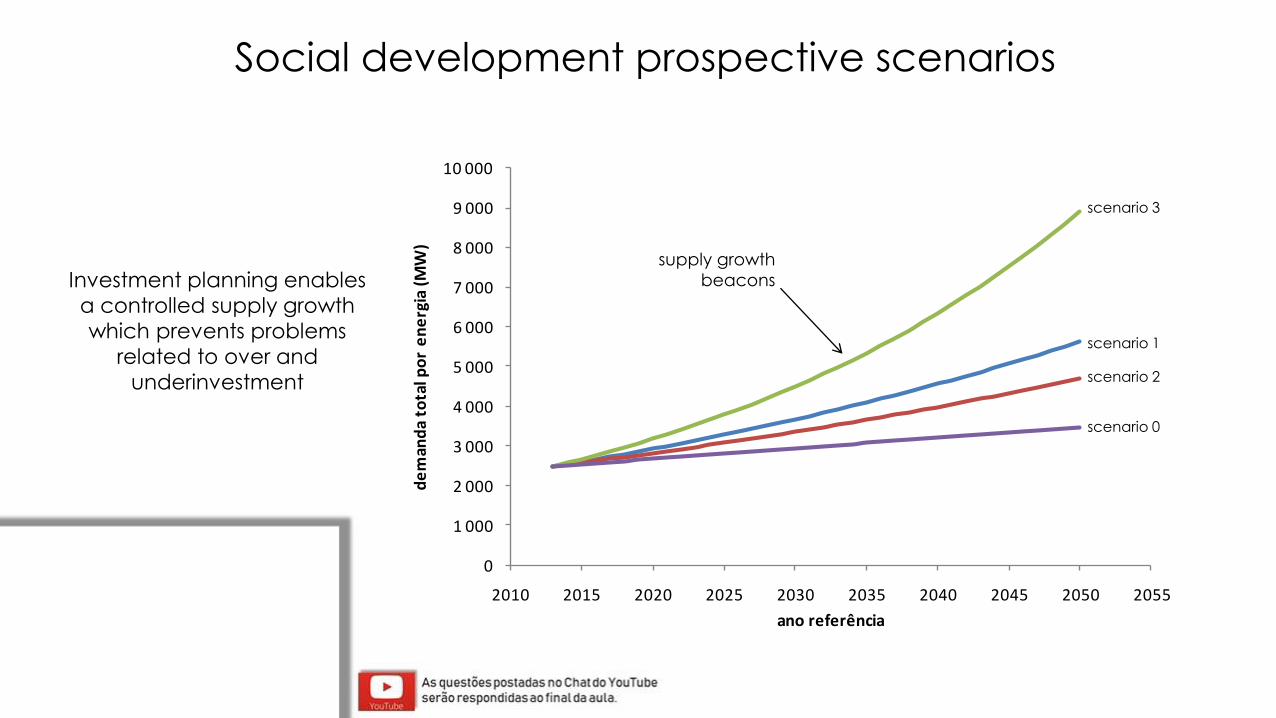
Investment planning enables
a controlled supply growth
which prevents problems
related to over and
underinvestment
supply growth
beacons
Social development prospective scenarios

0
1 000
2 000
3 000
4 000
5 000
6 000
7 000
8 000
9 000
10 000
2010 2015 2020 2025 2030 2035 2040 2045 2050 2055
de
man
da
tota
l po
r e
ne
rgia
(M
W)
ano referência
scenario 3
scenario 1
scenario 2
scenario 0
actual supply
Investment planning enables
a controlled supply growth
which prevents problems
related to over and
underinvestment
Social development prospective scenarios
supply growth
beacons
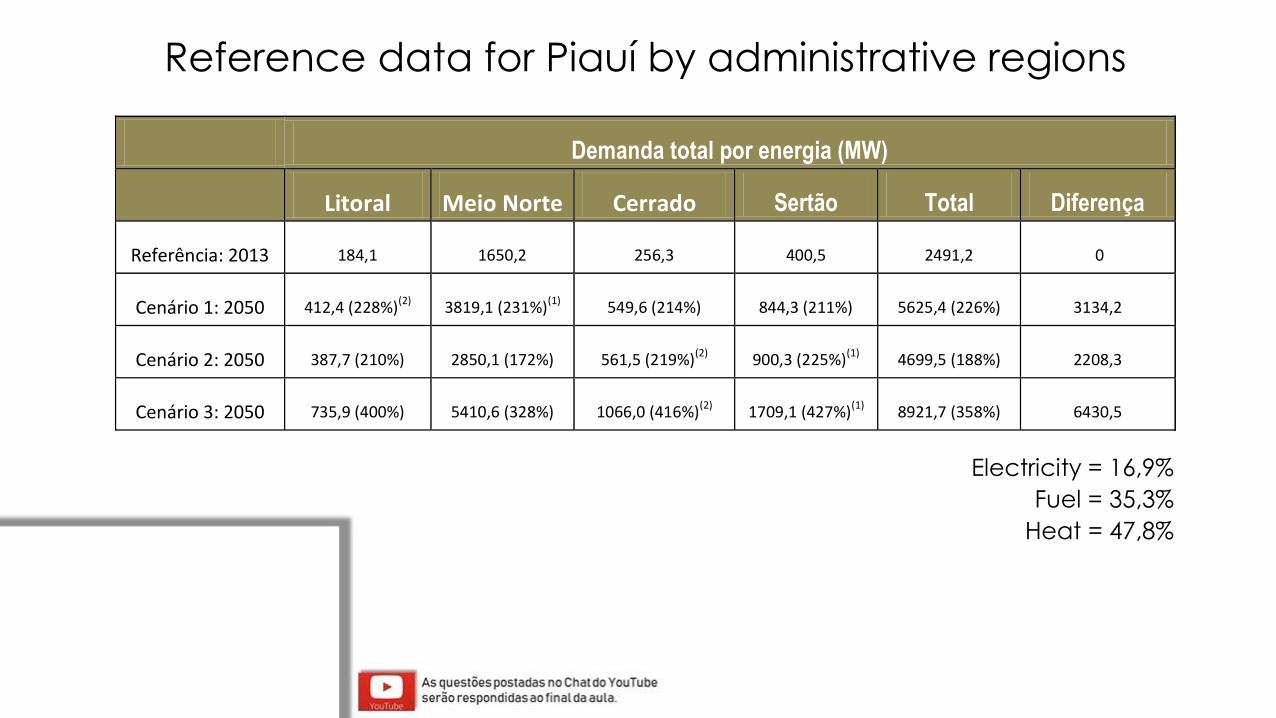
Demanda total por energia (MW)
Litoral Meio Norte Cerrado Sertão Total Diferença
Referência: 2013 184,1 1650,2 256,3 400,5 2491,2 0
Cenário 1: 2050 412,4 (228%)(2) 3819,1 (231%)(1) 549,6 (214%) 844,3 (211%) 5625,4 (226%) 3134,2
Cenário 2: 2050 387,7 (210%) 2850,1 (172%) 561,5 (219%)(2) 900,3 (225%)(1) 4699,5 (188%) 2208,3
Cenário 3: 2050 735,9 (400%) 5410,6 (328%) 1066,0 (416%)(2)
1709,1 (427%)(1)
8921,7 (358%) 6430,5
Electricity = 16,9%
Fuel = 35,3%
Heat = 47,8%
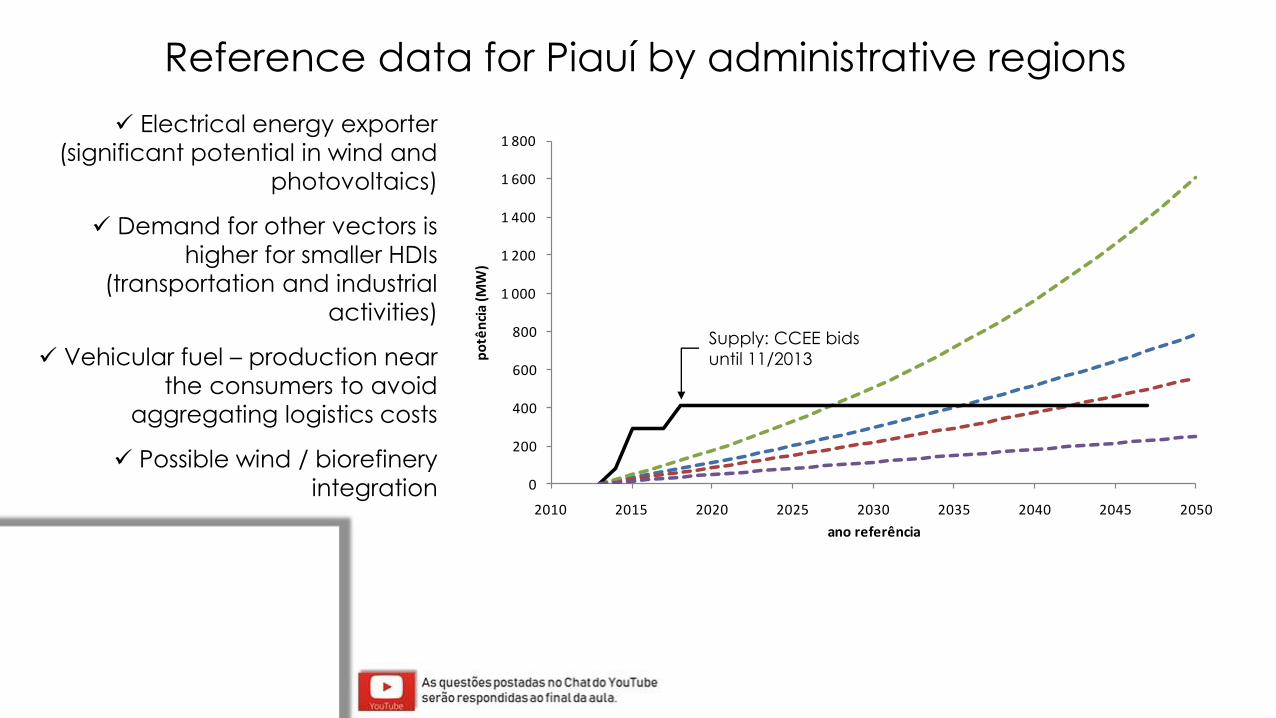
Reference data for Piauí by administrative regions
0
200
400
600
800
1 000
1 200
1 400
1 600
1 800
2010 2015 2020 2025 2030 2035 2040 2045 2050
po
tên
cia
(MW
)
ano referência
Supply: CCEE bids
until 11/2013
✓ Electrical energy exporter
(significant potential in wind and
photovoltaics)
✓ Demand for other vectors is
higher for smaller HDIs
(transportation and industrial
activities)
✓ Vehicular fuel – production near
the consumers to avoid
aggregating logistics costs
✓ Possible wind / biorefinery
integration
Reference data for Piauí by administrative regions

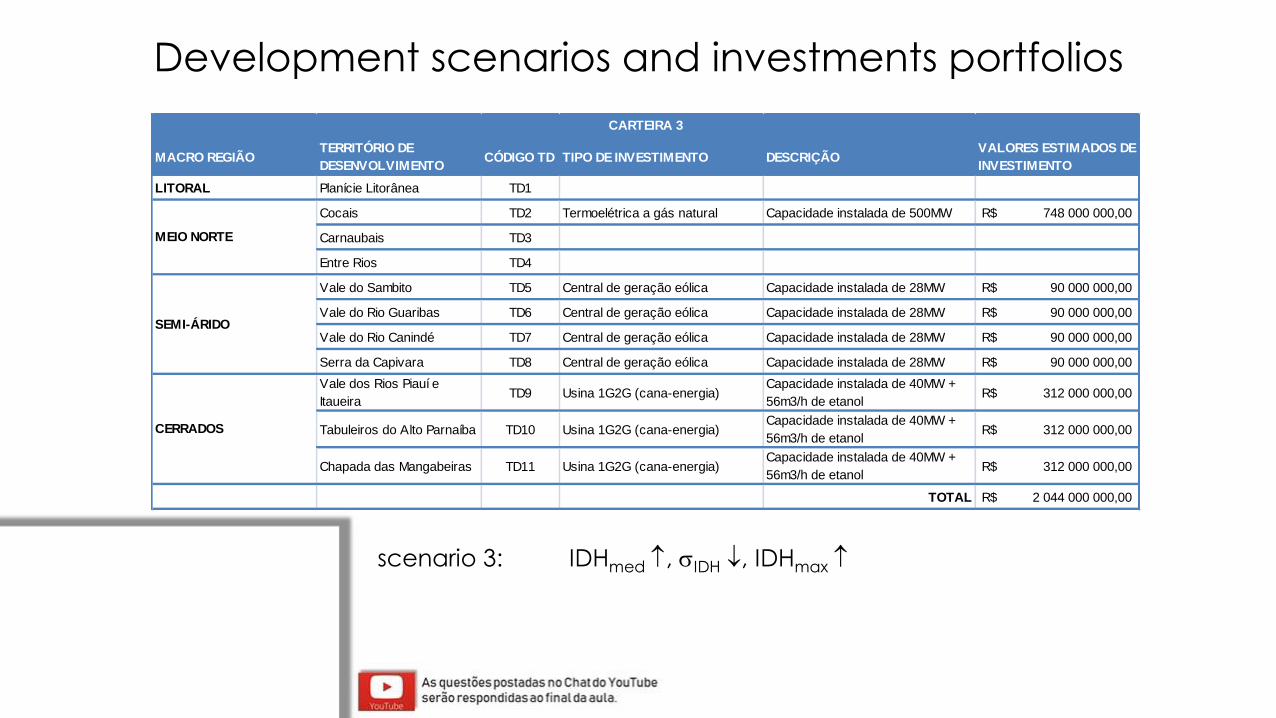
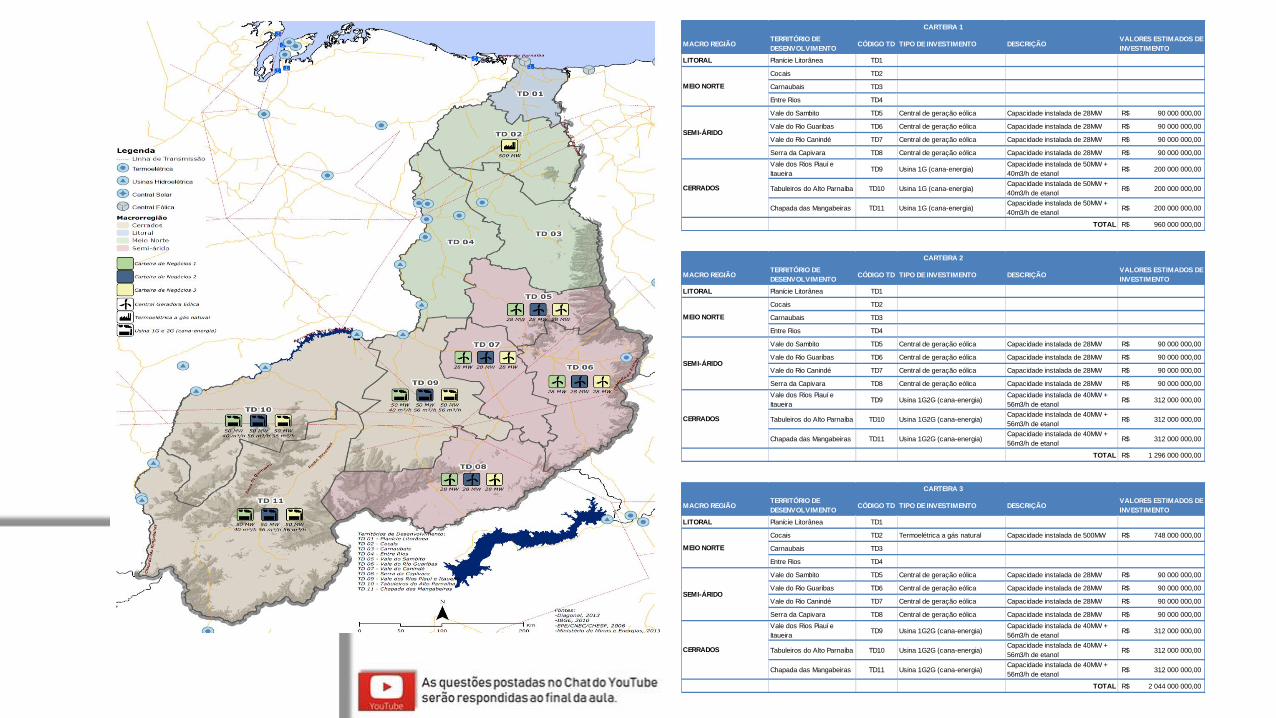
Development scenarios and investments portfolios
MACRO REGIÃOTERRITÓRIO DE
DESENVOLVIMENTOCÓDIGO TD TIPO DE INVESTIMENTO DESCRIÇÃO
VALORES ESTIMADOS DE
INVESTIMENTO
LITORAL Planície Litorânea TD1
Cocais TD2
Carnaubais TD3
Entre Rios TD4
Vale do Sambito TD5 Central de geração eólica Capacidade instalada de 28MW R$ 90 000 000,00
Vale do Rio Guaribas TD6 Central de geração eólica Capacidade instalada de 28MW R$ 90 000 000,00
Vale do Rio Canindé TD7 Central de geração eólica Capacidade instalada de 28MW R$ 90 000 000,00
Serra da Capivara TD8 Central de geração eólica Capacidade instalada de 28MW R$ 90 000 000,00
Vale dos Rios Piauí e
ItaueiraTD9 Usina 1G (cana-energia)
Capacidade instalada de 50MW +
40m3/h de etanol R$ 200 000 000,00
Tabuleiros do Alto Parnaíba TD10 Usina 1G (cana-energia)Capacidade instalada de 50MW +
40m3/h de etanol R$ 200 000 000,00
Chapada das Mangabeiras TD11 Usina 1G (cana-energia)Capacidade instalada de 50MW +
40m3/h de etanol R$ 200 000 000,00
TOTAL R$ 960 000 000,00
MEIO NORTE
SEMI-ÁRIDO
CERRADOS
CARTEIRA 1
scenario 1: IDHmed , IDH = cte, IDHmax = cte

MACRO REGIÃOTERRITÓRIO DE
DESENVOLVIMENTOCÓDIGO TD TIPO DE INVESTIMENTO DESCRIÇÃO
VALORES ESTIMADOS DE
INVESTIMENTO
LITORAL Planície Litorânea TD1
Cocais TD2
Carnaubais TD3
Entre Rios TD4
Vale do Sambito TD5 Central de geração eólica Capacidade instalada de 28MW R$ 90 000 000,00
Vale do Rio Guaribas TD6 Central de geração eólica Capacidade instalada de 28MW R$ 90 000 000,00
Vale do Rio Canindé TD7 Central de geração eólica Capacidade instalada de 28MW R$ 90 000 000,00
Serra da Capivara TD8 Central de geração eólica Capacidade instalada de 28MW R$ 90 000 000,00
Vale dos Rios Piauí e
ItaueiraTD9 Usina 1G2G (cana-energia)
Capacidade instalada de 40MW +
56m3/h de etanol R$ 312 000 000,00
Tabuleiros do Alto Parnaíba TD10 Usina 1G2G (cana-energia)Capacidade instalada de 40MW +
56m3/h de etanol R$ 312 000 000,00
Chapada das Mangabeiras TD11 Usina 1G2G (cana-energia)Capacidade instalada de 40MW +
56m3/h de etanol R$ 312 000 000,00
TOTAL R$ 1 296 000 000,00
MEIO NORTE
SEMI-ÁRIDO
CERRADOS
CARTEIRA 2
scenario 2: IDHmed , IDH , IDHmax = cte
Development scenarios and investments portfolios
MACRO REGIÃOTERRITÓRIO DE
DESENVOLVIMENTOCÓDIGO TD TIPO DE INVESTIMENTO DESCRIÇÃO
VALORES ESTIMADOS DE
INVESTIMENTO
LITORAL Planície Litorânea TD1
Cocais TD2 Termoelétrica a gás natural Capacidade instalada de 500MW R$ 748 000 000,00
Carnaubais TD3
Entre Rios TD4
Vale do Sambito TD5 Central de geração eólica Capacidade instalada de 28MW R$ 90 000 000,00
Vale do Rio Guaribas TD6 Central de geração eólica Capacidade instalada de 28MW R$ 90 000 000,00
Vale do Rio Canindé TD7 Central de geração eólica Capacidade instalada de 28MW R$ 90 000 000,00
Serra da Capivara TD8 Central de geração eólica Capacidade instalada de 28MW R$ 90 000 000,00
Vale dos Rios Piauí e
ItaueiraTD9 Usina 1G2G (cana-energia)
Capacidade instalada de 40MW +
56m3/h de etanol R$ 312 000 000,00
Tabuleiros do Alto Parnaíba TD10 Usina 1G2G (cana-energia)Capacidade instalada de 40MW +
56m3/h de etanol R$ 312 000 000,00
Chapada das Mangabeiras TD11 Usina 1G2G (cana-energia)Capacidade instalada de 40MW +
56m3/h de etanol R$ 312 000 000,00
TOTAL R$ 2 044 000 000,00
SEMI-ÁRIDO
CERRADOS
CARTEIRA 3
MEIO NORTE
scenario 3: IDHmed , IDH , IDHmax
Development scenarios and investments portfolios
MACRO REGIÃOTERRITÓRIO DE
DESENVOLVIMENTOCÓDIGO TD TIPO DE INVESTIMENTO DESCRIÇÃO
VALORES ESTIMADOS DE
INVESTIMENTO
LITORAL Planície Litorânea TD1
Cocais TD2 Termoelétrica a gás natural Capacidade instalada de 500MW R$ 748 000 000,00
Carnaubais TD3
Entre Rios TD4
Vale do Sambito TD5 Central de geração eólica Capacidade instalada de 28MW R$ 90 000 000,00
Vale do Rio Guaribas TD6 Central de geração eólica Capacidade instalada de 28MW R$ 90 000 000,00
Vale do Rio Canindé TD7 Central de geração eólica Capacidade instalada de 28MW R$ 90 000 000,00
Serra da Capivara TD8 Central de geração eólica Capacidade instalada de 28MW R$ 90 000 000,00
Vale dos Rios Piauí e
ItaueiraTD9 Usina 1G2G (cana-energia)
Capacidade instalada de 40MW +
56m3/h de etanol R$ 312 000 000,00
Tabuleiros do Alto Parnaíba TD10 Usina 1G2G (cana-energia)Capacidade instalada de 40MW +
56m3/h de etanol R$ 312 000 000,00
Chapada das Mangabeiras TD11 Usina 1G2G (cana-energia)Capacidade instalada de 40MW +
56m3/h de etanol R$ 312 000 000,00
TOTAL R$ 2 044 000 000,00
SEMI-ÁRIDO
CERRADOS
CARTEIRA 3
MEIO NORTE
MACRO REGIÃOTERRITÓRIO DE
DESENVOLVIMENTOCÓDIGO TD TIPO DE INVESTIMENTO DESCRIÇÃO
VALORES ESTIMADOS DE
INVESTIMENTO
LITORAL Planície Litorânea TD1
Cocais TD2
Carnaubais TD3
Entre Rios TD4
Vale do Sambito TD5 Central de geração eólica Capacidade instalada de 28MW R$ 90 000 000,00
Vale do Rio Guaribas TD6 Central de geração eólica Capacidade instalada de 28MW R$ 90 000 000,00
Vale do Rio Canindé TD7 Central de geração eólica Capacidade instalada de 28MW R$ 90 000 000,00
Serra da Capivara TD8 Central de geração eólica Capacidade instalada de 28MW R$ 90 000 000,00
Vale dos Rios Piauí e
ItaueiraTD9 Usina 1G2G (cana-energia)
Capacidade instalada de 40MW +
56m3/h de etanol R$ 312 000 000,00
Tabuleiros do Alto Parnaíba TD10 Usina 1G2G (cana-energia)Capacidade instalada de 40MW +
56m3/h de etanol R$ 312 000 000,00
Chapada das Mangabeiras TD11 Usina 1G2G (cana-energia)Capacidade instalada de 40MW +
56m3/h de etanol R$ 312 000 000,00
TOTAL R$ 1 296 000 000,00
MEIO NORTE
SEMI-ÁRIDO
CERRADOS
CARTEIRA 2
MACRO REGIÃOTERRITÓRIO DE
DESENVOLVIMENTOCÓDIGO TD TIPO DE INVESTIMENTO DESCRIÇÃO
VALORES ESTIMADOS DE
INVESTIMENTO
LITORAL Planície Litorânea TD1
Cocais TD2
Carnaubais TD3
Entre Rios TD4
Vale do Sambito TD5 Central de geração eólica Capacidade instalada de 28MW R$ 90 000 000,00
Vale do Rio Guaribas TD6 Central de geração eólica Capacidade instalada de 28MW R$ 90 000 000,00
Vale do Rio Canindé TD7 Central de geração eólica Capacidade instalada de 28MW R$ 90 000 000,00
Serra da Capivara TD8 Central de geração eólica Capacidade instalada de 28MW R$ 90 000 000,00
Vale dos Rios Piauí e
ItaueiraTD9 Usina 1G (cana-energia)
Capacidade instalada de 50MW +
40m3/h de etanol R$ 200 000 000,00
Tabuleiros do Alto Parnaíba TD10 Usina 1G (cana-energia)Capacidade instalada de 50MW +
40m3/h de etanol R$ 200 000 000,00
Chapada das Mangabeiras TD11 Usina 1G (cana-energia)Capacidade instalada de 50MW +
40m3/h de etanol R$ 200 000 000,00
TOTAL R$ 960 000 000,00
MEIO NORTE
SEMI-ÁRIDO
CERRADOS
CARTEIRA 1
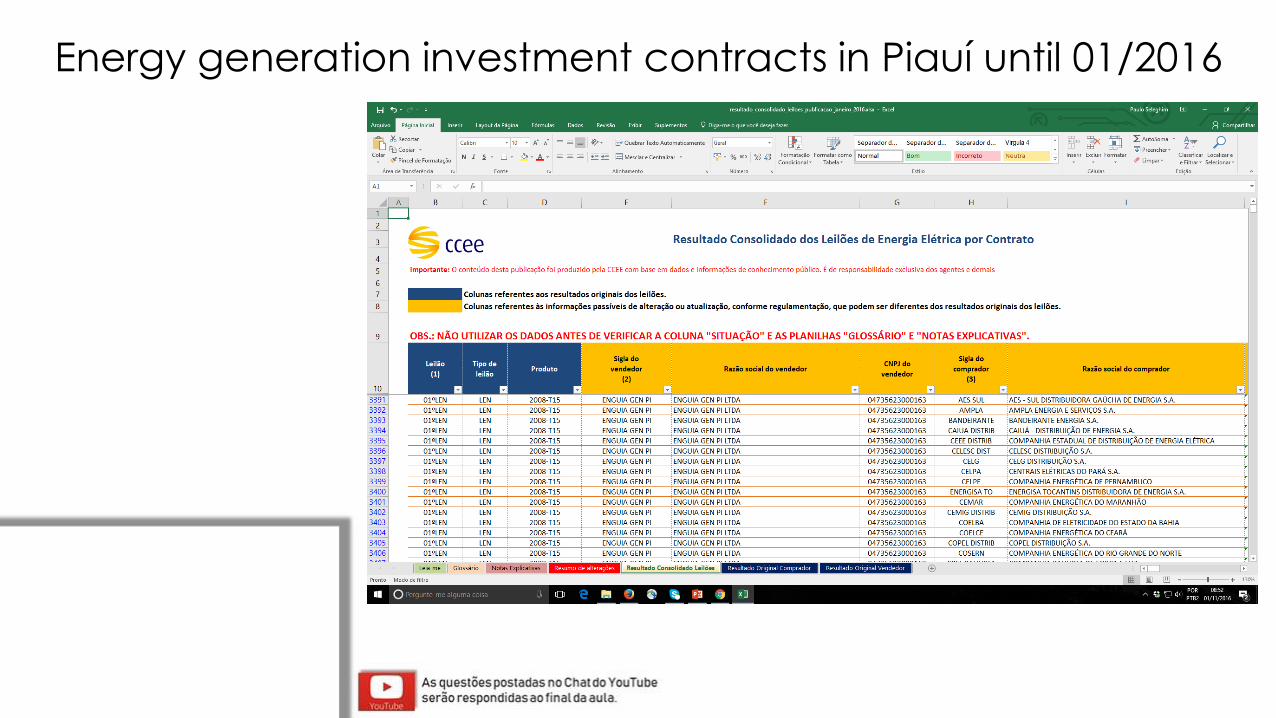
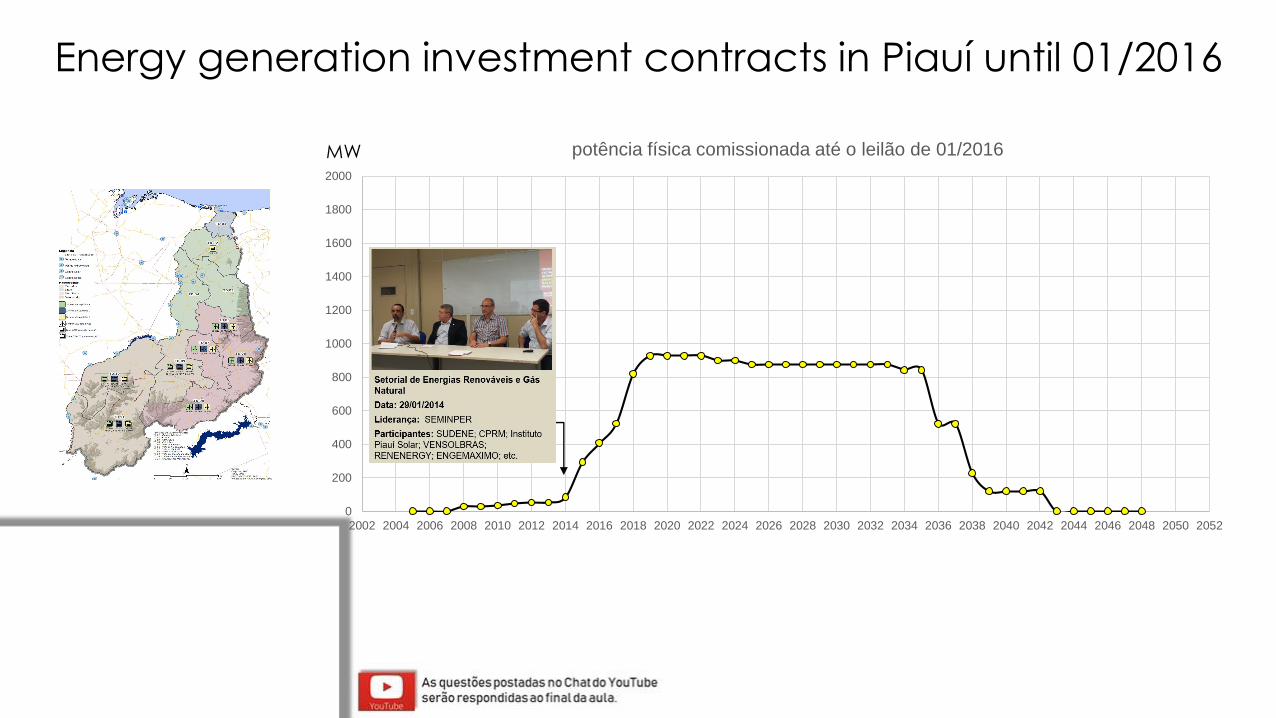
Energy generation investment contracts in Piauí until 01/2016
0
200
400
600
800
1000
1200
1400
1600
1800
2000
2002 2004 2006 2008 2010 2012 2014 2016 2018 2020 2022 2024 2026 2028 2030 2032 2034 2036 2038 2040 2042 2044 2046 2048 2050 2052
potência física comissionada até o leilão de 01/2016MW
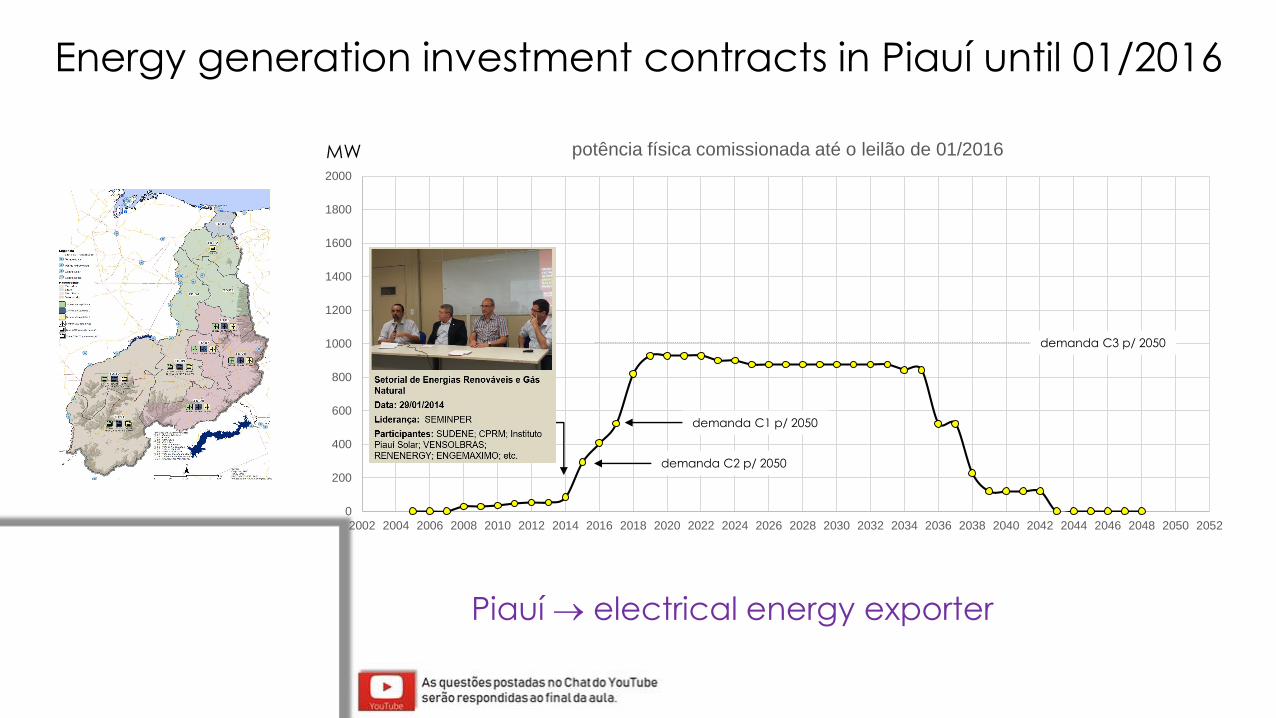
Energy generation investment contracts in Piauí until 01/2016
0
200
400
600
800
1000
1200
1400
1600
1800
2000
2002 2004 2006 2008 2010 2012 2014 2016 2018 2020 2022 2024 2026 2028 2030 2032 2034 2036 2038 2040 2042 2044 2046 2048 2050 2052
potência física comissionada até o leilão de 01/2016MW
demanda C1 p/ 2050
demanda C2 p/ 2050
demanda C3 p/ 2050
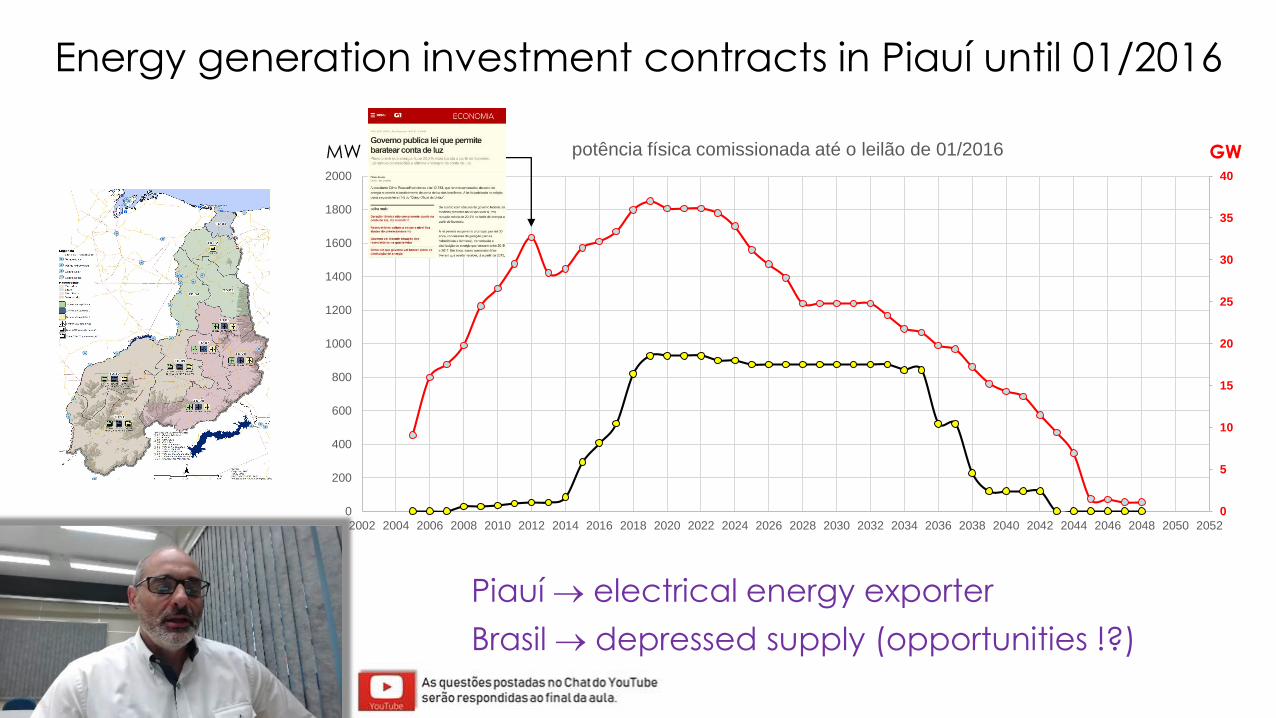
Energy generation investment contracts in Piauí until 01/2016
Piauí → electrical energy exporter
0
5
10
15
20
25
30
35
40
0
200
400
600
800
1000
1200
1400
1600
1800
2000
2002 2004 2006 2008 2010 2012 2014 2016 2018 2020 2022 2024 2026 2028 2030 2032 2034 2036 2038 2040 2042 2044 2046 2048 2050 2052
potência física comissionada até o leilão de 01/2016MW GW
Brasil → depressed supply (opportunities !?)
Piauí → electrical energy exporter
Energy generation investment contracts in Piauí until 01/2016
Other examples/indicators...
Supply growth to meet increased demands due to
life quality improvements
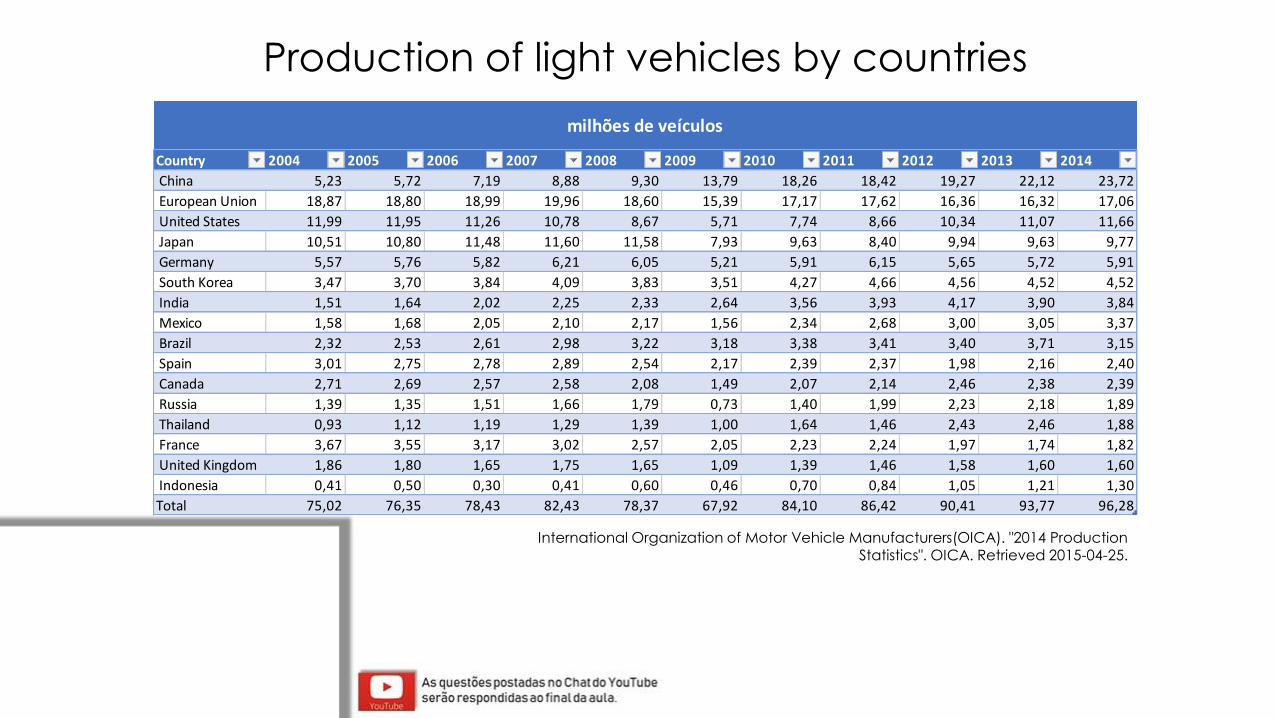
Production of light vehicles by countries
Country 2004 2005 2006 2007 2008 2009 2010 2011 2012 2013 2014
China 5,23 5,72 7,19 8,88 9,30 13,79 18,26 18,42 19,27 22,12 23,72
European Union 18,87 18,80 18,99 19,96 18,60 15,39 17,17 17,62 16,36 16,32 17,06
United States 11,99 11,95 11,26 10,78 8,67 5,71 7,74 8,66 10,34 11,07 11,66
Japan 10,51 10,80 11,48 11,60 11,58 7,93 9,63 8,40 9,94 9,63 9,77
Germany 5,57 5,76 5,82 6,21 6,05 5,21 5,91 6,15 5,65 5,72 5,91
South Korea 3,47 3,70 3,84 4,09 3,83 3,51 4,27 4,66 4,56 4,52 4,52
India 1,51 1,64 2,02 2,25 2,33 2,64 3,56 3,93 4,17 3,90 3,84
Mexico 1,58 1,68 2,05 2,10 2,17 1,56 2,34 2,68 3,00 3,05 3,37
Brazil 2,32 2,53 2,61 2,98 3,22 3,18 3,38 3,41 3,40 3,71 3,15
Spain 3,01 2,75 2,78 2,89 2,54 2,17 2,39 2,37 1,98 2,16 2,40
Canada 2,71 2,69 2,57 2,58 2,08 1,49 2,07 2,14 2,46 2,38 2,39
Russia 1,39 1,35 1,51 1,66 1,79 0,73 1,40 1,99 2,23 2,18 1,89
Thailand 0,93 1,12 1,19 1,29 1,39 1,00 1,64 1,46 2,43 2,46 1,88
France 3,67 3,55 3,17 3,02 2,57 2,05 2,23 2,24 1,97 1,74 1,82
United Kingdom 1,86 1,80 1,65 1,75 1,65 1,09 1,39 1,46 1,58 1,60 1,60
Indonesia 0,41 0,50 0,30 0,41 0,60 0,46 0,70 0,84 1,05 1,21 1,30
Total 75,02 76,35 78,43 82,43 78,37 67,92 84,10 86,42 90,41 93,77 96,28
milhões de veículos
International Organization of Motor Vehicle Manufacturers(OICA). "2014 Production Statistics". OICA. Retrieved 2015-04-25.
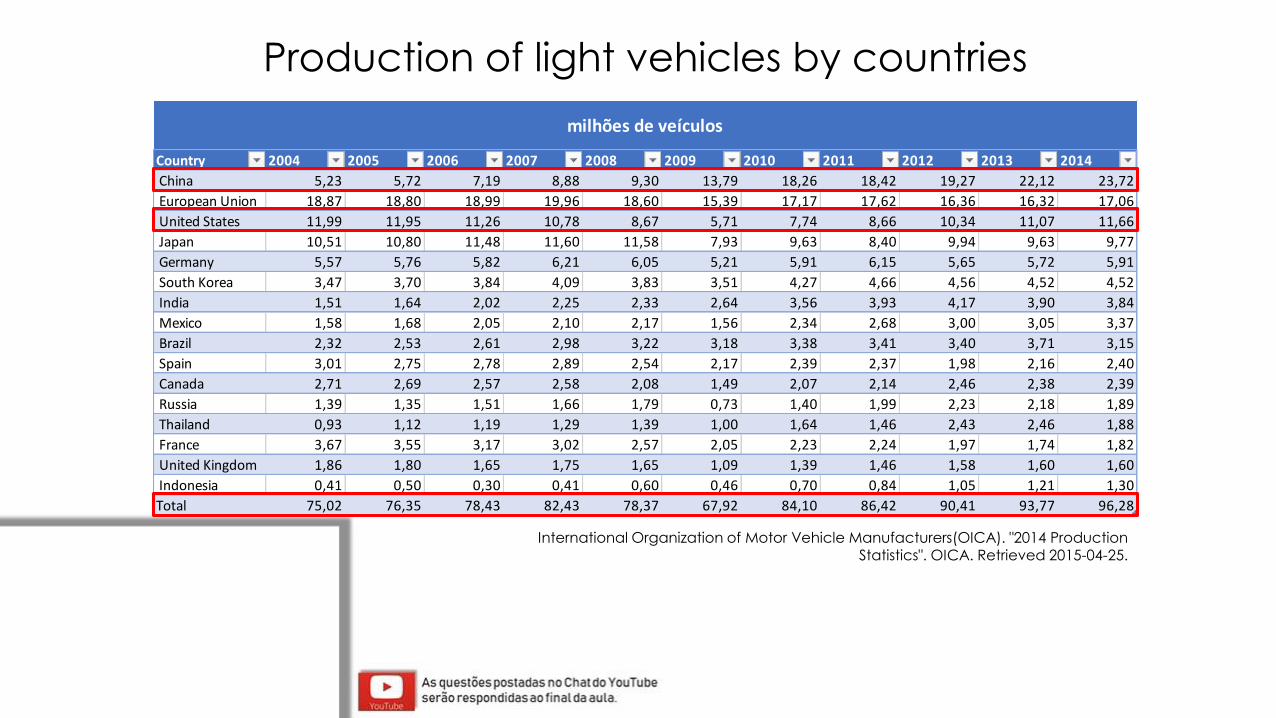
Production of light vehicles by countries
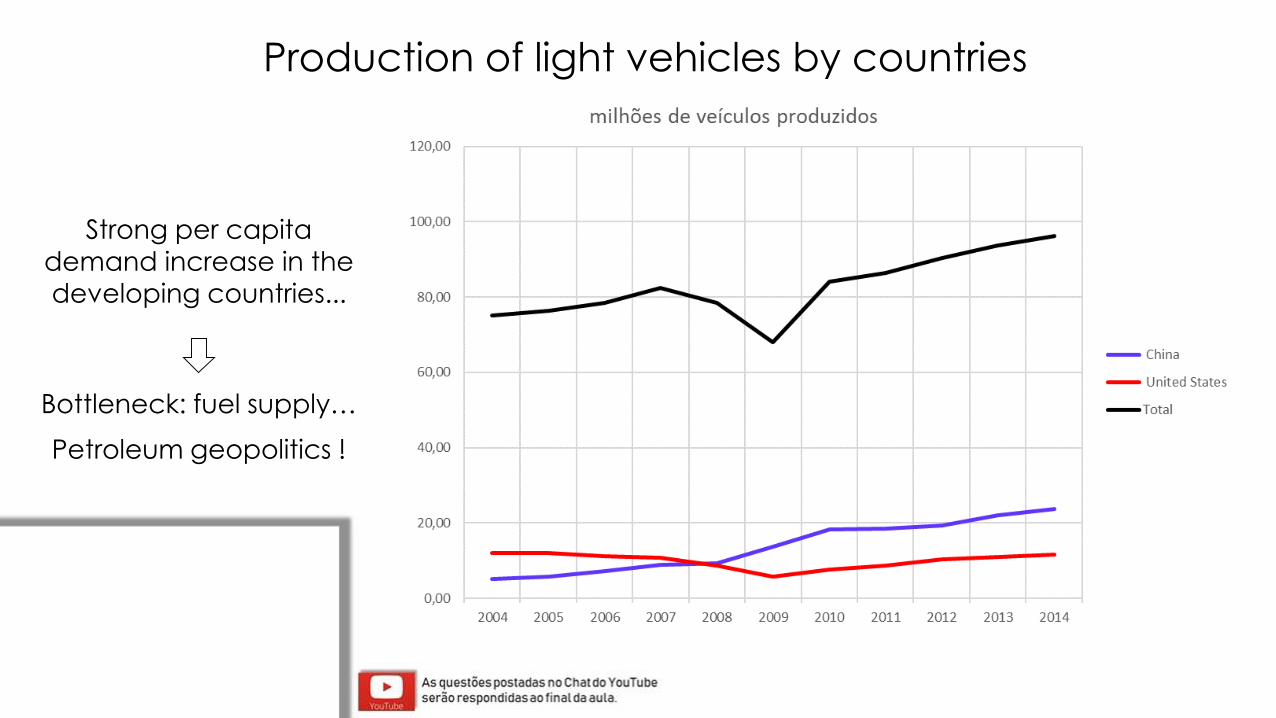
Strong per capita
demand increase in the
developing countries...
Petroleum geopolitics !
Bottleneck: fuel supply…
Production of light vehicles by countries

Energy security...
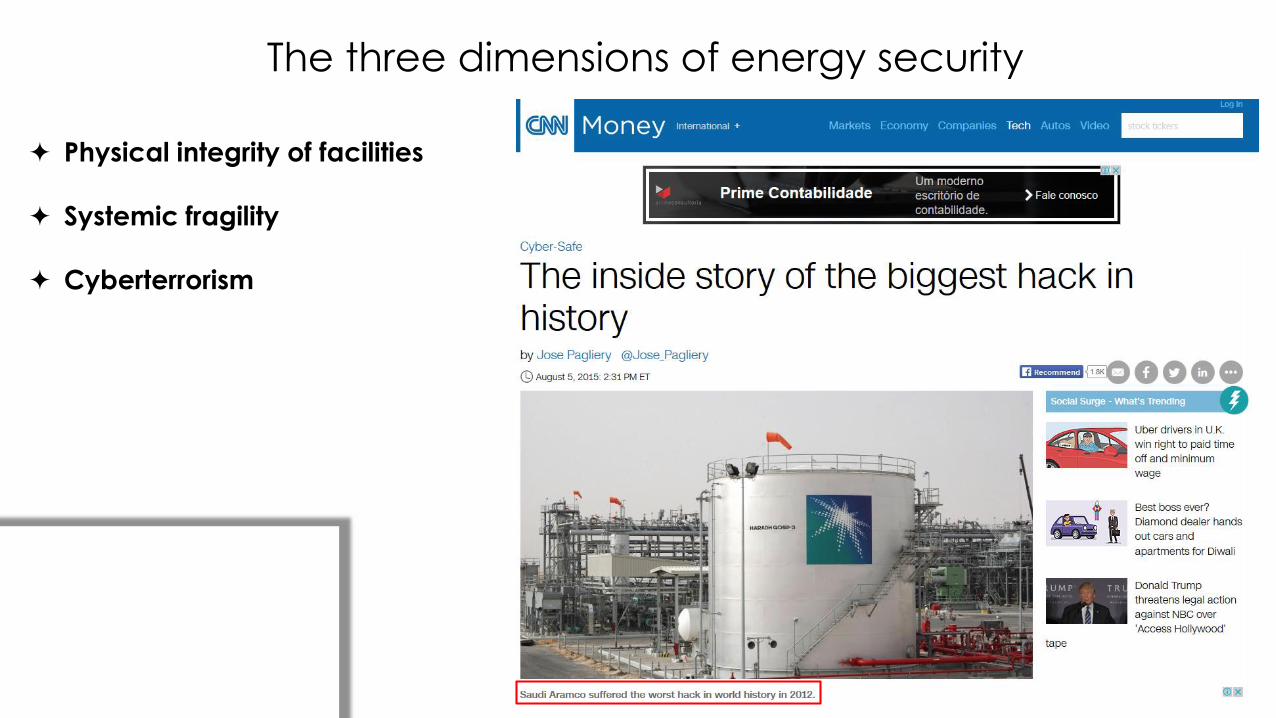
The three dimensions of energy security
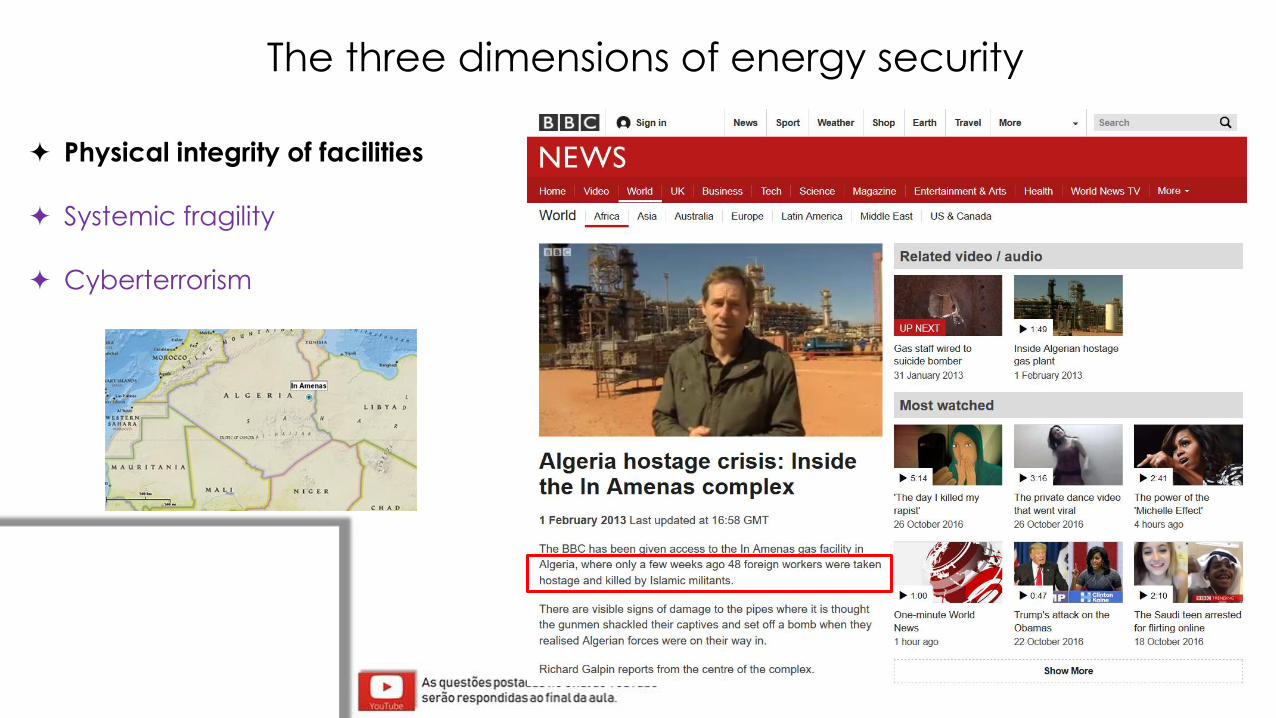
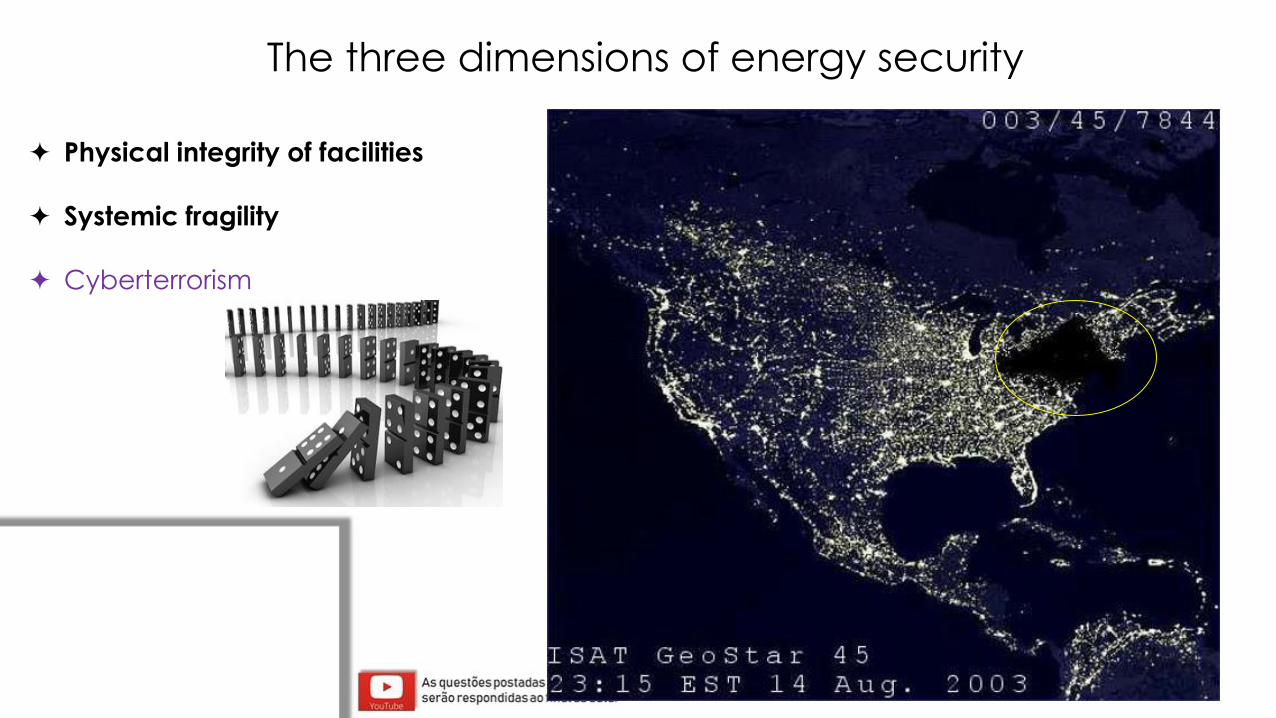
Physical integrity of facilities
Systemic fragility
Cyberterrorism
The three dimensions of energy security
Physical integrity of facilities
Systemic fragility
Cyberterrorism
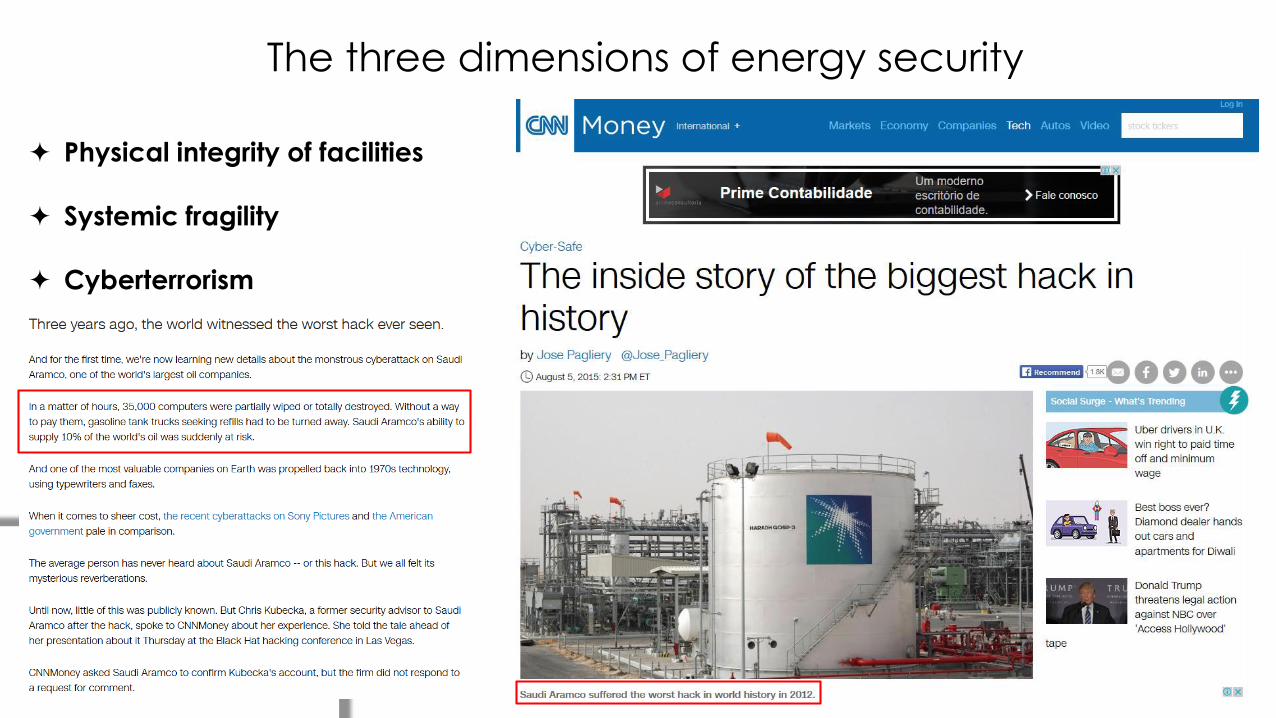
The three dimensions of energy security
Physical integrity of facilities
Systemic fragility
Cyberterrorism
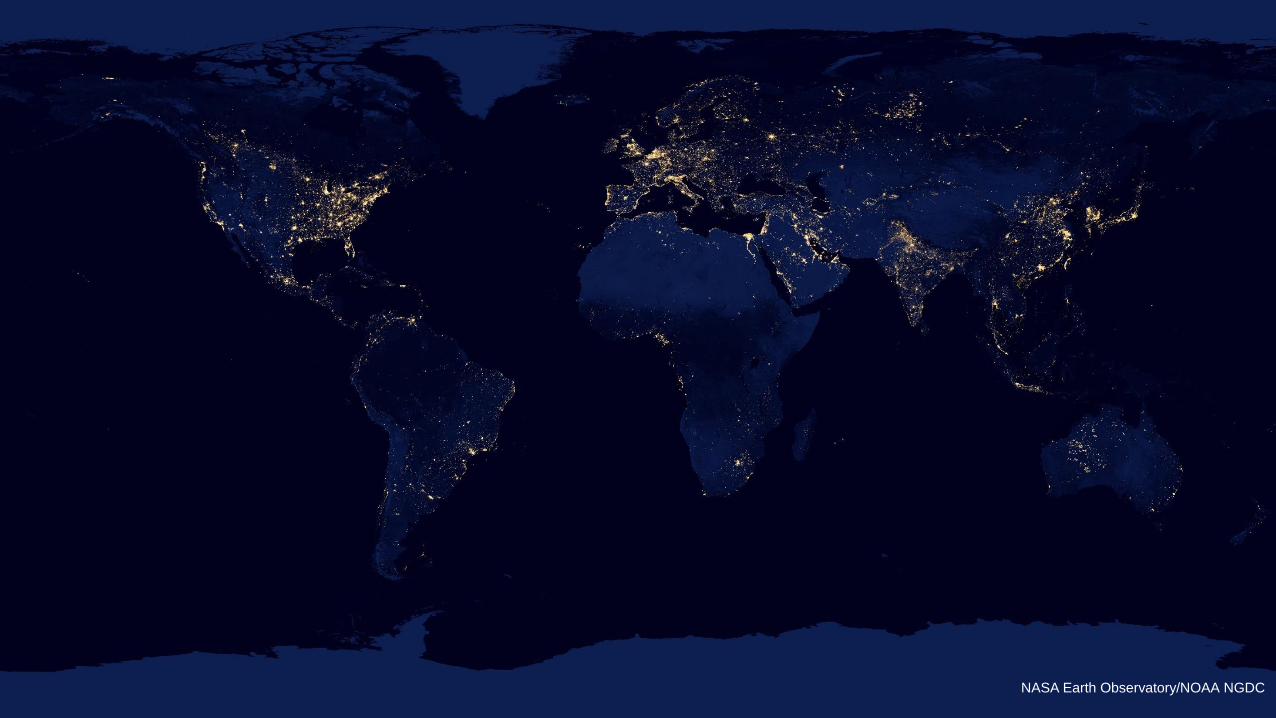
NASA Earth Observatory/NOAA NGDC

NASA Earth Observatory/NOAA NGDC
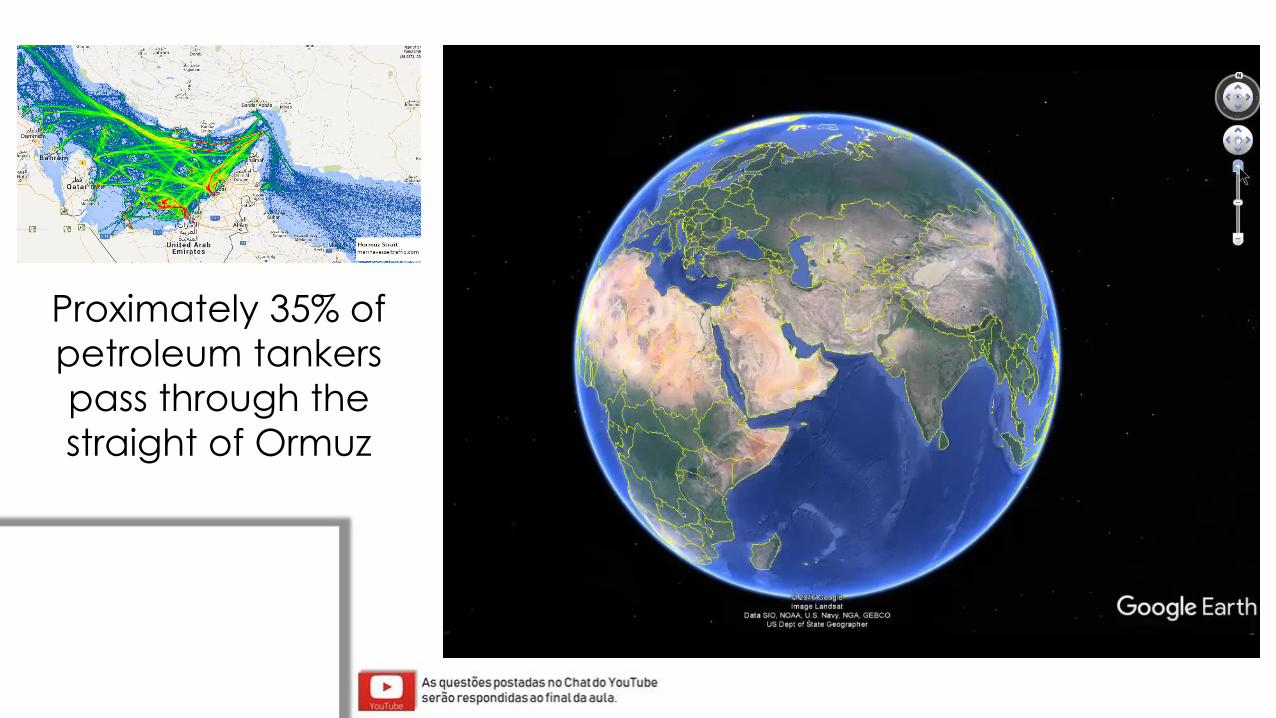
Proximately 35% of
petroleum tankers
pass through the
straight of Ormuz
The three dimensions of energy security
Physical integrity of facilities
Systemic fragility
Cyberterrorism
The three dimensions of energy security
Physical integrity of facilities
Systemic fragility
Cyberterrorism
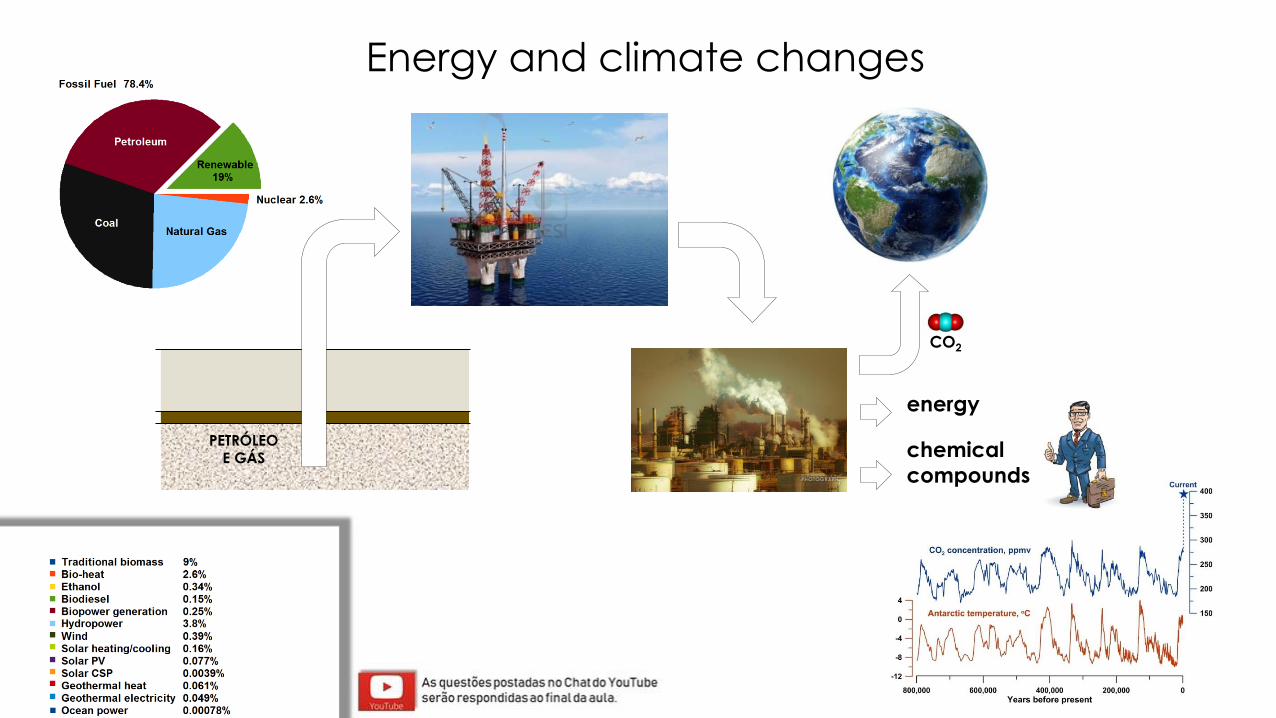
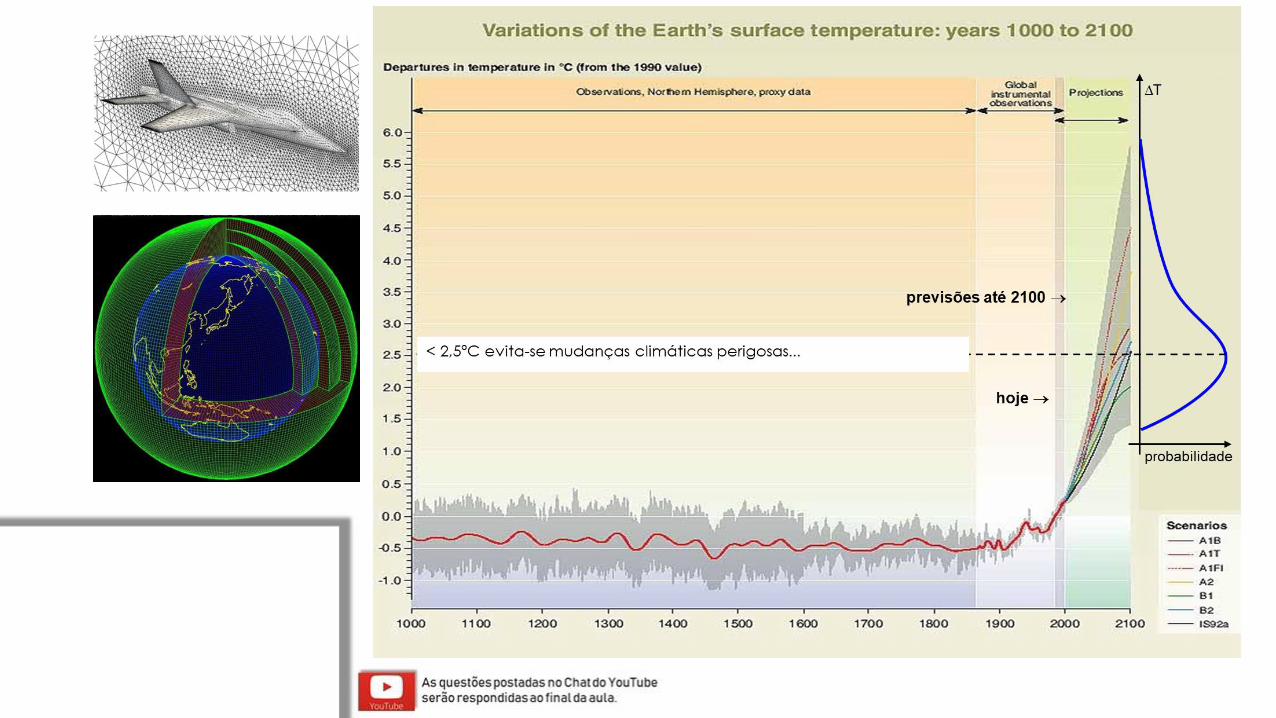
Energy and climate changes
CO2
energy
chemical
compounds
PETRÓLEOE GÁS
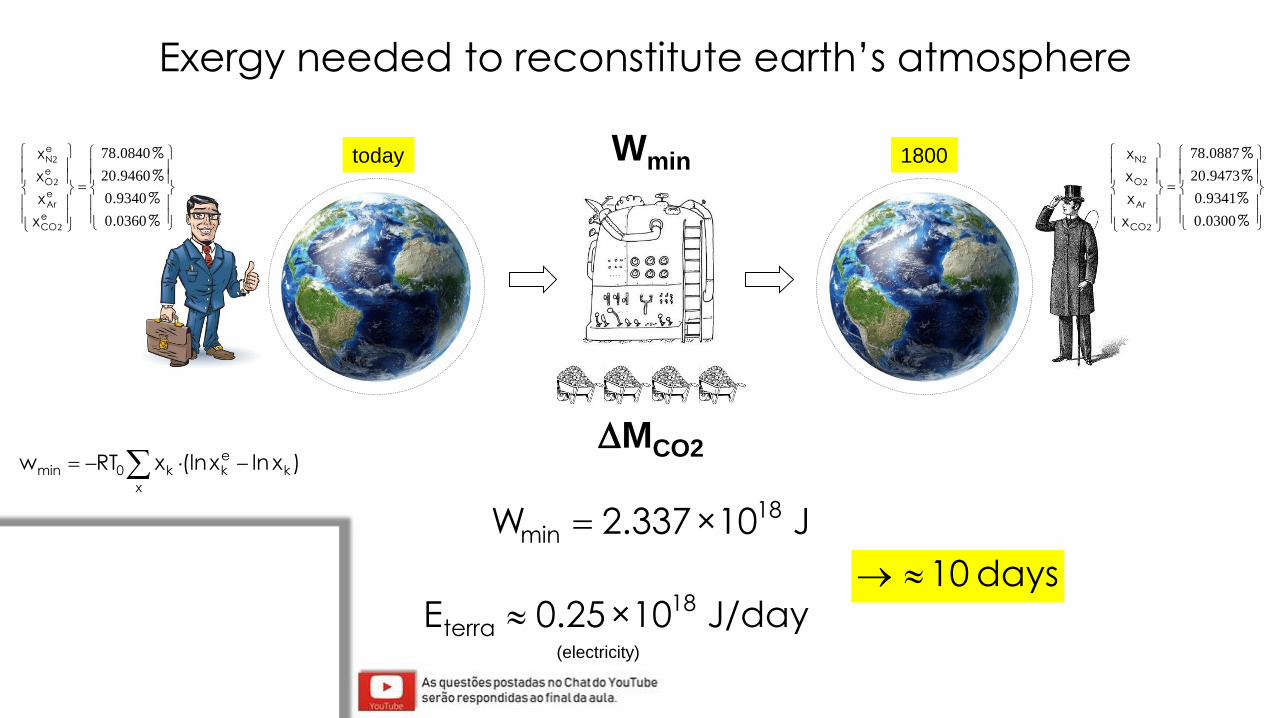
Exergy needed to reconstitute earth’s atmosphere
today 1800Wmin
DMCO2
J 10×337.2W 18min =
J/day 10×25.0E 18terra
(electricity)
days 10→
)xlnx(lnxRTw kek
x
k0min −−=
=
%.
%.
%.
%.
x
x
x
x
eCO
eAr
eO
eN
03600
93400
946020
084078
2
2
2
=
%.
%.
%.
%.
x
x
x
x
CO
Ar
O
N
03000
93410
947320
088778
2
2
2
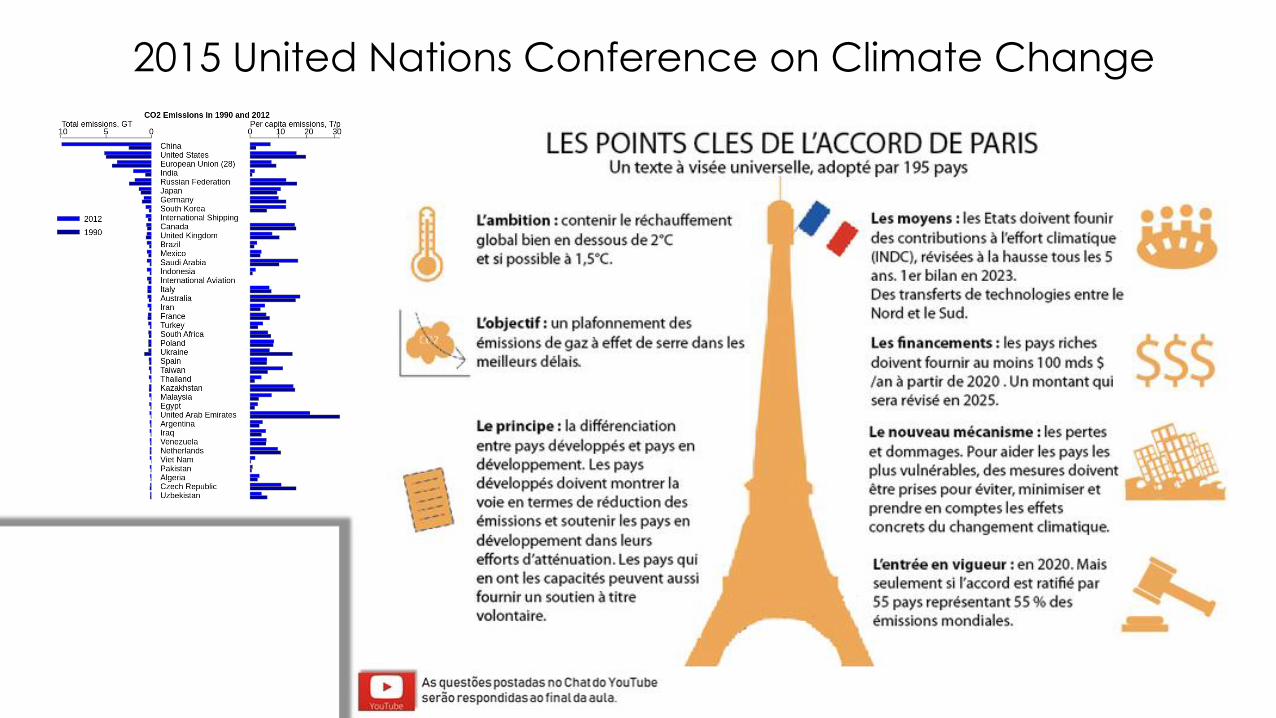
2015 United Nations Conference on Climate Change
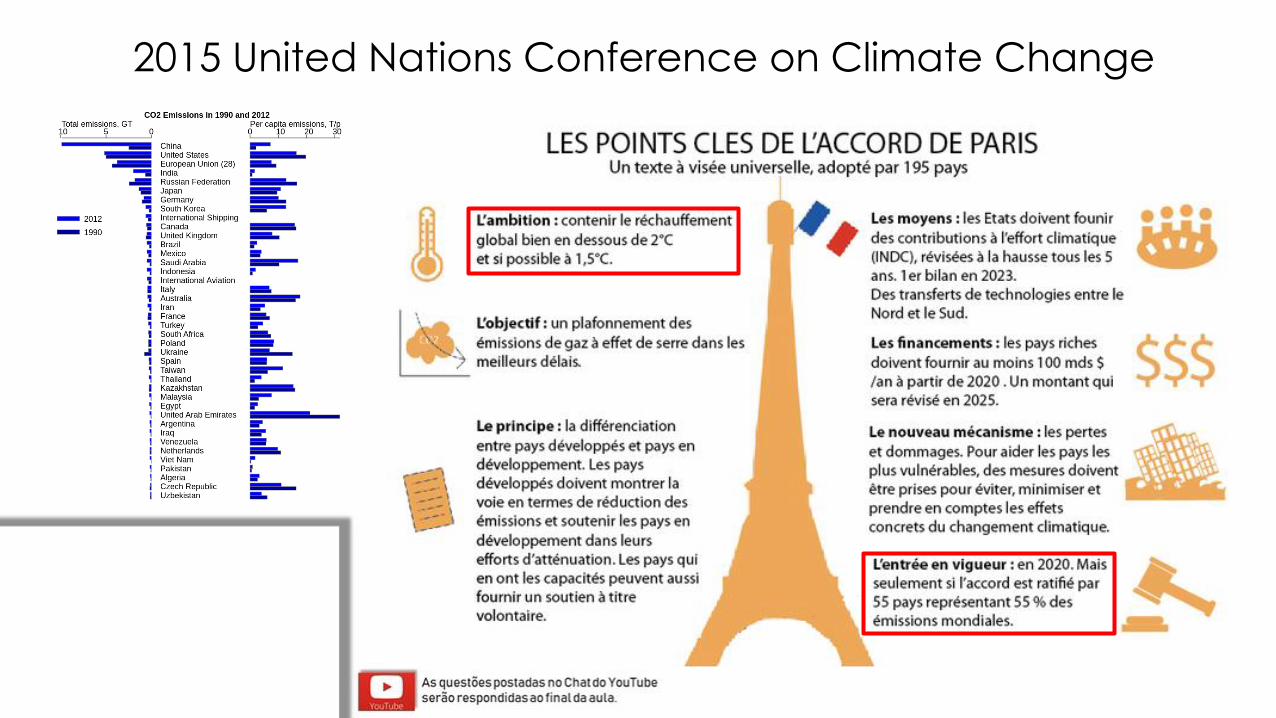
2015 United Nations Conference on Climate Change
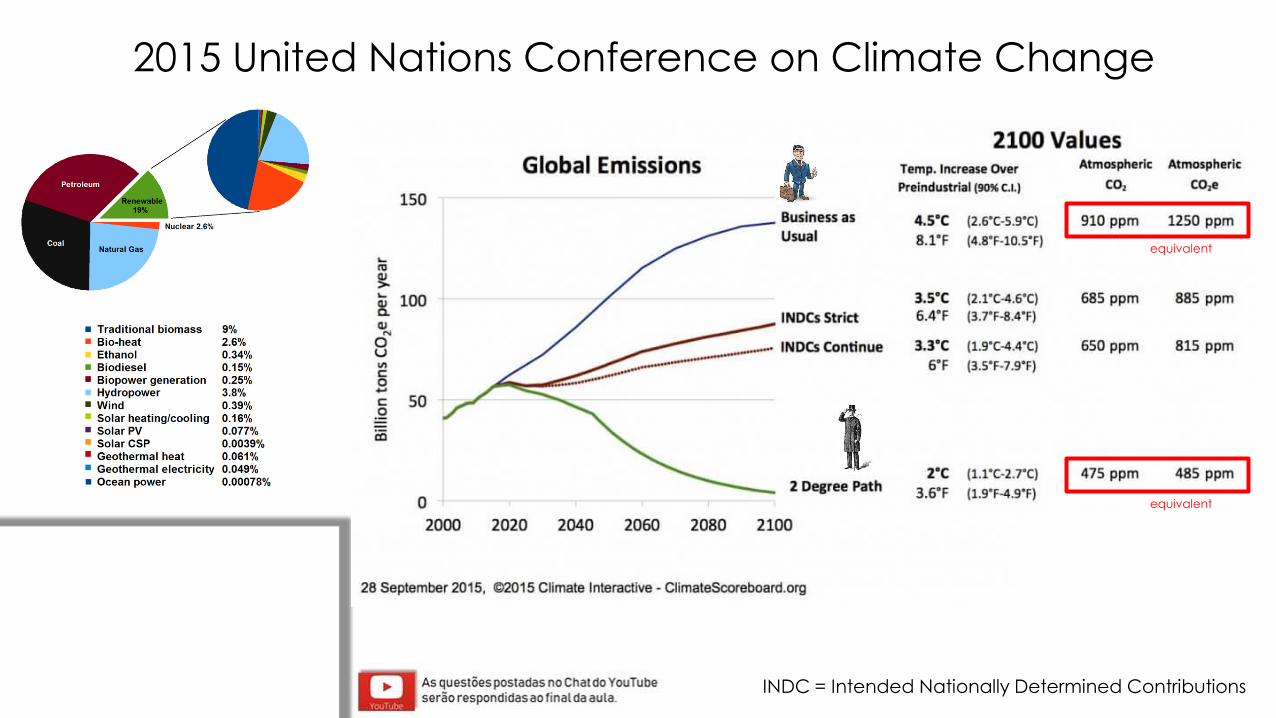
equivalent
equivalent
INDC = Intended Nationally Determined Contributions
2015 United Nations Conference on Climate Change
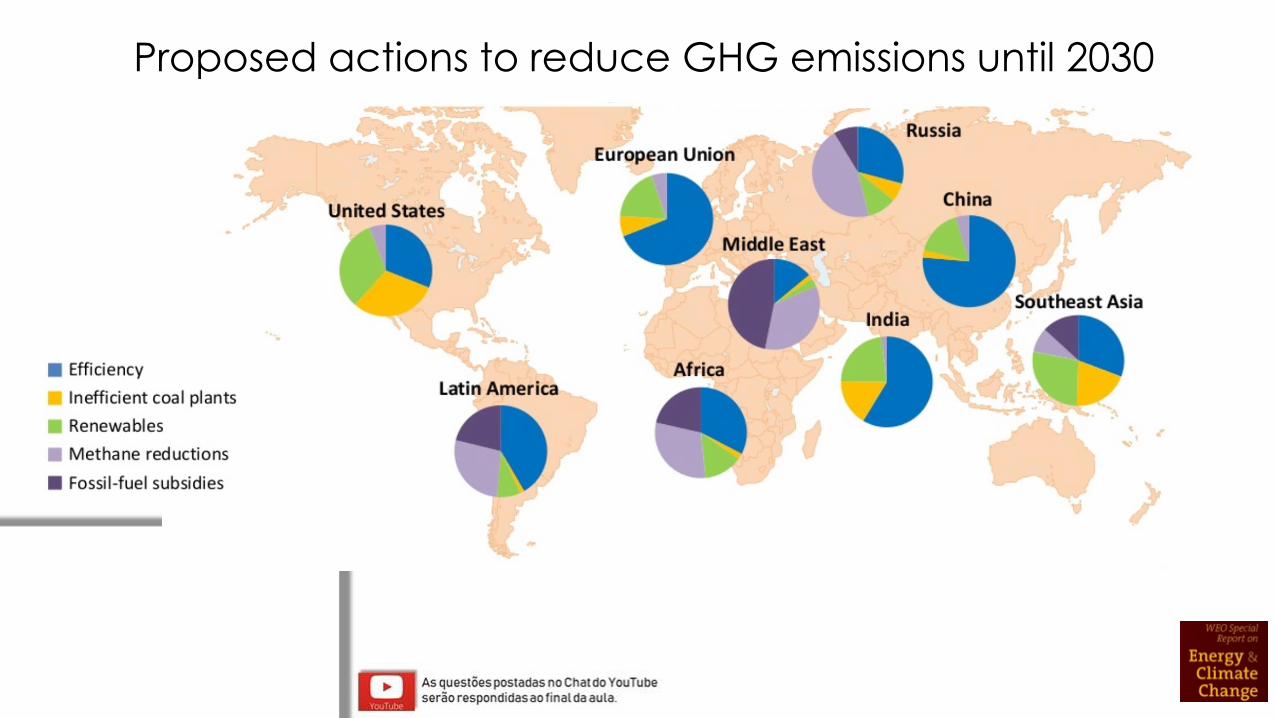
Proposed actions to reduce GHG emissions until 2030
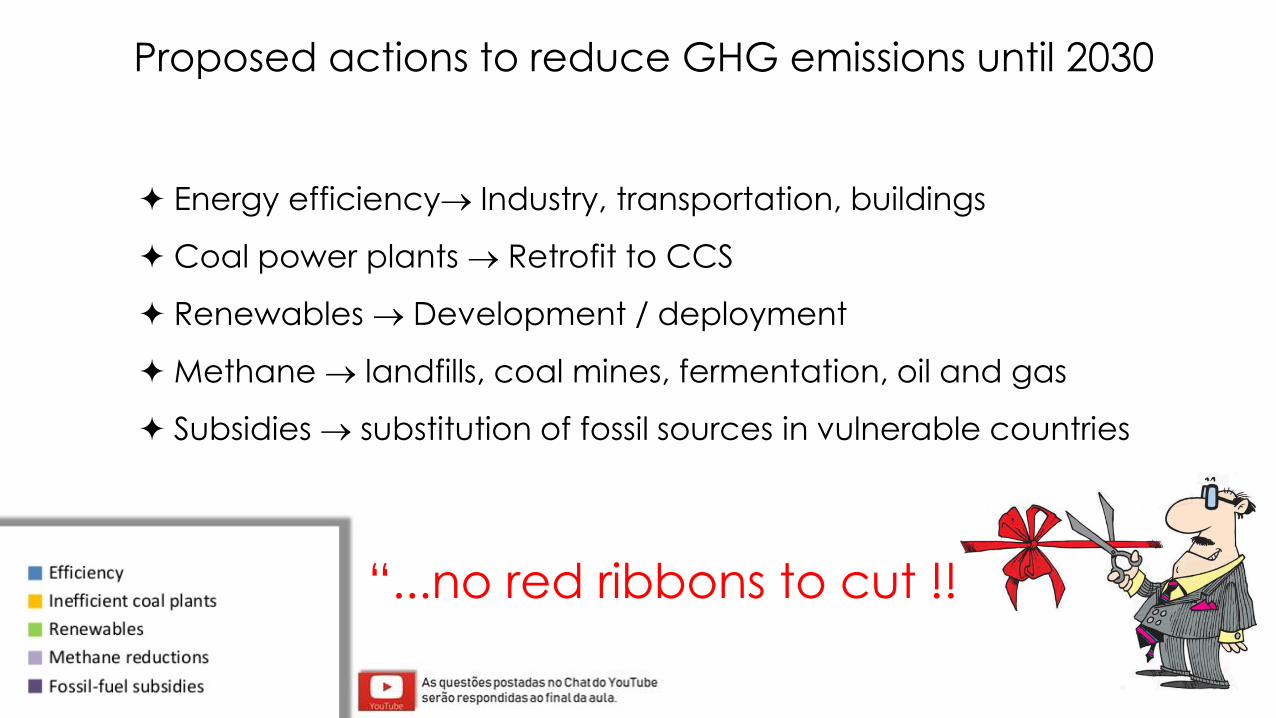
Energy efficiency→ Industry, transportation, buildings
Coal power plants → Retrofit to CCS
Renewables → Development / deployment
Methane → landfills, coal mines, fermentation, oil and gas
Subsidies → substitution of fossil sources in vulnerable countries
“...no red ribbons to cut !!!”
Proposed actions to reduce GHG emissions until 2030
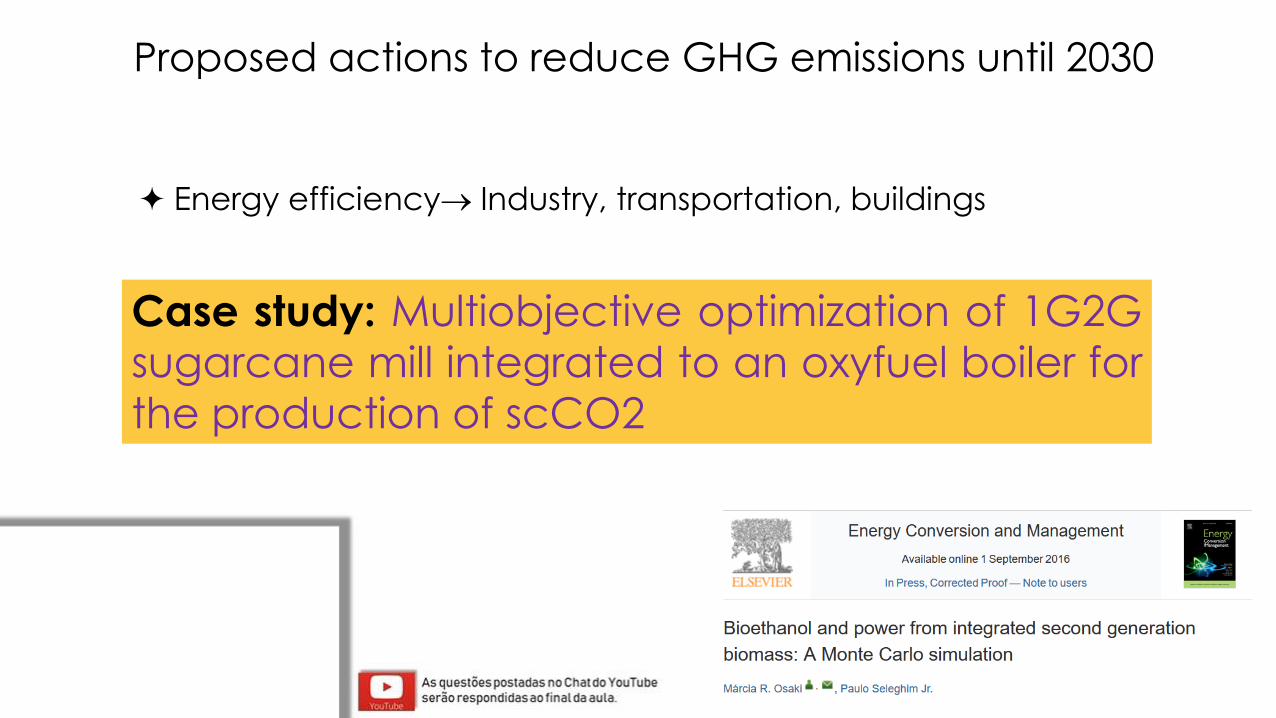
Case study: Multiobjective optimization of 1G2G
sugarcane mill integrated to an oxyfuel boiler for
the production of scCO2
Proposed actions to reduce GHG emissions until 2030
Energy efficiency→ Industry, transportation, buildings
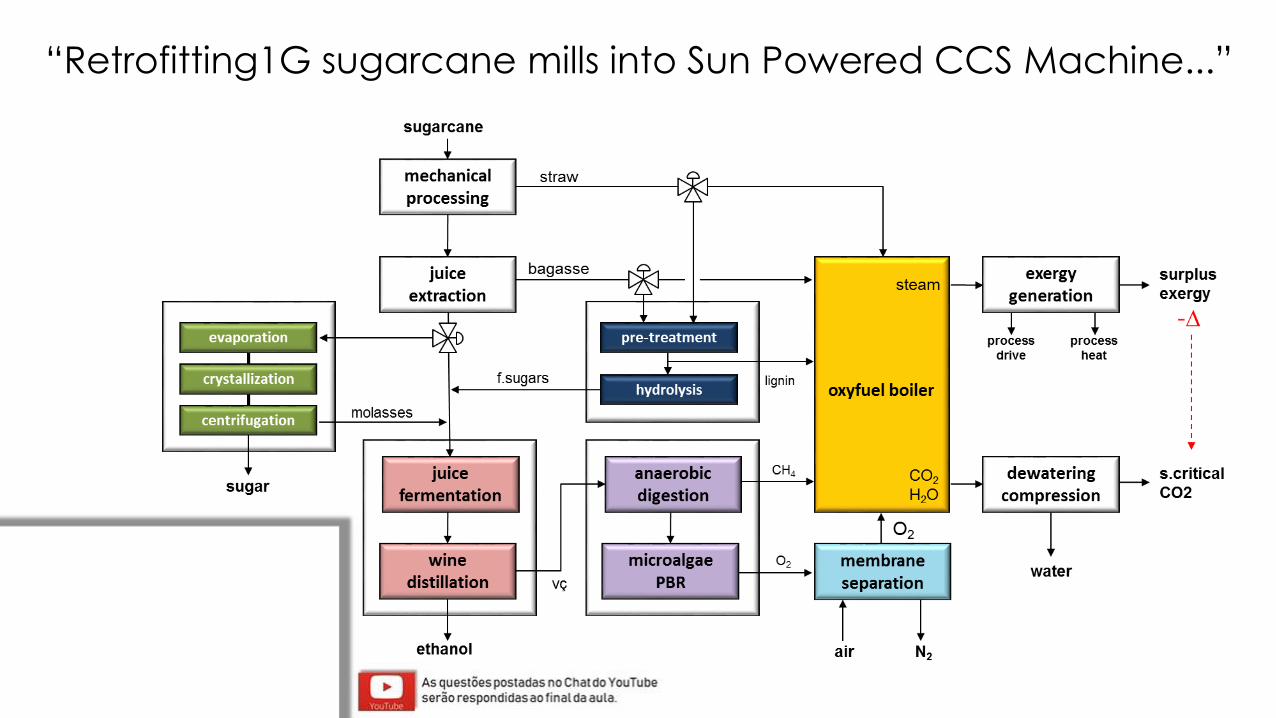
“Retrofitting1G sugarcane mills into Sun Powered CCS Machine...”
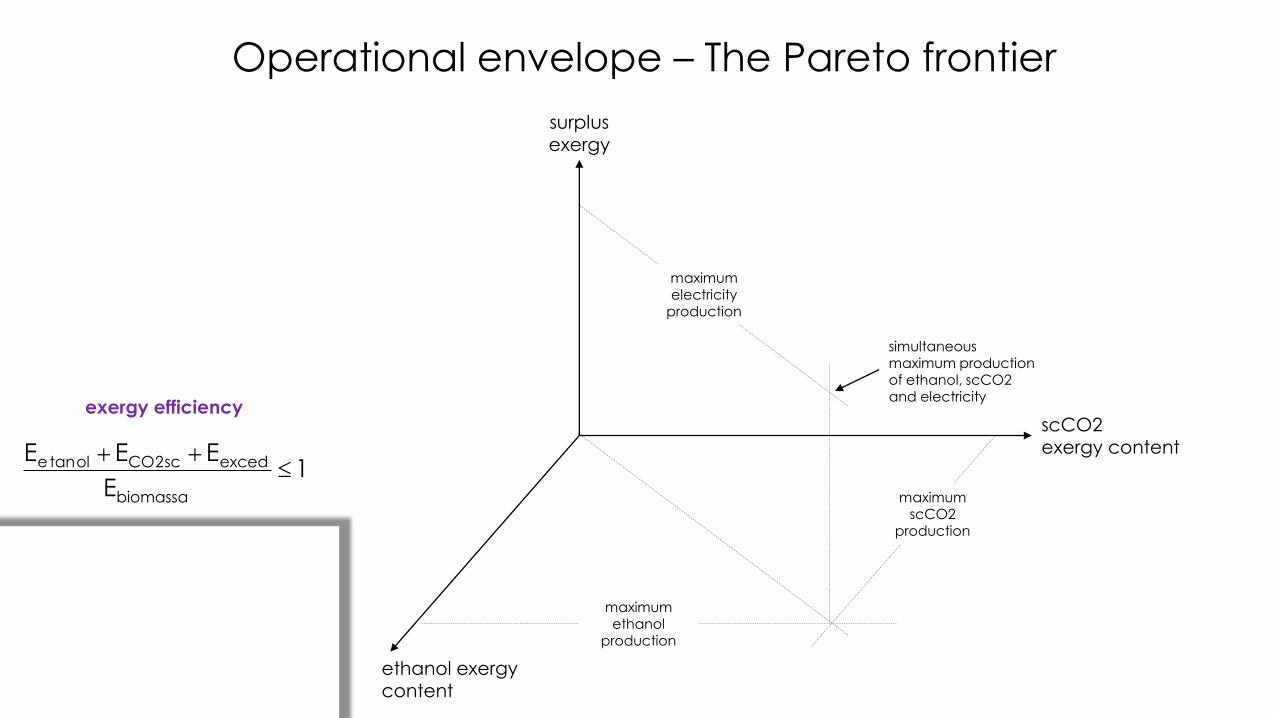
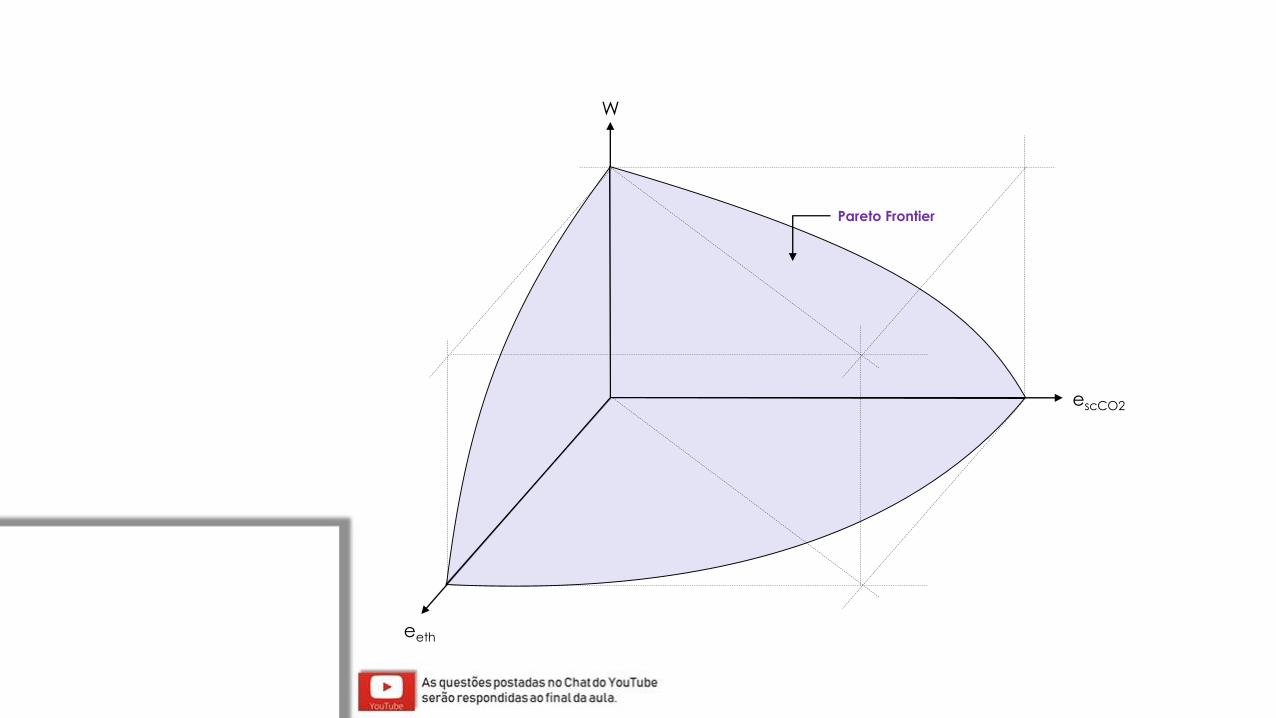
Operational envelope – The Pareto frontier
scCO2exergy content
surplusexergy
1E
EEE
biomassa
excedsc2COoltane ++
exergy efficiency
maximum ethanol
production
simultaneous maximum production of ethanol, scCO2 and electricity
maximum scCO2
production
maximum electricity
production
ethanol exergycontent
maximum ethanol production
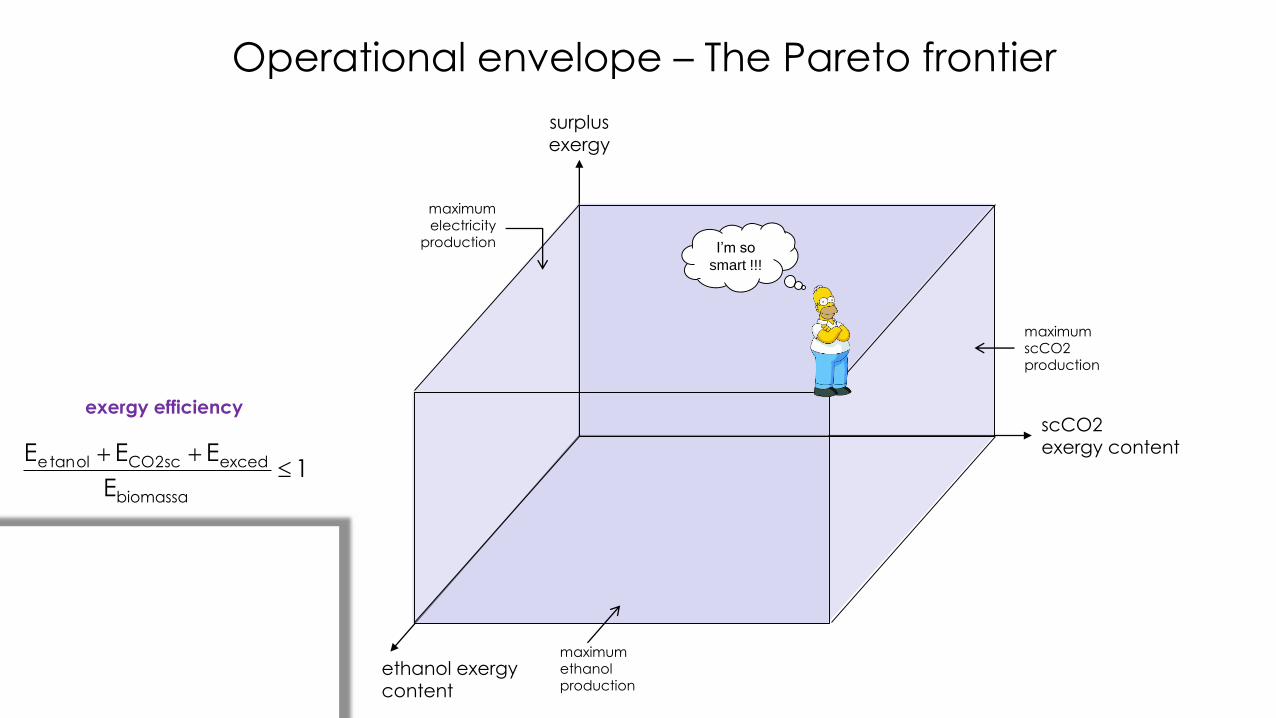
I’m so
smart !!!
Operational envelope – The Pareto frontier
scCO2exergy content
surplusexergy
maximum scCO2 production
maximum electricity
production
1E
EEE
biomassa
excedsc2COoltane ++
exergy efficiency
ethanol exergycontent
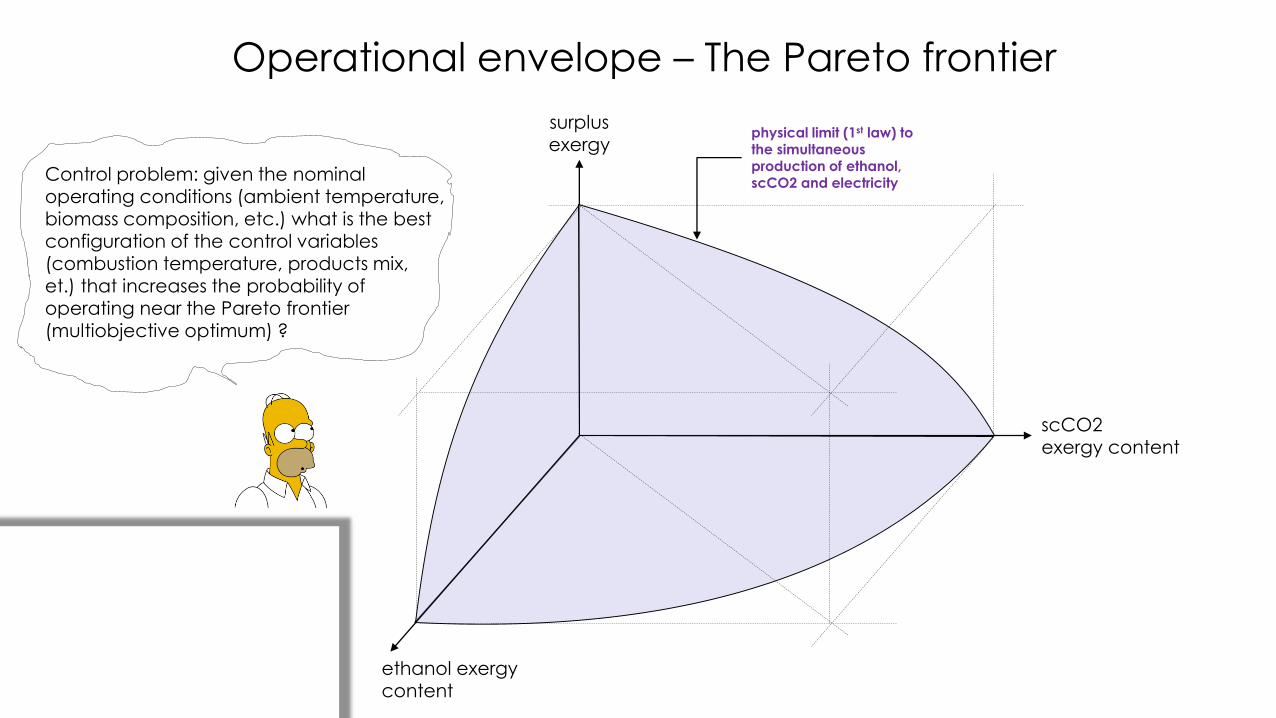
physical limit (1st law) to the simultaneous production of ethanol, scCO2 and electricity
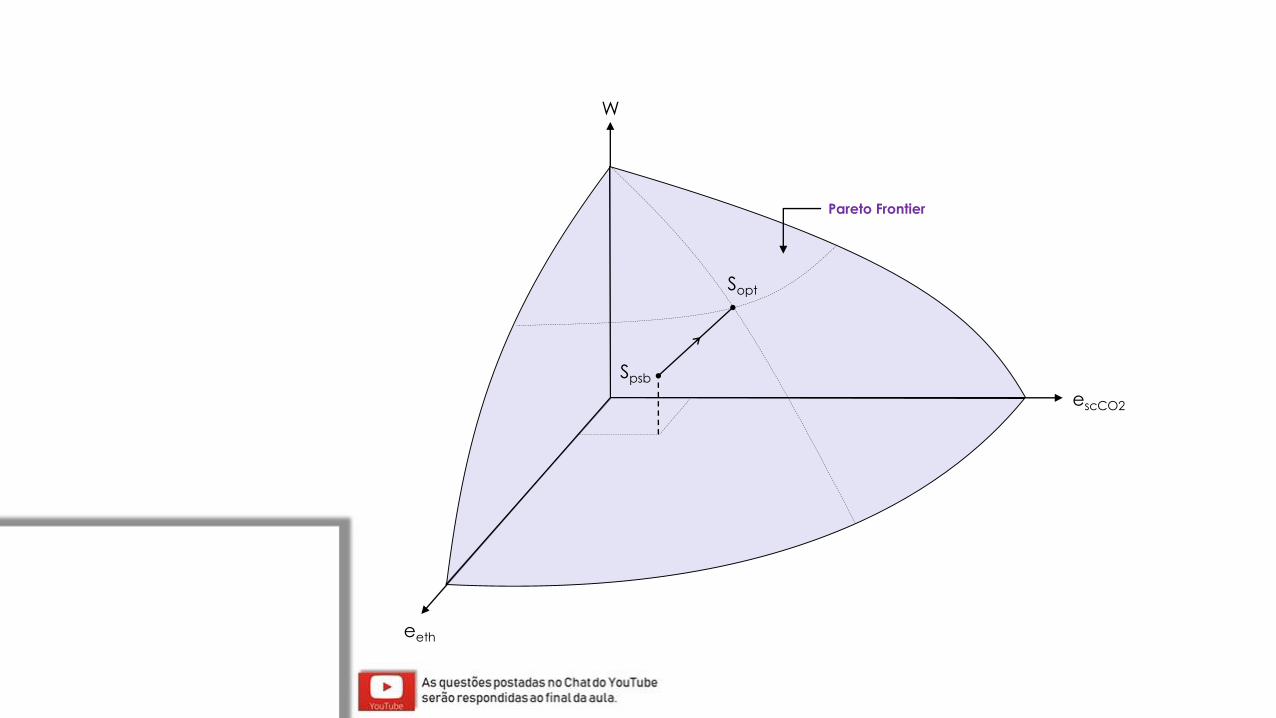
Control problem: given the nominal operating conditions (ambient temperature, biomass composition, etc.) what is the best configuration of the control variables (combustion temperature, products mix,
et.) that increases the probability of operating near the Pareto frontier (multiobjective optimum) ?
Operational envelope – The Pareto frontier
scCO2exergy content
surplusexergy
ethanol exergycontent
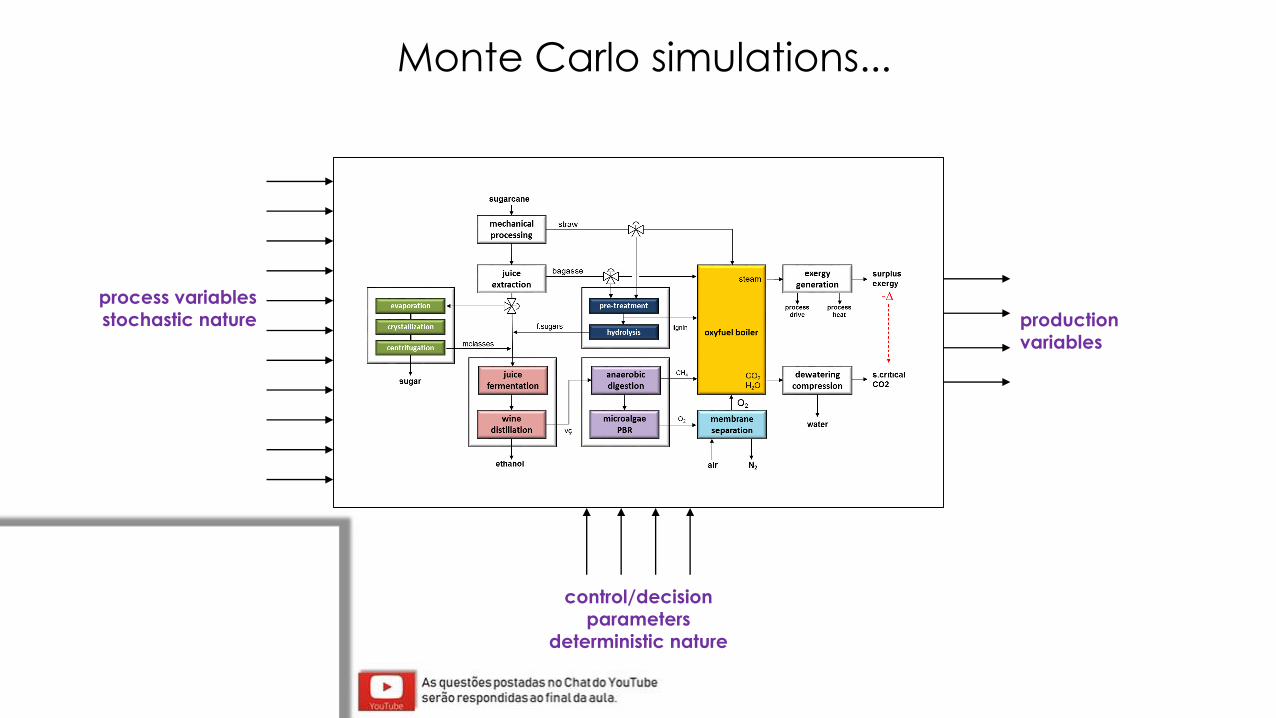
Monte Carlo simulations...
process variables stochastic nature production
variables
control/decision parameters
deterministic nature
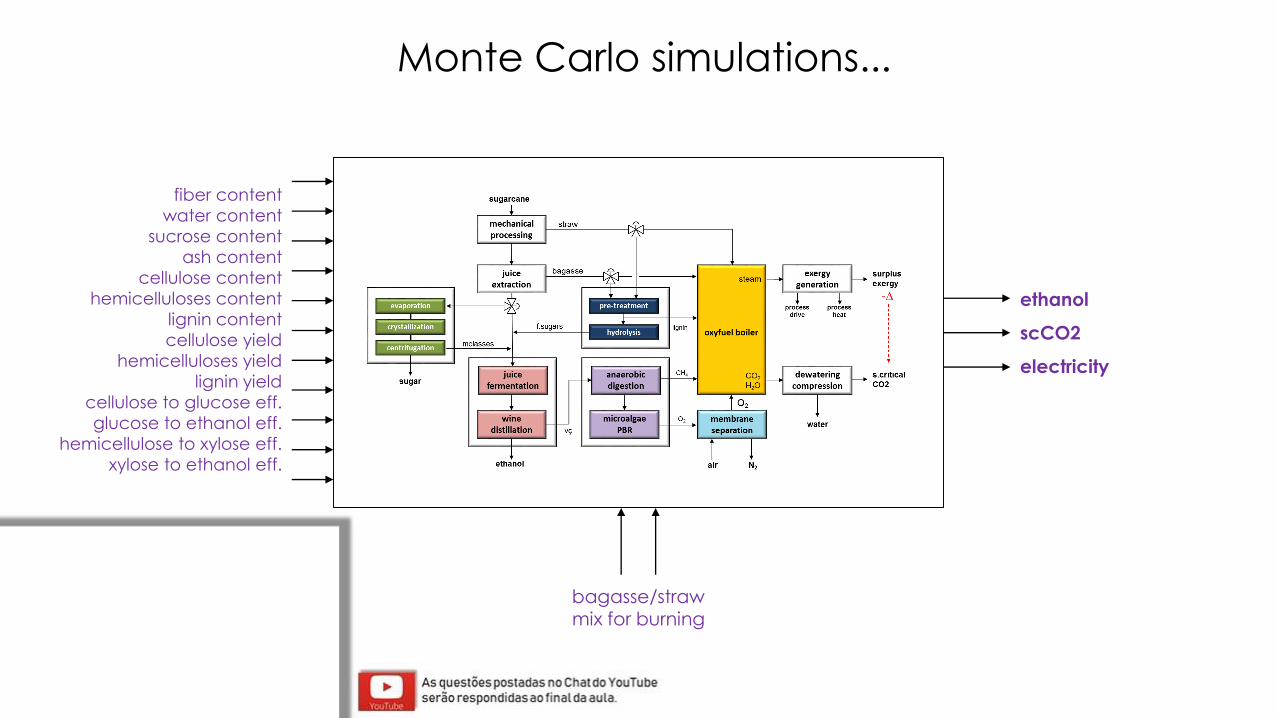
ethanol
scCO2
electricity
bagasse/straw mix for burning
fiber content
water content
sucrose content
ash content
cellulose content
hemicelluloses content
lignin content
cellulose yield
hemicelluloses yield
lignin yield
cellulose to glucose eff.
glucose to ethanol eff.
hemicellulose to xylose eff.
xylose to ethanol eff.
Monte Carlo simulations...
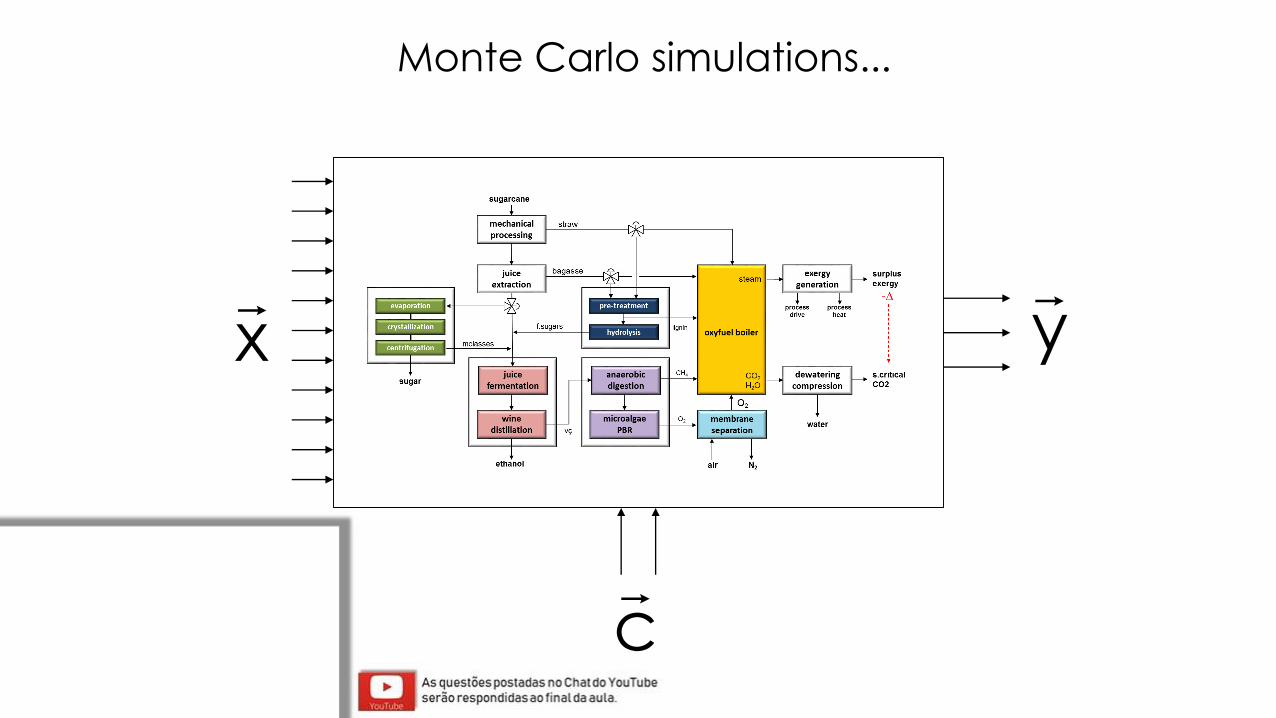
x
y
c
Monte Carlo simulations...
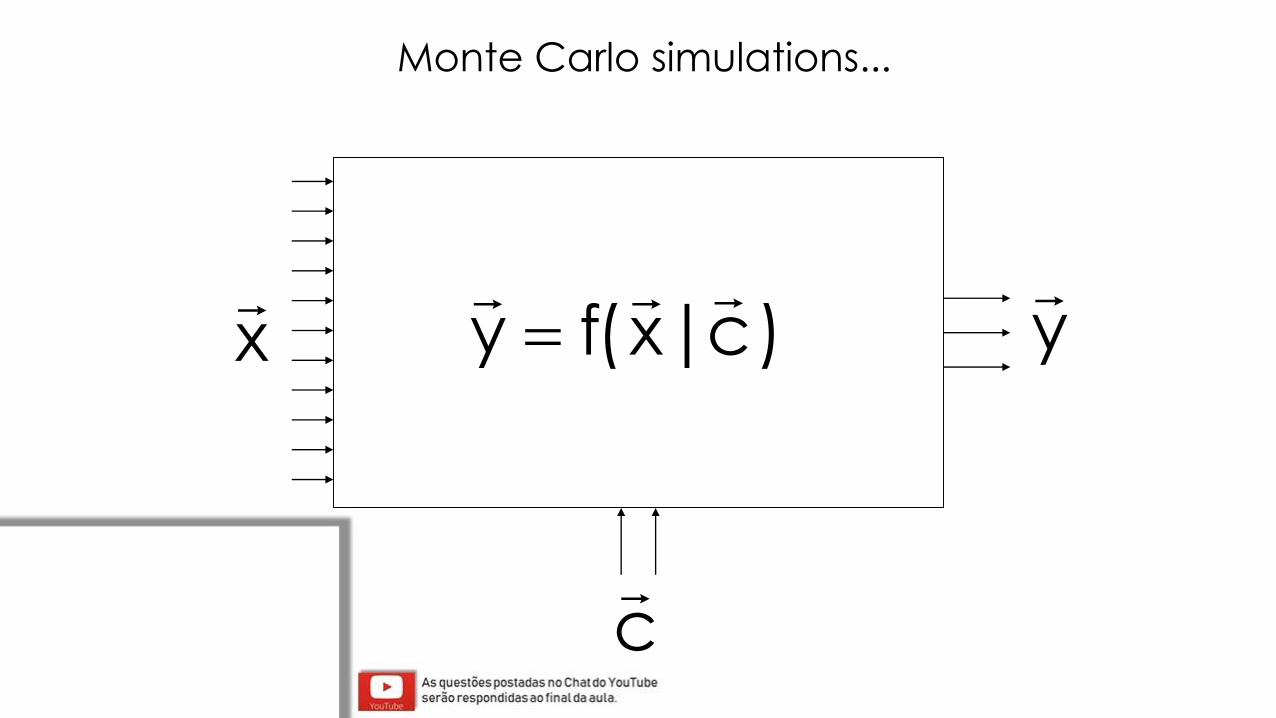
x
y
c
)c|x(fy
=
Monte Carlo simulations...
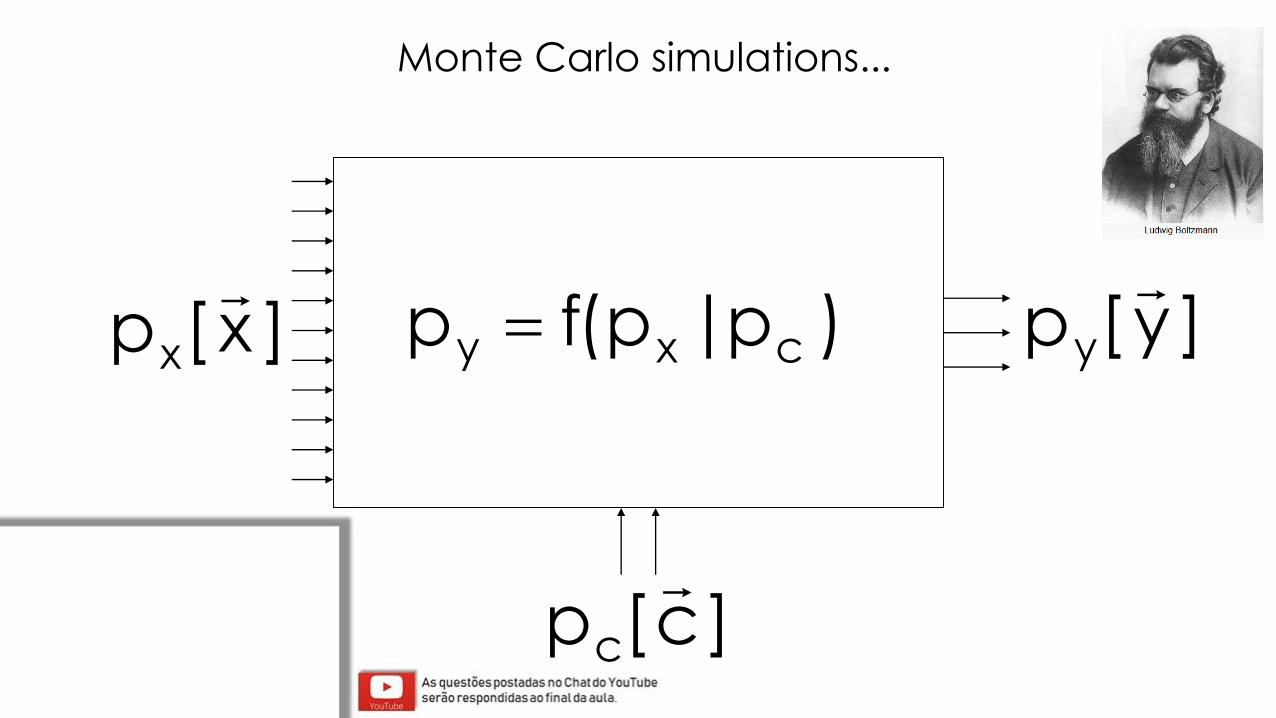
]x[px
]y[py
]c[pc
)p|p(fp cxy =
Monte Carlo simulations...
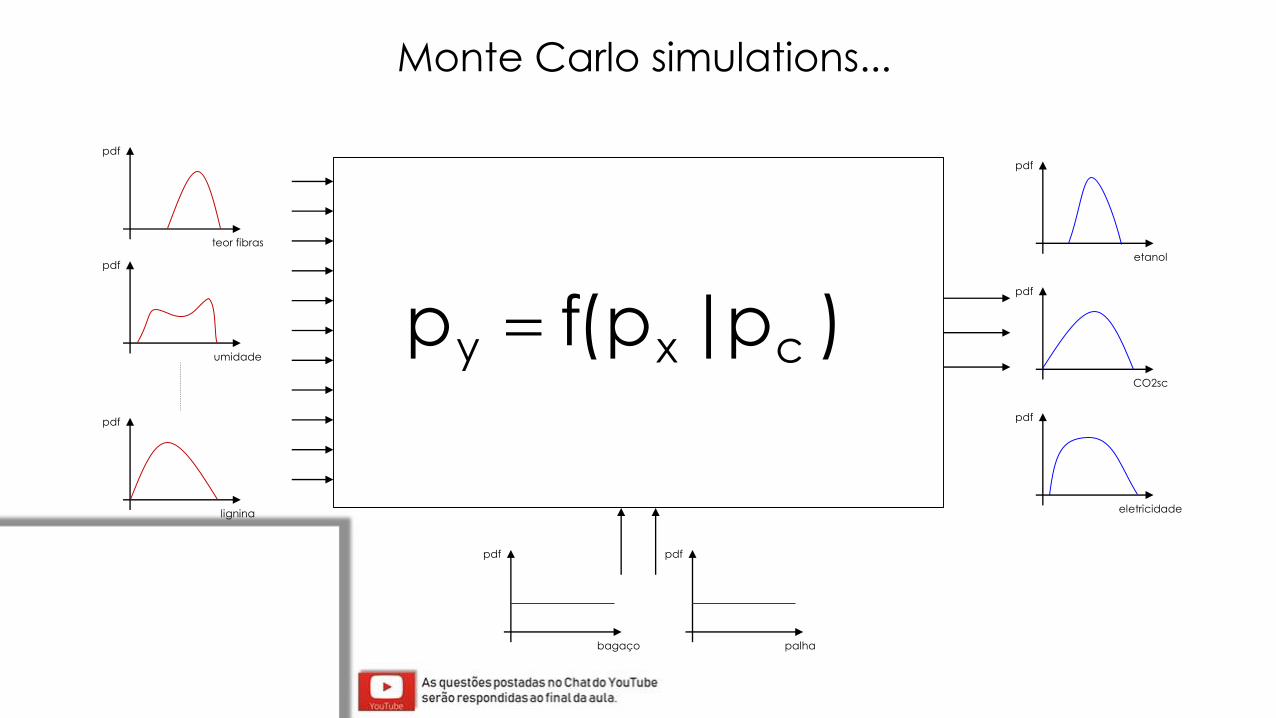
)p|p(fp cxy =
lignina
teor fibras
eletricidade
etanol
umidade
CO2sc
bagaço
palha
Monte Carlo simulations...
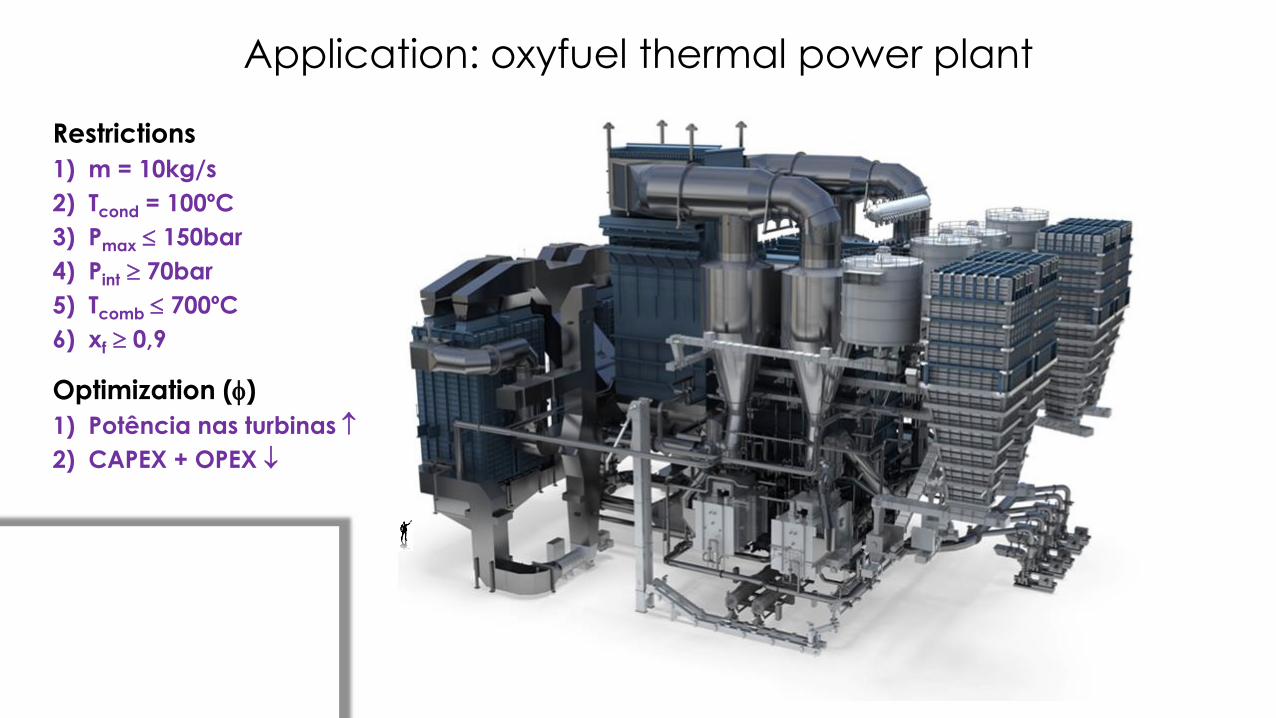
Application: oxyfuel thermal power plant
Restrictions
1) m = 10kg/s
2) Tcond = 100ºC
3) Pmax 150bar
4) Pint 70bar
5) Tcomb 700ºC
6) xf 0,9
Optimization ()
1) Potência nas turbinas
2) CAPEX + OPEX
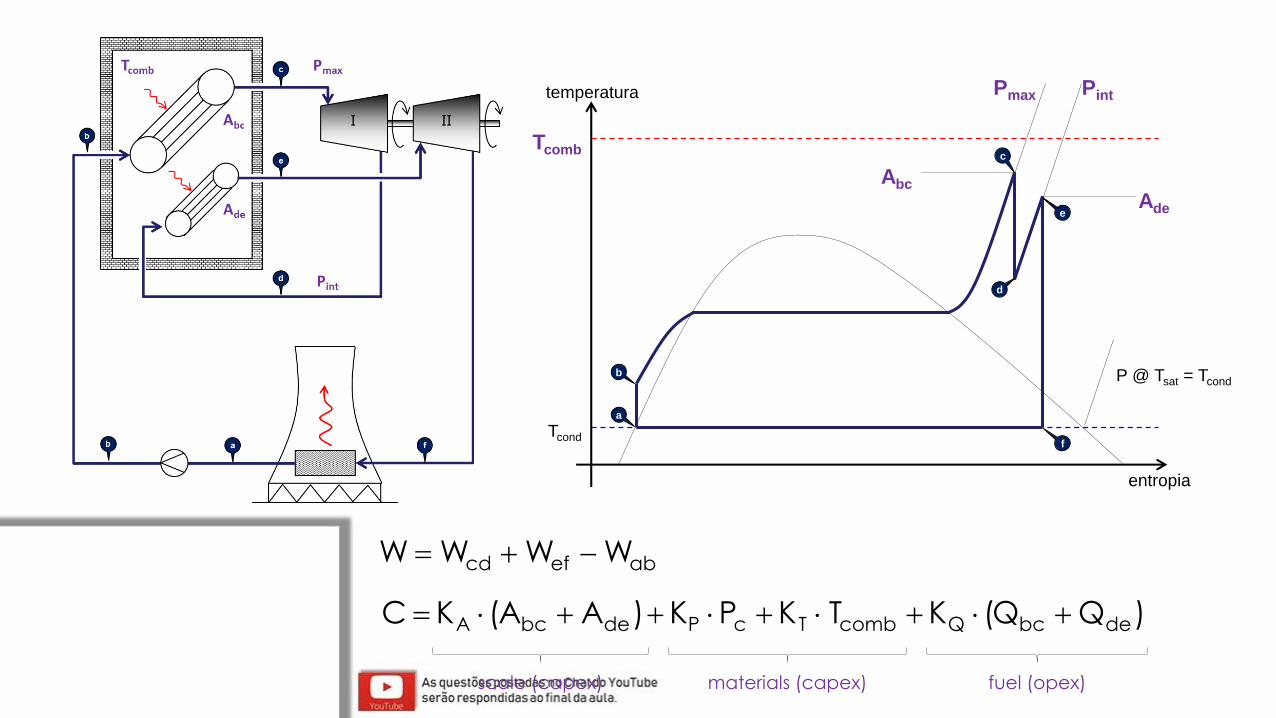
)QQ(KTKPK)AA(KC debcQcombTcPdebcA +++++=
temperatura
entropia
Tcomb
Tcond
a
b
c
e
d
f
Pmax Pint
Abc
Ade
P @ Tsat = Tcond
abefcd WWWW −+=
scale (capex) fuel (opex)materials (capex)
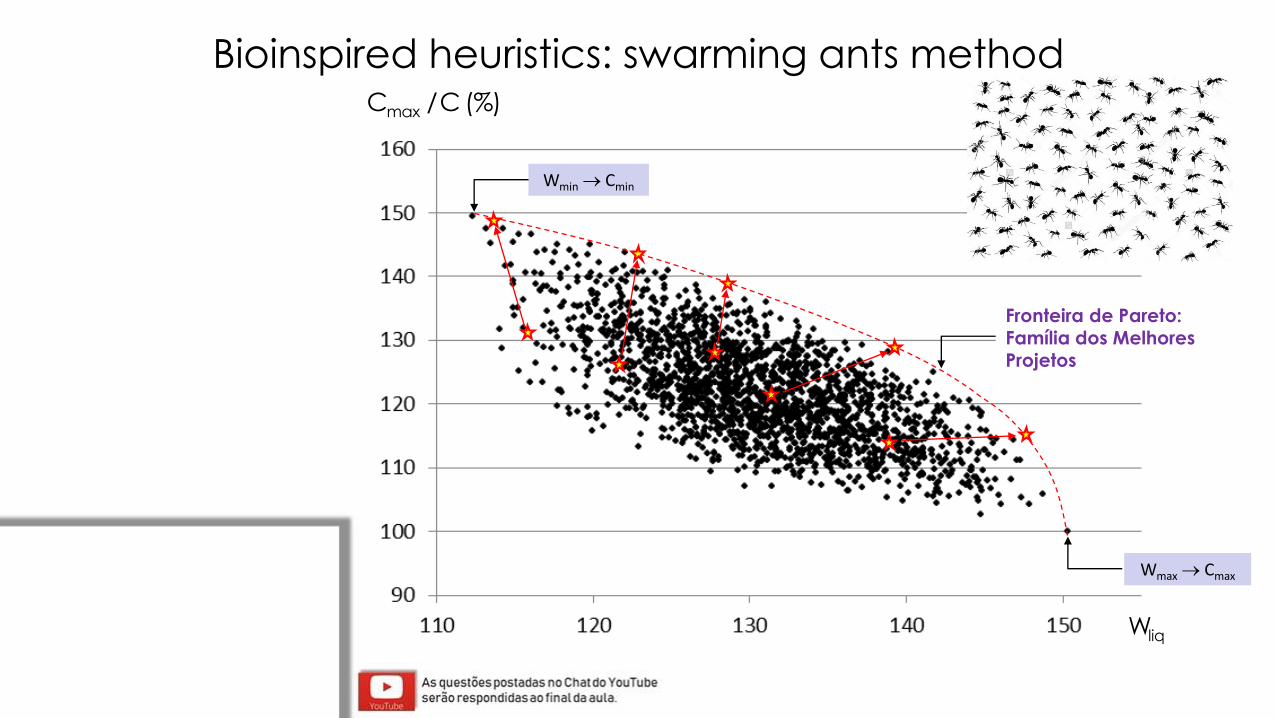
liqW
(%)C/Cmax
Wmax → Cmax
Wmin → Cmin
Fronteira de Pareto:Família dos Melhores Projetos
Bioinspired heuristics: swarming ants method
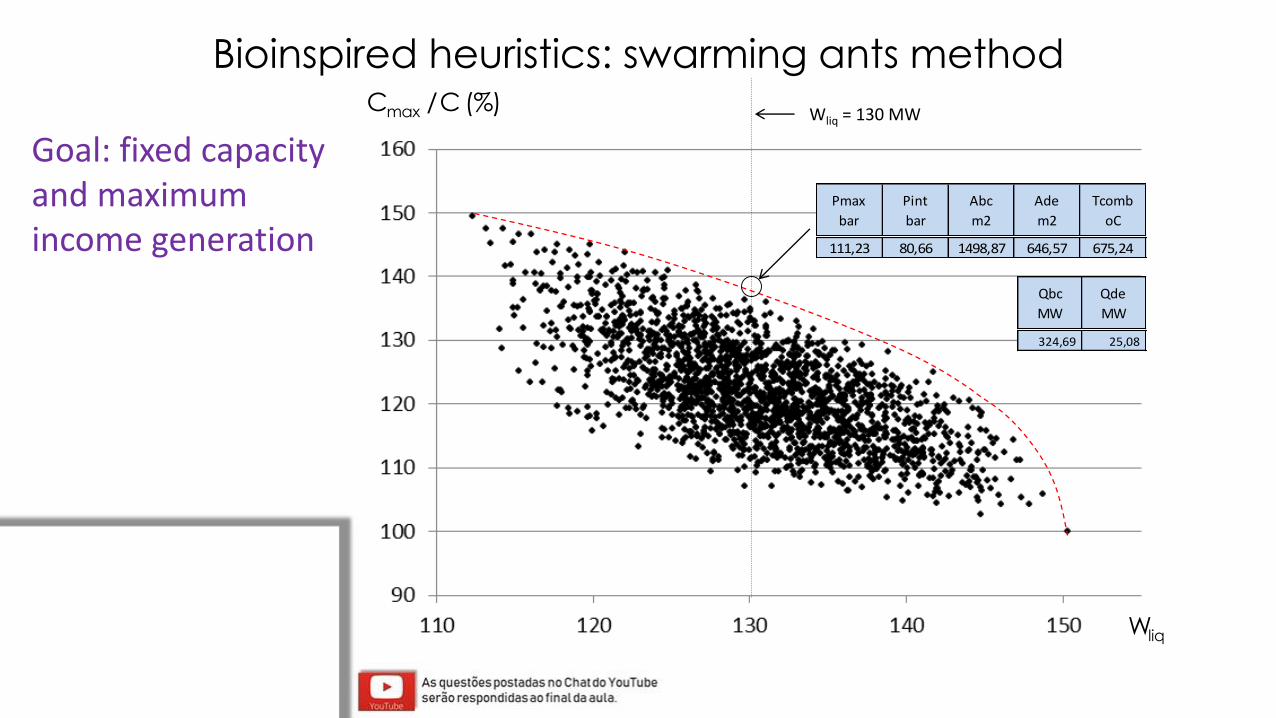
liqW
(%)C/Cmax Wliq = 130 MW
Pmax
bar
Pint
bar
Abc
m2
Ade
m2
Tcomb
oC
111,23 80,66 1498,87 646,57 675,24
Goal: fixed capacity and maximum income generation
Qbc
MW
Qde
MW
324,69 25,08
Bioinspired heuristics: swarming ants method
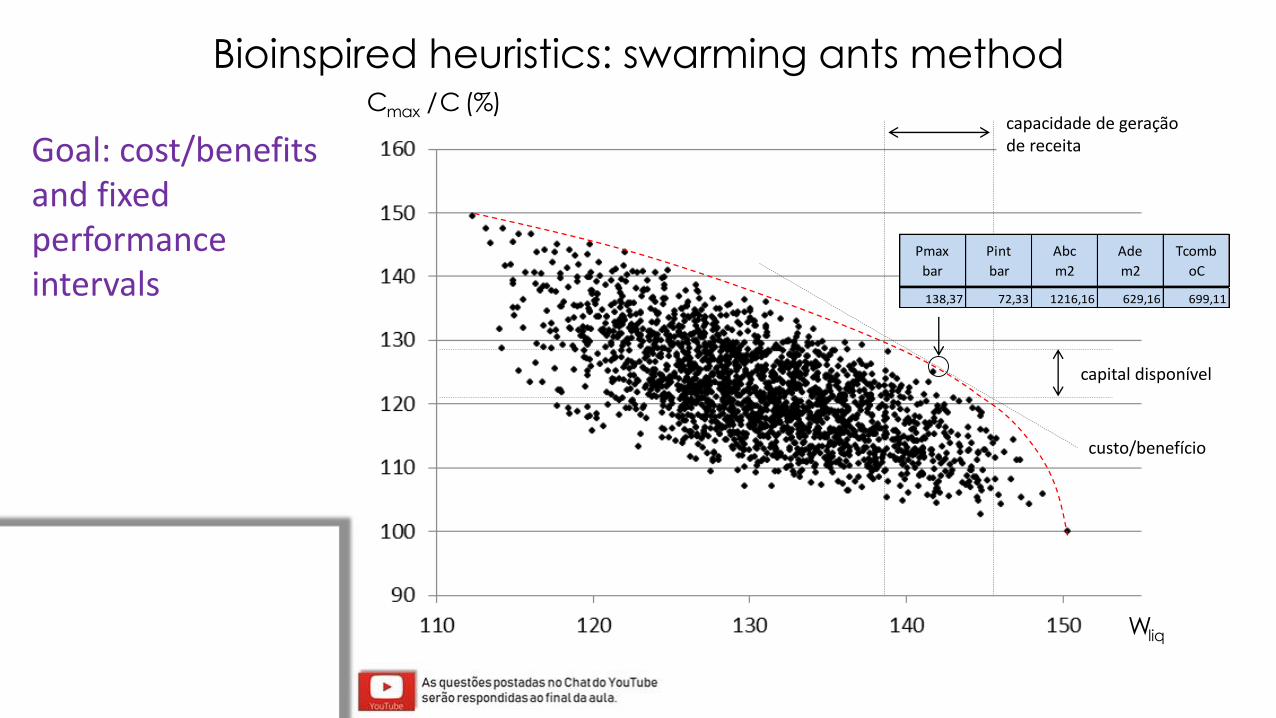
liqW
(%)C/Cmax
capital disponível
capacidade de geração de receita
custo/benefício
138,37 72,33 1216,16 629,16 699,11
Pmax
bar
Pint
bar
Abc
m2
Ade
m2
Tcomb
oC
Goal: cost/benefits and fixed performance intervals
Bioinspired heuristics: swarming ants method

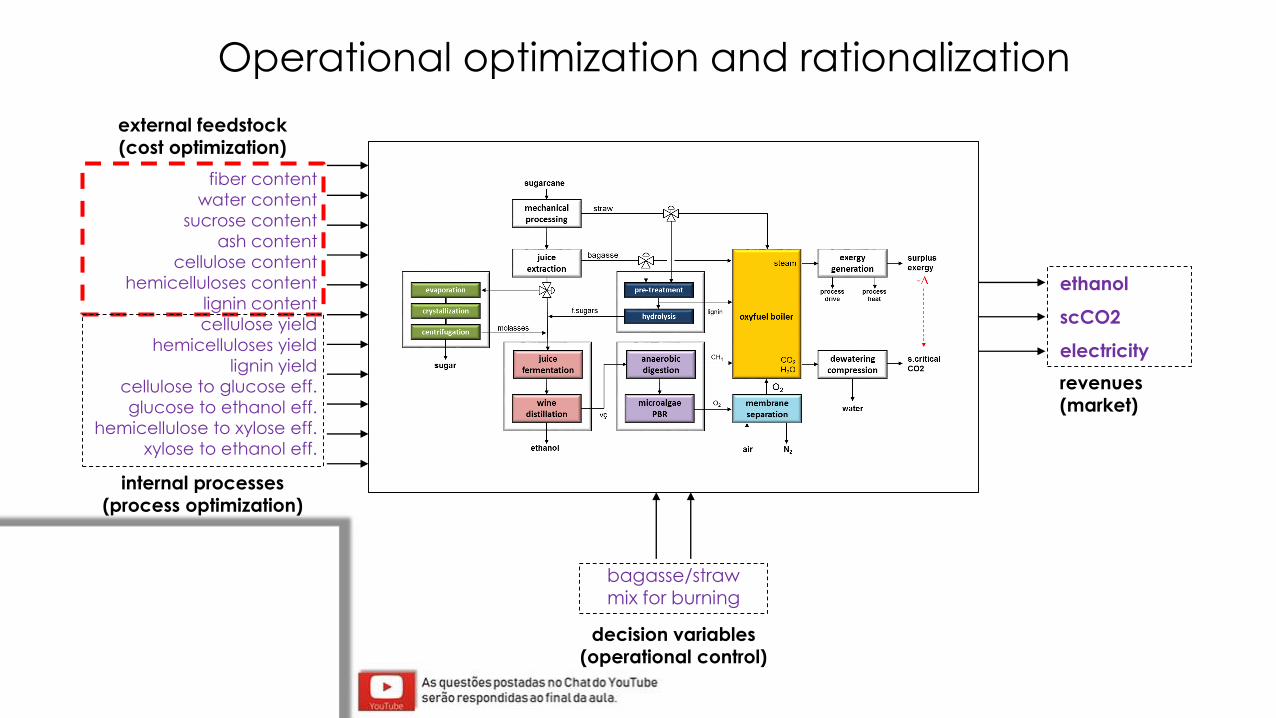
Operational optimization and
rationalization
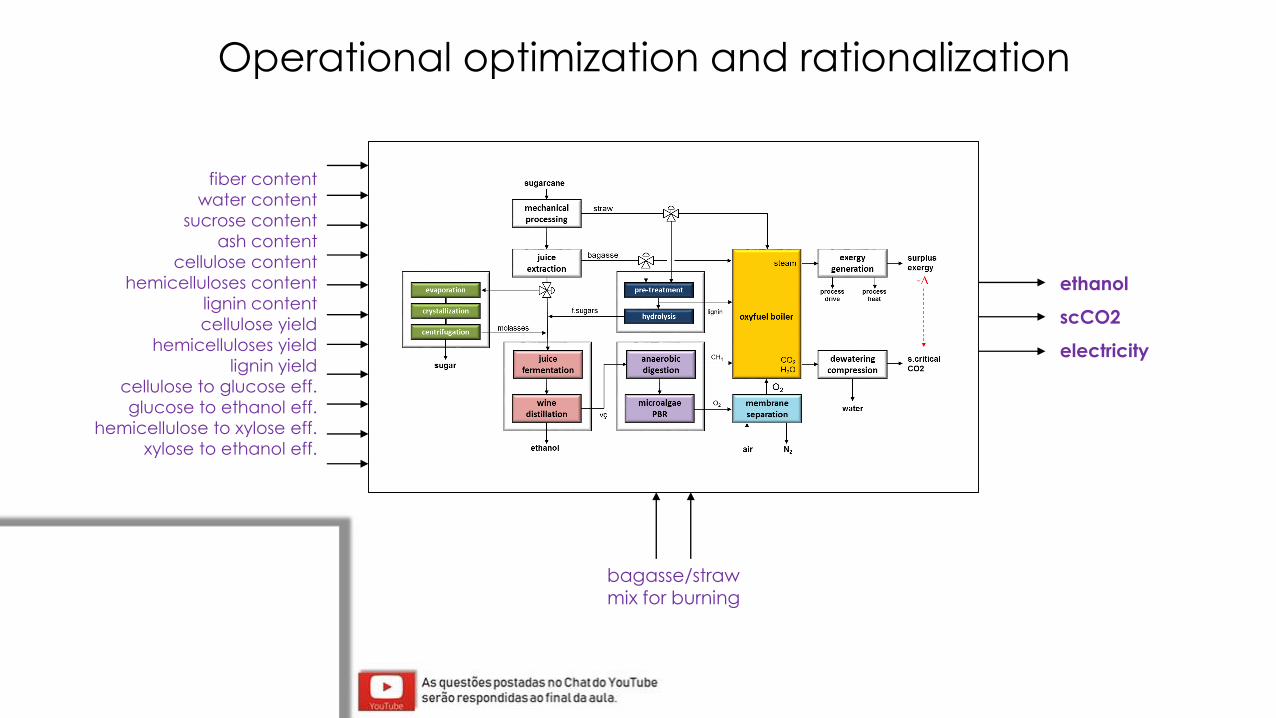
fiber content
water content
sucrose content
ash content
cellulose content
hemicelluloses content
lignin content
cellulose yield
hemicelluloses yield
lignin yield
cellulose to glucose eff.
glucose to ethanol eff.
hemicellulose to xylose eff.
xylose to ethanol eff.
Operational optimization and rationalization
ethanol
scCO2
electricity
bagasse/straw mix for burning
fiber content
water content
sucrose content
ash content
cellulose content
hemicelluloses content
lignin content
cellulose yield
hemicelluloses yield
lignin yield
cellulose to glucose eff.
glucose to ethanol eff.
hemicellulose to xylose eff.
xylose to ethanol eff.
external feedstock(cost optimization)
internal processes(process optimization)
decision variables(operational control)
revenues(market)
ethanol
scCO2
electricity
bagasse/straw mix for burning
Operational optimization and rationalization
Energy rationalization...
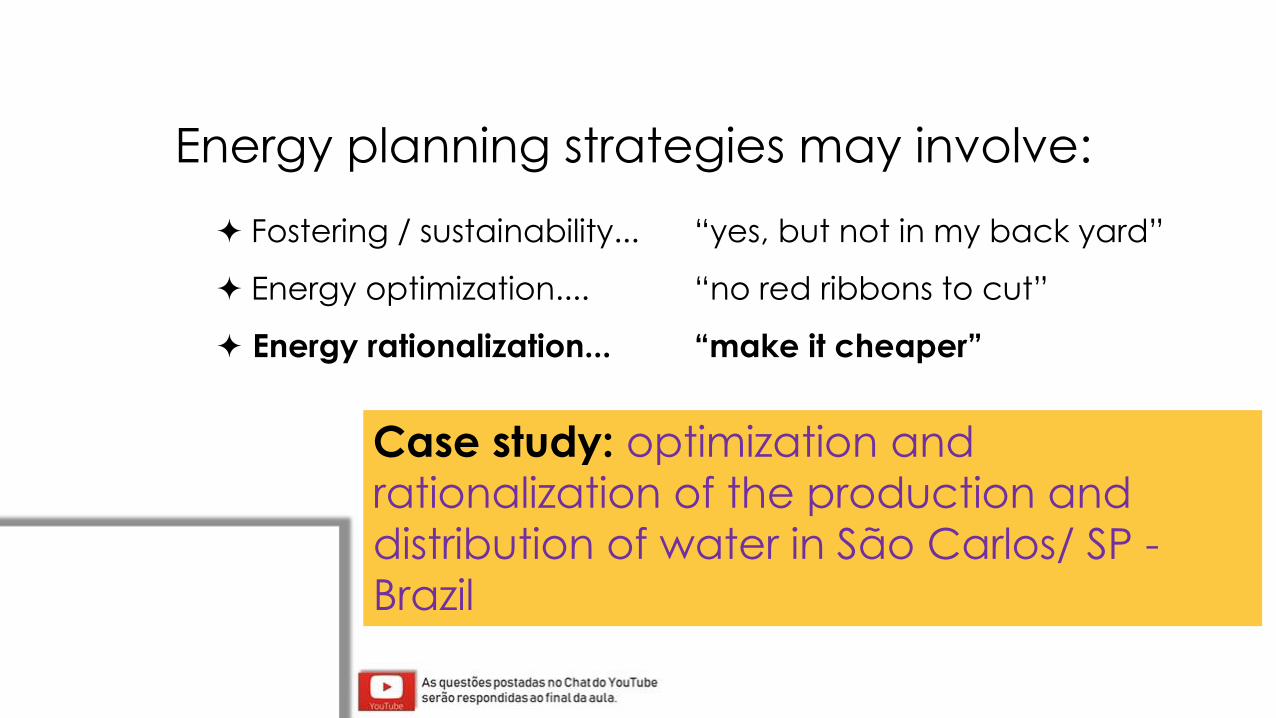
Case study: optimization and
rationalization of the production and
distribution of water in São Carlos/ SP -
Brazil
Energy planning strategies may involve:
Fostering / sustainability... “yes, but not in my back yard”
Energy optimization.... “no red ribbons to cut”
Energy rationalization... “make it cheaper”
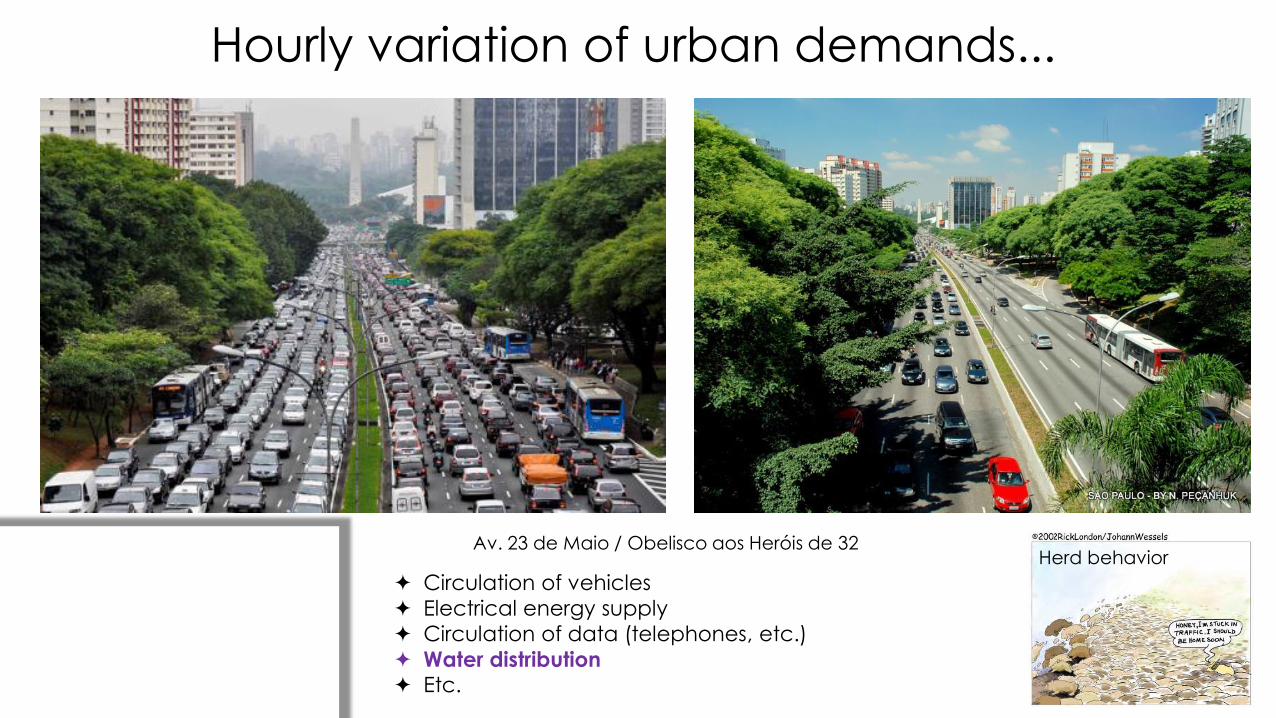
Hourly variation of urban demands...
Av. 23 de Maio / Obelisco aos Heróis de 32
Circulation of vehicles
Electrical energy supply
Circulation of data (telephones, etc.)
Water distribution Etc.
Herd behavior
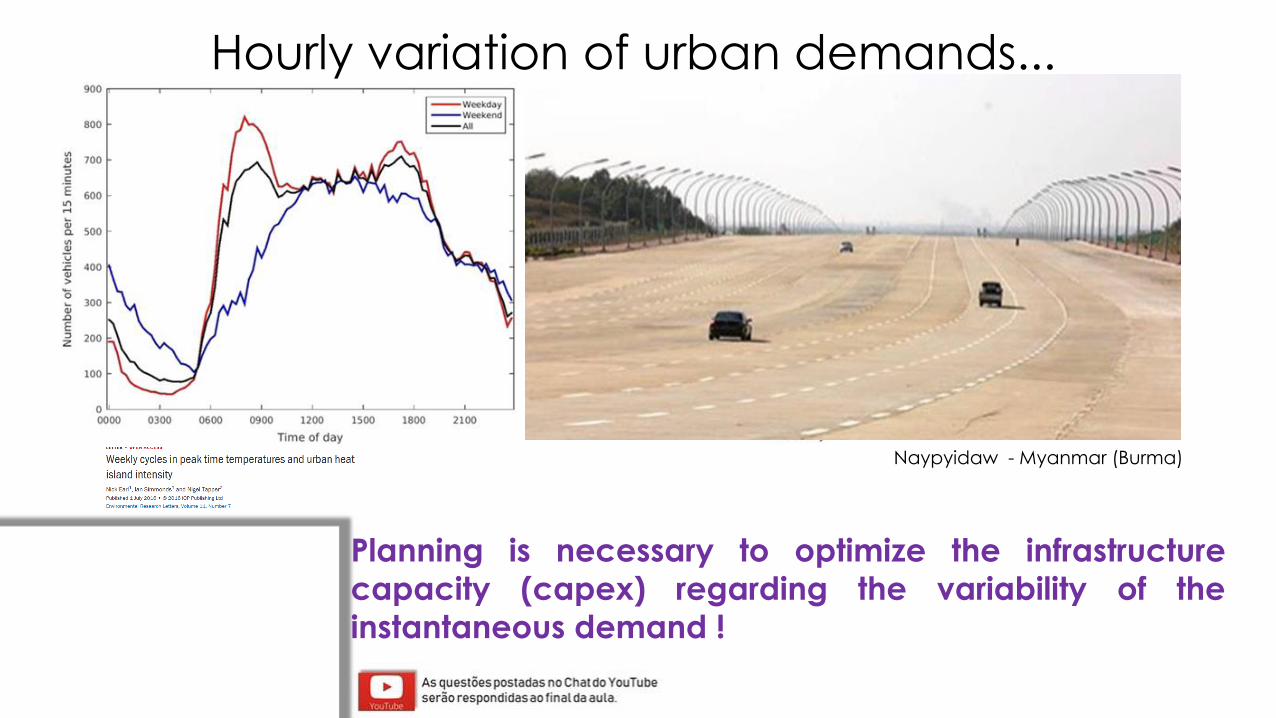
Planning is necessary to optimize the infrastructure
capacity (capex) regarding the variability of the
instantaneous demand !
Hourly variation of urban demands...
Naypyidaw - Myanmar (Burma)
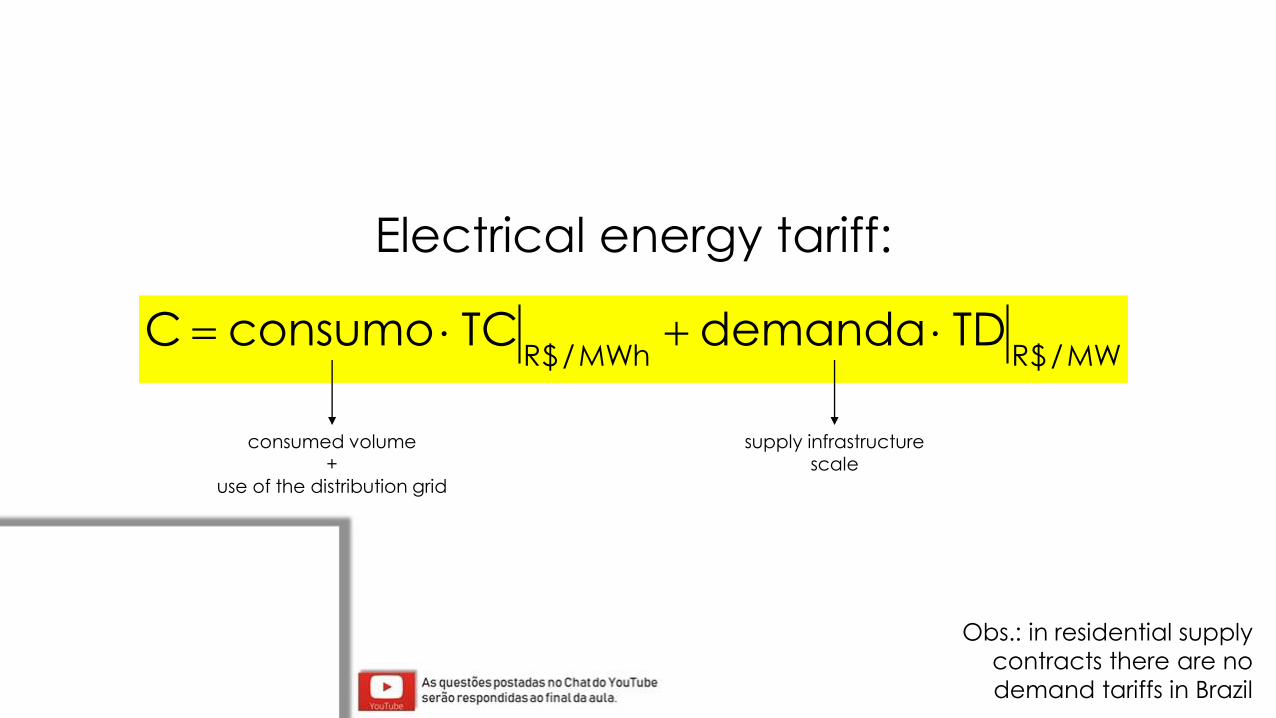
MW/$RMWh/$RTDdemandaTCconsumoC +=
Electrical energy tariff:
supply infrastructure scale
consumed volume+
use of the distribution grid
Obs.: in residential supply
contracts there are no
demand tariffs in Brazil
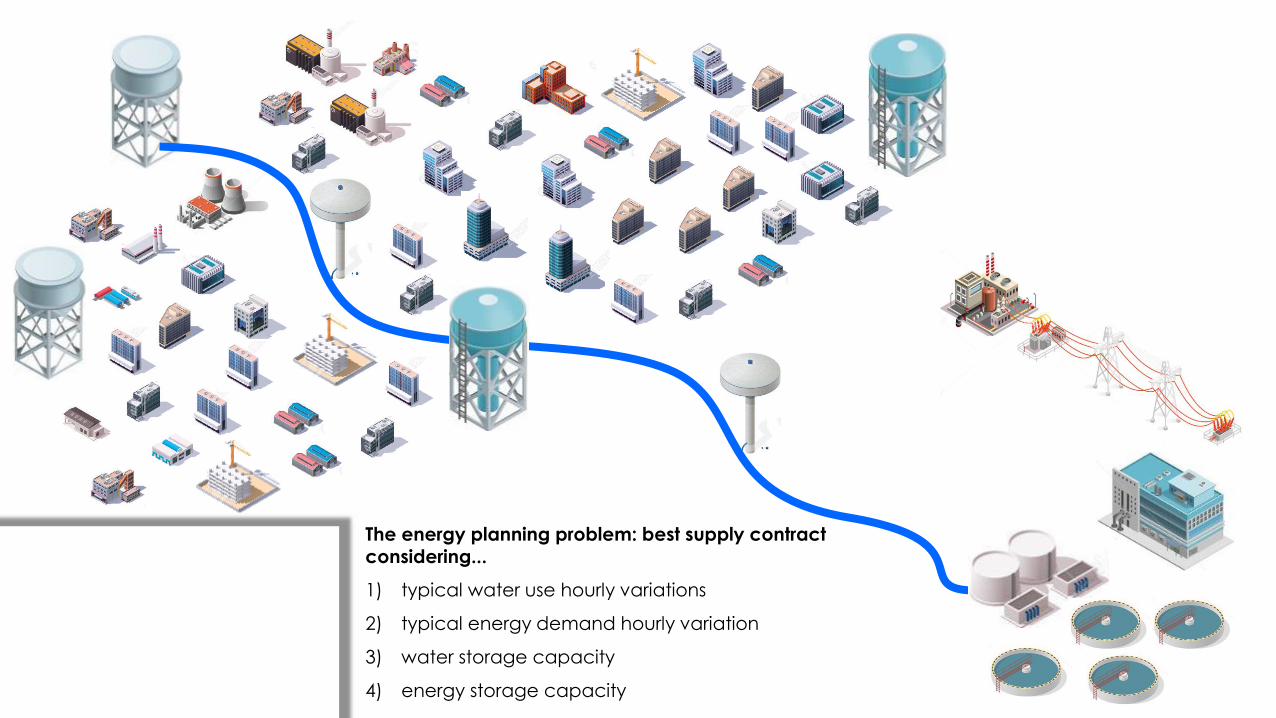
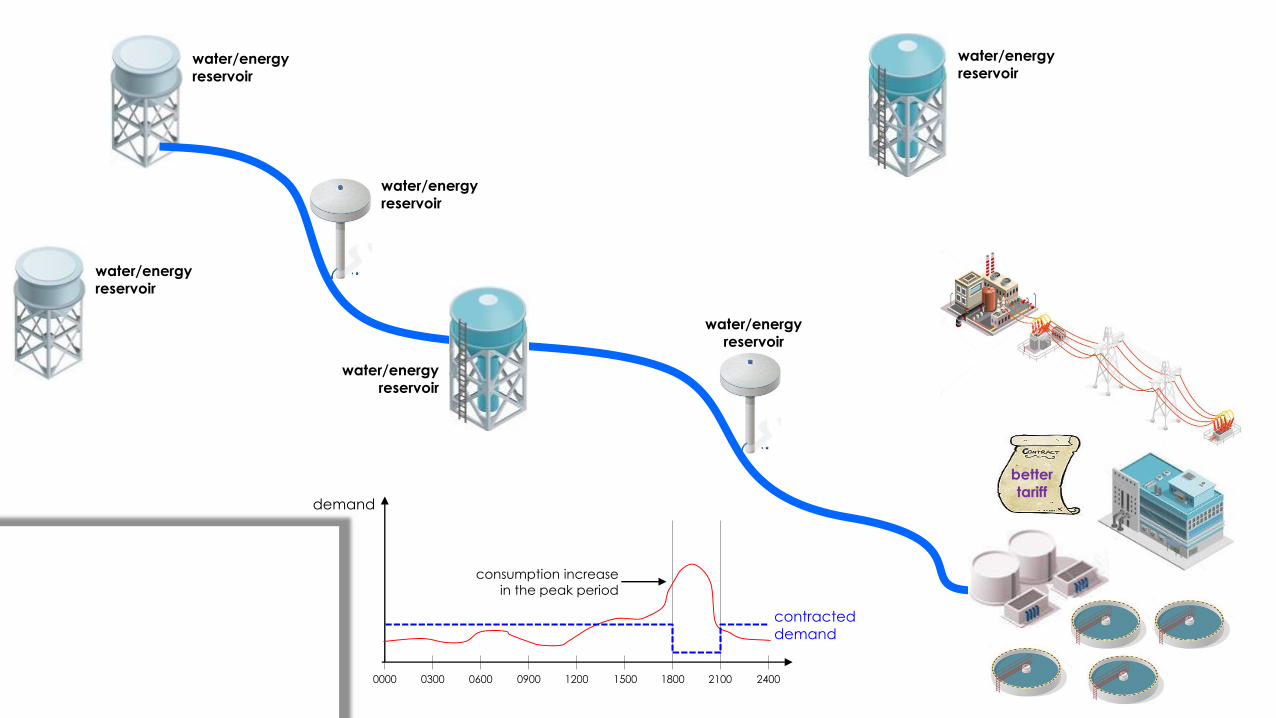
The energy planning problem: best supply contract considering...
1) typical water use hourly variations
2) typical energy demand hourly variation
3) water storage capacity
4) energy storage capacity
demand
contracteddemand
24000000 0300 0600 0900 1200 1500 1800 2100
consumption increase
in the peak period
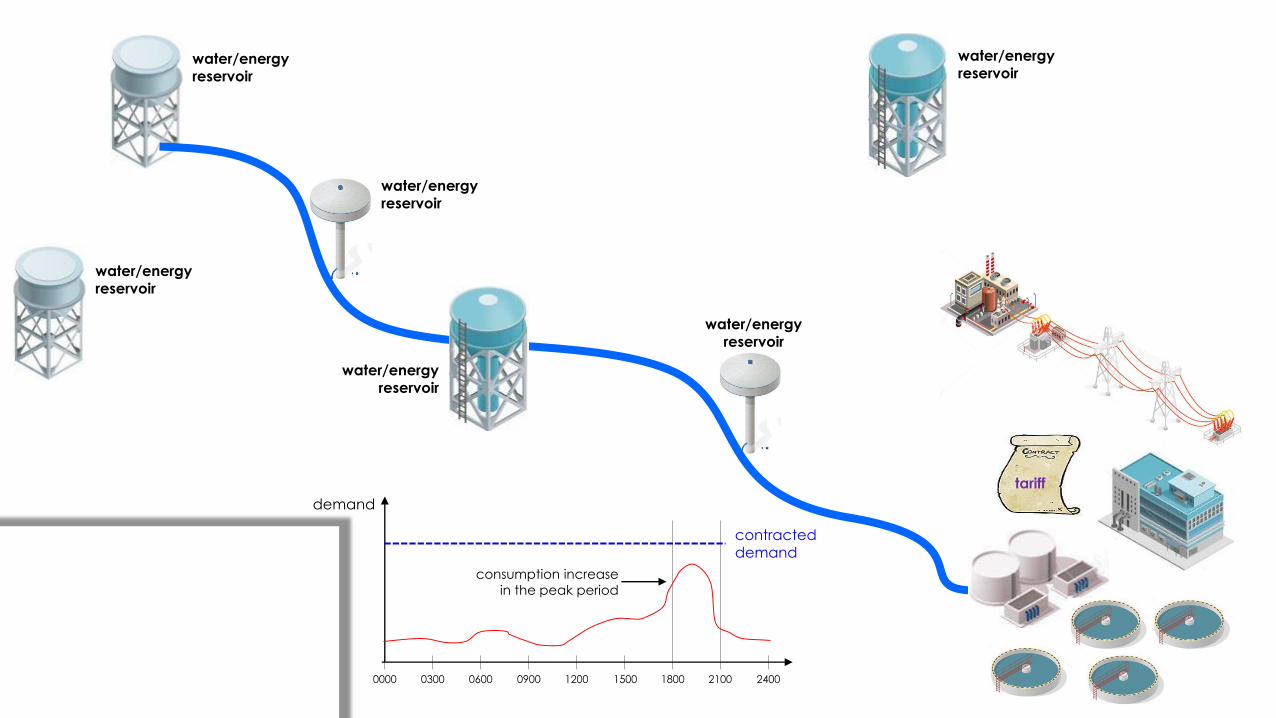
water/energy
reservoir
water/energyreservoir
water/energyreservoir
water/energyreservoir
water/energyreservoir
water/energyreservoir
tariff
demand
contracteddemand
24000000 0300 0600 0900 1200 1500 1800 2100
consumption increase
in the peak period
water/energy
reservoir
water/energyreservoir
water/energyreservoir
water/energyreservoir
water/energyreservoir
water/energyreservoir
bettertariff
How to control reservoirs and pumps during the day
assuring water supply and, simultaneously,
complying with the requirements of the energy
contract with hour-seasonal differentiation ?
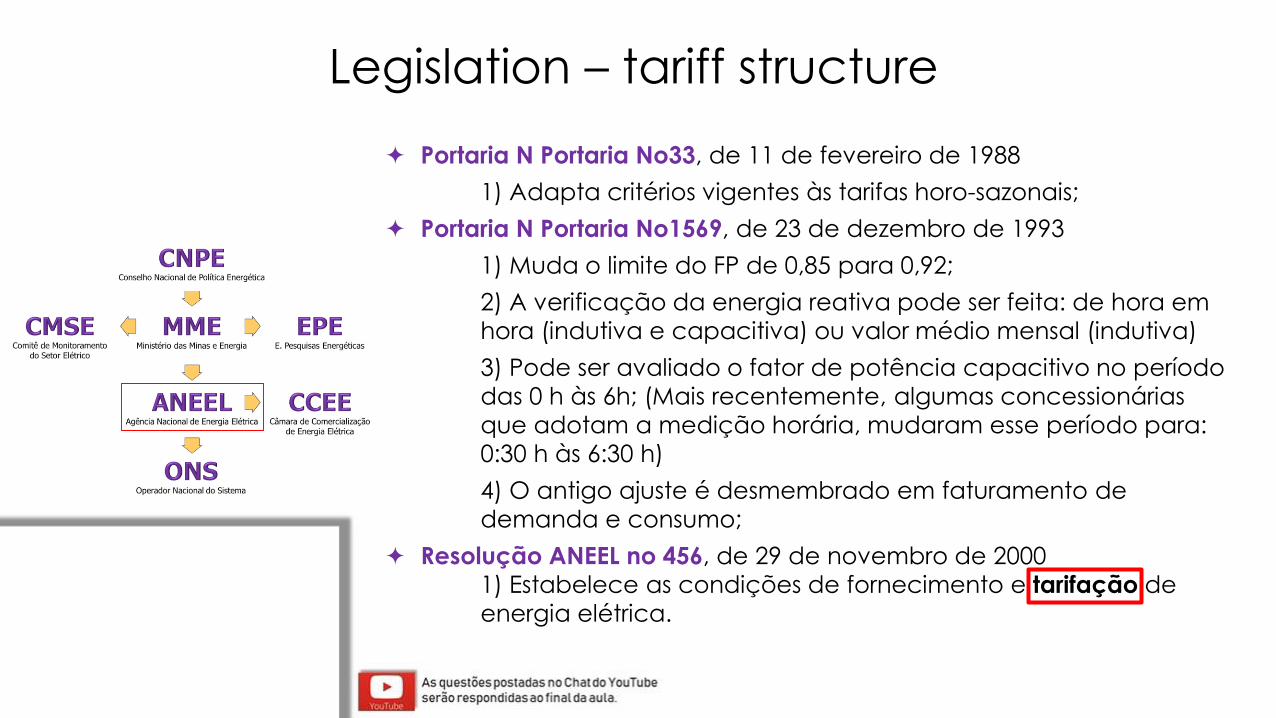
Portaria N Portaria No33, de 11 de fevereiro de 1988
1) Adapta critérios vigentes às tarifas horo-sazonais;
Portaria N Portaria No1569, de 23 de dezembro de 1993
1) Muda o limite do FP de 0,85 para 0,92;
2) A verificação da energia reativa pode ser feita: de hora em
hora (indutiva e capacitiva) ou valor médio mensal (indutiva)
3) Pode ser avaliado o fator de potência capacitivo no período
das 0 h às 6h; (Mais recentemente, algumas concessionárias
que adotam a medição horária, mudaram esse período para:
0:30 h às 6:30 h)
4) O antigo ajuste é desmembrado em faturamento de
demanda e consumo;
Resolução ANEEL no 456, de 29 de novembro de 2000
1) Estabelece as condições de fornecimento e tarifação de
energia elétrica.
Legislation – tariff structure
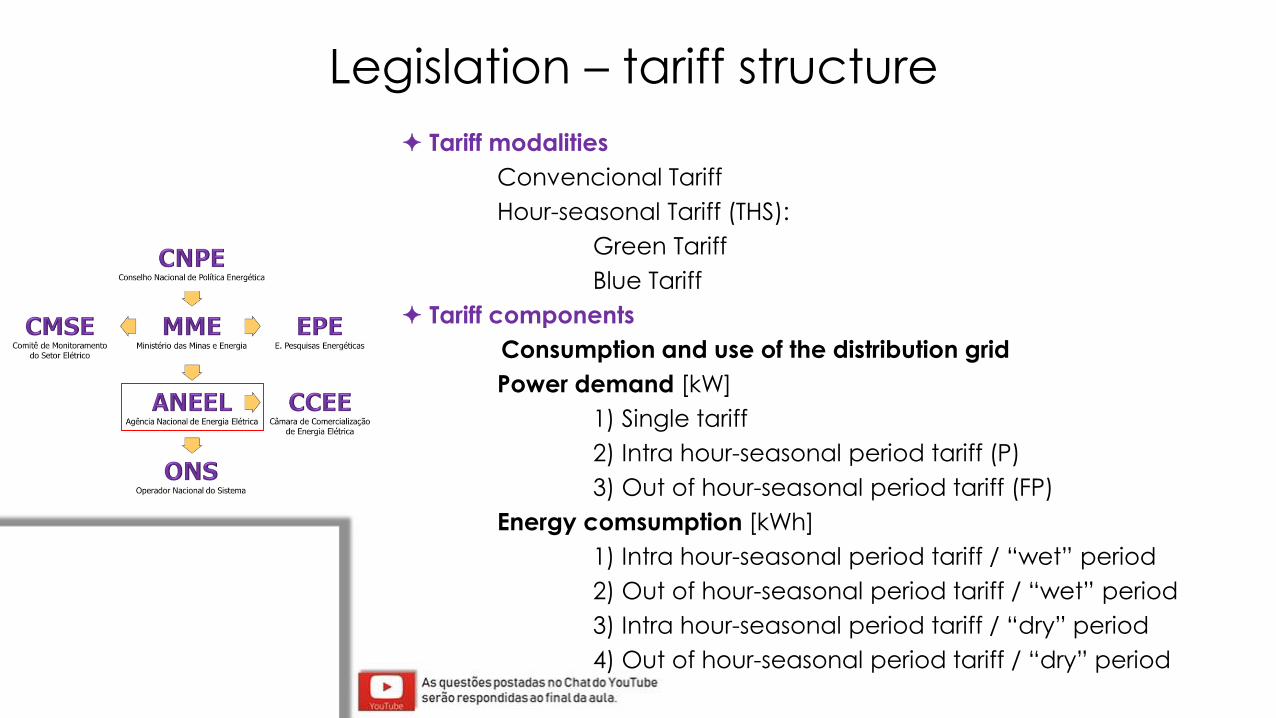
Tariff modalities
Convencional Tariff
Hour-seasonal Tariff (THS):
Green Tariff
Blue Tariff
Tariff components
Consumption and use of the distribution grid
Power demand [kW]
1) Single tariff
2) Intra hour-seasonal period tariff (P)
3) Out of hour-seasonal period tariff (FP)
Energy comsumption [kWh]
1) Intra hour-seasonal period tariff / “wet” period
2) Out of hour-seasonal period tariff / “wet” period
3) Intra hour-seasonal period tariff / “dry” period
4) Out of hour-seasonal period tariff / “dry” period
Legislation – tariff structure
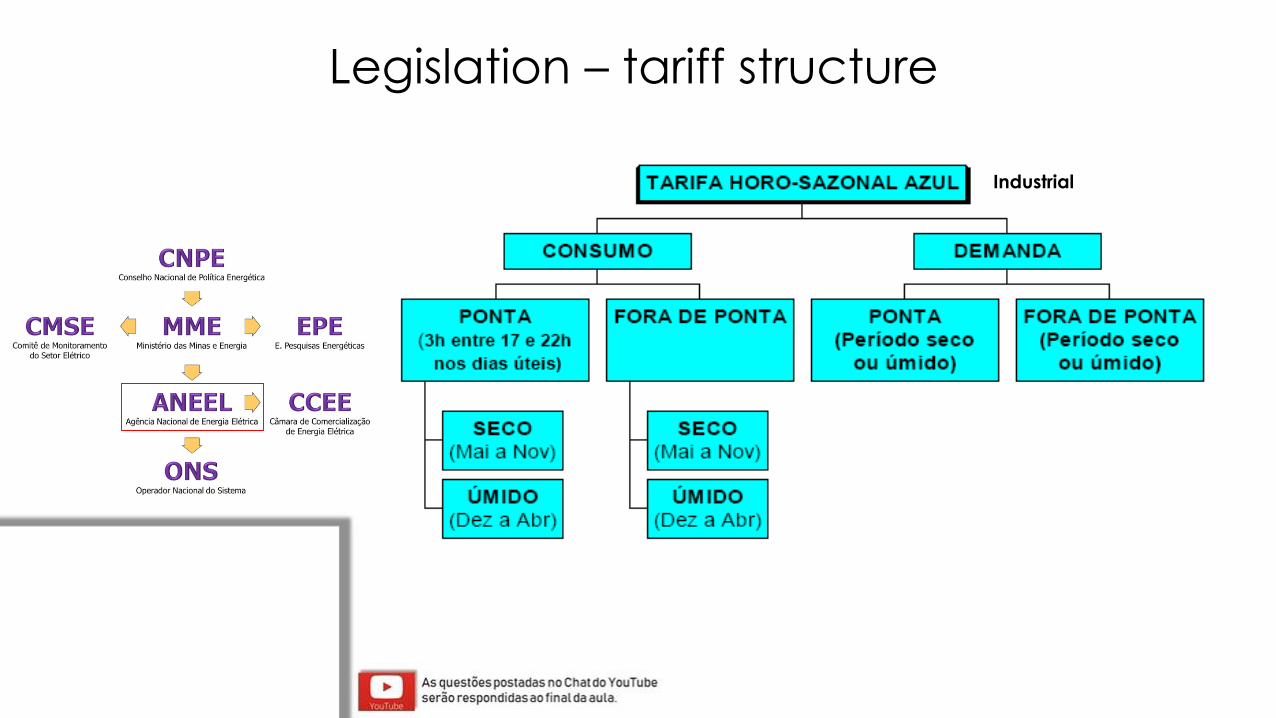
Industrial
Legislation – tariff structure
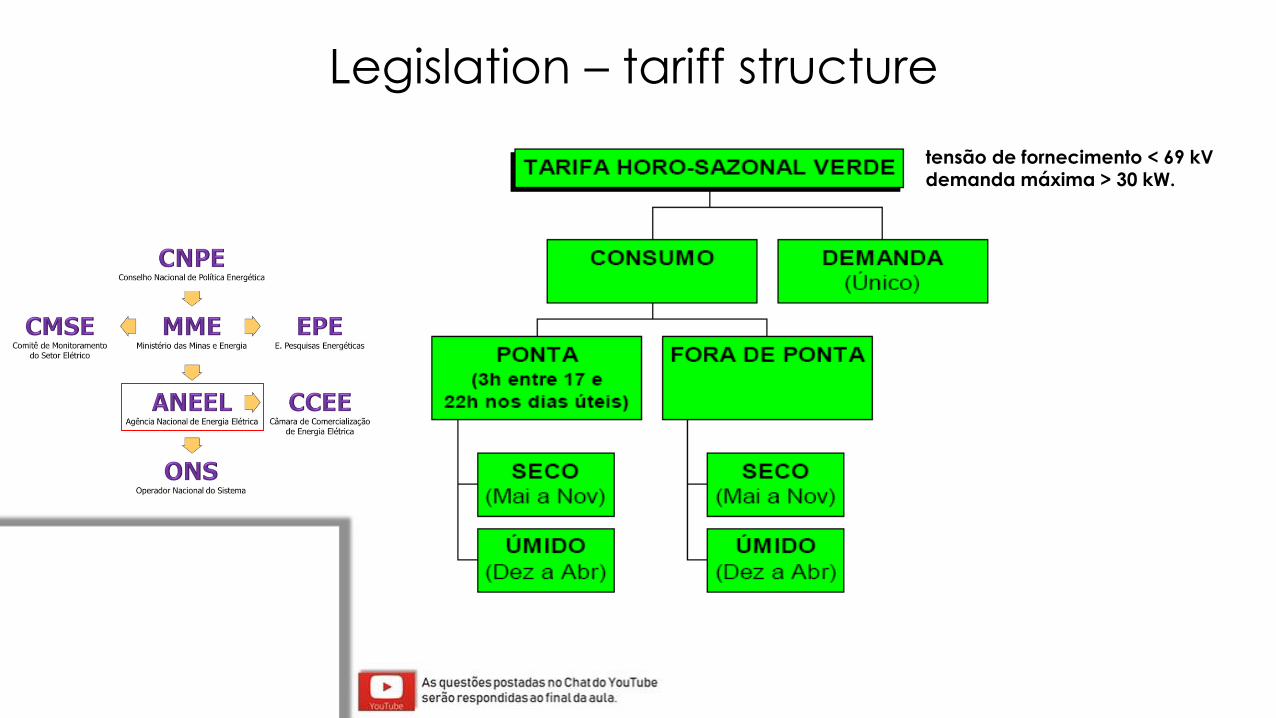
tensão de fornecimento < 69 kV
demanda máxima > 30 kW.
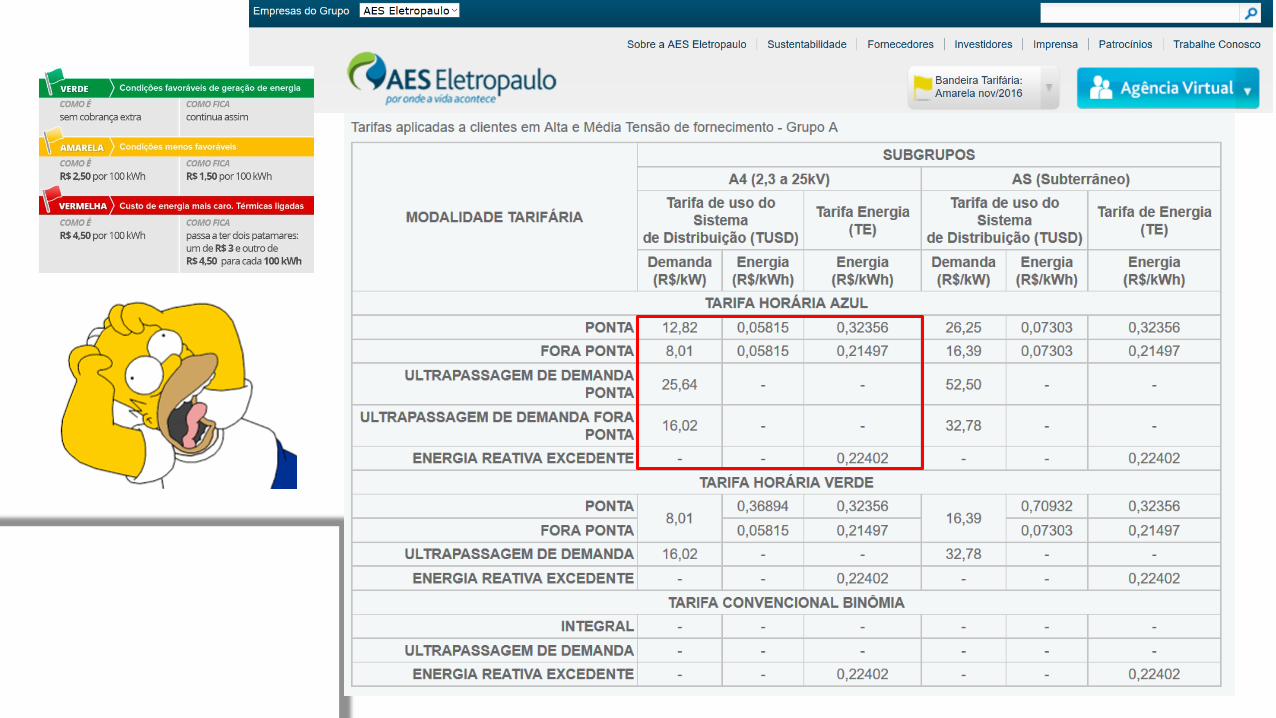
Legislation – tariff structure
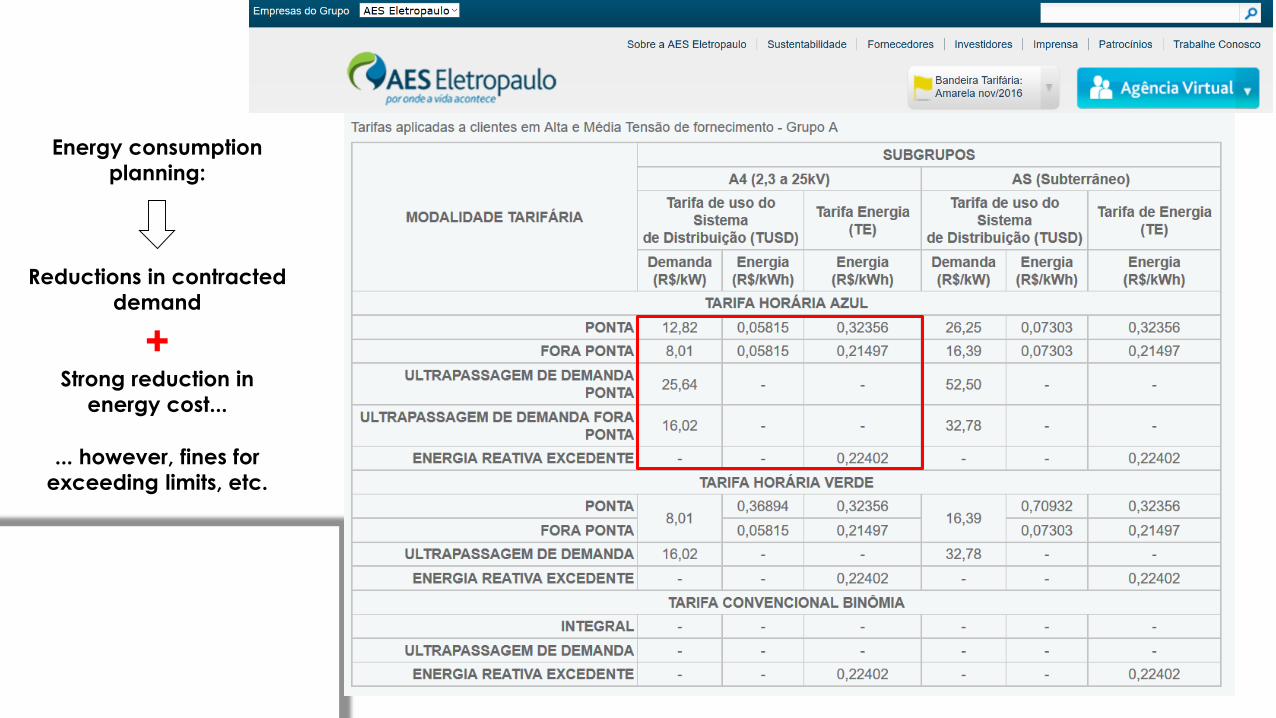
Energy consumption
planning:
Reductions in contracted
demand
+Strong reduction in
energy cost...
... however, fines for
exceeding limits, etc.
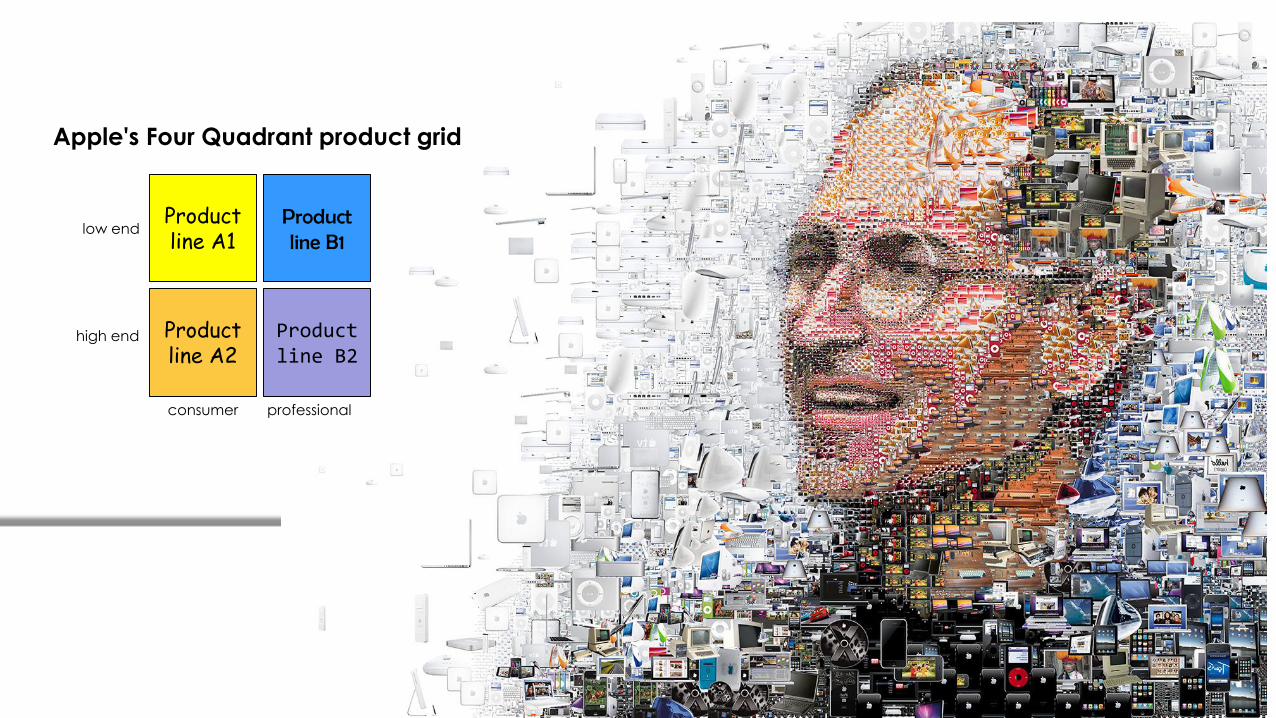
Apple's Four Quadrant product grid
Product line A1
consumer professional
high end
low endProduct line B1
Product line A2
Product line B2
Application to different urban environments:
IV Mostra de Ciência e Tecnologia em Políticas Municipais
Jorge Nicolau dos SANTOS e Paulo SELEGHIM Jr.
Núcleo de Engenharia Térmica e Fluidos
Escola de Engenharia de São Carlos
Universidade de São Paulo
ENERGY OPTIMIZATION AND
RATIONALIZATION IN WATER
DISTRIBUTION URBAN NETWORKS
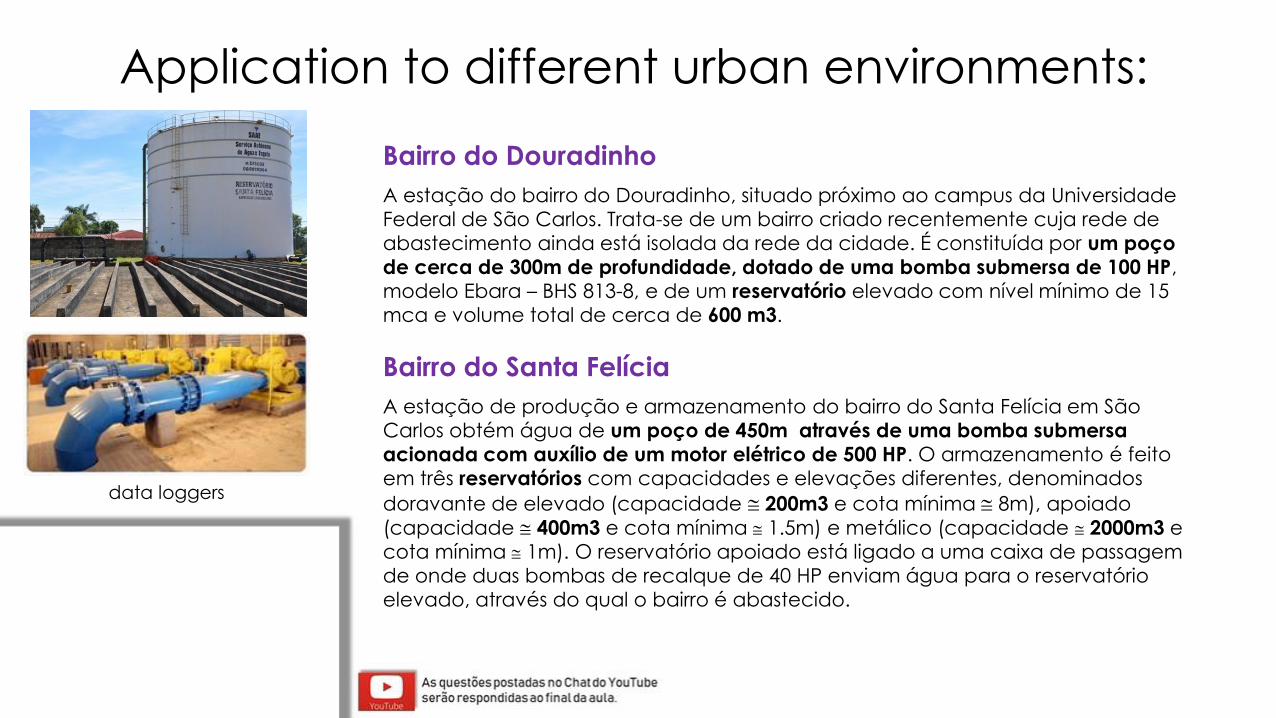
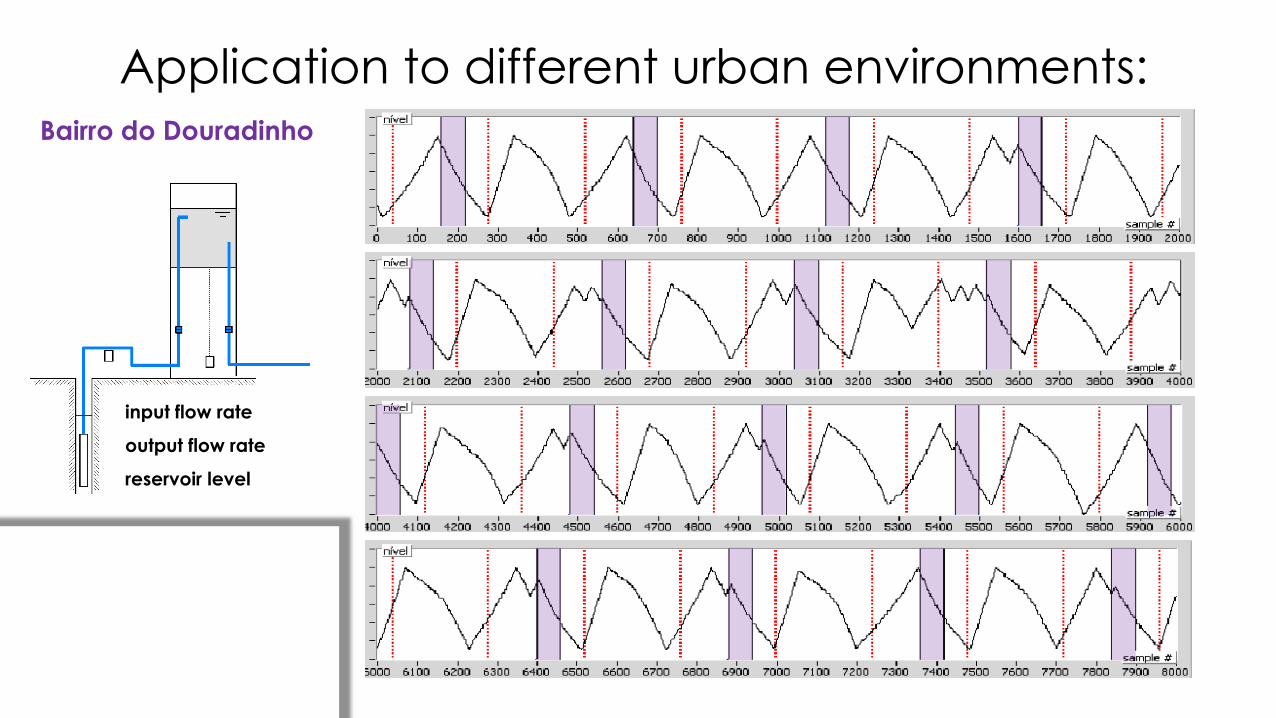
Bairro do Douradinho
A estação do bairro do Douradinho, situado próximo ao campus da Universidade
Federal de São Carlos. Trata-se de um bairro criado recentemente cuja rede de
abastecimento ainda está isolada da rede da cidade. É constituída por um poço
de cerca de 300m de profundidade, dotado de uma bomba submersa de 100 HP,
modelo Ebara – BHS 813-8, e de um reservatório elevado com nível mínimo de 15
mca e volume total de cerca de 600 m3.
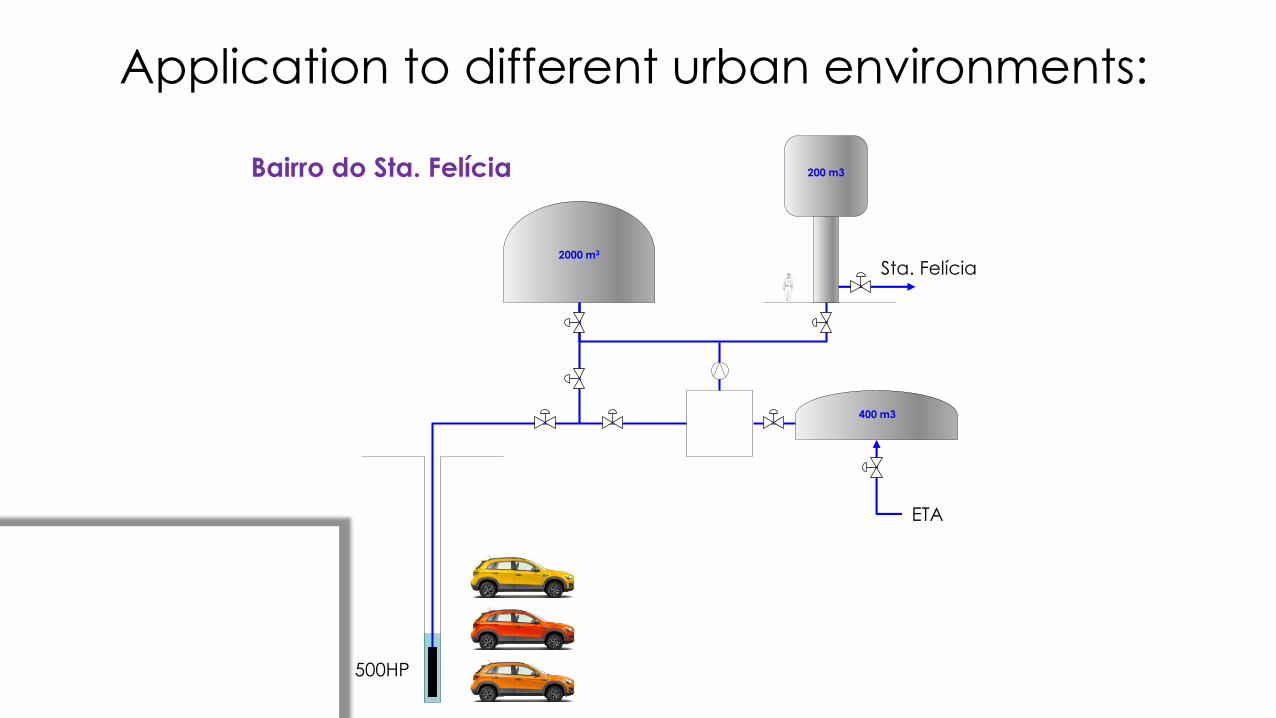
Bairro do Santa Felícia
A estação de produção e armazenamento do bairro do Santa Felícia em São
Carlos obtém água de um poço de 450m através de uma bomba submersa
acionada com auxílio de um motor elétrico de 500 HP. O armazenamento é feito
em três reservatórios com capacidades e elevações diferentes, denominados
doravante de elevado (capacidade 200m3 e cota mínima 8m), apoiado
(capacidade 400m3 e cota mínima 1.5m) e metálico (capacidade 2000m3 e
cota mínima 1m). O reservatório apoiado está ligado a uma caixa de passagem
de onde duas bombas de recalque de 40 HP enviam água para o reservatório
elevado, através do qual o bairro é abastecido.
data loggers
Application to different urban environments:

Santa Felícia
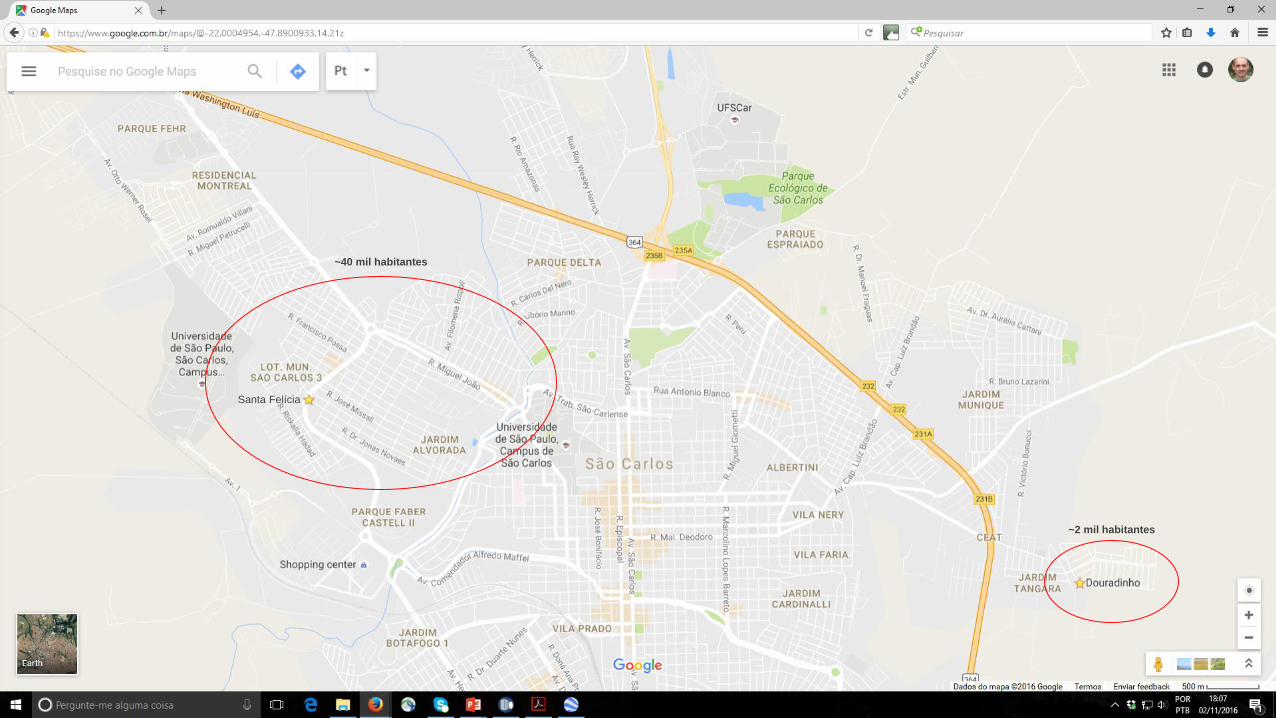
Santa Felícia
~40 mil habitantes
~2 mil habitantes
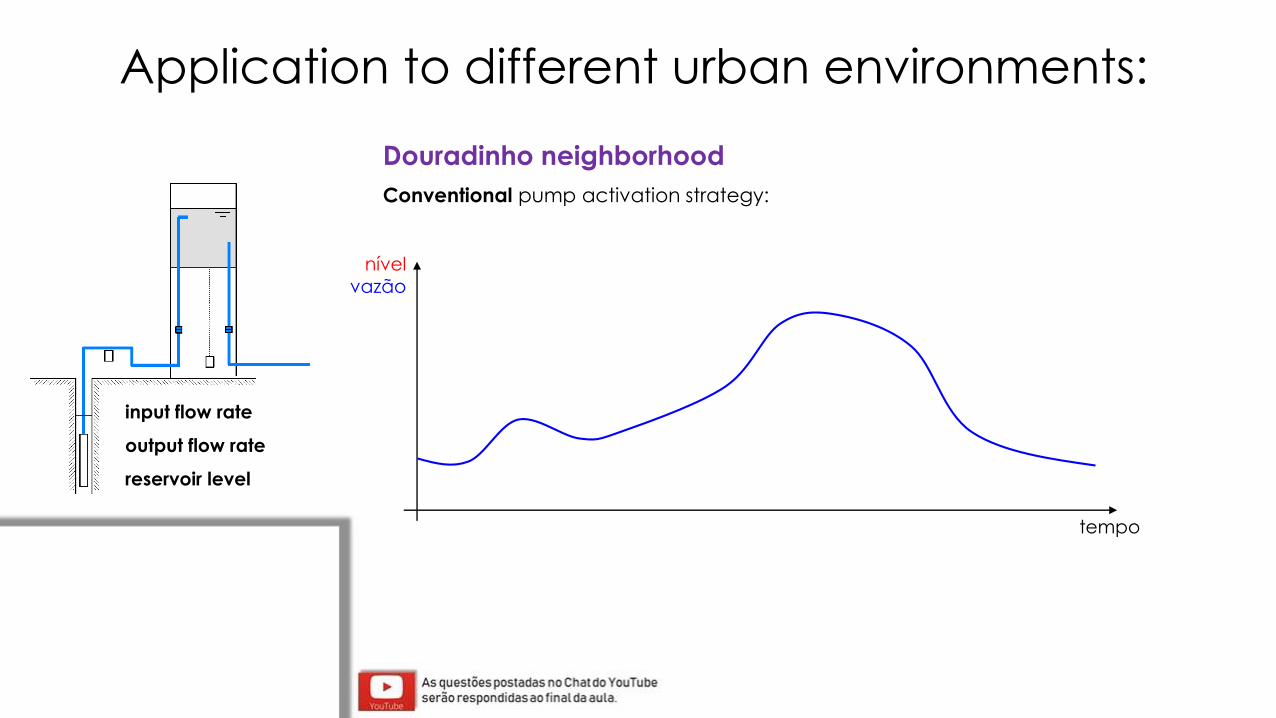
input flow rate
output flow rate
reservoir level
tempo
nívelvazão
Application to different urban environments:
Douradinho neighborhood
Conventional pump activation strategy:
input flow rate
output flow rate
reservoir level
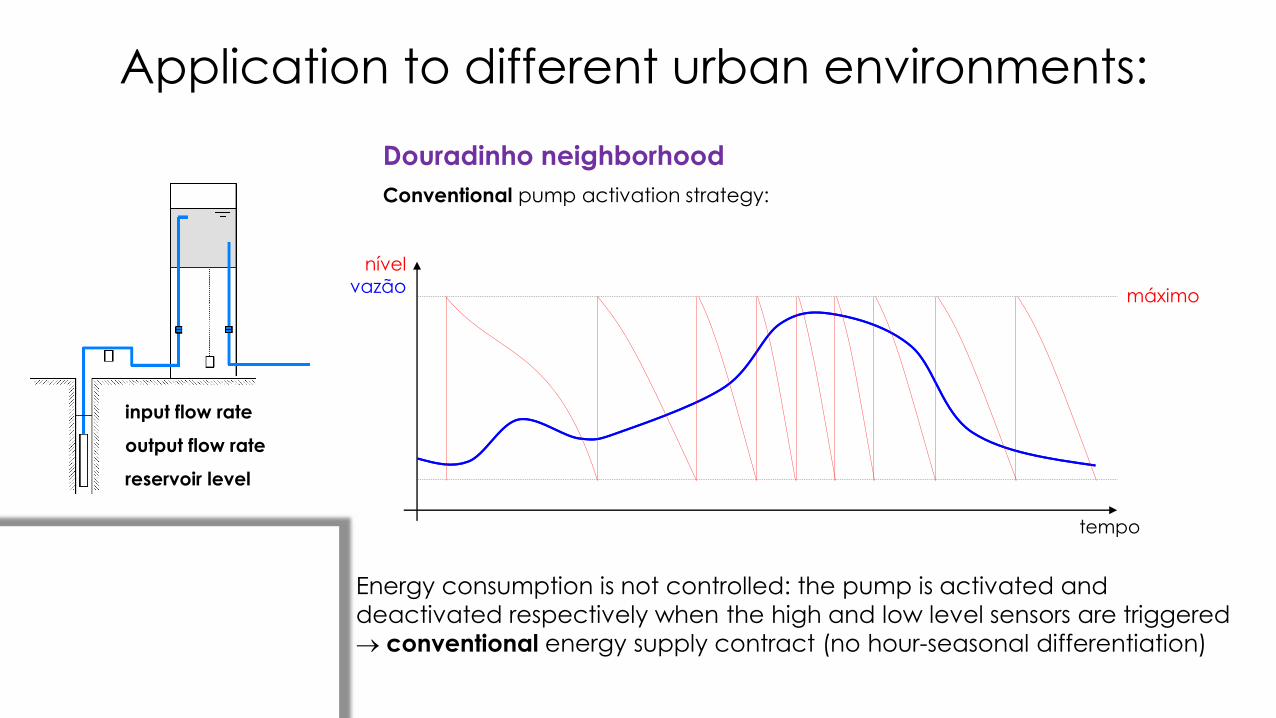
Douradinho neighborhood
Conventional pump activation strategy:
tempo
Energy consumption is not controlled: the pump is activated and
deactivated respectively when the high and low level sensors are triggered
→ conventional energy supply contract (no hour-seasonal differentiation)
nívelvazão
Application to different urban environments:
máximo
input flow rate
output flow rate
reservoir level
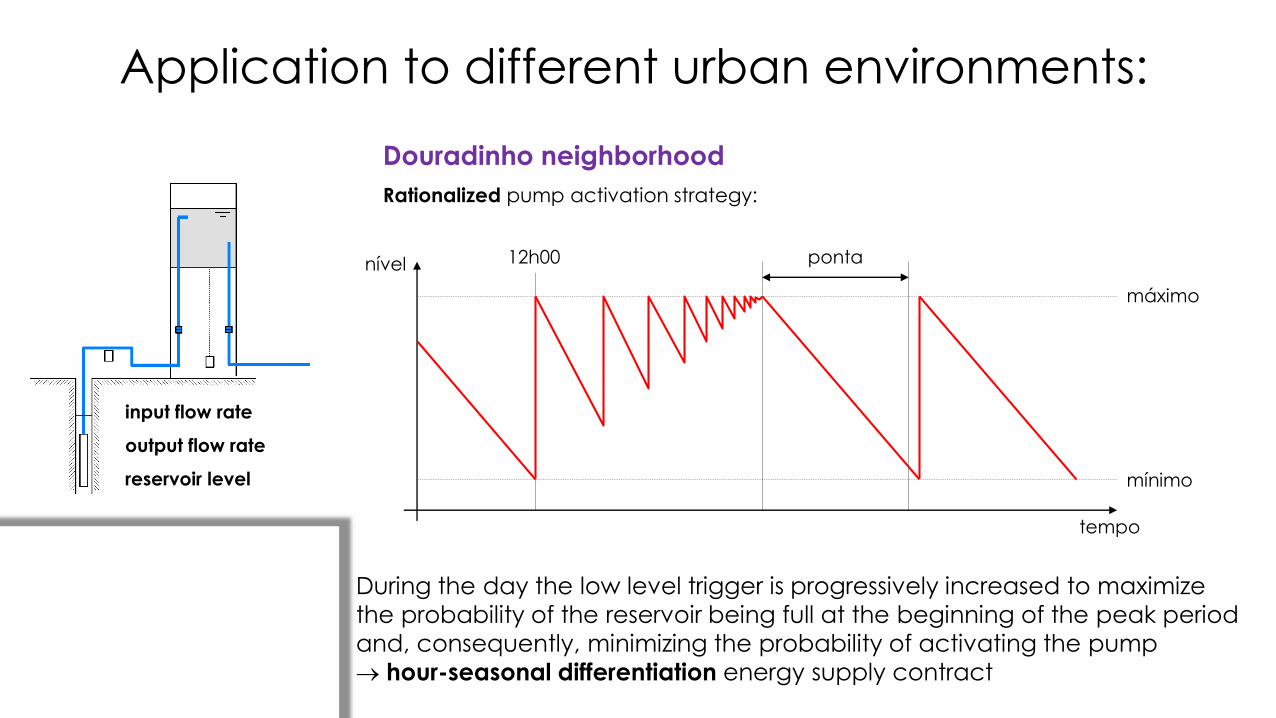
Douradinho neighborhood
Rationalized pump activation strategy:
tempo
During the day the low level trigger is progressively increased to maximize
the probability of the reservoir being full at the beginning of the peak period
and, consequently, minimizing the probability of activating the pump
→ hour-seasonal differentiation energy supply contract
Application to different urban environments:
nível
mínimo
máximo
ponta12h00
Bairro do Douradinho
Application to different urban environments:
input flow rate
output flow rate
reservoir level
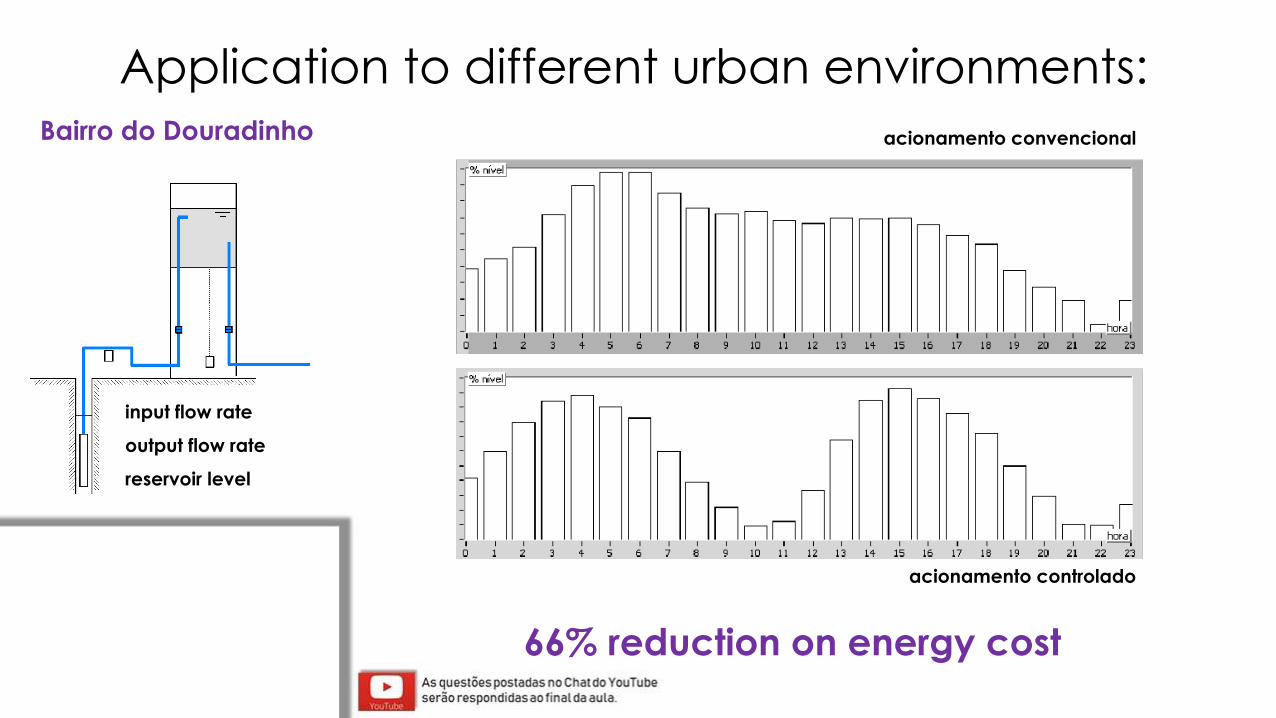
acionamento convencional
acionamento controlado
66% reduction on energy cost
Bairro do Douradinho
Application to different urban environments:
input flow rate
output flow rate
reservoir level
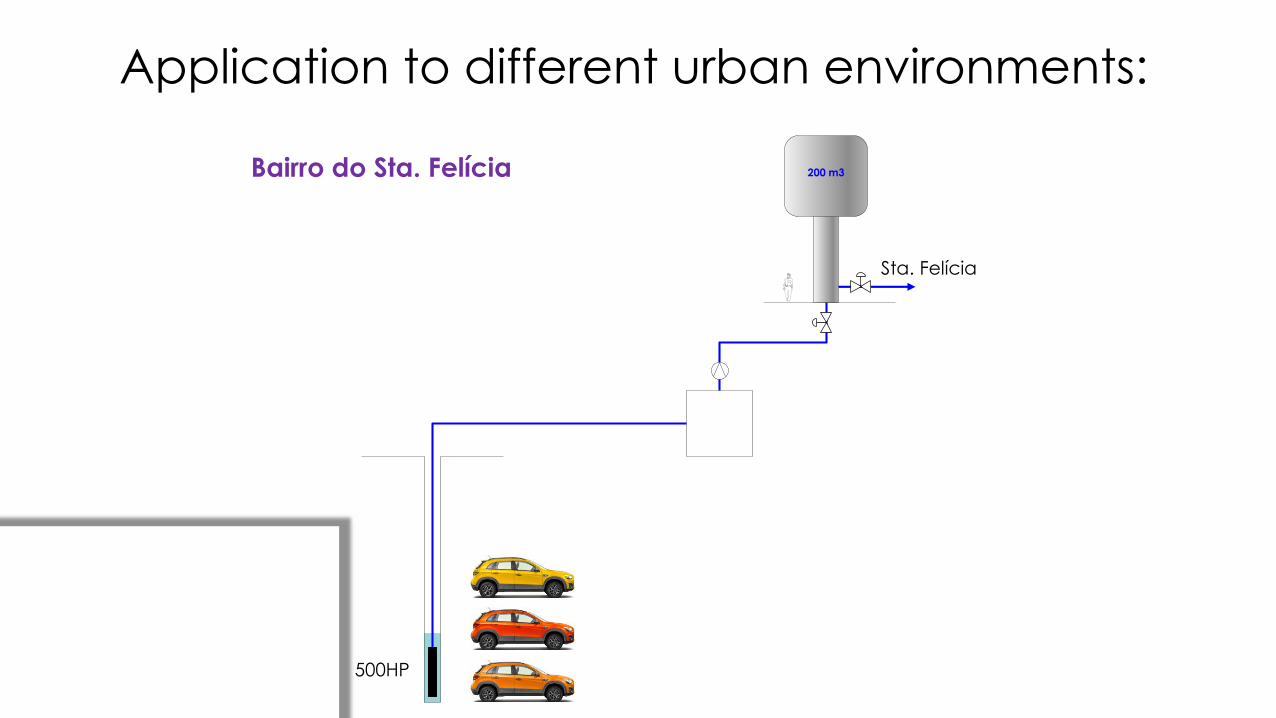
200 m3
Sta. Felícia
500HP
Bairro do Sta. Felícia
Application to different urban environments:
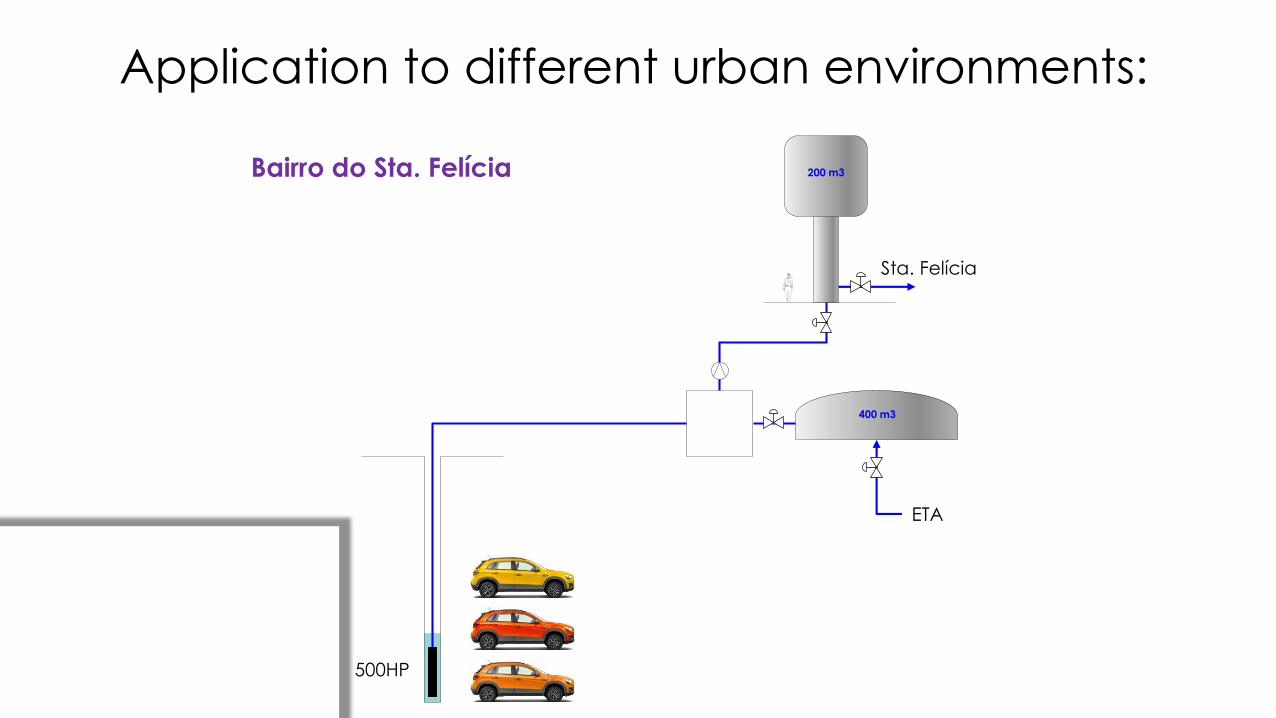
200 m3
400 m3
Sta. Felícia
500HP
ETA
Bairro do Sta. Felícia
Application to different urban environments:
200 m3
2000 m3
400 m3
Sta. Felícia
500HP
ETA
Bairro do Sta. Felícia
Application to different urban environments:
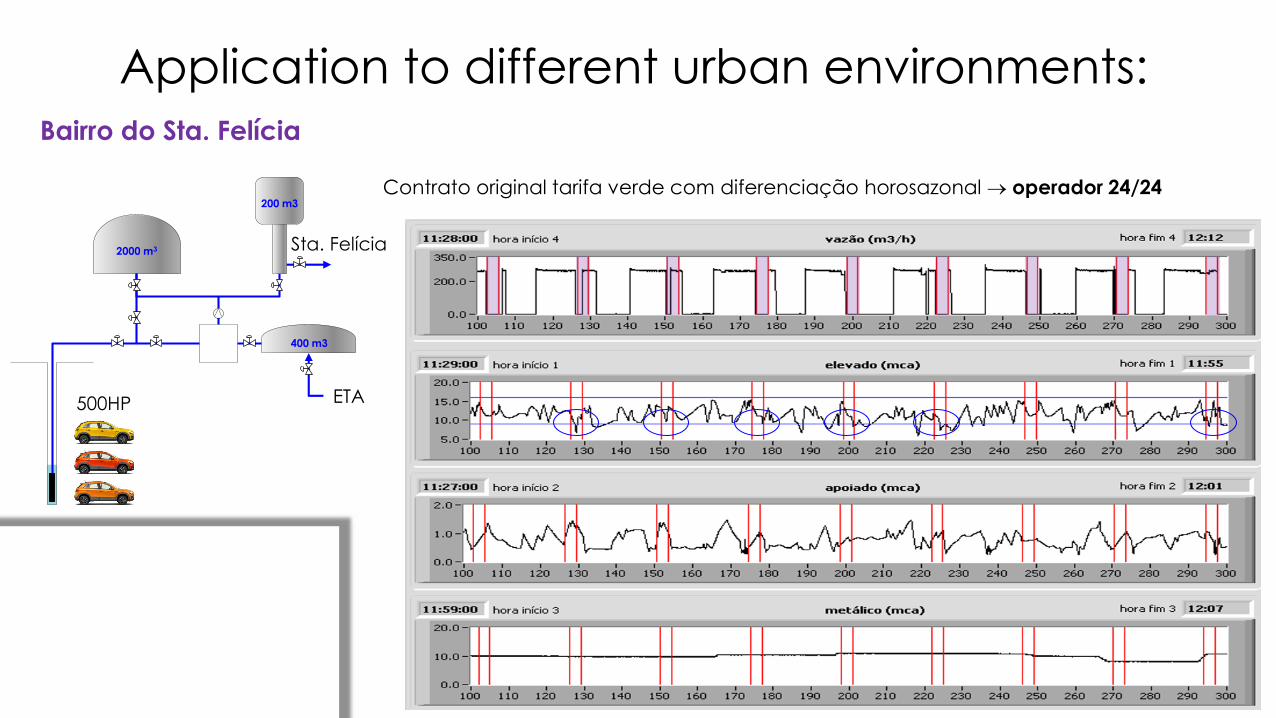
Contrato original tarifa verde com diferenciação horosazonal → operador 24/24200 m3
2000 m3
400 m3
Sta. Felícia
ETA500HP
Bairro do Sta. Felícia
Application to different urban environments:
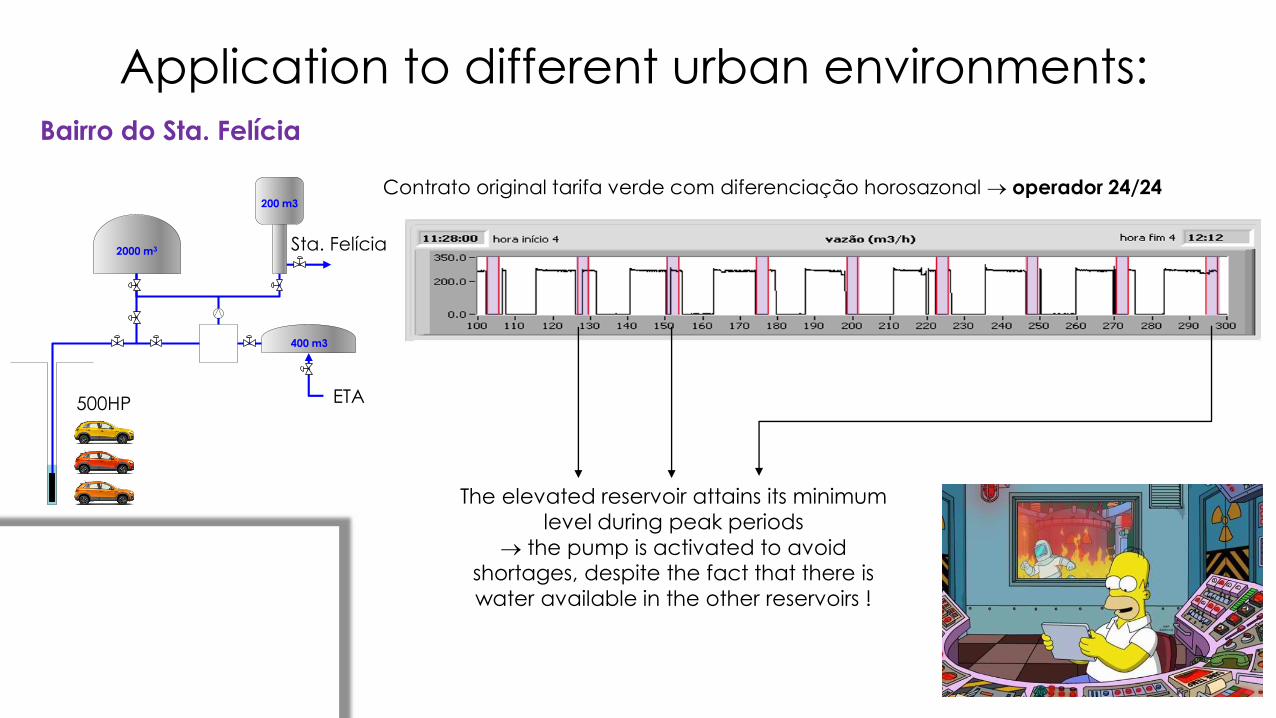
The elevated reservoir attains its minimum
level during peak periods
→ the pump is activated to avoid shortages, despite the fact that there is
water available in the other reservoirs !
Contrato original tarifa verde com diferenciação horosazonal → operador 24/24
Bairro do Sta. Felícia
Application to different urban environments:
200 m3
2000 m3
400 m3
Sta. Felícia
ETA500HP
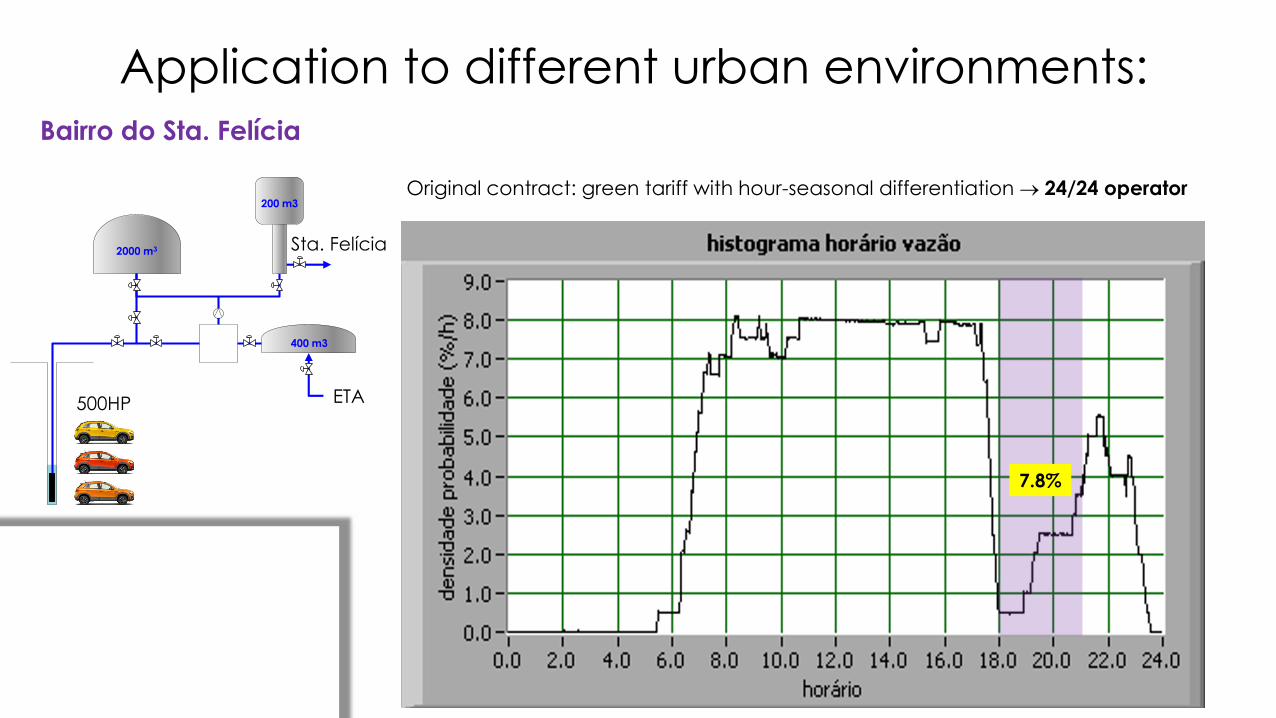
7.8%
Original contract: green tariff with hour-seasonal differentiation → 24/24 operator
Application to different urban environments:Bairro do Sta. Felícia
200 m3
2000 m3
400 m3
Sta. Felícia
ETA500HP
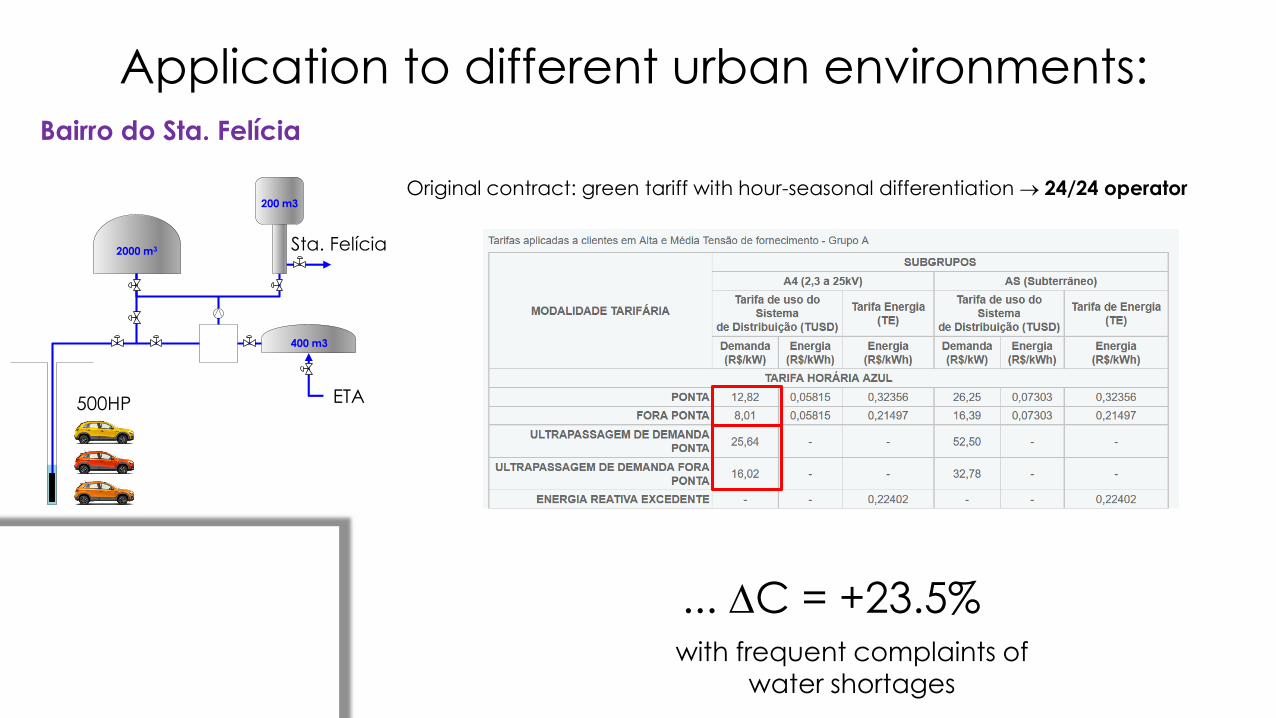
... DC = +23.5%with frequent complaints of
water shortages
Original contract: green tariff with hour-seasonal differentiation → 24/24 operator
Application to different urban environments:Bairro do Sta. Felícia
200 m3
2000 m3
400 m3
Sta. Felícia
ETA500HP
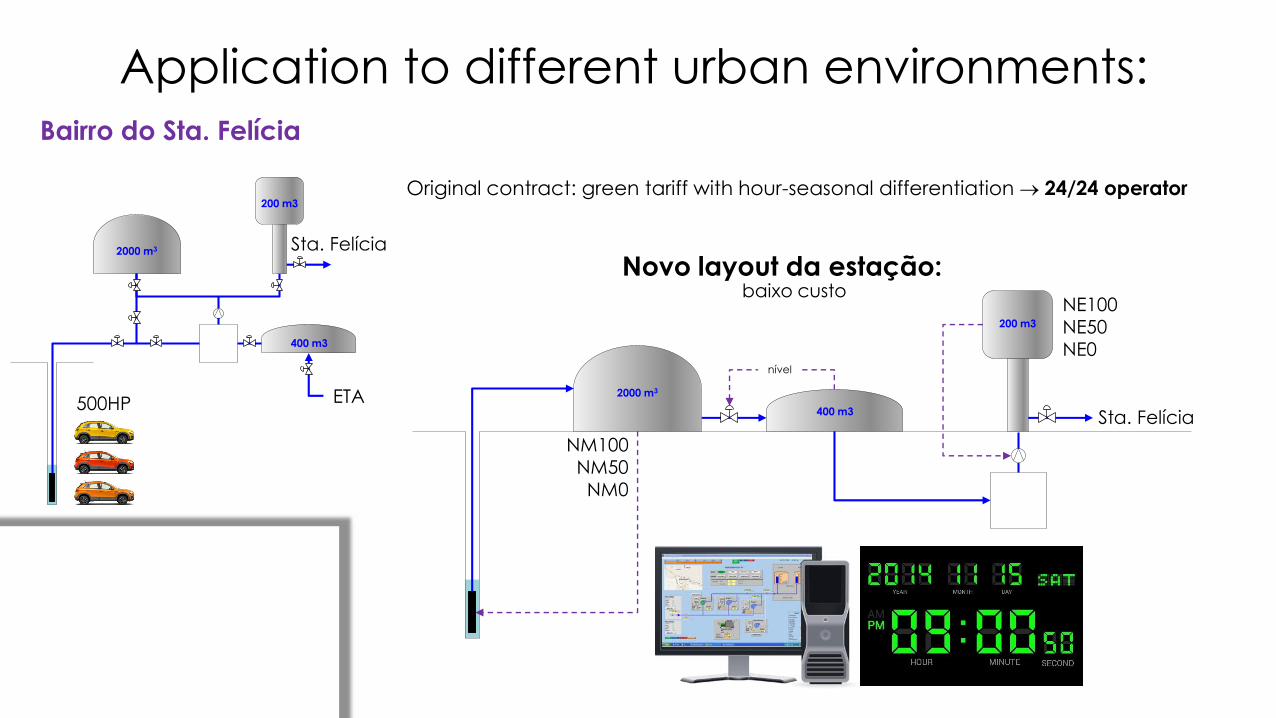
200 m3
2000 m3
400 m3 Sta. Felícia
nível
NM100NM50
NM0
NE100NE50NE0
Novo layout da estação:baixo custo
Bairro do Sta. Felícia
Original contract: green tariff with hour-seasonal differentiation → 24/24 operator
Application to different urban environments:
200 m3
2000 m3
400 m3
Sta. Felícia
ETA500HP
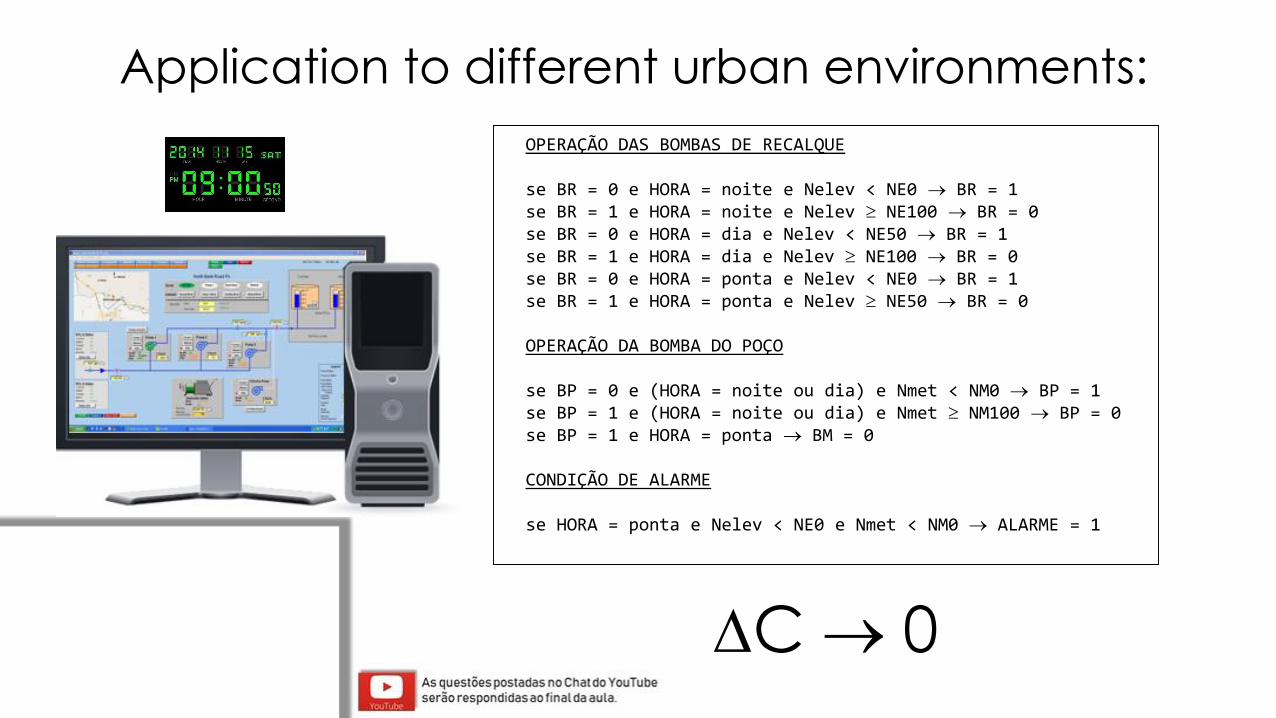
OPERAÇÃO DAS BOMBAS DE RECALQUE
se BR = 0 e HORA = noite e Nelev < NE0 → BR = 1se BR = 1 e HORA = noite e Nelev NE100 → BR = 0se BR = 0 e HORA = dia e Nelev < NE50 → BR = 1se BR = 1 e HORA = dia e Nelev NE100 → BR = 0se BR = 0 e HORA = ponta e Nelev < NE0 → BR = 1se BR = 1 e HORA = ponta e Nelev NE50 → BR = 0
OPERAÇÃO DA BOMBA DO POÇO
se BP = 0 e (HORA = noite ou dia) e Nmet < NM0 → BP = 1se BP = 1 e (HORA = noite ou dia) e Nmet NM100 → BP = 0se BP = 1 e HORA = ponta → BM = 0
CONDIÇÃO DE ALARME
se HORA = ponta e Nelev < NE0 e Nmet < NM0 → ALARME = 1
DC → 0
Application to different urban environments:
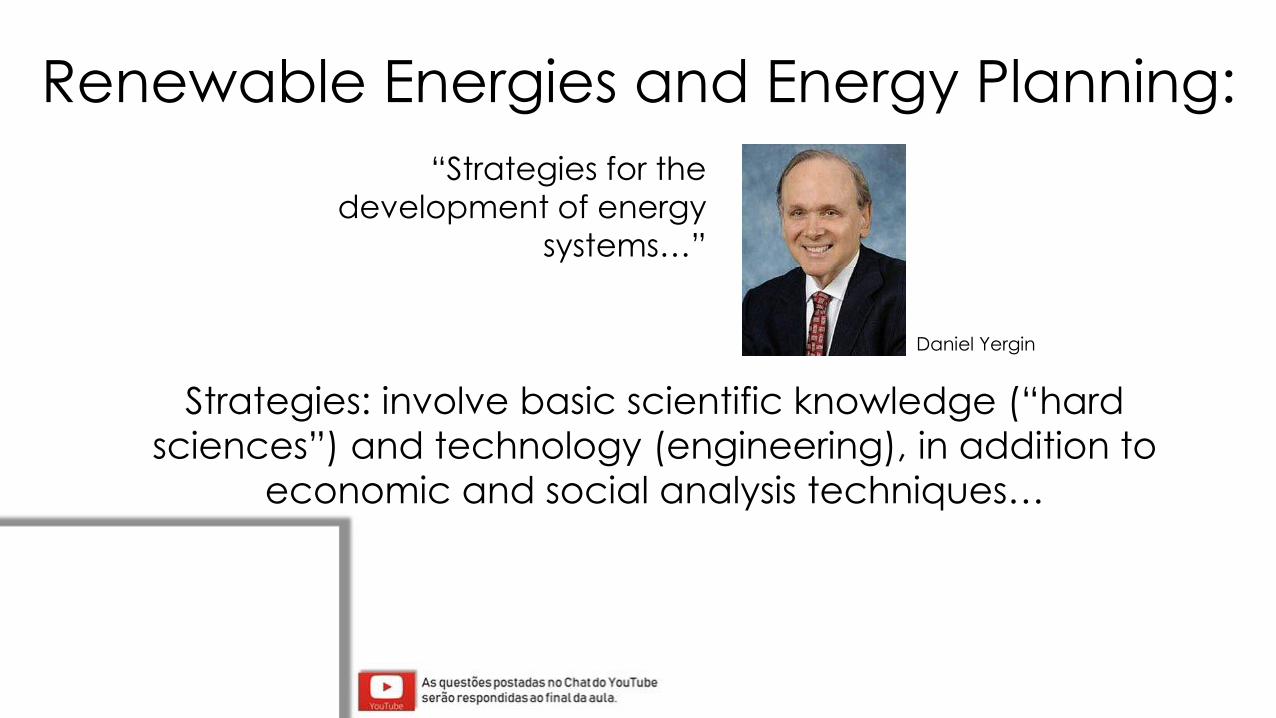
“Strategies for the
development of energy
systems…”
Strategies: involve basic scientific knowledge (“hard
sciences”) and technology (engineering), in addition to
economic and social analysis techniques…
Daniel Yergin
Renewable Energies and Energy Planning:
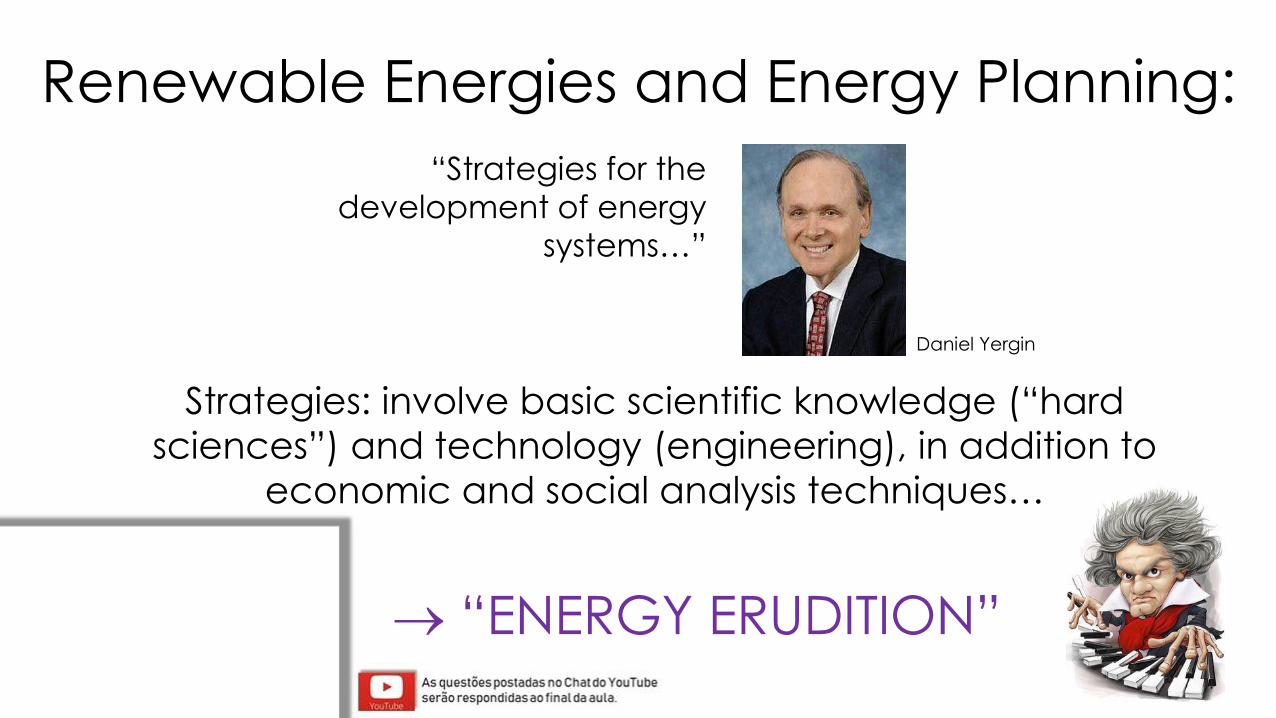
→ “ENERGY ERUDITION”
Renewable Energies and Energy Planning:
“Strategies for the
development of energy
systems…”
Strategies: involve basic scientific knowledge (“hard
sciences”) and technology (engineering), in addition to
economic and social analysis techniques…
Daniel Yergin
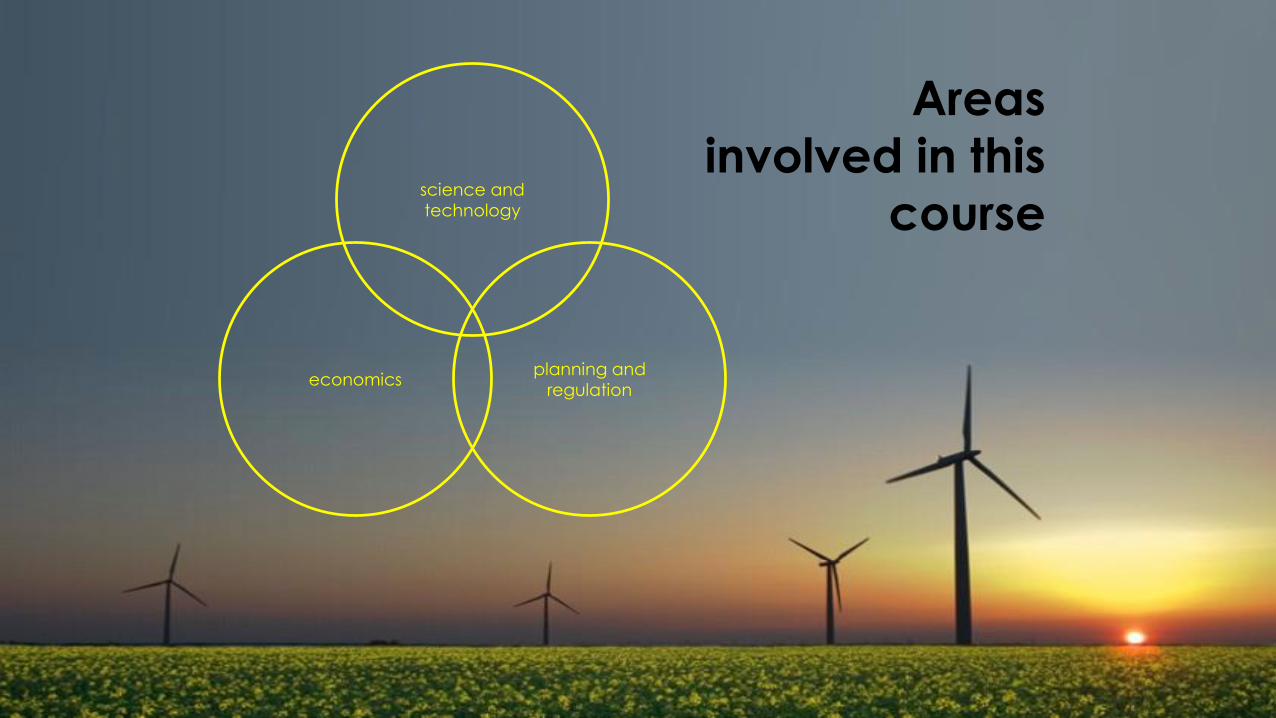
science and
technology
economicsplanning and
regulation
Areas
involved in this
course
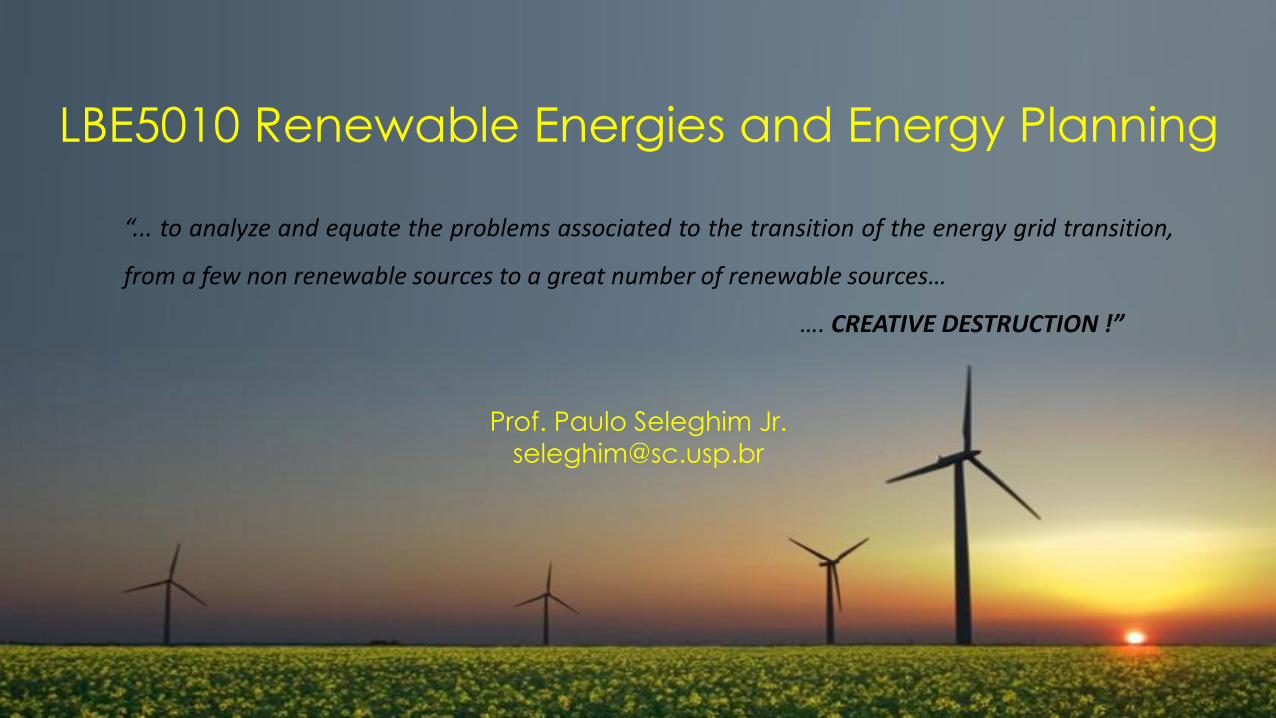
“... to analyze and equate the problems associated to the transition of the energy grid transition,
from a few non renewable sources to a great number of renewable sources…
…. CREATIVE DESTRUCTION !”
Prof. Paulo Seleghim Jr.
LBE5010 Renewable Energies and Energy Planning
Pareto Frontier
eeth
escCO2
W
Pareto Frontier
eeth
escCO2
W
Spsb
Sopt