professional paper because you can’t wait till the year’s...
TRANSCRIPT

Professional Paper
An analysis of entry test results of nine Singapore schools
Using Scholastic Literacy Pro to evaluate students’ reading proficiency levels in Singapore
Because you can’t wait till the year’s end:
Dr Duriya Aziz Singapore Wala Scholastic Education, Singapore


Copyright © 2014 Scholastic Inc. All rights reserved. 1
Using Scholastic Literacy Pro to evaluate students’ reading proficiency levels in Singapore:
An analysis of entry test results of nine Singapore schools
Introduction
Scholastic Literacy Pro (LitPro) is a research-based, online assessment resource that
provides teachers with evidence-based data so that they can make informed
teaching/learning decisions to develop students into successful, proficient readers.
The LitPro test (formerly known as Scholastic Reading Inventory or SRI) is a
computer-adaptive assessment for Kindergarten, Primary, Secondary and Junior
College levels that allows educators to quickly and accurately assess reading
comprehension over the course of a student’s education. This, in turn, informs
instruction and matches students to text using the Lexile Framework for Reading.
This assessment can be used to set growth goals, monitor progress, forecast
performance and help place students at the best level in a reading programme so
that they will read with success.
This paper presents an analysis of the results from the first LitPro benchmark test
used in nine primary and secondary schools in Singapore to measure students’
reading proficiency. The objective of the analysis is to understand the student
profiles revealed and to discuss how these may inform decisions with regard to
literacy policies and practices within the school. Later studies will present a
comparative analysis of the development of reading proficiency in students over
time across different schools.
The LitPro test was implemented at different times during the academic years 2010
and 2011 in the nine schools studied in this research paper. Indeed, the results of the
study point to a classroom assessment that is statistically “aligned” to school-based
assessments as well as high stakes tests and that can be used to identify students in
need of assistance, effectively guiding instructional intervention early in the school
year.

Copyright © 2014 Scholastic Inc. All rights reserved. 2
Using data analysed from the LitPro reports generated at school, class and individual
student levels, this paper intends to demonstrate the benefits of using a consistent,
objective and adaptive technology incorporating a measure such as Lexiles as a
measure of reading fluency to inform classroom instruction and consequently, the
implications for methodology and materials used in the classroom. Reference will be
made to the theoretical underpinnings of LitPro and the Lexile Framework for
Reading in the context of Singapore schools as outlined in an earlier professional
paper: Because you need to know what is most appropriate for your students to read:
Using Scholastic Literacy Pro to match reading texts to readers in Singapore.
The Singapore Lexile Framework
Based on collaborative research with MetaMetrics Inc. in which a sample of texts
and examination papers were measured, Scholastic developed the following draft
Lexile Framework for Singapore schools (Figure 1). It establishes the Lexile range for
each level in primary and secondary schools. This provides the benchmark against
which teachers can evaluate the Lexile scores derived from the LitPro test to
determine if students are reading at on-grade level, above or below. This framework,
together with LitPro test data, will also enable teachers and school administrators to
make more effective decisions in the design of instructional programmes,
independent reading programmes, learning support programmes and measure
progress in order to evaluate the effectiveness of initiatives implemented. It is
intended to provide educators with an independent and objective measure to
monitor progress in reading comprehension.

Copyright © 2014 Scholastic Inc. All rights reserved. 3
Figure 1: Lexile Framework for Singapore
School Level Lexile Range
Primary 1 200L – 400L
Primary 2 250L – 450L
Primary 3 350L – 500L
Primary 4 400L – 600L
Primary 5 500L – 800L
Primary 6 600L – 950L
Secondary 1 850L – 1100L
Secondary 2 950L – 1200L
Secondary 3 1150L - 1300L
Secondary 4 1250L – 1450L
Junior College 1300L – 1500L

Copyright © 2014 Scholastic Inc. All rights reserved. 4
The Singapore Schools Experience
A brief profile of the nine schools that are the subjects of this research is presented
below. All schools are adopters of the LitPro online assessment, but the schools are
different in terms of history, location and student demographics.
Figure 2: School Profile PROFILE LITPRO
ENROLMENT LITPRO COMMENCEMENT
PRIMARY SCHOOLS
School 1 New school in a housing estate
1158 students
Primary 1–5
July 2010
School 2
An established school with a history of more than 50 years
223 students
Primary 4
April 2011
School 3
An established school in the high-performing band
1178 students
Primary 1–5
May 2011
SECONDARY SCHOOLS
School 4
A co-ed government-aided mission school
820 students
Secondary 1– 3
October 2010
School 5
A co-ed mission school 1170 students
Secondary 1–4
October 2010
School 6
An established co-ed government school
250 students
Secondary 1
January 2011
School 7
An established high-performing government school
229 students
Secondary 1
February 2011
School 8
A co-ed school 272 students
Secondary 1
April 2011
School 9
A government co-ed school
Secondary 1–3 April 2011

Copyright © 2014 Scholastic Inc. All rights reserved. 5
Research Methodology and Design
Figure 2 above presents a brief profile of each of the nine schools in this study and
the last column in the table lists the period that the first LitPro test was administered
in the school. Prior to the implementation, teachers and students were briefed on
the test and the process and were given opportunities to trial and familiarise
themselves with the test prior to taking the actual test.
Data from the first LitPro test carried out in each school has been extracted and
represented in tables and bar graphs to identify clusters and trends, and to make
inferences and draw conclusions based on an understanding of the student cohort of
each school. The tables and bar graphs that follow demonstrate the reading
proficiency level of students by class. The presentation of data of each class is
followed by observations made with regard to the data. At the end of the analysis by
class, data is presented by class level across the school to identify trends across the
grades.
For each for the nine schools, the LitPro test data for whole-school and class level
proficiency is analysed. For the six secondary schools in this report, only the results
of the Express classes are analysed. Figure 3 below presents the legend explaining
the classification of student performance in the LitPro test.
Figure 3: Classification of Student Performance in the LitPro test
Advanced Students are reading at a Lexile level above that expected for their grade.
Proficient Students are reading in the top 50% Lexile range for their grade.
Basic Students are reading in the bottom 50% Lexile range for their grade.
Below Basic Students are reading at a Lexile level below that expected for their grade

Copyright © 2014 Scholastic Inc. All rights reserved. 6
Figure 4 below presents the Lexile Band Range at each level for Singapore students
based on the four classifications presented in Figure 3.
Figure 4: Lexile Band Range
Singapore School Level
Lexile Level (L)
Below Basic (≤) Basic Proficient Advanced (≥)
Primary 1 200L 300L 400L 401L
Primary 2 250L 350L 450L 451L
Primary 3 350L 425L 500L 501L
Primary 4 400L 500L 600L 601L
Primary 5 500L 650L 800L 801L
Primary 6 600L 775L 900L 951L
Secondary 1 Express 850L 975L 1100L 1101L
Secondary 2 Express 950L 1075L 1200L 1201L
Secondary 3 Express 1150L 1225L 1300L 1301L
Secondary 4 Express 1250L 1350L 1450L 1451L
Secondary 1 Normal Academic
700L 825L 950L 951L
Secondary 2 Normal Academic
800L 925L 1050L 1051L
Secondary 3 Normal Academic
1000L 1075L 1150L 1151L
Secondary 4 Normal Academic
1100L 1200L 1300L 1301L
Junior College 1 1300L 1400L 1500L 1501L
Junior College 2 1300L 1400L 1500L 1501L

Copyright © 2014 Scholastic Inc. All rights reserved. 7
Limitations of the Study
Given the scope of study and analysis of this paper, time series analysis and student
performance over time has not been considered. However, within each school, it is
reasonable to assume that across levels, the demographics and literacy backgrounds
of students are similar. Therefore, changes in reading proficiency across levels may
be said to be resulting from literacy interventions or lack thereof in the school at
each level. It may be speculated that the results presented of a particular school
across levels may also be indicative of the progress of the same cohort across levels
if this were a time series presentation of the same cohort of students over the years
in each grade level. It was not within the scope of this study to correlate
performance to teacher competency or literacy practices in the school though some
inferences may be made.

Copyright © 2014 Scholastic Inc. All rights reserved. 8
School 1
The first LitPro test for the Primary 1 to 5 cohort was administered in July 2010, after
students had six months of instruction in the year. Below are the results for each
level in the school.
Primary 1
Class Below Basic
Basic Proficient Advanced Total Number of
Students
P1A 0 24 1 5 30
P1B 0 24 4 1 29
P1C 0 20 1 9 30
P1D 0 26 2 2 30
P1E 0 21 3 5 29
P1F 0 27 1 2 30
P1G 0 22 3 5 30
P1H 0 27 3 0 30
Whole Level 0 191 18 29 238
0%
20%
40%
60%
80%
100%
P1A P1B P1C P1D P1E P1F P1G P1H
Class
Primary 1 Performance 2011
Advanced
Proficient
Basic
Below Basic
The table and bar graph showing the performance of eight P1 classes in School 1
show that there are no students in the Below Basic band; however, the majority of
students (80%) are in the Basic Band. The remaining 20% lie within the Proficient and
Advanced Bands. The majority of students therefore are in a delicate position,
whereby students may progress to improved proficiency or may regress to below
basic levels as the demands of academic study increase, requiring students to have
greater reading comprehension fluency.

Copyright © 2014 Scholastic Inc. All rights reserved. 9
Primary 2
Class Below Basic
Basic Proficient Advanced Total Number
of Students
P2A 11 5 4 10 30
P2B 11 7 4 8 30
P2C 26 0 3 0 29
P2D 0 0 4 26 30
P2E 10 4 6 11 31
P2F 9 5 11 5 30
P2G 10 3 8 9 30
P2H 12 4 4 10 30
Whole Level 89 28 44 79 240
0%
20%
40%
60%
80%
100%
P2A P2B P2C P2D P2E P2F P2G P2H
Class
Primary 2 Performance 2011
Advanced
Proficient
Basic
Below Basic
The table and bar graph showing the performance of eight P2 classes in School 1
show that the reading proficiency profile of students is quite different from the one
observed for P1 students. Assuming that the demographic factors and literacy
backgrounds of students in the school are similar, it may be that the change in the
reading comprehension profile of students in P2 is a result of literacy practices and
interventions during P1. Compared to P1 where no students were in the Below Basic
band, in P2, 37% of students have been found to be in that category. At the same
time, 32% are in the Advanced category as opposed to only 12% in P1. The remaining
31% fall within the Basic and Proficient categories. Another point evident from the
data above is that the school has carried out a regrouping exercise based on results
during promotion of students from P1 to P2. Based on the reading proficiency profile
presented above, we can conclude that P2D is the ‘best class’ with nearly 90% of

Copyright © 2014 Scholastic Inc. All rights reserved. 10
students falling in the Advanced category and the remaining 10% in the Proficient
category while P2C is the weakest class, with 90% in the Below Basic band and the
remaining 10% in the Proficient category.
Primary 3
Class Below Basic
Basic Proficient Advanced Total Number
of Students
P3A 12 11 7 12 42
P3B 10 7 6 19 42
P3C 23 5 4 0 32
P3D 1 3 3 35 42
P3E 23 6 5 3 37
P3F 12 7 4 19 42
P3G 24 2 4 3 33
P3H 3 6 5 28 42
Whole Level 108 47 38 119 312
The table and bar graph showing the performance of eight P3 classes in School 1
show that 35% of students are performing at the Below Basic level similar to the size
of the same band in P2. Further investigation into cohort, literacy practices or other
initiatives would reveal the reasons for this. At the same time, 38% of students are in
the Advanced band as opposed to 32% in p2. This is an indication that more students
are motivated and able to read at a level that is higher than the requirement for
their grade level. 27% of students fall in the Basic and Proficient categories — this is
a reduction in size from P2, however, proportionately there are more students in the
Basic category than in the Proficient category compared to P2. It is worth
investigating the causes for this.
0%
20%
40%
60%
80%
100%
P3A P3B P3C P3D P3E P3F P3G P3H
Class
Primary 3 Performance 2011
Advanced Proficient Basic Below Basic

Copyright © 2014 Scholastic Inc. All rights reserved. 11
It is also worth noting that the reading proficiency profiles of the ‘best’ and ‘weakest’
classes — P3D and P3C respectively continue in P3. As students may have been
allocated classes based on their performance in P2, the data analysis shows distinct
groups in the classes, with P3C, G and E having a high proportion of students in the
Below Basic band and P3 B, D, F and H having a high number of students in the
Advanced band.
Primary 4
Class Below Basic
Basic Proficient Advanced Total Number
of Students
P4A 20 10 3 4 37
P4B 16 8 7 7 38
P4C 16 7 7 8 38
P4D 5 7 5 24 41
P4E 0 0 0 42 42
P4F 0 10 8 25 43
P4G 1 2 2 35 40
P4H 3 6 5 24 38
Whole Level 61 50 37 169 317
The table and bar graph showing the performance of eight P4 classes in School 1
show an interesting shift in the reading proficiency pattern as compared to that
observed for P2 and P3. It is worth noting the P4 is an important year wherein high
stakes assessment takes place. This assessment results in the streaming of students
into various learning options which has a significant impact on their future studies
and careers. It is noteworthy that 68% of students fall into the Proficient and
0%
20%
40%
60%
80%
100%
P4A P4B P4C P4D P4E P4F P4G P4H
Class
Primary 4 Performance 2011
Advanced Proficient Basic Below Basic

Copyright © 2014 Scholastic Inc. All rights reserved. 12
Advanced bands, compared to 50% in P3. Likewise, only 19% of students fall into the
Below Basic band, compared to 35% in P3 — a reduction in size by nearly half. In
addition, the students in this category seem to be clustered in classes P4 A, B and C
— possibly a strategy by the school to provide focused remediation.
Primary 5
Class Below Basic
Basic Proficient Advanced Total Number
of Students
P5A 5 5 18 11 39
P5B 7 6 9 17 39
Whole Level 12 11 27 28 78
The table and bar graph showing the performance of two P5 classes in School 1 show
that some of the strong progress made in P4 has slowed down and even regressed in
the upper two bands. However, it must be pointed out that these are new students
to the school and the results cannot be seen as a culmination of literacy instruction
in the school over the years. The data analysed above shows that there are more
students in the Proficient band and less in the Advanced band. However, the
proportion of students in the Below Basic band has also gone down to 15% .
0%
20%
40%
60%
80%
100%
P5A P5B
Class
Primary 5 Performance 2011
Advanced Proficient Basic Below Basic
Copyright © 2014 Scholastic Inc. All rights reserved. 13
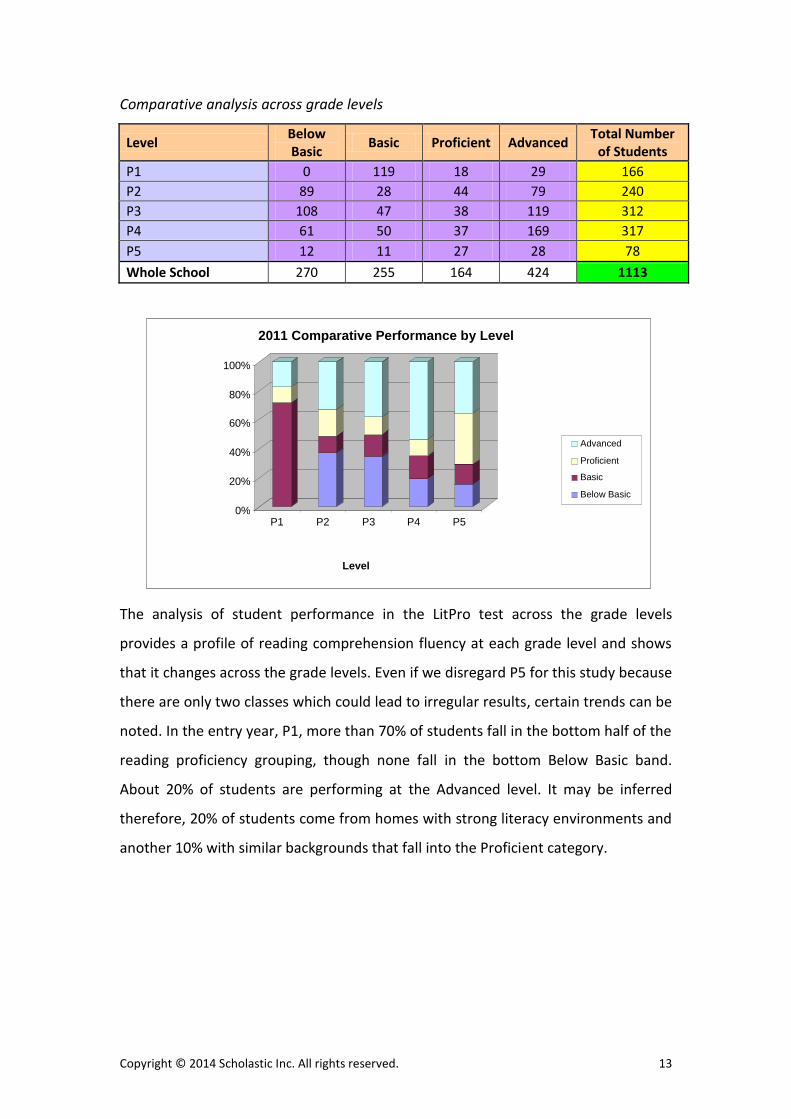
Comparative analysis across grade levels
Level Below Basic
Basic Proficient Advanced Total Number
of Students
P1 0 119 18 29 166
P2 89 28 44 79 240
P3 108 47 38 119 312
P4 61 50 37 169 317
P5 12 11 27 28 78
Whole School 270 255 164 424 1113
The analysis of student performance in the LitPro test across the grade levels
provides a profile of reading comprehension fluency at each grade level and shows
that it changes across the grade levels. Even if we disregard P5 for this study because
there are only two classes which could lead to irregular results, certain trends can be
noted. In the entry year, P1, more than 70% of students fall in the bottom half of the
reading proficiency grouping, though none fall in the bottom Below Basic band.
About 20% of students are performing at the Advanced level. It may be inferred
therefore, 20% of students come from homes with strong literacy environments and
another 10% with similar backgrounds that fall into the Proficient category.
0%
20%
40%
60%
80%
100%
P1 P2 P3 P4 P5
Level
2011 Comparative Performance by Level
Advanced Proficient Basic Below Basic

Copyright © 2014 Scholastic Inc. All rights reserved. 14
However, from P2 onwards, and as the demands on literacy become more rigorous
and complex, we see some students slip into the Below Basic category whereas in P1
there were none. Having said that, the number of students in the Advanced category
steadily increases and the number of students in the top half of the proficiency
bands remains steady at about 50% and peaking at 70% in P4. This indicates that the
school’s literacy practices are effective for the most part for the majority of students,
but about 30% of the cohort needs specific intervention to move them out of Below
Basic band so that they will able to read successfully for academic achievement.
Whilst there has been overall improvement in students’ reading proficiency as they
progress through the academic programme, there is a spread in ability levels in each
class in each year group. This can prove quite a challenge for teachers as they strive
to meet the different needs in their class. There is a need to provide for remediation
and learning support for the small group of students in the lower ability levels, whilst
at the same time providing additional challenge for the students in the high ability
groups.
School 1 was among the first to adopt LitPro school-wide as a means to assess
students’ reading proficiency. One result of the test noted above was that close to
80% of the Primary 1 cohort was reading at a Basic level. This reinforced the existing
school data, and allowed the school to focus on providing remediation and to design
effective learning support programmes to enable students to come up to grade level
reading fluency to meet the academic demands presented by the core curriculum.
The need to ensure students could read on level was important as this in turn has
implications for achievement in other subject areas as well.

Copyright © 2014 Scholastic Inc. All rights reserved. 15
School 2
Primary 4
Class Below Basic Basic Proficient Advanced Total
Number of Students
P4A 29 3 0 1 33
P4B 25 4 5 1 35
P4C 28 6 5 0 39
P4D 26 5 6 1 38
P4E 10 5 9 14 38
P4F 10 5 9 14 38
Whole Level 128 28 34 31 221
The bar graph above presents a snapshot of the different reading profiles of each
Primary 4 class in this primary school. The initial test data seems to indicate that
across the level, 58% of students are reading at a Below Basic level of proficiency.
This is quite a high number and in stark contrast to the P4 performance of School 1
presented earlier where less than 19% fall into this category. Given that P4 is an
important year where students will be streamed according to their academic ability,
this is a cause for concern and indicates the need for significant intervention with
specific and customised remediation programmes. The rest of the 43% of students
are spread evenly across the remaining three categories, at about 14% each. This
means that an overwhelming 72% of students fall in the bottom half of proficiency
levels at P4. This has implications for materials used in the class, instructional
strategies and classroom management for the level.
0%
20%
40%
60%
80%
100%
P4A P4B P4C P4D P4E P4F
Advanced
Proficient
Basic
Below Basic
2011 Primary 4 Perfomance
Class

Copyright © 2014 Scholastic Inc. All rights reserved. 16
School 3
Primary 1
Class Below Basic Basic Proficient Advanced Total Number of
Students
P1A 0 25 4 0 29
P1B 0 29 0 1 30
P1C 0 26 1 1 28
P1D 0 24 0 0 24
P1E 0 25 2 3 30
P1F 0 23 2 4 29
P1G 0 21 5 1 27
P1H 0 17 1 5 23
Whole Level 0 190 15 15 220
The table and bar graph showing the performance of eight P1 classes in School 3
show that similar to School 1, all students are able to achieve at least the Basic level
of reading proficiency and there are no students in the Below Basic band. However,
compared to School 1, there are less students in the upper half of the proficiency
grouping. 86% of students fell into the Basic category. This has implications for the
instructional design and literacy practices at this level.
0%20%40%60%80%
100%
P1A P1B P1C P1D P1E P1F P1G P1H
Class
2011 Primary 1 Performance
Advanced
Proficient
Basic
Below Basic

Copyright © 2014 Scholastic Inc. All rights reserved. 17
Primary 2
Class Below Basic Basic Proficient Advanced Total Number of
Students
P2A 3 2 0 8 13
P2B 6 2 5 15 28
P2C 4 5 4 15 28
P2D 7 5 6 11 29
P2E 11 1 3 12 27
P2F 4 4 7 13 28
P2G 9 3 7 11 30
P2H 7 2 3 5 17
P2I 8 2 5 14 29
Whole Level 59 26 40 104 229
0%20%40%60%80%
100%
P2A P2C P2E P2G P2I
Class
2011 Primary 2 Performance
Advanced
Proficient
Basic
Below Basic
The table and bar graph showing the performance of nine P2 classes in School 3
show that the reading proficiency profile of the cohort and in each of the classes are
unlike that of P1. 45% of students registered in the Advanced category. However, it
must be noted that a number of students did not take the test and this probably
explained why the profile is different from P1. Nevertheless, it is apparent that there
are more students in the top half of the reading proficiency bands. About 29% of
students still fall in the Below Basic category and this number could have been
higher if all students were accounted for.
Copyright © 2014 Scholastic Inc. All rights reserved. 18
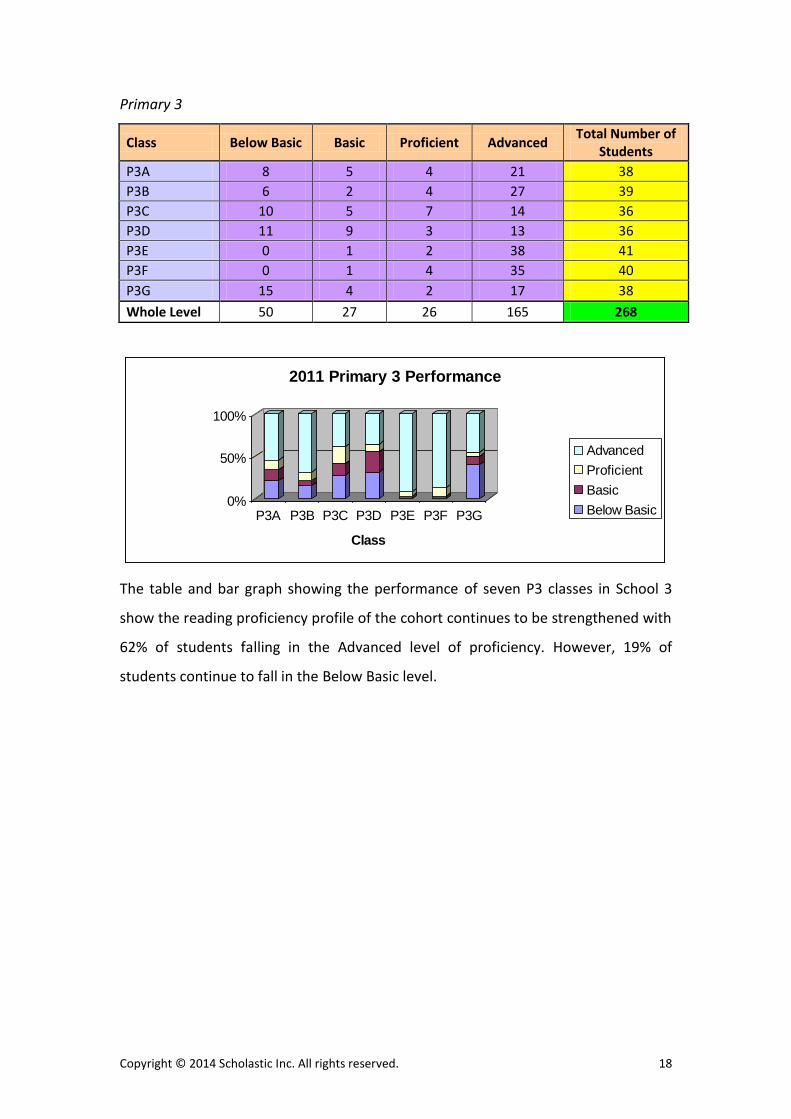
Primary 3
Class Below Basic Basic Proficient Advanced Total Number of
Students
P3A 8 5 4 21 38
P3B 6 2 4 27 39
P3C 10 5 7 14 36
P3D 11 9 3 13 36
P3E 0 1 2 38 41
P3F 0 1 4 35 40
P3G 15 4 2 17 38
Whole Level 50 27 26 165 268
0%
50%
100%
P3A P3B P3C P3D P3E P3F P3G
Class
2011 Primary 3 Performance
Advanced
Proficient
Basic
Below Basic
The table and bar graph showing the performance of seven P3 classes in School 3
show the reading proficiency profile of the cohort continues to be strengthened with
62% of students falling in the Advanced level of proficiency. However, 19% of
students continue to fall in the Below Basic level.

Copyright © 2014 Scholastic Inc. All rights reserved. 19
Primary 4
Class Below Basic Basic Proficient Advanced Total Number of
Students
P4A 9 7 2 15 33
P4B 5 9 8 12 34
P4C 5 8 3 21 37
P4D 11 7 2 14 34
P4E 0 2 3 35 40
P4F 0 2 1 34 37
P4G 9 4 4 16 33
P4H 10 3 5 9 27
Whole Level 49 42 28 156 275
0%20%40%60%80%
100%
P4A P4B P4C P4D P4E P4F P4G P4H
Class
2011 Primary 4 Performance
Advanced
Proficient
Basic
Below Basic
The table and bar graph showing the performance of eight P4 classes in School 3
shows that the reading proficiency profile of students continues to be strong with
57% of students in the Advanced category despite a slight drop from P3. However,
21% of students fall in the Below Basic group and this is an increase from P3. It has
been found that in P4, 33% of students fall in the lower half of the reading
proficiency band, a rise from 28% in P3.

Copyright © 2014 Scholastic Inc. All rights reserved. 20
Primary 5
Class Below Basic Basic Proficient Advanced Total Number of
Students
P5A 25 5 2 0 32
P5B 3 4 12 7 26
P5C 6 2 3 4 15
P5D 8 11 4 2 25
P5E 0 1 3 37 41
P5F 0 2 4 33 39
P5G 3 9 10 17 39
P5H 3 2 11 23 39
Whole Level 48 36 49 123 256
0%
20%
40%
60%
80%
100%
P5A P5B P5C P5D P5E P5F P5G P5H
Class
2011 Primary 5 Performance
Advanced
Proficient
Basic
Below Basic
The table and bar graph showing the performance of eight P5 classes in School 3
show that the reading proficiency profile of students continues on its downward
trend with 48% in the Advanced category. Although 19% of students fall in the Below
Basic group, which is less than those in P4, 34% of the P5 students fall in the lower
half of the reading proficiency band which is similar to P4.

Copyright © 2014 Scholastic Inc. All rights reserved. 21
Comparative analysis across grade levels
Level Below Basic Basic Proficient Advanced Total Number of
Students
P1 0 190 15 15 220
P2 59 26 40 104 229
P3 50 27 26 165 268
P4 49 42 28 156 275
P5 48 36 49 123 256
Whole School 206 321 158 563 1248
The LitPro test results for this primary school have been very promising and validate
the current instructional programmes and practices. In the Primary 1 cohort a high
number of students are in the Basic reading proficiency category; at 86% of the
cohort. Given that the level of basic proficiency and the socio-economic background
of each year group is consistent each year, what stands out for this school is how the
gap has been narrowed in the subsequent years and the number of students in the
Basic category has steadily grown smaller. In Primary 2 this number stands at 11%,
Primary 3 10%, Primary 4 15% and Primary 5 14%. What is also evident is that more
that 50% of each cohort has started to read at an Advanced level at Primary 2 and
this trend is sustained steadily at the upper grades.
The strategy of sorting the students by ability seems to have benefitted the students,
as it allows for targeted and specific instruction. In all year groups the best students
are concentrated in Classes E and F, with the weaker students in classes A, B and G.
P3D, P4D and P5D indicate the greatest range of ability level in students in the class,
with an equal number of students in all ability bands. This would be the most
0% 20% 40% 60% 80%
100%
P1 P2 P3 P4 P5
Level
2011 Comparative Performance By Level
Advanced
Proficient
Basic
Below Basic

Copyright © 2014 Scholastic Inc. All rights reserved. 22
challenging classes as teachers would have to pursue a differentiated instructional
approach to meet the needs of students across the spectrum of ability. Given the
improved proficiency of the students in the upper primary levels, an independent
reading programme that allows students to read beyond the text would be ideal.
School 4
Secondary 1
Class Below Basic Basic Proficient Advanced Total Number of
Students
Sec 1FH 4 4 8 23 39
Sec 1GR 15 5 4 1 25
Sec 1HP 16 5 3 3 27
Sec 1JY 20 8 7 2 37
Sec 1LV 1 3 4 32 40
Sec 1PC 18 11 6 4 39
Sec 1PR 12 7 2 0 21
Sec 1TH 7 7 9 17 40
Whole Level 93 50 43 82 268
In Secondary 1, the most fluent readers are concentrated in Sec 1FH and 1LV, with
60% and 80% of the respective class reading at an Advanced level. These classes
would be able to handle reading resources and materials above the reading level
required for Secondary 1, and an Independent Reading Programme with limited
teacher intervention could be considered for these two classes. In Sec 1TH, students
are split relatively evenly across all the four reading proficiency levels. The
instructional strategies to develop reading skills should be carefully considered for
this class, as students will require resources at different Lexile levels.
0%
20% 40%
60% 80%
100%
Sec 1FH
Sec 1GR
Sec 1HP
Sec 1JY
Sec 1LV
Sec 1PC
Sec 1PR
Sec 1TH
Class
2011 Secondary 1 Performance
Advanced Proficient Basic Below Basic

Copyright © 2014 Scholastic Inc. All rights reserved. 23
The range of skills demonstrated is also quite varied which probably calls for a
differentiated instructional approach. In Sec 1GR, Sec 1HP, Sec 1JY, Sec 1PC and Sec
1PR, a majority of the students are reading at a Below Basic or Basic level of
proficiency, which means that students are below the reading proficiency required at
Secondary 1. This is an area of concern and needs to be addressed in order to arrest
any further backsliding in Secondary 2 and 3. An intensive remediation programme
would be ideal for the targeted students in these classes, to bring them up to the
reading proficiency levels required. In addition there has to be a careful selection of
reading resources for independent reading to ensure that students are appropriately
matched according to their skills and ability.
Secondary 2
Class Below Basic Basic Proficient Advanced Total Number
of Students
Sec 2FH 9 5 4 12 30
Sec 2GR 27 7 1 1 36
Sec 2HP 26 6 5 1 38
Sec 2JY 2 2 10 21 35
Sec 2LV 15 5 10 10 40
Sec 2PA 6 11 7 4 28
Sec 2PC 2 7 10 19 38
Sec 2TH 8 6 9 8 31
Whole Level 95 49 56 76 276
0%
20%
40%
60%
80%
100%
Sec 2FH
Sec 2GR
Sec 2HP
Sec 2JY
Sec 2LV
Sec 2PA
Sec 2PC
Sec 2TH
Class
2011 Secondary 2 Performance
Advanced Proficient Basic Below Basic

Copyright © 2014 Scholastic Inc. All rights reserved. 24
In Sec 2JY and Sec 2PC, most of the students in these classes are reading above their
grade level, a pattern similar to Secondary 1. However, it has been found that the
spread of students across the different reading ability is relatively even in Sec 2FH,
Sec 2LV, Sec 2PA and Sec 2TH. This indicates a wide range of skills across the
students in these classes, and as such a well-designed, differentiated approach to
instruction should be adopted to ensure that the needs of all the students are met. A
strategy to group students by ability across these four classes could also be
considered for a more focussed and targeted instructional programme. The classes
of concern are Sec 2GR and Sec 2HP, where close to 80% of students are reading at
Below Basic and Basic levels. Serious attention needs to be given to review the
current instructional approach adopted in the teaching of reading for these two
classes. Simultaneously a very rigorous and structured remediation programme
should be considered to bring these students up to grade level.

Copyright © 2014 Scholastic Inc. All rights reserved. 25
Secondary 3
Class Below Basic Basic Proficient Advanced Total Number
of Students
Sec 3FH 19 2 6 5 32
Sec 3GR 32 0 1 1 34
Sec 3HP 33 3 0 3 39
Sec 3JY 16 2 5 4 27
Sec 3LV 14 6 5 1 26
Sec 3PA 18 3 8 11 40
Sec 3PC 17 3 10 8 38
Sec 3PR 30 2 0 0 32
Sec 3TH 13 6 8 12 39
Whole Level 192 27 43 45 307
At Secondary 3 level, an area of significant concern is the large percentage of
students reading at Below Basic and Basic levels across all the classes. As these
students progress into Secondary 4 in 2012, the GCE ‘O’ Level examinations may
prove to be a significant challenge for these students. Except for Sec 3TH and Sec
3PC, which have an equal mix of reading abilities in the class, serious consideration
should be given to the design of an instructional programme that will address the
needs of the majority of the students who seem to be falling behind the reading
proficiency required at Secondary 3.
0%
20%
40%
60%
80%
100%
Sec 3FH
Sec 3GR
Sec 3HP
Sec 3JY
Sec 3LV
Sec 3PA
Sec 3PC
Sec 3PR
Sec 3TH
Class
2011 Secondary 3 Performance
Advanced Proficient Basic Below Basic
Copyright © 2014 Scholastic Inc. All rights reserved. 26
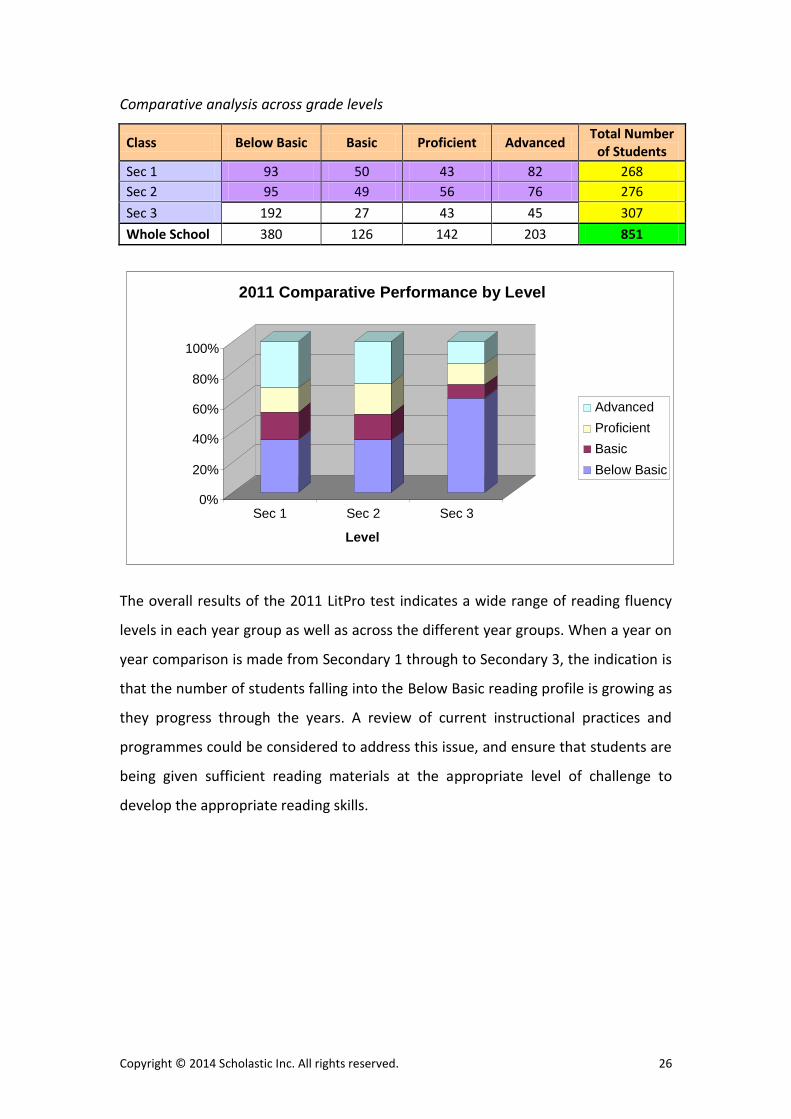
Comparative analysis across grade levels
Class Below Basic Basic Proficient Advanced Total Number
of Students
Sec 1 93 50 43 82 268
Sec 2 95 49 56 76 276
Sec 3 192 27 43 45 307
Whole School 380 126 142 203 851
The overall results of the 2011 LitPro test indicates a wide range of reading fluency
levels in each year group as well as across the different year groups. When a year on
year comparison is made from Secondary 1 through to Secondary 3, the indication is
that the number of students falling into the Below Basic reading profile is growing as
they progress through the years. A review of current instructional practices and
programmes could be considered to address this issue, and ensure that students are
being given sufficient reading materials at the appropriate level of challenge to
develop the appropriate reading skills.
0%
20%
40%
60%
80%
100%
Sec 1 Sec 2 Sec 3
Level
2011 Comparative Performance by Level
Advanced
Proficient
Basic
Below Basic

Copyright © 2014 Scholastic Inc. All rights reserved. 27
School 5
Secondary 1
Class Below Basic Basic Proficient Advanced Total Number
of Students
F1-1 1 6 8 23 38
F1-2 2 8 6 23 39
F1-3 4 11 5 18 38
F1-4 7 6 16 11 40
F1-5 10 3 3 2 18
H1-1 23 13 3 0 39
H1-2 26 12 1 0 39
Whole Level 73 59 42 77 251
The overall results of the 2011 LitPro test are quite promising for Secondary 1,
especially for classes F1-1, F1-2, and F1-3, where more than 50% of students are
reading at an Advanced level, which is above the proficiency required for Secondary
1. Students in these classes would do well, with programmes that enhance their
existing skills and stretch their reading capacity. For the small number of students in
these classes reading at Below Basic and Basic proficiency, a targeted programme
where they are assisted specially outside the regular instructional programme would
be ideal to support them to catch up with their peers. In F1-4, students are relatively
equally split across all the reading proficiency ranges. It would be useful to consider
a differentiated instructional strategy to meet the varied needs of students in this
class. Consideration should be given to the selection of reading materials for
independent reading to ensure that students have access to books that are
appropriately matched to their ability level. In classes F1-5, H1-1 and H1-2, a
majority of students are reading at Below Basic and Basic levels. These students
0%
20%
40%
60%
80%
100%
F1-1 F1-2 F1-3 F1-4 F1-5 H1-1 H1-2
Class
2011 Secondary 1 Performance
Advanced Proficient
Basic Below Basic

Copyright © 2014 Scholastic Inc. All rights reserved. 28
require immediate attention in the form of intensive instruction and remediation
where necessary. The choice of classroom reading instructional materials should be
carefully considered to ensure that students are able to build the required reading
skills, without being overly challenged by the text on-hand.
Secondary 2
Class Below Basic Basic Proficient Advanced Total Number
of Students
F2-1 6 8 14 9 37
F2-2 22 4 5 7 38
F2-3 19 2 6 9 36
F2-4 20 6 7 7 40
F2-5 24 10 4 1 39
H2-1 38 1 1 0 40
H2-2 26 1 3 1 31
Whole Level 155 32 40 34 261
The analysis of Secondary 2 tests shows that there is a significant increase in the
number of students falling into the Below Basic category of reading proficiency. In
fact, coupled with students in the Basic category, they make up 72% of the cohort.
This is cause for reflection on what initiatives in literacy practices and instructional
design need to be undertaken to remediate the situation.
0%
20%
40%
60%
80%
100%
F2-1 F2-2 F2-3 F2-4 F2-5 H2-1 H2-2
Class
2011 Secondary 2 Performance
Advanced
Proficient
Basic
Below Basic

Copyright © 2014 Scholastic Inc. All rights reserved. 29
Secondary 3
Class Below Basic Basic Proficient Advanced Total Number
of Students
F3-1 21 5 7 9 42
F3-2 12 9 11 7 39
F3-3 25 5 6 5 41
F3-4 17 4 7 4 32
F3-5 25 3 1 2 31
H3-1 30 2 0 1 33
H3-2 27 0 1 0 28
H3-3 25 1 1 0 27
Whole Level 182 29 34 28 273
In Secondary 3, 77% of students fall in the lower half of the reading proficiency scale.
This is an increase over previous years and cause for serious consideration.
Secondary 4
Class Below Basic Basic Proficient Advanced Total Number
of Students
F4-1 19 12 6 3 40
F4-2 27 8 3 1 39
F4-3 35 4 3 0 42
F4-4 18 14 5 1 38
F4-5 2 1 1 0 4
H4-1 18 1 1 0 20
H4-2 27 3 1 0 31
H4-3 21 2 0 0 23
Whole Level 167 45 20 5 237
0% 20% 40% 60% 80%
100%
F3-1 F3-2 F3-3 F3-4 F3-5 H3-1 H3-2 H3-3
Class
2011 Secondary 3 Performance
Advanced
Proficient
Basic
Below Basic

Copyright © 2014 Scholastic Inc. All rights reserved. 30
In Secondary 4, 90% of pupils fall into the lower half of the reading proficiency scale.
Secondary 5
Class Below Basic Basic Proficient Advanced Total Number
of Students
F5-1 17 1 0 0 18
F5-2 20 2 0 0 22
Whole Level 37 3 0 0 40
In Secondary 5, the trend observed in prior levels continues with most students
falling in the Below Basic proficiency range.
0%
20%
40%
60%
80%
100%
F5-1 F5-2
Class
2011 Secondary 5 Performance
Advanced Proficient Basic Below Basic
0%
20%
40%
60%
80%
100%
F4-1 F4-2 F4-3 F4-4 F4-5 H4-1 H4-2 H4-3
Class
2011 Secondary 4 Performance
Advanced
Proficient
Basic
Below Basic

Copyright © 2014 Scholastic Inc. All rights reserved. 31
0% 20% 40% 60% 80%
100%
Sec 1 Sec 2 Sec 3 Sec 4 Sec 5
Level
2011 Comparative Performance by Level
Advanced
Proficient
Basic
Below Basic
Comparative analysis across grade levels
A trend that is observed when reviewing the LitPro results for Secondary 2, 3 and 4 is
that an increasing number of students in all these levels are falling behind; with
more students reading at Below Basic and Basic levels in all classes. Assuming that
the PSLE intake scores and background of each cohort has remained relatively
consistent over the years, this is an area of concern. It seems to indicate that
students are struggling to read more challenging texts as they progress into the
higher grade levels. This means that their reading fluency is not improving at the rate
required to keep up with the reading resources provided.
In Secondary 2, apart from F2-1, more than 50% of students are reading at a Below
Basic proficiency level. In Secondary 3, this is also the case for all classes except F3-2.
In Secondary 4, close to 80% of students are reading at a Below Basic or Basic
proficiency level in all of the classes. The initial analysis of LitPro results seems to
show that students may be falling behind in their reading ability as they progress
through their academic programme.
A review of current instructional practices and programmes should be considered to
address this issue, and ensure that students are being given sufficient reading
materials at the appropriate level of challenge to develop the appropriate reading
skills. Specially designed, targeted intensive remediation would also be useful in this
case to arrest the trend of backsliding.

Copyright © 2014 Scholastic Inc. All rights reserved. 32
0%
20%
40%
60%
80%
100%
Sec 1A Sec 1B Sec 1C Sec 1D Sec 1E
Class
2011 Secondary 1 Express Performance
Advanced Proficient Basic Below Basic
School 6
Secondary 1
Class Below Basic Basic Proficient Advanced Total Number of
Students
Sec 1A 16 11 8 2 37
Sec 1B 19 9 7 4 39
Sec 1C 26 5 6 2 39
Sec 1D 23 11 5 0 39
Sec 1E 21 11 1 1 34
Sec 1F 29 0 0 0 29
Sec 1G 32 0 0 0 32
Whole School 166 47 27 9 249
The test data for this secondary school shows that close to half of the Secondary 1
cohort for 2011 was reading at a proficiency level below what was required for
Secondary 1. About 30% of the cohort was reading within the Lexile range required
for proficiency and less than 10% were at an Advanced level. This pattern of
proficiency was consistent across all the five Secondary 1 classes, with the weakest
class being Sec 1E. The results signal the potential risk of a significant number of
students falling behind and this would have repercussions in other subject areas as
well. The best action moving forward would be an intensive learning support
programme at this level to ensure that students move into the Basic level of reading
proficiency and stem any possible backsliding in the higher levels. Close attention

Copyright © 2014 Scholastic Inc. All rights reserved. 33
should also be paid to the selection of reading resources and classroom instructional
materials to ensure that they are on level with students’ reading proficiency.
School 7
Secondary 1
Class Below Basic
Basic Proficient Advanced Total Number of
Students
Sec 1-1 2 9 8 13 32
Sec 1-2 2 8 9 12 31
Sec 1-3 3 6 11 12 32
Sec 1-4 3 8 5 17 33
Sec 1-5 2 5 7 17 31
Sec 1-6 0 1 7 25 33
Sec 1-7 11 10 6 10 37
Whole Level 23 47 53 106 229
The overall result of the LitPro test is that 2011 Secondary 1 cohort is reading at high
levels of proficiency, with close to 70% reading at the Proficient and Advanced levels.
47% of the 2011 Secondary 1 cohort are reading at a level above what is required at
Secondary 1, indicating that teachers are able to use resources which challenge
students beyond what is determined for Secondary 1 during their instruction.
Students are performing above the determined Secondary 1 standard should be
selected to be part of an Independent Reading Programme as most of them are
reading on and above their grade level. Sec 1-5 and Sec 1-6 are the most
academically able classes, and there should be serious consideration given to
0%
20%
40%
60%
80%
100%
Sec 1-1
Sec 1-2
Sec 1-3
Sec 1-4
Sec 1-5
Sec 1-6
Sec 1-7
Class
2011 Secondary 1 Performance
Advanced
Proficient
Basic
Below Basic

Copyright © 2014 Scholastic Inc. All rights reserved. 34
0
20
40
60
80
100%
Sec 1-1 Sec 1-2 Sec 1-3 Sec 1-4 Sec 1-5
Class
2011 Secondary 1 Express Performance
Advanced Proficient Basic Below Basic
designing learning programmes which stretch students. The percentage of students
who are reading below level is very small, and mostly concentrated in Sec 1-7. As
such, an intensive after-school support programme for targeted students to bring
them on-level would be more ideal as opposed to a separate in-class differentiated
instructional programme.
School 8
Secondary 1
Class Below Basic Basic Proficient Advanced Total Number of
Students
Sec 1-1 12 11 5 12 40
Sec 1-2 3 12 8 17 40
Sec 1-3 5 8 17 10 40
Sec 1-4 3 12 14 11 40
Sec 1-5 14 14 5 5 38
Sec 1-6 25 8 4 2 39
Sec 1-7 32 2 0 1 35
Whole Level 94 67 53 58 272
For a school in a developing neighbourhood, the test data was encouraging for
teachers at this secondary school as it revealed that the incoming Secondary 1
cohort for 2011 had relatively high level of reading proficiency. 40% of the cohort is
reading above their grade level required at Secondary 1. These students are spread
across all five Secondary 1 classes. Nevertheless a significant number at 35% are also

Copyright © 2014 Scholastic Inc. All rights reserved. 35
0%
20%
40%
60%
80%
100%
Sec 1A1
Sec 1A2
Sec 1E1
Sec 1E2
Sec 1E3
Sec 1E4
Sec 1T1
Class
2011 Secondary 1 Performance
Advanced
Proficient
Basic
Below Basic
reading at a Below Basic level and most come from Sec 1-1 and Sec 1-5. For this
school, the focus on a differentiated approach to instruction would be ideal given
the significant range in reading proficiency levels in each class. This would allow
teachers to cater to the needs of all the students in the different ability groups. In
addition, a separate enrichment or learning support programme should be
considered for targeted students in the Below Basic group.
School 9
Secondary 1
Class Below Basic Basic Proficient Advanced Total Number of
Students
Sec 1A1 25 9 3 4 41
Sec 1A2 32 6 2 0 40
Sec 1E1 10 9 10 9 38
Sec 1E2 18 6 9 5 38
Sec 1E3 23 8 4 4 39
Sec 1E4 10 9 7 11 37
Sec 1T1 37 3 0 0 40
Whole Level 155 50 35 33 273
The Secondary 1 test data reveals that 56% of the cohort is reading at a level below
what is required. These students are relatively evenly spread out across all the
Express classes, from Sec 1E1 to Sec 1E4. Only about 24% of the cohort is reading on
grade level.

Copyright © 2014 Scholastic Inc. All rights reserved. 36
0%
20%
40%
60%
80%
100%
Sec 2A1
Sec 2A2
Sec 2E1
Sec 2E2
Sec 2E3
Sec 2E4
Sec 2E5
Sec 2T1
Class
2011 Secondary 2 Performance
Advanced
Proficient
Basic
Below Basic
Secondary 2
Class Below Basic Basic Proficient Advanced Total Number of
Students
Sec 2A1 30 9 2 2 43
Sec 2A2 36 5 0 2 43
Sec 2E1 9 13 8 10 40
Sec 2E2 16 8 11 5 40
Sec 2E3 22 5 8 4 39
Sec 24 22 6 8 3 39
Sec 2E5 19 14 2 2 37
Sec 2T1 36 0 0 0 36
Whole Level 190 60 39 28 317
The data for Secondary 2 performance is discussed together with that for Secondary
3 below.

Copyright © 2014 Scholastic Inc. All rights reserved. 37
0%
20%
40%
60%
80%
100%
Sec 3A1
Sec 3A2
Sec 3A3
Sec 3E1
Sec 3E2
Sec 3E4
Sec 3E4
Sec 3E5
Sec 3T1
Class
2011 Secondary 3 Performance
Advanced Proficient Basic Below Basic
Secondary 3
Class Below Basic Basic Proficient Advanced Total Number of
Students
Sec 3A1 32 0 0 0 32
Sec 3A2 19 2 0 0 21
Sec 3A3 28 0 0 0 28
Sec 3E1 22 6 9 3 40
Sec 3E2 23 8 6 2 39
Sec 3E3 22 5 8 4 39
Sec 3E4 22 8 5 6 41
Sec 3E5 28 1 0 7 36
Sec 3T1 39 1 0 0 40
Whole Level 235 31 28 22 316
The results for this neighbourhood school indicate the need to review the efficacy of
the current instructional model and learning support programmes. Given that the
PSLE intake scores on each cohort were quite similar, the LitPro data presents a
scenario where students’ reading proficiency is falling behind in each subsequent
year. The results of the Secondary 2 cohort indicate that 59% are reading at a Below
Basic level and this increases to 74% in Secondary 3. There also seems to be difficulty
in sustaining students who are reading above grade level with the percentage
decreasing from 12% in Secondary 1 to 8% in Secondary 2 and 7% in Secondary 3. It
would be ideal for this school to focus on designing a strong reading and language
foundation programme in the lower secondary years to ensure that students are

Copyright © 2014 Scholastic Inc. All rights reserved. 38
able to meet the challenge of the GCE ‘O’ levels. In addition, a highly structured and
supported levelled reading programme would be the recommended approach to
promote independent reading. The key for this school is to move a high proportion
of students from the Below Basic into the Basic and Proficient category in the lower
secondary years and then focus on sustaining their proficiency in the upper
secondary years.
Applications of Scholastic LitPro Test
The ability to develop an effective instructional programme for learning English and
to select reading resources that match appropriately to the students’ reading fluency
levels has taken on greater significance in an environment where reading fluency is
positively correlated to academic achievement. Students need to be able to read
across subject areas and effectively apply comprehension skills that they have learnt
in the language classroom. It is within this context that the LitPro test and the Lexile
Framework for Reading provide educators an opportunity to gain appropriate
information and design relevant reading and English language instructional
programmes to meet the needs and abilities of their students.
One of the most useful deliverables of the LitPro test is that critical student test data
is captured, analysed and presented in reports that allow educators to track reading
comprehension progress of individual students, groups, classes and at whole-school
level for specified time periods. This enables educators to critically review and
analyse instructional practices and fine tune them to meet the needs of specific
students and groups of students. It allows them to engage more effectively in
differentiated instruction and assessment as they develop instructional programmes
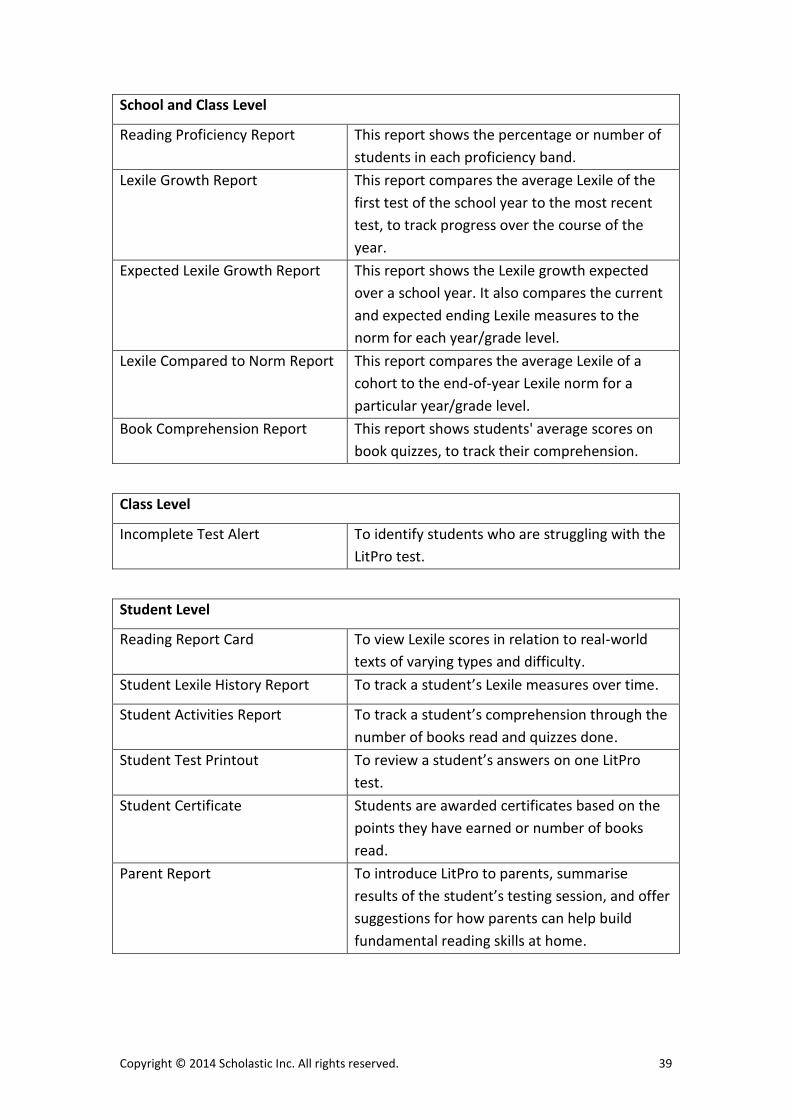
and materials. The table on the next page provides an overview of all the LitPro
reports by type and the functions that it serves.
Copyright © 2014 Scholastic Inc. All rights reserved. 39
School and Class Level
Reading Proficiency Report This report shows the percentage or number of
students in each proficiency band.
Lexile Growth Report This report compares the average Lexile of the
first test of the school year to the most recent
test, to track progress over the course of the
year.
Expected Lexile Growth Report This report shows the Lexile growth expected
over a school year. It also compares the current
and expected ending Lexile measures to the
norm for each year/grade level.
Lexile Compared to Norm Report This report compares the average Lexile of a
cohort to the end-of-year Lexile norm for a
particular year/grade level.
Book Comprehension Report This report shows students' average scores on
book quizzes, to track their comprehension.
Class Level
Incomplete Test Alert To identify students who are struggling with the
LitPro test.
Student Level
Reading Report Card To view Lexile scores in relation to real-world
texts of varying types and difficulty.
Student Lexile History Report To track a student’s Lexile measures over time.
Student Activities Report To track a student’s comprehension through the
number of books read and quizzes done.
Student Test Printout To review a student’s answers on one LitPro
test.
Student Certificate Students are awarded certificates based on the
points they have earned or number of books
read.
Parent Report To introduce LitPro to parents, summarise
results of the student’s testing session, and offer
suggestions for how parents can help build
fundamental reading skills at home.

Copyright © 2014 Scholastic Inc. All rights reserved. 40
When used as an assessment tool, LitPro provides specific data based on individual
abilities. Current standardised reading comprehension tests draw from standardised
tests and grade level reading texts to measure fluency. These types of tests deliver
the same test items to every student regardless of a student’s current reading ability.
They also cannot provide accurate indicators of reading comprehension levels, as all
students are not starting at the same level. Hence the accuracy of the scores and its
use as a tool to guide instruction do not take into account the existence of
differentiated abilities in the classroom. When Lexile measures are used to compare
students’ reading abilities to reading materials, it allows for adjustment of the
readers’ expected comprehension level and leads to successful individualised
reading experiences through targeted instruction and intervention programmes.
Adopting LitPro as a core assessment tool will enable educators to take into account
the differences in ability that affect the accuracy of a student’s score. It will provide a
much more accurate indicator of students’ reading proficiency as it uses a common,
absolute scale to measure text readability and student reading ability. For teachers
and educators it provides the opportunity to track students’ progress and assign
appropriate reading materials using a systematic, structured and standardised
approach.
The analyses in this paper show that using LitPro test to benchmark reading fluency
is useful for all schools. The range of schools is indicative of the benefits that LitPro
can provide in different educational settings to achieve a range of instructional and
learning outcomes.

Copyright © 2014 Scholastic Inc. All rights reserved. 41
This paper presents a brief analysis of the reading proficiency levels of students in
various schools at the time of the first administration of the LitPro assessment tool.
It enables teachers to understand the reading level and needs of each student and at
the same time understand the reading profile of the class as a whole. The teacher
will be able to make informed decisions with regard to classroom instructional
strategies and materials, classroom management and intensive and extensive
reading requirements. The data will influence the choice of texts and instructional
materials as well as the reading and language learning instructional approaches.
Across the level, the level head and teachers of each level will be able to see the
spread of students and determine differentiation and collaborative strategies
particularly with regard to intervention/ remediation and enrichment. Decisions can
be made about the allocation of teachers to particular classes based on the reading
profile and needs as well as the division of students into the various classes. A profile
of the reading proficiency at the whole school level allows the Head of Department
and faculty to make better informed decisions about instructional programmes,
reading programmes and library materials.
When the LitPro test is administered consistently and at fixed intervals, reports
generated will indicate the reading progress of a student within that grade level and
across grades as they progress through primary/ secondary school. Consistent and
skilful application of the results of LitPro tests will assist the teacher in providing
high-quality instruction and targeted interventions that match students’ needs by
providing systematic, data-driven processes for determining if implemented
strategies are working for each student. The LitPro test can support school-, cluster-
and nation-wide reading proficiency initiatives by serving as a universal screener,
placement tool, and progress monitor for all students at class-, school-, cluster- and
nation-wide levels. Using the reports, teachers can determine whether intensive
individual intervention, targeted small group instruction or a core instructional
programme, or a mix of all three would be most effective for each student.

Copyright © 2014 Scholastic Inc. All rights reserved. 42
The results of the LitPro test are reported on a developmental scale that is
interpretable across grade levels, making it a useful tool for accurately establishing
students’ initial reading comprehension levels and monitoring their growth
throughout the year. Teachers can use LitPro to individualise students’ learning
experiences and help ensure that they become motivated and successful readers.
While teachers typically have a good understanding of what students are expected
to know and be able to do in order to demonstrate basic grade-level reading
proficiency, they may not always have timely or accurate information to help
individual students develop their reading skills. Moreover, because teachers may
differ in their approach to reading instruction — both basic reading instruction and
remedial interventions — they are often in need of a measure that provides precise,
useful information about reading ability that is aligned with end-of-year measures
and is more or less neutral with respect to their chosen approach to reading
instruction.
As more schools get on LitPro, more data will be fed to reflect the reading
proficiency levels for Singapore. The test will then get more and more precisely
calibrated to provide results and information that will be completely suited to the
Singapore context and desired outcomes of the English Language Syllabus. This in
turn will lead to more informed and more effective decisions about instructional
design, materials and practice in the classroom and reading materials in the library
and for extensive reading.

Copyright © 2014 Scholastic Inc. All rights reserved. 43
Conclusion
The data presented and analysed in this paper shows that the LitPro assessment tool
can be used to identify students in need of assistance, effectively guiding
instructional interventions early in the school year. With access to an effective
classroom assessment tool that produces a metric that describes both the
complexity of text and student reading comprehension, and that is related to
expressed achievement levels, teachers can:
1. Align instructional materials to state standards and scaffold student
comprehension instruction.
2. Establish realistic, informed student achievement growth goals based on
students’ initial reading comprehension levels.
3. Monitor an instructional plan to help students at all levels demonstrate
proficiency in meeting reading standards.
In other words, teachers using LitPro will be able to obtain the data they need
throughout the year to monitor student progress, set goals according to reading
level, and adjust instruction appropriately. Teachers can start thinking about reading
proficiency in an objective manner, set goals and monitor performance, craft
initiatives suited to their students’ reading proficiency profiles and evaluate their
effectiveness. Most importantly, implementing LitPro will support every school’s
goal of ensuring that all students achieve reading success.

Copyright © 2014 Scholastic Inc. All rights reserved. 44
References
Lennon & Burdick (2004). The Lexile Framework as an Approach for Reading Measurement and Success MetaMetrics, Inc. (2008). The text continuum in 2008. Presented at the Lexile National Conference, San Antonio, TX. Scholastic Inc. (2007). Scholastic Reading Inventory technical guide. New York: Scholastic Inc. Also available at http://teacher.scholastic.com/products/sri_reading_assessment/pdfs/SRI_TechGuide.pdf Scholastic Inc. (2007). Accuracy Matters: Reducing Measurement Error by Targeted SRI Testing. New York, NY Scholastic Inc. (2008). Lexiles: A System for Measuring Reader Ability and Text Difficulty. A Guide for Educators. New York, NY Williamson, G. L. (2008). A text readability continuum for postsecondary readiness. Journal of Advanced Academics, 19(4), 602-632.


For enquires on cluster/school implementation, data services, consultations and professional development, please contact: Scholastic Education International (S) Pte Ltd 81 Ubi Avenue 4 #02-28 UB.ONE Singapore 408830 Contact: +65 6922 9589 Fax: +65 6922 9588 Email: [email protected] Website: scholastic.com/literacypro