professor of economics, bryant university
TRANSCRIPT

Economic Data LiteracyEdi Tebaldi, Ph.D.
Professor of Economics, Bryant University
Hassenfeld Institute for Public Leadership
• “Practical men, who believe themselves to be quite exempt from any intellectual influence, are usually the slaves of some defunct economist.” (John Maynard Keynes)
• “Practical men, who believe themselves to be quite exempt from mistakes interpreting data are often wrong or are pawns of data analysts and economists.”

Outline
• Data analysis in the era of big data
• Assessing economic conditions
• Common mistakes in data analysis
• The DO’s and DON’TS of data analysis

Data analysis in the era of big data
Hassenfeld Institute for Public Leadership

Why bother about economic data literacy?
• Meet public administration’s modernization goals;
• Make the decision-making process data-driven;
• Data are been produced in unfathomable quantity: • Can you make sense of it? • What good are the data if you cannot analyze the information collected?
• Are you asking your data the right/wrong questions?• Data scientists now how to process data, but are they the ones who know
best what is the right question to be asked?
• Should we start with data-first answers and then works backward to find the questions that should have been asked?
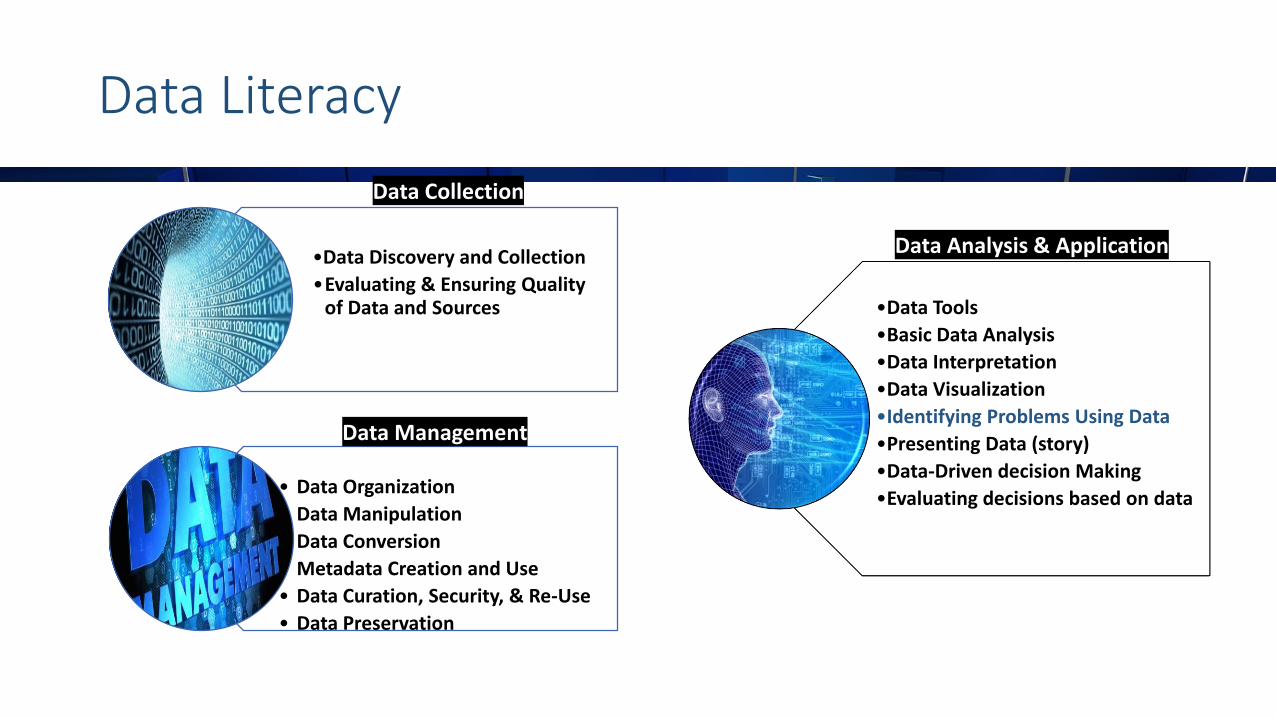
Data Literacy
•Data Discovery and Collection
•Evaluating & Ensuring Quality of Data and Sources
• Data Organization
• Data Manipulation
• Data Conversion
• Metadata Creation and Use
• Data Curation, Security, & Re-Use
• Data Preservation
Data Collection
•Data Tools
•Basic Data Analysis
•Data Interpretation
•Data Visualization
•Identifying Problems Using Data
•Presenting Data (story)
•Data-Driven decision Making
•Evaluating decisions based on data
Data Analysis & Application
Data Management
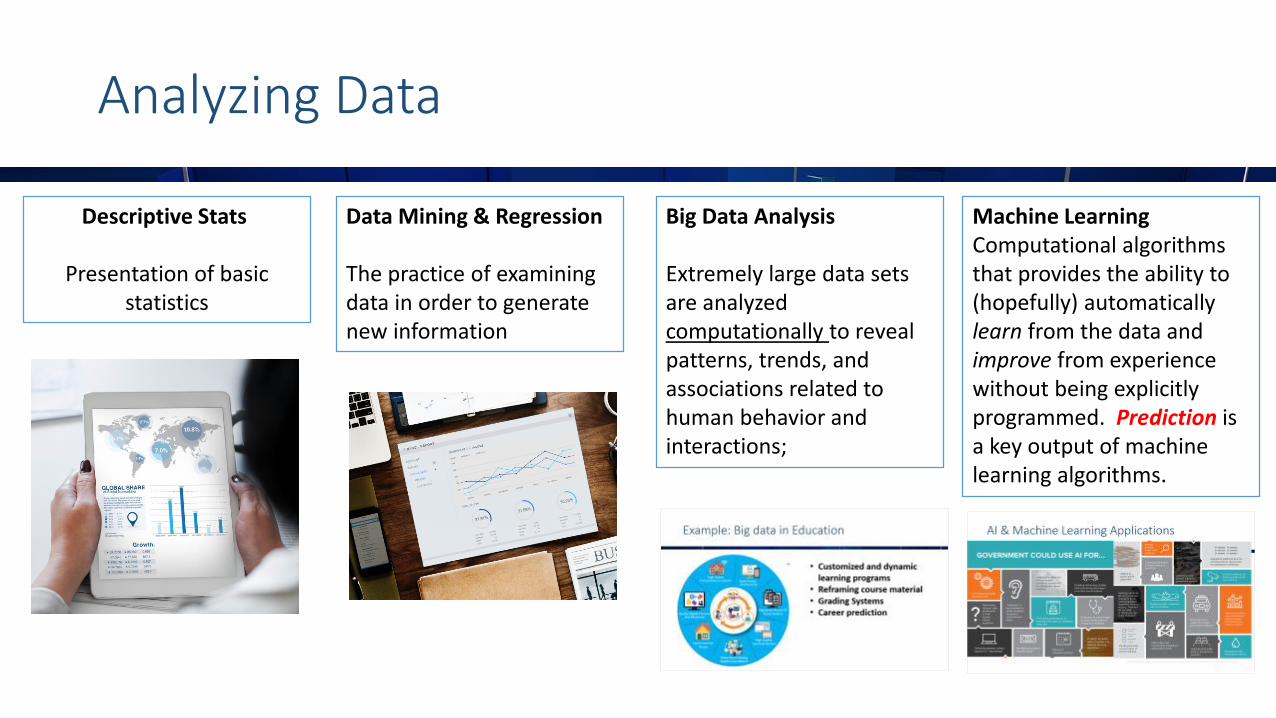
Analyzing Data
Descriptive Stats
Presentation of basicstatistics
Big Data Analysis
Extremely large data sets are analyzed computationally to reveal patterns, trends, and associations related to human behavior and interactions;
Machine LearningComputational algorithms that provides the ability to (hopefully) automatically learn from the data and improve from experience without being explicitly programmed. Prediction is a key output of machine learning algorithms.
Data Mining & Regression
The practice of examining data in order to generate new information
Assessing Economic Conditions
Hassenfeld Institute for Public Leadership
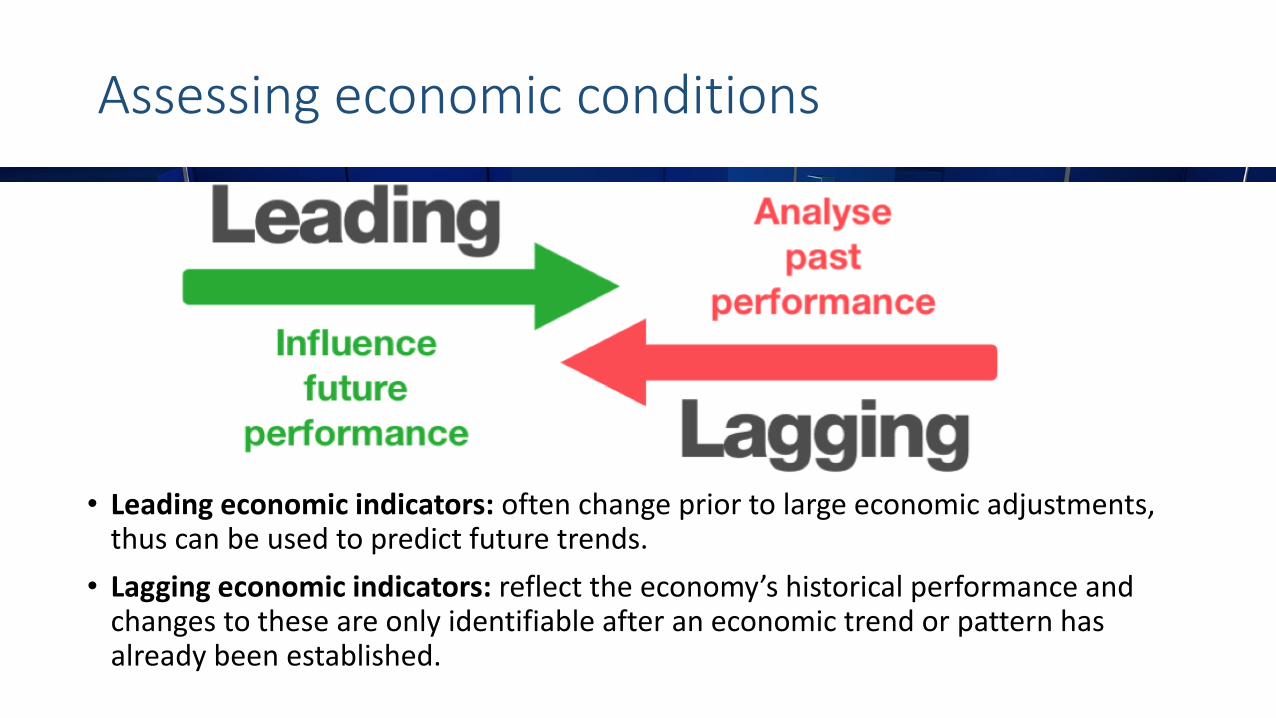
Assessing economic conditions
• Leading economic indicators: often change prior to large economic adjustments, thus can be used to predict future trends.
• Lagging economic indicators: reflect the economy’s historical performance and changes to these are only identifiable after an economic trend or pattern has already been established.

Lagging Economic Indicators
National & Local
• Current Economic Conditions Indicator: RIPEC/Bryant & FED
• Gross Domestic Product (GDP)• US, RI
• Unemployment Rate: US, RI
• Income: US, RI
• Wages: US, RI
• Consumer Price Index (Inflation): • US, New England
Global
• Exchange Rates: US
• Balance of Trade: US
• Libor (Interest Rate): UK
• Japan Stock market - NIKKEI
• EURO-Zone Stock Market: EURO

Warning: Do not let unemployment statistics fool you
Alternative Measures of Unemployment
• Discouraged workers: would like to have a job but they have not looked for work in the past four weeks:• Counted as out of the labor force;• Could be counted as unemployed but
they are not.
• Involuntary part-time workers: people who would like to work full-time but cannot find a full-time job.• Counted as employed.
BLS: https://www.bls.gov/lau/stalt.htm
FRED: U6UNEM6RI
Labor Force Participation
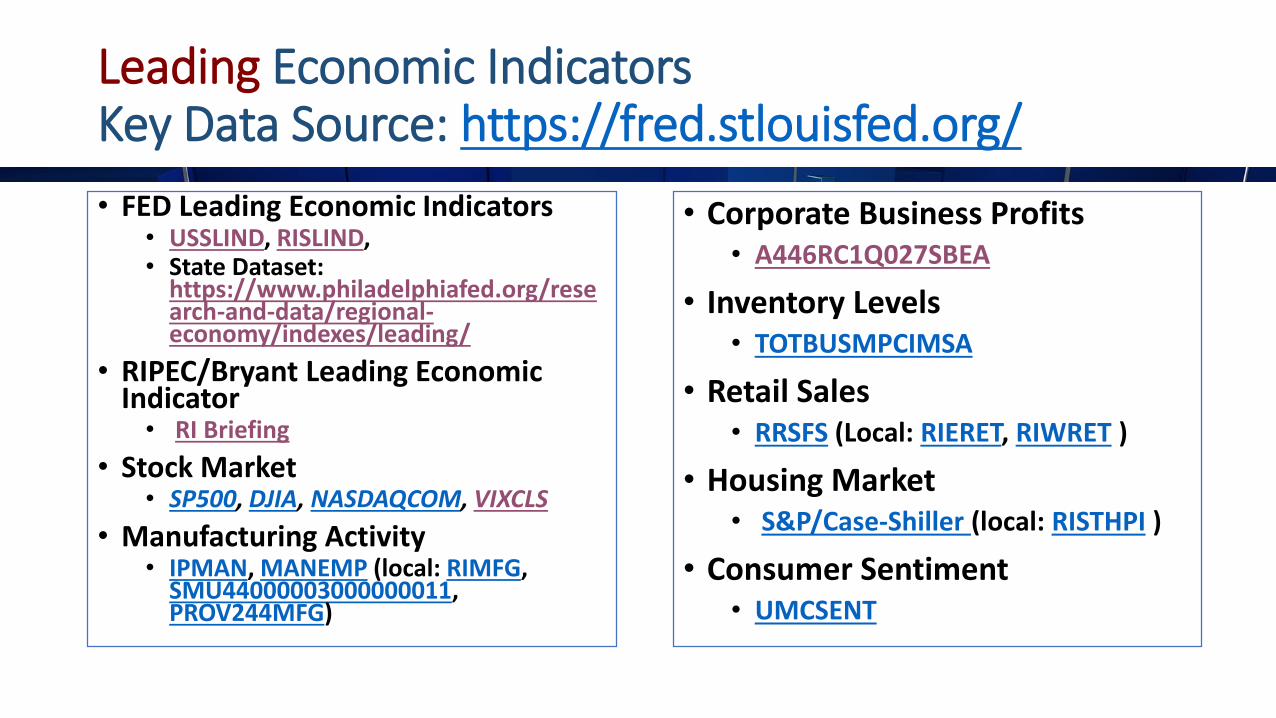
Leading Economic IndicatorsKey Data Source: https://fred.stlouisfed.org/
• FED Leading Economic Indicators • USSLIND, RISLIND,• State Dataset:
https://www.philadelphiafed.org/research-and-data/regional-economy/indexes/leading/
• RIPEC/Bryant Leading Economic Indicator• RI Briefing
• Stock Market • SP500, DJIA, NASDAQCOM, VIXCLS
• Manufacturing Activity • IPMAN, MANEMP (local: RIMFG,
SMU44000003000000011, PROV244MFG)
• Corporate Business Profits • A446RC1Q027SBEA
• Inventory Levels • TOTBUSMPCIMSA
• Retail Sales • RRSFS (Local: RIERET, RIWRET )
• Housing Market• S&P/Case-Shiller (local: RISTHPI )
• Consumer Sentiment• UMCSENT

Economic theory based Leading Indicators
Natural Unemployment rate (NROU) The Yield Curve (T10Y2Y)

Common Mistakes in Data Analysis
Hassenfeld Institute for Public Leadership
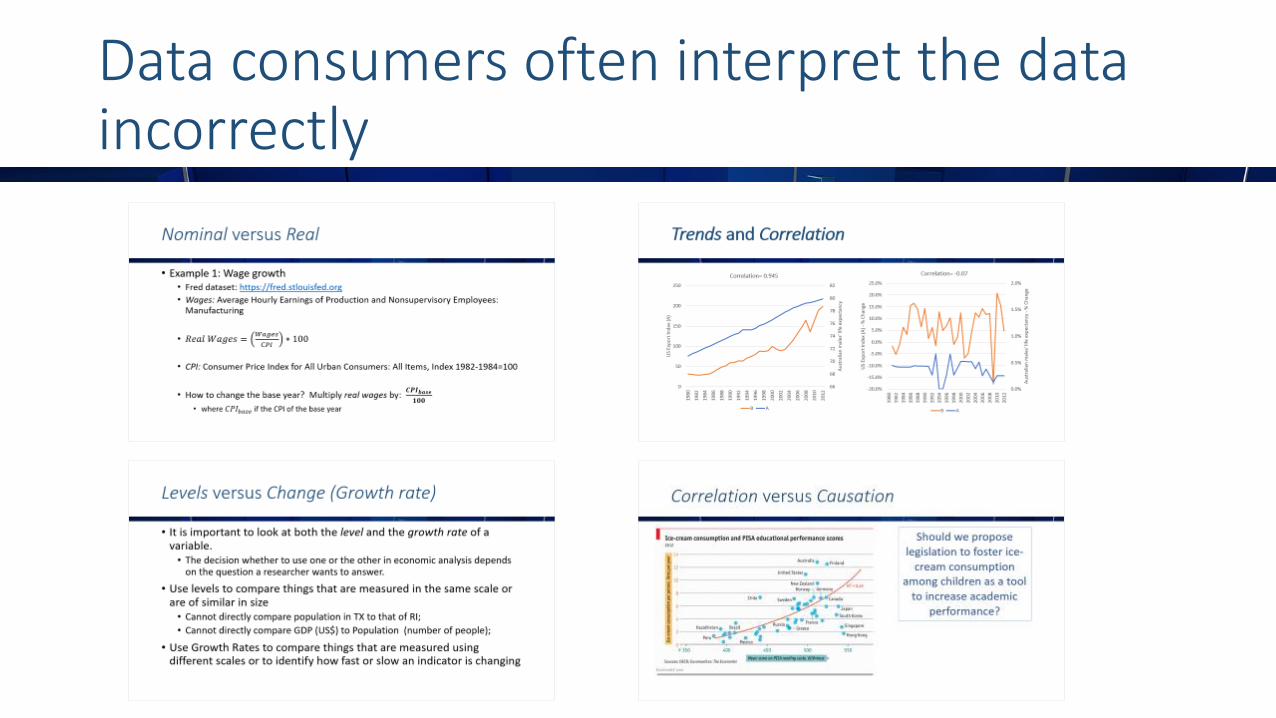
Data consumers often interpret the data incorrectly
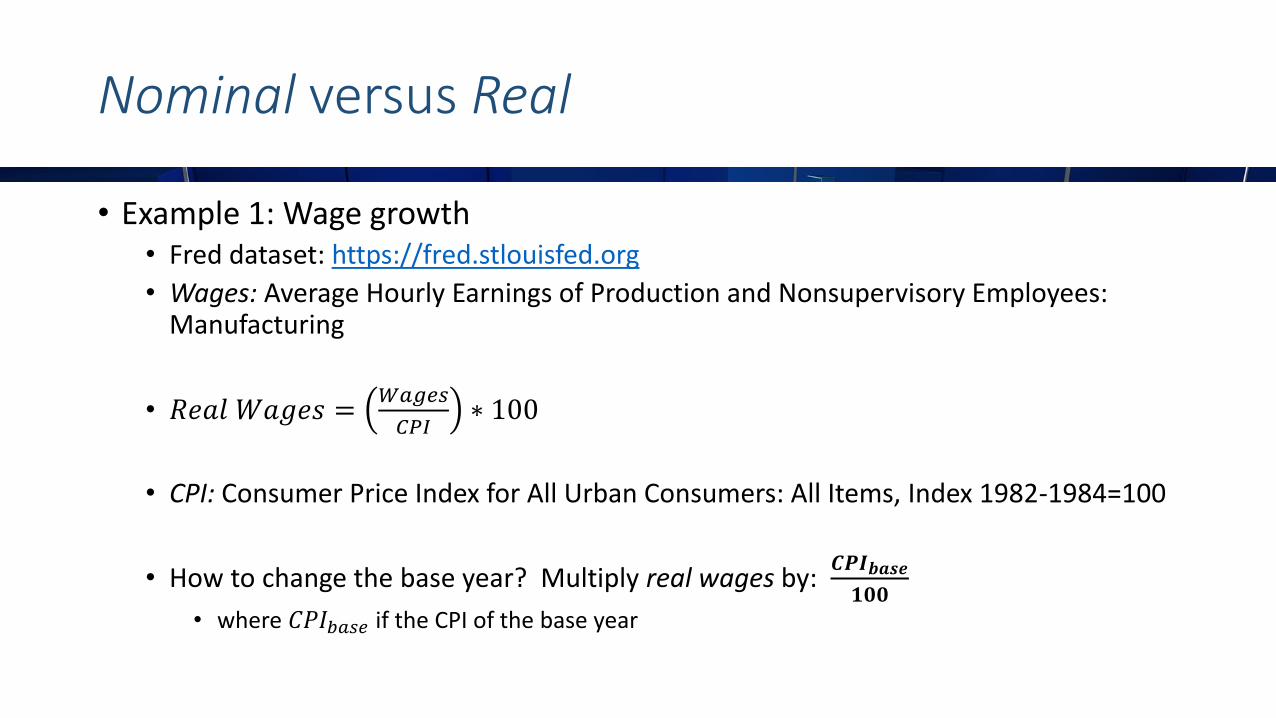
Nominal versus Real
• Example 1: Wage growth • Fred dataset: https://fred.stlouisfed.org
• Wages: Average Hourly Earnings of Production and Nonsupervisory Employees: Manufacturing
• 𝑅𝑒𝑎𝑙 𝑊𝑎𝑔𝑒𝑠 =𝑊𝑎𝑔𝑒𝑠
𝐶𝑃𝐼∗ 100
• CPI: Consumer Price Index for All Urban Consumers: All Items, Index 1982-1984=100
• How to change the base year? Multiply real wages by: 𝑪𝑷𝑰𝒃𝒂𝒔𝒆
𝟏𝟎𝟎• where 𝐶𝑃𝐼𝑏𝑎𝑠𝑒 if the CPI of the base year
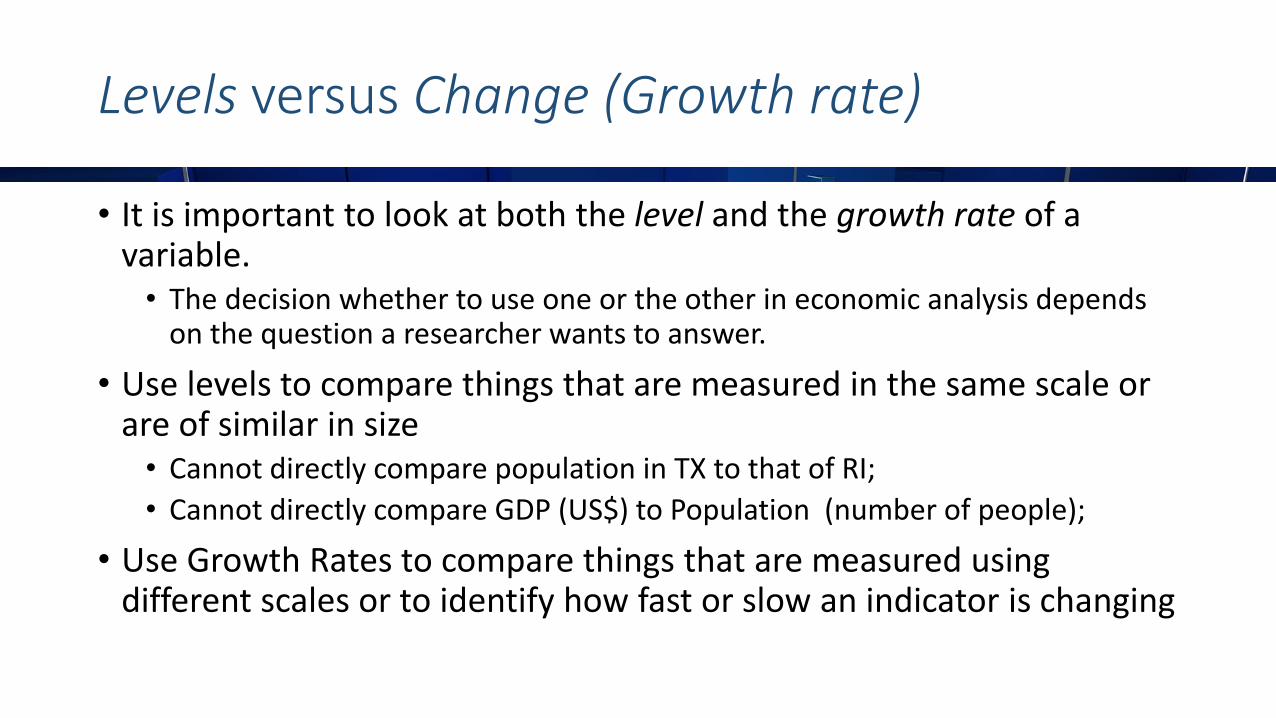
Levels versus Change (Growth rate)
• It is important to look at both the level and the growth rate of a variable. • The decision whether to use one or the other in economic analysis depends
on the question a researcher wants to answer.
• Use levels to compare things that are measured in the same scale or are of similar in size• Cannot directly compare population in TX to that of RI;
• Cannot directly compare GDP (US$) to Population (number of people);
• Use Growth Rates to compare things that are measured using different scales or to identify how fast or slow an indicator is changing

Levels versus Change (Growth rate)
Example 2: Population
• Fred dataset: https://fred.stlouisfed.org
• Plot • Pop TX: “Resident Population in Texas”
• Pop RI: “Resident Population in Rhode Island”
• Change Axis from “number of people” to: • Percentage change
• Percentage change from year ago
Example 3: GDP
• RI GDP• Choose “ right” indicator
• Change Axis from “US$” to: • Percentage change
• Percentage change from year ago

Trends and Correlation
66
68
70
72
74
76
78
80
82
0
50
100
150
200
250
19
80
19
82
19
84
19
86
19
88
19
90
19
92
19
94
19
96
19
98
20
00
20
02
20
04
20
06
20
08
20
10
20
12
Correlation= 0.945
B A
66
68
70
72
74
76
78
80
82
0
50
100
150
200
250
19
80
19
82
19
84
19
86
19
88
19
90
19
92
19
94
19
96
19
98
20
00
20
02
20
04
20
06
20
08
20
10
20
12
Au
stra
lian
mal
es'
life
exp
ecta
ncy
US
Exp
ort
Ind
ex (
A)
Correlation= 0.945
B A
0.0%
0.5%
1.0%
1.5%
2.0%
-20.0%
-15.0%
-10.0%
-5.0%
0.0%
5.0%
10.0%
15.0%
20.0%
25.0%
19
80
19
82
19
84
19
86
19
88
19
90
19
92
19
94
19
96
19
98
20
00
20
02
20
04
20
06
20
08
20
10
20
12
Au
stra
lian
mal
es'
life
exp
ecta
ncy
-%
Ch
ange
US
Exp
ort
Ind
ex (
A)
-%
Ch
ange
Correlation= -0.07
B A

Trends and Correlation
• Time Series Data might have TRENDS• May cause severe statistical problems
• Trending variables may produce unreliable estimates• Spurious Correlations
• Examples: http://tylervigen.com/spurious-correlations
What to do:• Do not let the data analyst fool you;
• Demand figures/tables with “variation in” or “% change in”

Time series: “% change” is the way to go
0
1,000
2,000
3,000
4,000
5,000
6,000
7,000
8,000
9,000
10,000
0
50
100
150
200
250
300
350
400
450
500
20
01
20
02
20
03
20
04
20
05
20
06
20
07
20
08
20
09
20
10
20
11
20
12
20
13
20
14
20
15
20
16
Suic
ide
-Su
ffo
cati
on
R&
S Sp
end
ing
(bill
ion
)
Correlation=0.975
R&D Spending Sucide - Suffocation
-4.0%
-2.0%
0.0%
2.0%
4.0%
6.0%
8.0%
10.0%
12.0%
14.0%
0.0%
0.0%
0.0%
0.0%
0.0%
0.0%
0.0%
0.0%
0.0%
20
02
20
03
20
04
20
05
20
06
20
07
20
08
20
09
20
10
20
11
20
12
20
13
20
14
20
15
20
16
Suic
ide
-Su
ffo
cati
on
R&
S Sp
end
ing
(bill
ion
)
Correlation=0.12
R&D Spending Sucide - Suffocation

Correlation versus Causation
Should we propose legislation to foster ice-
cream consumption among children as a tool
to increase academic performance?

Correlation versus Causation
• Policy making depends on your understanding of the difference between correlation versus causation;
• Correlation can assist examining what has happened, but finding the cause of something gives you the opportunity to change it.
• Correlations may happen by accident, but causalrelationships are the outcome of structural economic forces;

How to identify Causation?
Causation, most of the times, cannot be identified only through graphical analysis or work with 2 variables.
1. Ask the right policy question2. Design an experiment to make sure that biases are eliminated or deploy
appropriate statistical methods
3. Conduct graphical and statistical analysis

Example
• Question: Does class size affect children’s test scores?
• Experiment: • What is the ideal experiment that could be used to capture the causal effect
of interest? • To test if class size affect children’s test scores, we could randomly assign some students
to small and other to big classes and then compare their academic performance by the end of the academic year;
• Can we run/execute the ideal experiment? • Yes, do it!
• No. Regression analysis may be able to answer the question of interest

No Selection Controls Selection Controls
Note: Standard errors are shown in parentheses. The sample size is 14,238.
(1) (2) (3) (4) (5) (6)
Private School 0.212 0.152 0.139 0.034 0.031 0.037
(0.060) (0.057) (0.043) (0.062) (0.062) (0.039)
Own SAT Score/100 0.051 0.024 0.036 0.009
(0.008) (0.006) (0.006) (0.006)
Predicted log(Parental Income) 0.181 0.159
(0.026) (0.025)
Female -0.398 -0.396
(0.012) (0.014)
Black -0.003 -0.037
(0.031) (0.035)
Hispanic 0.027 0.001
(0.052) (0.054)
Asian 0.189 0.155
(0.035) (0.037)
Other/Missing Race -0.166 -0.189
(0.118) (0.117)
High School Top 10 Percent 0.067 0.064
(0.020) (0.020)
High School Rank Missing 0.003 -0.008
(0.025) (0.023)
Athlete 0.107 0.092
(0.027) (0.024)
0.110 0.082 0.077
(0.024) (0.022) (0.012)
Sent Two Application 0.071 0.062 0.058
(0.013) (0.011) (0.010)
Sent Three Applications 0.093 0.079 0.066
(0.021) (0.019) (0.017)
Sent Four or more Applications 0.139 0.127 0.098
(0.024) (0.023) (0.020)
Average SAT Score of Schools Applied to/100
Example: does private college education pays off?
Dependent variable: Average Earnings
ln Yi = α + βPi + ∑ γ j GROUPji + δ1SATi + δ2 ln PIi + ei
Regression AnalysisIs There a Causal Private School Effect?
Selection control is the key!Ambition and opportunity matters.
The DO’s and DON’TS of Data Analysis
Hassenfeld Institute for Public Leadership
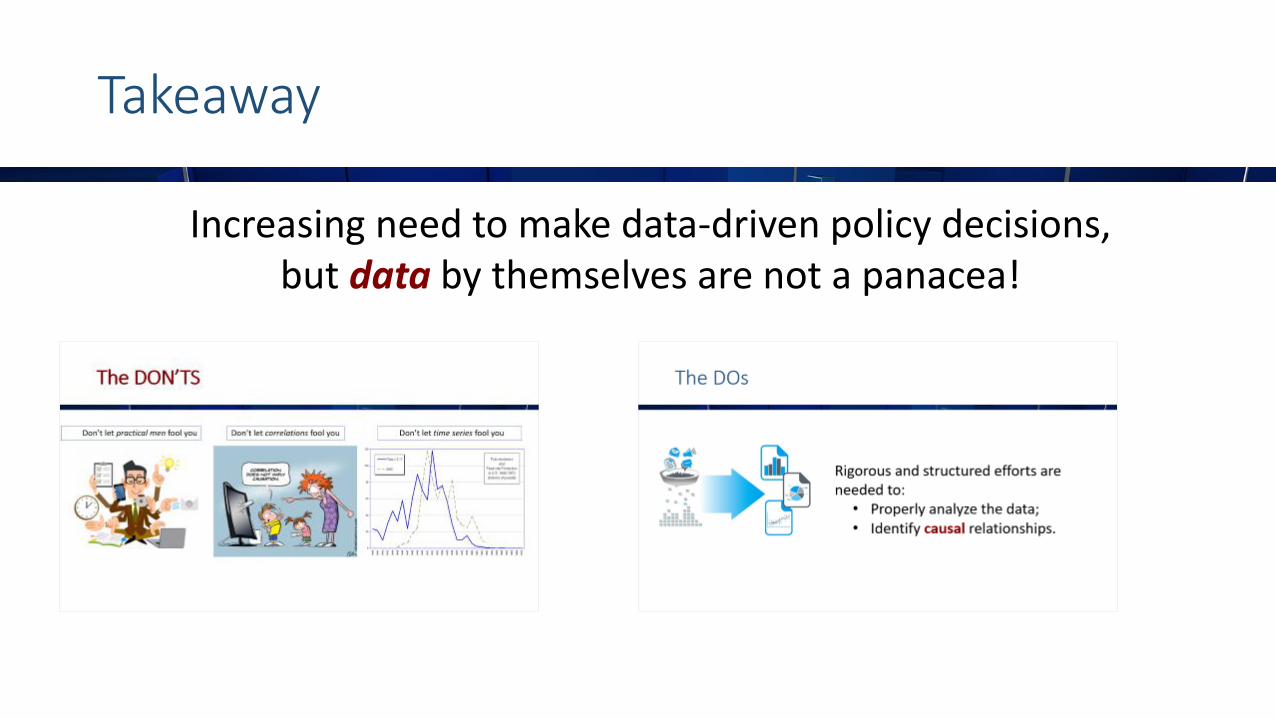
Takeaway
Increasing need to make data-driven policy decisions, but data by themselves are not a panacea!

The DOs
Rigorous and structured efforts are needed to: • Properly analyze the data;• Identify causal relationships.

The DOs
What are the limitations of the data analysis and the possible
impacts on the results?
Cross-examine your worldviews and biases
Discuss your question of interest
& data work with
others
Do I need a team of experts to properly analyze the problem at hand?

The DON’TS
Don’t let correlations fool you Don’t let time series fool youDon’t let practical men fool you

Source: AssetWorks

Obrigado
Gracias

What is the Causal relationship of interest?
• Does class size affect children’s test scores?• Does on-the-job-training increase productive? • Does private college education increase lifetime earnings?• Does R&D tax credits boost economic growth?

Example: Big data in Education
• Customized and dynamic learning programs
• Reframing course material• Grading Systems• Career prediction

AI & Machine Learning Applications

It is happening right now!
Urban Traffic
• Pittsburgh: SURTRAC -Scalable Urban Traffic Control-
• SURTRAC is used to manage traffic flows through several intersections and uses AI to optimize the traffic systems toward reduced travel times, reduced number of traffic stops, and reduced wait times.
• City reduced travel time by 25%, traffic stops by 30%, wait time by 40%, and overall emissions by 21% during the course of the pilot.
Predicting Fire Risk in Buildings
• Atlanta: Fire Rescue Department (AFRD) developed a predictive analytics software aimed at identifying buildings that have a higher likelihood of fire incidents.
• The software accurately predicted 73% of fire incidents in the building.
Chatbots
• North Carolina agency's IT help desk found made up more than 80 percent of its tickets were related to password reset, which chatbots tool care of.
• Free staff for more complex tasks.