profile of canadian environmental employment - eco …€¦ · 5 2. executive summary the `2010...
TRANSCRIPT

Profile of Canadian Environmental Employment
L A B O U R M A R K E T R E S E A R C H S T U D Y
2 0 1 0

E C O C A N A D A
ECO Canada develops programs that help individuals build meaningful
environmental careers, provides employers with resources to find and keep the
best environmental practitioners, and informs educators and governments of
employment trends to ensure the ongoing prosperity of this growing sector.
L A B O U R M A R K E T R E S E A R C H
ECO Canada Labour Market Research investigates current environmental skill and
labour trends within the environmental profession and provides up-to-date, timely
and relevant insights that can be applied in policy, business, and educational contexts.
The complete collection of reports is available at eco.ca.
1
Table of Contents 5 SECTION 1. ACKNOWLEDGEMENTS
6 SECTION 2. EXECUTIVE SUMMARY
11 SECTION 3. INTRODUCTION
11 3.1 About ECO Canada
11 3.2 Research Objectives
11 3.3 Summary of Methodology
11 3.4 Comparability with the 2007 Profile
of Canadian Environmental
Employment Study
12 SECTION 4. PROFILE OF ENVIRONMENTAL EMPLOYMENT IN CANADA
12 4.1 Summary
13 4.2 Environmental Employment by Industry
15 4.3 Employment by National Occupational
Standard (NOS) Category
16 4.4 Organizations employing
Environmental Employees
17 4.5 Environmental Employment by Province
18 4.6 Environmental Employment by Sector
and by Establishment Size
21 SECTION 5. PROFILE OF ENVIRONMENTAL EMPLOYEES IN CANADA
21 5.1 Summary
21 5.2 Demographic Profile
22 5.3 Training, Education & Experience
29 SECTION 6. RECRUITING ENVIRONMENTAL EMPLOYEES
29 6.1 Summary
29 6.2 Recent and Future Levels of
Recruiting Activity
30 6.3 Effective Recruitment Methods
32 6.4 Reasons for Effective Recruiting
34 SECTION 7. HIRING DURING THE ECONOMIC DOWNTURN
34 7.1 Summary
34 7.2 Hiring and Hiring Difficulties
35 7.3 Types of Vacancies
35 7.4 Hiring by Industry
38 SECTION 8. ENVIRONMENTAL EMPLOYEE ENGAGEMENT & TURNOVER
38 8.1 Summary
38 8.2 Employee Turnover
40 8.3 Employee Engagement
45 SECTION 9. FUTURE DEMAND FOR ENVIRONMENTAL WORKERS AND SKILLS
45 9.1 Summary
45 9.2 Growth in Total Workforce
46 9.3 Growth in Demand for Environmental Skills
48 9.4 Growth Occupational areas in
the Environmental Sector
49 9.5 Hot Jobs
50 9.6 Future Replacement Demand
54 APPENDIX A: ADDITIONAL SUMMARY TABLES
56 APPENDIX B: METHODOLOGY
64 APPENDIX C: EMPLOYER QUESTIONNAIRE

2
Table of Tables
13 TABLE 1 Total Canadian Environmental Employees by Industry
14 TABLE 2 Occupational Areas in the Environmental Sector
16 TABLE 3 Establishments with Environmental Employees by Major Industry Group
17 TABLE 4 Environmental Employees by Province
18 TABLE 5 Environmental Employees by Public, Private and Non-Profit Sector
19 TABLE 6 Environmental Employees by Establishment Size
21 TABLE 7 Environmental Employees by Age Category
22 TABLE 8 Environmental Employees for Selected Demographic Groups
22 TABLE 9 Environmental Employment by Level of Educational Attainment
24 TABLE 10 Educational Attainment for the Environmental Workforce by Occupational Area
26 TABLE 11 Environmental Employees by Level of Experience
27 TABLE 12 Average Annual Spending per Employee for Training
30 TABLE 13 Use and Effectiveness of Recruiting Methods
36 TABLE 14 Percentage of Firms who are Hiring Environmental Workers
41 TABLE 15A Organization Strengths in Promoting Employee Engagement
42 TABLE 15B Organization Strengths in Promoting Employee Engagement
47 TABLE 16 Environmental Employment as a Percentage of the Workforce
48 TABLE 17 Hiring Plans by Occupational Areas
49 TABLE 18 Hiring Difficulties in High Demand Occupations
51 TABLE 19 Environmental Employees Age 55 and Older by Occupational Areas
52 TABLE 20 Environmental Employees Age 55 or Older by Industry
52 TABLE 21 Educational Attainment by Age
3
Table of Figures
15 FIGURE 1 Environmental Employees by Occupational Areas
23 FIGURE 2 Environmental Employees with a Bachelor Degree or Higher
25 FIGURE 3 Environmental Workers who are Managers
29 FIGURE 4 Hiring Trends of Environmental Employers
31 FIGURE 5 Most Effective Recruitment Methods
32 FIGURE 6 Successful Recruitment Strategies
34 FIGURE 7 Vacant Positions at Environmental Employers in the Past
35 FIGURE 8 Reasons for Employee Vacancies
36 FIGURE 9 Organizations Hiring Environmental Employees in Past Year
39 FIGURE 10 Main Reasons for Employee Turnover
40 FIGURE 11 Environmental Workforce by Level of Employee Engagement
43 FIGURE 12 Strategies to Increase Employee Engagement
45 FIGURE 13 Forecast of Environmental Employees in 2010
46 FIGURE 14 Increase in Workforce Expectations by Organization Size
50 FIGURE 15 Environmental Workforce by Age and Gender

4
ECO Canada wishes to express its appreciation to all the
organizations and individuals who contributed their time
and effort to the development of this report.
The study is funded by the Government of Canada’s
Sector Council Program, whose continuous support is
much appreciated.
Special thanks are extended to the consultants RDA
Global for conducting the research and analyzing the
data collected through the survey.
1. ACKNOWLEDGEMENTS
Finally, this report would not have been possible without
the participation of countless individuals who offered
their time to talk to researchers and fill out the surveys.
These individuals were HR managers from companies
with environmental employment in Canada. It is for
these individuals that ECO Canada reserves its final and
most heartfelt thanks.

5
2. EXECUTIVE SUMMARY
The `2010 Profile of Canadian Environmental
Employment` is a unique study representing
the most comprehensive estimate of
environmental employment and use of
environmental skills in Canada. It is the first
study performed by ECO Canada that measures
the number of workers employed in specific
environmental occupations. This survey’s
focus on environmental occupations and skills
extends research previously performed that
identified environmental employment in each
industry, across sectors of the economy.
The report is based on survey data collected
from 2,204 organizations across all major
industry groups in Canada. The stratified
sample was drawn from an original sample of
over 23,000 employers in Canada. Of the 2,204
employers responding to the survey, 507 had
environmental employees and completed a
longer comprehensive questionnaire on human
resource matters for their environmental
employee workforce. The results of the survey
have been weighted by statistics reported from
the Labour Force Survey, the Census, and the
Canadian Business Patterns Database in order
to facilitate the estimation of total national and
provincial environmental employment and the
characteristics of these workers.
DEFINITION OF ENVIRONMENTAL EMPLOYMENT
For the purpose of the study, Environmental Employment is
defined as employed individuals who spend 50% or more of their
work time on activities associated with environmental protection,
resource management, or environmental sustainability.
Specifically, this includes the following activities as defined by
ECO Canada’s National Occupational Standards (NOS):
Environmental Protection
• AirQuality
• WaterQuality
• SiteAssessmentandReclamation
• WasteManagement
• HealthandSafety
Resource Management
• Energy
• FisheriesandWildlife
• NaturalResourceManagement
Environmental Sustainability
• EducationandTraining
• ResearchandDevelopment
• PolicyandLegislation
• CommunicationsandPublicAwareness
In addition to the above categories, we have added ‘alternative
/ renewable energy or eco-efficiency’ to the energy NOS, and
also a separate occupational area, ‘carbon and climate change
mitigation’, since these were identified as emerging areas in the
ECO Canada Environmental Trends Study.
Each occupation in the NOS is spread across various industry
groups. These industries are classified according to the North
American Industrial Classification System (NAICS). NAICS
categorizes establishments by the respective goods and services
that they produce. For the purpose of this report, ECO Canada has
used the top-level two digit, major industry groups (combining
some industries where a lower density of environmental
employment was predicted) to provide a complete picture of
where environmental employees are working.
6
KEY FINDINGS
1. PROFILE OF ENVIRONMENTAL EMPLOYMENT IN CANADA
Total Environmental Employment
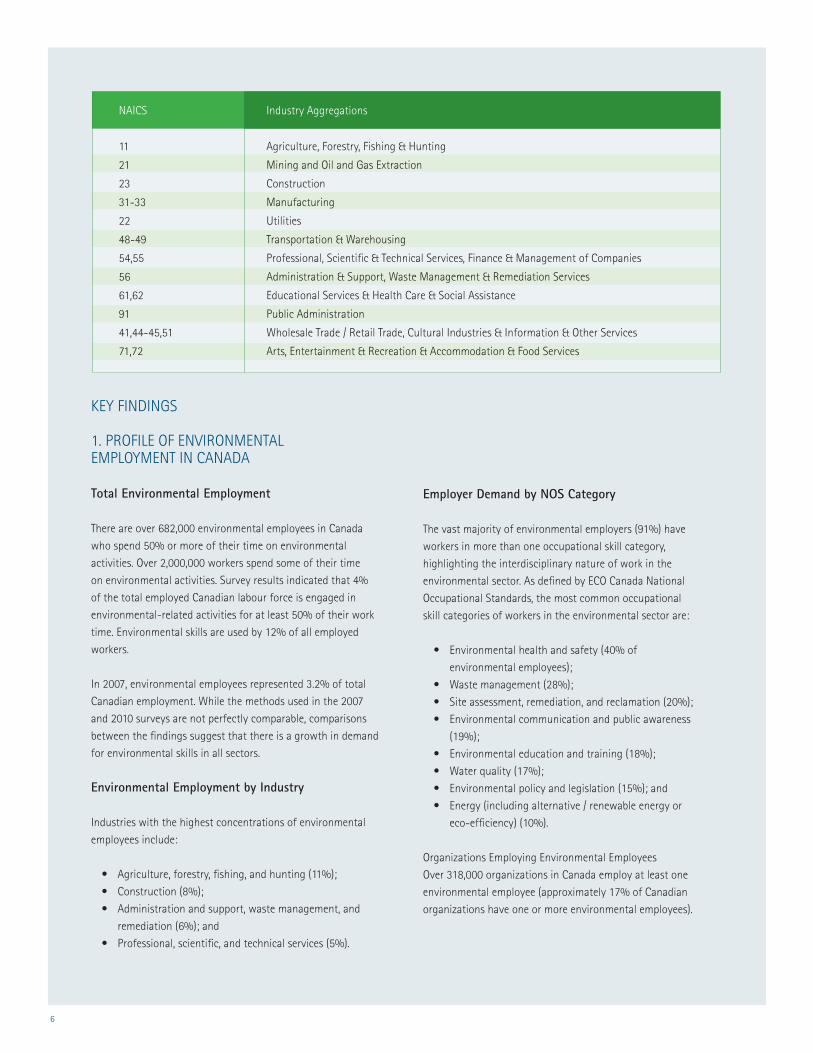
There are over 682,000 environmental employees in Canada
who spend 50% or more of their time on environmental
activities. Over 2,000,000 workers spend some of their time
on environmental activities. Survey results indicated that 4%
of the total employed Canadian labour force is engaged in
environmental-related activities for at least 50% of their work
time. Environmental skills are used by 12% of all employed
workers.
In 2007, environmental employees represented 3.2% of total
Canadian employment. While the methods used in the 2007
and 2010 surveys are not perfectly comparable, comparisons
between the findings suggest that there is a growth in demand
for environmental skills in all sectors.
Environmental Employment by Industry
Industries with the highest concentrations of environmental
employees include:
• Agriculture,forestry,fishing,andhunting(11%);
• Construction(8%);
• Administrationandsupport,wastemanagement,and
remediation(6%);and
• Professional,scientific,andtechnicalservices(5%).
Employer Demand by NOS Category
The vast majority of environmental employers (91%) have
workers in more than one occupational skill category,
highlighting the interdisciplinary nature of work in the
environmental sector. As defined by ECO Canada National
Occupational Standards, the most common occupational
skill categories of workers in the environmental sector are:
• Environmentalhealthandsafety(40%of
environmentalemployees);
• Wastemanagement(28%);
• Siteassessment,remediation,andreclamation(20%);
• Environmentalcommunicationandpublicawareness
(19%);
• Environmentaleducationandtraining(18%);
• Waterquality(17%);
• Environmentalpolicyandlegislation(15%);and
• Energy(includingalternative/renewableenergyor
eco-efficiency) (10%).
Organizations Employing Environmental Employees
Over 318,000 organizations in Canada employ at least one
environmental employee (approximately 17% of Canadian
organizations have one or more environmental employees).
NAICS Industry Aggregations
11 Agriculture, Forestry, Fishing & Hunting
21 Mining and Oil and Gas Extraction
23 Construction
31-33 Manufacturing
22 Utilities
48-49 Transportation & Warehousing
54,55 Professional, Scientific & Technical Services, Finance & Management of Companies
56 Administration & Support, Waste Management & Remediation Services
61,62 Educational Services & Health Care & Social Assistance
91 Public Administration
41,44-45,51 Wholesale Trade / Retail Trade, Cultural Industries & Information & Other Services
71,72 Arts, Entertainment & Recreation & Accommodation & Food Services

7
2. PROFILE OF ENVIRONMENTAL EMPLOYEES IN CANADA
Demographic groups within the environmental workforce
include:
• 40%ofallenvironmentalemployeesarewomen
(representing 45% of the total Canadian employed labour
force);
• 2.5%ofallenvironmentalemployeesareAboriginal
persons;
• 5.5%ofenvironmentalemployeesarerecentimmigrants
(withinthepast5years);and
• Aboutaquarter(24%)isbelow30yearsofage.Fourteen
percent of the environmental workforce is age 55 or older.
The survey confirmed that the levels of education, experience,
and skills for environmental workers are high. Thirty-six percent
of environmental workers have a bachelor’s degree or higher
(compared to 22% of the employed Canadian labour force).
The study established that the Canadian environmental
workforce is highly educated with a relatively high number
of senior level employees and managers. Forty percent of all
environmental employees are managers of people, budgets, or
projects, and 53% of all environmental workers are senior level
employees with at least 8 years of experience.
Ongoing training of these skilled workers is a priority for many
employers, with 36% of environmental employers budgeting
$2,000 or more annually to train each environmental employee.
3. RECRUTING ENVIRONMENTAL EMPLOYEES
Environmental employers reported that successful recruiting
in the sector depended on relational methods that make use
of social networks. The top-rated methods for recruiting
(internal recruitment, referrals, and co-op programs) all build
upon existing relationships with workers. The reputation of an
environmental employer as an ‘Employer of Choice’ was seen as
the most important factor affecting the ability to successfully
recruit highly qualified workers. Use of existing employee
networks were viewed by almost half of environmental
employers as critical to the success of their recruiting programs.
Other commonly used methods for recruiting included the
use of corporate websites and other job-post websites. These
methods were seen as relatively less effective when compared
with methods that depend on social networks.
4. HIRING DURING ECONOMIC DOWNTURN
Over the past year (March 2009-March 2010), 39% of
environmental employers hired or attempted to hire
environmental employees. Firms’ open positions were
roughly evenly split between positions left vacant by a
worker who left the firm and newly created positions. About
one third (31%) of employers who were hiring experienced
difficulties finding the workers they need. A lack of workers
with appropriate skills was the most commonly cited reason
for their difficulties. The most common reason for inability
to fill vacant positions was lack of qualified candidates—in
particular, a lack of candidates with the appropriate
education or experience, which was cited by about a quarter
of firms.
Higher number of employers were hiring in the following
industries:
• Administrationandsupport,wastemanagementand
remediation(56%);
• Arts,recreation,accommodationandfoodservices
(52%);
• Mining,quarrying,andoilandgasextraction(42%);
and
• Professional,scientific,andtechnicalservices(41%).
Employers in administration and support, waste
management and remediation and professional, scientific,
and technical services experienced the greatest hiring
difficulties, while those in mining, quarrying, and oil and
gas extraction and wholesale / retail trade were less likely to
experience hiring difficulties.
Employers in the following industries were most likely to
have had no open positions for environmental employees in
the past 12 months:
• Manufacturing(80%);
• Construction(76%);
• Agriculture,forestry,fishing,andhunting(71%);
• Education,health,andsocialassistance(68%);and
• Wholesaletrade/retailtrade(68%).

8
5. EMPLOYEE ENGAGEMENT AND TURNOVER
Forty two percent (42%) of employers lost workers because they
were offered better benefits, higher income, better work-life
balance, or better career opportunities at another organization.
Only 19% of environmental employers lost workers due to
reduction in workforce (layoffs) during the March 2009 - March
2010 period.
Environmental employers who placed a greater importance on the
professional development of workers, and those who challenged
workers with greater levels of responsibility and variety in their
tasks have higher levels of employee engagement and fewer
retention problems. Other effective strategies for employee
retention included better defined corporate goals, use of team-
building activities, and rewards for performance.
6. FUTURE DEMAND
Retirements of environmental workers will create vacancies over
the next decade as over 100,000 environmental employees (14%
of the environmental workforce) reach retirement age. Over the
next two years, 44% of environmental employers plan to hire
environmental workers, up from 39% in the March 2008-March
2009 (recessionary) period. A large number of hiring managers
were uncertain about their future growth prospects, but about
a fifth (20%) of environmental employers were optimistic that
they will increase the number of environmental workers on their
payrolls over the next two years. Smaller and mid-sized firms
were currently more optimistic than large employers, but this
could change over the next year if the economy continues to
improve.
Regardless of whether worker headcounts increase, trends since
the 2007 ECO Canada Survey of Environmental Employment demonstrate that environmental skills are quickly becoming
more important across the workforce and within every industry.
Particularly strong growth in demand for environmental skills was
apparent in the construction, manufacturing, and agricultural
sectors. All skilled environmental occupational categories were in
demand with some percentage of employers planning to hire in
each category. More employers have plans to hire workers in site
assessment and reclamation, waste management, environmental
safety and health, and water quality than in other categories.
Employers hope to hire within several environmental-related
subspecialties of engineering, including the top mentioned “hot
job” from the survey–environmental engineers—but short supply
of workers is a persistent problem.
RECOMMENDATIONS FOCUSING ON GROWTH AREAS IN THE ENVIRONMENTAL SECTOR
• Conduct additional research to define the skills required for new emerging sectors, such as green construction: Since the 2007 survey of environmental
employers, there has been strong growth in
environmental skills required in the construction sector.
Growth is most likely in occupations such as trades
workers and site managers/supervisors, and also involves
the emergence of a few specialist occupations (energy
auditors, blower door testers, etc.). The skill sets required
in the emerging green construction sector are not well
defined and a relatively high percentage (18%) of the
construction workforce uses at least some environmental
skills in their work.
• Prepare employers to transition to a highly skilled workforce to increase productivity in some industries, such as the agricultural/forestry/fishing/hunting sector, and the manufacturing industry: Strong growth
in demand for environmental skills was observed in
these two sectors. However, at the same time the total
number of workers employed in the manufacturing and
agricultural sectors have declined since 2007. These
opposing trends suggest that employers are transitioning
to a more highly skilled workforce that plays a value-
added role in increasing the productivity of these two
sectors.
• More can be done to understand the importance of certain occupations, such as environmental safety and health: In terms of environmental occupations, this
study found that environmental safety and health is the
largest occupational skill--four out of ten environmental
employees have this skill set. ECO Canada’s ‘Environmental Trends’ report also identified the occupation as one of the
fastest growing occupations. Given that these workers
are employed in all industries, more research is required
to understand the importance and specific need for this
occupation within the environmental sector.
9
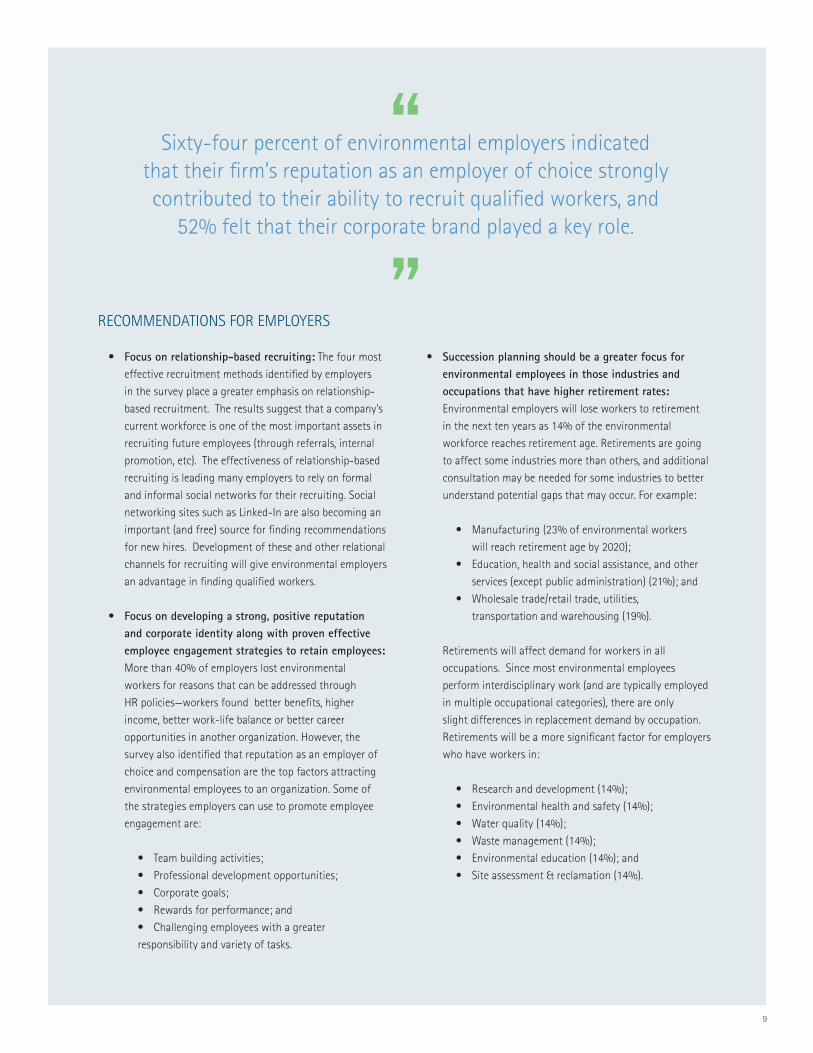
RECOMMENDATIONS FOR EMPLOYERS
• Focus on relationship-based recruiting: The four most
effective recruitment methods identified by employers
in the survey place a greater emphasis on relationship-
based recruitment. The results suggest that a company’s
current workforce is one of the most important assets in
recruiting future employees (through referrals, internal
promotion, etc). The effectiveness of relationship-based
recruiting is leading many employers to rely on formal
and informal social networks for their recruiting. Social
networking sites such as Linked-In are also becoming an
important (and free) source for finding recommendations
for new hires. Development of these and other relational
channels for recruiting will give environmental employers
an advantage in finding qualified workers.
• Focus on developing a strong, positive reputation and corporate identity along with proven effective employee engagement strategies to retain employees: More than 40% of employers lost environmental
workers for reasons that can be addressed through
HR policies—workers found better benefits, higher
income, better work-life balance or better career
opportunities in another organization. However, the
survey also identified that reputation as an employer of
choice and compensation are the top factors attracting
environmental employees to an organization. Some of
the strategies employers can use to promote employee
engagement are:
• Teambuildingactivities;
• Professionaldevelopmentopportunities;
• Corporategoals;
• Rewardsforperformance;and
• Challengingemployeeswithagreater
responsibility and variety of tasks.
• Succession planning should be a greater focus for environmental employees in those industries and occupations that have higher retirement rates: Environmental employers will lose workers to retirement
in the next ten years as 14% of the environmental
workforce reaches retirement age. Retirements are going
to affect some industries more than others, and additional
consultation may be needed for some industries to better
understand potential gaps that may occur. For example:
• Manufacturing(23%ofenvironmentalworkers
willreachretirementageby2020);
• Education,healthandsocialassistance,andother
services(exceptpublicadministration)(21%);and
• Wholesaletrade/retailtrade,utilities,
transportation and warehousing (19%).
Retirements will affect demand for workers in all
occupations. Since most environmental employees
perform interdisciplinary work (and are typically employed
in multiple occupational categories), there are only
slight differences in replacement demand by occupation.
Retirements will be a more significant factor for employers
who have workers in:
• Researchanddevelopment(14%);
• Environmentalhealthandsafety(14%);
• Waterquality(14%);
• Wastemanagement(14%);
• Environmentaleducation(14%);and
• Siteassessment&reclamation(14%).
Sixty-four percent of environmental employers indicated that their firm’s reputation as an employer of choice strongly contributed to their ability to recruit qualified workers, and
52% felt that their corporate brand played a key role.
10

11
3. INTRODUCTION
3.1 ABOUT ECO CANADA
ECO Canada (Environmental Careers Organization) is a not-for-
profit corporation that assists the Canadian environmental sector
in implementing sound human resource development policies.
Since its founding in 1992, ECO Canada has taken great strides
towards developing a national human resource strategy that
is focused towards the needs of environmental practitioners,
employers and educators.
3.2 RESEARCH OBJECTIVES
The primary objective of the Profile of Canadian Environmental
Employment 2010 was to estimate the number of environmental
employees across all major industries in Canada. The study was
also ECO Canada’s first study that seeks to estimate the number
of environmental employees within environmental occupations,
as defined by the ECO Canada National Occupational Standards
(NOS). The study measures recent hiring activity, retention rates,
recruiting practices, and expectations on future worker demand
among environmental employers.
3.3 SUMMARY OF METHODOLOGY
Out of the valid sample of 23,127 employers, 2,204 employers
completed the survey, representing a response rate of 10 percent.
Of these completions 2,132 were completed by the telephone
survey and 72 were completed via an online questionnaire.
The survey included a short questionnaire for all organizations
and a long questionnaire for organizations that identified
themselves as having environmental employees. While 1,697
organizations responded to the short questionnaire only (they
did not have environmental employees), 507 organizations
responded to both the short and long questionnaires. On
the basis of the definition above, organizations were asked to
complete the long questionnaire if they employed one or more
full-time or part-time employees whose work is related to the
environment. Organizations not employing environmental
employees were asked to answer a few questions about the
organization’s workforce, which was used to estimate the total
environmental workforce.
The data from the survey was used to estimate the number
of environmental employees in Canada. The responses
have been weighted by the total number of employees and
establishments in each industry, as reported by the Labour
Force Survey (LFS), the Census and the Canadian Business
Patterns Database.
3.4 COMPARABILITY WITH THE 2007 EMPLOYER DEMAND SURVEY
The results of this survey are not perfectly comparable with
the ECO Canada 2007 Profile of Canadian Environmental Employment. The 2007 survey asked employers to estimate
the number of environmental workers employed at their
organization. In the 2010 survey, we asked employers to
consider their workforce and determine the percentage of
workers who spend any time performing environmental
activities related to their work tasks and then estimate what
percentage of those workers spend more than 50% of their
time on environmental activities. The second measure is
the figure that is most closely aligned with figures from the
2007 survey and is used throughout this report to represent
environmental employment.
26,039 2,912 23,127 2,204 10%
Number of Surveys
Distributed
Number identified
as not in service
Valid
Sample
Number of Valid Surveys
Completed
Valid
Response Rate

12
4. PROFILE OF ENVIRONMENTAL EMPLOYMENT IN CANADA
4.1 SUMMARY
There are over 682,000 environmental employees in Canada who
spend more than 50% of their time on environmental work activities.
These workers were most concentrated in the following industries:
• Agriculture,forestry,fishingandhunting;
• Construction;
• Administrationandsupport,wastemanagementand
remediation;and
• Professional,scientificandtechnicalservices.
The majority of environmental employers (91%) have workers in more
than one occupational skill category, highlighting the interdisciplinary
nature of work in the environmental sector. The most common
occupational areas in the sector included:
• Environmentalsafetyandhealth;
• Wastemanagement;
• Siteassessmentandreclamation;and
• Environmentalcommunicationandpublicawareness.
Levels of environmental employment were similar among
provinces, with slightly higher concentrations of environmental
workers in the Atlantic Provinces and in the Prairies (Manitoba and
Saskatchewan). Three quarters of environmental workers (75%)
work in the private sector, 20% work in the public sector and 5%
are employed in the non-profit sector. Environmental employees
are about equally represented in the public and private sectors.
Nearly half of environmental employees are employed at small
establishments with 20 employees or less, or are self-employed.
Over 318,000 organizations in Canada employ at least one
environmental employee (approximately 17% of organizations
from across Canada have one or more environmental employees).
According to the findings of the survey, the top industries
employing environmental employees are:
• Publicadministration(38%);
• Administration&support,wastemanagementand
remediation(35%);
• Mining&oilandgasextraction(26%);and
• Agriculture,forestry,fishingandhunting(25%).
13
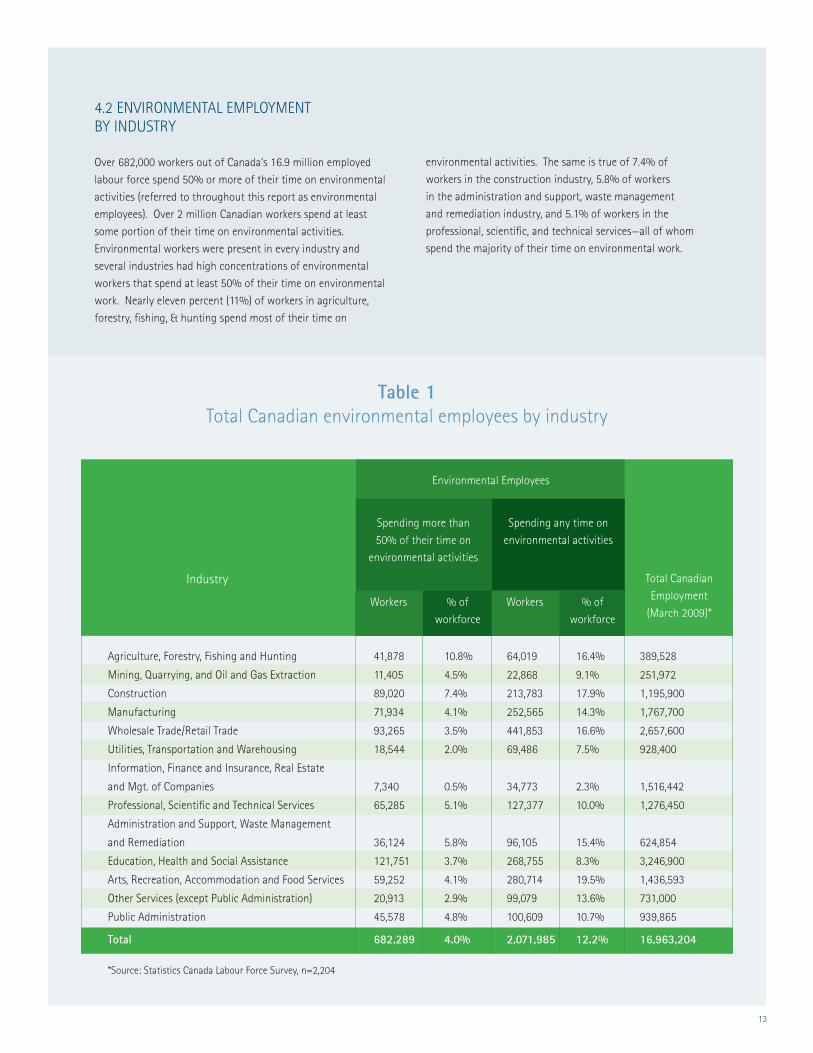
4.2 ENVIRONMENTAL EMPLOYMENT BY INDUSTRY
Over 682,000 workers out of Canada’s 16.9 million employed
labour force spend 50% or more of their time on environmental
activities (referred to throughout this report as environmental
employees). Over 2 million Canadian workers spend at least
some portion of their time on environmental activities.
Environmental workers were present in every industry and
several industries had high concentrations of environmental
workers that spend at least 50% of their time on environmental
work. Nearly eleven percent (11%) of workers in agriculture,
forestry, fishing, & hunting spend most of their time on
Table 1 Total Canadian environmental employees by industry
Industry Total Canadian
Employment
(March 2009)*
Environmental Employees
Spending more than
50% of their time on
environmental activities
Spending any time on
environmental activities
Workers % of
workforce
Workers % of
workforce
*Source: Statistics Canada Labour Force Survey, n=2,204
environmental activities. The same is true of 7.4% of
workers in the construction industry, 5.8% of workers
in the administration and support, waste management
and remediation industry, and 5.1% of workers in the
professional, scientific, and technical services—all of whom
spend the majority of their time on environmental work.
Agriculture, Forestry, Fishing and Hunting 41,878 10.8% 64,019 16.4% 389,528
Mining,Quarrying,andOilandGasExtraction 11,405 4.5% 22,868 9.1% 251,972
Construction 89,020 7.4% 213,783 17.9% 1,195,900
Manufacturing 71,934 4.1% 252,565 14.3% 1,767,700
Wholesale Trade/Retail Trade 93,265 3.5% 441,853 16.6% 2,657,600
Utilities, Transportation and Warehousing 18,544 2.0% 69,486 7.5% 928,400
Information, Finance and Insurance, Real Estate
and Mgt. of Companies 7,340 0.5% 34,773 2.3% 1,516,442
Professional, Scientific and Technical Services 65,285 5.1% 127,377 10.0% 1,276,450
Administration and Support, Waste Management
and Remediation 36,124 5.8% 96,105 15.4% 624,854
Education, Health and Social Assistance 121,751 3.7% 268,755 8.3% 3,246,900
Arts, Recreation, Accommodation and Food Services 59,252 4.1% 280,714 19.5% 1,436,593
Other Services (except Public Administration) 20,913 2.9% 99,079 13.6% 731,000
Public Administration 45,578 4.8% 100,609 10.7% 939,865
Total 682,289 4.0% 2,071,985 12.2% 16,963,204

14
4.3 EMPLOYMENT BY NATIONAL OCCUPATIONAL STANDARD (NOS) CATEGORY
As identified in the ECO Canada Environmental Trends Report, a characteristic that sets apart the environmental sector is
the diversity of activities that range from traditional waste
management activities, to emerging new sectors such as carbon
and climate change mitigation. Skills of workers in the sector
are also diverse and a variety of environmental occupations exist
but they are not well captured by Statistics Canada’s surveys or
the Census. In this survey, employers were asked to identify the
number of environmental workers employed at their establishment
who performed work activities in each of thirteen categories of
environmental activities. These activities correspond to twelve
categories defined by ECO Canada as National Occupational
Standards (NOS) and also additional categories such as ‘alternative
/ renewable energy or eco-efficiency’ and ‘carbon and climate
change mitigation’ since these were identified as emerging areas
in the ECO Canada Environmental Trends Study.
Environmental work is highly interdisciplinary in nature as
most environmental employers (91%) indicated that their
employees were involved in activities in more than one NOS
category. Half of employers (51%) had workers who performed
activities in more than 5 NOS categories and 11% had workers
performing activities in more than 10 NOS categories. Only
9% of the environmental employers had employees that were
limited to working in just one NOS category. The high degree
of overlap in environmental activities was evident in practically
all industries.
Based on weighted results of the survey, we estimate that 40%
of all environmental employees perform activities related to
environmental safety and health, which is the most common
environmental activity. About a third (28%) of environmental
employees carry out activities in waste management. One in
five environmental workers (20%) perform site assessment
and reclamation activities. Nineteen percent complete work
activities that require environmental communication and public
awareness, and 18% perform work activities in environmental
education and training. Fifteen percent of environmental
employees carry out activities related to environmental policy
and legislation. Figure 1 contains a ranking of the number of
environmental workers engaged in each of ECO Canada’s NOS
occupational categories.
Table 2 Occupational areas in the
environmental sector
National Occupational Standard (NOS) Category
Sector A: Environmental Protection
Air quality
Water quality
Site assessment and reclamation
Waste management
Environmental safety and health
Sector B: Resource Management
Energy
Eco-preservation / wildlife and fisheries management
Natural resource management
Sector C: Environmental Sustainability
Environmental education & training
Research & development
Policy and legislation
Environmental communication and public awareness
Environmental work is highly interdisciplinary
in nature as most environmental employers (91%) indicated that their employees were involved in activities in more than
one NOS category.

15
Figure 1Environmental employees by occupational areas
Total Environmental Employees
Environmental safety and health
Waste management
Site assessment and reclamation
Environmental communication and public awareness
Environmental education and training
Water quality
Policy and legislation
Alternative/renewable energy, eco-efficiency
Air quality
Natural resource management
Research and development
Eco-preservation/wildlife and fisheries management
Carbon and climate change mitigation
200,000 400,000 600,000 800,000
36,676 (5%)
41,831 (6%)
48,684 (7%)
49,582 (7%)
66,628 (10%)
71,287 (10%)
103,249 (15%)
114,333 (17%)
120,623 (18%)
131,085 (19%)
137,940 (20%)
188,377 (28%)
271,671 (40%)
682,289 (100%)
Number of Environmental Employees Engagedin Each Type of Activity, n=507
Work Activities of Environmental Employees * ^^(Number of Environmental Employees Performing Each Type of Activity)
* In addition to the ECO Canada NOS categories, the other categories included are ‘carbon and climate change mitigation’ and ’alternative / renewable energy and eco-efficiency’.
^^ Since most environmental employers indicated that their employees performed activities in more than one NOS category, the total >100%.
16
Table 3 Establishments with environmental employees by major industry group
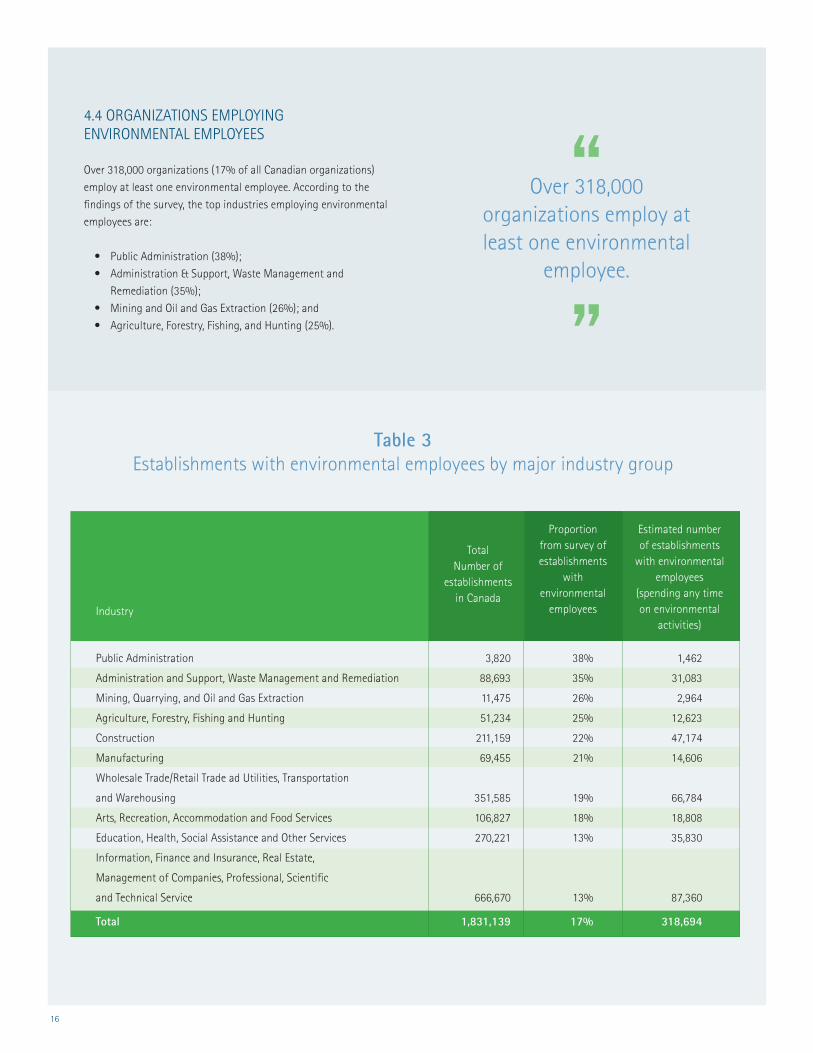
4.4 ORGANIZATIONS EMPLOYING ENVIRONMENTAL EMPLOYEES
Over 318,000 organizations (17% of all Canadian organizations)
employ at least one environmental employee. According to the
findings of the survey, the top industries employing environmental
employees are:
• PublicAdministration(38%);
• Administration&Support,WasteManagementand
Remediation(35%);
• MiningandOilandGasExtraction(26%);and
• Agriculture,Forestry,Fishing,andHunting(25%).
Estimated number of establishments
with environmental employees
(spending any time on environmental
activities)
Proportion from survey of establishments
with environmental
employees
Total Number of
establishments in Canada
Industry
Public Administration 3,820 38% 1,462
Administration and Support, Waste Management and Remediation 88,693 35% 31,083
Mining,Quarrying,andOilandGasExtraction 11,475 26% 2,964
Agriculture, Forestry, Fishing and Hunting 51,234 25% 12,623
Construction 211,159 22% 47,174
Manufacturing 69,455 21% 14,606
Wholesale Trade/Retail Trade ad Utilities, Transportation
and Warehousing 351,585 19% 66,784
Arts, Recreation, Accommodation and Food Services 106,827 18% 18,808
Education, Health, Social Assistance and Other Services 270,221 13% 35,830
Information, Finance and Insurance, Real Estate,
Management of Companies, Professional, Scientific
and Technical Service 666,670 13% 87,360
Total 1,831,139 17% 318,694
Over 318,000 organizations employ at least one environmental
employee.

17
4.5 ENVIRONMENTAL EMPLOYMENT BY PROVINCE
The concentration of environmental workers as a
percentage of the workforce is similar across provinces,
with slightly higher concentrations of workers in the
Atlantic Provinces and Manitoba, and lower concentrations
in Ontario. Ontario (37%) has the highest share of
environmentalemployees,followedbyQuebec(23%).
Alberta and British Columbia have similar numbers of
environmental employees, representing 12% and 14% of
environmental employment respectively.
Table 4 Environmental employees by province
Province Environmental Employees
Total Employment March 2010
Share of Environmental Employment
Environmental Employees as a Percentage of Workers in the
Province
Atlantic Provinces 46,847 1,099,199 6.9% 4.3%
Quebec 155,504 3,877,644 22.8% 4.0%
Ontario 253,552 6,595.121 37.2% 3.8%
Manitoba/ Saskatchewan 48,771 1,140,680 7.1% 4.3%
Alberta 83,956 1,982,121 12.3% 4.2%
British Columbia 92,739 2,268,499 13.6% 4.1%
Canada Total 682,289 16,963,204 100% 4.0%
* Source: Statistics Canada and Labour Force Survey, n=2,204

18
4.6 ENVIRONMENTAL EMPLOYMENT BY SECTOR AND BY ESTABLISHMENT SIZE
The majority (74%) of environmental employees are
employed in the private sector, and 20% of environmental
employees are employed in the public sector. The non-profit
sector represents about 5% of environmental employment.
The concentration of environmental employees is essentially
the same in the public and private sectors, with slightly
higher concentrations of environmental employees in the
private sector.
Table 5 Environmental employees by public, private and non-profit sectorSector
Environmental Employees
Percentage of Environmental
Employees
Total Employees
Percentage of Workers Who Are
Environmental Employees
* Non-Profit environmental employers and employees who are uncertain of their sector are included in figures for private sector environmental employment.
Private sector* 545,985 80.0% 13,487,700 4 %
Private sector 504,578 74% N/A N/A
Not-for-profit / charitable organization 36,951 5% N/A N/A
Don’t know 4,456 1% N/A N/A
Public sector 136,304 20.0% 3,475,500 4%
Public sector –municipal 51,715 8% N/A N/A
Public sector – provincial 68,231 10% N/A N/A
Public sector – federal 16,358 2% N/A N/A
Total 682,289 100.0% 16,963,200 4.0%

19
Nearly half of all environmental employees work at establishment
with less than 20 employees or are self-employed. Employers
at larger establishments have a smaller concentration of
environmental employees (2.5% of all workers at these firms
are environmental workers versus 4.0% of employees overall).
Only 10% of environmental employees are employed at larger
establishments with over 500 workers.
Table 6Environmental employees by establishment size
Establishment Size Number of Environmental
Employees
Total Canadian
Employment (March 2010)
Distribution of Environmental Employees by
Establishment Size
Environmental Employees as a Percentage of Total CanadianEmployment
* Source: Statistics Canada and Labour Force Survey, n=2,204
Less than 20 employees or self-employed 337,823 7,419,500 47% 4.6%
20 to 99 employees 176,498 4,731,800 21% 3.7%
100 to 500 employees 123,877 2,898,700 21% 4.3%
More than 500 employees 44,092 1,792,300 10% 2.5%
Total employees 682,289 16,963,200 100% 4.0%
Nearly half of all environmental employees
work at establishment with less than 20 employees or
are self-employed.

20
21
5. PROFILE OF ENVIRONMENTAL EMPLOYEES IN CANADA
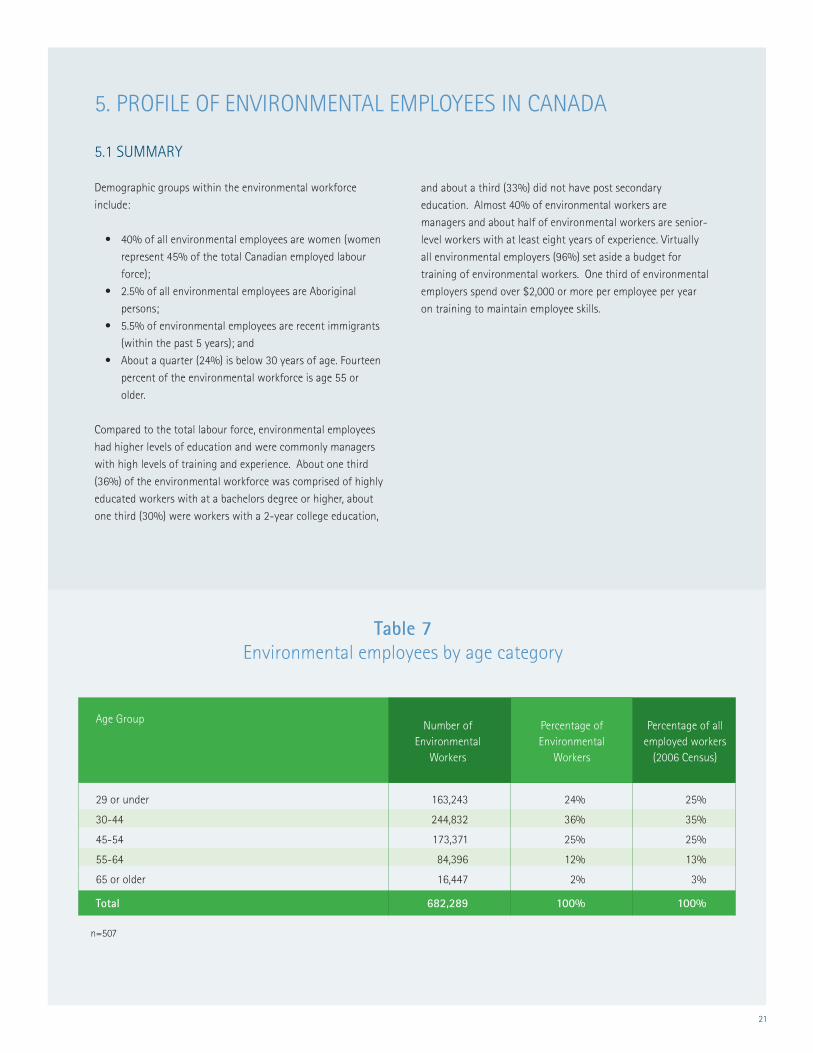
5.1 SUMMARY
Demographic groups within the environmental workforce
include:
• 40%ofallenvironmentalemployeesarewomen(women
represent 45% of the total Canadian employed labour
force);
• 2.5%ofallenvironmentalemployeesareAboriginal
persons;
• 5.5%ofenvironmentalemployeesarerecentimmigrants
(withinthepast5years);and
• Aboutaquarter(24%)isbelow30yearsofage.Fourteen
percent of the environmental workforce is age 55 or
older.
Compared to the total labour force, environmental employees
had higher levels of education and were commonly managers
with high levels of training and experience. About one third
(36%) of the environmental workforce was comprised of highly
educated workers with at a bachelors degree or higher, about
one third (30%) were workers with a 2-year college education,
and about a third (33%) did not have post secondary
education. Almost 40% of environmental workers are
managers and about half of environmental workers are senior-
level workers with at least eight years of experience. Virtually
all environmental employers (96%) set aside a budget for
training of environmental workers. One third of environmental
employers spend over $2,000 or more per employee per year
on training to maintain employee skills.
Table 7 Environmental employees by age category
Age Group Number of Environmental
Workers
Percentage of Environmental
Workers
Percentage of all employed workers
(2006 Census)
29 or under 163,243 24% 25%
30-44 244,832 36% 35%
45-54 173,371 25% 25%
55-64 84,396 12% 13%
65 or older 16,447 2% 3%
Total 682,289 100% 100%
n=507

22
5.2 DEMOGRAPHIC PROFILE
The age distribution of environmental employment was very
similar to the age distribution of employed workers in the 2006
Census of Canada. While the two measures are not perfectly
comparable because four years have elapsed between the 2006
Census and the 2010 Survey of Environmental Employers, the
comparison suggests that the environmental workforce will face
similar pressures as the general labour force due to retirements.
The environmental workforce was comprised of a larger
percentage of men than the total Canadian labour force. Forty-
five percent of workers in the employed Canadian labour force
were women, while only 39.8% of environmental employees were
women. Aboriginal persons represent 2.5% of all environmental
employees, which is slightly lower than the percentage of
Aboriginal persons in the total employed workforce (Aboriginal
workers represented 2.75% of the employed workforce in 20061).
Recent immigrants (arriving in the last 5 years) represented 5.5%
of environmental employees. Statistics from the 2006 Census
Survey are the most recent data available, but are not comparable
with the findings of this survey because they do not represent
recent immigrants from the past five years (2005-2010).
Table 8 Environmental employees for selected demographic groups
Demographic Group
Number of Environmental
Employees
Percentage of Environmental
Employees
Percentage ofTotal Workforce
Female 271,603 39.8% 45.1%
Aboriginal 16,925 2.5% 2.75%
Recent immigrant (in the past 5 years) 37,867 5.5% N/A*
All Environmental Employees 682,289 100% 100%
* Statistics from the 2006 Survey are the most recent data available, but are not comparable with the findings of this survey because they do not represent recent immigrants from the past five years (2005-2010).
Table 9 Environmental employment by level of educational attainment
Education Attainment
Number of environmental
workers
Percentage of environmental
workforce
Percentage in the total Canadian labour force
Masters, doctorate, or higher 77,908 11% 8%
Bachelor degree or equivalent 171,184 25% 14%
College or equivalent 207,865 30% 20%
Less than post-secondary 225,332 33% 58%
Total 682,289 100% 100%
n=507
1 2006 Census of Canada

23
Figure 2Environmental employees with a bachelor degree or higher
37%
53%
46%
44%
44%
40%
39%
37%
36%
35%
35%
34%
33%
33%
0.0% 20.0% 40.0% 60.0%
Percentage of Environmental Employers' Workforcewith a Bachelor Degree or Higher, n=507
Total Environmental Employees
Carbon and climate change mitigation
Research and development
Natural resource management
Eco-preservation/wildlife and fisheries management
Environmental communication and public awareness
Alternative/renewable energy, eco-efficiency
Policy and legislation
Environmental education and training
Air quality
Site assessment and reclamation
Waste management
Environmental safety and health
Monitoring, resource management
* In addition to the ECO Canada NOS categories, the other categories included are ‘carbon and climate change mitigation’ and ‘alternative / renewable energy andeEco-efficiency’.
5.3 TRAINING, EDUCATION & EXPERIENCE
Environmental employees, on average, had a higher level of
educational attainment than workers in the total Canadian labour
force – 66% of environmental employees have post-secondary
education compared to 42% of the Canadian workforce.
About one third (36%) of environmental employees had a
bachelor’s degree or higher and 11% of workers have a masters
degree or higher. Thirty percent (30%) of environmental
employees had a 2-year college level of education. The remaining
third (33%) of workers did not have post-secondary education.
The level of educational attainment of environmental workers
differed by industry and by national occupational standard (NOS)
category. A majority (52%) of environmental workers at firms
engaged in carbon and climate change mitigation activities had at
least a bachelor degree and (19%) had a masters degree or higher.
Employers who have workers in research and development,
natural resource management, eco-preservation, environmental
communication, alternative/renewable energy and eco-efficiency,
and environmental policy and legislation all had a higher-than-
average percentage of workers with at least a bachelor degree.

24
Air quality 9% 26% 25% 40% 100%
Water quality 8% 25% 29% 37% 100%
Site assessment and reclamation 10% 25% 26% 39% 100%
Waste management 11% 23% 31% 36% 100%
Environmental safety and health 8% 26% 31% 36% 100%
Alternative/renewable energy, eco-efficiency 10% 29% 33% 29% 100%
Eco-preservation/wildlife and fisheries management 14% 30% 37% 19% 100%
Natural resource management 14% 30% 30% 26% 100%
Environmental education & training 8% 28% 32% 32% 100%
Research & development 15% 31% 21% 33% 100%
Policy and legislation 11% 26% 30% 32% 100%
Environmental communication and public awareness 11% 29% 31% 29% 100%
Carbon and climate change mitigation 19% 33% 15% 33% 100%
All Environmental Employment 11% 25% 30% 33% 100%
National Occupational Standard (NOS) Category
Masters, doctorate or higher
Bachelor degree or equivalent
College or equivalent
Less than post-
secondary
Total
Table 10 Educational Attainment for the Environmental Workforce
by Occupational Area*2
* In addition to the ECO Canada NOS categories, the other categories included are ‘carbon and climate change mitigation’ and ‘alternative / renewable energy and eco-efficiency’.
Forty percent of environmental workers are managers of
people, budgets, or projects. In the survey, managers were
defined as workers who provide leadership and accountability
and played a role in the hierarchy of the organization, in
addition to possessing baseline technical expertise.
Forty percent of environmental workers are managers of people,
budgets, or projects.
2 Responses represent the weighted distribution of environmental workers by education level. The summary for each NOS category represents all employers who have at least one employee in the specified NOS category.

25
Figure 3Environmental workers who are managers
70%
60%
50%
40%
30%
20%
10%
0%
Percentage of workers who mainly domanagerial work
Percentage of workers who mainly donon-managerial work
40% 60%
Source: Survey of Environmental Employment 2010, n=507
Among the occupational areas, employers in carbon and climate
change mitigation have a larger percentage of environmental
workers who are entry-level workers (22% of their environmental
employees). ECO Canada’s Environmental Trends Report identified carbon and climate change mitigation as an emerging
environmental field, which may explain why there is a higher
percentage of workers in the field that are considered entry-
level. The employers who have workers in the category of eco-
preservation/wildlife and fisheries management have the largest
proportion of their workers who are senior level (63% of workers
employed have eight years of experience or more). Table 11
contains a segmentation of experience level for employers who
have workers in each of the occupational areas. 3
3 Responses represent the weighted distribution of environmental workers by experience level. The summary for each NOS category represents all employers who have at least one employee in the specified NOS category.

26
Occupational Areas* Entry Level-Usually a recent
graduate with no work experience
Junior Level-Usually from
1 to 3 years of experience
Intermediate Level-Usually
from 4 to 7 years of experience
Senior Level-Usually 8 years and
more
Air quality 9% 14% 21% 56%
Water quality 8% 16% 23% 52%
Site assessment and reclamation 8% 16% 22% 55%
Waste management 6% 17% 22% 55%
Environmental safety and health 6% 16% 24% 54%
Alternative/renewable energy, eco-efficiency 8% 20% 24% 48%
Eco-preservation/wildlife and fisheries management 6% 13% 19% 63%
Natural resource management 6% 21% 23% 50%
Environmental education & training 9% 19% 24% 47%
Research & development 9% 20% 23% 48%
Policy and legislation 7% 18% 24% 50%
Environmental communication and public awareness 8% 16% 25% 51%
Carbon and climate change mitigation 22% 15% 16% 47%
All Environmental Employment 7% 17% 23% 53%
Table 11 Environmental employees by level of experience
* In addition to the ECO Canada NOS categories, the other categories included are ‘carbon and climate change mitigation’ and ‘alternative / renewable energyandeco-efficiency;.
n=507
The majority (54%) of environmental employers budget over
$1,000 per employee per year for training of environmental
employees. Just over one-third (36%) of employers
spent a budget $2,000 or more per employee for training.
Environmental employers in mining (including oil and gas)
and government are most likely to have larger budgets for
training while those in agriculture, manufacturing, arts and
recreation, and accommodation and food services have the
smallest per-employee budgets for training.
The majority (54%) of environmental employers budget over $1,000 per employee per year for
training of environmental employees.

27
Table 12 Average annual spending per employee for training
IndustryAverage Per-Employee Expenditure for Training
(Percent of Respondents in Each Category)
$0 $0 to
$100
$100 to
$499
$500 to
$999
$1000 to
$1999
$2000 or
more
Total
Agriculture, Forestry, Fishing and Hunting 24% 7% 17% 17% 12% 24% 100%
Mining,Quarrying,andOilandGasExtraction 6% 6% 6% 16% 19% 45% 100%
Construction 16% 3% 18% 32% 16% 16% 100%
Manufacturing 22% 5% 17% 17% 22% 17% 100%
Wholesale Trade/Retail Trade, Utilities,
Transportation and Warehousing 10% 2% 29% 18% 12% 29% 100%
Professional, Scientific and Technical Services,
Information, Finance and Insurance, Real Estate
and Management of Companies 8% 10% 11% 26% 26% 19% 100%
Administration and Support, Waste Management
and Remediation 11% 4% 16% 27% 21% 20% 100%
Education, Health and Social Assistance, and
Other Services (except Public Administration) 4% 14% 29% 18% 14% 21% 100%
Arts, Recreation, Accommodation and
Food Services 21% 8% 42% 17% 4% 8% 100%
Public Administration 0% 0% 0% 20% 40% 40% 100%
Total 4% 7% 11% 25% 18% 36% 100%
n=507

28
29
6. RECRUITING ENVIRONMENTAL EMPLOYEES
6.1 SUMMARY
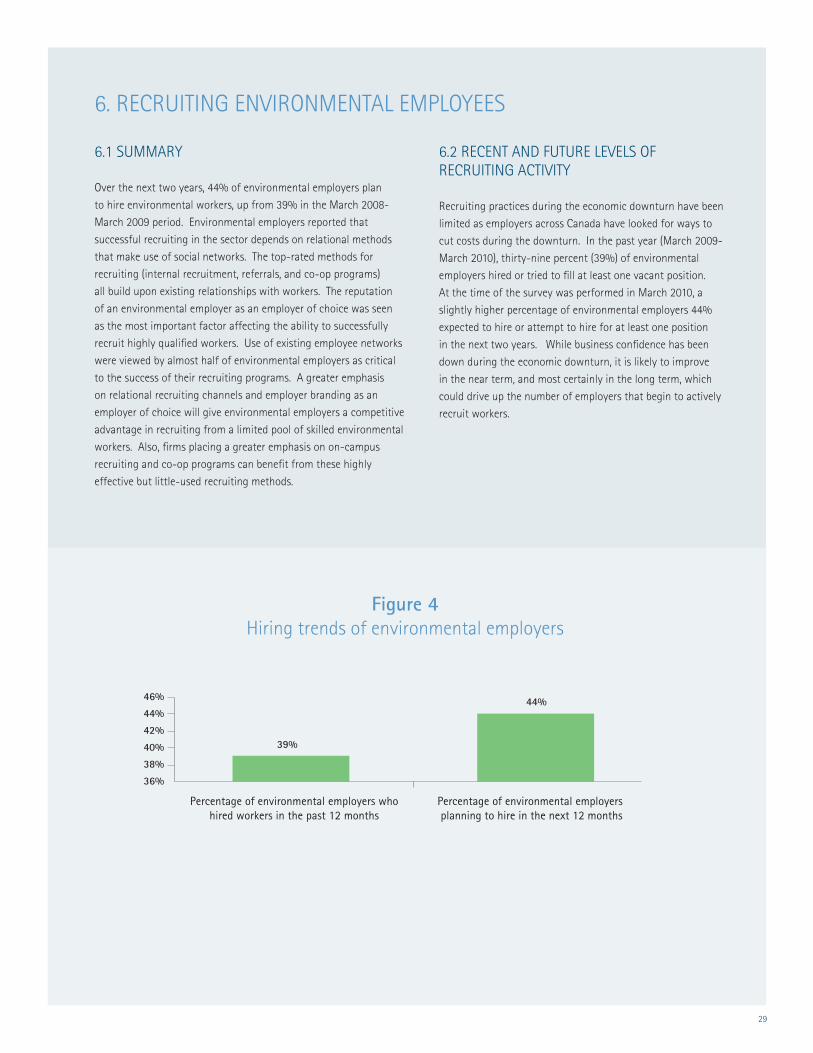
Over the next two years, 44% of environmental employers plan
to hire environmental workers, up from 39% in the March 2008-
March 2009 period. Environmental employers reported that
successful recruiting in the sector depends on relational methods
that make use of social networks. The top-rated methods for
recruiting (internal recruitment, referrals, and co-op programs)
all build upon existing relationships with workers. The reputation
of an environmental employer as an employer of choice was seen
as the most important factor affecting the ability to successfully
recruit highly qualified workers. Use of existing employee networks
were viewed by almost half of environmental employers as critical
to the success of their recruiting programs. A greater emphasis
on relational recruiting channels and employer branding as an
employer of choice will give environmental employers a competitive
advantage in recruiting from a limited pool of skilled environmental
workers. Also, firms placing a greater emphasis on on-campus
recruiting and co-op programs can benefit from these highly
effective but little-used recruiting methods.
6.2 RECENT AND FUTURE LEVELS OF RECRUITING ACTIVITY
Recruiting practices during the economic downturn have been
limited as employers across Canada have looked for ways to
cut costs during the downturn. In the past year (March 2009-
March 2010), thirty-nine percent (39%) of environmental
employers hired or tried to fill at least one vacant position.
At the time of the survey was performed in March 2010, a
slightly higher percentage of environmental employers 44%
expected to hire or attempt to hire for at least one position
in the next two years. While business confidence has been
down during the economic downturn, it is likely to improve
in the near term, and most certainly in the long term, which
could drive up the number of employers that begin to actively
recruit workers.
Figure 4Hiring trends of environmental employers
46%
44%
42%
40%
38%
36%
39%
44%
Percentage of environmental employers whohired workers in the past 12 months
Percentage of environmental employers planning to hire in the next 12 months

30
6.3 EFFECTIVE RECRUITMENT METHODS
Recruitment of qualified workers is a critical task for any
environmental employer. Use of effective methods for recruiting
can greatly cut costs and time spent by environmental employers
to recruit qualified workers. In the survey, we presented
respondents with a set of recruitment methods and asked whether
they have used the method and how effective the method was for
recruiting the right person for the job. Environmental employers
identified referrals and internal recruitment (promotion from
within) as the most effective methods of recruiting. Online job
banks (such as monster.com), on-campus recruiting, and co-op
programs were also ranked as effective methods for finding
qualified candidates.
Interestingly, the most effective methods place a greater
emphasis on relationship-based recruitment. The results
suggest that a company’s current workforce is one of the
most important assets in recruiting future employees (through
referrals, internal promotion, co-op programs and on-campus
recruitment). Only 25% of employers use on-campus
recruitment and only 23% have a co-op program for students
or recent graduates. A greater emphasis on these recruiting
methods may be a solution for environmental employers who
face difficulties attracting the skilled workers they need. Table
13 below outlines the frequency of use and effectiveness of
the main recruiting method used by environmental employers.
Table 13 Use and effectiveness of recruiting methods
Recruiting Methods
Percent of Employers Using the Recruitment Method
Percentage of Employers Who
Find the Method to be Effective*
* Reflects the percentage of employers who used the method and rated it a 4 or 5 on a 5-point scale of effectiveness. n=507
Internal Recruitment 44% 66%
Personal contacts (referrals) 65% 64%
Co-op programs 23% 57%
On-campus recruitment 25% 54%
Online job banks / Job search Websites 51% 50%
Corporate website 48% 45%
Recruitment agency 17% 42%
Acquire another company 15% 42%
Newspapers 35% 33%
31
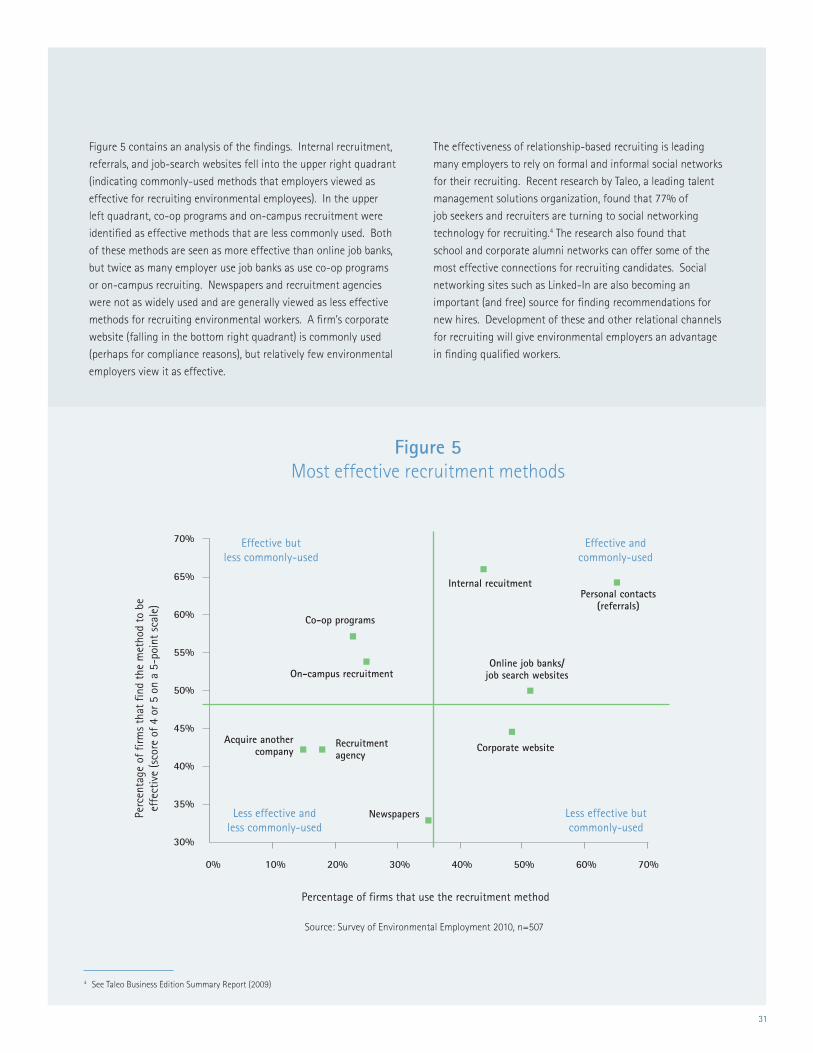
Figure 5 contains an analysis of the findings. Internal recruitment,
referrals, and job-search websites fell into the upper right quadrant
(indicating commonly-used methods that employers viewed as
effective for recruiting environmental employees). In the upper
left quadrant, co-op programs and on-campus recruitment were
identified as effective methods that are less commonly used. Both
of these methods are seen as more effective than online job banks,
but twice as many employer use job banks as use co-op programs
or on-campus recruiting. Newspapers and recruitment agencies
were not as widely used and are generally viewed as less effective
methods for recruiting environmental workers. A firm’s corporate
website (falling in the bottom right quadrant) is commonly used
(perhaps for compliance reasons), but relatively few environmental
employers view it as effective.
The effectiveness of relationship-based recruiting is leading
many employers to rely on formal and informal social networks
for their recruiting. Recent research by Taleo, a leading talent
management solutions organization, found that 77% of
job seekers and recruiters are turning to social networking
technology for recruiting.4 The research also found that
school and corporate alumni networks can offer some of the
most effective connections for recruiting candidates. Social
networking sites such as Linked-In are also becoming an
important (and free) source for finding recommendations for
new hires. Development of these and other relational channels
for recruiting will give environmental employers an advantage
in finding qualified workers.
Figure 5Most effective recruitment methods
Effective butless commonly-used
Effective andcommonly-used
Less effective butcommonly-used
Less effective andless commonly-used
Co-op programs
On-campus recruitment
Internal recuitmentPersonal contacts
(referrals)
Online job banks/job search websites
Corporate websiteAcquire another
companyRecruitment agency
Newspapers
Percentage of firms that use the recruitment method
Perc
enta
ge o
f firm
s th
at fi
nd t
he m
etho
d to
be
effe
ctiv
e (s
core
of 4
or 5
on
a 5-
poin
t sc
ale)
70%
65%
60%
55%
50%
45%
40%
35%
30%
70%60%40% 50%30%20%10%0%
4 See Taleo Business Edition Summary Report (2009)
Source: Survey of Environmental Employment 2010, n=507

32
6.4 REASONS FOR EFFECTIVE RECRUITING
While competitive wages and benefits are a necessary
prerequisite to effective recruiting, employer branding that
establishes a firm’s reputation as an employer of choice may
be a critical strategy for employers competing for talented
environmental workers. Survey results indicated that reputation
and compensation are the top factors influencing recruiting
success. Sixty-four percent of environmental employers
indicated that their firm’s reputation as an employer of choice
strongly contributed to their ability to recruit qualified workers,
and 52% felt that their corporate brand played a key role.
About half (46%) of environmental employers viewed the use
of existing employee networks as a key to successful recruiting.
Interestingly, less than a third (31%) of environmental employers
felt that use of multiple recruiting methods strongly influenced
their recruiting success.
As the economy regains strength and an increasing number
of environmental firms resume higher recruiting levels,
environmental employers that have effectively branded their
organization will have an advantage in attracting the best workers.
A recent study by Bently College Professor, Pierre Berthon, on
employer branding for recruiting showed that workers prefer to
work for firms that offer recognition and/or appreciation from
management and also offer a springboard for future employment.
In addition, Berthon’s research identified that workers preferred
employers with a fun working environment where they enjoyed
a good relationship with superiors and colleagues.5 Workers
preferred to work for employers that helped them to feel good
about themselves and gain more self-confidence. Environmental
employers who are able to identify the key strengths of their
organization which would appeal to workers and then translate
those strengths into a well-articulated employer brand can position
their firm as an employer of choice in the minds of prospective
employees. These environmental employers will be able to recruit
from a larger pool of qualified candidates who show strong interest
in working for the firm.
Figure 6Successful recruitment strategies
0% 20% 40% 60% 80%
31%
38%
40%
42%
46%
52%
52%
64%
Percentage of Environmental Employers indicatingthe Activity Strongy Contributes to Recruiting Success
Reputation as an employer of choice
Competitiveness of wage and benefits package offered
Strong corporate brand
Use of existing employee network
Clearly explained recruiting processes
Speed of hiring process
Effective HR department
Use of diverse recruitment techniques(not relying on one single method)
5 Captivating Company: Dimension of Attractiveness in Employer Branding (Berthon, Ewing and Han, 2005).

33

34
7. HIRING DURING THE ECONOMIC DOWNTURN
7.1 SUMMARY
Even during the economic economic downturn a large
number (nearly 40%) of environmental employers have hired
or attempted to hire environmental employees. The open
positions at firms were roughly evenly split between positions
left vacant by a worker who left the firm and newly created
positions. There was a portion of employers in every industry
that hired or tried to hire environmental workers. About one
third of employers who were hiring experienced difficulties
finding the workers they need. Lack of workers with appropriate
skills was the most commonly-cited reason for their difficulties.
Employers in professional services and waste management/
remediation were more likely to experience difficulties finding
the environmental workers they need. Hiring patterns were
similar across provinces, with employers in Alberta being most
active in recruiting workers.
7.2 HIRING AND HIRING DIFFICULTIES
The economic downturn in 2007-2009 affected employer hiring
practices across North America as employers cut costs and
personnel. In the past 12 months, (March 2009 to March 2010)
Canadian employers added 147,500 new jobs.6 This reflects all
employers, including environmental employers. The new jobs
added equate to a slight 0.9% increase in employment over the
last year. During the same time period, 61% of environmental
employers did not have any vacant positions, 27% had vacant
positions with no trouble filling the position and 12% had vacant
positions and had difficulties filling the positions. Combined, 39%
of environmental employers attempted to fill at least one vacant
position for an environmental employee.
The most commonly-cited hiring difficulty across all demographics
is difficulties in finding workers with the appropriate skills. Finding
workers with specialized experience is also a limiting factor,
especially for employers hiring workers who are transitioning
out of different industry and into the environmental sector.
Firms hiring international workers and recent immigrants also
experienced difficulties related to evaluating the competency of
these workers in the skills that are required.
6 See Appendix A for a summary of employment changes from March 2009 to March 2010.
Figure 7Vacant positions at environmental employers in past year
61%
27%
12%
Experiencing difficulties filling vacant positions
No difficulties filling vacant positions
No vacant positions in the past 12 months
Source: Survey of Environmental Employment 2010, n=507
35
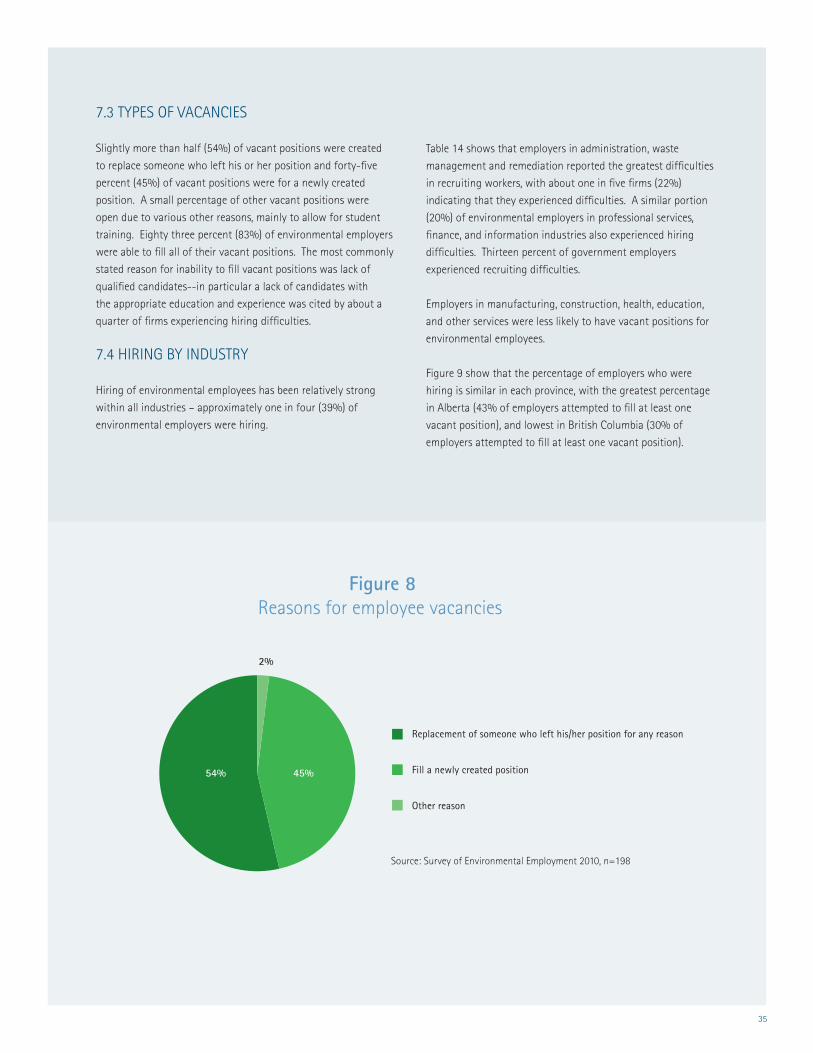
7.3 TYPES OF VACANCIES
Slightly more than half (54%) of vacant positions were created
to replace someone who left his or her position and forty-five
percent (45%) of vacant positions were for a newly created
position. A small percentage of other vacant positions were
open due to various other reasons, mainly to allow for student
training. Eighty three percent (83%) of environmental employers
were able to fill all of their vacant positions. The most commonly
stated reason for inability to fill vacant positions was lack of
qualified candidates--in particular a lack of candidates with
the appropriate education and experience was cited by about a
quarter of firms experiencing hiring difficulties.
7.4 HIRING BY INDUSTRY
Hiring of environmental employees has been relatively strong
within all industries – approximately one in four (39%) of
environmental employers were hiring.
Table 14 shows that employers in administration, waste
management and remediation reported the greatest difficulties
in recruiting workers, with about one in five firms (22%)
indicating that they experienced difficulties. A similar portion
(20%) of environmental employers in professional services,
finance, and information industries also experienced hiring
difficulties. Thirteen percent of government employers
experienced recruiting difficulties.
Employers in manufacturing, construction, health, education,
and other services were less likely to have vacant positions for
environmental employees.
Figure 9 show that the percentage of employers who were
hiring is similar in each province, with the greatest percentage
in Alberta (43% of employers attempted to fill at least one
vacant position), and lowest in British Columbia (30% of
employers attempted to fill at least one vacant position).
Figure 8Reasons for employee vacancies
Replacement of someone who left his/her position for any reason
Fill a newly created position
Other reason
54% 45%
2%
Source: Survey of Environmental Employment 2010, n=198

36
Figure 9Organizations hiring environmental employees in past year
39%33%
41%37%
43%
30%39%
AtlanticProvinces
Quebec Ontario Prairies Alberta BritishColumbia
Canada
100%
90%
80%
70%
60%
50%
40%
30%
20%
10%
0%
n=507
Agriculture, Forestry, Fishing and Hunting 30% 6% 24% 71% 51
Mining,Quarrying,andOilandGasExtraction 42% 10% 32% 58% 31
Construction 24% 12% 12% 76% 42
Manufacturing 20% 4% 16% 80% 49
Wholesale Trade/Retail Trade, Utilities, Transportation
and Warehousing 32% 2% 30% 68% 57
Professional, Scientific and Technical Services,
Information, Finance and Insurance, Real Estate
and Management of Companies 41% 20% 21% 59% 71
Administration and Support, Waste Management
and Remediation 56% 22% 34% 44% 116
Education, Health and Social Assistance, and
Other Services (except Public Administration) 33% 9% 24% 68% 34
Arts, Recreation, Accommodation and Food Services 52% 8% 44% 48% 25
Public Administration 45% 13% 32% 55% 31
Total 39% 12% 27% 61% 507
Industry Percent Environmental Employers that
are Hiring
Percent of Environmental
Employers Hiring with No
Difficulties Filling Vacant Positions
Firms with No Vacant Positions in the Past 12
Months
n
Table 14Percentage of firms who are hiring environmental workers
Firms That Are Hiring
Percent of Environmental
Employers Experiencing
Hiring Difficulties

37

38
8. ENVIRONMENTAL EMPLOYEE ENGAGEMENT & TURNOVER
8.1 SUMMARY
In the environmental sector, twice as many employers have lost
workers due to problems with employee retention than have
lost workers due to downsizing during the economic downturn.
During the economic downturn, environmental employers
experienced difficulties retaining their best employees, who were
offered better benefits, higher income, better work-life balance,
or better career opportunities at another organization. With
retention concerns persisting, analysis of the survey results
show that there are some actions that employers can take to
improve the level of engagement of workers and keep their most
talented and qualified employees. These include placing a greater
importance on the professional development of workers, which
is perhaps the most effective high-leverage strategy to improve
retention of qualified workers. Other successful strategies include
challenging workers with greater levels of responsibility and
variety in their tasks, developing better defined corporate goals
and promoting stronger team connections through team-building
activities. Employers who engage in these strategies benefit from
employees who are more committed and enthusiastic about their
work and act in a way that furthers their organization’s interests.
8.2 EMPLOYEE TURNOVER
Many of the driving forces behind turnover are unavoidable,
such as a need to relocate for family or ending of a
temporary position, but many employers also face retention
problems that can be addressed through HR policies. During
the past 12 months (March 2009-March 2010), while most
Canadian employers struggled through the 2007-2009
economic downturn, 19% of environmental employers lost
workers due to reduction in workforce (layoffs). More than
twice as many employers (42%) lost environmental workers
for reasons that can be addressed through HR policies, such
as workers being offered better benefits, higher income,
better work-life balance, or better career opportunities at
another organization. The largest problem for employers was
losing workers due to the offer of better career advancement
opportunitiesatotherorganizations;whichmadeup25%of
addressable employee turnovers.

39
Figure 10Main reasons for employee turnover
8%
19%26%
42%50%
40%
30%
20%
10%
0%
Retirement ofemployee
Downsizing of ourworkforce
Worker was fired forpoor performance
Employees foundbetter benefits, salary,work-life balance, or
career opportunities atanother organization
Perc
ent
of S
urve
yRe
spon
dent
sPe
rcen
t of
Sur
vey
Resp
onde
nts
30%
25%
20%
15%
10%
5%
0%
25%23%
14%13%
Better benefits inanother organization
Better work-lifebalance in another
organization
Higher salary inanother organization
Better opportunitiesfor career advancementin another organization
Note: Regarding the bottom charts, respondents sometimes indicated that employee attrition was due to more than one benefit offered by another organization (for instance, some respondents indicated that they lost employees due to both a higher salary and better benefits at another organization). As a result, totals do not add to the figure stated in the upper chart (42%).
40
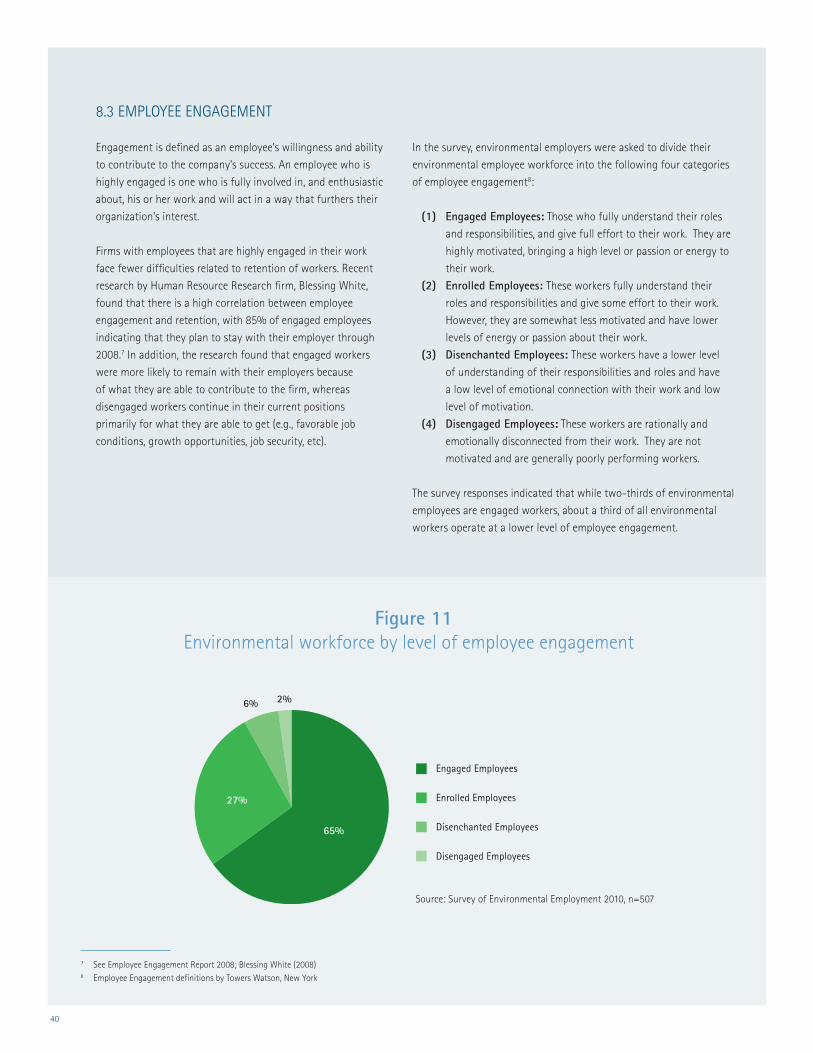
8.3 EMPLOYEE ENGAGEMENT
Engagement is defined as an employee’s willingness and ability
to contribute to the company’s success. An employee who is
highly engaged is one who is fully involved in, and enthusiastic
about, his or her work and will act in a way that furthers their
organization’s interest.
Firms with employees that are highly engaged in their work
face fewer difficulties related to retention of workers. Recent
research by Human Resource Research firm, Blessing White,
found that there is a high correlation between employee
engagement and retention, with 85% of engaged employees
indicating that they plan to stay with their employer through
2008.7 In addition, the research found that engaged workers
were more likely to remain with their employers because
of what they are able to contribute to the firm, whereas
disengaged workers continue in their current positions
primarily for what they are able to get (e.g., favorable job
conditions, growth opportunities, job security, etc).
In the survey, environmental employers were asked to divide their
environmental employee workforce into the following four categories
of employee engagement8:
(1) Engaged Employees: Those who fully understand their roles
and responsibilities, and give full effort to their work. They are
highly motivated, bringing a high level or passion or energy to
their work.
(2) Enrolled Employees: These workers fully understand their
roles and responsibilities and give some effort to their work.
However, they are somewhat less motivated and have lower
levels of energy or passion about their work.
(3) Disenchanted Employees: These workers have a lower level
of understanding of their responsibilities and roles and have
a low level of emotional connection with their work and low
level of motivation.
(4) Disengaged Employees: These workers are rationally and
emotionally disconnected from their work. They are not
motivated and are generally poorly performing workers.
The survey responses indicated that while two-thirds of environmental
employees are engaged workers, about a third of all environmental
workers operate at a lower level of employee engagement.
Figure 11Environmental workforce by level of employee engagement
Engaged Employees
Enrolled Employees
Disenchanted Employees
Disengaged Employees
65%
27%
6% 2%
7 SeeEmployeeEngagementReport2008;BlessingWhite(2008)8 Employee Engagement definitions by Towers Watson, New York
Source: Survey of Environmental Employment 2010, n=507

41
Several factors were viewed as contributing to the promotion
of a high level of employee engagement. Strong leadership
from senior management, challenging employees with greater
responsibility and variety of tasks, professional development
opportunities and rewards for performance were the top ranked
factors contributing to an engaged workforce. Table 15 contains
a ranked list of strategies that employers viewed as effective for
maintaining an engaged workforce. Notably, most employers did
not view ownership options or retention training for managers
as factors contributing to employee engagement.
Table 15A Organization strengths in promoting employee engagement
Engagement Strategy
Percent of Employers Who Think The Strategy Contributes to High
Employee Engagement
* Percent of employers who think the strategy contributes to high employee engagement, n=507
Strong leadership from senior management 92%
Challenge employees with greater responsibility or increasing variety of their tasks 83%
Professional development opportunities 80%
Corporate goals 80%
Rewards for performance 78%
Management feedback tools (such as manager report cards from those they manage) 74%
Other opportunity for career advancement 71%
Strong HR department policies 71%
Better benefits (e.g, retirement benefits, vacation or paid leave benefits, educational
reimbursement, flexible work schedules, or other fringe benefits (e.g., relocation
assistance, bonuses, day care for children, gyms) 63%
Team-building activities and exercises or team cohesion activities outside
the work environment 61%
Unexpected rewards 59%
Retention training for managers 43%
Ownership options such as stock options 27%
Firms with employees that are highly engaged in their work face fewer difficulties related
to retention of workers.

42
A comparison of firms with a high percentage of engaged
employees versus those with low levels of engagement sheds
light on key differences that affect employee engagement and
retention. Both groups hold similar views on some strategies.
For instance, both groups believe that strong leadership from
senior management and competitive benefits contribute to
employee engagement. Firms with more engaged employees
were more likely to place a high importance on the professional
development of their workers. They were also more likely
to place importance on giving workers higher levels of
responsibility and variety in their tasks. They were more likely
to view well-defined corporate goals, rewards for performance,
and team-building activities as key strategies that lead to
better retention. By comparison, employers with lower levels
of employee engagement were more likely to view unexpected
rewards, management feedback tools, and opportunities for career
advancement as more effective methods for employee retention.
Table 15b compares engagement strategies between two
key groups of employers: (1) employers with a high level of
engagement (75% of workers are engaged), referred to as “High-
Engagement Employers” and (2) employers with a low level of
engagement (less than 25% of workers are engaged), referred to
as “Low-Engagement Employers”.
Table 15BOrganization strengths in promoting employee engagement
n=507
Engagement Strategy High-Engagement Employers*
Low-Engagement Employers*
Difference between High-Engagement
and Low- Engagement Employers
Professional development opportunities 81% 63% 18%
Team-building activities 60% 45% 15%
Corporate goals 79% 67% 13%
Rewards for performance 78% 67% 11%
Ownership options 29% 19% 9%
Retention training for managers 42% 34% 8%
Challenging employees with greater responsibility/variety of tasks 84% 77% 8%
Better benefits 62% 58% 4%
Strong leadership from senior management 94% 90% 4%
Strong HR department policies 69% 73% -4%
Unexpected rewards 57% 61% -5%
Management feedback tools 76% 81% -5%
Opportunity for career advancement 65% 72% -7%
Professional development opportunities, well-defined corporate goals,rewards for performance,team-building and challenging workers
with greater responsibility are all recommended strategies for employers seeking to increase engagement and reduce their cost of recruitment.
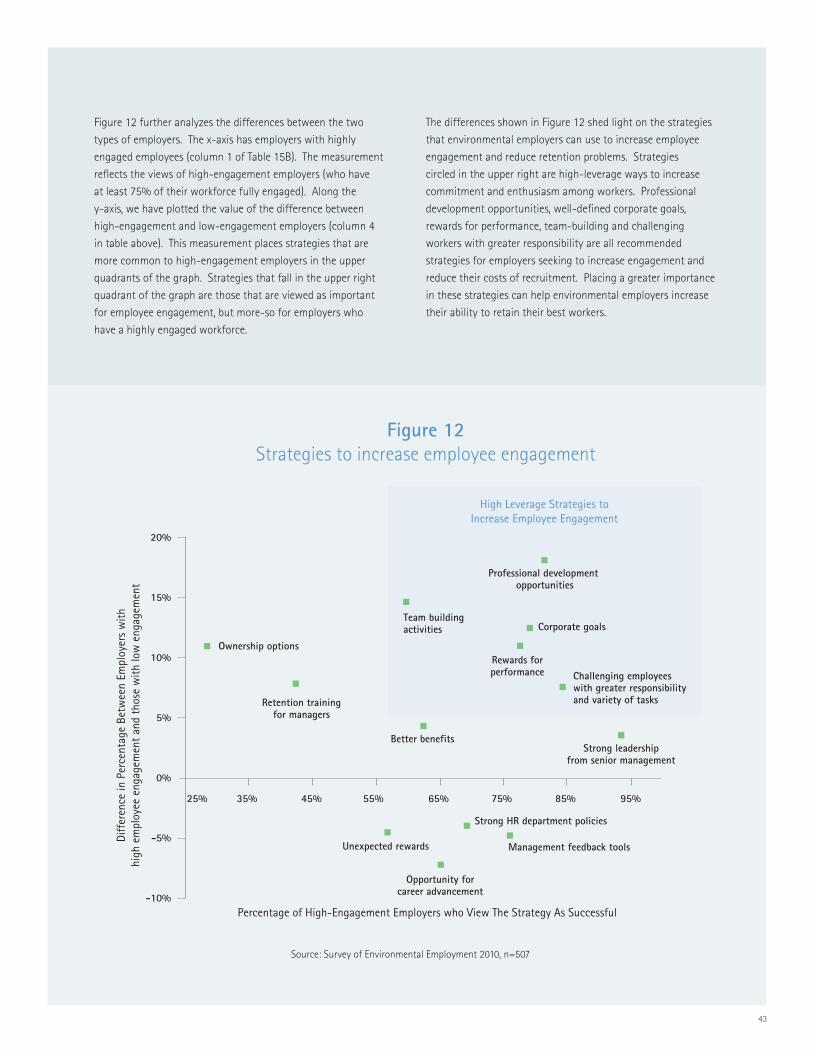
43
Figure 12 further analyzes the differences between the two
types of employers. The x-axis has employers with highly
engaged employees (column 1 of Table 15B). The measurement
reflects the views of high-engagement employers (who have
at least 75% of their workforce fully engaged). Along the
y-axis, we have plotted the value of the difference between
high-engagement and low-engagement employers (column 4
in table above). This measurement places strategies that are
more common to high-engagement employers in the upper
quadrants of the graph. Strategies that fall in the upper right
quadrant of the graph are those that are viewed as important
for employee engagement, but more-so for employers who
have a highly engaged workforce.
The differences shown in Figure 12 shed light on the strategies
that environmental employers can use to increase employee
engagement and reduce retention problems. Strategies
circled in the upper right are high-leverage ways to increase
commitment and enthusiasm among workers. Professional
development opportunities, well-defined corporate goals,
rewards for performance, team-building and challenging
workers with greater responsibility are all recommended
strategies for employers seeking to increase engagement and
reduce their costs of recruitment. Placing a greater importance
in these strategies can help environmental employers increase
their ability to retain their best workers.
Figure 12Strategies to increase employee engagement
20%
15%
10%
5%
0%
-5%
-10%
25% 35% 45% 55% 65% 75% 85% 95%
Percentage of High-Engagement Employers who View The Strategy As Successful
Diff
eren
ce in
Per
cent
age
Betw
een
Empl
oyer
s w
ithhi
gh e
mpl
oyee
eng
agem
ent
and
thos
e w
ith lo
w e
ngag
emen
t
Ownership options
Retention trainingfor managers
High Leverage Strategies toIncrease Employee Engagement
Opportunity forcareer advancement
Unexpected rewards
Strong HR department policies
Management feedback tools
Better benefitsStrong leadership
from senior management
Team buildingactivities
Professional development opportunities
Corporate goals
Rewards forperformance Challenging employees
with greater responsibility and variety of tasks
Source: Survey of Environmental Employment 2010, n=507

44

45
9. FUTURE DEMAND FOR ENVIRONMENTAL WORKERS AND SKILLS
9.1 SUMMARY
A large number of hiring managers are uncertain about their future
growth prospects, with about a fifth of environmental employers
optimistic that they will increase the number of environmental
workers on their payrolls over the next two years. Smaller and
mid-sized firms were more optimistic than large employers, but
this could change over the next year if the economy continues to
improve. Regardless of whether worker headcounts increase, trends
since the 2007 ECO Canada Survey of Environmental Employment
demonstrate that environmental skills are quickly becoming
more important across the workforce and within every industry.
Particularly strong growth in demand for environmental skills was
apparent in the green construction, manufacturing and agricultural
sectors. All skilled environmental occupational categories are in
demand with some percentage of employers planning to hire in
each category. More employers have plans to hire workers in site
assessment and reclamation, waste management, environmental
safety and health, and water quality than in other categories.
Employers hoped to hire within several environmental-related
subspecialties of engineering, including the top mentioned “hot
job” from the survey environmental engineers, but short supply of
workers is a common problem.
Retirement of environmental workers will create over 100,000
vacancies over the next decade as 14% of the environmental
workforce reaches retirement age. Future retirements will
create demand for environmental employees in all occupations
and in all industries, in particular for manufacturing,
healthcare, education, utilities, and other industries.
9.2 GROWTH IN TOTAL WORKFORCE
Environmental employers had mixed views of their future
growth expectations. The largest percentage of environmental
employers (37%) were uncertain about how many
environmental employees they expect to employ two years in
the future. The rest were evenly split between:
• 21%expectthenumberofenvironmentalworkersthey
employ to be the same in two years.
• 22%expectedthenumberofenvironmentalworkers
they employ to decrease in the future and
• 20%expectthenumberofenvironmentalemployeesto
increase.
The lower percentage of employers that expect to increase
their workforce likely reflects low business confidence levels as
employers emerge from the economic downturn.
Figure 13Forecast of environmental employees in 2010
40%
35%
30%
25%
20%
15%
10%
5%
0%
Employers expecting adescrease in environmental
employees
Employers expectingthe same number of
environmental employees
Employers expecting anincrease in the number ofenvironmental employees
Employers whoare uncertain
22% 21% 20%
37%
Source: Survey of Environmental Employment 2010, n=507

46
Analysis of employers by firm size suggests that smaller
organizations had more positive views of their future growth
potential. Environmental employers with fewer than 20 employees
were more than twice as likely to expect to increase the size of
their environmental workforce as environmental employers with
over 1,000 employees. Figure 14 highlights that about one third
(29%) of environmental employers with less than 20 employees
expect to increase their number of environmental employees in
the next 2 years. The view of many small business economists
is that small businesses are a shock absorber for the economy-
-these smaller firms are better able to react quickly to changing
economic situations without overcompensation (they don’t
over-hire or lay off workers too aggressively). This causes small
employers to fluctuate less in their workforce size as compared
to large employers.9 At the time of the survey, only 12% of large
environmental employers expect their workforce to grow in the
next two years, and nearly half (42%) expressed uncertainty about
their future. When business confidence returns, these larger
employers may aggressively begin hiring again, placing pressure
on smaller employers to retain their workers.
9.3 GROWTH IN DEMAND FOR ENVIRONMENTAL SKILLS
While demand for more environmental workers is somewhat
uncertain at this point, comparisons with ECO Canada’s 2007 Survey of Environmental Employment highlight a strong
growth trend in the demand for environmental skills across the
workforce. In the 2007 survey, ECO Canada asked employers
how many of their workers they consider to be environmental
employees. A different method was used in the 2010 survey
to capture the demand for environmental skills, which are
becoming increasingly common. In 2007, environmental
employees represented 3.2% of total Canadian Employment. In
2010, 4% of employees in Canada spend 50% or more of their
time on environmental activities and 12.2% of workers spend at
least some time on environmental activities. While the methods
used in the 2007 and 2010 surveys are not perfectly comparable,
comparisons between the findings suggest that there is growth
in demand for environmental skills in all sectors.
9 Small Business Growth (Brian Headd, Bruce Kirchhoff, 2007)
Figure 14Increase in workforce expectations by organization size
35%
30%
25%
20%
15%
10%
5%
0%
29%28%
26%
12%
More than 1000employees
100 to 1000employees
20 to 99employees
Less than 20employees
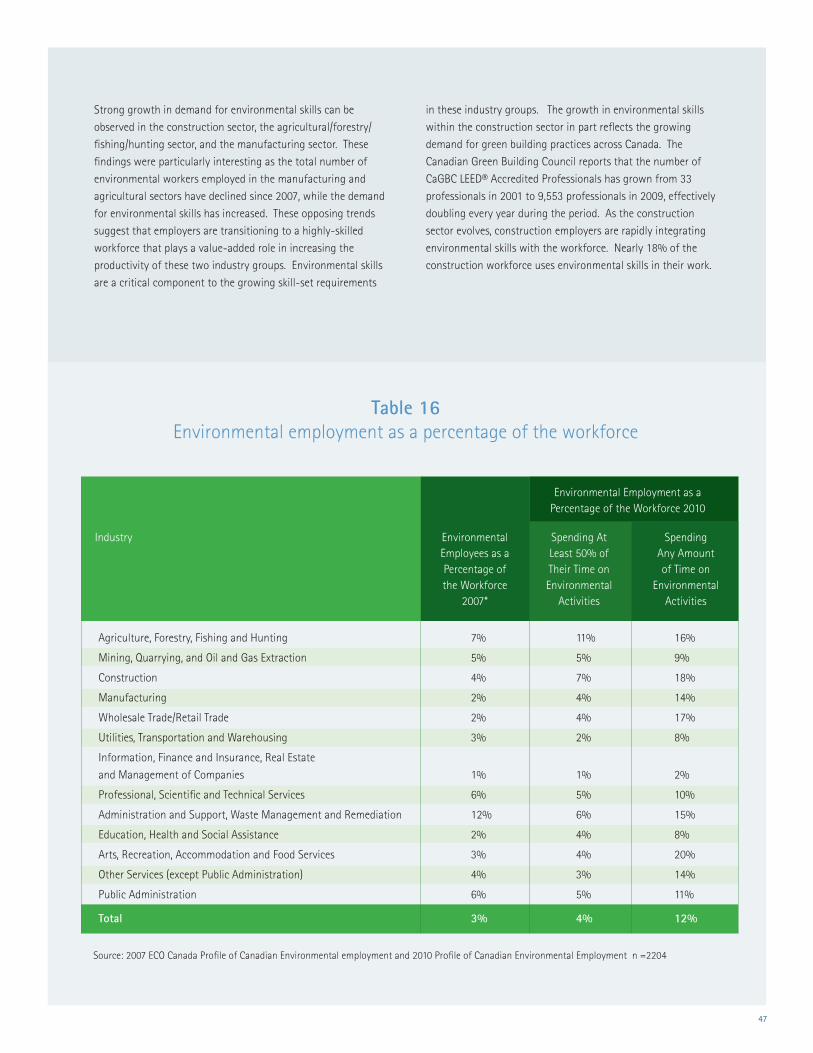
47
Strong growth in demand for environmental skills can be
observed in the construction sector, the agricultural/forestry/
fishing/hunting sector, and the manufacturing sector. These
findings were particularly interesting as the total number of
environmental workers employed in the manufacturing and
agricultural sectors have declined since 2007, while the demand
for environmental skills has increased. These opposing trends
suggest that employers are transitioning to a highly-skilled
workforce that plays a value-added role in increasing the
productivity of these two industry groups. Environmental skills
are a critical component to the growing skill-set requirements
in these industry groups. The growth in environmental skills
within the construction sector in part reflects the growing
demand for green building practices across Canada. The
Canadian Green Building Council reports that the number of
CaGBC LEED® Accredited Professionals has grown from 33
professionals in 2001 to 9,553 professionals in 2009, effectively
doubling every year during the period. As the construction
sector evolves, construction employers are rapidly integrating
environmental skills with the workforce. Nearly 18% of the
construction workforce uses environmental skills in their work.
Table 16Environmental employment as a percentage of the workforce
Source: 2007 ECO Canada Profile of Canadian Environmental employment and 2010 Profile of Canadian Environmental Employment n =2204
Industry Environmental Employees as a Percentage of the Workforce
2007*
Spending At Least 50% of Their Time on Environmental
Activities
Spending Any Amount of Time on
Environmental Activities
Environmental Employment as a Percentage of the Workforce 2010
Agriculture, Forestry, Fishing and Hunting 7% 11% 16%
Mining,Quarrying,andOilandGasExtraction 5% 5% 9%
Construction 4% 7% 18%
Manufacturing 2% 4% 14%
Wholesale Trade/Retail Trade 2% 4% 17%
Utilities, Transportation and Warehousing 3% 2% 8%
Information, Finance and Insurance, Real Estate
and Management of Companies 1% 1% 2%
Professional, Scientific and Technical Services 6% 5% 10%
Administration and Support, Waste Management and Remediation 12% 6% 15%
Education, Health and Social Assistance 2% 4% 8%
Arts, Recreation, Accommodation and Food Services 3% 4% 20%
Other Services (except Public Administration) 4% 3% 14%
Public Administration 6% 5% 11%
Total 3% 4% 12%

48
9.4 GROWTH OCCUPATIONAL AREAS IN THE ENVIRONMENTAL SECTOR
A minority (20%) of employers planned to increase the size of their
environmental workforce, but nearly half (44%) of environmental
employers planned to hire workers in the next two years, either
to augment their workforce or to replace workers who leave. The
most common NOSoccupation category employers plan to hire
for was site assessment and reclamation. Employers also had
strong hiring expectations for workers in waste management,
environmental health and safety, and water quality.
A relatively low percentage of employers planned to hire workers
in carbon and climate change mitigation and in alternative/
renewable energy and eco-efficiency categories. Both of these
areas are new emerging growth areas identified in the ECO Canada Environmental Trends Study, and we expected to see stronger
hiring demand in these categories. Relatively low hiring plans in
the carbon and climate change mitigation category may reflect
employer uncertainty of future regulatory schemes used to reduce
carbon emissions. While some provinces have implemented
carbon emission reduction schemes, a national model is still
under development. Until a national regulatory scheme
is clarified and legislation is put in place, employers may
be hesitant to hire workers or develop skill-sets within the
category.
The survey may underestimate future growth potential for
these two categories because these sectors may not developed
within established firms, but rather through new business
startups. For instance, many firms selling carbon offset
credits are new businesses that have been formed within
the past few years as legislation has been implemented,
creating a need for the service. It is possible that established
environmental employers that participated in our survey will
not be the firms that hire the majority of these workers.
Table 17Hiring plans by occupational areas*
National Occupational Standard (NOS) Category Percentage of employers planning to hire in next year
n=507
* In addition to the ECO Canada NOS categories, the other categories included are ‘Carbon and Climate Change mitigation’ and Alternative / renewable energy and Eco-efficiency
Planning to hire in at least one NOS Category 44%
Site assessment and reclamation 24%
Waste management 22%
Environmental safety and health 22%
Water quality 19%
Research & development 13%
Eco-preservation/ wildlife and fisheries management 11%
Policy and legislation 11%
Air quality 11%
Alternative/renewable energy, eco-efficiency 10%
Environmental education & training 10%
Natural resource management 10%
Carbon and climate change mitigation 9%
Environmental communication and public awareness 9%

49
9.5 HOT JOBS
Environmental engineers, technicians, and project managers
are the environmental occupations that are in highest demand
across all industry sectors. Employers in each industry identified
a variety of occupations that are in high demand—either because
they are in short supply (difficult to recruit) or because employers
plan to hire a large number of workers in the occupation.
Environmental engineers and specific engineering specialties
(such as civil engineers and mechanical engineers) were the most
commonly mentioned occupations that employers are planning
to hire. The gap between employer demand and the supply of
environmental engineers may be particularly large—employers
participating in the survey identified indicated they plan to hire
a lot of engineers, but also experience difficulty finding these
workers because they are in short supply.
Environmental employers were also having difficulty
finding engineering technologists/technicians, operations
managers, project managers, machine operators, hydrologists,
and workers in other specialized occupations that are in
demand. Operations managers, project managers, water
and wastewater technicians, waste management workers,
engineering technologists/technicians, and health and safety
technicians were the most commonly mentioned occupations
where employers plan to hire a large number of workers in
the future.
Table 18Hiring difficulties in high demand occupations
Occupation Number of Mentions by Employers
Environmental engineer or engineering specialty (civil, mechanical, etc.) 41
Engineering technologist or technician 16
Operations manager/ project manager 15
Machine operator 11
Waste water technician 10
Sales representative 9
Researcher/ research & development 8
Hydrologist 8
Health and safety technician 8
Drivers 8
Waste management workers 6
Mechanic or electric technician 6
Agronomist 6
Abatement/remediation/site assessment/hazardous waste handler 6
Scientist 5
Geologist 5
Laboratory technicians 4
Environmental consultant 4
Policy & legislation analysts 3
Driller 3
Renewable energy technicians 2
Water quality 2
Land use planner/ civil designers 2
Finance & accounting 2
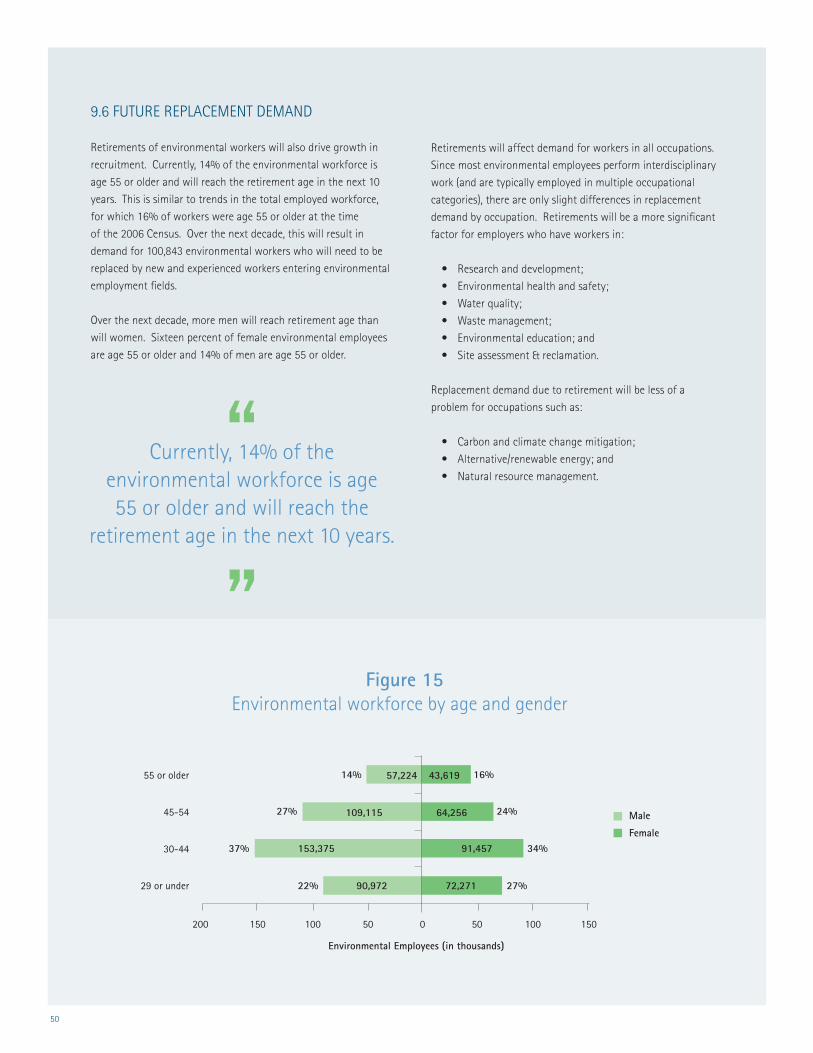
50
9.6 FUTURE REPLACEMENT DEMAND
Retirements of environmental workers will also drive growth in
recruitment. Currently, 14% of the environmental workforce is
age 55 or older and will reach the retirement age in the next 10
years. This is similar to trends in the total employed workforce,
for which 16% of workers were age 55 or older at the time
of the 2006 Census. Over the next decade, this will result in
demand for 100,843 environmental workers who will need to be
replaced by new and experienced workers entering environmental
employment fields.
Over the next decade, more men will reach retirement age than
will women. Sixteen percent of female environmental employees
are age 55 or older and 14% of men are age 55 or older.
Retirements will affect demand for workers in all occupations.
Since most environmental employees perform interdisciplinary
work (and are typically employed in multiple occupational
categories), there are only slight differences in replacement
demand by occupation. Retirements will be a more significant
factor for employers who have workers in:
• Researchanddevelopment;
• Environmentalhealthandsafety;
• Waterquality;
• Wastemanagement;
• Environmentaleducation;and
• Siteassessment&reclamation.
Replacement demand due to retirement will be less of a
problem for occupations such as:
• Carbonandclimatechangemitigation;
• Alternative/renewableenergy;and
• Naturalresourcemanagement.
Figure 15Environmental workforce by age and gender
14% 16%
27% 24%
37% 34%
22% 27%
Environmental Employees (in thousands)
55 or older
45-54
30-44
29 or under
57,224 43,619
109,115 64,256
153,375 91,457
90,972 72,271
200 150 100 50 0 50 100 150
Male
Female
Currently, 14% of the environmental workforce is age 55 or older and will reach the
retirement age in the next 10 years.
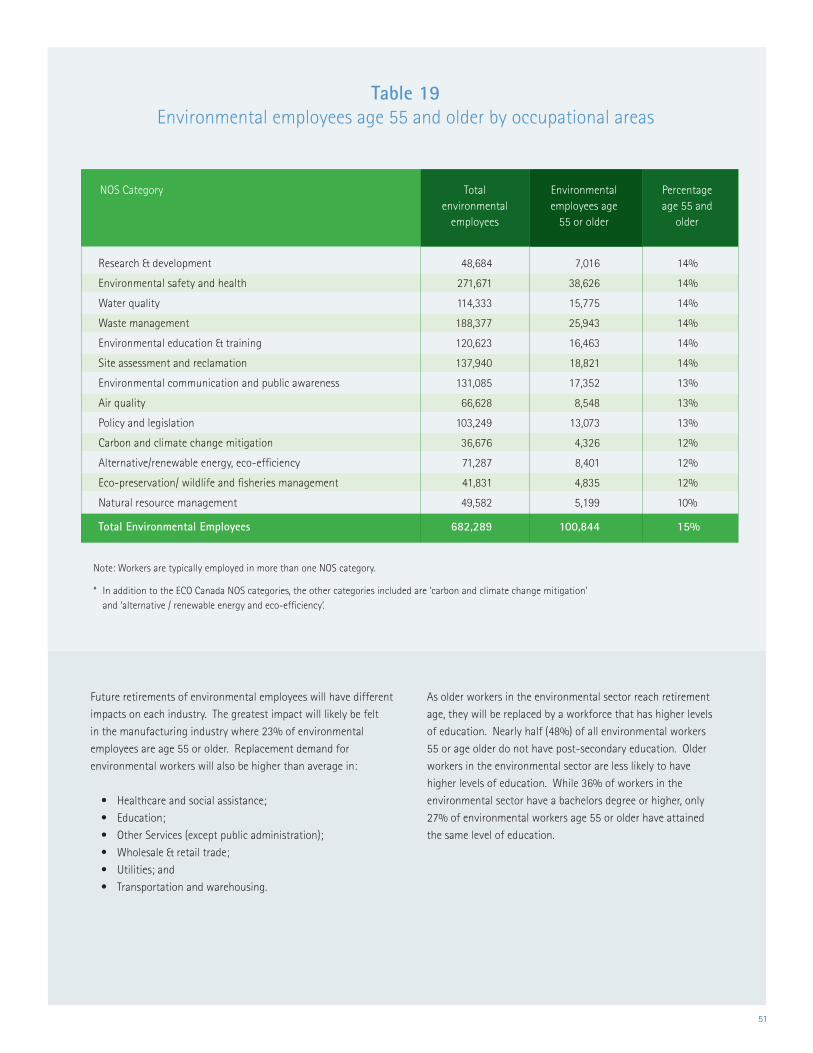
51
Table 19Environmental employees age 55 and older by occupational areas
Note: Workers are typically employed in more than one NOS category.
* In addition to the ECO Canada NOS categories, the other categories included are ‘carbon and climate change mitigation’ and ‘alternative / renewable energy and eco-efficiency’.
NOS Category Environmental employees age
55 or older
Percentage age 55 and
older
Research & development 48,684 7,016 14%
Environmental safety and health 271,671 38,626 14%
Water quality 114,333 15,775 14%
Waste management 188,377 25,943 14%
Environmental education & training 120,623 16,463 14%
Site assessment and reclamation 137,940 18,821 14%
Environmental communication and public awareness 131,085 17,352 13%
Air quality 66,628 8,548 13%
Policy and legislation 103,249 13,073 13%
Carbon and climate change mitigation 36,676 4,326 12%
Alternative/renewable energy, eco-efficiency 71,287 8,401 12%
Eco-preservation/ wildlife and fisheries management 41,831 4,835 12%
Natural resource management 49,582 5,199 10%
Total Environmental Employees 682,289 100,844 15%
Total environmental
employees
Future retirements of environmental employees will have different
impacts on each industry. The greatest impact will likely be felt
in the manufacturing industry where 23% of environmental
employees are age 55 or older. Replacement demand for
environmental workers will also be higher than average in:
• Healthcareandsocialassistance;
• Education;
• OtherServices(exceptpublicadministration);
• Wholesale&retailtrade;
• Utilities;and
• Transportationandwarehousing.
As older workers in the environmental sector reach retirement
age, they will be replaced by a workforce that has higher levels
of education. Nearly half (48%) of all environmental workers
55 or age older do not have post-secondary education. Older
workers in the environmental sector are less likely to have
higher levels of education. While 36% of workers in the
environmental sector have a bachelors degree or higher, only
27% of environmental workers age 55 or older have attained
the same level of education.

52
Table 20Environmental employees age 55 and older by industry
Environmental employees age
55 or older
Percentage age 55 or
older
Agriculture, Forestry, Fishing and Hunting 41,878 4,260 10%
Mining,Quarrying,andOilandGasExtraction 11,405 845 7%
Construction 89,020 6,979 8%
Manufacturing 71,934 16,527 23%
Wholesale Trade/Retail Trade, Utilities, Transportation and Warehousing 111,808 21,632 19%
Professional, Scientific and Technical Services, Information, Finance
and Insurance, Real Estate and Management of Companies 72,625 7,833 11%
Administration and Support, Waste Management and Remediation 36,124 3,827 11%
Education, Health and Social Assistance, and Other Services
(except Public Administration) 142,665 29,874 21%
Arts, Recreation, Accommodation and Food Services 59,252 5,299 9%
Public Administration 45,578 3,767 8%
Total 682,289 100,844 15%
Environmental employees
Industry
Table 21 Educational attainment by age
Occupational Areas* Environmental workers age 55 or older
Masters, doctorate, or higher 6,934 7% 77,908 11%
Bachelor degree or equivalent 20,671 20% 171,184 25%
College or equivalent 25,113 25% 207,865 30%
Less than post-secondary 48,126 48% 225,332 33%
Total 100,844 100% 682,289 100%
n=507
Percentage of workers age 55 and older
Number of environmental
workers
Percentage of environmental
workforce

53

54
APPENDIX A ADDITIONAL SUMMARY TABLES
TABLE A1 National employment change March 2009 - March 2010
Increase in Employment March 2009
to March 2010 (thousands)
Percent Change from
March 2009 to March 2010
Employment March 2010 (thousands)
Labour Force Category
Employees 14268.1 106.9 0.8
Self-employed 2695.1 40.6 1.5
Public sector employees 3475.5 95.7 2.8
Private sector employees 10792.6 11.2 0.1
All industries 16963.2 147.5 0.9
Goods-producing sector 3751.1 -10.1 -0.3
Agriculture 306.3 -14.6 -4.5
Natural resources 335.2 10.8 3.3
Utilities 146 -3.3 -2.2
Construction 1195.9 52.5 4.6
Manufacturing 1767.7 -55.6 -3
Services-producing sector 13212.1 157.6 1.2
Trade 2657.6 25.8 1
Transportation and warehousing 782.4 -58.9 -7
Finance, insurance, real estate and leasing 1098.1 20 1.9
Professional, scientific and technical services 1258.7 71.1 6
Business, building and other support services 642.6 -28.8 -4.3
Educational services 1236 60.6 5.2
Health care and social assistance 2010.9 64.5 3.3
Information, culture and recreation 765.5 15.8 2.1
Accommodation and food services 1092.4 27.4 2.6
Other services 731 -53.9 -6.9
Public administration 936.9 14 1.5
Source: Statistics Canada Labour Force Survey Release April 9, 2010

55
Percentage of Environmental
Employees Who Are Female
Percentage of All Employees
Who Are Female
Number of Female
Environmental Employees
Industry
Agriculture, Forestry, Fishing and Hunting 10,945 26% 30%
Mining,Quarrying,andOilandGasExtraction 2,437 21% 18%
Construction 9,122 10% 12%
Manufacturing 24,433 34% 29%
Wholesale Trade/Retail Trade 28,385 30% 49%
Utilities, Transportation and Warehousing 3,542 19% 46%
Information, Finance and Insurance, Real Estate and Mgt. of Companies 2,438 33% 54%
Professional, Scientific and Technical Services 22,310 34% 45%
Administration and Support, Waste Management and Remediation 13,519 37% 45%
Education, Health and Social Assistance 96,266 79% 76%
Arts, Recreation, Accommodation and Food Services 33,823 57% 58%
Other Services (except Public Administration) 8,714 42% 53%
Public Administration 15,669 34% 47%
Total 271,603 40% 47%
TABLE A2 Female environmental employees by industry

56
APPENDIX B METHODOLOGY
DEFINITION OF ENVIRONMENTAL EMPLOYMENT
Environmental employment is defined as individuals who
spend 50% or more of their work time on activities associated
with environmental protection, resource management, or
environmental sustainability. Specifically, this includes the
following activities:
• EnvironmentalProtection • Protectionofair;
• Carbonandclimatechangemitigation;
• Waterandlandquality;
• Wastemanagement;
• Restorationandreclamation;
• Humanandenvironmentalhealthandsafety;and
• Environmentalprotectionmanagement.
• ResourceManagement • Fishery;
• Wildlife;
• Forestry;
• Sustainableagriculture;
• Energyefficiency;
• Alternativeorrenewableenergy;
• Parksandnaturalreserves;and
• Naturalresourcemanagement.
• EnvironmentalSustainability • Education;
• Researchanddevelopment;
• Policyandlegislation;
• Communicationsandpublicawareness;and
• Sustainabledevelopment.
• Otherenvironmentrelatedactivities.
SURVEY DESIGN
The survey was designed by ECO Canada and RDA Global to meet
the study objectives. The survey included a short questionnaire
for all organizations and a long questionnaire for organizations
that identified themselves as having environmental employees.
While 1,697 organizations responded to short questionnaire
(they did not have environmental employees), 507 organizations
responded to the long questionnaire. On the basis of the
definition above, organizations were asked to complete the
long questionnaire if they employed one or more full-
time or part-time employees whose work is related to the
environment. Organizations not employing environmental
employees were asked to answer a few questions about the
organization’s workforce, which was used to estimate the
total environmental workforce. The survey was administered
both by phone and online. A total of 2,132 firms responded
to the survey by phone and 72 responded via the online
questionnaire.
SAMPLE PLAN
In order to ensure statistical reliability of the results, it was
estimated that a sample size of at least 1,200 responses was
required, with specific quotas for each industry category.
Once the sample frame was established, a random sample
contact database was created using the following sources:
• InfoCanadaDatabase;
• MailProspects(HumanResourceManagers);
• ASDE,SurveySampler,Inc.;
• CanadianCompanyCapabilities;and
• Contactssuppliedbyseveralindustry-basedmembership
organizations agreeing to participate in the study.
A stratified random sample of 26,039 organizations across
Canada were contacted by phone and email and invited
to participate in the survey. In total, the survey contact
database had 26,039 employers who were contacted for the
survey. Of this number 2,912 represented defunct businesses
or organizations with telephone numbers that were not in
service. The valid sample for the survey for telephone follow-
up activities was 23,127 employers. The survey sample frame
was constructed using the estimates of the total number of
employers by NAICS codes (based on data available in the
Canadian Business Patterns Database from Statistics Canada).
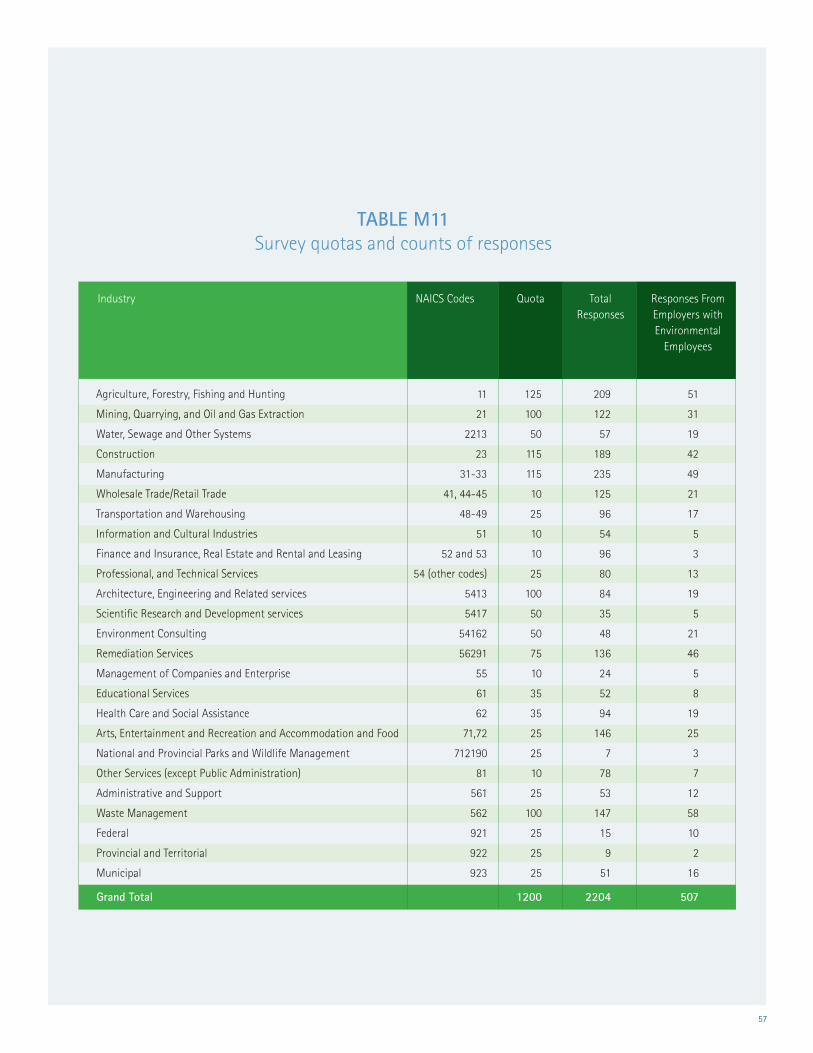
57
TABLE M11 Survey quotas and counts of responses
Quota Responses From Employers with Environmental
Employees
NAICS CodesIndustry Total Responses
Agriculture, Forestry, Fishing and Hunting 11 125 209 51
Mining,Quarrying,andOilandGasExtraction 21 100 122 31
Water, Sewage and Other Systems 2213 50 57 19
Construction 23 115 189 42
Manufacturing 31-33 115 235 49
Wholesale Trade/Retail Trade 41, 44-45 10 125 21
Transportation and Warehousing 48-49 25 96 17
Information and Cultural Industries 51 10 54 5
Finance and Insurance, Real Estate and Rental and Leasing 52 and 53 10 96 3
Professional, and Technical Services 54 (other codes) 25 80 13
Architecture, Engineering and Related services 5413 100 84 19
Scientific Research and Development services 5417 50 35 5
Environment Consulting 54162 50 48 21
Remediation Services 56291 75 136 46
Management of Companies and Enterprise 55 10 24 5
Educational Services 61 35 52 8
Health Care and Social Assistance 62 35 94 19
Arts, Entertainment and Recreation and Accommodation and Food 71,72 25 146 25
National and Provincial Parks and Wildlife Management 712190 25 7 3
Other Services (except Public Administration) 81 10 78 7
Administrative and Support 561 25 53 12
Waste Management 562 100 147 58
Federal 921 25 15 10
Provincial and Territorial 922 25 9 2
Municipal 923 25 51 16
Grand Total 1200 2204 507

58
PRE-TEST
A pre-test of the survey was performed in the last week of
January, 2010. The pre-test was used to identify any difficulties
that respondents might have understanding or responding to the
survey questions. Pre-test activities included:
• Preparationofafieldtestsamplewith200employers;
• Editsmadetothequestionnaire,basedondifficulties
experiencedbyemployers;and
• Reviewandfinalizationofthephoneandonlineversionsof
the survey.
In the pre-test, it was observed that a larger than expected
percentage of employers were indicating that they have
environmental employees (a higher percentage than that of
the 2007 survey). As a result, a survey question was added to
ask respondents how many of their environmental employees
spend 50% or more of their time on environmental activities.
The response allowed for a segmentation of environmental
employees into two distinct groups: (1) employees who spend
any amount of time on environmental activities, and (2)
employees who spend most (greater than 50%) of their time
on environmental activities.
In addition, a few other questions were changed or added to
ensure that the questions were suited for the respondent.
RESPONSE RATES
As shown in the table below, a total of 2,204 responses to
the survey were received, which includes respondents who
agreed to take the survey but were not eligible for the long
questionnaire since they did not have any environmental
employees. The overall response rate of the survey is 10%.
TABLE M12 Survey response rate
Valid Sample
Response Rate
Total Establishments
Industry Group Completions
Agriculture, Forestry, Fishing and Hunting 51,234 3,104 207 7%
Mining,Quarrying,andOilandGasExtraction 11,475 909 120 13%
Construction 211,159 2,978 188 6%
Manufacturing 69,455 3,048 233 8%
Wholesale Trade/Retail Trade 254,030 702 123 18%
Utilities, Transportation and Warehousing 97,555 1,769 150 8%
Information, Finance and Insurance, Real Estate
and Management of Companies 388,821 1,301 146 11%
Professional, Scientific and Technical Services 277,849 2,579 265 10%
Administration and Support, Waste Management and Remediation 88,693 1,730 331 19%
Education, Health and Social Assistance 111,602 2,576 142 6%
Arts, Recreation, Accommodation and Food Services 106,827 1,338 142 11%
Other Services (except Public Administration) 158,619 362 76 21%
Public Administration 3,820 731 81 11%
Total 1,831,139 23,127 2,204 10%

59
As shown in Table M13, 23% of the 2,204 establishments
responding to the survey indicated that they employed one
or more environmental workers. Overall, employers in sectors
such as public administration and administration and support
/ waste management are most likely to report having an
environmental employee in the organization.
Number of Establishments
With One orMore Environmental
Workers
Proportion of Establishments
With One or More
Environmental Workers
Total Number of Establishments Responding to
the Survey
Agriculture, Forestry, Fishing and Hunting 207 51 24.6%
Mining,Quarrying,andOilandGasExtraction 120 31 25.8%
Construction 188 42 22.3%
Manufacturing 233 49 21.0%
Wholesale Trade/Retail Trade 123 21 17.1%
Utilities, Transportation and Warehousing 150 36 24.0%
Information, Finance and Insurance, Real Estate
and Management of Companies 146 8 5.5%
Professional, Scientific and Technical Services 265 63 23.8%
Administration and Support, Waste Management and Remediation 331 116 35.0%
Education, Health and Social Assistance 142 27 19.0%
Arts, Recreation, Accommodation and Food Services 142 25 17.6%
Other Services (except Public Administration) 76 7 9.2%
Public Administration 81 31 38.3%
Total 2,204 507 23.0%
TABLE M13 Proportion of establishments with one or more environmental worker
Industry Group

60
The margin of error for all the establishments in the major
industry groups is presented in Table M14. The margin of error
for all establishments is ± 2 % at a 95 % confidence interval.
The sampling method results in margins of error of a maximum
of ±11 % at a 95 % confidence level. For industry strata, the
margin of error ranges from ±5 % for administration and
support and waste management and remediation to ±11 % for
other services and public administration.
Number of Survey Responses
Margin of Error
Number of Establishments
in Canada
Agriculture, Forestry, Fishing and Hunting 51,234 207 ±6.8%
Mining,Quarrying,andOilandGasExtraction 11,475 120 ±8.9%
Construction 211,159 188 ±7.1%
Manufacturing 69,455 233 ±6.4%
Wholesale Trade/Retail Trade 254,030 123 ±8.8%
Utilities, Transportation and Warehousing 97,555 150 ±8.0%
Information, Finance and Insurance, Real Estate and
Management of Companies 388,821 146 ±8.1%
Professional, Scientific and Technical Services 277,849 265 ±6.0%
Administration and Support, Waste Management and Remediation 88,693 331 ±5.4%
Education, Health and Social Assistance 111,602 142 ±8.2%
Arts, Recreation, Accommodation and Food Services 106,827 142 ±8.2%
Other Services (except Public Administration) 158,619 76 ±11.2%
Public Administration 3,820 81 ±10.8%
Total 1,831,139 2,204 ±2.1%
TABLE M14 Margin of error in estimation of environmental employment
Industry Group

61
The margin of error by industry for those establishments that
employ at least one environmental employee is presented in Table
M15. However the margin of error for all establishments employing
environmental employees is ±4.4 % at a 95 % confidence interval.
Within industry segments the margin of error ranges from ±9
% for the industry including administration, support, waste
management, and remediation to ±19.6 % for arts, recreation,
accommodation and food services.
Number of Survey Completes
(with one or more environmental
employees)
Margin of error
Number of Establishments in Canada (with Environmental
employees)
Agriculture, Forestry, Fishing and Hunting 12,623 51 ±13.7%
Mining,Quarrying,andOilandGasExtraction 2,964 31 ±17.5%
Construction 47,174 42 ±15.1%
Manufacturing 14,606 49 ±14.0%
Wholesale Trade/Retail Trade ad Utilities, Transportation
and Warehousing 66,784 57 ±13.0%
Information, Finance and Insurance, Real Estate, Management
of Companies, Professional, Scientific and Technical Services 87,360 71 ±11.6%
Administration and Support, Waste Management and Remediation 31,083 116 ±9.1%
Education, Health, Social Assistance and Other Services 35,830 34 ±16.8%
Arts, Recreation, Accommodation and Food Services 18,808 25 ±19.6%
Public Administration 1,462 31 ±17.4%
Total 318,694 507 ±4.4%
TABLE M15 Margin of error on environmental employment by environmental employers
Industry Group

62
LIMITATIONS OF THE RESEARCH
Coverage: The survey frame includes firms that were willing
to participate in the telephone or online survey and were
drawn from a random and stratified sample of employers
within each NAICS industry segment. The desired quota
of responses in some industry segments was difficult to
complete due to limited sample size, a small population
size, or a lack of willingness or interest for the respondents
to participate in the survey. At the outset of the project,
we sought to collect at least 1200 responses, with specific
quotas for each industry. In addition, we wished to receive
at least 30 responses from employers in each industry who
have environmental employees and were willing to respond
to the long questionnaire. These responses could then be
used to estimate the incidence of workers in each occupation
within each industry category. In some industries this could
not be achieved because the percentage of firms who have
environmental employees is low—although this could not
be anticipated at the outset because no previous research at
this level has been completed. In total 2,204 firms responded
to the survey and 507 had environmental employees and
responded to the long questionnaire. A larger number of
responses would have resulted in a smaller margin of error
for the survey. The margins of error (at a 95% confidence) are
described in the previous tables.
Sampling error: The survey is based on a random sample of
business establishments but is stratified with specific quotas
of responses for each industry-defined strata. At the outset
of the survey, our expectation was that sub-populations
(different industries) vary considerably in their demand for
environmental employees in certain occupations. For example,
waste management workers are more likely to work in the
waste management industry than in agriculture. Since we
thought it was advantageous to sample each sub-population
independently, a set of strata was developed for each industry.
The groupings of industries into strata reflected our expectation
that certain industries are similar in their demand for
environmental employees in certain occupations. For instance,
we thought that demand for environmental occupations would
be similar for some professional services such as accounting,
business services, or legal services. However, we thought that
demand for workers in these industries would be qualitatively
different from demand for workers in the environmental
consulting industry. All strata were mutually exclusive: firms
in every industry were assigned to only one stratum and no
industry was excluded. Random sampling was applied within
each stratum. This was done to improve the representativeness
of the sample by reducing sampling error. The responses
were weighted by the population of all establishments
and employment for the firms in each strata. The use of
assumptions to define strata is a limitation for the research.
However, previous research does not identify differences in
occupational demand for environmental occupations at a
micro-industry level. The survey is therefore subject to error
related to the strata defined. A table describing the sampling
error for each industry strata precedes this section.

63
Response rates: Response rates for this survey were lower
than that of previous surveys conducted by ECO Canada. This
may be due to survey fatigue among employers as well as
formal policy not to participate in surveys. Public entities have
implemented similar measures to reduce the burden of surveys on
their organizations. These policy measures greatly increase the
complexity required to obtain a survey response and thus reduce
the number of surveys completed. In addition to survey fatigue,
we believe that there are conditions that affect this survey’s
target audience (HR managers) that, in turn, lower response rates.
General market surveys such as this one pose more of a challenge
than those that have a dedicated audience or database.
In many firms, the economic slowdown has resulted in staffing
cuts over the last 18 months. Typically in post-recessionary
periods, firms do not quickly recommence hiring as demand
returns. Rather, the level of per-employee productivity grows
for a significant period before hiring resumes. In effect, during
this period, the firm’s output and revenues grow but the firm
doesn’t hire new employees. At a certain point, the labour market
improves and workers find greater level of workforce mobility
as their confidence in the economy increases. As over-worked
employees complain or leave the company, firms begin to hire
again. This situation occurred in the past two recessionary
periods and is likely to be occurring now as well.
Comparability over time: The 2007 study was based on the
proportion of environmental employees/ total employees by
industry applied to total national employment in the industry.
In the 2010 survey, we have asked employers to consider their
workforce and determine the percentage of workers who spend
any time performing environmental activities related to their work
tasks and then estimate what percentage of those workers spend
more than 50% of their time on environmental activities. The
second measure is the figure that is most closely aligned with
figures from the 2007 survey and is used throughout this report
to represent environmental employment.
Benchmarking and revisions: The survey was compared
with the results of previous surveys. There were
considerable differences in the methodology, sample frame,
and questionnaire with the previous studies, and thus
they should not be compared as equals. The 2010 survey
results for workers spending 50% or more of their time
on environmental employment are of the same order of
magnitude as the findings of the 2007 survey.
Comparability with other data sources: No other current
sources of information on the number of environmental
employees exist in Canada at a national level.
Other important aspects: A relatively large number of
firms declined to participate in the survey and this may
have affected some qualities of the findings. We believe
that the value proposition of the survey was not compelling
enough to the respondents. In exchange for their time, we
offered respondents good intelligence on the state of the
environmental industry and a chance at a draw for one of
two cash prizes. When we attempted to recruit partners to
assist with survey completes (related industry associations
and organizations), the most common reason for refusal
was that the survey was not targeted specifically to the
needs of the industry segment. We found that explaining
the value of the cross-industry horizontal survey was
not compelling enough for most organizations. Other
objections were related to the length of the survey. While
survey length didn’t typically reduce the willingness of
an individual respondent to participate, it did reduce the
willingness of partner organizations to give us access to
their membership.

64
APPENDIX C EMPLOYERQUESTIONNAIRE
SHORTQUESTIONNAIRE(ALLEMPLOYERS)
S0 How many paid employees are currently employed at this location? Include full-time and part-time employees who are on payroll for this location.
[ENTER NUMBER]
S1 Of the [insert number from S0 here] employees working at this location, how many of these individuals would you consider as environmental employees?
Environmental employment is any activity associated with:
• EnvironmentalProtection(e.g.air,waterandlandquality,wastemanagement,restorationandreclamation,
human and environmental health and safety, carbon and climate change mitigation, and environmental protection
management);
• ResourceManagement(e.g.fishery,wildlife,forestry,sustainableagriculture,energyefficiency,alternativeor
renewableenergy,parksandnaturalreserves,andnaturalresourcemanagement);
• EnvironmentalSustainability(e.g.education,researchanddevelopment,policyandlegislation,communicationsand
publicawareness,andsustainabledevelopment);
• Otherenvironmentrelatedactivities.
[ENTER NUMBER]
S2 How many of these individuals would you consider spend 50 % or more of their time on environmental work?
[ENTER NUMBER]

65
LONGQUESTIONNAIRE(ENVIRONMENTALEMPLOYERS)
Employer Background
A1 The organization name I have is [insert organization]…is this correct?
Yes
No. Please enter the correct name: ___________________
A2 And the location I have is [INSERT ADDRESS/CITY/PROVINCE/POSTAL CODE]. Is this all correct?
Yes
No. Please enter the correct information below:
Company Information
Address
City
Province
Postal Code
A3 And, the main phone number I have on file for you is [insert phone number]. Is this correct?
Yes
No. Please enter the correct phone number: ______________________
A4 And the industry you are in is [INSERT INDUSTRY DESCRIPTION]. Is that right?
Yes
No – Please select the industry group below that best describes your firm’s main business activities.
• Agriculture,Forestry,FishingandHunting
• MiningandOilandGasExtraction
• Construction
• Manufacturing
• Utilities
• TransportationandWarehousing
• Professional,ScientificandTechnicalServices
• AdministrativeandSupport,WasteManagement
and Remediation Services
• EducationalServicesandHealthCareandSocialAssistance
• PublicAdministration
• WholesaleTrade/RetailTrade
• InformationandCulturalIndustries
• FinanceandInsurance,RealEstateandRentalandLeasing
• ManagementofCompaniesandEnterprises
• Arts,EntertainmentandRecreation
and Accommodation and Food Services
• OtherServices(exceptPublicAdministration)
• Water,sewageandothersystems
• EnvironmentConsulting
• Architecture,EngineeringandRelatedservices
• ScientificResearchandDevelopmentservices
• WasteManagement
• RemediationServices
• AdministrativeandSupport
• EducationalServices
• HealthCareandSocialAssistance
• Federal
• ProvincialandTerritorial
• Municipal
Identifying Industry

66
Environmental Employee Profile
B1 Of the [INSERT TOTAL NUMBER OF ENVIRONMENTAL EMPLOYEES FROM S1] environmental employees, what percentage of individuals have the following educational levels as their highest completed level of education?
B2 Of the [INSERT TOTAL NUMBER OF ENVIRONMENTAL EMPLOYEES FROM S1] environmental employees, what percentage belong to the following demographic groups?
B3 Of the [INSERT TOTAL NUMBER OF ENVIRONMENTAL EMPLOYEES FROM S1] environmental employees, what percentage belong to the following age groups:
B4 Of the [INSERT TOTAL NUMBER OF ENVIRONMENTAL EMPLOYEES FROM S1] environmental employees at this location, how many are in each of the following categories?
Level of Education Percentage of Environmental WorkersMasters, Doctorate or higher [ENTER PERCENTAGE]
Bachelor [ENTER PERCENTAGE]
College [ENTER PERCENTAGE]
Less than post-secondary [ENTER PERCENTAGE]
Demographic Group Percentage of Environmental WorkersFemale [ENTER PERCENTAGE]
Aboriginal [ENTER PERCENTAGE]
Recent immigrant (in the past 5 years) [ENTER PERCENTAGE]
Notes: Aboriginal people include those who are First Nations, Inuit, and Métis. A recent immigrant is a person who is new to Canada in the last 5 years or less. If you are uncertain on the percent of employees in the particular demographic group, please estimate. Your best guess will be sufficient.
Age Group Percentage of Environmental Workers29 or under [ENTER PERCENTAGE]
30-44 [ENTER PERCENTAGE]
45-54 [ENTER PERCENTAGE]
55-64 [ENTER PERCENTAGE]
65 or older [ENTER PERCENTAGE]
Level of Worker Percentage of Environmental WorkersEntry Level: Usually a recent graduate with no work experience. [ENTER PERCENTAGE]
Junior Level: Usually from 1 to 3 years of experience. [ENTER PERCENTAGE]
Intermediate Level: Usually from 4 to 7 years of experience. [ENTER PERCENTAGE]
Senior Level: Usually 8 years and more. [ENTER PERCENTAGE]

67
B5 Of the [INSERT TOTAL NUMBER OF ENVIRONMENTAL EMPLOYEES FROM S1] environmental employees at this location, what percentage are managers?
[ENTER PERCENTAGE]
Notes: We consider a manager to be any worker who provides leadership, accountability and plays a role in the hierarchy of your organization in addition to possessing baseline technical expertise.
B6 Out of the [INSERT TOTAL NUMBER OF ENVIRONMENTAL EMPLOYEES FROM S1] environmental employees at this location, what percentage of these employees are involved in the following activities at this location?
Category Description/ Examples Percentage of Environmental Workers
AirQuality AirQualityTesting,Monitoring,
Modeling, Air Pollution Abatement, etc. [ENTER PERCENTAGE]
WaterQuality WaterQualityTesting,Monitoring,
Resource Management, Water Pollution
Abatement, etc. [ENTER PERCENTAGE]
Site Assessment and Reclamation Site Remediation, Restoration,
and Reclamation [ENTER PERCENTAGE]
Waste Management Waste Management, Collection,
Reduction, Treatment & Disposal [ENTER PERCENTAGE]
Environmental health and safety Occupational Health and Safety,
Industrial/Occupational Hygiene [ENTER PERCENTAGE]
Alternative/ Renewable Energy, Energy Efficiency Management, Wind/
Energy, Eco Efficiency Solar/hydro/other power generation,
bio-fuels, etc. [ENTER PERCENTAGE]
Eco-Preservation / Wildlife and Management of wildlife and fisheries
fisheries management. [ENTER PERCENTAGE]
Natural resource management Management of forests, parks, etc. [ENTER PERCENTAGE]
Environmental Education & Training Environmental Training and Education [ENTER PERCENTAGE]
Research & Development Eco-Innovation, Environmental Research [ENTER PERCENTAGE]
Policy and Legislation Development of Environmental Policies/
Legislation & Compliance Monitoring [ENTER PERCENTAGE]
Communication and Public Awareness Communications and Public Awareness [ENTER PERCENTAGE]
Carbon and climate change mitigation Carbon measurement, carbon capture,
reduction of carbon emissions, etc. [ENTER PERCENTAGE]
Other: Please Specify: [ENTER PERCENTAGE]

68
Current Labour Demand and Employee Turnover
C1 How many environmental positions have you filled or tried to fill at this location over the past 12 months?
[ENTER NUMBER]
C2 Thinking of all the environmental positions you filled or tried to fill at this location over the past 12 months, how many were for the following reasons?
C3 How many of these environmental positions were you able to fill?
[ENTER NUMBER]
C4 Did you experience difficulties in hiring environmental employees at this location?
Yes
No [SKIP TO C6]
C5 You indicated that this location of your organization was impacted by difficulty in recruiting environmental employees. What do you think contributed to this difficulty?
Reason Number of Environmental WorkersReplacement of someone who left his/her position for any reason [ENTER NUMBER]
Fill a newly created position [ENTER NUMBER]
Other reason: ________ [ENTER NUMBER]
Difficulty recruiting due to remote location 1 2 3 4 5
Difficulty recruiting due to compensation levels offered 1 2 3 4 5
Difficulty recruiting due to lack of qualified applicants 1 2 3 4 5
Difficulty recruiting due to a weak recruiting program 1 2 3 4 5
Other difficulty recruiting (please specify) 1 2 3 4 5
Contributing Factor
How much has this issue affected this location of your organization?
Did not Contribute at all. Strongly Contributed

69
C6 Over the past 12 months, did you fill, or try to fill, any environmental positions at this location? If yes, how difficult was it to fill the particular position(s)?
C7 Over the past 12 months, did you hire, or try to hire, any [INSERT FROM LIST] at this location?
C8 Did you experience any challenges while hiring or making an effort to hire any [INSERT FROM LIST] at this location?
[ ]Yes [ ]No [ ]Unsure Entry Level (Usually a recent graduate with 1 2 3 4 5
no work experience)
[ ]Yes [ ]No [ ]Unsure Junior Level (Usually from 1 to 3 years of experience) 1 2 3 4 5
[ ]Yes [ ]No [ ]Unsure Intermediate level (Usually from 4 to 7years of experience) 1 2 3 4 5
[ ]Yes [ ]No [ ]Unsure Senior Level(Usually 8 years and more) 1 2 3 4 5
Did you fill or try to fill? Level of workers Not Difficult at all Very Difficult
If yes, how difficult was it?
[ ]Yes [ ]No [ ]Unsure Recent Immigrants: Recent immigrant refers to [OPEN ENDED]
those who immigrated within past 5 years.
[ ]Yes [ ]No [ ]Unsure Aboriginal People: Aboriginal people include [OPEN ENDED]
those who are First Nations, Inuit, and Métis.
[ ]Yes [ ]No [ ]Unsure Transitioning workers from other industries [OPEN ENDED]
[ ]Yes [ ]No [ ]Unsure International workers [OPEN ENDED]
Did you hire or try to hire? Demographic Group
If yes, please describe the strategy your organization used to hire or
make a special effort to hire.
[ ]Yes [ ]No [ ]Unsure Recent Immigrants: Recent immigrant refers [OPEN ENDED]
to those who immigrated within past 5 years.
[ ]Yes [ ]No [ ]Unsure Aboriginal People: Aboriginal people include [OPEN ENDED]
those who are First Nations, Inuit, and Métis.
[ ]Yes [ ]No [ ]Unsure Transitioning workers from other industries [OPEN ENDED]
[ ]Yes [ ]No [ ]Unsure International workers [OPEN ENDED]
Did you experience hiring challenges? Demographic Group
If yes, please describe the challenges you faced in hiring
or trying to hire.

70
C9 Over the past 12 months, which of the following areas of work did you hire environmental employees?
C10 How many environmental employees have left your organization in the past 12months?
[ENTER NUMBER]
[0] (SKIP TO E1)
[]Hired[]DidnotHire AirQuality AirQualityTesting,Monitoring,
Modeling, Air Pollution Abatement, etc.
[]Hired[]DidnotHire WaterQuality WaterQualityTesting,Monitoring,
Resource Management, Water
Pollution Abatement, etc.
[ ]Hired [ ]Did not Hire Site Assessment Site Remediation, Restoration,
and Reclamation and Reclamation
[ ]Hired [ ]Did not Hire Waste Management Waste Management, Collection,
Reduction, Treatment & Disposal
[ ]Hired [ ]Did not Hire Environmental health Occupational Health and Safety,
and safety Industrial/Occupational Hygiene
[ ]Hired [ ]Did not Hire Alternative/ Renewable Energy Efficiency Management, Wind/
Energy, Energy, Eco Efficiency Solar/hydro/other power generation,
bio-fuels, etc.
[ ]Hired [ ]Did not Hire Eco-Preservation / Wildlife. Management of wildlife and fisheries
and fisheries management
[ ]Hired [ ]Did not Hire Natural resource management Management of forests, parks, etc.
[ ]Hired [ ]Did not Hire Environmental Education Environmental Training and Education
& Training
[ ]Hired [ ]Did not Hire Research & Development Eco-Innovation, Environmental Research
[ ]Hired [ ]Did not Hire Policy and Legislation Development of Environmental Policies/
Legislation & Compliance Monitoring
[ ]Hired [ ]Did not Hire Communication and Communications and Public Awareness
Public Awareness
[ ]Hired [ ]Did not Hire Carbon and climate Carbon measurement, carbon capture,
change mitigation reduction of carbon emissions, etc.
[ ]Hired [ ]Did not Hire Other. Please Specify:
Action Category Description/ Examples

71
C11 Which of the following reasons would you say are the major reasons why environmental employees at this location are no longer working with your organization? [SELECT ALL THAT APPLY]
Current Recruitment Strategies in the Environmental Sector
D1 Over the past 12 months, which of the following recruitment strategies did you use to hire environmental employees for this location and how effective were the recruitment strategies?
• Agriculture,Forestry,FishingandHunting
• Betterbenefitsinanotherorganization
• Highersalaryinanotherorganization
• BetterWorklifebalance
• BetterOpportunitiesforcareeradvancement
• Downsizingofyourbusinessorworkforce
• Poorworkerperformance
• Retirementofcurrentemployees
• Other:Pleasedescribe:_________________________
Reasons
[ ]Yes [ ]No [ ]Unsure Co-op programs 1 2 3 4 5
[ ]Yes [ ]No [ ]Unsure Corporate website 1 2 3 4 5
[ ]Yes [ ]No [ ]Unsure Internal recruiters 1 2 3 4 5
[ ]Yes [ ]No [ ]Unsure Newspapers 1 2 3 4 5
[ ]Yes [ ]No [ ]Unsure On-campus recruitment 1 2 3 4 5
[ ]Yes [ ]No [ ]Unsure Online job banks 1 2 3 4 5
[ ]Yes [ ]No [ ]Unsure Personal contacts (referrals) 1 2 3 4 5
[ ]Yes [ ]No [ ]Unsure Recruitment agency 1 2 3 4 5
[ ]Yes [ ]No [ ]Unsure Acquisition of another firm or organization 1 2 3 4 5
[ ]Yes [ ]No [ ]Unsure Other (please specify) 1 2 3 4 5
Did you use this Strategy? Strategy Not Effective At All Highly Effective
If yes, how Effective Was it?
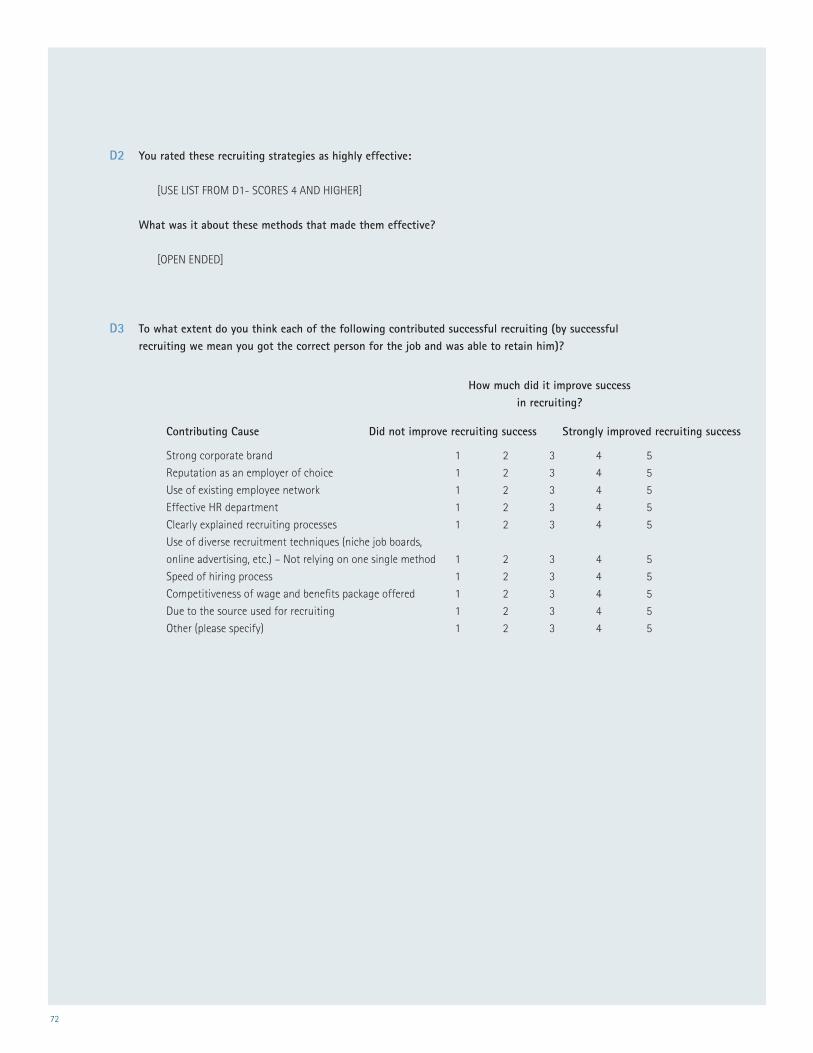
72
D2 You rated these recruiting strategies as highly effective:
[USE LIST FROM D1- SCORES 4 AND HIGHER]
What was it about these methods that made them effective?
[OPEN ENDED]
D3 To what extent do you think each of the following contributed successful recruiting (by successful recruiting we mean you got the correct person for the job and was able to retain him)?
Strong corporate brand 1 2 3 4 5
Reputation as an employer of choice 1 2 3 4 5
Use of existing employee network 1 2 3 4 5
Effective HR department 1 2 3 4 5
Clearly explained recruiting processes 1 2 3 4 5
Use of diverse recruitment techniques (niche job boards,
online advertising, etc.) – Not relying on one single method 1 2 3 4 5
Speed of hiring process 1 2 3 4 5
Competitiveness of wage and benefits package offered 1 2 3 4 5
Due to the source used for recruiting 1 2 3 4 5
Other (please specify) 1 2 3 4 5
Contributing Cause
How much did it improve success in recruiting?
Did not improve recruiting success Strongly improved recruiting success
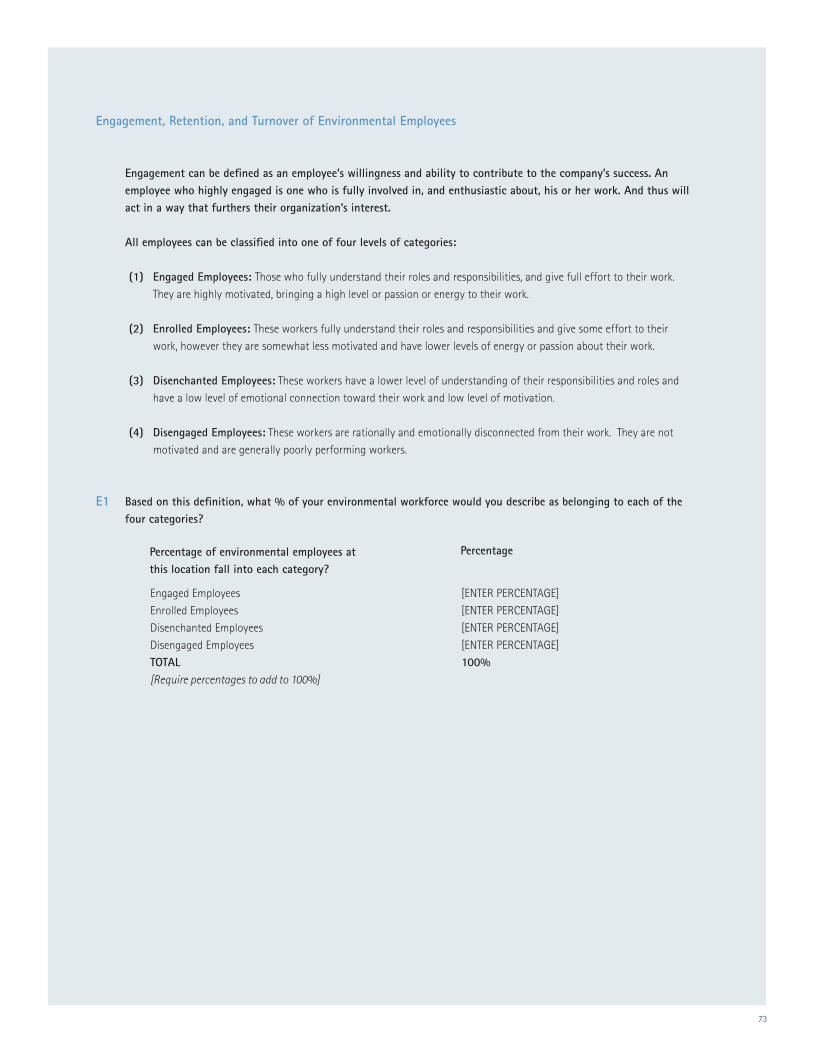
73
Engagement, Retention, and Turnover of Environmental Employees
Engagement can be defined as an employee’s willingness and ability to contribute to the company’s success. An employee who highly engaged is one who is fully involved in, and enthusiastic about, his or her work. And thus will act in a way that furthers their organization’s interest.
All employees can be classified into one of four levels of categories:
(1) Engaged Employees: Those who fully understand their roles and responsibilities, and give full effort to their work.
They are highly motivated, bringing a high level or passion or energy to their work.
(2) Enrolled Employees: These workers fully understand their roles and responsibilities and give some effort to their
work, however they are somewhat less motivated and have lower levels of energy or passion about their work.
(3) Disenchanted Employees: These workers have a lower level of understanding of their responsibilities and roles and
have a low level of emotional connection toward their work and low level of motivation.
(4) Disengaged Employees: These workers are rationally and emotionally disconnected from their work. They are not
motivated and are generally poorly performing workers.
E1 Based on this definition, what % of your environmental workforce would you describe as belonging to each of the four categories?
Engaged Employees [ENTER PERCENTAGE]
Enrolled Employees [ENTER PERCENTAGE]
Disenchanted Employees [ENTER PERCENTAGE]
Disengaged Employees [ENTER PERCENTAGE]
TOTAL 100%[Require percentages to add to 100%]
Percentage of environmental employees at this location fall into each category?
Percentage
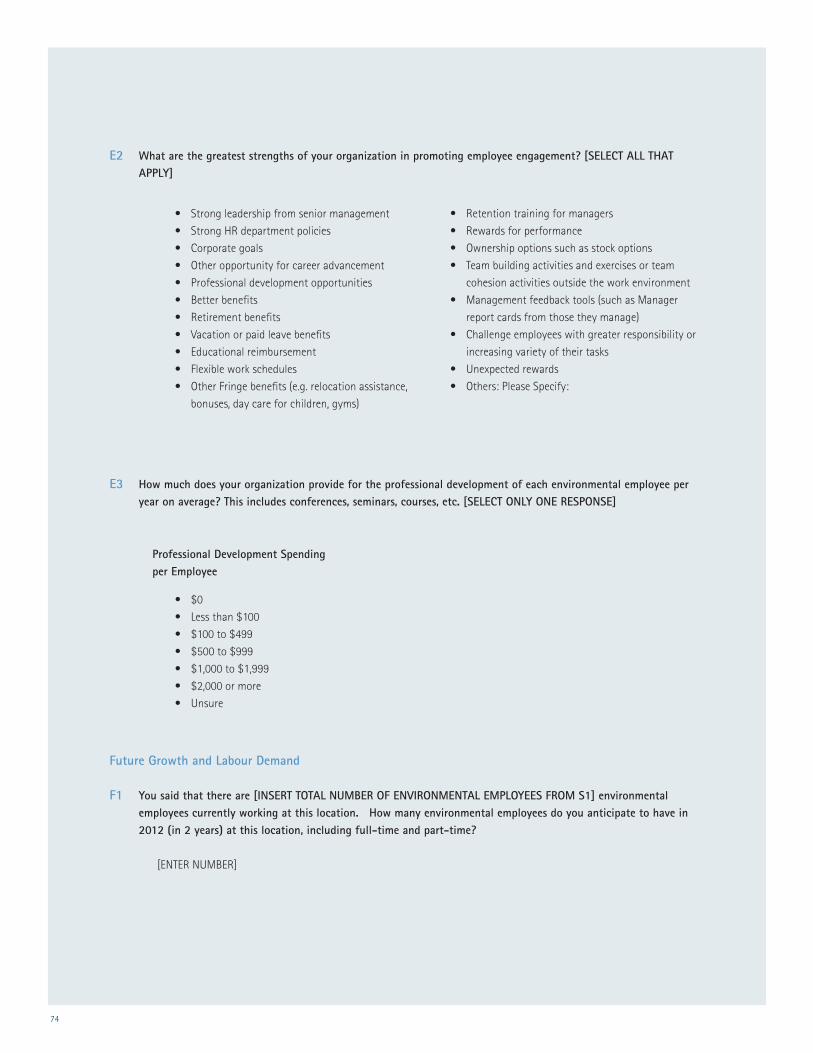
74
E2 What are the greatest strengths of your organization in promoting employee engagement? [SELECT ALL THAT APPLY]
E3 How much does your organization provide for the professional development of each environmental employee per year on average? This includes conferences, seminars, courses, etc. [SELECT ONLY ONE RESPONSE]
Future Growth and Labour Demand
F1 You said that there are [INSERT TOTAL NUMBER OF ENVIRONMENTAL EMPLOYEES FROM S1] environmental employees currently working at this location. How many environmental employees do you anticipate to have in 2012 (in 2 years) at this location, including full-time and part-time?
[ENTER NUMBER]
• $0
• Lessthan$100
• $100to$499
• $500to$999
• $1,000to$1,999
• $2,000ormore
• Unsure
Professional Development Spending per Employee
• Strongleadershipfromseniormanagement
• StrongHRdepartmentpolicies
• Corporategoals
• Otheropportunityforcareeradvancement
• Professionaldevelopmentopportunities
• Betterbenefits
• Retirementbenefits
• Vacationorpaidleavebenefits
• Educationalreimbursement
• Flexibleworkschedules
• OtherFringebenefits(e.g.relocationassistance,
bonuses, day care for children, gyms)
• Retentiontrainingformanagers
• Rewardsforperformance
• Ownershipoptionssuchasstockoptions
• Teambuildingactivitiesandexercisesorteam
cohesion activities outside the work environment
• Managementfeedbacktools(suchasManager
report cards from those they manage)
• Challengeemployeeswithgreaterresponsibilityor
increasing variety of their tasks
• Unexpectedrewards
• Others:PleaseSpecify:

75
F2 Which of the following areas of work do you expect to hire environmental employees in the next two years?
Action Category Description/ Examples
[]PlantoHire[]NoplantoHire AirQuality AirQualityTesting,Monitoring,Modeling,
Air Pollution Abatement, etc.
[]PlantoHire[]NoplantoHire WaterQuality WaterQualityTesting,Monitoring,ResourceManagement,
Water Pollution Abatement, etc.
[ ]Plan to Hire [ ] No plan to Hire Site Assessment and Reclamation Site Remediation, Restoration, and Reclamation
[ ]Plan to Hire [ ] No plan to Hire Waste Management Waste Management, Collection, Reduction,
Treatment & Disposal
[ ]Plan to Hire [ ] No plan to Hire Environmental health and safety Occupational Health and Safety,
Industrial/Occupational Hygiene
[ ]Plan to Hire [ ] No plan to Hire Alternative/ Renewable Energy, Energy Efficiency Management, Wind/Solar/hydro/other
Energy, Eco Efficiency power generation, bio-fuels, etc.
[ ]Plan to Hire [ ] No plan to Hire Eco-Preservation / Wildlife and fisheries Management of wildlife and fisheries
[ ]Plan to Hire [ ] No plan to Hire Natural resource management Management of forests, parks, etc.
[ ]Plan to Hire [ ] No plan to Hire Environmental Education & Training Environmental Training and Education
[ ]Plan to Hire [ ] No plan to Hire Research & Development Eco-Innovation, Environmental Research
[ ]Plan to Hire [ ] No plan to Hire Policy and Legislation Development of Environmental Policies/
Legislation & Compliance Monitoring
[ ]Plan to Hire [ ] No plan to Hire Communication and Public Communications and Public Awareness
Awareness
[ ]Plan to Hire [ ] No plan to Hire Carbon and climate Carbon measurement, carbon capture, reduction
change mitigation of carbon emissions, etc.
[ ]Plan to Hire Other. Please Specify:

76
F3 Are there certain high demand occupations that your organization has difficulty finding or recruiting? [OPEN ENDED]
F4 Are there specific area where you anticipate hiring a large number of workers? [OPEN ENDED]
• EnvironmentalEngineer
• EnvironmentalTechnician/Technologist
• LabTechnician/Technologist
• Hydrogeologist
• CivilEngineer
• RemediationSpecialist
• AirQualityTechnician/Technologist
• ConservationOfficer
• WasteManagementSpecialist
• Aquatics/MarineBiologist
• Meteorologist
• Agrologist
• ProjectManager
• LandUsePlanner
• Geoscientist
Pre-coded list:

77
F5 Are there any specific job levels you anticipate having trouble filling on a regular basis?
F6 In the future, to what extent do you anticipate that you will access each of the following sources of labour to fill open positions?
Will you have trouble filling positions at this level? Level of workers
[ ]Yes [ ]No [ ]Unsure Entry Level (Usually a recent graduate with no work experience)
[ ]Yes [ ]No [ ]Unsure Junior Level (Usually from 1 to 3 years of experience)
[ ]Yes [ ]No [ ]Unsure Intermediate level (Usually from 4 to 7years of experience)
[ ]Yes [ ]No [ ]Unsure Senior Level(Usually 8 years and more)
Percentage of each source to be used to Percentagefill open positions
Recent Student [ENTER PERCENTAGE]
Transitioning workers from other industry [ENTER PERCENTAGE]
Workers in environmental industry [ENTER PERCENTAGE]
Aboriginals [ENTER PERCENTAGE]
Immigrants [ENTER PERCENTAGE]
International Workers [ENTER PERCENTAGE]
78
Future Growth and Labour Demand
G1 How many locations do you have including this location Canada-wide? [ENTER NUMBER]
G2 How many employees work for your organization Canada-Wide?
G3 Please select the sector which best describes your organization.
• 1(Ownerandnootheremployees)
• 2-5
• 6-10
• 11-15
• 16-20
• 21-50
• 51–100
• 101–250
• 251–1000
• Morethan1000
Number of Workers
• Privatesector
• Publicsector–Municipal
• PublicSector–Provincial
• PublicSector–Federal
• Not-for-profit/Charitableorganization
Sector

79
This project was funded by the Government of Canada’s Sector Council Program.
The opinions and interpretations in this publication are the author’s and do not necessarily
reflect those held by the Government of Canada.
Copyright © 2010 ECO Canada
All rights reserved. The use of any part of this publication, whether it is reproduced, stored in a retrieval
system, or transmitted in any form or means (including electronic, mechanical, photographic, photocopying
or recording), without the prior written permission of ECO Canada is an infringement of copyright law.
ECO Canada (2010).
2010 Profile of Canadian Environmental Employment
Labour Market Research.
Environmental Careers Organization of Canada.

80
Funded by the Government of Canada’s Sector Council Program
Suite 200, 308 - 11th Avenue S.E., Calgary, Alberta, Canada T2G 0Y2
Telephone: (403) 233-0748 Fax: (403) 269-9544
eco.ca